from a static to a dynamic bsc analysis – winston salem sanitation division
TRANSCRIPT

From a static to a dynamic BSC analysis – Winston Salem
Sanitation Division
Carmine BianchiFull Professor in Business and Public Management
University of Palermo - Department of Management
[email protected] - www.ced4.it
CED4-System Dynamics Group
Armando TauroProfessor in Business and Operation Management
University of Piura – Faculty og Engeneering
[email protected] - www.armandotauro.com
INNSA consultores- CED4-System Dynamics Group
FUENTE

Identifying key variables and reference behavior modes (1 of 6)
Population and collection points (households)

Tons collected in a year
Identifying key variables and reference behavior modes (2 of 6)

Modeling Population
Population
Accumulation rate
Depletion rate

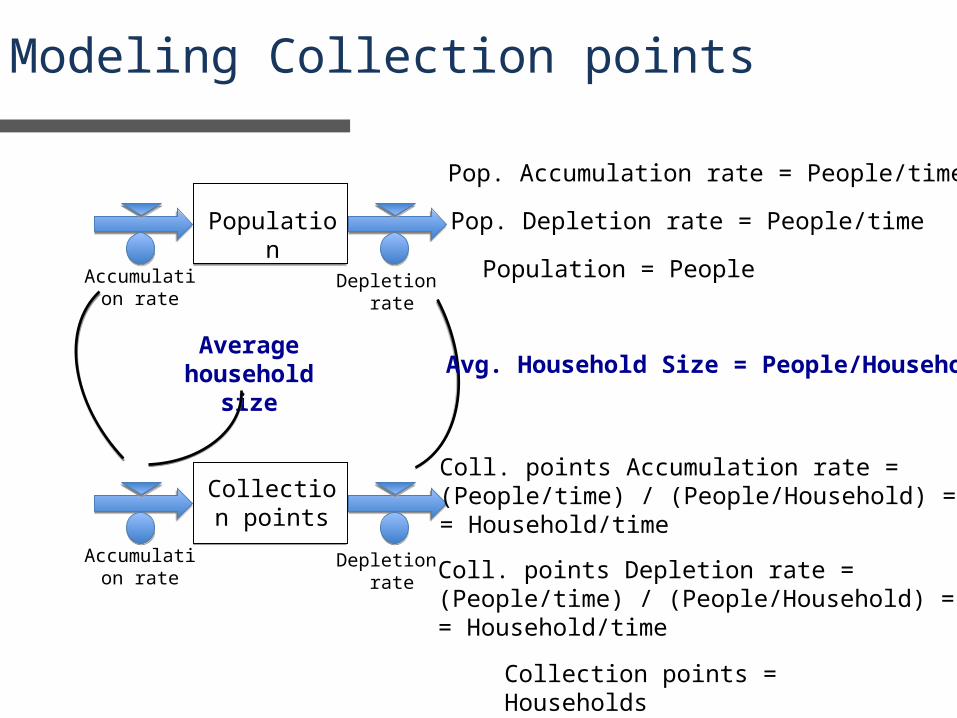
Modeling Collection points
Population
Accumulation rate
Depletion rate
Collection points
Accumulation rate
Depletion rate
What kind of relationship
links Population to
Collection points
(households)?
Average household size
Modeling Collection points
Population
Accumulation rate
Depletion rate
Collection points
Accumulation rate
Depletion rate
Average household size
Pop. Accumulation rate = People/time
Pop. Depletion rate = People/time
Population = People
Avg. Household Size = People/Household
Coll. points Accumulation rate = (People/time) / (People/Household) = = Household/time
Coll. points Depletion rate = (People/time) / (People/Household) = = Household/time
Collection points = Households

Modeling Collection points
Population
Accumulation rate
Depletion rate
Collection points
Accumulation rate
Depletion rate
Average household size

Modeling Garbage accumulation and collection
Collection points
Accumulation rate
Depletion rate
Total Garbage to collect
Accumulation rate
Depletion rate
What kind of relationship
links Collection points to collected garbage ?
New Garbage to collect per collection point per
week

Modeling Garbage accumulation and collection
Collection points
Accumulation rate
Depletion rate
Total Garbage to collect
Accumulation rate
Depletion rate
New Garbage to collect per collection point per
week
Coll. points Accumulation rate = (People/time) / (People/Household) = = Household/time Coll. points Depletion rate = (People/time) / (People/Household) = = Household/time Collection points = Households
New Garbage to collect per coll. point = Tons/Households/week
Garbage to collect Accumulation rate = Households * Tons/Household/week = Tons/week
Garbage to collect Depletion rate = ?????
Total Garbage to collect = Tons

Modeling Garbage accumulation and collection
Collection points
Accumulation rate
Depletion rate
Total Garbage to collect
Accumulation rate
New Garbage to collect per collection point per
week
Tons collected per time
• How such end-results have been achieved?• Which resources are used?• What impact did they make?

Modeling Garbage accumulation and collection
Collection points
Accumulation rate
Depletion rate
Total Garbage to collect
Accumulation rate
New Garbage to collect per collection point per
week
Tons collected per time
FTE Positions

Identifying key variables and reference behavior modes (3 of 6)
FTE positions

Identifying key variables and reference behavior modes (4 of 6)
Indentifying the number of workers
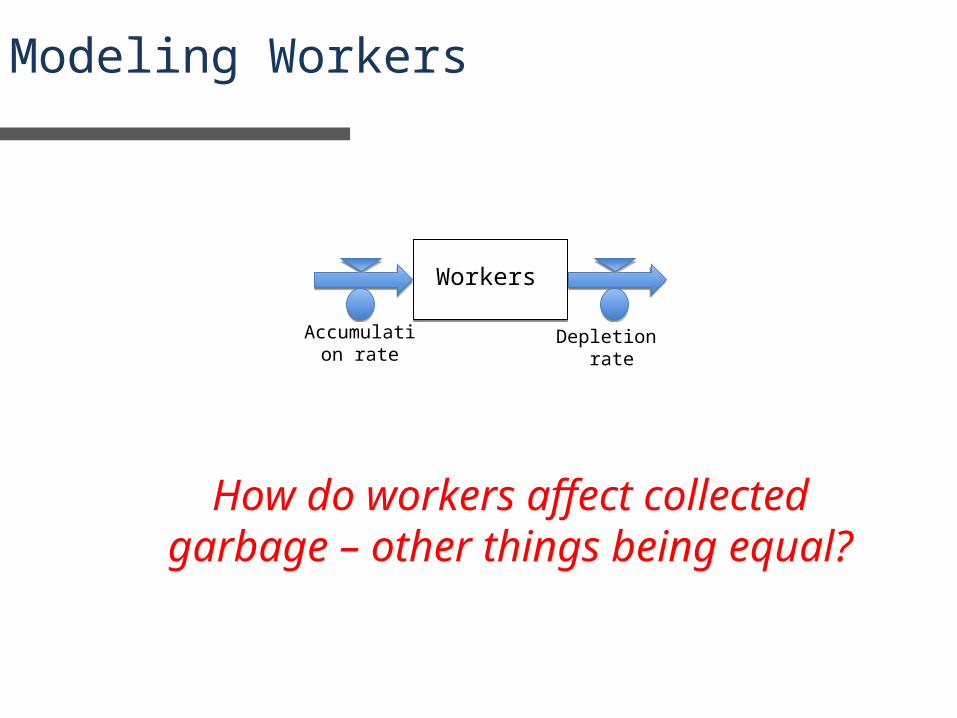
Modeling Workers
Workers
Accumulation rate
Depletion rate
How do workers affect collected garbage – other things being equal?

Identifying key variables and reference behavior modes (5 of 6)
Indentifying workers’ productivity

Modeling Workers’ productivity
Quality of Incentive & Manpower
planning systemsChange in quality of
incentive & manpower planning
systems
Backyards collection ratio
Tons collected / working hour
Equipment automation
Working hours / person / week
Workers
Accumulation rate
Depletion rate
STRATEGIC RESOURCES
Relative quality of Incentive & Manpower planning systems
PERFORMANCE DRIVERS
Change in working hours / week
Working hours / week
Tons collected per weekEND-RESULTS
Tons collected per week
Garbage to collect from Backyards
Total Garbage to collect
Accumulation rate

Modeling service levels
STRATEGIC RESOURCES
PERFORMANCE DRIVERS
Total Garbage to collect
Accumulation rate
Tons collected per week
END-RESULTSChange in customer
satisfaction
Customer satisfaction
Change in customer satisfaction
Time to serve households
Time to serve households ratio
Perceived time to serve households
Change in perceived time
Change in perceived time

Identifying key variables and reference behavior modes (6 of 6)
Indentifying Service levels

Performance indicators and Indexes
Performance indicator --- measure gauging organization results:
end-results (flows)
drivers (auxiliaries – ratios).
PERFORMANCE DRIVERS
END-RESULTS

Performance indicators and Indexes
A performance indicator always affects another variable:
end-results -- may affect:
a) strategic resources (last layer end-results)
b) other end-results (intermediate layer end-results)
drivers -- may affect:
a) end-results
b) other drivers

Performance indicators and Indexes
Tons collected / working hour
PERFORMANCE DRIVERS
END-RESULTS
STRATEGIC RESOURCES
Change in customer satisfaction
Customer satisfaction
Change in customer satisfaction
Liquidity
Garbage Collection expenses
Garbage Collection expenses
Backyards collection ratio
Time to serve households ratio
Time to serve households
Perceived time to serve households
Change in perceived time
Change in perceived time
Working hours / person / week
Change in working hours / week
Working hours / week
Tons collected per week
Total Garbage to collect
Tons collected per week

Performance indicators and Indexes
Performance drivers: Ratio between a current state (resource) and a
benchmark, affecting performance usually through a normalized graph function
Perceived time to serve households
Change in perceived time
PERFORMANCE DRIVERS
STRATEGIC RESOURCES
END-RESULTS
Time to serve households ratio
Normal time to serve
households
Effect of Time to serve households ratio on
customer satisfaction
Change in customer satisfaction
Effect of Time to serve households ratio on customer satisfaction
Time to serve households ratio1 1.50.5
2
1
0.3

Performance indicators and Indexes
Performance drivers: Ratio between a current state (resource) and a
benchmark, affecting performance usually through a normalized graph function
PERFORMANCE DRIVERS
STRATEGIC RESOURCES
END-RESULTS
Effect of Backyards collection ratio on
workers productivity
Garbage to collect from Backyards
Total Garbage to collect
Backyards collection ratio
Tons collected / working hour
Tons collected per week
Normal Tons collected per
week
Effect of backyards collection ration on workers productivity
Backyards collection ratio0.5 10
1.5
1
0.5

Performance indicators and IndexesIndexes:
Synthetic measures of the quality or state of a system. They are usually expressed as ratios. They do not affect any specific performance measure. They rather gauge a synthetic expression of specific aspects regarding performance.
PERFORMANCE DRIVERS
STRATEGIC RESOURCES
END-RESULTS
Change in working hours / week
Working hours / weekWorkers
Accumulation rate Depletion rate
Working hours / person / week Working time
saturation index
Max hours / worker /week
Max working hours / week

Performance indicators and IndexesIndexes:
Synthetic measures of the quality or state of a system. They are usually expressed as ratios. They do not affect any specific performance measure. They rather gauge a synthetic expression of specific aspects regarding performance.
PERFORMANCE DRIVERS
STRATEGIC RESOURCES
END-RESULTS
Tons collected per .000 population
Total Garbage to collect
Accumulation rate
Tons collected per week
Tons collected per week
Population
Total collected garbage

Modeling Performance starting from accounting reports data
Collection points
Accumulation rate
Depletion rate
Total Garbage to collect
Accumulation rate
New Garbage to collect per collection point per
week
Tons collected per time
• How such end-results have been achieved?• Which resources are used?• What impact did they make?
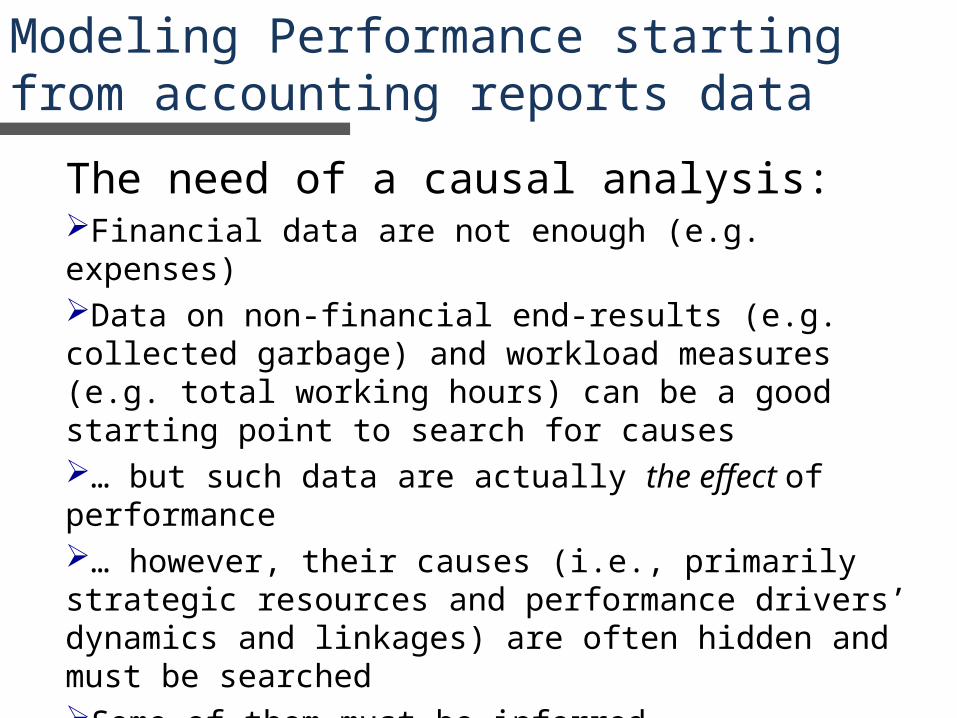
Modeling Performance starting from accounting reports data
The need of a causal analysis:Financial data are not enough (e.g. expenses)Data on non-financial end-results (e.g. collected garbage) and workload measures (e.g. total working hours) can be a good starting point to search for causes… but such data are actually the effect of performance … however, their causes (i.e., primarily strategic resources and performance drivers’ dynamics and linkages) are often hidden and must be searchedSome of them must be inferredStructure & behavior analysis, together with modeling with decision makers’ participation, and matching SD with accounting models are substantial vehicles in this effort.

Time to fix billing complaints index
Skill index
Staff Capacity
Time to respond an inquiry index
Knowledge index
Time to install a fixed line index
Time to restore fixed line index
Competency index (CI)
Average training hours per staff