from carting to purchasing€¦ · to get social interaction data for other networks like facebook,...
TRANSCRIPT

Tracking Product Journey From Carting to Purchasing |1
Tracking Product Journey from Carting to Purchasing
15 SECRETS TO PERFECTING YOUR ONLINE STORE
Allaedin Ezzedin

Tracking Product Journey From Carting to Purchasing |2
Table of Contents
Introduction 3From Viewing to Carting (Marketing KPIs) 5
1 Product Pages Exposure 6
2 Product Rating and Review 9
3 On-site Social Interactions: (Pins, Tweets, Likes, Google+1) 10
4 Add to Cart 12
5 Unsuccessful Add to Cart 13
From Carting to Buying (Merchandising KPIs) 14 6 Conversion Rate 16
7 Conversion Duration 18
8 Cart Item Removal 21
9 Coupon and Promotional Codes 22
10 Payment Method 23
From Buying to Buying More (Loyalty KPIs) 2411 Measuring Buyers’ Engagement Over Time 24
12 Measuring Buyers’ Engagement Based on Number of Purchases 26
13 Measuring Buyers’ Engagement Based on Their Spending 28
14 Measuring Buyers’ Engagement Based on Their Gender and Age 30
15 Measuring Buyers’ Engagement Based on Their Visit Intent 32
Final Thoughts #1: Multi-Tiered Segmentation 34Final Thoughts #2: Tracking Users Across Devices 36Final Thoughts #3: Multi-Channel Attribution 37Take Home Action Items 40About 41i
PLATINUMMEMBER

Tracking Product Journey From Carting to Purchasing |3
IntroductionGetting customers through your website’s metaphorical doors is a tough mission! But keeping those visitors engaged once they’re on your site is an even tougher challenge. How do you leap these hurdles and create a site that customers both enjoy visiting and want to keep coming back to? This is a question all marketers and web analysts would LOVE to know the answer to. Unfortunately, it isn’t something that is easily determined with a one-size-fits-all answer.
Whether you are the CEO of walmart.com or the owner of a small ecommerce site, we all have similar expectations of our online store: convert visitors into buyers, and then turn those customers into repeat buyers who will then advocate for your brand. This is done by digging deep into your visitor’s behavior and customer’s buying habits through gathering specific data at given touch points within your website known as Key Performance Indicators (KPIs). And while these ecommerce KPIs may vary based on the complexity of your business model and targeted audience, many KPIs are universal for most ecommerce businesses. These KPIs are the focus of this eBook.
Online stores are product-centric, and the success of these sites is dependent on maximizing the category and product page exposure, number of social shares, number of product purchases and the selling price.
In this eBook, we will be constructing a comprehensive product and ecommerce report covering all needed details about the performance of product pages, and how to use some of the obvious (and less obvious) tracked metrics to make concrete decisions to optimize the product pages’ and the ecommerce funnel’s effectiveness.

Tracking Product Journey From Carting to Purchasing |4
Disclaimer:
1. Timberland (up to the time of writing this eBook) is not a client of my analytics consulting agency and is being used as a case study.
2. Data used in this eBook is sanitized data.
3. For technical people: All tracking code shared in this eBook is using the newest Universal Analytics JavaScript snippet, which is a new way to measure how users interact with websites. It is similar to the legacy Google Analytics tracking code, ga.js, but offers more flexibility for developers to customize their implementations.
4. The tracking code snippets provided in this document are meant for website tracking. Same concepts are applicable to mobile apps tracking. Use the Google Analytics SDK for Android or iOS to implement the proper syntax.
5. Installing Universal Analytics via Google Tag Manager is an ideal way to implement, as making changes in the future will be much easier.
√ The top engagement metrics for each step of the purchasing cycle VIEWING TO CARTING CARTING TO BUYING BUYING TO BUYING MORE
√ How to architect and implement a measurement solution using Google Analytics as a measurement platform.
√ How to analyze the data collected for the different users’ segments.
√ This eBook also can be used as an unofficial guide to a best practice implementation of Google’s Universal Analytics.
This eBook will cover:

Tracking Product Journey From Carting to Purchasing |5
Measuring visitors’ interaction with our product-detail pages is very crucial for site optimization purposes and bottom-line ROI. It is an important step towards understanding the true value of our visitors and their behavior.
While any interaction with the product pages up to adding items to cart are considered micro-conversions, we have to remember that these interactions are the prerequisites for any macro conversion (e.g. sales) and in most cases will lead to more product exposure and revenue.
The engagement metrics for the product-detail pages include, but are not limited to:
• Product Pages Exposure
• Product Rating and Review
• On-site Social Interactions: (Pins, Tweets, Facebook Likes, Google Pluses)
• Add to Cart
• Unsuccessful Add to Cart
• Content Depth
• Time on Page
So let’s now go into detail on how you can track a few of the above KPIs in Google Analytics (GA):
STEP 1:
From Viewing to Carting(Marketing KPIs)

Tracking Product Journey From Carting to Purchasing |6
Secret #1: Product Pages ExposureLooking at the number of page views for product-detail pages may not add real value if looked at in isolation of other metrics, but your analysis will be incomplete if you don’t have these numbers handy in your dashboards. Measuring product-detail pages exposure help answer questions like: How many times have product-detail pages served as landing pages? Which products are causing visitors to bounce or leave the store? Which products are viewed the most? Which product lines have more social shares? Which product categories have the highest conversion rate and which ones generate the highest revenue? Which product lines within the Men’s and Women’s departments should we invest in more?
Since our example in this eBook is timberland.com and it sells clothing, footwear and accessories for men, women and kids, all product-detail pages will be associated with these three categories as seen here:

Tracking Product Journey From Carting to Purchasing |7
Measurement Strategy:To track product-detail pages and their categories, we will fire a Google Analytics event hit for each product view and fire multiple Content Grouping hits for the product categories.
Tracking Method: Event + Content GroupingEvent Category: Product Detail PageEvent Action: ViewEvent Label: <Product Name>Content grouping 1: <Shop For>Content grouping 2: <Department>Content grouping 3: <Product Line>
Examples:URL: http://shop.timberland.com/product/index.jsp?productId=12310017Product Name: Men’s Earthkeepers® City Premium Chukka BootEvent: Product Detail Page | View | Mens Earthkeepers City Premium Chukka BootContent Groups: Men >> Footwear >> Boots

Tracking Product Journey From Carting to Purchasing |8
URL: http://shop.timberland.com/product/index.jsp?productId=15207536Product Name: Women’s Earthkeepers® Wool PantEvent: Product Detail Page | View | Womens Earthkeepers Wool PantContent Groups: Women >> Clothing >> Pants
URL: http://shop.timberland.com/product/index.jsp?productId=11361203Product Name: Kids’ Cooling Crew Sock 2-PackEvent: Product Detail Page | View | Kids Cooling Crew Sock 2-PackContent Groups: Kids >> Accessories >> Socks
Sample Code:
Note: Before you can send Content Groups values to Google Analytics, they must first be defined in a Google Analytics View (Profile).
ga('set', 'contentGroup1', 'Men');ga('set', 'contentGroup2', 'Footwear');ga('set', 'contentGroup3', 'Boots');ga('send', 'event', 'Product Detail Page', 'View', 'Mens Earthkeepers City Premium Chukka Boot');
</>

Tracking Product Journey From Carting to Purchasing |9
Secret #2: Product Rating and ReviewMany online shoppers value what others say about the products they are interested in. It is very common these days to see even offline shoppers walking into Costco, Macy’s or BestBuy and check online ratings and reviews on products before they buy.
Effectively listening to user-generated content and marrying their feedback with analytics data is an amazing combination to get the complete picture about the performance of our product-detail pages and their impact on the purchase cycle.
How to Track Product Rating in Google AnalyticsTracking Method: EventEvent Category: Product Detail PageEvent Action: Product RatingEvent Label: <Product Name>Event Value: <Product Rating>
Sample Code:
ga('send', 'event', 'Product Detail Page', 'Product Rating', 'Womens Winter Leaf Beanie', 5);
</>
Tracking Product Journey From Carting to Purchasing |10
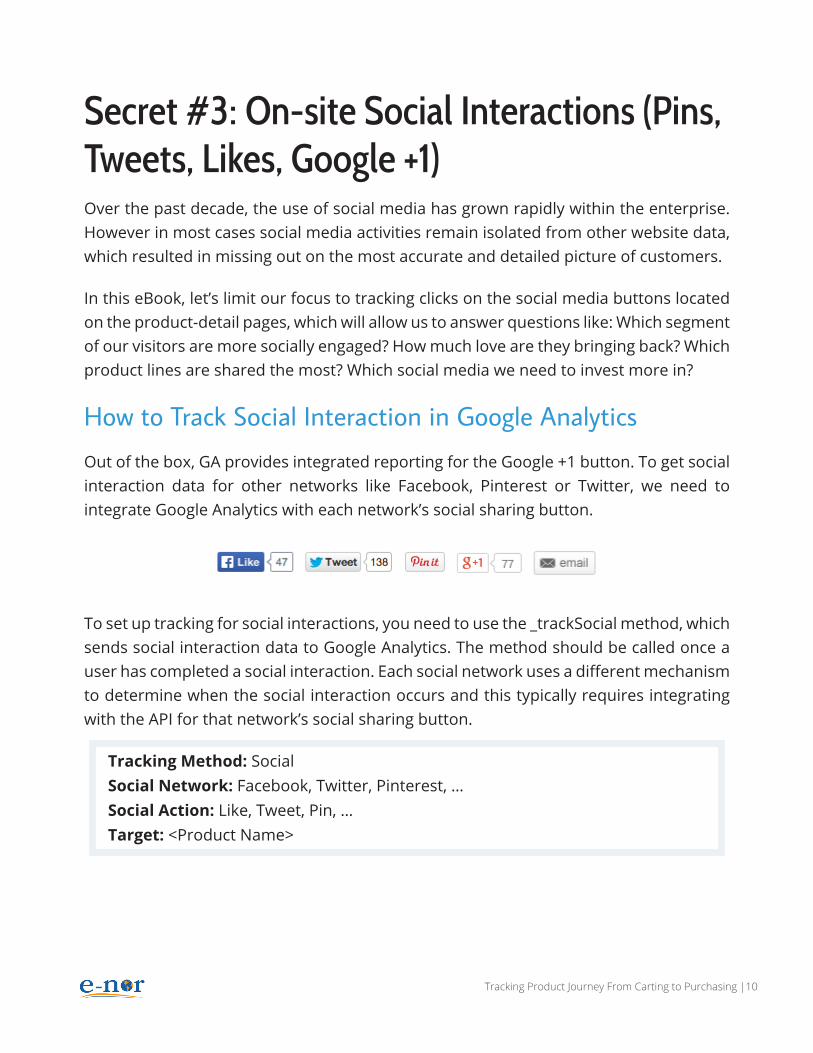
Secret #3: On-site Social Interactions (Pins, Tweets, Likes, Google +1)Over the past decade, the use of social media has grown rapidly within the enterprise. However in most cases social media activities remain isolated from other website data, which resulted in missing out on the most accurate and detailed picture of customers.
In this eBook, let’s limit our focus to tracking clicks on the social media buttons located on the product-detail pages, which will allow us to answer questions like: Which segment of our visitors are more socially engaged? How much love are they bringing back? Which product lines are shared the most? Which social media we need to invest more in?
How to Track Social Interaction in Google AnalyticsOut of the box, GA provides integrated reporting for the Google +1 button. To get social interaction data for other networks like Facebook, Pinterest or Twitter, we need to integrate Google Analytics with each network’s social sharing button.
To set up tracking for social interactions, you need to use the _trackSocial method, which sends social interaction data to Google Analytics. The method should be called once a user has completed a social interaction. Each social network uses a different mechanism to determine when the social interaction occurs and this typically requires integrating with the API for that network’s social sharing button.
Tracking Method: SocialSocial Network: Facebook, Twitter, Pinterest, …Social Action: Like, Tweet, Pin, …Target: <Product Name>

Tracking Product Journey From Carting to Purchasing |11
Sample Code:
ga('send', 'social', 'facebook', 'like', 'Mens Cable-Knit Beanie');ga('send', 'social', 'twitter', 'tweet', 'Womens Earthkeepers Wool Pant');ga('send', 'social', 'Pinterest', 'Pin', 'Kids Cooling Crew Sock 2-Pack');
</>

Tracking Product Journey From Carting to Purchasing |12
Secret #4: Add to CartThis is the most important user interaction in the product-detail pages. Obviously, if users do not add items to the shopping basket, they will not purchase! Therefore, tracking users’ interaction with this lovely button is a must. As you know, analytics tools do not automatically track clicks on the Add to Cart buttons unless the link goes to a unique URL or the button itself is tagged with tracking code.
If your Add to Cart button doesn’t link to a unique page, but rather launches an overlay instead, then you need to fire an event or a virtual pageview to Google Analytics indicating that the user clicked on the button.
How to Track Add-to-Cart in Google AnalyticsTracking Method: EventEvent Category: Product Detail PageEvent Action: Add to CartEvent Label: <Product Name>
Sample Code:
ga('send', 'event', 'Product Detail Page', 'Add to Cart', 'Women’s Winter Leaf Beanie');
</>

Tracking Product Journey From Carting to Purchasing |13
Secret #5: Unsuccessful Add to CartSome products on timberland.com require selecting color, size, and quantity before proceeding into the purchase process. This could be a possible cause of abandonment, In this case, I would suggest firing an event to Google Analytics when an error message is presented to the visitors informing them about the missing information.
How to Track Add-to-Cart in Google AnalyticsTracking Method: EventEvent Category: Product Detail PageEvent Action: Unsuccessful Add to CartEvent Label: <Product Name>
Sample Code:
ga('send', 'event', 'Product Detail Page', 'Unsuccessful Add to Cart', 'Women’s Winter Leaf Beanie');
</>

Tracking Product Journey From Carting to Purchasing |14
I don’t want to put too much pressure on you here, but the failure of completing conversions after this point is all yours! For one reason or another, the shopper trusted your products and dropped few items in the shopping cart and your job now is to keep every single item inside the cart until they have successfully checked out. Measuring the shoppers’ behavior and experience during the checkout funnel is very important to understand. And examining issues such as why some visitors abandon the funnel, reduce the number of items in the cart, or add more items to their original intended list can be beneficial data.
STEP 2:
From Carting to Buying(Merchandising KPIs)

Tracking Product Journey From Carting to Purchasing |15
Unlike the previous step of the purchasing cycle where we were tracking micro-conversions, in this step we are going to study the user behavior and experience while purchasing, which is our macro-conversion.
The KPIs and engagement metrics for this step may include, but are not limited to:
• Shopping Cart Abandonment Rate
• Conversion Rate
• Conversion Duration
• Average Order Value
• Related-Items Performance
• Product Affinity (which products are purchased together)
• Payment Methods
• Shipping Method
• Gift Registry
• Promotion Coupons
Here is how we suggest tracking a few of the above KPIs in Google Analytics:

Tracking Product Journey From Carting to Purchasing |16
Secret #6: Conversion RateNo matter what some may say about this metric, I always say the Conversion Rate is the most basic, yet most important ecommerce metric to look at. This metric gives a wonderful performance overview of your store over time. It is an easy metric to share, and is understood by everyone within the organization. For example, our site was visited by a hundred people who came after seeing a paid banner on cnn.com and three of them converted. The conversion rate for that day is 3%. It can’t get any simpler than that!
Be sure to always keep in mind the Conversion Rate metric assumes that every transaction is of the same value. Therefore, an improved conversion rate may just mean more lower revenue transactions due to targeting lower value customers.
In Google Analytics, Conversion Rate is one of the standard metrics, and is available across almost all reports. You just need to ensure that the ecommerce code is fired properly in all receipt/thank you pages.

Tracking Product Journey From Carting to Purchasing |17
Sample E-Commerce Code:
ga('require', 'ecommerce', 'ecommerce.js');
ga('ecommerce:addTransaction', {
'id': '1234567', // Transaction ID. Required.
'affiliation': 'Online Store', // Affiliation or store name.
'revenue': '438.00', // Grand Total.
'shipping': '13.95', // Shipping.
'tax': '1.29' // Tax.
});
ga('ecommerce:addItem', {
'id': '1234567', // Transaction ID. Required.
'name': 'Men’s Earthkeepers City Premium Chukka Boot', // Product name. Required.
'sku': '5321R', // SKU/code.
'category': 'Men’s Footwear', // Category or variation.
'price': '185.00', // Unit price.
'quantity': '2' // Quantity.
});
ga('ecommerce:addItem', {
'id': '1234567', // Transaction ID. Required.
'name': 'Women’s Long Sleeve Flower Pattern Shirt', // Product name. Required.
'sku': '5207J', // SKU/code.
'category': 'Women’s Clothing', // Category or variation.
'price': '68.00', // Unit price.
'quantity': '1' // Quantity.
});
ga('ecommerce:send');
</>

Tracking Product Journey From Carting to Purchasing |18
Secret #7: Conversion DurationThis metric is one of the KPIs that not many marketers or web analysts know about, let alone look at. Yet it is a very important report that web analytics ninjas need to have in order to accurately optimize the conversion funnel based on visitor’s experience and behavior.
I define the Conversion Duration metric as, “The time is takes a user to complete a purchase or a Goal from a defined starting event.”
In this eBook, let’s measure two conversion durations for our visitors. The first one I call “Micro Conversion Duration,” which is the time that users take from landing at the site to adding the first item into the shopping cart/basket. The second duration is Macro Conversion Duration, which represents the time users take from landing at the site to making a purchase.
How to Track the Conversion Duration in Google AnalyticsWhile there are various ways to report the calculated metric to GA, we will use the relatively new feature, User Timings, to pass the period of time spent in the conversion.

Tracking Product Journey From Carting to Purchasing |19
The easiest way to implement this is to create a timestamp at the landing page, and second when users add an item to the cart for the first time, then create a third timestamp at the completion of the purchase. Finally, calculate the time delta between each timestamps and pass it to GA.
Here’s the process:i. Create a timestamp at the landing page.
t1 = new Date().getTime();
ii. Save the timestamp in the cookies or in the backend.
iii. Create a timestamp at the add-to-cart confirmation page. t2 = new Date().getTime();
iv. Save the timestamp in the cookies or in the backend.
v. Create a timestamp at the end of the conversion. t3 = new Date().getTime();
vi. Calculate the time duration between t1 and t2 and between t1 and t3. (In GA the time difference between the two timestamps is in milliseconds)
vii. Micro Conversion Duration = timeSpent1 = (t2 – t1) Macro Conversion Duration = timeSpent2 = (t3 – t1)
viii. Fire the Google Analytics Timing method to track the conversion duration in GA. (Read more here about Timing https://developers.google.com/analytics/devguides/collection/analyticsjs/user-timings)
ga('send', 'timing', 'Micro Conversion Duration', 'Add to Cart', timeSpent1, 'Men’s Earthkeepers City Premium Chukka Boot');
ga('send', 'timing', 'Macro Conversion Duration', 'Product Purchase', timeSpent2, 'Men’s Earthkeepers City Premium Chukka Boot');
</>

Tracking Product Journey From Carting to Purchasing |20
Once this data is collected, the report will consist of the Conversion Duration metrics as well as the number of Conversions, as seen below.
Go to Content > Site Speed > User Timings to see your data.

Tracking Product Journey From Carting to Purchasing |21
Secret #8: Cart Item RemovalAs much as we get excited about products that are successfully added to the cart, it’s also important to monitor those products that are being removed before purchase completion. If you start seeing a lot of cart removals of a particular item, then maybe it’s time to reconsider pricing, start a remarketing campaign offering discounts or send follow-up emails with a promotion to shoppers who didn’t complete the purchase of that item.
Similar to what we did above for the Add to Cart action, let’s also fire an event to Google Analytics when users click on the “Remove Item” button in the shopping cart by following the steps below.
How to Track Remove Item in Google AnalyticsTracking Method: EventEvent Category: Shopping CartEvent Action: Remove ItemEvent Label: <Product Name>
Sample Code:
ga('send', 'event', 'Shopping Cart', 'Remove Item', 'Women’s Winter Leaf Beanie');
</>

Tracking Product Journey From Carting to Purchasing |22
Secret #9: Coupon and Promotional CodesThere are a lot of opinions in the industry about whether to include or not to include the Promotional Code box on the shopping cart page. I personally feel that this box has the potential of increasing the cart abandonment rate because visitors who don’t have the promotional code could leave the site to search for one and get distracted in the process to never come back.
Gut feelings are sometimes one of the best sources of insights for business and for life, but when it comes to website optimization I like to combine my gut feeling with data. So let us track the impact of this box on conversion, meanwhile asking certain questions along the way: Do visitors abandon the process if the promo code didn’t go through? Which promo code is generating more sales? Is there any impact on revenue and average order value for purchases with coupons applied verses those without?
How to Track “Successful” and “Failed” Promotional Codes Apply in Google Analytics
Tracking Method: EventEvent Category: Promotional CodeEvent Action: AppliedEvent Label: <Promotion Name>
Tracking Method: EventEvent Category: Promotional CodeEvent Action: FailedEvent Label: <Promotion Name>
Sample Code:
ga('send', 'event', 'Promotional Code', 'Applied', 'mothersday2013');ga('send', 'event', 'Promotional Code', 'Failed', 'mothersday2013');
</>

Tracking Product Journey From Carting to Purchasing |23
Secret #10: Payment MethodWhen you ask your customers to pay online, the payment methods you offer can make a big difference on the order-closing rate and/or the average order value. Tracking the payment methods will help us answer questions like: Is there a difference in buying behavior between consumers who pay with credit cards verses those who pay with Google Wallet or PayPal? Do buyers who use American Express credit cards spend more dollars than the ones who pay using Visa? Do visitors who pay using gift cards or store credits likely to buy more than the available credit?
How to track Payment Method in Google AnalyticsTracking Method: EventEvent Category: Payment MethodEvent Action: <payment method> (i.e. Credit Card, PayPal, Gift Card, Store Credit…)Event Label: <Card Name> (i.e. Visa, Master Card, American Express,…)Event Value: <Order Total> (i.e. 340 for $340.00)
Sample Code:
ga('send', 'event', 'Payment Method', 'Credit Card', 'Visa', '340');</>

Tracking Product Journey From Carting to Purchasing |24
Many marketers and web analysts usually stop tracking their visitors once they finalize their purchase because the ultimate goal of tracking conversions was achieved. True data ninjas, on the other hand, look at the picture differently! Their interest is always on people and the relationship their online clients has just started.
The engagement metrics for this step may include, but are not limited to:
Secret #11: Measuring Buyers’ Engagement Over Time (Cohort Analysis)One issue we may face with the metrics measured so far is the inability to distinguish between growth metrics and engagement metrics.
Think about this scenario:
If we’re continuously gaining a lot of new buyers, I can argue that our engagement numbers will always look positive because those new buyers may stay highly engaged with our website during their very first purchasing visits. They may view many product pages, add multiple items to the cart, share items with their social media followers and buy products. If we just look at the engagement numbers then we would think that we are doing great and our site is very engaging.
However, our buyers may stop being engaged with our site or buying again from our store for any number of reasons: not happy with our services, got what they are looking
PLATINUM
MEMBER
STEP 3:
From Buying To Buying More (Loyalty KPIs)

Tracking Product Journey From Carting to Purchasing |25
for, they are not into leaving feedback and rating products after purchasing, already shared their favorite products with all their social media friends, etc.
As you see, the lack of continued engagement of these one-time buyers is being hidden by the high numbers of new buyers.
Potential solution in this situation:Group buyers based on their purchasing date. The visitors who bought in March make up the March cohort, the visitors who bought in August make up the August cohort, and so on. We then investigate how each cohort stays engaged with our site over time, comparing the cohorts against each other to make sure that the online shoppers, for example, who bought in December are more engaged than those who bought in January.
In order to track the above KPI, we will set a custom dimension for every purchase with two values: the purchase date and the purchase count.
Configuration:The Day of Purchase custom dimension is defined in the property settings section of the web interface with these values:
Index: 1Name: Day of PurchaseScope: SessionState: Active
Sample Code:
The third string parameter is the purchase date. In the above configuration, the visitor successfully confirmed the transaction on December 26th, 2013.
ga('set', 'dimension1', '20131226');</>

Tracking Product Journey From Carting to Purchasing |26
Secret #12: Measuring Buyers’ Engagement Based on the Number of Their Purchases (Life Time Value)Analyzing the users’ behavior based on their level of loyalty (frequency of their purchase) is another distinguishing factor between great analysts and mediocre analysts. Similar to what we did in the last section, let’s segment our buyers based on the number of times they bought from our store. Those who bought 3 times will make up the “3 purchases” cohort, and those who bought 7 times will make up the “7 purchases” cohort and so on.
Now we can see how each cohort is performing. Which campaign brought more of the second time buyers? Which visitors’ segment is more active in sharing our products in social sites? What is the email click rate for the visitors who bought more than 10 times? Etc.
In order to track the above KPI, we will set a custom dimension for every purchase. The purchase count value has to be read from the backend (User’s Profile/Account) during the order confirmation process and get passed to GA through this code. We will set the value of the custom dimension at the User level to ensure grouping all of the user’s component sessions and hits together.
Note: The value of the User-Level custom dimension will be applied to all user activities in current and future sessions, until the Number of Purchases value changes by a new purchase.
ConfigurationThe Number of Purchases custom dimension is defined in the property settings section of the web interface with these values:
Index: 2Name: Numbers of PurchasesScope: UserState: Active

Tracking Product Journey From Carting to Purchasing |27
Sample Code:
The third string parameter is the Number of Purchases. The visitor in the above example purchased 8 times from our store.
ga('set', 'dimension2', '8');</>

Tracking Product Journey From Carting to Purchasing |28
Secret #13: Measuring Buyers’ Engagement Based on Their SpendingWe all love big spenders! But in the long run, how do we know the real value of our visitors and their contribution to the success of our business? Again, if our focus is just to measure pure conversions, then we really don’t need to go any further. But if our focus is to measure the lifetime value of our clients and analyze who is really bringing more business to us, then we need to look at our data differently.
If you divide your clients’ demographics into three different sets of customers base on their order value: Big Spenders, Average Spenders, and Small Spenders, then you can truly know over time who is bringing more business than others.
By looking at data within these three segments, you can easily determine the referring sites that are sending us lots of big spenders, or discover that the Defection Rate among the average spenders is very low or that most of our big spenders fall under the one-time buyers or that the big spenders’ cost of acquisition is very high. You might also discover that small spenders not only have a very good Retention Rate, but overtime they convert to big spenders and so on.
For these reasons and more, you need to learn more about our favorite spending cohort, where they’re coming from and how they behave on our site. Once you know where they come from, adjust and optimize the marketing budget to attract more of them. And once you know how these customers interact with the site, you can update and enhance the content to meet their needs.
So How Can This Be Done in Google Analytics?Similarly to what we did for the last two KPIs, we will set a custom dimension for every purchase. This time we will pass the User Type to GA during the order confirmation process. Set the value of the custom dimension at the User Level to ensure grouping all of the user’s component sessions and hits together. As mentioned before, the value of the User-Level custom dimension will be applied to all user activities in current and future sessions, until the User Type value changes by a new purchase.

Tracking Product Journey From Carting to Purchasing |29
Configuration:The User Type custom dimension is defined in the property settings section of the web interface with these values:
Index: 3Name: User TypeScope: UserState: Active
Sample Code:
The third string parameter is the User Type (i.e. Big Spender, Average Spender, Small Spender)
ga('set', 'dimension3', 'Big Spender');</>
Tracking Product Journey From Carting to Purchasing |30
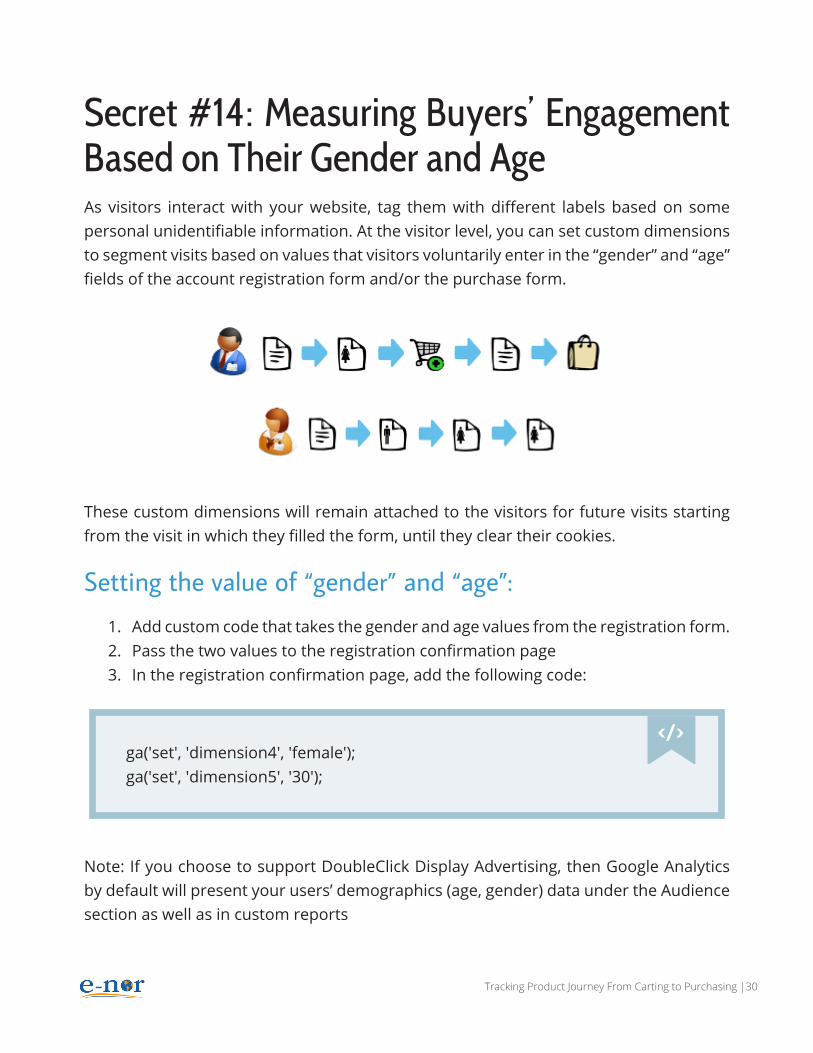
Secret #14: Measuring Buyers’ Engagement Based on Their Gender and AgeAs visitors interact with your website, tag them with different labels based on some personal unidentifiable information. At the visitor level, you can set custom dimensions to segment visits based on values that visitors voluntarily enter in the “gender” and “age” fields of the account registration form and/or the purchase form.
These custom dimensions will remain attached to the visitors for future visits starting from the visit in which they filled the form, until they clear their cookies.
Setting the value of “gender” and “age”:1. Add custom code that takes the gender and age values from the registration form.2. Pass the two values to the registration confirmation page3. In the registration confirmation page, add the following code:
Note: If you choose to support DoubleClick Display Advertising, then Google Analytics by default will present your users’ demographics (age, gender) data under the Audience section as well as in custom reports
ga('set', 'dimension4', 'female');ga('set', 'dimension5', '30');
</>

Tracking Product Journey From Carting to Purchasing |31
To make data available in GA, you need to:
• Make a one-line change to your tracking code
• Set the enabling options in analytics
• Update privacy policy

Tracking Product Journey From Carting to Purchasing |32
Secret #15: Measuring Buyers’ Engagement Based on Their Visit IntentI strongly believe that visit intent is the most important segmentation in digital analytics. That is because we cannot accurately measure and optimize our online store performance without knowing who is visiting and why they are visiting. Unlike all visitor-type segmentations that we discussed so far, behavioral or visit-intent segmentations are not easy to track and measure as they require complex tools and techniques.
Here are few reasons why Timberland visitors may visit the site:
• Buy gift cards
• Buy apparel
• Return an item
• Check order status
• Check gift card balance
• Allocate the nearest Timberland store
• Find the customer service telephone number
• Search for a career at Timberland
How We Track Visit Intent in Google Analytics
Set a custom dimension once we get a clear indication about the visitor’s visit intent.
Configuration:The Visit Type custom dimension is defined in the property settings section of the web interface with these values:
Index: 6Name: Visit TypeScope: SessionState: Active

Tracking Product Journey From Carting to Purchasing |33
Sample Code:
ga('set', 'dimension6', 'Check Order Status');</>

Tracking Product Journey From Carting to Purchasing |34
Now as we have all KPIs needed to start our analysis, I have to caution you that it’s very dangerous and misleading to look at these KPIs at the site-wide level. In the last section, you may have noticed, I focused on creating some visitor-level segmentation that we can use to help us massage our data and read our KPIs accurately.
What is wrong with looking at KPIs at the site-wide level?Think about this scenario:
If I tell you that the performance of the past Thanksgiving campaign for your online store is as following:
• Funnel Abandonment Rate: 85%• Conversion Rate: < 0.5%• Average order value: $9
You might immediately - after waking up from your heart attack - fire your entire web team and make executive orders to change the funnel flow and redesign the whole web store.
But wait!
Let’s apply some segmentation to the above numbers:
• Funnel Abandonment Rate for US visitors is 15%• Funnel Abandonment Rate for UK visitors is 65%
FINAL THOUGHTS 1:
Multi-Tiered Segmentation

Tracking Product Journey From Carting to Purchasing |35
• Conversion Rate for US visitors is 2.5%• Conversion Rate for Brazil visitors is 0.3%• Average order value for first time US buyers is $65• Average order value for organic search visitors with keyword == “Timberland
return policy” is $5
Hmmmm… now, I think you’re not only considering not firing your web and marketing teams, but rather sending them to Hawaii for a vacation!
By applying few basic segments, we just found out that our target audience actually reacted very well to the Thanksgiving campaign and their performance was beyond our initial expectations.
So before we start laying down the foundations of our analytics framework and deciding on the KPIs, we need to think about business objectives, who is visiting our site and why they are visiting us. Once we do that and we do it right, KPIs will be generated based on real business needs and the data collected will be more actionable and insightful.
Tracking Product Journey From Carting to Purchasing |36
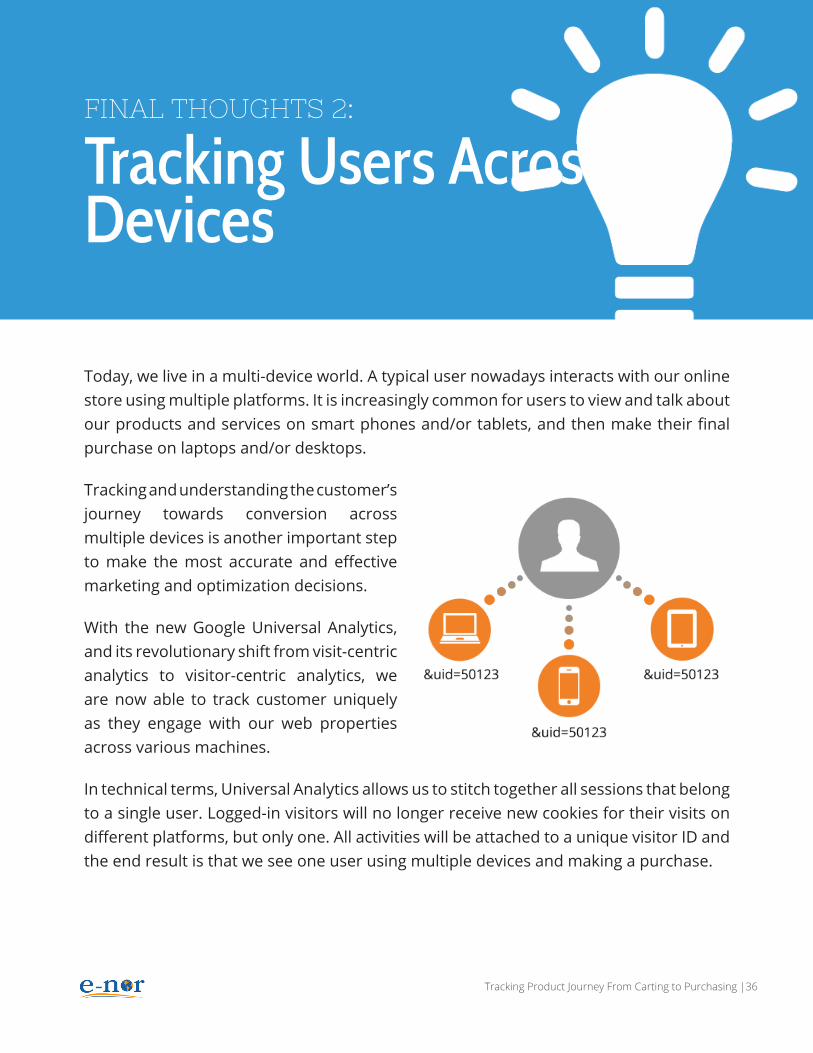
Today, we live in a multi-device world. A typical user nowadays interacts with our online store using multiple platforms. It is increasingly common for users to view and talk about our products and services on smart phones and/or tablets, and then make their final purchase on laptops and/or desktops.
Tracking and understanding the customer’s journey towards conversion across multiple devices is another important step to make the most accurate and effective marketing and optimization decisions.
With the new Google Universal Analytics, and its revolutionary shift from visit-centric analytics to visitor-centric analytics, we are now able to track customer uniquely as they engage with our web properties across various machines.
In technical terms, Universal Analytics allows us to stitch together all sessions that belong to a single user. Logged-in visitors will no longer receive new cookies for their visits on different platforms, but only one. All activities will be attached to a unique visitor ID and the end result is that we see one user using multiple devices and making a purchase.
FINAL THOUGHTS 2:
Tracking Users Across Devices

Tracking Product Journey From Carting to Purchasing |37
Web analytics tools, by default, use the “last touch” attribution model to assign credit for conversions and ecommerce transactions, which means only the last point of interaction prior to conversion will be granted the credit for conversion.
I know you are not naive to believe that all your August conversions are coming from the “Back to School” email blast that you sent last month, but your email marketing agency or your affiliate agency might want you to believe so and provide you with one-side-of-the-story reports to support their claims.
In order to be able to optimize campaign effectiveness, and accurately calculate return on investment across channels, we have to look deeply at the various marketing channels and how they work together to create sales and conversions.
GA’s Multi-Channel Funnels reports answer these business needs in a very simple way by showing how marketing channels interact with each other. It gives a complete picture of how our visitors interact with the different marketing campaigns prior to their conversion visit.
The real value of the Multi-Channel Funnels report will only be achieved on if all marketing campaigns are tagged. Google Analytics allows pushing campaign-identifying information by adding tags to the end of the marketing destination URLs. Tags are variables that contain campaign information. For example, ‘utm_medium=social’ identifies a social
FINAL THOUGHTS 3:
Multi-Channel Attribution

Tracking Product Journey From Carting to Purchasing |38
media channel and ‘utm_campaign=back-to-school-2013’ identifies the Back to School campaign for 2013.
Setting up campaign tags doesn’t require any modifications to the tracking code. They can be set up manually or by using a tool such as CampaignAlyzer to help append URL variables.
CampaignAlyzer is a web-based application that acts as a central repository platform where organizations that are using Google Analytics can store their marketing campaign values in one database. Marketing agencies and digital marketers across an organization would have the ability to collaborate in tagging various online and offline campaigns, and ensure consistency in their campaign tagging.
Example:Tagging a social update on Facebook for the 2014 “father’s day” campaign:
1. Enter the following variables into the URL builder:
Destination URL: http://shop.timberland.com/product/?productId=15261456
Campaign Source: facebookCampaign Medium: socialCampaign Name: fathers-day-2014
2. Use the generated link URL in your Facebook ad:
http://shop.timberland.com/category/index.jsp?categoryId=4278570&utm_source=facebook&utm_medium=social&utm_campaign=fathers-day-2014

Tracking Product Journey From Carting to Purchasing |39
In ConclusionWe have covered the effective metrics to track data for an ecommerce website. All that is left to be done now is to aggregate all that data into a comprehensive report.
Now, the top engagement metrics can be taken in at a glance!
PRODUCT Micro Conversions
Name Department Product Views Add to Cart
Like Tweet Pin It Average Rates
Men’s Lightweight Quilted Jacket Men | Clothing | Outerwear 27841 1413 2804 124 14 4
Women’s Earthkeepers® Quilted Vest Women | Clothing | Outerwear 24553 1794 3112 187 5586 3
Women’s Winter Leaf Beanie Women | Accessories | Hats & Scarves 24397 1677 3527 551 3547 4
Junior Mukluk Waterproof Tall Lace Boot Kids | Footwear | Boots 24308 991 900 125 256 5
Men’s Classic Cargo Pant Men | Clothing | Pants 22173 1485 1998 88 212 5
Men’s Falmouth Vintage Plaid Shirt Men | Clothing | Shirts 21804 764 2458 112 787 3
Earthkeepers™ Sonya Small Wallet Women | Accessories | Wallets 21142 1883 4021 450 4563 4
Men’s Half-Button Wool Sweater Men | Clothing | Sweaters 19839 1457 2273 254 425 3
Earthkeepers™ Pathrock 23L Daypack Men | Accessories | Backpacks 18550 1249 2137 304 74 2
Women’s SmartWool® Warm Hat Women | Accessories | Hats & Scarves 17991 911 3824 1241 2936 4
Women’s SmartWool® Star Garnet Gaiter Women | Accessories | Hats & Scarves 17423 1124 1926 45 783 3
PRODUCT Macro Conversions
Name Department Orders Average Qty
P roduc t Price
P r o d u c t Revenue
Conversion Rate
Men’s Lightweight Quilted Jacket Men | Clothing | Outerwear 780 1.2 $128.00 $119,808.00 2.80%
Women’s Earthkeepers® Quilted Vest Women | Clothing | Outerwear 882 1 $98.00 $86,436.00 3.59%
Women’s Winter Leaf Beanie Women | Accessories | Hats & Scarves 640 1 $30.00 $19,200.00 2.62%
Junior Mukluk Waterproof Tall Lace Boot Kids | Footwear | Boots 426 1 $85.00 $36,210.00 1.75%
Men’s Classic Cargo Pant Men | Clothing | Pants 550 1 $65.00 $35,750.00 2.48%
Men’s Falmouth Vintage Plaid Shirt Men | Clothing | Shirts 660 1.2 $64.50 $51,084.00 3.03%
Earthkeepers™ Sonya Small Wallet Women | Accessories | Wallets 333 1 $105.00 $34,965.00 1.58%
Men’s Half-Button Wool Sweater Men | Clothing | Sweaters 927 1 $108.00 $100,116.00 4.67%
Earthkeepers™ Pathrock 23L Daypack Men | Accessories | Backpacks 874 1.3 $90.00 $102,258.00 4.71%
Women’s SmartWool® Warm Hat Women | Accessories | Hats & Scarves 774 1 $32.00 $24,768.00 4.30%
Women’s SmartWool® Star Garnet Gaiter Women | Accessories | Hats & Scarves 698 1 $40.00 $27,920.00 4.01%

Tracking Product Journey From Carting to Purchasing |40
Executives:Hire great digital analysts. They are the main ingredient for success.
Digital Analysts:The days of site-wide level KPIs, treating all site visitors as being homogenous, single marketing campaign attribution, one-size-fits-all approach, and visit-centric analytics are in the past.
Today’s digital analytics requires smart analysts who know how to:
• Integrate KPIs into their company’s strategy• Segment and create different personas for the site’s visitors• Track users across devices and across marketing channels • Track and measure buyers’ engagement over time and based on their visit intent
Solution Architects:Bridging the gap between business requirements and technical capabilities is a tough job, as measurement technologies and analytics tools keep evolving everyday. It is important that Solution Architects and Technical Analysts stay at the cutting edge of the analytics technologies. They need to move beyond tracking clicks within isolated sessions to tracking visitors’ behavior across sessions and platforms.
TAKE HOME:
Action Items

About Allaedin EzzedinAllaedin Ezzedin is the analytics manager at E-Nor Inc., an online marketing consultant, blogger and the founder of CampaignAlyzer. He has a passion for bridging the gap between business objectives/goals and web analytics solutions.
Allaedin works with organizations to architect and develop strategies for successful digital marketing optimization, and helps clients integrate web analytics into their decision making processes. Allaedin holds a Bachelor of Science degree in Computer Engineering from San Jose State University and is a Certified Web Analyst by the Digital Analytics Association (DAA).
About E-NorE-Nor, Inc. is a leading digital analytics and marketing optimization consulting firm headquartered in the heart of the Silicon Valley in Santa Clara, with offices in Los Angeles, Dallas, Tampa, NYC and Brussels. E-Nor’s clients include Fortune 500, as well as those aspiring to establish a data-driven culture. E-Nor leverages its time-tested digital analytics optimization framework to bring actionable insights to some of the world’s most recognized brands including Sony, SanDisk, MIT, eBay, and more.
E-Nor was founded in 2003, and has achieved multiple Google certifications including Google Analytics Premium Authorized Reseller and Google Analytics Certified Partner. E-Nor is a Premier Corporate Sponsor of the Digital Analytics Association. Many of E-Nor’s consultants are frequent speakers at leading industry conferences and publish regularly on www.e-nor.com/blog as well as leading industry publications.
About i
© Copyright E-Nor Inc. 2014. All rights reserved.
3000 Scott Blvd, Suite 216, Santa Clara, CA 95054 U.S.A.http://www.e-nor.com