from chaos to action: turning usability testing data into actionable insights without going insane
TRANSCRIPT

From Chaos to Action: Turning Usability Testing Data Into Actionable
Insights Without Going Insane
Carlos Rosemberg

How data is helping design
Analytics
Social media
Usability tests
A/B tests
Sales data
Customer service logs
Surveys
Interviews
Contextual research
other…

QuantitativeWHO
WHAT
WHEN
WERE
QualitativeWHY
HOW
Numerical data Non numerical data

Data driven design is a way to reduce guess-work into design
process, making it more effective

What about the efficiency in this process?
Let’s see three major problems in data driven design

Drinking from the firehoseOverwhelmed by the data

Analysis paralysisOverthinking, no outcomes

"The uncomfortable”, by Katerina Kamprani
Disconnection between research findings and solutions

How to avoid being overwhelmed by the data and choosing “not-so-good" solutions in a product development perspective?

D I V E R G E N T / C O N V E R G E N T T H I N K I N G
Tim Brown (based on Richard Nisbett’s work), 2009

T H E D O U B L E D I A M O N D
The British Design Council, 2005

Reframing to usability testing activities

OBSERVED ISSUES
SOLUTION PRIORITIZATION
Prioritize potential solutions according multiple criteria
DATA COLLECTION
Collect and generate data from usability tests
ISSUE PRIORITIZATION
Normalize and prioritize issues according multiple criteria
IDEA GENERATION
Generate potential solution ideas
RESEARCH QUESTIONS
ISSUES LIST
PROBLEM LANDSCAPE
POTENTIAL SOLUTIONS
SOLUTIONS BY ROI

Data collection
Focus on usability (effectiveness, efficiency and satisfaction)
Issues are friction events that hurt effectiveness and efficiency (mistakes, paths, system errors, etc).
An issue can occur with multiple participants.
Comments can be positive, negative or neutral.
Satisfaction can be collected as a scale (be careful!).

B A S I C I S S U E L O G F R O M U S A B I L I T Y T E S T I N G
ID WHERE TASK DESCRIPTION P1 P2 P3
1 Login page Login using a social network
Didn’t recognize the Twitter option X
2 Main menu Create a post Didn’t find the option for adding a post X X
…
An example of aggregated data log from 3 participants (P) as seen in Lewis/Sauro (2012)
Participants

C O L L E C T I N G S AT I S F A C T I O N L E V E L S
P1 P2 P3 P4 AVERAGE
Satisfaction rating 2 3 4 4 3,25
An example of aggregated data log from 3 participants (P).
Participants

Issue prioritization
Issues are prioritized multidimensionally.
Common dimensions are severity and frequency.

F R E Q U E N C Y
SE
VE
RIT
Y
3rd 2nd
2nd 1st
W H I C H I S S U E S A R E M O R E I M P O R TA N T ?

C A L C U L AT I N G I S S U E I M PA C T
ID TASK WHERE ISSUE SEVERITY P1 P2 P3 FREQUENCY IMPACT
1Login using a social network
Login page
Didn’t recognize the Twitter option 5 1 1 5 x 1 = 5
2 Create a post
Main menu
Took more than 3s to find the "add post" option 1 1 1 2 1 x 2 = 2
3 Create a post
Main menu
Struggled opening and closing the hamburger menu
3 1 1 2 3 x 2 = 6
A simple data log (Lewis/Sauro, 2012). Other parameters can be added.
1 (trivial) = user stops to figure out3 (major) = user accomplishes with difficulties (try and error)5 (blocker) = user doesn't accomplish the task
IMPACT = SEVERITY x FREQUENCY
FREQUENCY is the sum OR proportion of occurrences of a given issue for all participants

Entering into solution phase: Going beyond recommendations

Idea generation
Recommendations and solutions are not the same thing
Solution ideas are specific.
Some issues have obvious solutions, some not.
A solution can address multiple issues, in different levels.
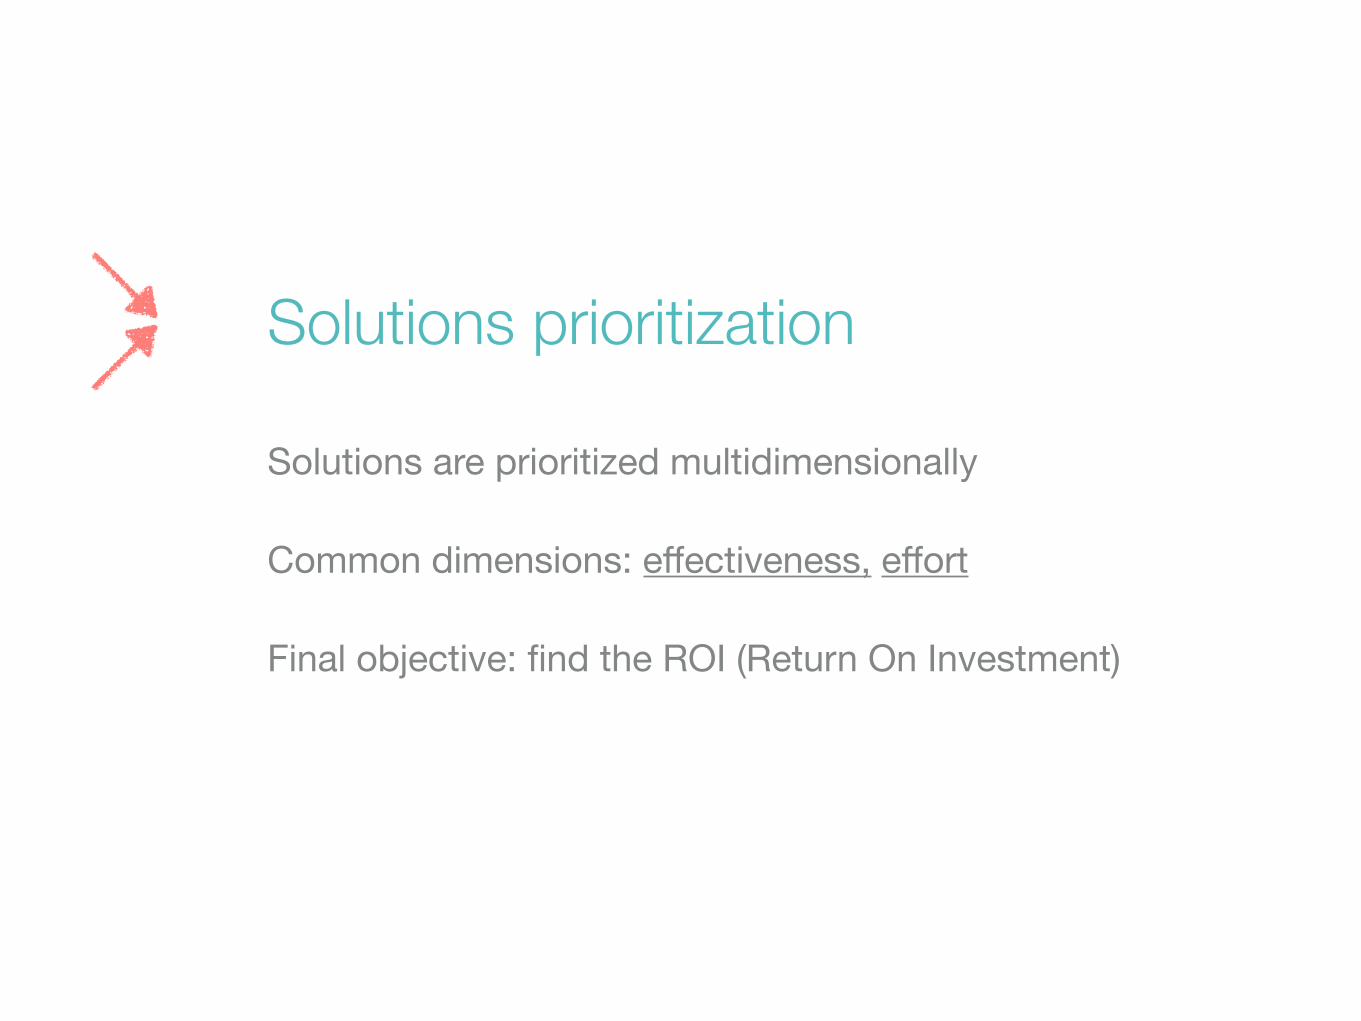
Solutions prioritization
Solutions are prioritized multidimensionally
Common dimensions: effectiveness, effort
Final objective: find the ROI (Return On Investment)
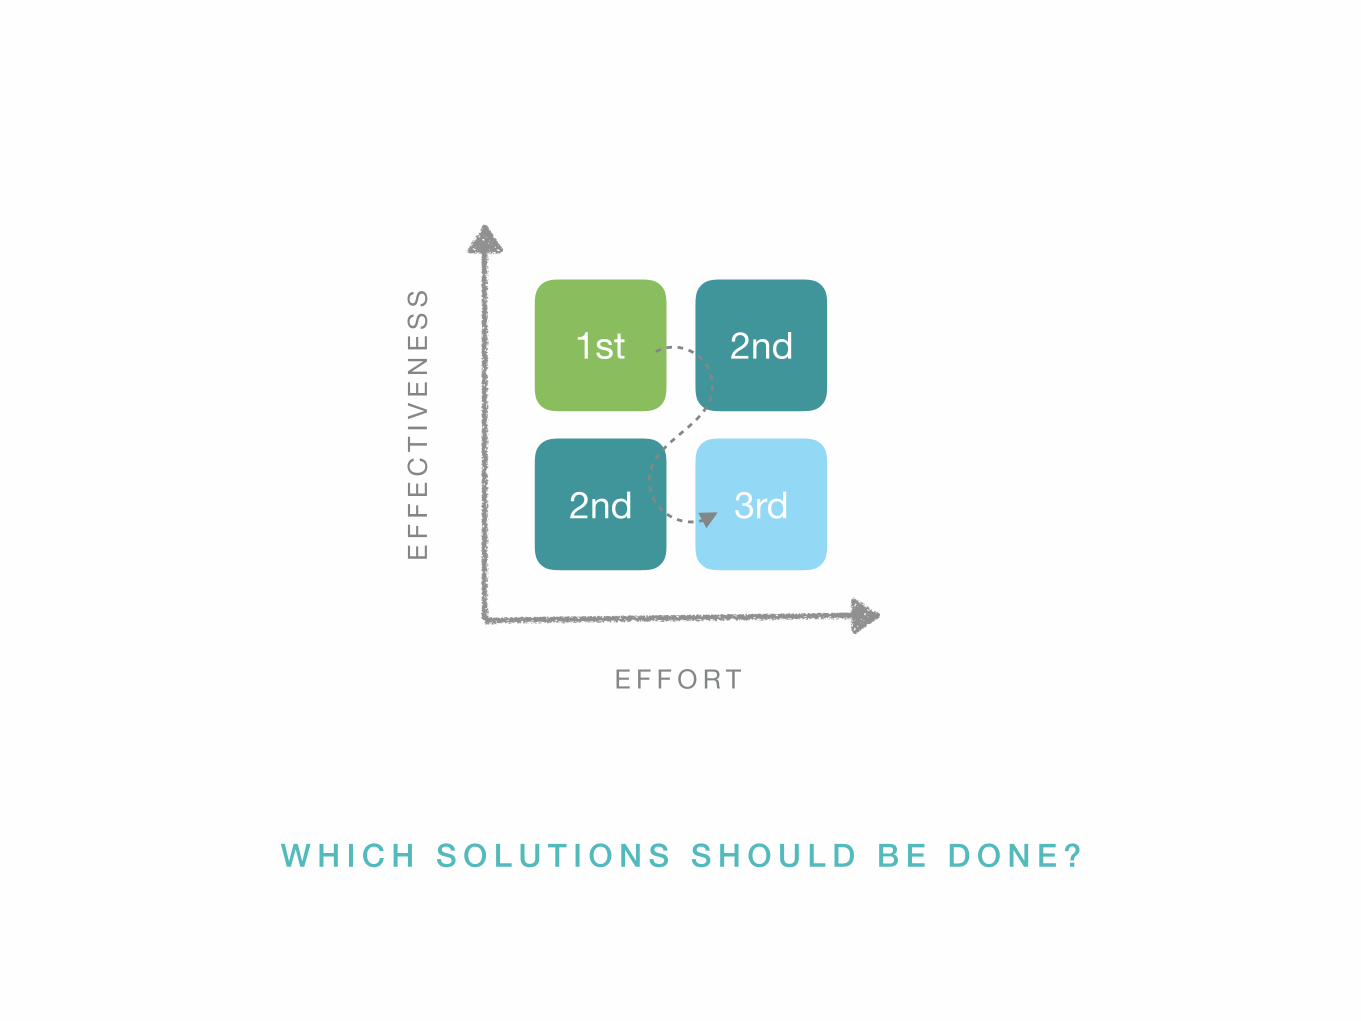
2nd
E F F O R T
EF
FE
CT
IVE
NE
SS
3rd2nd
1st
W H I C H S O L U T I O N S S H O U L D B E D O N E ?

C A L C U L AT I N G S O L U T I O N R O I
ID SOLUTION IDEA I1 (5 )
I2 (2 )
I3 (6 )
EFFECTIVENESS EFFORT ROI
1 Make the Twitter login button bigger and use original blue color
3 15(3 x 5 + 0 + 0)
1 15 (15 / 1)
2Make the Twitter login button bigger and put the email login in another screen state
3 15(3 x 5 + 0 + 0)
3 5 (15 / 3)
3 Remove the hamburger menu and reorganize options hierarchically
3 6 42(0 + 3 x 2 + 6 x 6)
5 8,4 (42 / 5)
Finding the optimal path for solving UX issues
1 = Minimum effort3 = Medium effort5 = Maximum effort
SOLUTION ROI = Effectiveness / Viability
EFFECTIVENESS = Sum of all Idea Potentials x Issue Impact (I1 + I2 + I3)
Idea Potential for solving the issue. Values can be none, 1, 3 and 5.

In summary
End-to-end workflow (product development oriented).
Get all the team involved in the process.
Issues and solutions are mutually traceable.
Can be done collaboratively.
Can be extended to other techniques than usability testing.

Limitation
It does not include in prioritization the positive
attitudes and behaviors, only usability issues: This
data is logged apart.

And of course, don't forget
Numbers don't tell everything. Always remember to
take in account the QUALITATIVE data when
understanding behaviors.


T H A N K Y O UCarlos Rosembergcarlosrosemberg.com @carlbberg