from: dante nomellini, jr. … to support agricultural operations in the delta lowlands (which...
TRANSCRIPT
From: Dante Nomellini, Jr. [mailto:[email protected]] Sent: Tuesday, May 12, 2015 6:03 PM To: 'Coats, Brian@Waterboards'; 'Evoy, Barbara@Waterboards'; 'Trgovcich, Caren@Waterboards'; 'Dadamo, Dorene@Waterboards'; 'Rizzardo, David@DWR'; 'Nemeth, Stephen@DWR'; 'O'Hagan, John@Waterboards'; 'Mrowka, Kathy@Waterboards'; '[email protected]'; 'Herrick, John @aol.com'; 'Jennifer Spaletta ([email protected])'; 'George, Michael@Waterboards'; '[email protected]'; '[email protected]' Subject: RE: San Joaquin River Stakeholder Meeting - Senior Rights
Thank you SWRCB for hosting this morning's meeting. That was quite informative and a most appreciated opportunity for the stakeholders to be able to interact with the SWRCB, DWR and other stakeholders on this critical topic.
Nearly the entire meeting focused on natural flow and curtailment discussions upstream of the Delta, however, at the end of the meeting I was able to hand out and briefly discuss a couple of handouts that I prepared which pertain to natural flow and curtailments within the Delta.
Needless to say, I believe these handouts are a good read for everyone on this email list and highly pertinent to the matter of curtailments within the Delta, hence, I've attached them hereto for those that were not in attendance at the meeting.
I've also attached a copy of DWR's 1956 Report No. 4 which I reference in one of those attachments which contains a quite remarkable conclusion which, as I read it, states that water diversions to support agricultural operations in the Delta Lowlands (which comprise the vast majority of the Legal Delta) actually improve water quality during the summer months. If that is true, then such diversions would seemingly reduce the need for Storage Releases to maintain salinity control during those months, i.e., the months when storage supplies are the scarcest.
That is quite a profound conclusion that has obvious implications to curtailments within the Delta and the desired outcome of such curtailments.
Thanks again for the meeting and for taking the time to review these materials.
Sincerely, Dan Jr. Attorney for the Central Delta Water Agency
Dante J. Nomellini, Jr. ("Dan Jr.") Attorney at Law Nomellini, Grilli & McDaniel Professional Law Corporations 235 East Weber Avenue Stockton, CA 95202 Mailing address:
WSID Exhibit 183
P.O. Box 1461 Stockton, CA 95201-1461 Telephone: (209) 465-5883 Facsimile: (209) 465-3956 Email: [email protected] _____________________________ CONFIDENTIALITY NOTICE: This communication with its contents may contain confidential and/or legally privileged information. It is solely for the use of the intended recipient(s). Unauthorized interception, review, use or disclosure is prohibited and may violate applicable laws including the Electronic Communications Privacy Act. If you are not the intended recipient, please contact the sender and destroy all copies of the communication.
-----Original Appointment----- From: Coats, Brian@Waterboards [mailto:[email protected]] Sent: Tuesday, May 05, 2015 8:40 AM To: Evoy, Barbara@Waterboards; Trgovcich, Caren@Waterboards; Dadamo, Dorene@Waterboards; Rizzardo, David@DWR; Nemeth, Stephen@DWR; O'Hagan, John@Waterboards; Mrowka, Kathy@Waterboards; [email protected]; Herrick, John @aol.com; Jennifer Spaletta ([email protected]); Dante Nomellini, Jr. ([email protected]); George, Michael@Waterboards; [email protected]; [email protected] Subject: San Joaquin River Stakeholder Meeting - Senior Rights When: Tuesday, May 12, 2015 9:00 AM-11:00 AM (UTC-08:00) Pacific Time (US & Canada). Where: Cal/EPA building, Conference Room 320
Meeting to discuss supply analysis and curtailments for senior rights in the San Joaquin River watershed.
DWR will present their full natural flow supply analysis for the first part of the meeting with a discussion on senior right curtailments afterwards.
For those that can’t make the meeting and would like to participate on a conference call, the phone number is 877-402-9753, participant code is 258306.
STATE OF CALIFORNIA DEPARTMENT OF WATER RESOURCES
GOODWIN J. KNIGHT, Govornor I-URVIZY 0. BANKS, Diroctos of Water Besourcos
INVESTIGATION OF THE
SA.CRAMENrl?O-SAN JOAQUIN DELTA
Report No. 4
QUANTITY AND QUALITY OF WATERS APPLIED T O AND
DRAINED FROM THE DELTA LOWLANDS
JULY 1956
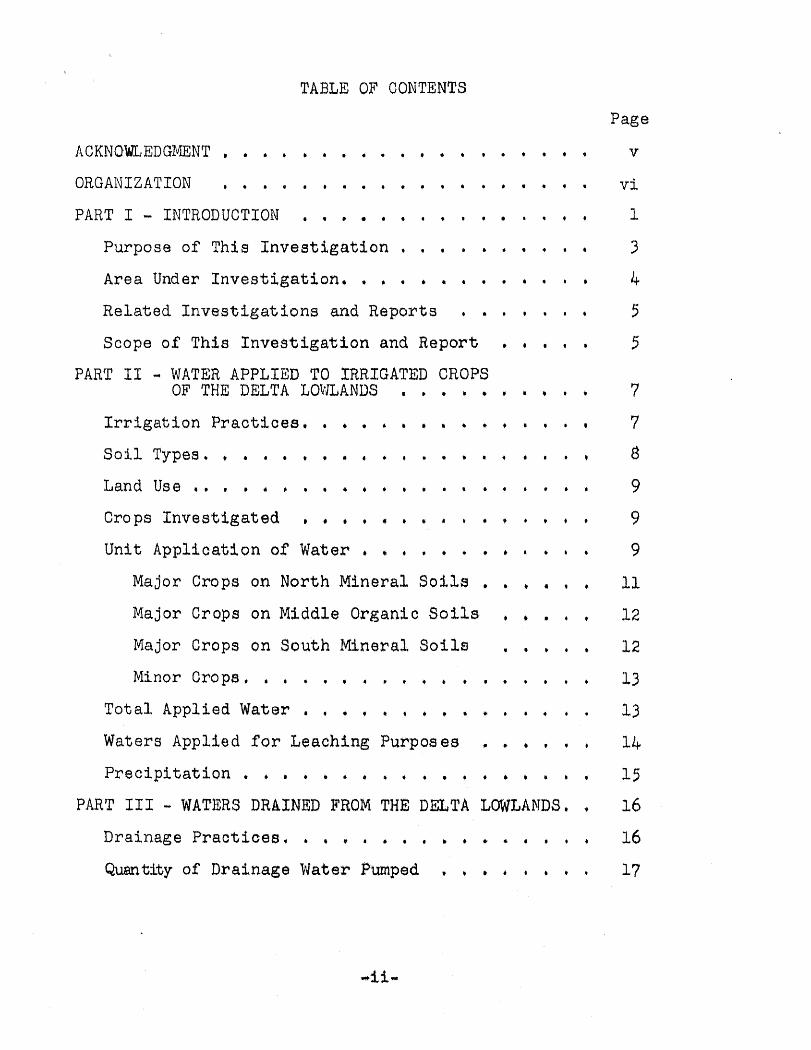
TABLE OF CONTENTS
QRGAlVXZATSQN , . , , , , , . , , , . , , . . . . . PART 1 INTRODUCTION , 9 e * 8 * e q u 0 * +
Purpose o f Th is I n v e s t i g a t i o n . , . . . . . . . A r e a Under Investigation, , . . . . . . . . . Related Inves t iga t ions and Reports . . * , . , ,
Scope o f This I n v e s t i g a t i o n and Report . @ * . PART T I * WATER APPLIED TO IRRIGATED CROPS
OF THE DELTA LOVlLANDS . e c * * * *
I r r i g a t i o n P r a c t i c e s . . , . * . . . . . + . . I
S o i l Types. , . . . . . . . * . . . . . , . ,
Page
V
VI
1
3
4
5
5
Unit Applicat ion o f Water , + + * 9
Major Crops on North Mineral S o i l s , , 11
Major Crops on Middle Organic S o i l s , , , , 12
Major Crops on South mnerak S o i l s . . . 12
M i n o r C r o p s , , . , . . . . . 33
T o t a l AppliedWatxw . . , + 13
Waters Applied f o r Leaching Purposes , . . , 14
PreclpltaClon . , . , , . . . . . . . . . . . . . 15
PART IT1 - WATERS DRAINER FROM THE DELTA LOWLANDS, 16
Drainage Prac t ices . . , . . . . , . . , , 16
Quan%ity of Drainage Water Pumped . , , , 17
Table o f Contents - Continued
Page
PART I V - WATER SUPPLY AND DISPOSAL, e e
Consumptive Use . . . . . . . . . . . . . . . . , Subsurface Inflow . . , . , , , . . . . . . .
PART V - QUALITY OF WATER 0 , , , 0 a . * , * , ,
Q u a l i t y o f Applied Water . . . . . . . . . . . Q u a l i t y of Drainage Waters. . . . . . + * , * .
Channel-Water Degradation by Drainage Water a
PART VT - SUMCIIEARY AND CONCLUSZQN e a * v r
S u m m a r y . ~ . . . , . , b b . e . . , . a . . e ~
Conckusion, , , , . , , , . , . , . , * , . * . TABLES
( ~ollowing Tex t )
Tabla No.
Land Use - Delta Lowlands, 1955
I r r i g a t e d Crops - Del ta Lowlands,
Water Applied to Certain I r r i g a t e d Crops During 1954, Delta Lowlands - 1Nar.t;h NinsrraJ, Sail,
Wa te r bp lied to Certain I r r iga t sd Crops During 1954, 3e D e l t a owlands - Middle Organic S o i l
Water Applied to Certain Irr igaCed Crops During 1954, Delta Lowlands - South, PIineral Soil
Seasonal Use o f Applied Water - Delta Lowlands, 1954
Monthly Distribution of Applied Water to I r r iga ted Crops, Delta Lowlands, 1954
Average Precipitation in Sacramento-San Jonquin Delta
P r e c i p i t a t i o n on Delta Lowlands
Tablea - Continued
Table No,
10 Drainage From Delt a Lowlands
11 Consumptive Use Requirements, Delta Lowlands, 1955
12 Water Supply and Disposal, Delta Lowlands
Weight of S a l t s in Applied Irrigation Water, Delta Lowlands
u Average Q u a l i t y o f Applied Water, Del ta Lowlands
1 5 Weight of S a l t s In Drainage Water, Delta Lowlands
16 Average Q u a l i t y o f Drainage Water, Delta Lowlands
PLATES
(Following Tables)
J Lowlands o f t h e Sacramen-bo-San Joaquin Delta
2 Subdivis ion Unita o f t h e Sacramento-San Joaquin Delta
3 Lowlands Drainage Rates - May Chrough Octobar , L95b
4 Lowlands Drainage Rates - November, 1954, through February, 1955
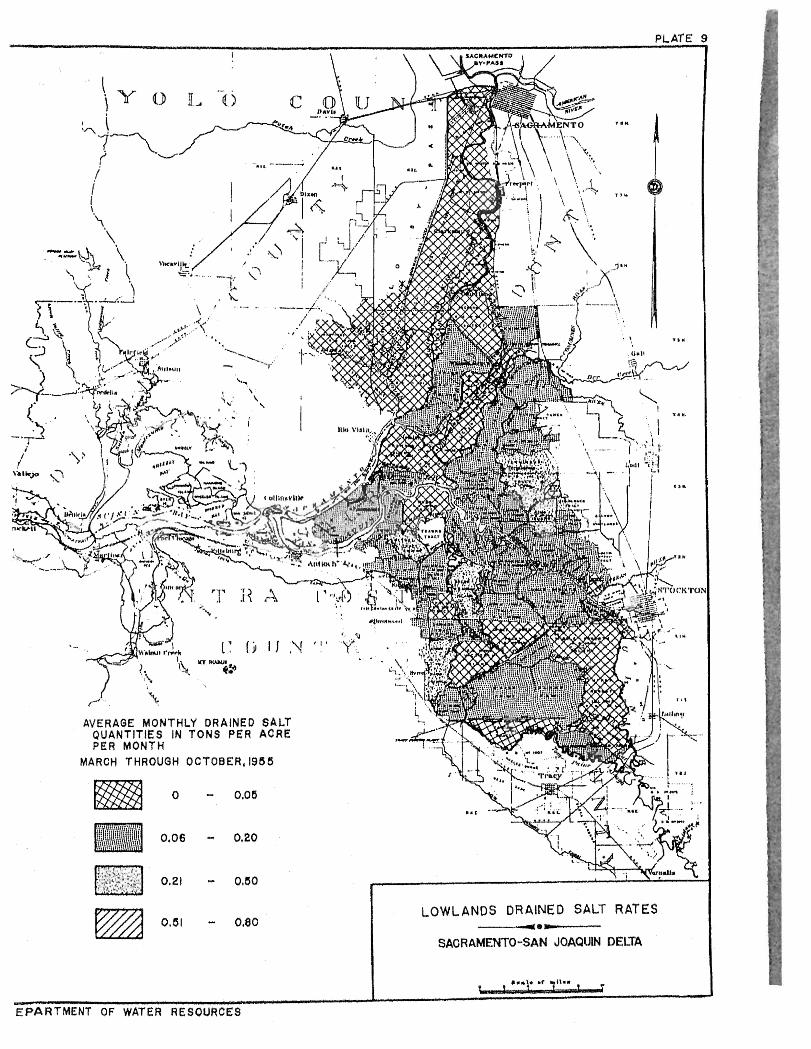
5 Lowlands Drainage Rates - March, 1955# t h r o u g h October, 1955
6 Comparison o f Wate r Supply and Disposal - Delta Lowlands
7 Lowlands Drained S a l t Rates - May through October, 1954
8 Lowlands Drained Salt :Rates - November, 1954, through February, 1955
9 Lowlands Drained SalC Rates - March, 1955, through October, 1955
Valuable assis tance and da ta used in this investiga-
t i o n were con t r i bu t ed by many i n d i v i d u a h and by p u b l i c and
pr iva te agencies, T h e i r coopera t ion i s g r a t e f u l l y acknowledged;
it g r e a t l y f a c i l i t a t e d t h e c o l l e c t i o n and compilation o f d a t a
contained i n t h i s r epor t .
ORGANIZATION
Water P r o j e c t Authority
of t h e
State o f California
Frank 3, Durkee, Director o f Public Works Chairman
Edmund G. Brown Attorney General
John M, Pef rce Di rec tor of Finance
Charles G w Johnson S t a t e Treasurer
Robert C. Kirkwood S t a t e C o n t r o l l e r
Harvey 0. Banks, S t a t e Engineer Executivs Officer
Jaabel C. NessJer Acting Secretary
E f f e c t i v e Ju ly 5, 1956, t h e Water Prw j a c t Authority was abolished and its func t ions , d u t i e s and responsibilities assigned to t he Department of Water Resources by Chapter 52, S t a t u t e s o f 3,956.
Harvey 0 , Banks Director of Water Resources
W, 3 , She l ton Deputy Direc to r o f Watar Resources
William L. Berry Chief, Diviaion of Water Resourcee Planning
Activities covered by t h i s r e p o r t were conducted by t he s t a f f of t h e Water Project Author i ty under
t h e d3rectAon o f
I r v i n M. Ingerson Principal Hydraulic Engineer
a s s i s t ed by
Wayne MacRostie Supervising Hydraulic Engineer
The f i e l d and office work for this investigation were supervised by and this r e p o r t was prepared by
Sam Kabalcov Sen io r Hydraulic Engineer
Fie ld and O f f i c e A s s i a t a n t a
William O, Brigance
George W * Dsatharage
Walter Fieher
Roger B, Lindholm
A s s i e t a n t C i v i l Engineer
Aesistant Hydraulic Engineer
AssisGant Hydraulic Engineer
Assistant Hydraulic Engineer
ZNVESTXGATION
of the
SACRAMENTO-SAN J O A Q U I N DELTA
Report No, 4
QUANTITY AND QUALITY OF WATERS APPLIED TO AND DRAINED FROM
THE DELTA LOWLANDS
s k * *
PART I - INTRODUCTION T h i s s e r i e s of f i v e repor%s i s designed to furnis h naw
and additional f a c t u a l data collectsd during t h a past three years,
with ana lysss thereof, t h a t a re germane to Lhose hydrologic prob-
lems in %he Statsts water development programs which invoJva tha
use of Delta channeXa as conveyanas conduits and as sources o f
divers ton,
The Sacramento-San Joaquin Delta l i e a i n t h e Cantmil
Val ley of Ca l i fo rn ia and embracea t h e confluent channels m d trib-
utaries of the Sacramento River en te r ing from t h e n o r t h , t h e
Mokelumne and CaLavaras Rivera enter ing from t h e eas t , and of t h e
S m JoaquXn River en te r i rq from t h e sou2;h, The DeUa 18 camprlsed
of a block of newly 4OO,OOO acres of irrigated agricultural land
i n t e r l a c e d by more than 600 m i l e s a f t i d a l channel8 which In turn
a u r r a w d more Lhan 50 islands l y ing at or below sea-lsvel and
which are protec ted by Isveese
The s t r a t e g i c geographic location of t h e Del ta makes
i t t h e p i v o t a l conveyance l i n k a c r o s s which t h e surplus w a t e r
suppl ies of t h e nor thern por t ion of t h e State must be t r a n s p o r t e d
t o t h e water -def ic ient areas o f t h e c e n t r a l and southern p o r t i o n
t o permit t h e continued agricultural, i n d u s t r i a l , and munic ipa l
growth of t h o s e areas, The Central Valley P r o j e c t has been de-
signed, cons t ruc ted , and put i n to o p e r a t i o n t o take advantage of
t h e Delta channels t o convey some 5,000 second-feet o f the s u r p l u s
Sacramento Valley waters t o the sou th i n t o $he San Joaquin Va l l ey ,
The plans of t h e Feather River ProJsct c a l l f o r t h e t r a n s f a r and
conveyance of an addi%ional 12,000 second-f eet through t h e s e same
t i d a l D e l t a channels ,
Despite t h e recognized importance o f $hs pivotal pos i -
t i o n t h e Delta plays , o r wil.1, play, i n major programs of water
development i n Ca l i fo rn ia , t h e r e has basn a dear th o f geoI.ogic,
hydraul ic , hydrologic , and s a l i n i c informatian o f the physica3.
phenomena present;, Such information i s essential f o r i n t e l l i g e n L
planning o f w a t e r t r a n s f e r across t h e Delta area, On t h e o t h e r
hand, t h s f r u i t i o n of such w a t e r t r a n s f e r p lans must i n c l u d e salu-
t i a n s t o problems o f f lood cont ro l , w a t e r u t i l i z a t i o n , and water
d i ~ p o s a l within t h e Del-ba area i t x i e l f , The s o l u t i o n s w i l l involve
h plans f o r optimum fresh-water d i s t r i b u t i o n , saline-water drainage
disposal, and degrees of channel s a l i n i t y control -t;o s a t i s f y
agr icu l tura l and S n d u s t r i a l needs, The data and their analyses
as presented i n this aeries o f r epo r t s are germane and a a o e n t i a l
t o sa lu t ions o f these Delta probhrns a
A n investigation so comprehensive as to cover and r e p o r t
upon a l l o f t h e f a c e t s o f p e r t i n e n t knowledge c o n c e r n i n g t h e Delta
a rea would be p r o h i b i t i v e in c o s t at this t i rno . This s e r i e s o f
r e p o r t s perforce i s l im i t ed t o some of t h e s e f a c e t s , namely,
ground water geology, water source and water u t i l i z a t i o n phenomena
on two o f t h e D e l t a islands, q u a n t i t i e s and q u a l i t i e s o f applied
w a t e r and o f drainage water in the Delta , and t h e ex tent o f sea-
water i n c u r s i o n i n Delta channels,
T h i s r e p o r t i s t h e f o u r t h in this a e r i e s and d e a l s
w i t h some o f t h e hydrographic and s a l i n i c a spec t s o f water supply
and water d isposa l in t h e Del ta .
One purpose o f this i n v e s t i g a t i o n was to determine t h e
monthly and seasonal quan t i t i e s o f water applisd Go t h e i r r i g a t e d
crops in t h e Del ta Lowlands, T h i s investigation was i n i t i a t e d
i n 1954 prior to, but in anticipation o f , t h e "Sacramento River
and D e l t a T r i a l Water Distribution Agreement f o r 1955" In which
t h e S t a t e agreed to undertake ' r s tudies to asce r t a in t h e q u a n t i t y
o f water requ i red by water users d i v e r t i n g in and f rom t h e Deltan.
Another purpose o f t h i s investigation was to determine
the ex ten t and sources o f degradation in quallCy o f t h e channel
waters as t h e y move from t h e Sacramento River to the Tracy Pump-
ing Plant.
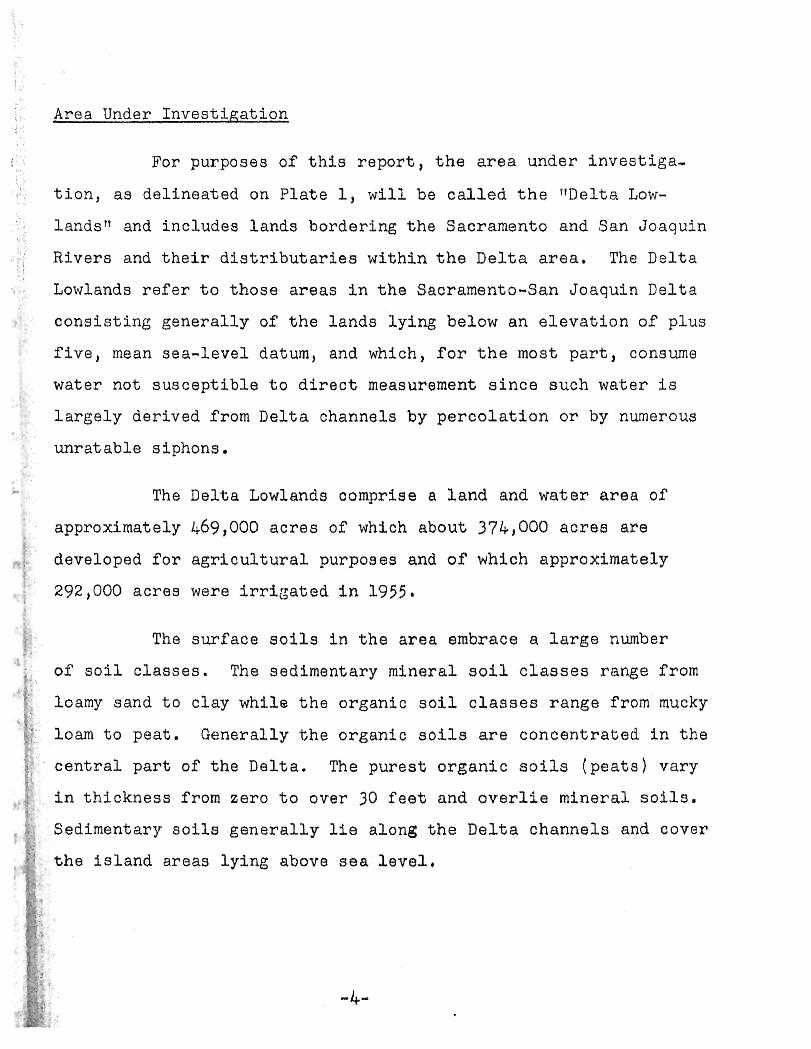
Area Under I n v e s t i g a t i o n
For purposes of t h i s r e p o r t , t h e area under i n v e s t i g a -
t i o n , as de l inea ted on Plate 1, will be called the Ylelta Low-
lands" and inc ludes l a n d s border ing the Sacramento and San Joaquin
Rivers and their d i s t r i b u t a r i e s w i t h i n t h e Delta area. The De l t a
Lowlands r e f e r t o those areas in the Sacramento-San Joaquin Del ta
c o n s i s t i n g g e n e r a l l y of t h e l a n d s l y i n g below an e l e v a t i o n of plus
f i v e , mean s e a - l e v e l datum, and which, f a r t h e most p a r t , consume
water not s u s c e p t i b l e i;a direct measurement since such water i s
l a r g e l y derived from Delta channels by p e r c o l a t i o n or by numerous
unratable siphons.
The Del ta Lowlands comprise a land and water a r e a o f
approximately 469,000 a c r e s o f which about 374,000 a c r e s are
developed f o r a g r i c u l t u r a l purpones and of' which appraxirnateLy
292,000 acres were i r r i g a t e d i n 1955,
The s u r f a c e soils i n t h e area embrace a large number
of s o i l classes. The sedimentary mineral soil c lasses range from
loamy sand t o c lay while the organic soil cLasses range from mucky
loam t o peat . Generally t h e organic s o i l s a re concen t ra ted In t h a
central p a r t of the D e l t a , The purest organic soils ( p e a t s ) va ry
in th ickness from zero t o over 30 f ee t and avsrl ia mineral soils,
Sedimentary s o i l s generally l i e a long the Delta channels and cover
the i s l and a reas lying above sea l e v e l ,
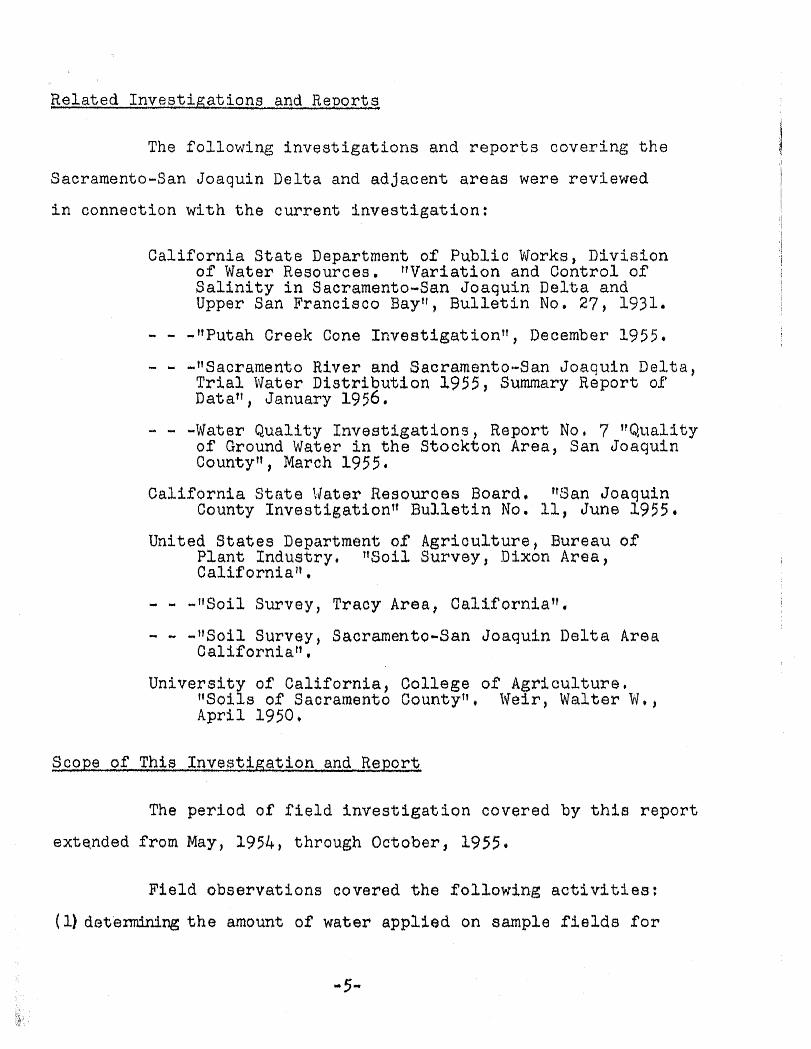
Related I n v e s t i a a t i o n s and R e p o r t s
The fol lowing i nves t i ga t i ons and r e p o r t s covering Lhe
SacramentxA3an Joaquin Delta and adjacent a reas were reviewed
i n connection with t h e current i n v e s t i g a t i o n :
C a l i f o r n i a State Department of Public Works, Division o f Water Resources. t T a r i a t i a n and Contro l of S a l i n i t y i n S acramento-San Joaquin DeLt a and Upper San Francisco Bayn, Bul le t in No, 27, 1931.
- - -frPutah Creek Cone Investigation", December 1955,
.. .. -ttSacramento River and Sacramento-San Joaquln De l ta , Trial Water D i s t r i b u t i o n 1955, Swnmary Report OF Dat art , January 19 56,
- - -Water Qua l i t y Lnvsstigations, Report No, 7 'fQuaJiLy of Ground WaLer i n t h e SLockton Area, San Joaquin Coun%ytt, March 1955,
C a l i f o r n i a S t a t e Water Resources Board* County InvestSga$ion" BuZlatin No.
Wan Joaquin 11, June 1955,
United S t a b s Department o f Agriculture, Bureau a t PLant IndusCry, Y b i L Survsy , Dixon Arsa, Ca l i f ornia't ,
- - -1lSoil Survey, Tracy Area, CaJiforniafl,
- - -1tSoi.l Survey, Sacramento-San Joaquin Delta Area Ca l i fo rn ia" ,
University of California, Collage o f AgricuLture , " S o i l s of Sacramento Coun%ytl, Weir, Walter W, ,
Scope of This Investigation and R e p o r t
The per iod of f i e l d invesLlgaLion covered by t h i ~ r e p o r t
exttjnded from May, 1954, through October, 3955 ,
F i e l d observat ions covered t h e folLowlng ac t iv f$ i e s :
(1) d e t e m a t h e mount o f water applied on sample f i e l d s for
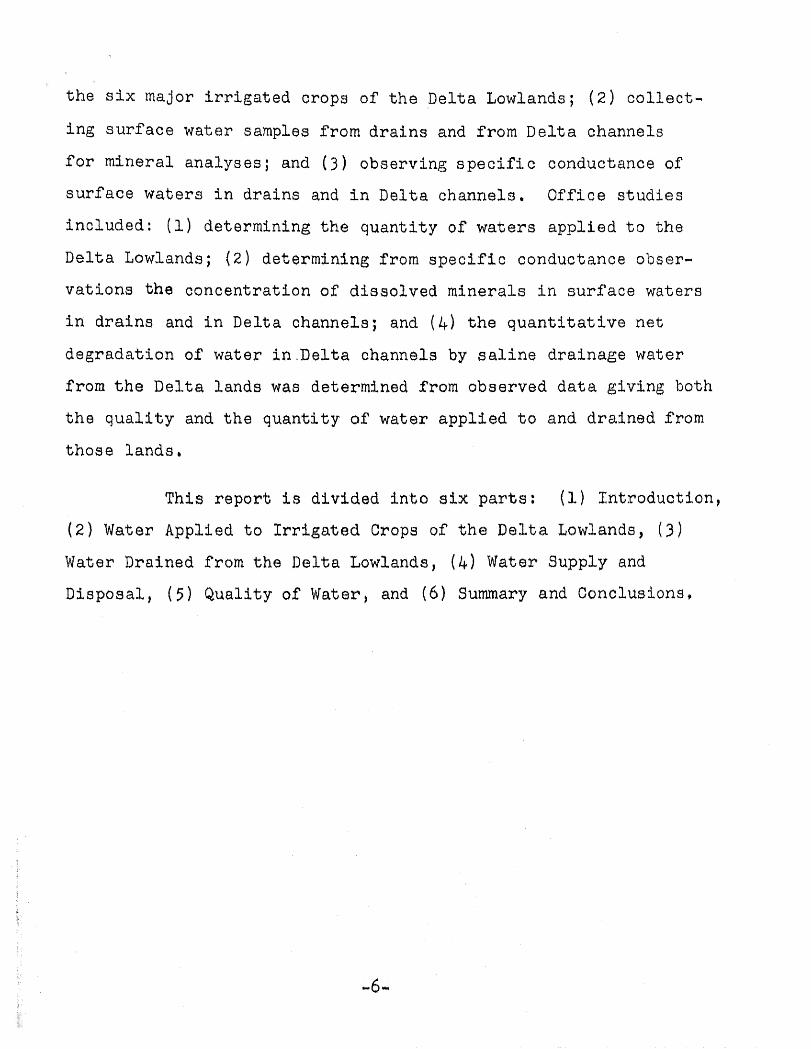
t h e s i x major i r r i g a t e d crops of t h e Del ta Lowlands; (2) c o l l e c t -
i n g surface water samples from d r a i n s and f rom Del ta channels
f o r minera l ana lyses ; and ( 3 ) observing s p e c i f i c conductance o f
su r face waters i n d r a i n s and in D e l t a channels . O f f i c e s t u d i e s
inc luded : (1) determining t h e q u a n t i t y o f waters app l ied t o t h e
De l t a Lowlands; ( 2 ) determining from s p e c i f i c conductance obser-
v a t i o n s the concent ra t ion of d i s s o f ved minerals in surf ace w a t e r s
i n d r a i n s and i n Delta channels ; and (4) the quantitative n e t
degrada t ion of water in.Delta channela by saline dra inage water
from t h e Del ta l a n d s was determined f r o m observed d a t a g iv ing bath
t h e q u a l i t y and t h e quan t i ty of w a t e r app l ied t o and drainad from
those lands,
This r e p o r t i s d iv ided I n t o a ix parts: (1) Zntroduc t ion ,
(2) Water Applied t o I r r i g a t e d Crops o f t h e Dslta Lawlands, ( 3 )
Water Drained from t h e Dalta Lowlands, ( 4 ) Water Supply and
Disposa l , ( 5 ) Q u a l i t y o f Water, and ( 6 ) Summary and Conclusions,
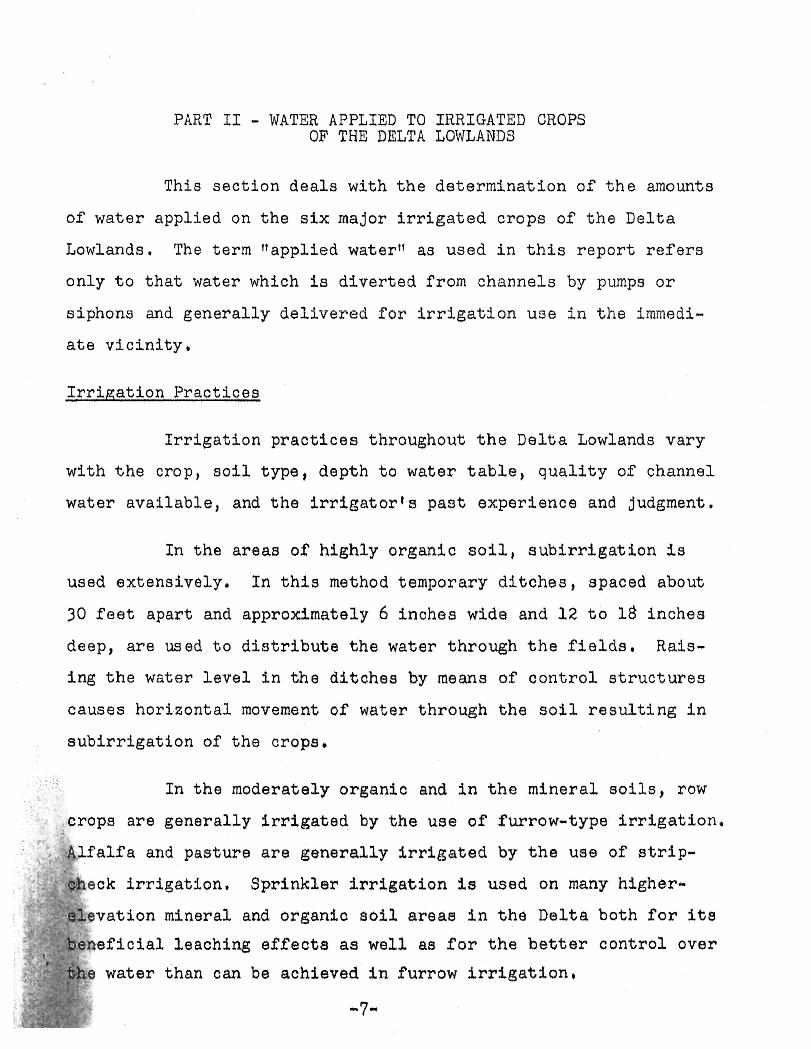
PART TI - WATER APPLIED TO IRRIGATED CROPS OF THE DELTA LOWLANDS
This s e c t i o n deals with t h e determination of t h e amounts
of water applied on t h e six major i r r i g a t e d crops of t h e Delta
Lowlands. The term "appl ied water" as used i n this r e p o r t re fers
only t o t h a t water which is d i v e r t e d from channels by pumps o r
s iphons and g e n e r a l l y d e l i v e r e d Tor i r r i g a t i o n uos i n t h e immedi-
a t e v i c i n i t y ,
I r r i a a t i o n Practices
I r r iga t ion p r a c t i c e s throughout the Dslta Lowlands vary
with t h e crop, s o i l t ype , depth Lo water t a b l a , q u a l i t y of channel
water a v a i l a b l e , and the irrigator's past experience and judgment.
In t he a r e a s of highly organic s o i l , s u b i r r i $ a t i o n i s
used ex tens ive ly , In t h i s method temporary d i txhes , spaced about
30 f e e t apart and approximately 6 inchea wide and 1 2 t o 18 i nches
deep, are wad to d i s t r i b u t e the water through the f i e l d s , Rais-
ing t h e wate r l e v e l i n t h e d ieches by means of c o n t r o l structures
causes h o r i z o n t a l movement o f waLer through tha s o i l resulting i n
s u b i r r i g a t i o n of %he craps
In t h e moderately organic anel i n the rnineraL s o i l s , row
crops are g e n e r a l l y 1rrigat;ed by the use of furrow-type i r r i g a t i o n ,
ber
I. ' : Alfalfa and pasture are g e n e r a l l y irrigated by the use o f strip-
9ck irrigation, Sprinkler i r r i g a t i o n 12s used on many higher-
,vation mineral and organh s a i l area8 i n Lhe DaZ%a both f o r i t a kefdcial leaching e f fec t8 as we11 as f o r the bs t tx r c o n t r o l over
i e water than can be achieved i n furrow i r r i g a t i o n ,
Mas* i r r i g a t i o n takes p lace i n the l a t e Spring and
Summer. However, some i r r i g a t o r s apply a l a r g e quan-bity of water
in the e a r l y Spr ing before p lan t ing t o i n c r e a s e t h e moisture
content of t h e s o i l i n t h e expec ta t ion o f e a r l y seed germinat ion ,
The inc rease i n s a l i n i t y of t h e channel waters during
t h e summer pe r iod causes some farm o p e r a t o r s i n t h e wes te rn
por t ion of t h e Del ta t o cease i r r i g a t i o n during t h a t pe r iod because
of t h e d e l e t e r i o u s e f f e c t s of applying h i g h l y - s a l i n e water t o crops,
Waters a re app l i ed i n t h e f a l l and w i n t e r seasons p r i m a r i l y to
leach accumulated s a l t s from t h e soils,
Some irrigators divert wate r s to t h e i r l ands during t h e
summer in excess of their requirements because ample watsr is
a v a i l a b l e at p r a c t i c a l l y no additional cas t Lo them, Water con-
servation would bs enhanced i f more c a r e f u l use of water were
prac t i ced .
S o i l Types
A division of' t h e D e l t a by soil type6 was es t ima ted
from d a t a on s a i l maps embracing the Delta area compiled Jointly
by t h e Unitxd Staeas Department of A g r i c u l t u r e and University of
California, For purposes o f this i n v a s t i g n t i o n t h s agrScultural
l ands i n the D e l t a a r e a were divided, as shown on Plate 1, i n t o
three soil types: (1) nor th mineral, ( 2 ) middle o r g a n i c , and ( 3 )
south mclnaral , These types cover approximat a l y 121,000 acras , L92,OGO acres, and 6'1,000 acres respectivaly * Thass acreages comps;.;lss,
respectively, about 33 per cen t , 51 per cent, and 16 per cenC
of t h e t o t b Delta Lowlands area developed f o r agr iculCuraL
purposes.
A comprehensive land-use survey was made i n 1955 by t h e
S t a t e Divis ion of Water Resources, t h e resulCs o f which are
d e t a i l e d in t h a t Division's r e p o r t t i t l e d Y3acrarnento River and
Sacramento-San Joaquin Delta, Tr ia l Water D i s t r i b u t i o n 1955,
Summary Report of Datatl. A summary from t h a t r e p o r t is ahown
in Table 1, For purposes o f this investigation t.he areas o f t h e
e x t e r i a r watsr sur face and o f t h e i s l a n d a in %he channel8 wers
excluded, leaving an area o f 419,439 acres cons idered as t h e
?'Dal.ta Lowlands",
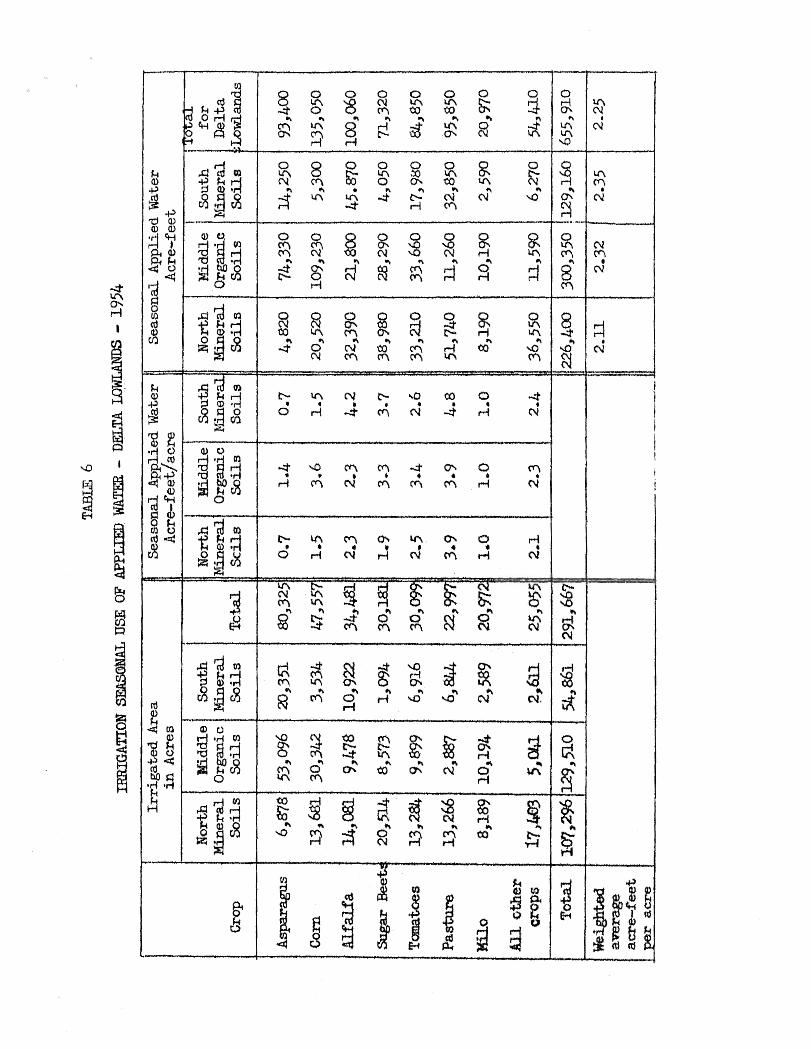
As shown in Table 1 t h e seven major crop8 grown i n 1955
on t h e Delta Lowlands were: (1) asparagus, ( 2 ) f i e l d c o r n , ( 3 )
al fa l fa , '(4) sugar bee t s , ( 5 ) tomatoes, (6) paatxire, and ( 7 ) m i l o ,
Table 2 he re in shows t h e i r r i g a t e d acreages and t h e percentage
of total i r r i g a t e d area f o r each of t h e seven major c rops and
f o r aLL o t h e r crops as a single value.
Unit Applica_tion o;f Water
Quantities o f water appl ied were estimated by measure-
ments on s ix o f t h e seven i r r i g a t e d major c rops in t h e Delta arsa
in 30 sample f i e l d 8 t o t a l i n g 3,369 acres, Loca t ions o f t h e s e
fields are shown on Plate 1. Each of these 36 sample f i e l d s was
i n v e s t i g a t e d separa te ly and reco rds o f applied-water q u a n t i t i e s
were obta ined. The f i e l d s were s e l ec t ed as t y p i f y i n g t h e s o i l ,
i r r i g a t i o n practices, and crops grown on each o f t h e t h r e e s o i l
t y p e s in t h e Delta Lowlands. As expected, irrigation practices,
s o i l t ypes in t h e Delta, and varying amounts o f seepage, r e s u l t e d
i n varying amounts of water app l i ed to t h e i r r i g a t e d c rops . The
l e n g t h o f t h e i r r i g a t i o n season also var ied, f o r different c r o p s ,
from one to e i g h t months.
Although t h i s investigation s t a r t e d in May, 1954,
quan t i t i e s o f water appl ied $0 t he sample f i e l d s e a r l i e r i n t h e
year were estimated f rom data on power consumption and/or from
wa"f;sr us arst r eco rds ,
The unit applied-.water f a c t o r f o r Chs seventh major
c r o p , milo, was estimated from oCher available data. The e s t i -
mated applied water during the i r r i ga t ion season f o r mila, aa
determined from exparimerits by the University o f California at
Davis, i s 1.0 acre-foot per acre . Data in the Div i s ion o f W a t e r
Resources report; Y3an Joaquin County InvesCigationtt indicates
t h a t 0,7 ac re - foo t per acre was app l i ed t o an 80-acre t e s t p l o t
o f rnilo. For purposes of t h i s present repor'c, 1.0 acre-foot pe r
ac re was used as t h e applied-water f a c t o r f o r mtlo f o r the e n t i r e
Delta area, No measurement;^ were made for certain major cropa I
in each o f t h e th ree s o i l - t y p e areas because of (1) l a c k o f
coopera t ion by fEwm@r~ in gmnting permission '.to make t h e measwe-
ments o r in keeping the necessary records and (2) i n a b i l i t y to
f i n d a n area encompassing only t h e one crop and containing a
d i s t r i b u t i o n system that, would permit de te rmina t ion of the quan-
t i t y of w a t e r app l ied t o t h a t c rop . Therefore, values f o r such
major crops were assumed to approximate t h e values f o r those
crops i n comparable areas for which actual applied w&er measure-
ments were made,
The subdivision unit numbers r e f e r r e d to i n t a b l e s
described subsequently in this report designate subdivisions of
t h e Sacramento-San Joaquin Delta of which t h e Delta Lowlands
encompase all or part of a l l of the wits except numbers 1, 4 and
5, The locations of the units are shown on Plate 2,
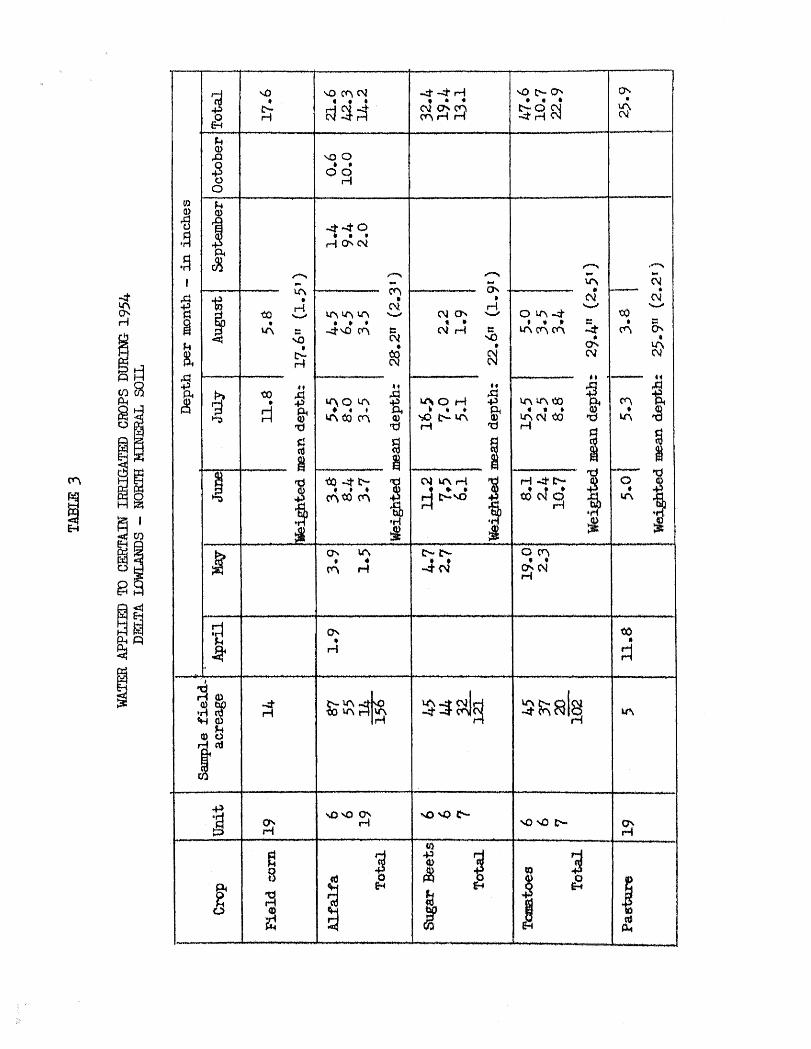
_Major Crops on North Min- Monthly and
seasonal applications of water t o crops of t h e nor th mineral
s o i l s area are shown i n TabXe 3 , The depths o f applied-water
during t h e i r r i g a t i o n seasan f o r f i v e o f the mador crops were:
f i e l d corn, 2.5 f e e t ; a l f a l f a , 2 .3 f e e t ; augar b e e t s , 1.9 r e s t ;
tomatoes, 2 .5 f ee t ; and pasture, 2.2 f e e t ,
Ths Wfvision o f Water Resources in its repor t "Putah
Creek Cone Investigation, December h955tt , determined certain
applied-water factors an areas at the northern edge of the DeZta,
The weighted mean value o f applied w a t e r for paatura repor ted
t h e r e i n was 3.9 acre-feet per acre, based upon a 430-acre area,
This value was considered a reasonable applied-water factor for
pasture and it was ussd in t h i s rspwl because t h s sampLe F i e l d
fo r pasture in the present investigation, due $0 its small size
of only f i v e acres, waa not considered representat ive of t h a t crop
A value of O,7 acre-Wot per acre f o r asparagus as
determined for the south mineral, s o i l s area, was a lso used f o r
the north mineral soils a rea ,
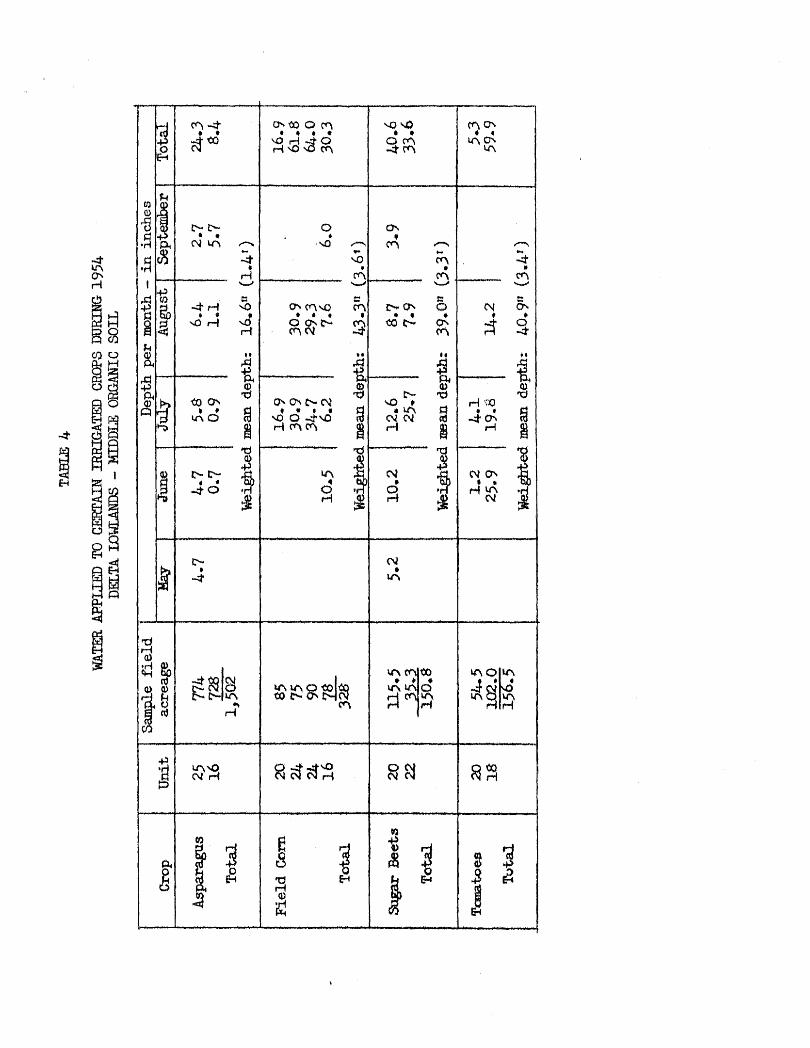
Ma,jor Crops on Middle Organic S o i l s , Monthly and season-
a l applica4xLons of water .t;o c rops of t;he middle organic s o i l s area
are shown i n Table 4 , The depths of applied-water during t h e
i r r i g a t i o n season f o r four of t h e rnaj.or crops were: asparagus,
1.4 f e e t ; f i e l d corn, 3 . 6 feet; sugar beets , 3 . 3 f e e t ; and
tomatoes, 3 , 4 f e e t ,
A value of 2.3 a c r e - f e e l per acre f o r a l fa l fa , aa
determined f o r t h e nor th mineral soils a rea , was assumed t o
approximate the unit quant i ty of w a t e r app l lad to a l f a l f a in the
middle organic soils area.
A value af 3.9 ac r s - fee t per acre f o r pas tu re , as dam
tarmined f o r t h e north mineral soi3.s area, was assumed aa t h e
un i t quant i ty o f water applisd t o pasture in the middle organic
soils a r e a ,
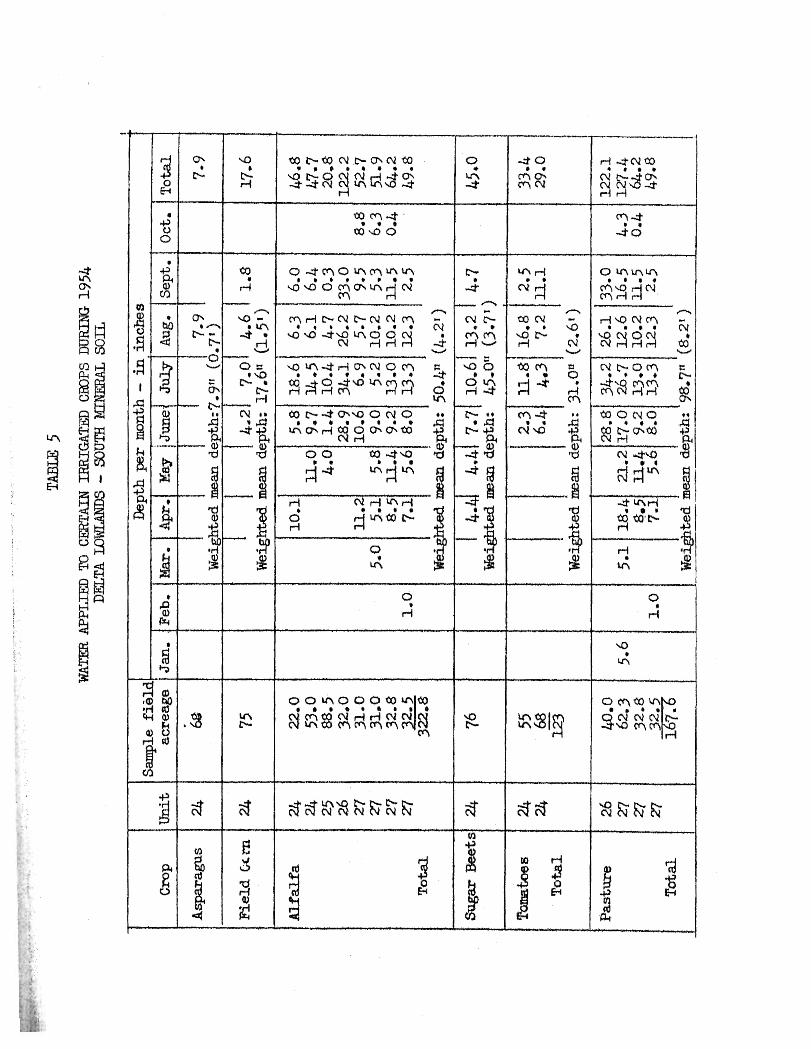
Major Craps on South Mineral Soils,, Monthly and season-
al applications o f water to crops of the south mineral s o i l s area
are shown in Table 5, The dep%hs o f applied-waQer during t h e
i r r i g a t i o n season f o r the six major crops ware: asparagus, 0.7
foot; f i e l d corn, 1.5 f e e t ; a l f a l f a , 4.2 f e a t ; sugar bests, 3 , 7
f e e t ; tomatoes, 2.6 feet; and pasture, 8,2 f e e t .
The applied-water values f o r two samp3.e p l o t s f o r
pasture i nd i ca t ed an excessive anni~a l use o f water ( o v e r 10 acre-
f ee t per ac re ) as compared to t h e o t h e r t w o p l o t s . The Division
of Water Resources in i t s r e p o r t Y3an Joaquin County I n v e s t i g a t i a +
June 1955", determined t h o weighted mean applied-water value f o r
pasture on areas at the southeas% edge of t h e Delta t o be 4.5
acre-feet pe r ac re as based upon a 240-acre area , However, f o r
purposes o f Chis r e p o r t , t h e weighted average of 4 .8 acre-feet
per a c r e f o r t h e remaining two sample p l o t s of pas ture in Uni t 27,
a3 shown in Table 5 , was used as t h e applied-water f a c t o r f a r
pasture in t h e south mineral s o i L s a r ea ,
mCrgpa, To determine t h e total quant i ty of irri-
gat ion water appl ied to the Delta Lowlands d u r i n g $he i r r i g a t i o n
season, i t wag necessary to eatlmate unit applied-water values f o r
t h e minor irrigaCed crops. Th i s waa done by c a l c u l a t i n g t h e
weighted average uniC depth of water applied to t h e major irri-
gated crops in each o f t h e aoilL-type areas. These values f o r t h e
nor th mineral, middle organic, and sou th mineral soils areas a r e
2.1, 2.3 and 2.4 acre-feet p e r acre, respectively, These weighted
averages were multiplied by t h e i r respective s o i l - t y p e areas;
these quantities were then used as t h e estimated amount o f water
app l ied to t h e minor crops f o r incLusion in the eva lua t ion o f
t o t a l water appl ied to t h e Lowlands.
The toCaL seasonal amounts o f appl ied water on i r r i g a t e d
crops of t h e Delta Lowland8 were determined from t h e 1955 land-use
survey daCa and t h e uniti applied-water values described heretofore,
The t o t a l seasonal app l i ca t ions by s o i l type and by
crop and the totals for t h e Delta Lowlands a r e shown I n Table 6 .
The t o t a l irrigation seasonal use of appl ied water fo r t h e Delta
Lowlands amounted to about 656,000 a c r e - f e e t o r an avwage of 2.25
a c r e - f e e t p e r i r r i g a t e d acre,
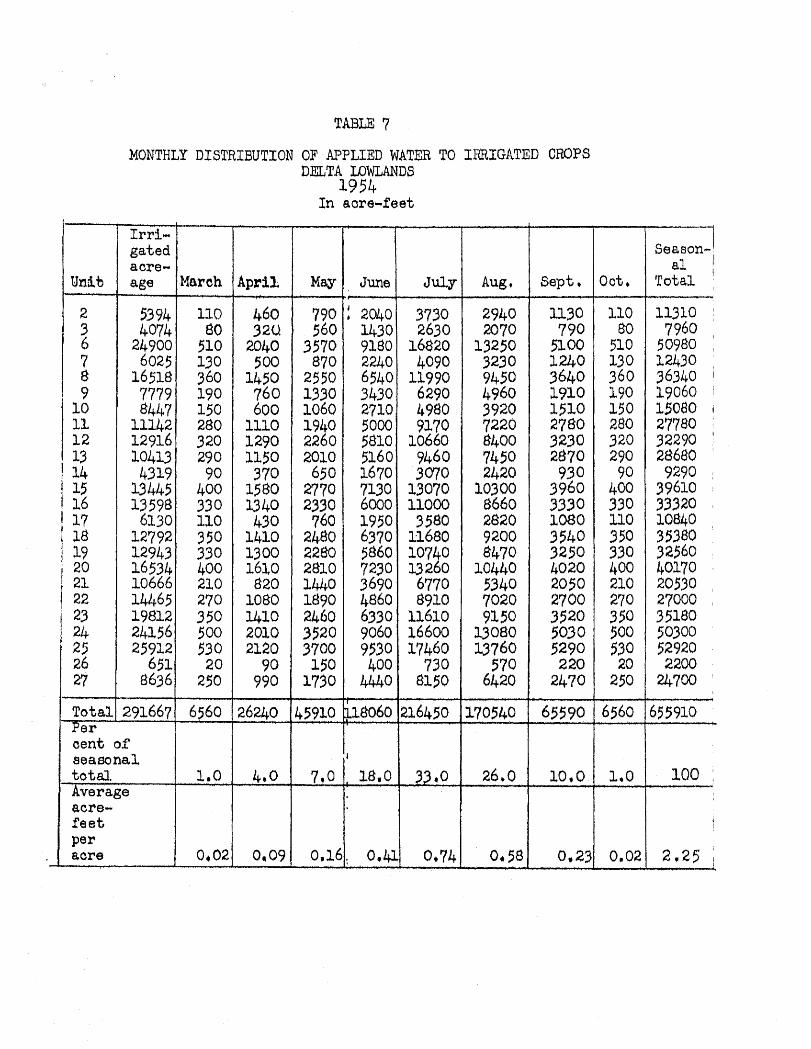
The monthly d i s t r i b u t i o n of a p p l i e d i r r i g a t i o n wa te r
was ca l cu l a t ed for each of t h e a foresa id s u b d i v i s i o n s from i t 8
crop pattern and appl icable monthly a p p l i e d - w a t e ~ values. Tabls 7
shows the monthly d i s t r i b u t i o n o f applied irrigation water by
u n i t s , monthly percentages o f seasonal t o t a h , and monthly average
unit applied-water values i n acre-feet per acre. The monthly
distribution of seasonal applied-water values varied from one per
cent each in March and October to a maximum of 33 per cen t
( a b o u t 216,000 a c r e - f e e t ) i n July,
Wa,tars Applied f o r Leaching Purposes
Water is applied Lo t h e Delta Lowlands f o r Leaching
excess sa l t s f rom the soil, *hereby Lowering the saUnlLy o f t h e
soi l . solution i n t h e r o o t aone, As w i l l be shown he re ina f t e r ,
evidence i n d i c a t e s t h a t t h e concentration o f saLta In t h e o o i l
i nc reases during the s m e r season. These salts must subsaqucnt ly
be removed from t h e s o i l s , otherwise the increasing saline con-
centration would accumu1at;e and adversiely a f f e c t p lan t growth,
Leaching waters are usualZy applied d u r i n g the f a l l and
winter months, No at tempt was made during this investigation t o
determine tha quan t i t y of water app l ied f o r Leaching purposes
because o f t h e wide v a r i a t i o n s in l each ing practices and because
of the r e l a t i v e unimportance on channel demands o f l each ing
water requirements s i n c e ample water of good q u a l i t y i s u s u a l l y
a v a i l a b l e dur ing the
Precipitation
l a t e f a l l and w inke r seasons,
P rec ip i t a t ion , al though not p a r t o f t h e "applied wate rn
as considered in this r e p o r t , does affect month by month t h e
i r r i g a t i o n and leaching p r a c t i c e s , and the q u a n t i t i e s and qualLCk3
of d r a i n a g e water as w i l l be discussed l a t e r .
Data shown in Table 8 f rom t h e United S t a t e s Weather
Bureau Repor ts t i t l e d "Climatological Data, Cal i fornia" f o r the
seven weather s t a t i o n s in and near t h e Delta, a r e cons idered
r e p r e s e n t a t i v e of p r e c i p i t a t i o n on t he Delta. Tho average rain-
f a l l f a r t h e Del ta Lowlands i s as~wnad tcr bs t h e arithmetic
average o f precipitation at Chose eeven s t a t i o n s , Table 8 a l so
shows t h e monthly ra infa l l a t these s t a t i o n s f o r the p e r i o d May,
1954, through October, 1955, and t h e monthly average f o r t h e Delta,
Monthly total quantities o f precipitation on t h e Delta
Lowlands, estimated by multiplying t h e aforesaid average dep ths
o f p r e c i p i t a t i o n by t h e 419,419 acres o f t h e Delta Lowlands
are g iven in Table 9 , The t o t a l p r e c i p i t a t i o n f o r t h e March
through October i r r i g a t i o n season in 1955 amounted to about
PART X I 1 - WATERS DRAINED FROM THE DELTA LOWLANDS
Concurrent with t h e observations of water appl ied f o r
i r r i g a t i o n i n t h e Delta Lowlands, observa t ions were made t o
determine t h e q u a n t i t i e s of waters dra ined f rom those lands .
Permission was secured from proper ty owners to t e s t and rate
t h e i r drainage pumping; p l a n t s and t o secure t h e i r power consmp-
L i o n r eco rds , These data were used to c a l c u l a t e t h e water
q u a n t i t i e s pumped f rom t h e i n t e r i o r drain canals into t h e t i d a l
channels ,
In genera l , each i s l a n d o r t r a c t in t h e Delta Lowland8
has one o r more drainage system8 wherein the drainage waters
f i r s t e n t e r small drainage d i t c h e s leading to l a rge r main drains
and t h e n terminate a t t h e pumptng p l a n t s , Those p l a n t s , usually
f l o a t - a c t u a t e d between predeCerrnined water levels in $he main
d r a i n s , pump water intermittently from t h e main drains into t h e
cont iguous channels,
Il&nage pumps used i n t h e De l t a v a r y in combinations
o f t h e fo l lowing types and s i z e s : 3- to 50-inch d i scharge p i p e ,
3 - t o 500-horsepower motor , horizontally o r v e r t i c a l l y mounted,
double or single s u c t i o n cen t r i fuga l type , mixed-flow o r ax ia l -
f l o w prope l le r t y p e , d i r e c t or belt connected t o gasoline or
d i e s e l internal combustion engine o r to an e l e c t r i c motor. The
mast common drainage-pump i n s t a l L a t i o n in the Delta area i s a 30
Co 75 horsepower, d i r e c t connected, electric-motor driven, axial-
f l o w propeller-type pump.
Q u a n t i t y o f Drainage Water Pumped
The q u a n t i t y of drainage water pumped from 82 per c e n t
of the area in t h e Delta Lowlands f o r the p e r i o d May, 1954,
through October , 1955, by means o f 162 pumping plan ts involving
255 pumps, was determined from pwnp t e s t data and power consump-
t i o n records, For t h e same per iod , drainage pumped by 64 pumps
a t 44 pumping plants servicing 16 per cent of t h e Delta Lowlands,
was estimated by assuming t h a t t h e p l a n t r a t i n g f ac to r s were
similar to comparable measured i n s t a l l a t i o n s o r by c o r r e l a t i o n
with drainage-per-acre va lues in adjacent areas. The remaining
2 per csnC o f t h e area covers lands e i t h e r drained by g rav i ty o r
urbanized, and t h e i r drainage c o n t r i b u t i o n s were estimated by
correLation with drainage-per-acre va lues i n adjacent areas.
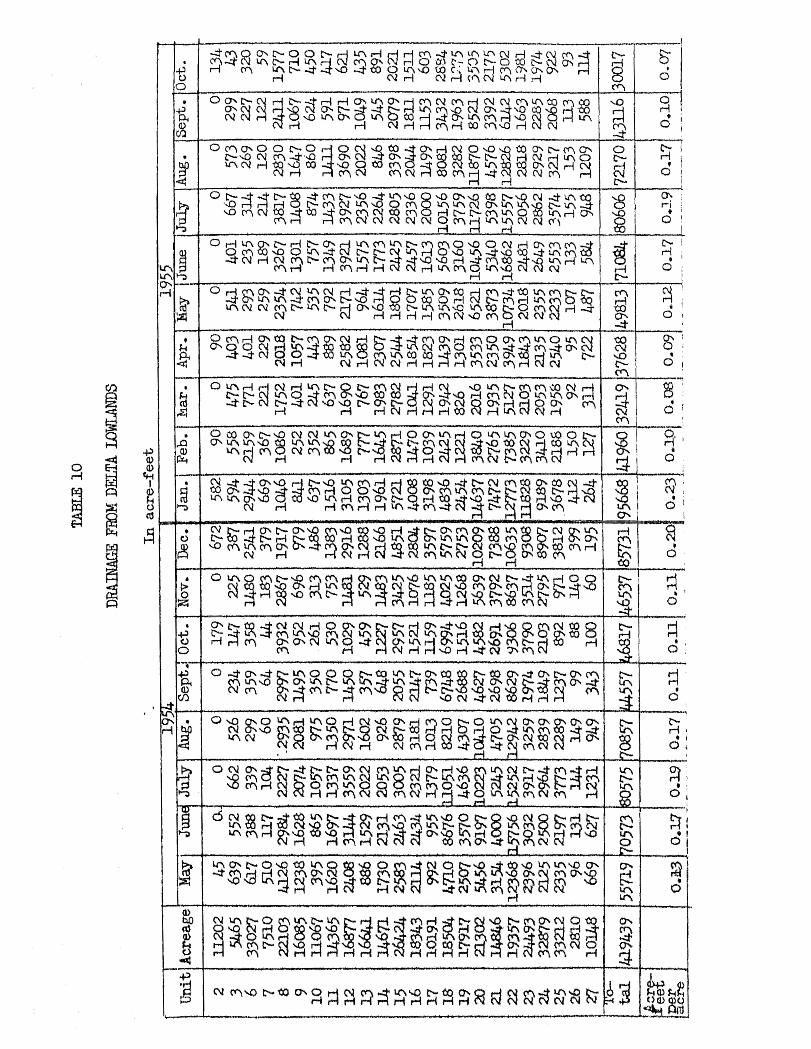
Table 10 show3 t h e combined measured and estimated
monthly t o t a l drainage from each subd iv i s ion unit w i t h l n t h e
Delta Lowlands and t h e manthLy average unit drainage in acre-feet
per acre . During the p e r i o d o f i nves t iga t ion the monthly t o t a l
drainage va r i ed from a low o f about 30,000 acre-feet i n October,
1955, to a maximum o f approximately 96,000 acre-feet i n January,
The average monthly unit drainage values in acre-feet
per ac re are shown graphically on Pla tes 3, 4 and 5 F o r t h ree
pexicds: May t h r o u g h October , 1954; November,1954., th rough
February, 1955 ; and March through October , 1955. A comparison o f
these t h r e e plates indicates thaC t h e average monthly drainago in
t h e Delta dur ing the winter is grea te r than dur ing t h e o t h e r
seasons as i n d i c a t e d by t h e small area during t h e w i n t e r f rom
which drainage was between z a r o and 0.10 acre-feet per a c r e per
month. This i nc rease i s due to a combination o f greater
precipitation and lower consumptive use demands a t t h a t t i m e .
A l s o dur ing t h e winter a not iceab le increase occurred in t h e area
from which drainage was between 0.31 and 0,60 a c r e - f o o t pe r acre
per month. It may also be no ted t h a t c e r t a i n areas in t h e
n o r t h e r n and southern parts o f t he Delta show t h e results o f high
i r r i g a t i o n e f f i d e n c y and minor seepage problems s i n c e t h e drainage
from those areas remained i n t h e z e r o to 0.10 a c r e - f o o t per acre
per month category throughout t h e e n t i r e per iod o f i n v e s t i g a t i o n .
The higher e l e v a t i o n of those lands compared to lands in t h e
c e n t r a l p o r t i o n o f t h e RelCa probably accounts f o r t h e lesser
saapaga ,
PART IV - WATER SUPPLY AND DISPOSAL
The water s u p p l y to i s l a n d s of t h e Delta Lowlands con-
sists of ( 1) a p p l i e d i r r i g a t i o n water, ( 2 ) subsurf ace in f low, and
( 3 ) p r e c i p i t a t i o n . Water d i s p o s a l c o n s i s t s of (1) dra inage water,
and ( 2 ) consumptive use, Ground water s t o r age changes account f o r
any imbalance between supply and disposa l . Of t h e foregoins
i-bems, applied irrigation water, precipitation, and drainage have
been discussed and evaluated h e r e t o f o r e . This chapter preoents
an evaluation of consumptive use and a, d e r i v a t i o n of subsurface
in f low under assumptions as to ground water s to rage changes.
Consumptive Use
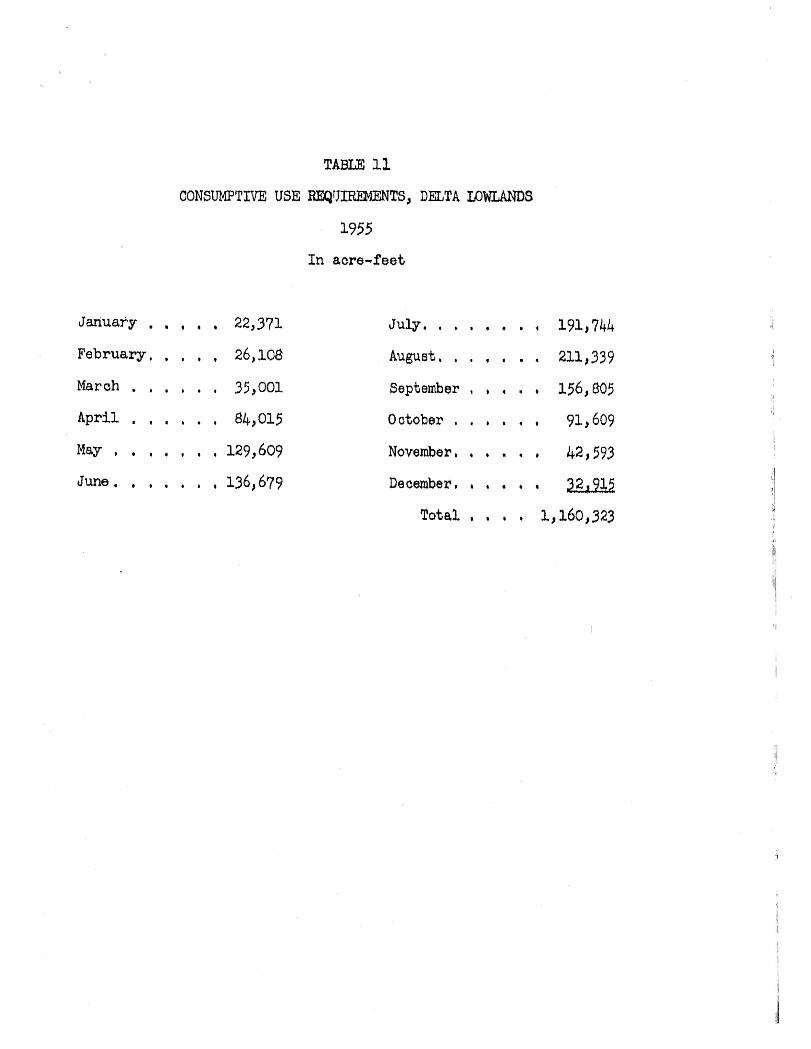
The monthly to ta l quant i t ies of consumptive use of water
were t a k e n from t h e D i v i s i o n o f Water Resources repor t t i t l e d
ttSacrarnentc River and Sacramento-San Jaaquin De l t a Tr ia l Water
Distribution 1955, Summary Report o f Data". These quantities
were de r ived by multiplying 1955 crop acreages by appropr ia te
unit consumpCive use values. Monthly consumptive use quanCit i e s
within t h e Delca Lowlands are shown i n Table 11 of this report; ,
It w i l l be noted t h a t these values var ied from about 22,000
acre-feet i n January, 1955, to about 211,000 acre-feet in August,
1955. O f t h e annual consumptive use requirements o f 1,160,000
acre-feet, about 1,036,000 acre-feet were consumed dur ing the
March through October i r r i g a t i o n seaeon,
. p'eriod i s comparatively in s ign i f i can t , Therefore, it i s concluded
t h a t the 6,$8,000 acre-feet i s indica t ive , during that period, of
%he magnitude o f subsurf ace inflow, I
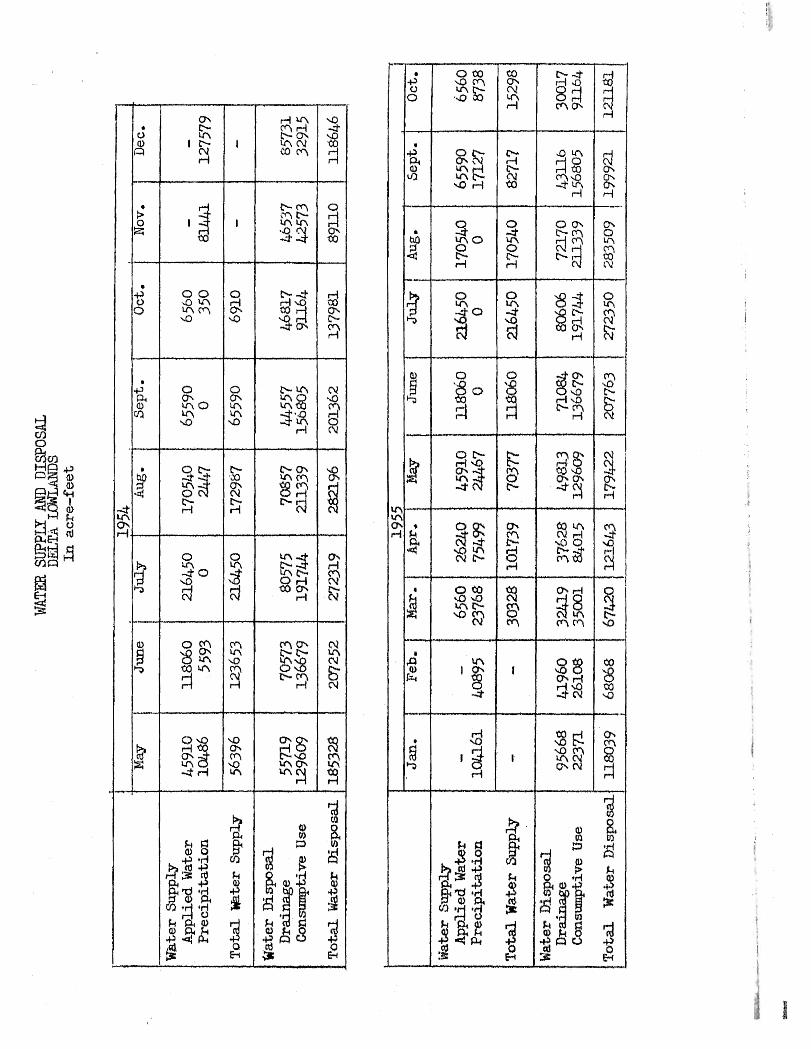
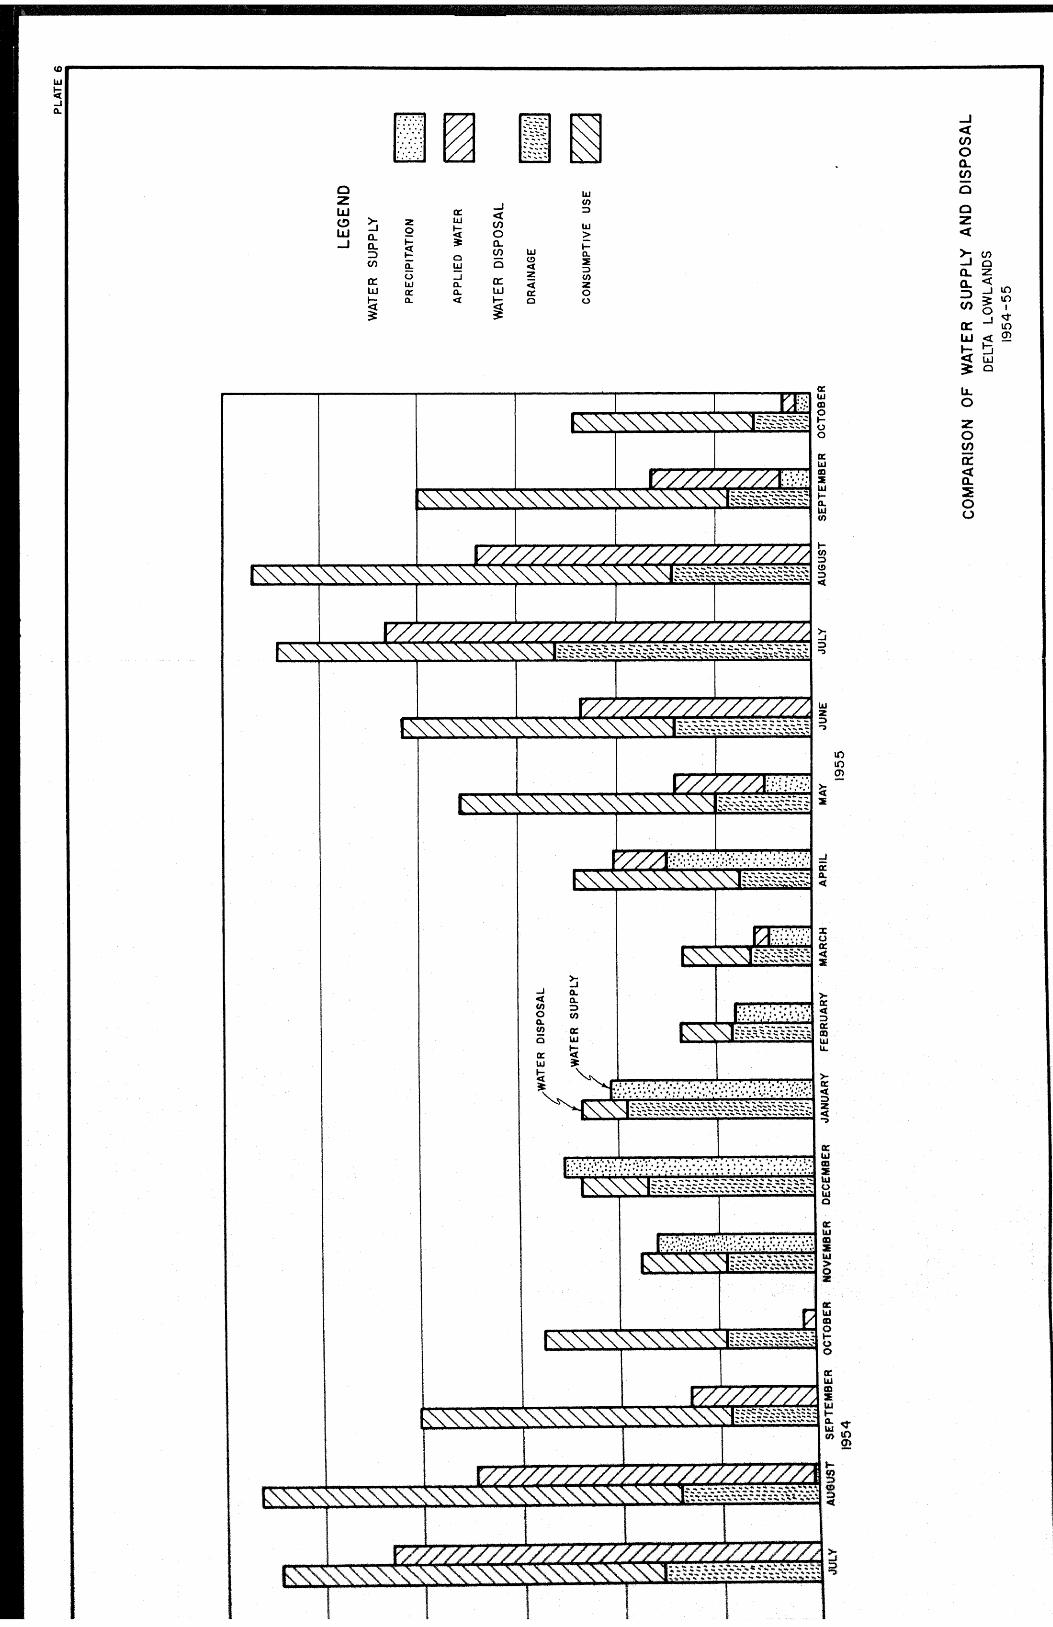
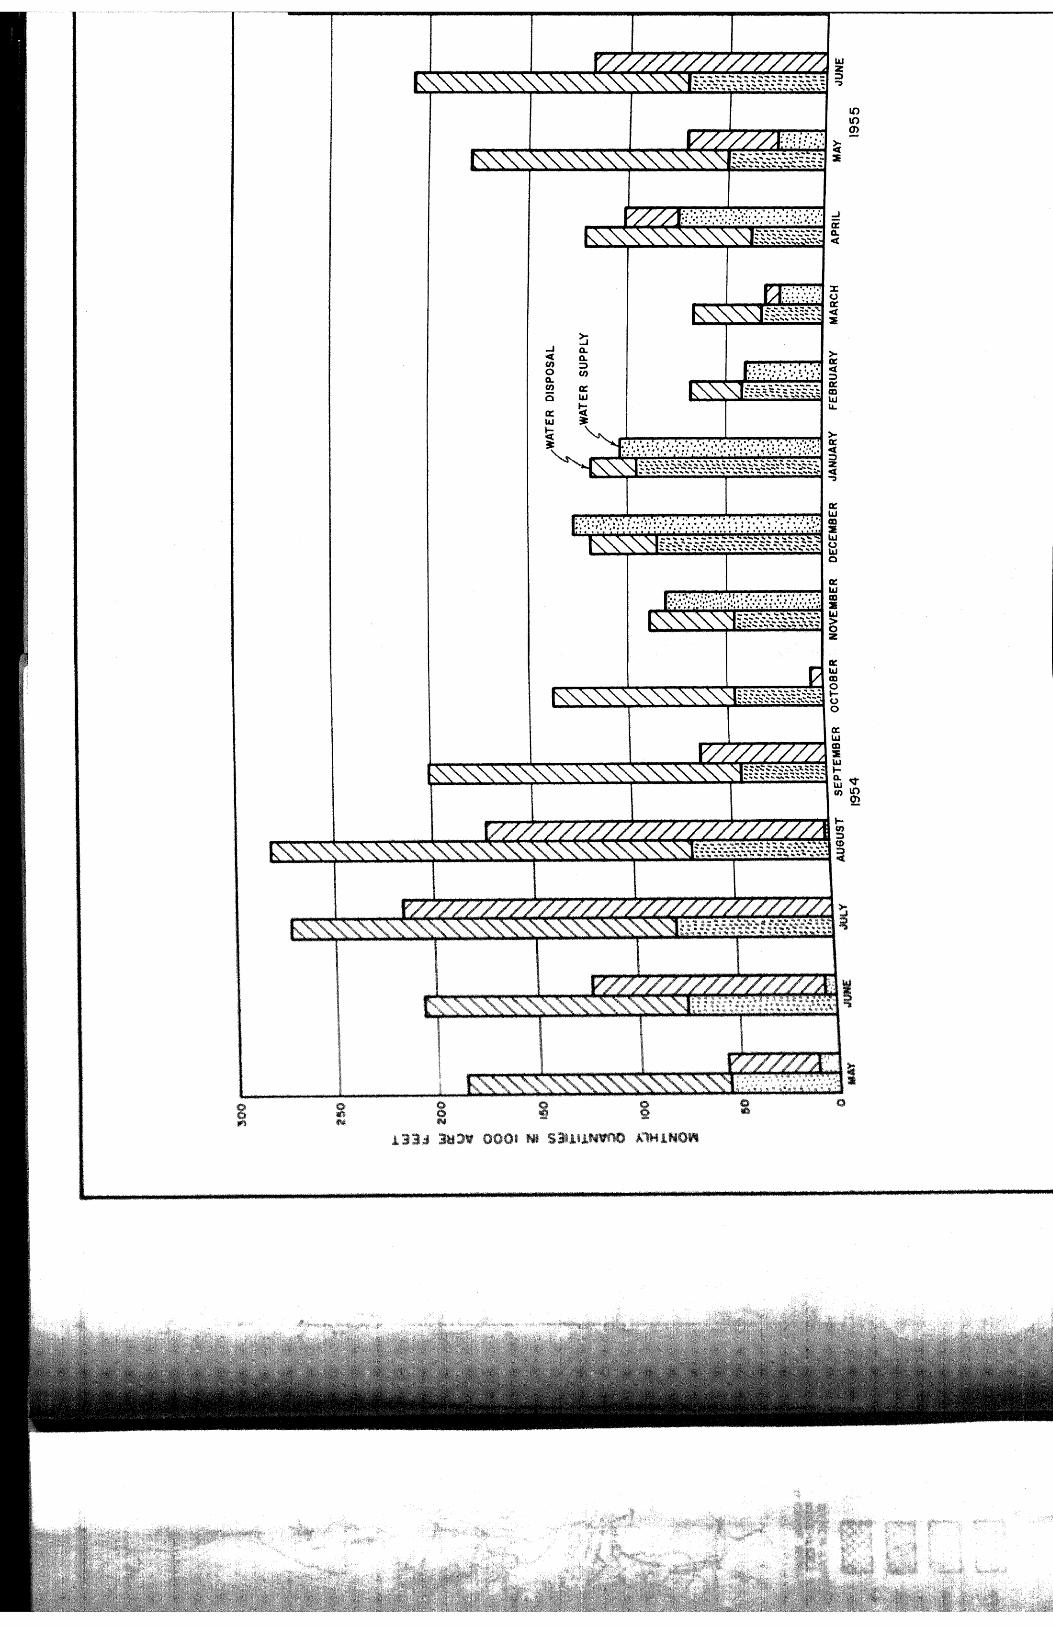
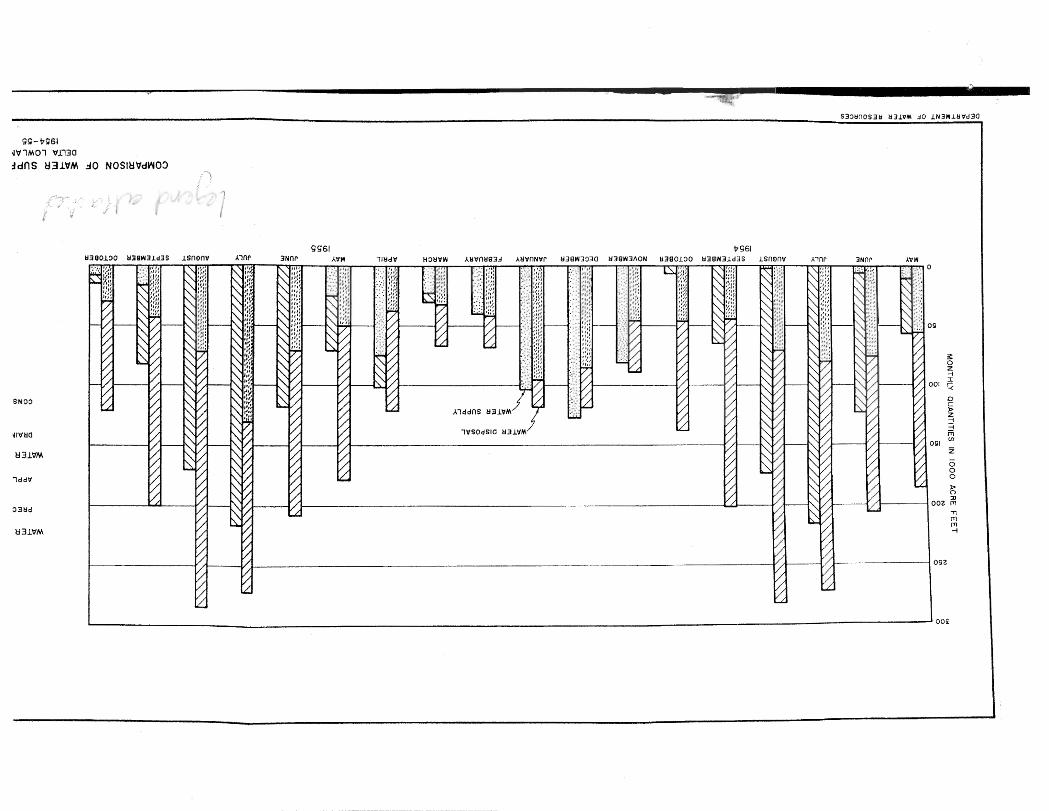
The data presented i n Table 3.2 are shown g raph ica l l y
on Pla te 6. In t h i s p l a t e , for each month, the t o t a l measurable
wa%r supply i s shown on the r igh t s i d e o f t h e double column and
t h e water d i s p o s a l on the left side of the double column. J t i s
t o be noted that no applied i r r i g a t i o n water values were de te r -
mined f o r t h e montha o f November, 1954, through February, 1955,
In s p i t e of this omission, an inspecLion of t h e p l a t e shows t ha t ,
except f o r t h e month of December, 1954, %he w a t e r disposa l exceed-
ed the measurable and es thtable water supply in every month dur-
i n g t he 18-manth period from May, 1954, Ghrough October, 1955,
indicating subsurf ace i n f l o w ,
PART WATER
An inspection of water analyses f rom t h e f i l e s of t h e
Division o f Water Resources shows that generally t h e quality of
Del ta channel, water becomes progressively poorer as t h e water
* moves f r o m the nor the rn to t h e southern p a r t of t h e DeLta, t h a t
i s , from t h e Sacramento River toward the Tracy Pumping Plan t
o f t h e Centra l Valley P r o j e c t , One possible cause of this de-
gradat ion is t h e e f f e c t of sea-water i n t r u s i o n , which e f f e c t i s
d iscussed in Report No, 5 in t h i s s e r i e s o f r e p o r t s on t h e
Sacramento-San Joaquin Delta,
Another p o s s i b l e source o f t h e degradat ion i s t h e s a l t
c o n t r i b u t e d t o t h e channels by t h e drainage waters from the Delta
islands. To evaluate % h i s possibility t h e s a l t c o n t r i b u t i o n to
t h e Delta channels was determined f rom observaCians and computa-
t i o n s involving t h e q u a l i t i e s and q u a n t i t i e s of watera applied t o
and drained from t h e Delta LowLands. The q u a n t i t i e s o f those
waters have been disoussed and presencad here tofore ,
The q u a l i t y of applied water was determined in t h e f i e l d
f r o m speclfic-conductance data collecCed a t random t i d e phaees
at 62 sampling po in t s in the D e l t a channels at approximately s i x -
week i n t e r v a l s during 18 continuous months of 1954 and 1955. A t
22 o f t h e s e sampling p o i n t s , water samples were also c o l l e c t e d aC
3-month i n t e r v a l s , and sub jec ted to complete mineral analyses,
Correlations were detsrmined between s p e c i f i c conductance o f t h e
water and t h e sum of concen$rations o f mineral constituents f n
p a r t s per m i l l i o n (pprn). By i n t e r p o l a t i o n ; a monthly average
concen t ra t ion was determined f o r t h e water a t each sampling
p o i n t . These monthly concen t ra t ions and t h e monthly appl ied-
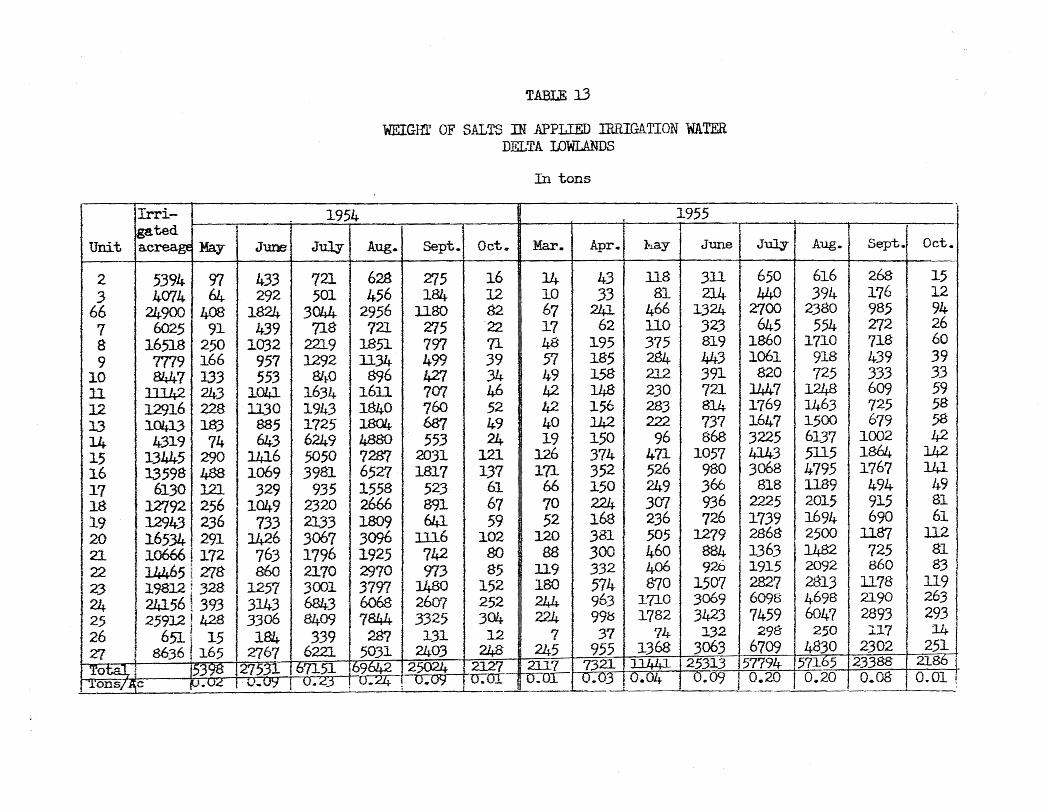
water q u a n t i t i e s f o r each subdivision unit were used to determine
t h e monthly tons o f s a l t i n t h e i r r i g a t i o n water applied t o each
unit o f t h e De l ta Lowlands. These monthly quantities, as well as
values f o r tons-per-irrigated acre , are shown in Table 13. The
monthly t o t a l s a l t s in applied i r r i g a t i o n water varied from a
minimum o f about 2,100 t ons i n March, 1955, t o a maximum of
approximately 70,000 t o n s dur ing August, 1954,, Since no appl ied-
water values were determined f o r t h e per iod November, 1954, '
through February, 1955, no s a l t tonnages are shown f o r those
mont;hs, However, it i s to be noted t h a t water appZied f o r leach-
ing dur ing t h i s per iod o f winter runof f from the Cen t ra l Valley,
would have been o f gene ra l l y good qual i ty .
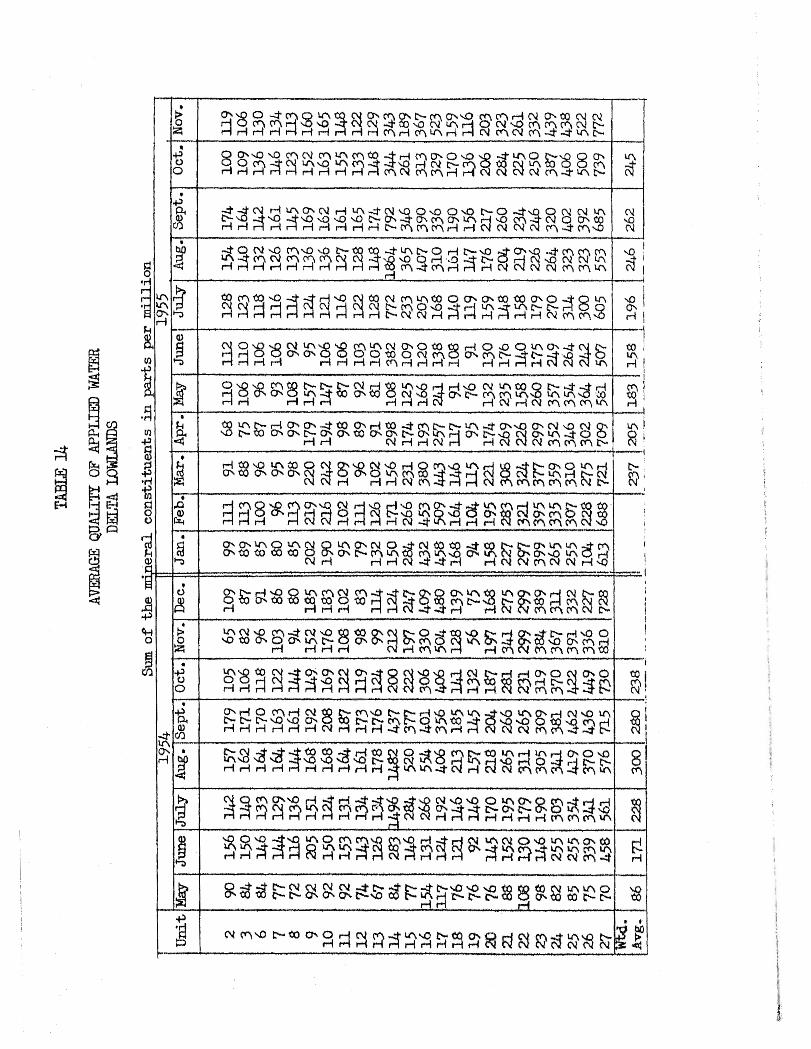
The monthly average qua l i t y o f applied i r r i g a t i o n water
with in each subd iv i s ion uni t was determined as an a r i t h m e t i c a l
average o f t h e monthly water qualities at a l l o f t h e sampling
p o i n t s w i t h i n t h a t unit. Table 14. shows t h a t these values ranged
from 70 ppm in Unit 27 dur ing May, 1954, to about 1,800 pprn in
UniZ; 14 d u r i n g August, 1955. A l s o shown in t h i s t a b l e are t h e
weighted monthly averages f o r t h e e n t i r e Delta as computed from
data in Table 1 3 . These averages ranged from 86 ppm in May,lQ54.,
to 300 ppm in August, 195C. Since appl ied-water valuee were not
determined f o r tho per iod November, 1954, through Fsbruary, 1955,
no weighted averages f o r t h a t per iod could be calculated,
The daCa in Tables 13 and 14 i nvo lve o n l y t h e s a l t
c o n t e n t o f applied surface water. T h e y do not concern t h e s a l t
in water entering t h e islands by seepage from channels o r from
o t h e r sources . Although t h e q u a l i t y of such additional s u p p l i e s
i s u n c e r t a i n , i t is i n d i c a t e d i n Repor t s No, 2 and 3 t h a t t h e
ground water i n f l o w to Medford and McDonald I s lands was largely
channel water, Available da ta are not; sufficf en% a% t h i s time t o
i n d i c a t e whether o r no t t h i s I s t r u e f o r t h e Delta Lowland3 as
a whole. However, if f o r purposes of a mugh approximat ion, i t
i s hypothesized Chat t h e r a t e o f ground water i n f l o w t o %he i s l a n d s
of t h e D e l t a Lowlands is constant, and t h a t t h e quality o f such
inflow equals the approximate Dalta-wide average annual quality
of channel waters o f about 260 ppm, abouC 33,000 t o n s of s a l t
per month in a d d i t i o n to thoae amounts shown in Table 13 would
e n t a r such islands,
An inspection o f t h e average concentra t ions o f appl ied
water in Tab le 14 indicates that peak concentrations o f salts i n
t h e channels occur in t h e l a t e summer monhha, Evidence presented
in Repor t No. 5 shows Ghat t h i s condiCion i s due l a r g e l y to sea-
waCer i ncu r s ion caused by a combination of high conswnptivs use,
inc luding high water-surface evaporation losses, and by t h e
relatively l o w fresh-water inflow Co t h e Delta a t t h a t time,
Quality of Drains-
The
detm-mined in
aect;ion under
quaLity o f water drained from t h e Delta Lowlands was
a manner similar to that descr ibed i n preceding
t h e beading, t fQua l i ty o f Applied Water", S p e c i f i c
conductance f i e l d measurements at; approximately six-week i n t e r v a l s
were made o f t h e drainage water at 196 sampling point;s. W a t e r
samples were a lso collected a t 24 of t h e s e po in t s at approximately
three-month i n t e r v a l s and subjected to complete mineral analyses.
The est imated quantities of drainage water, presented here to fore ,
and t h e drainage-water qualities were used t o determine t h e amount
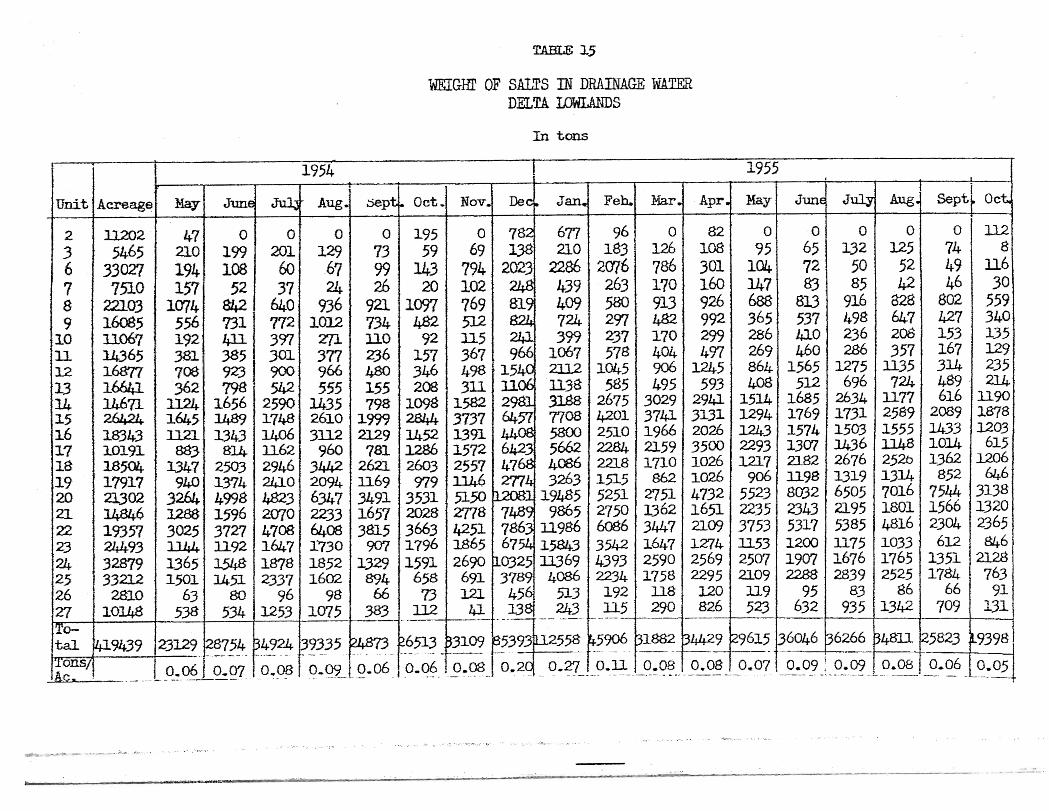
of s a l t d i scha rged a t pumping p l a n t s in each unit. Table 15 shows
t he estimated monthly s a l t tonnage discharged t o t h e channels
w i t h i n each u n i t and t h e monthly t o t a l discharge in tons-per-acre
f o r t h e Delta Lowlands as a whole. The t o t a l s a l t tonnage d i s -
charged in the drainage water during t h e 18-month p e r i o d varied
from a minimum of about l9,QOO t o n s in October , 1955, t o a
maximum o f approximately 113,000 t o n s in January, 1 9 5 5 .
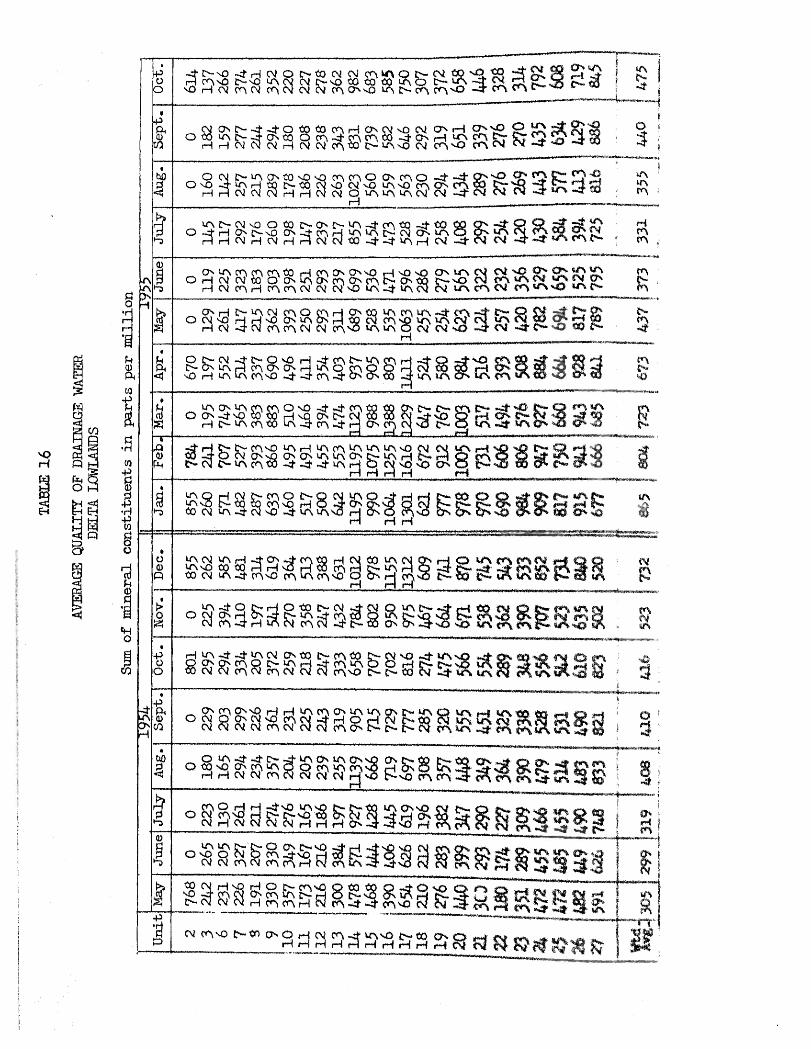
The d a t a in Table 15 ware converted t o show, in T a b l e 16,
t h e weighted average concentration of' drainage water in each sub-
d i v i s i o n unit and f a r t h e e n t i r e Delta Lowlands a rea , T o t a l dis-
so lved s o l i d s in drainage water v a r i e d from abouc 120 ppm in
June, 1955, i n Unit 3 to aboui; 1,600 ppm in February, 3955, i n
Uni t 17, The Delta average ranged between about 300 ppm in June,
1954, to 865 ppm i n January, 1955. An i n spec t i on o f Table 16
indicates t h a t t h e average concentration o f t h e dra inage water
remains comparatively constant between May and October , During
t h i s per iod in each year , t h e concentra2;ion inc reased from about
300 to approximatsly 475 ppm.
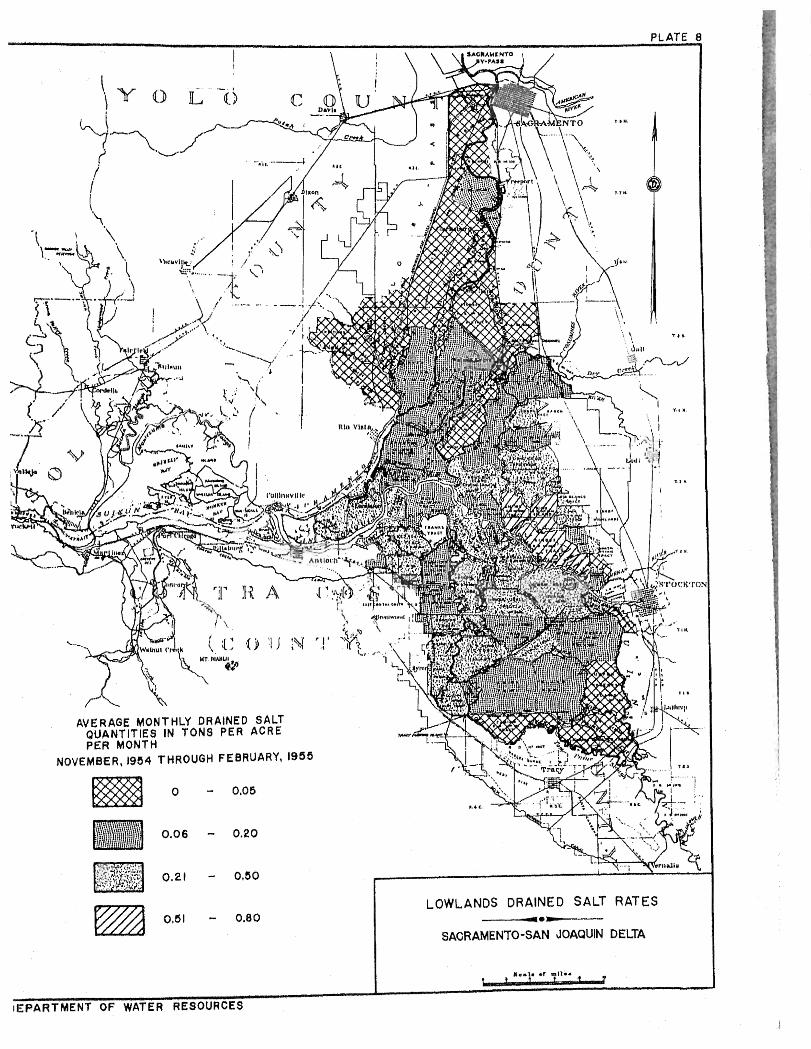
Values o f average monthly salt dincharge in cons-por-
acre from %he Del ta Lowlands are shown g raph i ca l l y on Plates 7, 8,
and 9 f o r three p e r i o d s : May through October, 1954.; November,
1954, through February, 1955; and March through October, 1955.
An i n s p e c t i o n of these p l a t e s indicates t h a t t h e r e was a l a r g e r
area contributing high tonnages of s a l t per-acre-per-month du r ing
t h e winter than dur ing o the r soasons, Th i s is ahown by t h e l a rge
areas in t h e ca tegor ies of 0.21 to 0.50, and 0.51 to 0.80 t o n s -
per-acre-per-month o f s a l t removed during t h e w i n t e r months.
Channgl-Water D m i o n by DrAnaae Wateq. An in-
spec t ion o f t h e da ta shown in Tables 13 and 15 revea l s t h a t during
summer rnont:hs s a J t inflow CQ Delta Lowlands islands exceeds a a l t
drainage therefrom, T h i s i s t r u e even without; t a k i n g into account
t h e r e l a t i v e l y Large amounts o f s a l t ca r r ied by subsurface i n f l o w
to t h e i s lands mentioned h e r e t o f o r e , and sal ts introduced by
fertilization and o t h e r agricultural prac t ices . In o t h e r months
o f t h e y e a r , s a l t removal exceeds sale infLow. Thue t h e Delta
lands ac t as a sa l t reservoir by first; e t o r i n g some o f t h e salts
t h a t e n t e r t h e i s lands during t h e summer and t h e n by releasing
t h o s e sa l t s dur ing t h e win te r through l each ing and/or dra inago o f
p rec ip i t a t i on . This indicates t h a t agricultural practices w i t h i n
t h e Delta Lowlands during t h e summer, when t h a problem o f watar
qua l i ty t h e r e i s most critical, do not degrade good quality
Sacramento River water as it moves through the Delta Co t h e
Tracy Pumping P l a n t bu t ra ther enhances i ts q u a l i t y by removing
a porCion o f its s a l t content . In t he w i n t e r months, when the
accumulated surplus s a l t s are discharged to t h e channels, t h e r e i s
usual ly sufficient surplus f low Chrough t h e DelCa to d i l u t e and
to c a r r y out to Che ocean t h e Leached salts, However, i t should
be noted t h a t the precsd ing statemen$ applied to condi t ions as o f ! 1954-55. Any additional upstream r e g u l a t i o n o r a "dryu year, such si 8
as 1924 o r 1931, w i l l decrease t h e winter flows through t h e De l t a
t o t h e extent that leached salts may not be completely removed
from the area, These f indings a re important and are t h e f i rs t
ava i l ab le demonstratsd conclusions re1at;ing t o Delta channel
water degradation by drainage waters,
PART VZ - SUMMARY AND CONCLUSION As a result of f i e l d investigation and analysis of
other available
tions discussed
are presented:
Summary
da ta and on t h e basis o f t h e e s t i m a t e s and assump-
herainbef ore, t h e fo l lowing summary and conclus ion
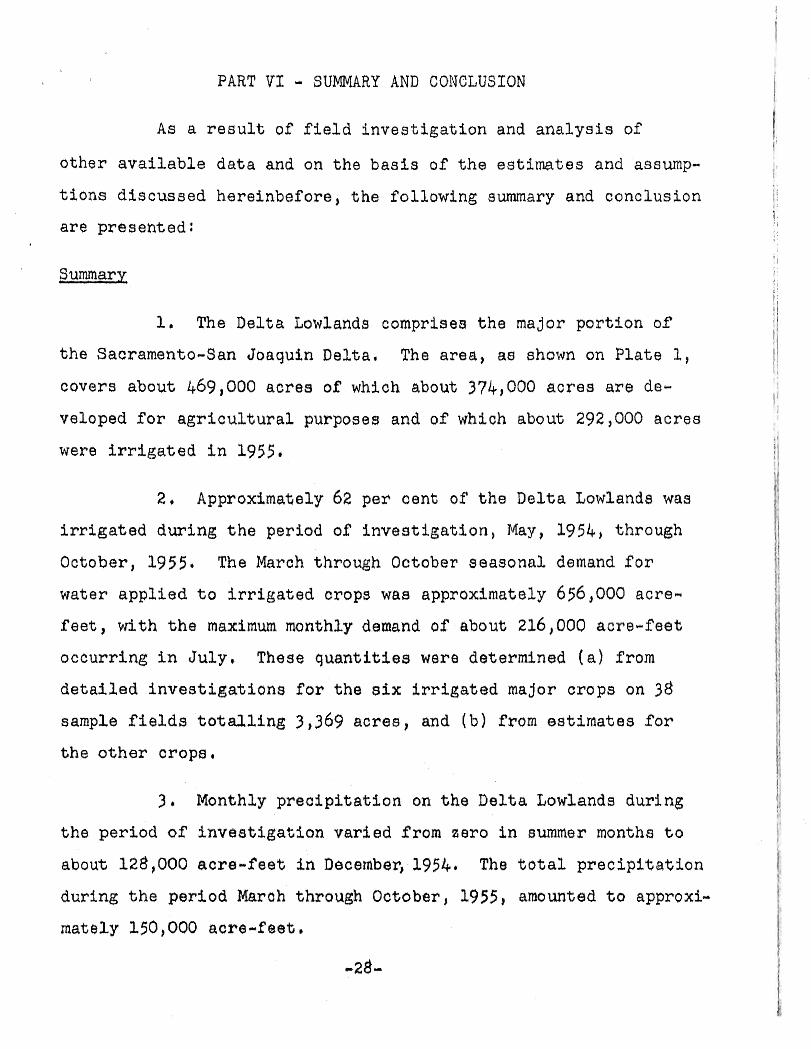
1, The DeLta Lowlands comprises t h e major p o r t i o n of
t h e Sacramento-San Joaquin Delta, The area, as shown on Plate 1,
covers about 469,000 acres of which about 374,000 acres are de-
veloped f o r agxdcul tura l purposes and af which abou* 292,000 acres
were i r r i g a t e d i n 1955,
2 , Approximately 62 per cent of t h e Delta Lowlands was
i r r i g a t e d during t h e period of i n v e s t i g a t i o n , May, 1954, through
October, 1955, The March through October seasanal demand f o r
water applied t o i r r iga ted crops w m approximately 656,000 acre-
fee t , with t h e maximum monthly demand o f about 216,000 a c r a 4 a e t
occurr ing i n July, These quantities were determined ( a ) Prom
d e t a i l a d investigation8 f o r the 8 l x i r r iga ted major crops on 38
sample f i e l d s t o t a l L l n g 3,369 acree, and (b) from es t imates f o r
the o the r c ropa ,
3 the period of
about 128,000
Monbhly p r e c i p i t a t i o n on t he Delta Lawlands during
investigation varied f rom sero in aummer months to
a c r e 4 eet; i n December, 1954, The t o t 8 1 precipitatlan
during t h e period Nmch through October, 1955, amounted t o approxi-
mately 150,000 a c r e 4 e e l ,
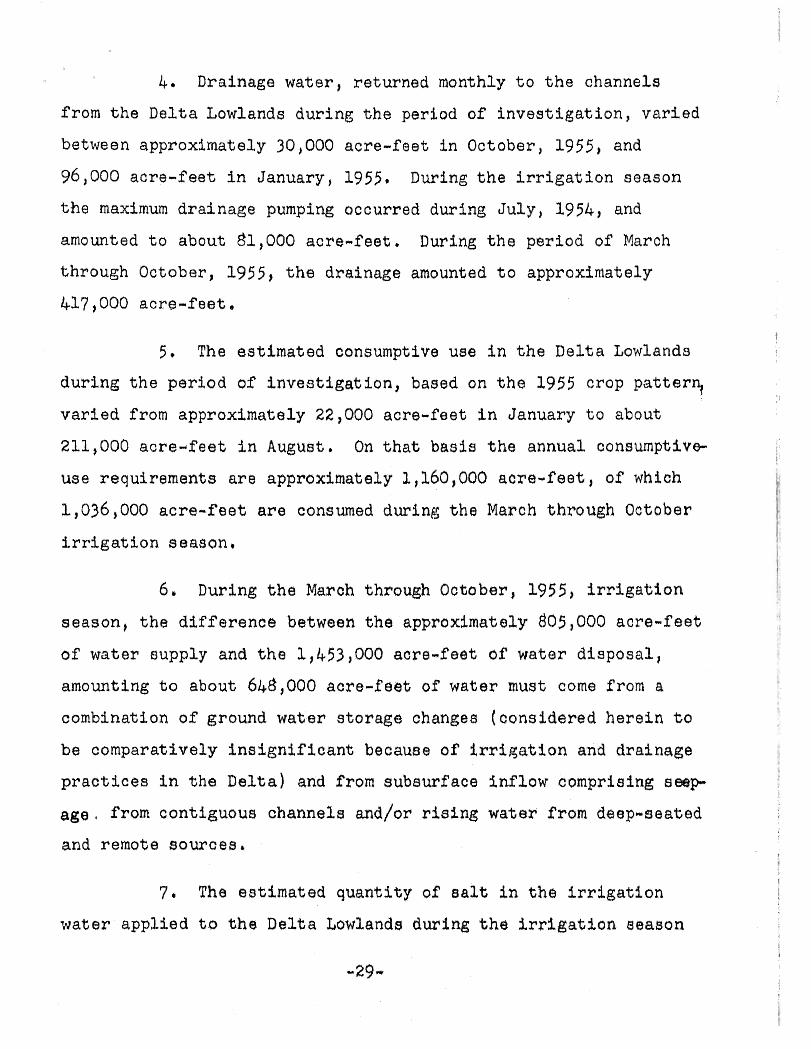
4. Drainage water , returned monthly t o t h e channels
from the Delta Lowlands during t h e period of investigation, var ied
between approximately 30,000 acre-feet i n October, 1955, and
96,000 acre-f e e t i n January, 1955. During t h e irrigaDion season
the maximum drainage pumping occurred during July, 1954, and
amounted t o about 81,000 acre-feet . During t h e per iod of March
through October, 1955, t h e drainage amounted t o approximately
417,000 acre-feel,
5, The estimated consumptive use i n the Delta Lowlands
during t h e period o f investigation, based on t h s 1955 crop pattern,
varied from approximately 22,000 acre-feet i n January t o about
211,000 acre-feat in Auguat, On that basis t h e annual consumptive-
use requirements a r e appraximately 1,160,000 acre-feet , o f which
1,036,000 acre-feet are consumed during the March through October
irrigation season,
6 During t h e March through October, 3.955, i r r i g a t i o n
season, t h e difference between Ghe approxi+mataly 605,000 acre-f ast
of water supply and the 1,453,000 acre- fea t of wate r disposal ,
amounting t o about 6bB,000 acre-feet of watar must come from a
combination of ground watar storage changed (cons idered hers in t o
be comparatively i n s ign i f i can t because o f irriqa2;ion and drainage
prac t i ce s i n %he ~ e l t a ) and from subsurf ace i n f l o w comprising swp
age , from cont iguous channels and/or rising water from deep-aeated
and remota sources, I
, 7 * Tho estimated quanti$y of 8aXt In the i r r iga t ion i
watar applied to the Delta LowZanda during the imigaCian season
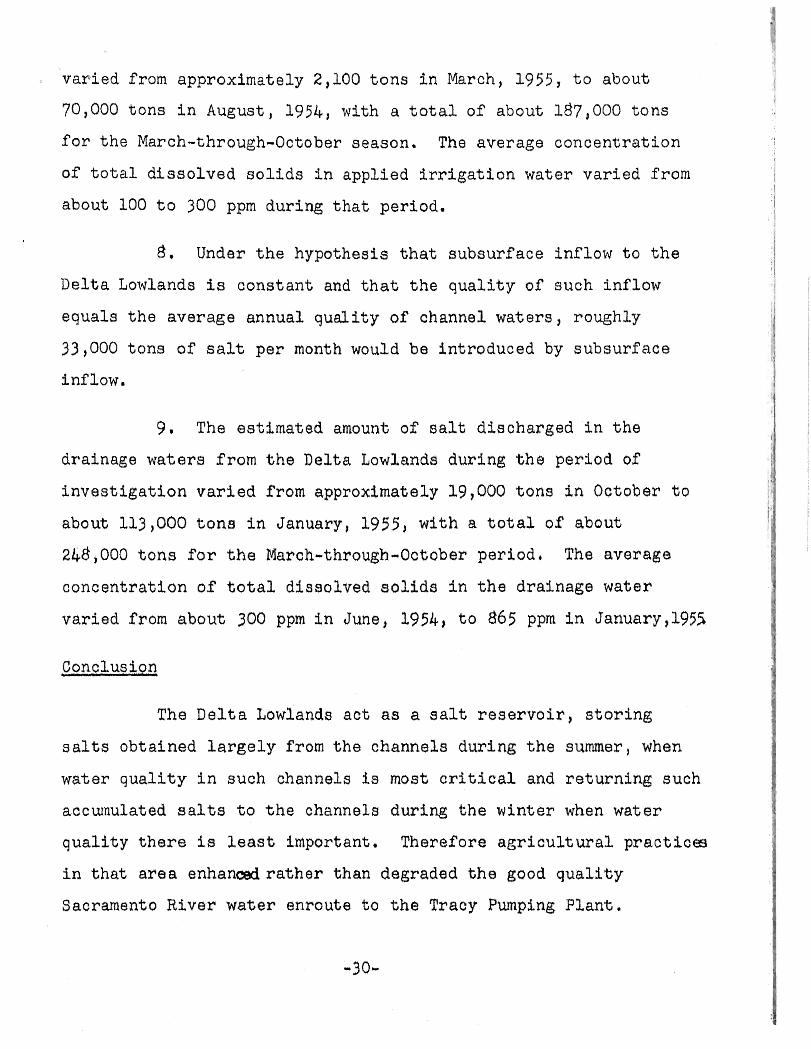
var ied from approximately 2,100 t o n s i n March, 1955, t o about
70,000 tons i n August, 2954, with a total of about 187,000 tons
f o r t h e March-through-October season. The average concen t ra t ion
of t o t a l d i s s o l v e d solids i n applied i r r i g a t i o n water va r i ed from
about 100 t o 300 ppm during t h a t per iod.
8, Under the hypothesis t h a t subsurface inf low t o the
Del ta Lowlands i s constant and that the q u a l i t y of such inf low
equals t h e average annual quality of channel wa-bers, roughly
33,000 tons o f s a l t pe r month would be introduced by subsurface
inflow.
9 . The est imated amount of s a l t discharged i n t h e
drainage waters from t h e Delta Lowlands during t h e period of
i n v e s t i g a t i o n v a r i e d from approximately 19,000 tons in October t o
about ll3,OOQ t o n s i n January, 1955, with a t o t a l of abou-b
248,000 tons f a r t h e March-through-Octaber period. The average
concent ra t ion of total dissolved so l fda I n the drainage water
var ied from about 300 ppm i n June, L954, t o 665 ppm i n January,l955
The De l t a Lowlands ac t as a s a l t r e s e r v o i r , s t o r i n g
s a l t s obtained l a r g e l y from the channelis during t h e summer, when
water q u a l i t y i n such channela t s most critical and r e t u r n i n g such
accumulated s a l t $ to t h e channels during t h e winter when w a t e r
q u a l i t y t h e m i s least important, Therefore agriculLuraZ p r a c t i c a
i n t h a t area enhanced ra ther t;han degraded the good quali ty
Sacramento River water enroute t o t h e Tracy Pumping Plan%.
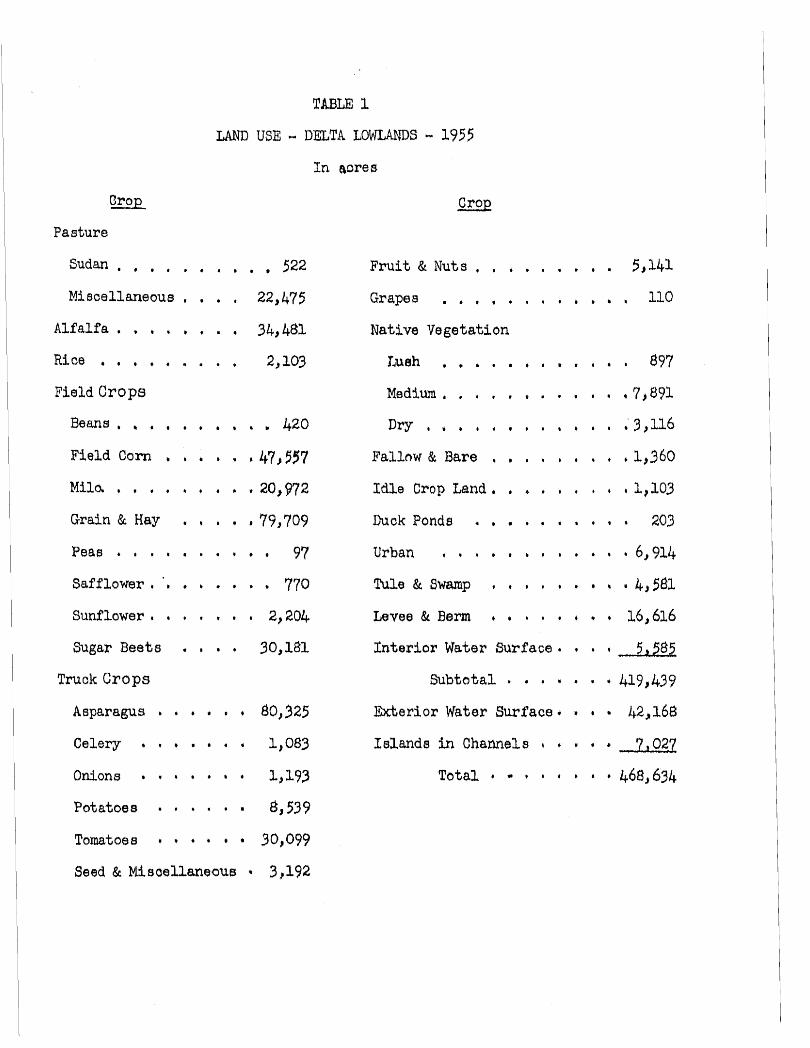
TABLE 3.
LAND USE - DEZTA L O W S - 1955 In Iprrrecs
Grop
Pasture
Sudan. . . . . . . . . . 522 Miscellaneous . . . 22,475
Alfalfa . . . . . . . . 3b,481 Rice . . . . . . . . . 2,103
FbLd Crops
B e a ~ 1 8 . . . . , . . . . . 420
Field Corn . . . . . . 47,557
Mila . . . . . . . * *20,$?72 Grain & Hay . . . . 79,709
P B ~ E ~ . . . . 97
Srzfflower '. . , . * . . 770
Sunflower . . . . . . . 2,204. Sugar Beeba . 30,181
Tmck Crops
Asparagus b . . * . . 80,925 Celery . . * 4 6 1,083
On,,j.ons . w + * * 1,193
Potatoes a + + . 8,539
Tomatoes * * * * * 30,099
Seed & MsosUaneous * 3$192
F ~ i t & Nuts . . . . . . . . . 5,141
Grapea . . . . . . . . . . . . U0
Native Vegetation
Lueh . 877
. . . . . . . . . . M o d i ~ . ,7,8$L
D r y , , . . . . . . . , * . *3,1J6 Fallow & Bare . . . . . . . . . 1,360 Idle CropLand. . . . . . . . d,103 1Dl;lckPdndfj . . . . . 209 Urban . . . . . . . . . . . . 6,91L+ n i l e & 8 ~ 1 ~ ~ 1 8 t . . * ' wl+,5$1
Levee & Berm . 16,616
h t e r l o r Water Surfeca . . a fi,58:!
Subtotal . a . . . e . @9,439
M e r i o r Water Surface m b * 42,168
Islands in Channels + . . 1,027 Total a + * a . 468,634
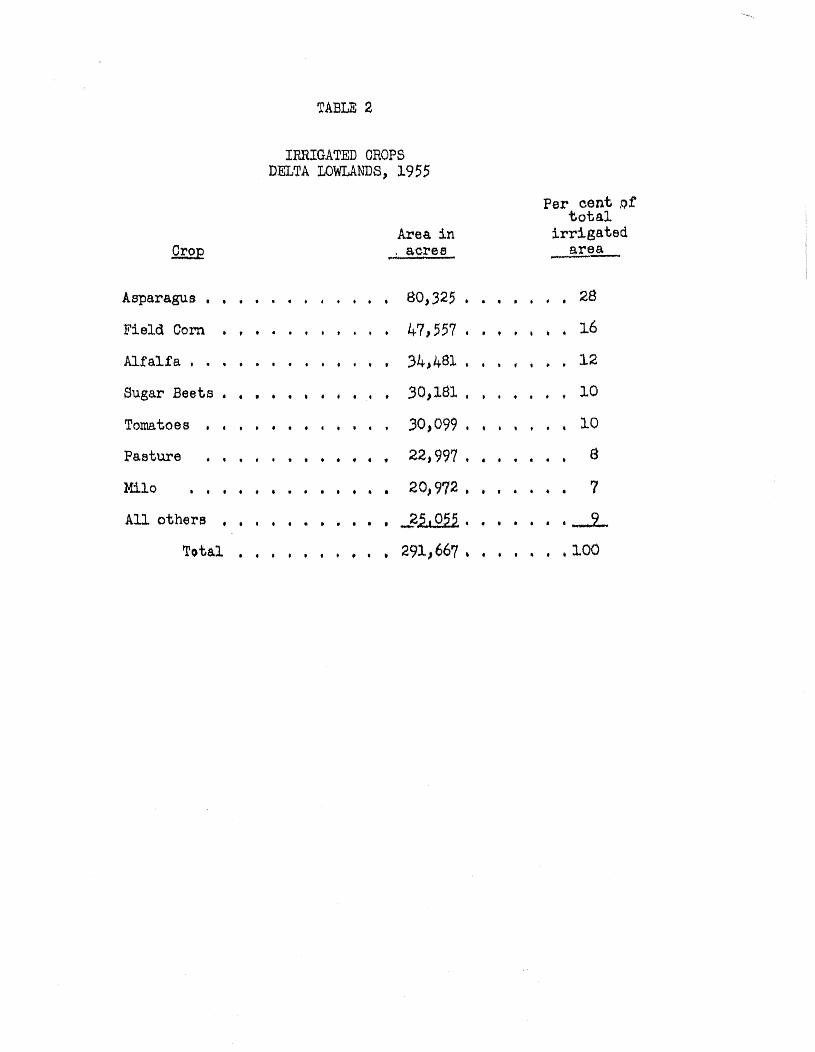
1RRIGATE)I) CROPS DELTA LOWLANDS, 1955
Asparagus , , . . . , . , . . . . 80,325 . . . , . . . 28 Field Corn . . . . . . . . . . . 47,557 . . . . . . . 16
Alfalfa . . . . . . . . . , . . . 34>461 . . . . . . , 12 Sugar Beets . . . . . . . . . . . 30,181 . . . . . . . 10
A l l othere . . . . . . . . . . . Ju. . . . . . . 9
Total . . . . . . . . . . 291,667 . . . . . . . 100
TABU 7
MONTHLY DISTRXBUTION OF APPLIED WATER TO IRRIGATED CROPS DELTA ~ W L A N D 8
1954 In acre-feet
Irri- gated acre-
I cent o f seasonal,
June,
2@U Q30 93.60 2240 6540 3430 2710 5000 5810 516 0 a670 7130 boo0 1950 6370 5860 1230 3690 4860 6330 9060 9530 400 wo -
.18060 -
JB,O -
0°K -
Sept .
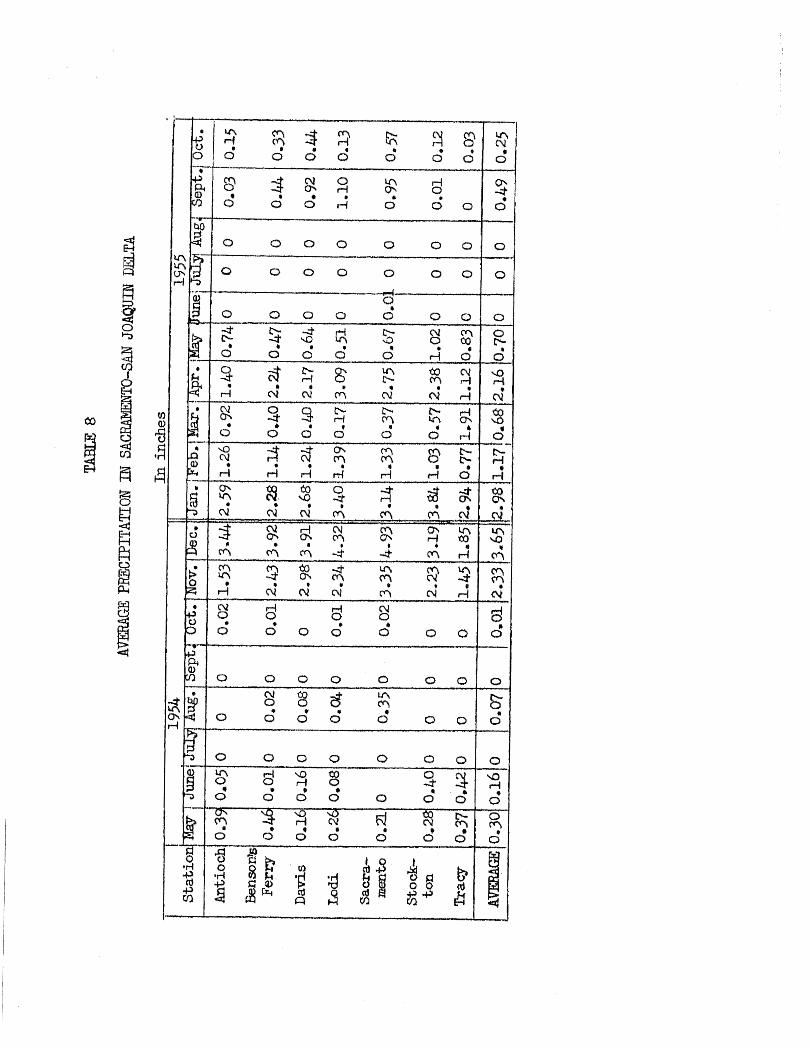
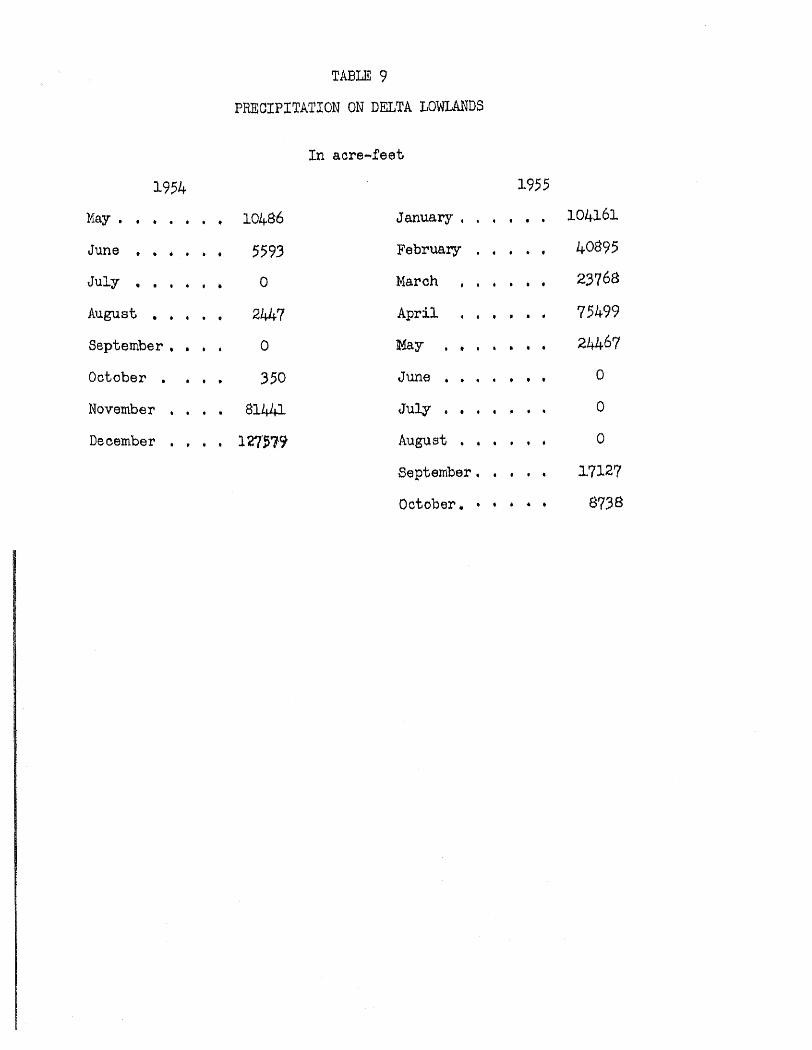
TABLE q
PRECIPITATION OPJ DELTA L Q W D S
1954
May . . . . . . , 10486
June . . , , . , 5593
July rn e , * a 0
August , . , , , 24.47
September , . , , 0
October , , , 3 59
November , . . . 814U
December , , , , 12'7379
3-955
JmwrJT, , r 8 . February . , , . . March , , , , . ,
April , , . . . . 3M&y r e , . . . *
J u n e . . . , , . .
J u l y # . , , . * .
A U D D ~ + . * , ,
September. . . . . October, . * 4 a 0
TABZ;E: 15
CONSUMPTlVE USE R E Q f J m T S , DELTA LOWLANDS
1955
In awe-feet
Jmuary . , , , , 22,371.
February, , , , , 26,108
March . , , , , , 35,001 April , , , . , , 84,015 May , , , , , , , 129,609
June. . , , . . , 136,679
July, 6 e , * , , 191,744
Au~usL, , . , , . , 211,339
September , , , , , 156,805
October , . , . , , 91,609
November, , . * , , 42,593
Daoember, , , , , , w Total , . , , 1,160,323
WEIGZ OF SALTS 33 A P p m IFEuGBTfON mTER DFZTA LOWLANDS
1 Fd 1954 Wt ac Hay I J-1 July) Ax-
o ~ 8 3 ~ ~ ~ ~ % d ~ y ~ ~ @ g $ $ ~ g $ $ g g l 81 IPI 3
- Feb
- Apr
38 ~!ilR685;W3SRd#8 ERE S
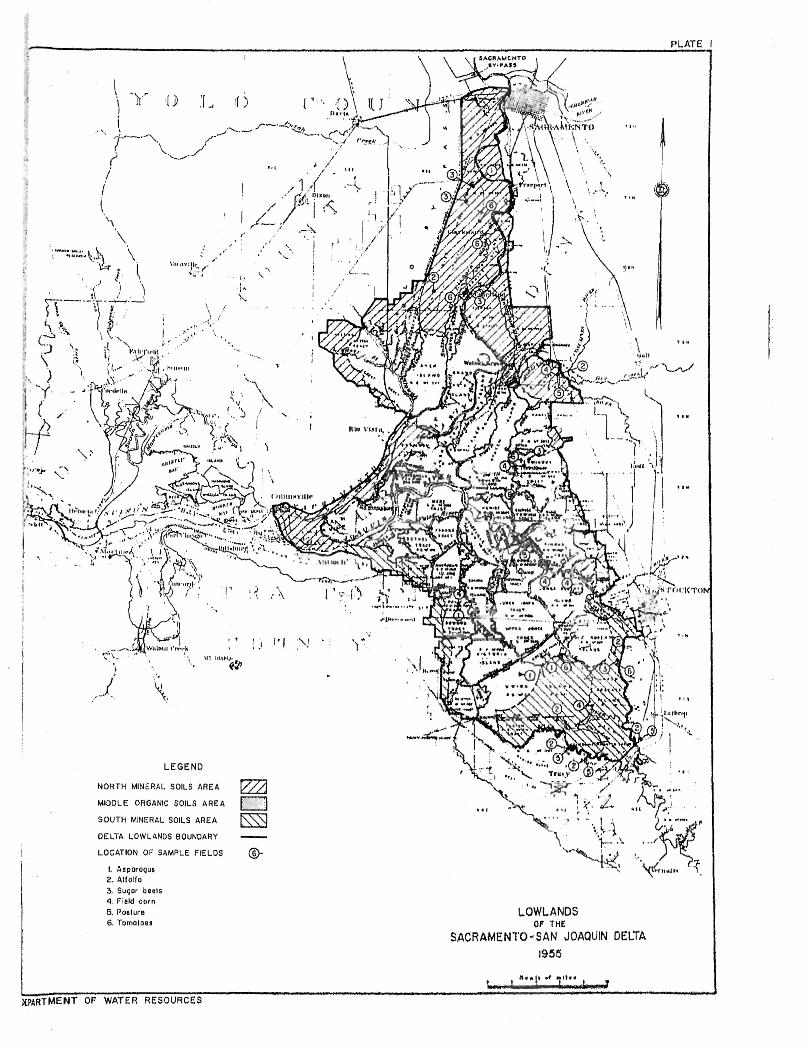
LEGEND
NORTH MINERAL SOILS AREA
MIDDLE ORGANIC SOILS AREA
SOUTH MINERAL SOILS AREA
DELTA LOWLANDS BOUNDARY - LOCATION OF SAMPLE FIELDS @-
I. Asporopua 2. Allolfo 3, Suqor beels 4. Pleld corn 3. Posture 6. Tornaloaa
LOWLANDS OF THE
SACRAMEN1'0wSAN JOAQUIN DELTA 1955
L XpARTMENf OF WATER RESOURCES
* - . ' LII*LLI "
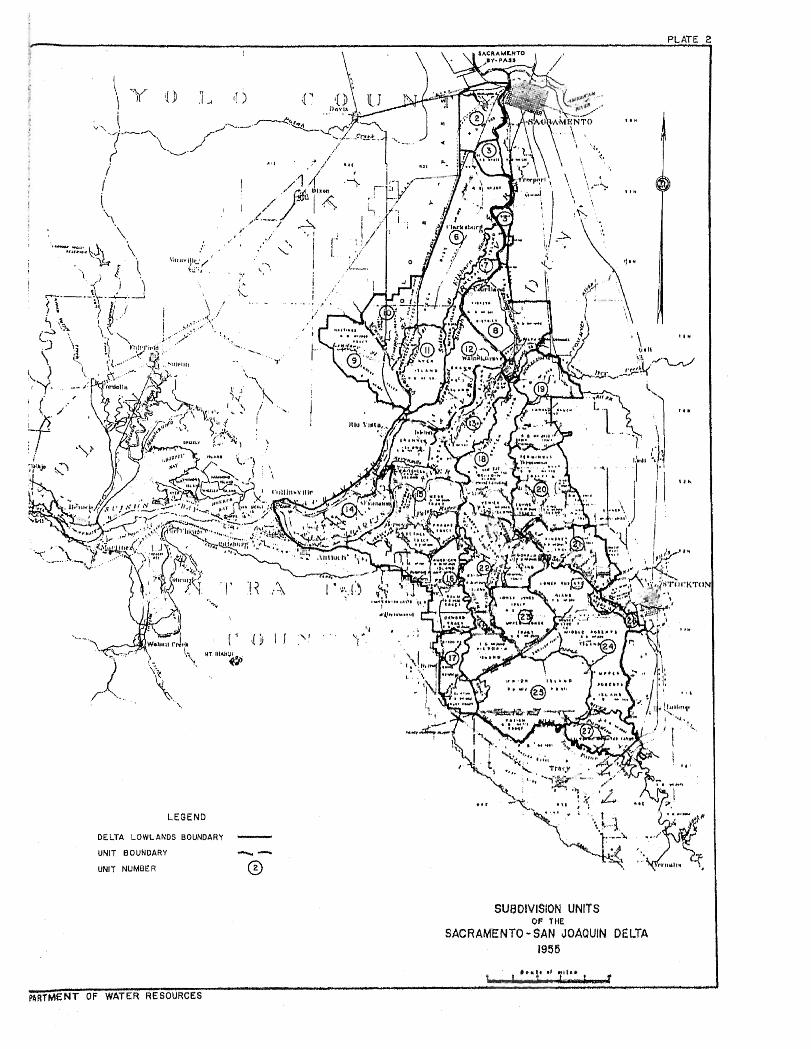
LEGEND
DELTA LOWLANDS BOUNDARY - UNIT BOUNDARY 4-
UNIT NUMBER 0
SUf3DlVlSlON UNITS OF THE
SACRAMENTO-SAN JOAQUIN DELTA 1955
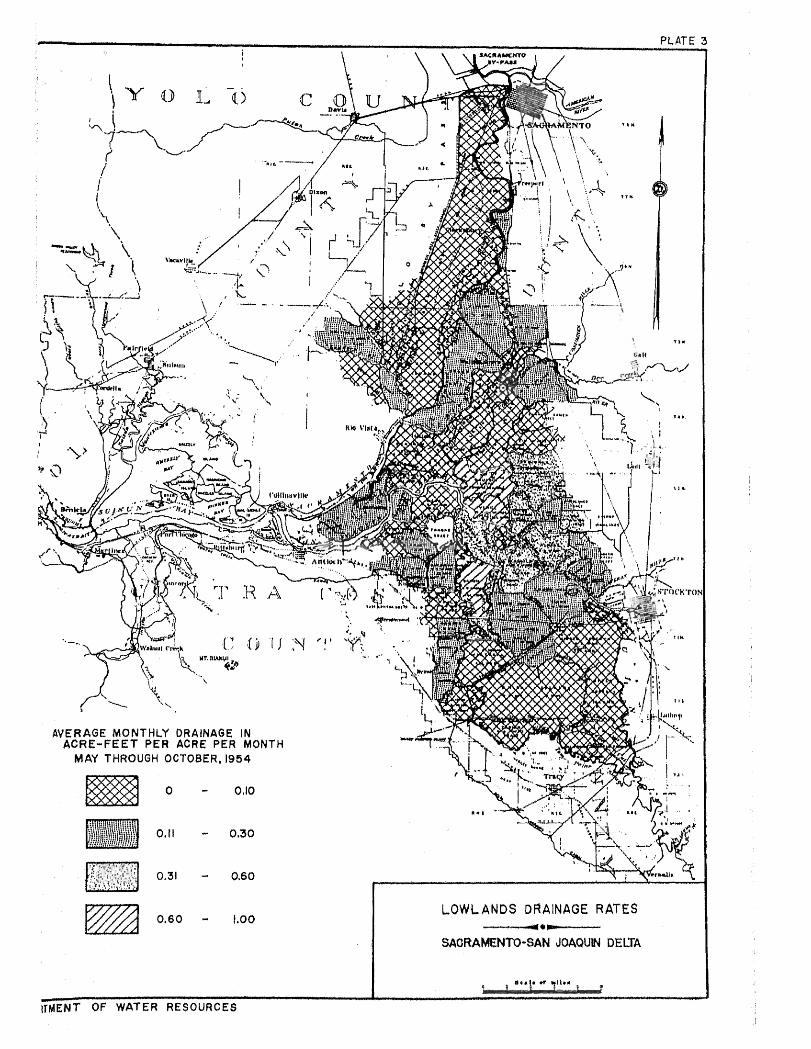
LOWLANDS DRAINAGE RATES -*h------
SACR-m-SAN JOAQUIN DELTA
1
llMENT OF WATER RESOURCES I
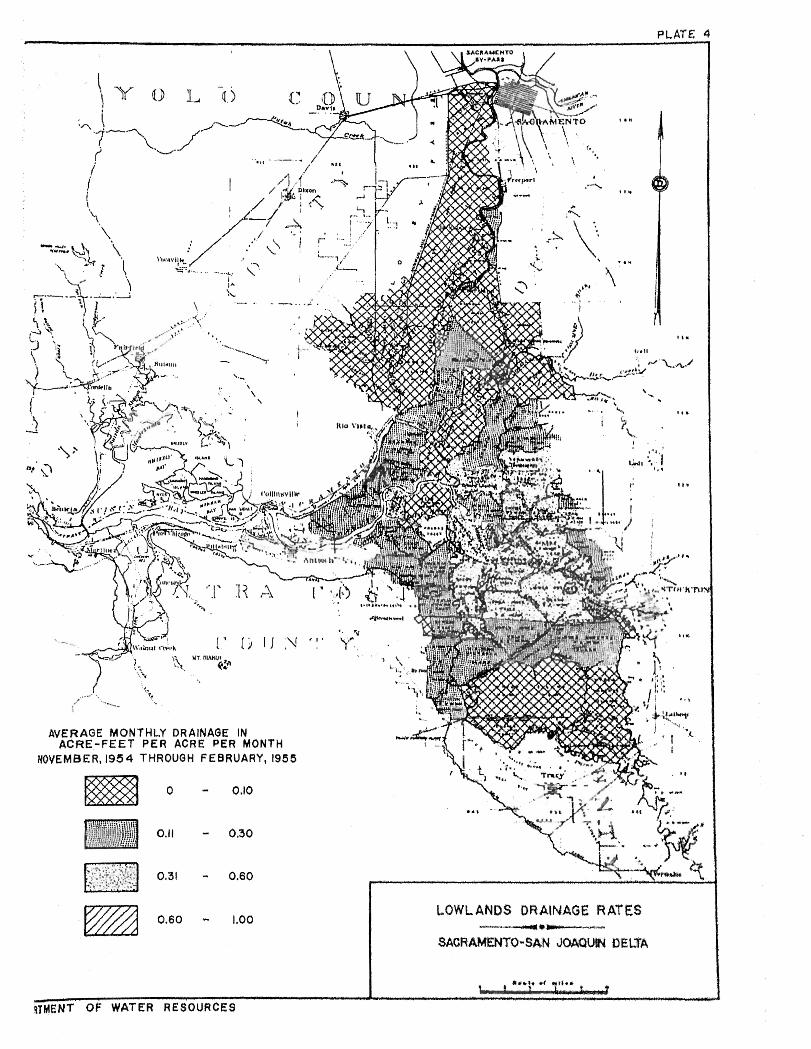
LOWLANDS ORANAGE RATES ------a*-
SAGAAkfWO-$AN Jt3iWW4 DELTA
1 ITMENT OF WATER RESOURCE9
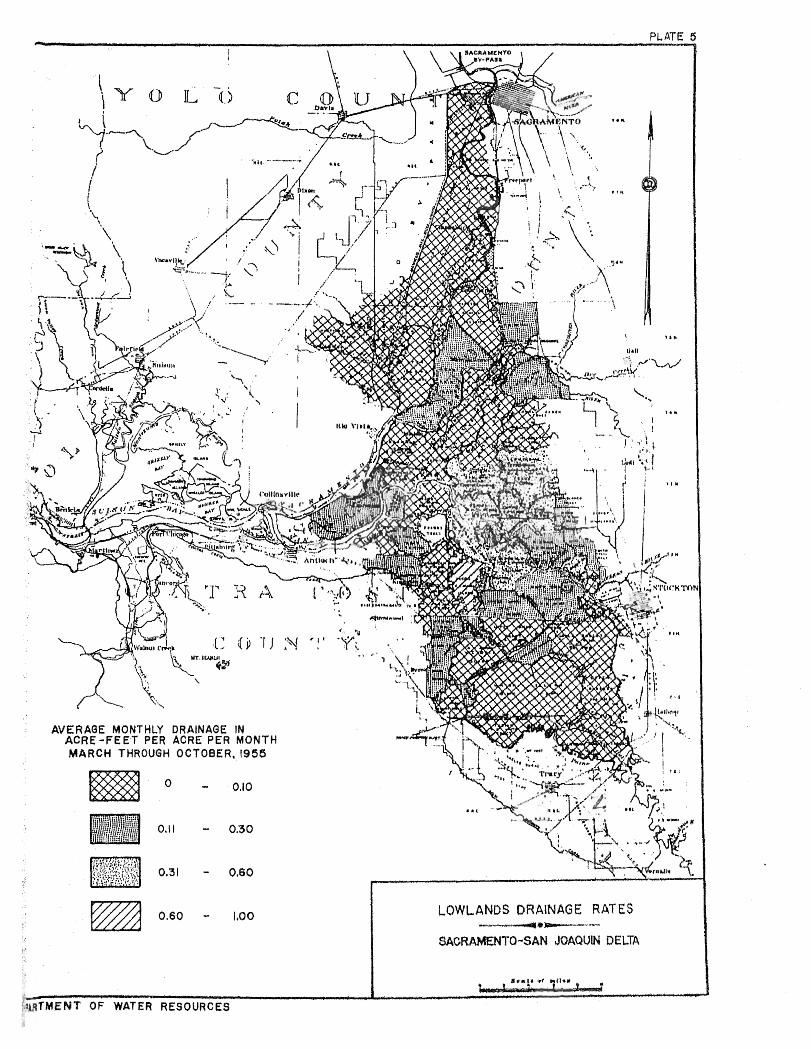
PLATE 6
7
LOWLANDS DRAINAGE RATES --. - .-- I SACRAMENTO-SAN JOAQUH DELTA
e
:wTMENT OF WATER RESOURCES
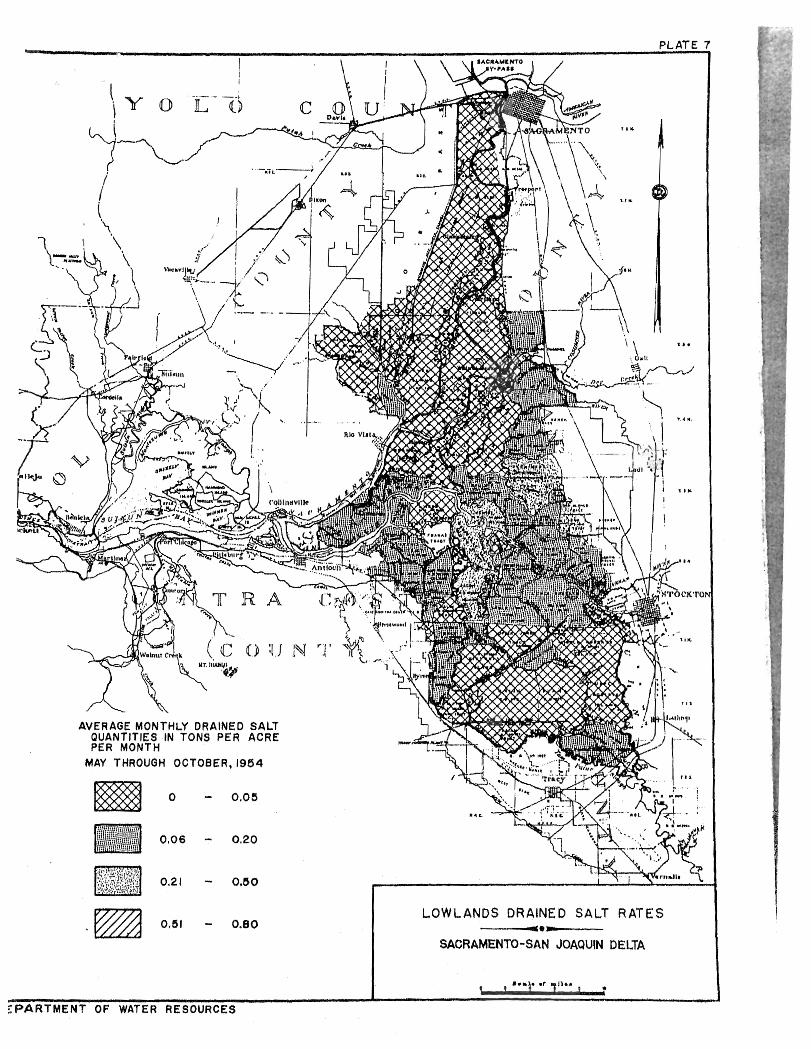
AVERAGE MONTHLY DRAINED SALT QUANTITIES -IN TONS PER ACRE PEA MONTH
MAY THROUGH OCTOBER, 1954
0 - 0 , o s
0.06 - 0.20
0.21 - 0.50
0 - 0.80 LOWLANDS DRAINED SALT RATES
-0-
SACRAMENTO-SAN JOAQUIN DELTA
I ZPARTMENT OF WATER RESOURCES
IEPARTMENT OF WATER RESOURCES
LOWLANDS DRAINED SALT RATES -I*-
SACF~AMENTO-SAN JOAQUIN DELTA
LOWLANDS DRAINED SALT RATES
SAGRAMENTO-SAN JOAQUH DELTA
EPARTMENT OF WATER RESOURCES
L 1 oor
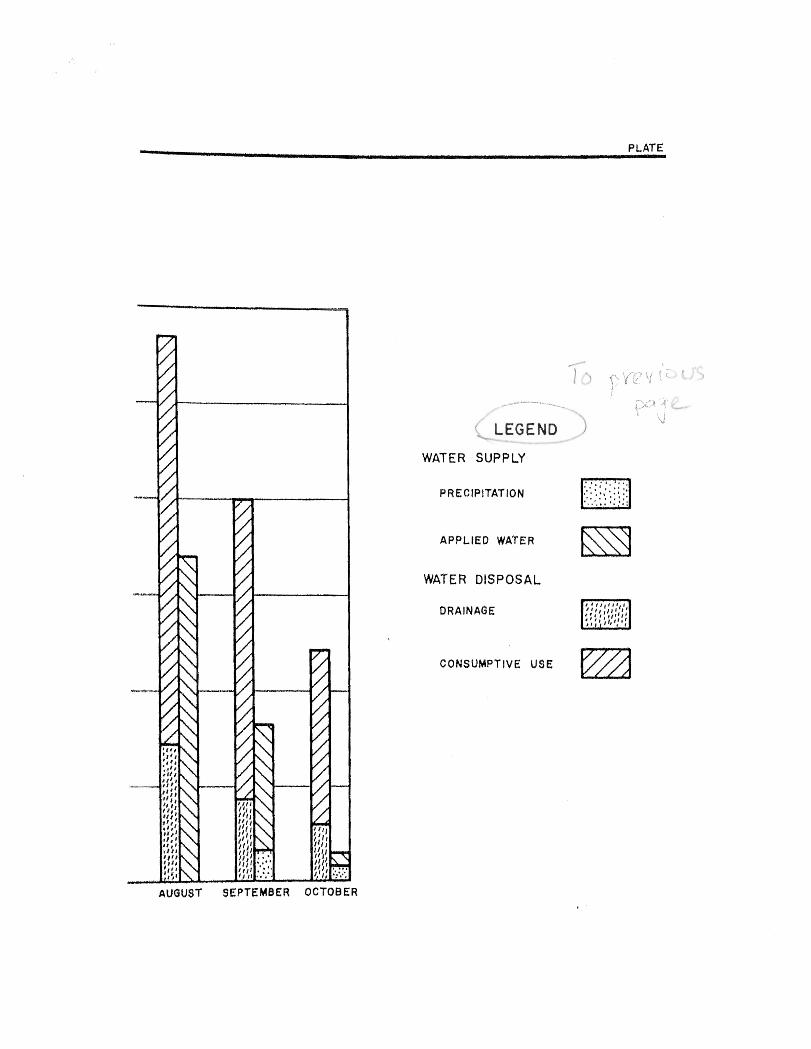
, LEGEND *I
-<
WATER SUPPLY
PRECIPITATION
APPLIED WATER rn WATER DISPOSAL
DRAINAGE
CONSUMPTIVE USE rn
AUGUST SEPTEMBER OCTOBER