from deficit to distinction: restructuring for early...
TRANSCRIPT

From Deficit to Distinction: Restructuring for Early
ChildhoodP3 Principal Leadership Series
Minnesota Department of EducationYvonne Caamal Canul
Superintendent Lansing School DistrictDecember 5, 2016

The Lansing School District• Capital of Michigan (115,000)
• 11,000 students PK – 12
• $155 million budget
• 1500 employees, 9-member Board
• Median Family Income $42,907
• Median Age of Homes: 42 years, 50/40 owned/rental
• 40% of eligible students choice to others
• 61% district graduation rate – increased 10% last 4 years
• 9 schools in “priority” status
The Deficits
• Empty Facilities
• Declining Enrollment/Budget
• Scattered grade configurations
• Trust and Communication
• Lack of Coherence, Vision, Direction
• Stagnated Achievement

Foundational StepsI. Restructure the District Schools:
o Grade span cohorts based on child development
o Maximize facility capacity
II. Focus on Instructiono Long-term instructional vision
o Provide coherent plan
III. Caring, Collaboration, Excellenceo Build trust
o Get teachers engaged in their own learning
o Generate and use process data

Grade-Span Cohorts
Maximize Facility Capacity

Pre-K – 8 Specialty 4 schools
PK to 3rd Grade12 Schools
4th to 6th Grade5 Schools
7th to 12th Grade3 Schools
Pre-K – 62 Centers
Advantages for PK-3
• Develops strong foundation of numeracy, language and literacy skills
• Intense focus on developmental needs
• Provides children with the skills and strategies for lifelong learning
• Personalized and nurturing environment that facilitates student-centered learning communities
• Teachers choose their passion
• School-level focus on PK-3 world
Advantages of 4-6 Communities
• Critical developmental stage that needs positive role models, predictability, behavioral supports
• Provides a sustained nurturing environment and gently moves students to a multi-teacher day
• Unique instructional strategies for group work
• PBL designed for this age group increases engagement by focusing real-world application

Advantages of 7-12 Communities
• More elective choices at earlier age
• Grab them before they drop-out
• More staff with specialized knowledge and expertise in a specific developmental stage of educational growth
• Increased sense of belonging, attendance, self-esteem and positive attitudes, with fewer suspensions
• Opportunity for career and college exploration at an earlier age

Long-Term Instructional Vision
Coherence

Focus on Instruction
New Lens on Instruction
• Annual outcome data does not help change instructional practice
• Students’ experience drives achievement
• Data neutralizes perception
• Two observational instruments
o EduSnap and CLASS

Developing Coherence
School Action Plans
Curriculum/Pacing Guides
School Improvementand Transformation
Plans
Research
Data
iCollaborate

Developing Coherence• This is what we’re doing
• Teachers name initiative: iCollaborate
• Contracted expertise
• All Classrooms are observed
• Use of PD days for iCollaborate
• Timely data feedback

Instruments That Help Us Know
More About What Students
Experience in Their Classroom
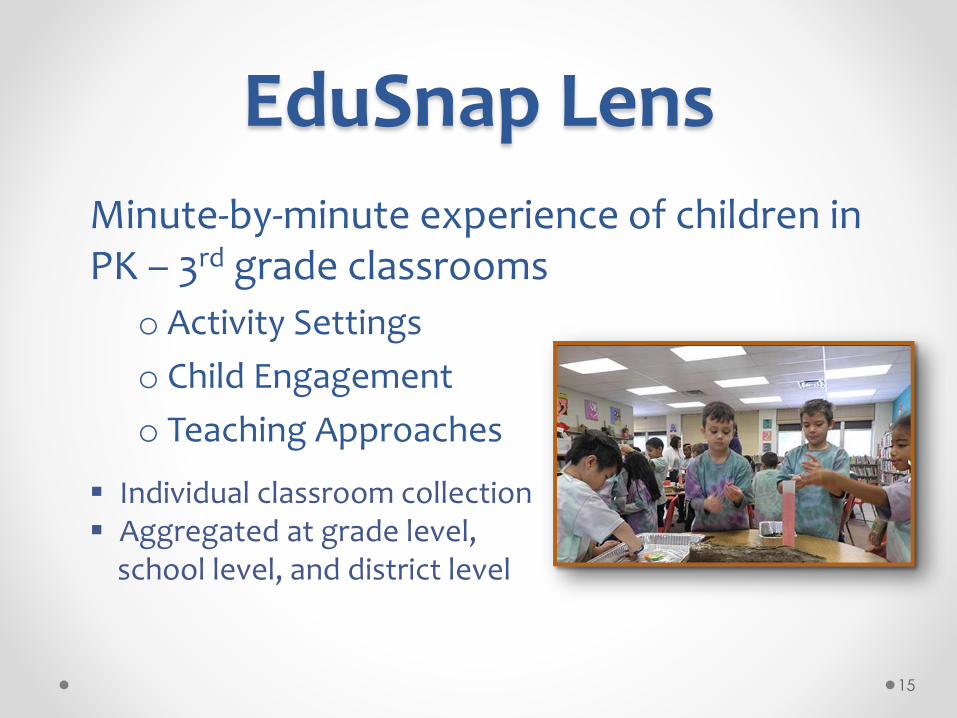
EduSnap Lens
Minute-by-minute experience of children in PK – 3rd grade classrooms
o Activity Settings
o Child Engagement
o Teaching Approaches
15
Individual classroom collection Aggregated at grade level,
school level, and district level

CLASS Lens• Focuses on the interactions between teachers and students
and what the teachers do with their materials and environment.
• Data Coaches codify in 15-20 minute sessions, for 1 day
• Uses a 7-point scale to indicate the presence of key indicators and attributes
1 - 2 = low
3 - 5 = mid
6 - 7 = high
Aggregated at grade level,
school level, and district level
EduSnap™
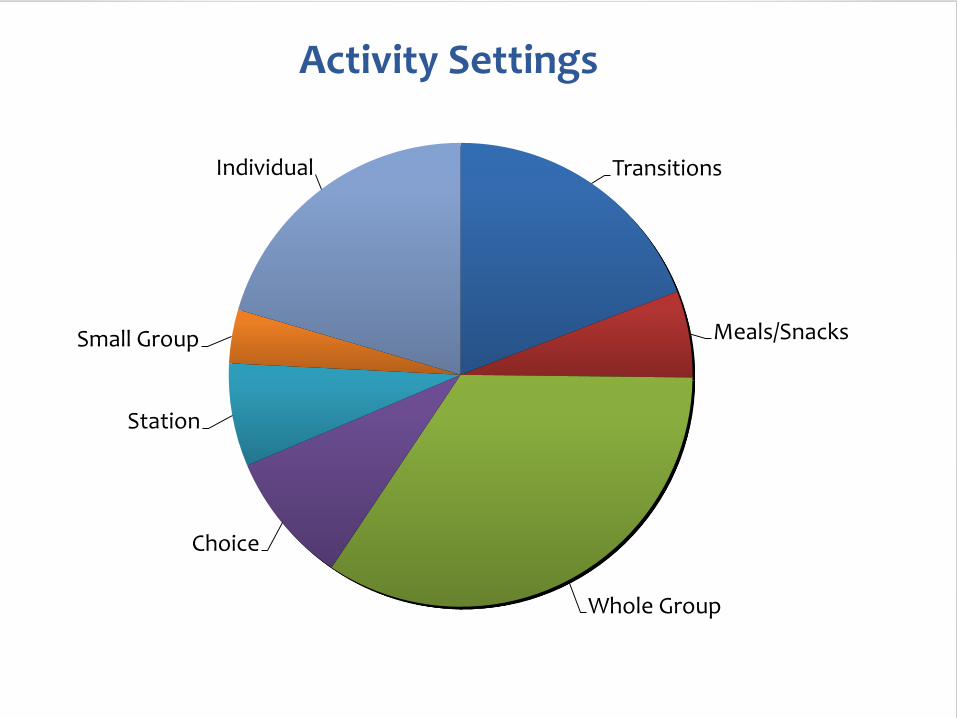
Transitions
Meals/Snacks
Whole Group
Choice
Station
Small Group
Individual
Activity Settings
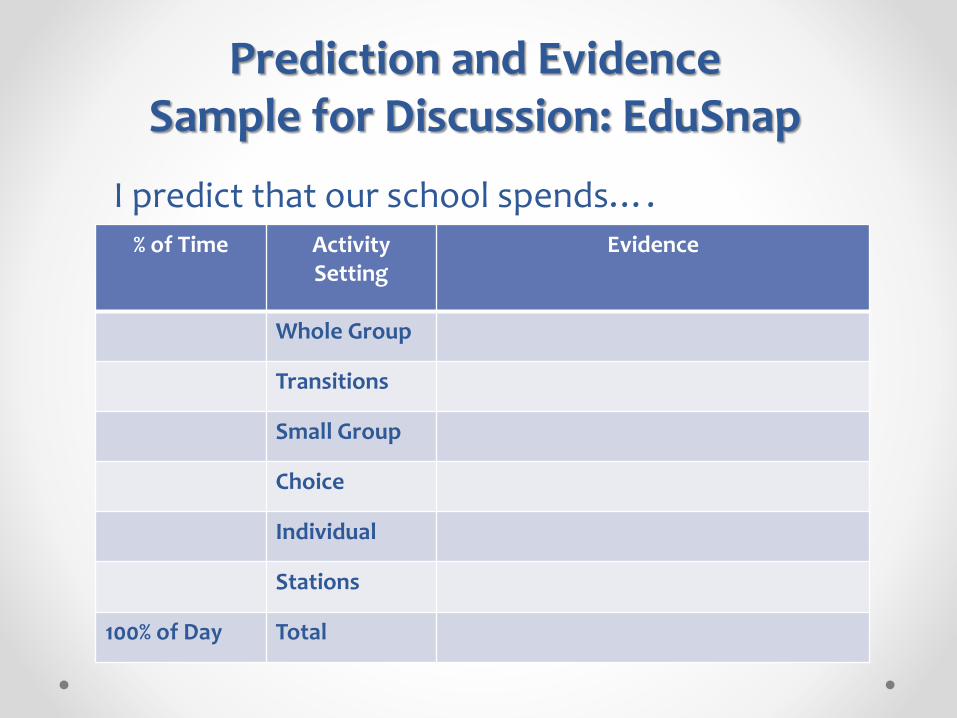
Prediction and EvidenceSample for Discussion: EduSnap
I predict that our school spends….% of Time Activity
SettingEvidence
Whole Group
Transitions
Small Group
Choice
Individual
Stations
100% of Day Total

34%
21%
19%
9%
6%
4%
7%
34%
21%
18%
11%
6%
3%
6%
33%
22%
18%
11%
7%
3%
6%
39%
29%
13%
2%1%
7%
10%
37%
30%
10%
2%
0%
5%
15%
0%
5%
10%
15%
20%
25%
30%
35%
40%
45%
Whole Group Individual Transitions Choice Meals Small Groups Stations
Series 1 - 2012
Series 2 - 2013
Series 3 - 2014
Series 4 - 2015
Series 5 - 2016
Series 1 34% 21% 19% 9% 6% 4% 7%
Series 2 34% 21% 18% 11% 6% 3% 6%
Series 3 33% 22% 18% 11% 7% 3% 6%
Series 4 39% 29% 13% 2% 1% 7% 10%
Series 5 37% 30% 10% 2% 0% 5% 15%
Activity Setting: 2012 to 2016
Two-hour observations

Series 1 39% 20% 7% 5% 6% 7%
Series 2 42% 24% 8% 5% 7% 7%
Series 3 41% 23% 10% 6% 7% 5%
Series 4 47% 37% 13% 8% 3% 2%
Series 5 54% 36% 9% 9% 3% 5%
39%
20%
7%5%
6%7%
42%
24%
8%
5%7% 7%
41%
23%
10%
6%7%
5%
47%
37%
13%
8%
3%2%
54%
36%
9% 9%
3%5%
0%
10%
20%
30%
40%
50%
60%
Literacy Math Social Studies Science Gross Motor Aesthetics
Series 1 - 2012
Series 2 - 2013
Series 3 - 2014
Series 4 - 2015
Series 5 - 2016
Curriculum Balance: 2012 to 2016

Series 1 43% 9%
Series 2 37% 15%
Series 3 34% 18%
Series 4 36% 23%
Series 5 30% 23%
43%
9%
37%
15%
34%
18%
36%
23%
30%
23%
0%
5%
10%
15%
20%
25%
30%
35%
40%
45%
50%
Didactic Scaffolds
Series 1 - 2012
Series 2 - 2013
Series 3 - 2014
Series 4 - 2015
Series 5 - 2016
Teaching Approaches: 2012 to 2016

52%
49%
29%
26% 26% 26%
33%
29%
0%
10%
20%
30%
40%
50%
60%
Fall MEAP2012
Fall MEAP2013
Spring 2015MSTEP
Spring 2016MSTEP
Fall MEAP2012
Fall MEAP2013
Spring 2015MSTEP
Spring 2016MSTEP
English Language Arts (3rd Grade) Mathematics (3rd Grade)
Fall 2012 52% 26%
Fall 2013 49% 26%
Spring 2015 29% 33%
Spring 2016 26% 29%
State Assessment Proficiency: 2012 to 2016State ELA Data:2012 – 68%2013 – 68%2014 – NO TEST2015 – 50% (-18%)2016 – 46% (-4%)
State Math Data:2012 – 40%2013 – 46%2014 – NO TEST2015 – 49%2016 – 46%
CLASS™Classroom Assessment Scoring System

Classroom Quality
Emotional Support
Positive Climate
Teacher Sensitivity
Regard for Adolescent Perspective
Classroom Organization
Behavior Management
ProductivityNegative Climate
Instructional Support
Learning Formats
Content Understanding
Analysis and Inquiry
Quality of Feedback
Instructional Dialogue
CLASS™
Student EngagementThe overall engagement level of students in the classroom
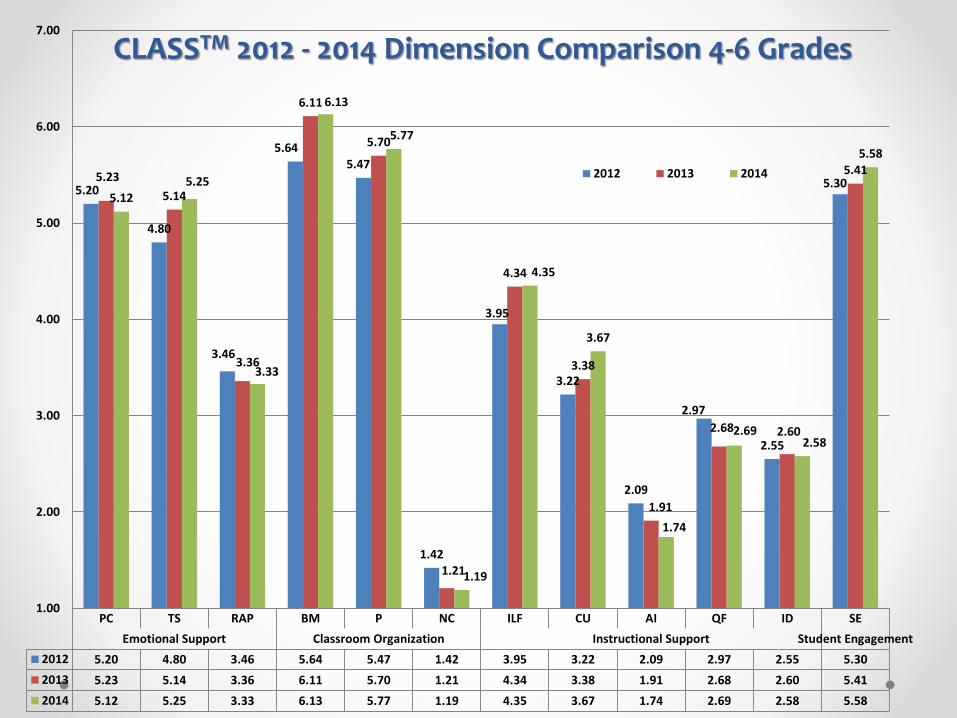
PC TS RAP BM P NC ILF CU AI QF ID SE
Emotional Support Classroom Organization Instructional Support Student Engagement
2012 5.20 4.80 3.46 5.64 5.47 1.42 3.95 3.22 2.09 2.97 2.55 5.30
2013 5.23 5.14 3.36 6.11 5.70 1.21 4.34 3.38 1.91 2.68 2.60 5.41
2014 5.12 5.25 3.33 6.13 5.77 1.19 4.35 3.67 1.74 2.69 2.58 5.58
5.20
4.80
3.46
5.645.47
1.42
3.95
3.22
2.09
2.97
2.55
5.305.23
5.14
3.36
6.11
5.70
1.21
4.34
3.38
1.91
2.68 2.60
5.41
5.125.25
3.33
6.13
5.77
1.19
4.35
3.67
1.74
2.692.58
5.58
1.00
2.00
3.00
4.00
5.00
6.00
7.00
2012 2013 2014
CLASSTM 2012 - 2014 Dimension Comparison 4-6 Grades
Build Trust
Teachers Engaged in Their Own Learning
Use Process Data

Building Trust
• School-Level Leadership Teamso Principal and 2 teachers
o Meet 3x’s/year with iCollaborate staff/data coaches
o Identify strengths, areas of challenge, and action plan to
guide practice and professional development
o Build in-school capacity
• Train the Trainer Modelo Leadership Teams share PD at School
• Individual Data is for Personal Growth Onlyo Individuals can request data
o Can be used by teacher in evaluation
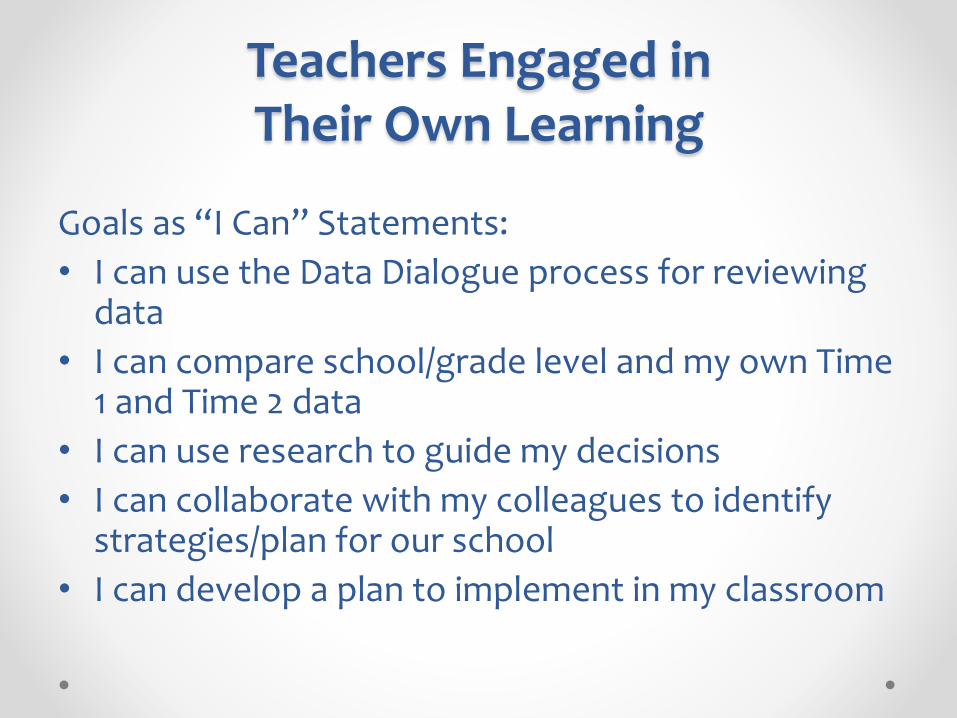
Teachers Engaged in Their Own Learning
Goals as “I Can” Statements:
• I can use the Data Dialogue process for reviewing data
• I can compare school/grade level and my own Time 1 and Time 2 data
• I can use research to guide my decisions
• I can collaborate with my colleagues to identify strategies/plan for our school
• I can develop a plan to implement in my classroom

• Move from evaluation to inquiry
• Value educator expertise and insights
• Provide educators with opportunities for meaningful participation in decision-making
• Convey high expectations
• Increase intellectual curiosity, competence, openness and willingness to share
Learning Within A Culture of Collaborative Inquiry
Using the action planning sheet, prioritize 1-2 items on which to focus.
• Consider the following:
oWhat would your students benefit from the most?
oWhat fits in with current initiatives at your school?
Develop your plan of action!
Action Planning Process

Using Data to Improve PracticeIdentify One or Two Priority Areas – Where do I really want to focus?
EduSnap Change FocusforActionPlanning Practice
Lookingatyourdata,whathaschanged?Whydoyouthinkthat?
Selectoneortwoprioritiesfromyourdatathatyouwant
tochangefornextyear.
Whatwillthislooklikeinyourclassroom?
ActivitySettings
SmallGroupGroupWork
ComponentsofMath
EarlyMathConcepts
ComponentsofLiteracy
OralLanguage
Vocabulary
ContentBalance
EarlyMath
LanguageVocabulary
TeachingApproaches
Scaffolds
StudentLearningApproaches
CollaborationMetacognition

Using Process Data• Identifies and drives professional learning agenda,
topics, and activities and uses funding resources more coherently – School Improvement Plans
• Convene in collaborative inquiry using the data to improve the instructional practice
• District Improvement/Strategic Plan
• Monitor change over time
• Share with Board of Education

iCollaborate is embedded in District’s
Strategic Plan and Superintendent’s
Evaluation

Teachers Say it Best
“Now we are sharing data with one another. It is clear what successes we have had and we know what we need to work on. The data has helped us be more intentional and meaningful with every bit of our time. Time is so precious.”
“I don’t have to feel like a perfect teacher. Data gives me the feedback that helps me engage in thoughtful and meaningful planning of how to engage kids in practices and activities that I know are going to make a difference.”

Teachers Say it Best
“I think the fact that there is a leadership team that has a ‘focused’ and ‘consistent’ agenda that allows for each building and staff member to speak the same language is important and should remain in place for the duration of this Central Office’s reign.
“Change is happening and there are some good things that have already risen. We need to continue to visit and celebrate it regularly.”

On the Horizon(no stopping us now!)

The Lansing Pathway Promise
• $120 million Bond passed with 62% in May 2016
• The Lansing Pathway Promiseo Promise Scholarship upon graduation
o Career and College Readiness
o Create open choice throughout district
o Establish multiple learning options
o Projects-based learning approach
o Partnerships with business, industry, and higher ed.
• Bond upgrades district based on the Pathwayso Furniture – flexible
o Technology – benchmarking grade spans
o Security – safe entrances
o General upgrades for efficiencies
o School upgrades based on its Pathway
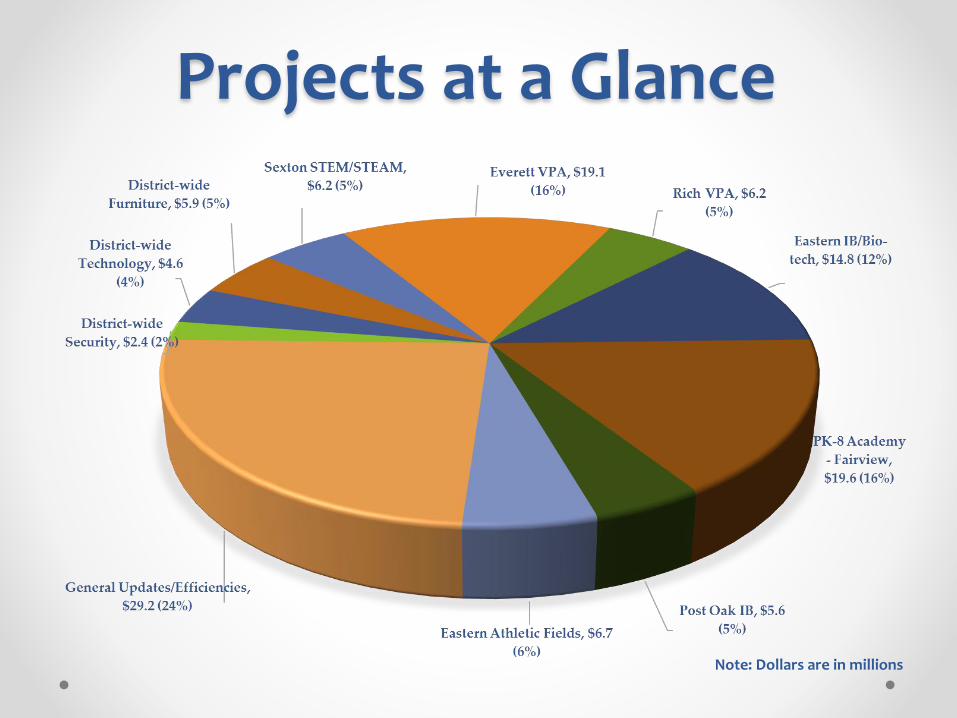
Projects at a Glance
Note: Dollars are in millions

THE PATHWAY PROMISE
Post-Secondary PartnershipsAll Lansing School District Graduates are eligible for a Lansing HOPE or Promise scholarship
The Pathway Promise is the Lansing School District’s commitment to guiding students through bountifulearly educational choices that lead to robust offerings at our three high schools. With Pathway Promise, aneducation in the Lansing School District ultimately ends with a Lansing Promise scholarship.
EASTERN HIGH SCHOOL7th - 12th Grades
IB/Chinese/Bio Tech/Comprehensive
Pattengill Academy (Fairview)PreK-8th GradesBio/Tech, General
Rich Visual Performing Arts
Academy
PreK-8th Grades
Gardner Leadership, Law& Government Academy
PreK-8th Grades
EVERETT HIGH SCHOOL7th - 12th Grades
New Tech/VPA/Comprehensive
SEXTON HIGH SCHOOL7th - 12th grades
STEM/STEAM/Spanish/Comprehensive
Fairview/STEMPreK-3rd Grades
NorthPreK-6th Grades
Sheridan Rd. STEM4th -6th Grades
Gier ParkPreK-3rd Grades
LyonsPreK-3rd Grades
Mt. Hope STEAM4th-6th Grades
Mt. Hope STEAM4th-6th Grades
CumberlandPreK-3rd Grades
Cavanaugh STEMPreK – 3rd Grades
Forest ViewPreK-3rd Grades
Choice of Pathways
Wexford Montessori
PreK-8th Grade
Gier ParkPreK-3rd Grades
Post OakK-8 IB/Chinese
Attwood4th-6th Grades
Lewton4th-6th Grades
Spanish
RiddlePreK-3rd Grades
CumberlandPreK-3rd Grades
Pleasant ViewOffline or GSRP
ReoPreK-3rd Grades
AverillPreK-3rd Grades
Spanish
WillowPreK-3rd Grades
KendonPreK-3rd Grades
KEY: Bond Construction Possible Change
SY 19/20
SY 19/20
SY 20/21
SY 2
1/22
SY 21/22
On
-goin
g
On
-goin
g tech
nolog
y, furn
iture,
security u
pg
rad
es
On
-goin
g tech
nolog
y, furn
iture,
security u
pg
rad
es
