from dsdp leg 371 - deep sea drilling · pdf filethe bulk densities of 101 basalt samples...
TRANSCRIPT

13. PHYSICAL PROPERTIES OF BASALTS, GABBROS, AND ULTRAMAFIC ROCKSFROM DSDP LEG 371
R.D. Hyndman, Victoria Geophysical Observatory, Earth Physics Branch,Department of Energy, Mines, and Resources, Victoria, B.C., Canada
andMJ. Drury, Department of Oceanography, Dalhousie University, Halifax, N.S., Canada
ABSTRACT
The physical properties of bulk and grain density, porosity andwater content, electrical resistivity, thermal conductivity, and com-pressional and shear wave velocity have been measured on a largecollection of DSDP Leg 37 basalts and a few gabbros and ser-pentinized peridotites. The mean properties for the basalts are: bulkdensity 2.795 g/cm3; porosity, 7.8%; electrical resistivity at 25°C,220 ohm-m; thermal conductivity, 3.97 mcal/cm/sec/°C; com-pressional velocity at 0.5 kbar pressure, 5.94 km/sec; and Poisson'sratio, 0.295. The means for the gabbros are: 2.957 g/cm3; 1.0%; 1710ohm-m; 5.7 mcal/cm/sec/°C; 7.07 km/sec; 0.310. The means forthe serpentinized peridotites are: 2.699 g/cm3; 0.8%; 7160 ohm-m;7.6 mcal/cm/sec/°C; 6.18 km/sec; 0.350.
INTRODUCTIONThis article summarizes and discusses the physical
properties measurements made on DSDP Leg 37basalts, gabbros, and serpentinized peridotites, andpresents some detailed data not given in other chapters.The properties examined are: bulk and grain density,porosity and water content, electrical resistivity, ther-mal conductivity, and compressional and shear wavevelocity.
The shipboard measurements of density, porosity,electrical resistivity (at atmospheric temperature andpressure), and seismic velocities (at 0.5 kbar pressure)are given in the site reports, so only a summary and in-terpretation are given here. Measurements of electricalresistivity at higher temperatures and pressures aregiven here. The seismic velocity results at high pressuresare presented and discussed in detail by Hyndman (thisvolume) and Christensen (this volume). The thermalconductivity at room temperature and low pressure byJ. Jolivet for the computation of heat flow is describedby Hyndman et al. (this volume). Very high pressureand temperature measurements of thermal conductivityand electrical resistivity of basalts are presented bySchloessin and Dvorak (this volume). The electricalproperties of basalts as a function of frequency arepresented by Katsube et al. (this volume).
The measured samples were mini cores 2.5 cmdiameter × 2.5 to 5.0 cm length weighing about 50 g. Itmust be remembered that the core recovery in the base-ment parts of the Leg 37 holes was only about 20%. Inaddition, although we have attempted to include allrock types and states of weathering and alteration, only
•Contribution 599 of the Earth Physics Branch.
part of the recovered core is sufficiently unfractured tobe suitable for measurement. Much of the drilled sec-tion not recovered probably is broken and fracturedvolcanic material with some sediment. Thus, the meanphysical properties given may be a poor representationof the average values for the section drilled. Thisproblem has been discussed by Hyndman (this volume).
Histograms showing the distribution of values foreach physical property are given in Figure 1 for thebasalts and the mean values and standard deviationsfor basalts, gabbros, and serpentinized peridotites aregiven in Table 1. The velocity and density results ofTable 1 include data for four gabbros and two serpen-tinites from Christensen (this volume).
For previous general discussions of the physicalproperties of basalts, see Somerton et al. (1963) andNafe and Drake (1968).
BULK AND GRAIN DENSITYThe bulk density was determined onboard ship at at-
mospheric pressure and temperature. The samples(about 50 g) were weighed on a simple Ohaus Cen-togram four-beam scale with a capacity of 311 g and aresolution of 0.01 g. Calibration with standard weightsduring calm seas indicated an accuracy of ±0.02 g. Thereproducibility also is about ±0.02 g. The volumes ofthe samples were determined from the differences inweights in air and suspended in distilled water with athin wire. As a check, the volumes also were deter-mined from the sample dimensions. The latter methodhas lower accuracy. The accuracy of the density deter-minations is about ±0.15% or ±0.005 g/cm3, which isadequate for most purposes. Higher measurement ac-curacy could be obtained with a better balancemounted on gimbals, but the problems of complete
395

R. D. HYNDMAN, M. J. DRURY
PoissorTs Ratio
σ=0.295
TABLE 1Physical Properties of DSDP Leg 37 Rocks
PropertyNumber of
Samples Mean
StandardError of
Mean
StandardDeviationIndividual
Values
(% Volume
Figure 1. Histograms showing frequency of occurrence ofbasalt samples for the physical properties of: bulk andgrain density, porosity, water content, electrical resisti-vity, compressional and shear velocity. The mean valueand number of samples are given for each property.
water saturation and the amount of surface water willlimit the real accuracy. The samples all were seawatersaturated on the assumption that they were in this stateon the sea floor. The water was wiped from the surfaceof the samples and the surface allowed to just dry (a fewminutes) before weighing.
The grain or mineral density of the samples was es-timated using the measured porosity (below). This in-volves simply subtracting the mass and the volume ofthe pore fluid and recomputing the density. Since theporosity must be underestimated, the computed graindensity also will tend to be low. Thus, we estimateasymmetrical error limits of +0.014 to -0.007 g/cm3.
The bulk densities of 101 basalt samples (mainlyfrom Site 332) range from 2.463 g/cm3 for highlyvesicular material to 2.945 g/cm3 for low porositymaterial with a mean and standard deviation of in-dividual values of 2.795 ±0.082 g/cm3 (Figure 1). Tengabbros have a mean of 2.957 ±0.068 g/cm3 and 4serpentinized peridotites 2.713 ±0.087 g/cm3. Thegrain or mineral density of the basalts ranges from2.804 to 3.010 g/cm3 with a mean of 2.949 ±0.045g/cm3. T(his range is considerably smaller than for thebulk density indicating that much of the variation inbulk density arises from variation in porosity ratherthan from differences in mineralogy. Allowing for theunderestimation of the porosity, the true grain densityshould be close to 3.00 g/cm3.
The mean bulk density of 10 gabbros is 2.957 ±0.068g/cm3 and the estimated mean grain density of 4
Basalts
Comp. velocity 79 5.94 0.04 0.34(0.5 kbar)(km/sec) 37 3.27 0.02 0.15Shear velocity(0.5 kbar)(km/sec) 37 0.295 0.002 0.011Poisson's ratioBulk density 101 2.795 0.008 0.082(g/cm3)Grain density 85 2.949 0.005 0.045(g/cm3)Thermal cond. 19 3.97 0.04 0.17(mcal/cm/sec/°C)Porosity 85 7.8 0.4 4.1(% vol)Water content 85 2.7 0.2 1.5(% wt)Elect, resist. 87 220a
(ohm-m)
Gabbros
Comp. velocity 10 7.07 0.05 0.15(0.5 kbar)(km/sec) 10 3.72 0.03 0.11Shear velocity(0.5 kbar)(km/sec) 10 0.310 0.004 0.011Poisson's ratio(0.5 kbar)Bulk density 10 2.957 0.021 0.068(g/cm3)Grain density 4 3.024 0.010 0.020(g/cm3)Thermal cond. 1 5.7(mcal/cm/sec/°C)Porosity 4 1.0 0.2 0.5(% vol)Water content 4 0.37 0.07 0.15(% wt)Elect, resist. 6 1710a
(ohm-m)
Serpentinized Peridotites
Comp. velocity 3 6.18 0.29 0.50(0.5 kbar)(km/sec) 3 2.96 0.13 0.23Shear velocity(0.5 kbar)(km/sec) 3 0.350 0.001 0.002Poisson's ratio(0.5 kbar)Bulk density 5 2.699 0.036 0.081(g/cm3)Grain density 1 2.868(g/cm3)Thermal cond. 1 7.6(mcal/cm/sec/°C)Porosity 1 0.8(% vol)Water content 1 0.3(% wt)Elect, resist. 1 7160(ohm-m)
aGeometric mean.
396

PHYSICAL PROPERTIES OF BASALTS
samples 3.024 ±0.020 g/cm3. Thus, the higher densityof the gabbros compared to the basalts comes primarilyfrom their lower porosity.
The, mean bulk density of five serpentinizedperidotites is 2.699 ±0.081 g/cm3 and the grain densityof one sample 2.868 g/cm3.
POROSITY AND WATER CONTENT
The porosity (percent pore volume) and water con-tent (percent water by weight) was measured byweighing the minicores seawater saturated and afterdrying. The samples are kept as wet as possible afterrecovery so they have close to in situ water content.Some drying of the large cores is necessary for labelingand the cores generally were left in the core laboratoryseveral days before the minicores were drilled.However, as seen from the slow drying of the minicores(see below) appreciable water probably is lost onlyfrom the surface few millimeters and not from the cen-tral part from which the minicores were drilled. Theminicores were kept in seawater. No significant waterappears to be lost by this treatment as the originalweight is similar (and in fact generally greater) to thatafter drying and resaturating by the followingprocedure. The samples are evacuated in a vacuumdesiccator, then immersed in seawater while still undervacuum, and finally squeezed at 1 kbar in a pressurechamber for several hours in a seawater-filled container(less than 25% of the water could be returned to thesamples by the first step, the vacuum soaking which iscommonly used, without the high pressure step).
The samples were dried simply in a vacuum desic-cator sitting on a hot plate, the sample temperature be-ing about 60° to 70°C. Drying was surprisingly slow.Figure 2 shows 18 consecutive weighings during 65 hrof drying for three samples ranging in porosity from 2%to 5%. An asymptote is approached only after about 60hr. To show the drying process more clearly, the per-cent loss in weight also is plotted as a function of thesquare root of time. The loss of material by diffusionfrom a semi-infinite flat surface is proportional to thesquare root of time (no asymptote). Thus, as long asthis plot is linear, the loss of water has not extended to adepth in the sample that is a major fraction of the mini-core radius. The asymptotic approach to the dry weightappears to be quite rapid from the time the plotdeviates from linearity. High porosity samples drymore rapidly than those of low porosity as expected,since high porosity rocks should have higherpermeability. All of the samples were dried for at least72 hr, which should remove at least 90% of the water.We estimate the accuracy of the porosity (percent ofvolume) to be from +0.4 to -0.2 plus +10% to -5% ofvalue. The vacuum drying of the rocks leaves the dis-solved salts behind so a small correction is needed. Wehave corrected for the residual salt assuming an originalsalinity of 35°/oo.
Accurate porosity values are difficult to obtain in lowpermeability rocks. The HΣO~ reported in chemicalanalyses involves nearly complete dehydration, but asignificant part of the rock water may be lost duringcrushing and handling before analysis. In contrast,
332B-3-4, 10-13
20 40 60
Drying time (hours) •JDrying time (hours)
Figure 2. Loss of weight of basalt samples with drying timeat 65 °C with, (a) linear time scale, (b) square root timescale.
whole rocks may start saturated at the initial weighing,but it takes a long time to dry them and pores that arenot connected may never be evacuated. For accurateresults the solid saturated rock must be weighed, thencrushed with no loss of material, and finally dried andreweighed, or alternatively, the saturated rock could becrushed in a sealed container and the contents weighedbefore and after drying. Both procedures are difficult.Our method of weighing the saturated and vacuum-dried minicore seems the simplest procedure, gives suf-ficient accuracy for most purposes, and the sample sub-sequently can be used for other physical propertiesmeasurements.
Our drying at 60°C may partially dehydrate some ofthe clay minerals that occur frequently in the basalts,but the amount of water so lost probably is negligiblesince there are no obvious changes with drying seen inmicroscopic examination except for occasional shrink-ing away from the walls of vesicles of the clay mineralsthat coat them.
The basalt porosities are surprisingly high, 85 sam-ples ranging from 1.7% to 24.5% (Figure 1) with a meanand standard deviation of individual values of 7.8±4.1%. The mean water content (percent weight) is 2.7±1.5%. It should be emphasized, as noted above, thatthe measured samples are representative of not morethan 30% of the drilled section. The remainder, notrecovered in the core, is probably fractured volcanicmaterial which should have much higher large-scaleporosity. In the upper part of layer 2 the porosity maybe over 20%. The volume fraction of vesicles has anaverage similar to the porosity (M.F.J. Flower, per-sonal communication), indicating that most of the porespace in the minicores is in vesicles. The mean mineralor grain density of each sample was determined usingthe measured porosities (see above). There is a smallbut significant correlation between porosity and com-puted grain density. Such a correlation probably is anartifact, which suggests that the porosity of the lowporosity rocks is underestimated. Probably there is asignificant fraction of the pore volume in the low
397
R. D. HYNDMAN, M. J. DRURY
porosity (low permeability) rocks that is not inter-connected and thus is not dried by our procedure. Mostof the pores and cracks in the high porosity vesicularrocks will be interconnected, so they are well dried.There also is the possibility that fine-grained, lowporosity basalts trap significant amounts of gas onsolidification so that some of the pores initially are gasrather than water filled.
The porosity of the gabbros is much lower than thatof the basalts, four samples ranging from 0.8% to 1.7%with a mean of 1.0 ±0.4%. One serpentinized perido-tite has a porosity of 0.8%.
ELECTRICAL RESISTIVITY
Measurements of the electrical resistivity of oceanfloor rocks are useful both for the interpretation of dataof electromagnetic induction in the sea floor and forunderstanding the detailed composition and structureof these rocks. Natural electromagnetic induction hasbeen used to estimate the resistivity with depth beneaththe deep ocean floor (Cox et al., 1970| Greenhouse,1972; Richards, 1970; Schneyer and Fonarev, 1968;Poehls and Von Herzen, 1975) and beneath oceanicislands (Hermance and Garland, 1968; Hermance,1973; Klein, 1971; Elvers et al., 1970; Berdichevskiy andChernyavskiy, 1970). The resistivities found for depthsof a few tens of kilometers generally range between 1and 6000 ohm-m, lower than those for most continentalregions, and much lower than for most dry samples ofprobable oceanic crust and upper mantle rocks (Cox etal., 1970). Some oceanic basalts and ultramafic rocksrecently measured, however, do have appropriately lowresistivities either because of metallic mineral conduc-tion or high porosity filled with low resistivity seawater(Stesky and Brace, 1973; Hyndman and Ade-Hall,1974). In this study we have measured the resistivity ofa large number of samples at atmospheric temperatureand pressure and the variation of several at moderatelyhigh temperatures and pressures.
Electrical Resistivity Versus Porosity and Pressure
The electrical resistivity of seawater (about 0.3 ohm-m) saturated minicores was measured at laboratorytemperature of 22° to 24°C and atmospheric pressureonboard ship. A 50-Hz signal was used which should betoo high for induced polarization effects and too lowfor capacitative effects. We have used a 1.00-v signalapplied across the sample and a precision resistance inseries, that is variable in steps so as to be the same orderof magnitude of resistance as the sample, so there is ap-proximately 0.5 v across the sample. The relativevoltages were measured with a precision digital meter.Electrical contact was made by painting the ends of thesamples with electrically conducting epoxy resin. Theaccuracy of resistance measurement is better than 1%,but variations in the state of the samples, particularly insurface water, make resistivities reproducible only to±10%. The surface water is wiped off and the samplesurface allowed to just dry (a few minutes) before themeasurement.
The basalt resistivities all are very low, ranging from6.3 to 5700 ohm-m with a geometric mean (mean on a
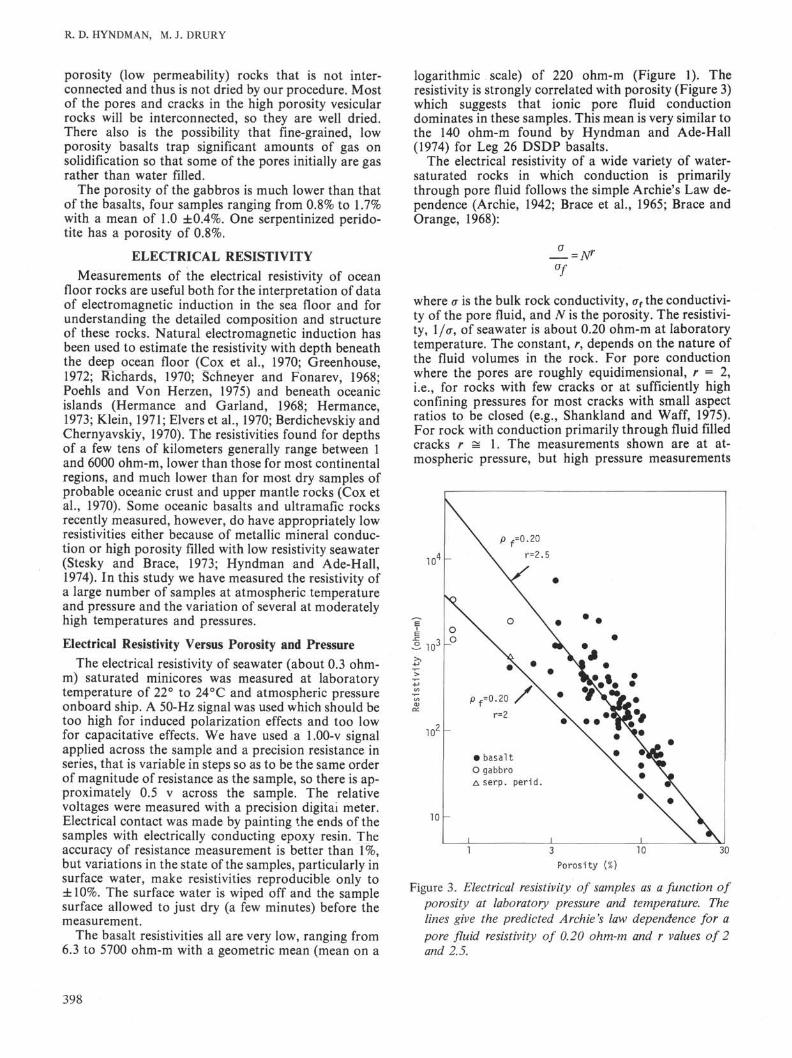
logarithmic scale) of 220 ohm-m (Figure 1). Theresistivity is strongly correlated with porosity (Figure 3)which suggests that ionic pore fluid conductiondominates in these samples. This mean is very similar tothe 140 ohm-m found by Hyndman and Ade-Hall(1974) for Leg 26 DSDP basalts.
The electrical resistivity of a wide variety of water-saturated rocks in which conduction is primarilythrough pore fluid follows the simple Archie's Law de-pendence (Archie, 1942; Brace et al., 1965; Brace andOrange, 1968):
σ
where σ is the bulk rock conductivity, σf the conductivi-ty of the pore fluid, and N is the porosity. The resistivi-ty, 1/σ, of seawater is about 0.20 ohm-m at laboratorytemperature. The constant, r, depends on the nature ofthe fluid volumes in the rock. For pore conductionwhere the pores are roughly equidimensional, r = 2,i.e., for rocks with few cracks or at sufficiently highconfining pressures for most cracks with small aspectratios to be closed (e.g., Shankland and Waff, 1975).For rock with conduction primarily through fluid filledcracks r = \. The measurements shown are at at-mospheric pressure, but high pressure measurements
10
10 -
• basalt
O gabbro
serp. perid.
Porosity {%)
Figure 3. Electrical resistivity of samples as a function ofporosity at laboratory pressure and temperature. Thelines give the predicted Archie's law dependence for apore fluid resistivity of 0.20 ohm-m and r values of 2and 2.5.
398
PHYSICAL PROPERTIES OF BASALTS
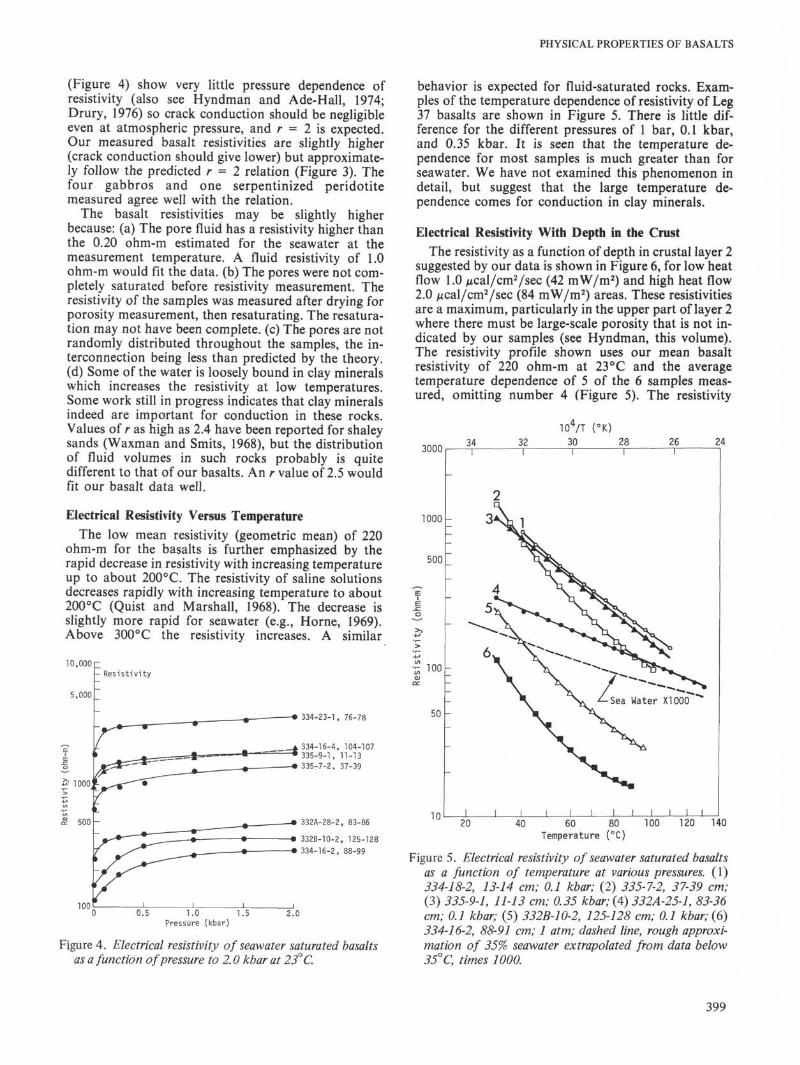
(Figure 4) show very little pressure dependence ofresistivity (also see Hyndman and Ade-Hall, 1974;Drury, 1976) so crack conduction should be negligibleeven at atmospheric pressure, and r = 2 is expected.Our measured basalt resistivities are slightly higher(crack conduction should give lower) but approximate-ly follow the predicted r = 2 relation (Figure 3). Thefour gabbros and one serpentinized peridotitemeasured agree well with the relation.
The basalt resistivities may be slightly higherbecause: (a) The pore fluid has a resistivity higher thanthe 0.20 ohm-m estimated for the seawater at themeasurement temperature. A fluid resistivity of 1.0ohm-m would fit the data, (b) The pores were not com-pletely saturated before resistivity measurement. Theresistivity of the samples was measured after drying forporosity measurement, then resaturating. The resatura-tion may not have been complete, (c) The pores are notrandomly distributed throughout the samples, the in-terconnection being less than predicted by the theory,(d) Some of the water is loosely bound in clay mineralswhich increases the resistivity at low temperatures.Some work still in progress indicates that clay mineralsindeed are important for conduction in these rocks.Values of r as high as 2.4 have been reported for shaleysands (Waxman and Smits, 1968), but the distributionof fluid volumes in such rocks probably is quitedifferent to that of our basalts. An r value of 2.5 wouldfit our basalt data well.
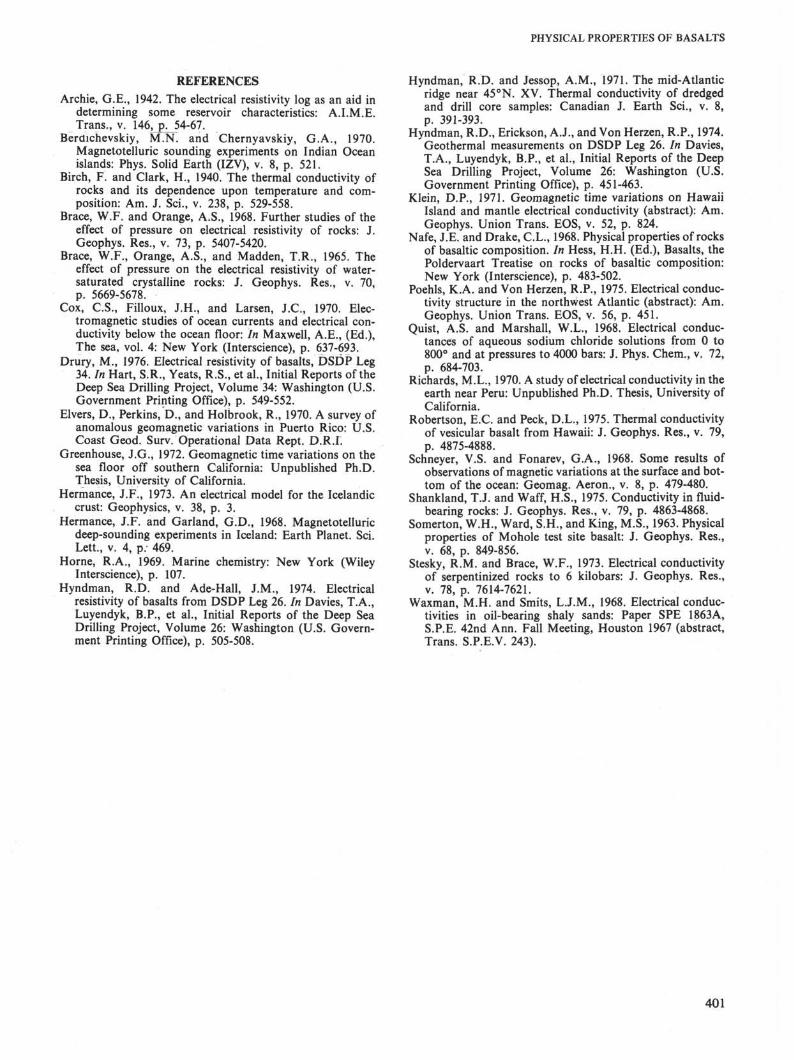
Electrical Resistivity Versus TemperatureThe low mean resistivity (geometric mean) of 220
ohm-m for the basalts is further emphasized by therapid decrease in resistivity with increasing temperatureup to about 200°C. The resistivity of saline solutionsdecreases rapidly with increasing temperature to about200°C (Quist and Marshall, 1968). The decrease isslightly more rapid for seawater (e.g., Home, 1969).Above 300°C the resistivity increases. A similar
0.5 1.0 1.5Pressure (kbar)
334-23-1, 76-78
334-16-4, 104-107335-9-1, 11-13335-7-2, 37-39
332A-28-2, 83-86
332B-10-2, 125-128
• 334-16-2, 88-99
2.0
behavior is expected for fluid-saturated rocks. Exam-ples of the temperature dependence of resistivity of Leg37 basalts are shown in Figure 5. There is little dif-ference for the different pressures of 1 bar, 0.1 kbar,and 0.35 kbar. It is seen that the temperature de-pendence for most samples is much greater than forseawater. We have not examined this phenomenon indetail, but suggest that the large temperature de-pendence comes for conduction in clay minerals.
Electrical Resistivity With Depth in the CrustThe resistivity as a function of depth in crustal layer 2
suggested by our data is shown in Figure 6, for low heatflow 1.0 µcal/cm2/sec (42 mW/m2) and high heat flow2.0 µcal/cm2/sec (84 mW/m2) areas. These resistivitiesare a maximum, particularly in the upper part of layer 2where there must be large-scale porosity that is not in-dicated by our samples (see Hyndman, this volume).The resistivity profile shown uses our mean basaltresistivity of 220 ohm-m at 23 °C and the averagetemperature dependence of 5 of the 6 samples meas-ured, omitting number 4 (Figure 5). The resistivity
3000
1000 -
34
20 40 60 80Temperature (°C)
100 120 140
Figure 4. Electrical resistivity of seawater saturated basaltsas a function of pressure to 2.0 kbar at 23°C.
Figure 5. Electrical resistivity of seawater saturated basaltsas a function of temperature at various pressures. (1)334-18-2, 13-14 cm; 0.1 kbar; (2) 335-7-2, 37-39 cm;(3) 335-9-1, 11-13 cm; 0.35 kbar; {A) 332A-25-1, 83-36cm; 0.1 kbar; (5) 332B-10-2, 125-128 cm; 0.1 kbar; (6)334-16-2, 88-91 cm; 1 atm; dashed line, rough approxi-mation of 35% seawater extrapolated from data below35° C, times 1000.
399

R. D. HYNDMAN, M. J. DRURY
Res is t i v i t y (ohm-m)300 100 30T
10
6 -
Figure 6. Suggested electrical resistivity as a function ofdepth in the oceanic crust for areas of low and high heatflow (1 and 2 µcal/cm^ sec).
profile for layer 3 uses the mean gabbro resistivity at23°C of 1710 ohm-m and assumes the sametemperature dependence as for the basalt.
Our measured resistivities and estimates for the crustmay be compared with the values mainly between 10and 100 ohm-m found from geomagnetic inductionmeasurements at variation periods from 0.5 to 2 hr (seeabove). Variations of these periods and the estimatedresistivities will penetrate (skin depth) from 10 toseveral 100 km depth so, of course, are influenced bythe upper mantle as well as by the crust. The resistivityin the uppermost mantle probably is much higher downto depths of at least several tens of kilometers, becausethere is little water present.
SEISMIC VELOCITYThe laboratory measurements of seismic velocity on
Leg 37 samples are discussed by Hyndman (thisvolume) and Christensen (this volume). A large numberof samples were measured onboard ship to 2.0 kbarpressure. The mean compressional velocity of 79basalts at 0.5 kbar pressure is 5.94 ±0.04 km/sec, themean shear velocity for 37 samples is 3.27 ±0.02km/sec, and the mean Poisson's ratio 0.295 ±0.008.There is a good correlation of increasing velocity withincreasing density. The upper part of layer 2 probablycontains extensive fractured basaltic material, sedi-ment, and large scale voids so the velocity is estimatedto increase from about 3.5 km/sec near the surface toabout 5.5 km/sec below 500 meters depth in regionswith a pronounced layer 2a such as Sites 332 and 333.
The mean velocities and standard error of mean for10 gabbros at 0.5 kbar for compression is 7.07 ±0.05km/sec, for shear is 3.72 ±0.03, and Poisson's ratio is0.310 ±0.04. About 2% of cracks or other water-filledvoids or 10% of 4.5 km/sec material is required to lowerthis compressional velocity to the mean seismic refrac-tion layer 3 velocity of 6.7 km/sec. The higher velocity,higher density, and higher Poisson's ratio of the gab-
bros compared to the basalts appear to arise primarilyfrom the lower porosity of the gabbros.
The mean velocity for three serpentinized peridotitesat 0.5 kbar is for compression, 6.18 ±0.29 km/sec, forshear 2.96 ±0.13, and Poisson's ratio is 0.350 ±0.001.The velocities are somewhat lower and the Poisson'sratios much higher than found by seismic refraction forlayer 3. Thus, serpentinized peridotites probably can beonly a minor constituent of layer 3.
THERMAL CONDUCTIVITYThe thermal conductivity of 21 samples—19 basalts,
1 gabbro, and 1 serpentinized peridotite—were meas-ured by J. Jolivet using a divided bar apparatus. Thedetails are given in Hyndman et al. (this volume). Themean sample temperature was 21 °C and there was anaxial force on disk samples of 75 kg/cm2. The accuracyof individual values is about ±5%. The mean of thebasalts is 3.97 ±0.04 mcal/cm/sec/°C (1.66 ±0.02W/m/K). This value is slightly higher than the mean of3.70 (1.55) for Leg 26 basalts from the Indian Ocean(Hyndman et al., 1974) which have an age of about 100m.y. However, these latter samples show the effects ofsurface weathering. The Leg 37 mean value is similar tothe average of 4.0 (1.7) for basalts from the Mid-Atlantic Ridge near 45°N (Hyndman and Jessop, 1971)and low porosity basalts from Hawaii (Robertson andPeck, 1975). It is slightly lower than a basalt measuredby Somerton et al. (1963). A value of 4.0 (1.7) thusseems representative for young sea floor layer 2 basaltswith older weathered basalts having somewhat lowerconductivity. It should be pointed out, however, thatonly consolidated basalts are recovered in the DSDPdrill core. Up to 50% of the upper part of layer 2 may befractured basalt, sediment, and voids, particularlywhere there is a well-defined low seismic velocity layer2a present. We estimate, for example, a conductivity of3.5 ±0.3 (1.5 ±0.1) for the upper 500 meters at Site 332increasing to 4.0 ±0.2 (1.7 ±0.1) in layer 2b.
The one gabbro measured from Site 334 has a con-ductivity of 5.7 mcal/cm/sec/°C (2.4 W/m/K) which isslightly higher than some previously measured gabbros(e.g., 4.60 [1.93] in Birch and Clark, 1940). Our sampleprobably is less weathered or altered. A conductivity of7.6 (3.2) was obtained for a serpentinized peridotitefrom Site 334 which is higher than for most serpen-tinites (e.g., 4.3 [1.8] for two MAR samples, Hyndmanand Jessop, 1971) which are more completely serpen-tinized. Thus, a conductivity of 5.5 ±0.5 (2.3 ±0.2) is areasonable estimate for layer 3 if it is composedprimarily of gabbro. The conductivity of the lower partof layer 3 may be higher if there is a significant fractionof only partially serpentinized peridotites.
ACKNOWLEDGMENTSMr. R. Iuliucci and the other Deep Sea Drilling Project
technical staff on board D.V. Glomar Challenger provided in-valuable assistance with the shipboard measurements. Finan-cial support for some of the laboratory facilities was pro-vided by the National Research Council of Canada. The workwas done while one of us (R.D. Hyndman) was at Depart-ment of Oceanography, Dalhousie University, Halifax, N.S.,Canada.
400
PHYSICAL PROPERTIES OF BASALTS
REFERENCESArchie, G.E., 1942. The electrical resistivity log as an aid in
determining some reservoir characteristics: A.I.M.E.Trans., v. 146,^^54-67.
Berdichevskiy, M.N. and Chernyavskiy, G.A., 1970.Magnetotelluric sounding experiments on Indian Oceanislands: Phys. Solid Earth (IZV), v. 8, p. 521.
Birch, F. and Clark, H., 1940. The thermal conductivity ofrocks and its dependence upon temperature and com-position: Am. J. Sci., v. 238, p. 529-558.
Brace, W.F. and Orange, A.S., 1968. Further studies of theeffect of pressure on electrical resistivity of rocks: J.Geophys. Res., v. 73, p. 5407-5420.
Brace, W.F., Orange, A.S., and Madden, T.R., 1965. Theeffect of pressure on the electrical resistivity of water-saturated crystalline rocks: J. Geophys. Res., v. 70,p. 5669-5678.
Cox, C.S., Filloux, J.H., and Larsen, J.C., 1970. Elec-tromagnetic studies of ocean currents and electrical con-ductivity below the ocean floor: In Maxwell, A.E., (Ed.),The sea, vol. 4: New York (Interscience), p. 637-693.
Drury, M., 1976. Electrical resistivity of basalts, DSDP Leg34. In Hart, S.R., Yeats, R.S., et al., Initial Reports of theDeep Sea Drilling Project, Volume 34: Washington (U.S.Government Printing Office), p. 549-552.
Elvers, D., Perkins, D., and Holbrook, R., 1970. A survey ofanomalous geomagnetic variations in Puerto Rico: U.S.Coast Geod. Surv. Operational Data Rept. D.R.I.
Greenhouse, J.G., 1972. Geomagnetic time variations on thesea floor off southern California: Unpublished Ph.D.Thesis, University of California.
Hermance, J.F., 1973. An electrical model for the Icelandiccrust: Geophysics, v. 38, p. 3.
Hermance, J.F. and Garland, G.D., 1968. Magnetotelluricdeep-sounding experiments in Iceland: Earth Planet. Sci.Lett., v. 4, p. 469.
Home, R.A., 1969. Marine chemistry: New York (WileyInterscience), p. 107.
Hyndman, R.D. and Ade-Hall, J.M., 1974. Electricalresistivity of basalts from DSDP Leg 26. In Davies, T.A.,Luyendyk, B.P., et al., Initial Reports of the Deep SeaDrilling Project, Volume 26: Washington (U.S. Govern-ment Printing Office), p. 505-508.
Hyndman, R.D. and Jessop, A.M., 1971. The mid-Atlanticridge near 45°N. XV. Thermal conductivity of dredgedand drill core samples: Canadian J. Earth Sci., v. 8,p. 391-393.
Hyndman, R.D., Erickson, A.J., and Von Herzen, R.P., 1974.Geothermal measurements on DSDP Leg 26. In Davies,T.A., Luyendyk, B.P., et al., Initial Reports of the DeepSea Drilling Project, Volume 26: Washington (U.S.Government Printing Office), p. 451-463.
Klein, D.P., 1971. Geomagnetic time variations on HawaiiIsland and mantle electrical conductivity (abstract): Am.Geophys. Union Trans. EOS, v. 52, p. 824.
Nafe, J.E. and Drake, C.L., 1968. Physical properties of rocksof basaltic composition. In Hess, H.H. (Ed.), Basalts, thePoldervaart Treatise on rocks of basaltic composition:New York (Interscience), p. 483-502.
Poehls, K.A. and Von Herzen, R.P., 1975. Electrical conduc-tivity structure in the northwest Atlantic (abstract): Am.Geophys. Union Trans. EOS, v. 56, p. 451.
Quist, A.S. and Marshall, W.L., 1968. Electrical conduc-tances of aqueous sodium chloride solutions from 0 to800° and at pressures to 4000 bars: J. Phys. Chem., v. 72,p. 684-703.
Richards, ML., 1970. A study of electrical conductivity in theearth near Peru: Unpublished Ph.D. Thesis, University ofCalifornia.
Robertson, E.C. and Peck, D.L., 1975. Thermal conductivityof vesicular basalt from Hawaii: J. Geophys. Res., v. 79,p. 4875-4888.
Schneyer, V.S. and Fonarev, G.A., 1968. Some results ofobservations of magnetic variations at the surface and bot-tom of the ocean: Geomag. Aeron., v. 8, p. 479-480.
Shankland, T.J. and Waff, H.S., 1975. Conductivity in fluid-bearing rocks: J. Geophys. Res., v. 79, p. 4863-4868.
Somerton, W.H., Ward, S.H., and King, M.S., 1963. Physicalproperties of Mohole test site basalt: J. Geophys. Res.,v. 68, p. 849-856.
Stesky, R.M. and Brace, W.F., 1973. Electrical conductivityof serpentinized rocks to 6 kilobars: J. Geophys. Res.,v. 78, p. 7614-7621.
Waxman, M.H. and Smits, L.J.M., 1968. Electrical conduc-tivities in oil-bearing shaly sands: Paper SPE 1863A,S.P.E. 42nd Ann. Fall Meeting, Houston 1967 (abstract,Trans. S.P.E.V. 243).
401