from each state office by the states and reports districts
TRANSCRIPT

=NW.
DOCV4FNT RFSl'MF
ED 023 886 08
By Schill, Wham JohnConcurrent Work -Education, Programs in the 50 States, 1965 -66.Spons Agency -Of fice of Education (DHEW), Washington, D C.
Bureau No -BR -6 -2851Grant -OEG -1 -7 -062851 -3533Note -118p.EDRS Price MF -41.0 50 HC -$600Descriptors -Business Education, Cooperative Education, Cooperative Programs, Distributive Education,
Expenditures, High Schools, *National Surveys, Post Secondary Education, Program Administration, Program
Descriptions, Program Effectiveness, Student Enrollment, 'Trade and rndustrial Education, Vocational
Agriculture, *Vocational Education, *Work Experience Programs, *Work Study Programs
To describe concurrent work-education programs in each of the 50 states, data
were solicited from each state office by personal visit and from individual school
districts by mailed questionnaire. Reports were made to the US. Office of Education by
the states and reports made by individual school districts to state offices wereutilized. Some findings were:(1) Mode enrollment in distributive education programs was20 students, with a significant portion of the programs clustered in cities over 50000,
(2) The mode enrollment in business education programs was 18 students with
programs concentrated in cities over 50000 population, (3) The mode enrollment in
trade and industrial cooperative programs was 25 students concentrated primarily in
industrial centers, (4) Diversified occupations showed no relationship to populationdensity and showed a mode student enrollment of 25, (5) 75 percent of thecooperative agriculture programs enrolled 12 or fewer students, (6) There were 2451
schools with cooperative programs but no work study programs, and 1823 schoolswith work study programs and no cooperative programs, and (7) Two-thirds of theschools with cooperative work-education programs had only one offering.Descriptionsof student and program characteristics and a bibliography are included. A preliminary
draft is available at VT 003 561. (DM)
VT 006 911

U.S. DEPARTMENT OF HEALTH, EDUCATION & WELFARE
OFFICE OF EDUCATION
THIS DOCUMENT HAS 3EEN REPRODUCED EXACTLY AS RECEIVED FROM THE
PERSON OR ORGANIZATION ORIGINATING IT. POINTS OF VIEW OR OPINIONS
STATED DO NOT NECESSARILY REPRESENT OFFICIAL OFFICE OF EDUCATION
POSITION OR POLICY.
37f-R/9 -or
CONCURRENTiProo,ram 30 F.2...!-,atis,:s '6.6)
byWilliam John SchillAssociate ProfessorUnive.rsity of Washington
E-1
. Q.V. Projecr; 6-2851. report

ACKNOWLMONIMITS
Four bright energetic yourg uen who Gre doctoral cerclidates at the
University of Illinois were employed on this research project. It seems
to the author to be almost needless to sty that their contribttim VAL
essential to the satisfactory completion of the project. Without excep-
tion, they gave of their time and their energies beyond the requiremsnts
of the modest stipend they received from tha University of Illinois.
These four men were James E. Gallagher, Thomas R. Jensen, Menno DiLlberto,
and J. William Ullery. To each of them I 6vAnoziledge a debt of gratitude
for their contribution to the succesnftl completion of this project.
The state office personnel in the various states are to be
acknowledged also for their ready cooperation with the research staff
when we arrived at their office to solicit data on concurrent work-
education programs.
Thanks to Dean Rupert EVans for reading the discussion draft and
identifying redundant and inconsistent statements. Thanks also to
Professor Elizabeth Simpson for calling attention to an oversight in
home economics cooperative programs. Of the fifty state directors w.no
received a discussion copy of this report, only five acknowledged having
read it; to them I am grateful.
Last but not least, we must acknowledge the efforts of the office
staff (most of whom were undergraduate girls at the University of Illinois)
vilo were of invaluable assistance throughout the project. 7 mmst especially
acknowledo, in this area, Miss Anita Tripp.
William John SchillAssociate ?rofessor

TABLE or ODNTENTS
CONCUEREM WORK-a0VCATION EIDGRO,IN IN THE UNITED STATES 1965-1966
ACknOrta.td!..., MOritat
CHAPTER;
I. Irtmkuction
A, Cooperative Education
B. Work-Study
. Conourrent Work-Education
;). Methodology
1. Data Collection Procedureo
2. Variables and Coding Procedures
Organization of the Report
II. iork-Study
c. Conditions Set by Public Law 88-210
I. Work-Study Programs among the States
Expenditures on Work-Study
Schools with Work-Study Programs
.4. Enrollment in Work-Study Programs
F. Questionnaire Responses on Work-Study
III. :ooperative Work-Education
A. Objectives and Conditions:
B. Cooperative Work-Education Programa mong the States
C. Schools with Cooperative Work-Education Programs
D. Enrollment ie Cooperative Work-Education Programs
E. Questionnaire Responsea on Cooperative Work-Education
IV, Summary
V Discusvion and Intrepretation
Vt. Characteriotics of Students and Programs
ippendiciesAppendix I - Tables
Appendix II - Forms and Instruments
Bibliography

CHAPTER
INTRODUCTION

Introduction / 1
The data presente0. in this re-oort reprments txTo distinct aspects
of vocational education: those progrons that we have troically called
cooperative prograns and Work-Study as defined in section 13 of Public
Law 88-210. Some of the points to be made ebout cooperative education
may sound truistic to vocational educatore; be that as it may, it is
noted that the daba which are presented sedeetantiate these truths.
would cite the following in this category: Distributive Education has
the greatest =Jeer of cooperative peogramo and the greatest nuMber of
students in each and every state. Relatie newcomers to cooperative
education are Agriculture Education and Feete Economics. To Home
Economics the entire concept of occupational preparation and cooperative
education is new. To Agriculture the cocpezative education concept is
a modification or replacement of the traditional on-the-farm project
method of providing the student vith work experience. Between Distribu-
tive Education and the newcomers,are such areas as Trade and Industrial
Education and Diversified Occupeeeions; these have a few years experience
with cooperative education. In some states, notably Louisiana, labor
pressures have forced the discentinuatfi.on of cooperative programs that
involve the industrial occupations. Neverthe3ess, the over-all trend
is for an increase in the number of programe tnd in the number of
students in each program across all the feeeas of vocational education.
2255512:11mEducation
Cooperative education, a program wherein the students work part-
time and study in a formal classroom setting part-time, is of long

Introduction / 2
standinE in United States plblic edecatLen. Althow;h the genesis of this
program came f2'am the Uziveesity of Cincinnati az tete t-xen of zhe century
and was related pieWetrily to engiaelving educAticn, It has grovn to be
popular n other fields of pl2Wic edueat4%.
One of the desirable aspects of cou2erative edueation i3 that
education and vork ceese to be mutually exclusive of each other. There
is some werk involved in education; and it is readily recognized that
there is some education in pork. Although it has not been pinpointed
(and this study will na'; attempt to pinpeielt it), it has been hypothesized
that theTe is considerably more att.Itude formation in the work environment
than there is In the educaUonal environraent, at /east attitude formation
in terms of socially neceesary attitudes for continued employment.
It must be recognized at the outset tl-at one of the conditions that
mitigates against rapid growth of cooperative education is the amcunt of
effort necessary on the part of the pro.Zessional staff in each school
needed to locate employment stations and ay:range working conditions for
the students. Sometimes these arrangements have to be made over the
objections of labor unions and in spi.te of consiierable reluctance on
the part of employers.
Work-Stu&
The Vocational Education Act of 1963, Public Law 88-210, had in it
a section vhereln the federal government would reimburse schools for
employing students part-time in order to permit them to remain in school.
The assumption herein is that there are a number of students from low-
income families that could not remain in school unless they were able to

Introduction / 3
earn a modest salary every month. During the year for which data are
reported in this study, school year 1965-66, the federal government
reimbuxsed the school districts (via the state offices) for the total
expenditures in Wbrk-Study. The total aperopriation for Work-Study vas
modest in comparison to the amount of money spent for the school lunch
program and other federally supported programs; but it Tras sufficient
to generate a considerable amount of activity in the local school
district!t The term Work-Stuey has connotations other than the one
used in the Vocational Act of 463; it is used in higher education acts
and IA; used in various fashions by local districts. For the purpose of
this study, only Work-Study' in vocational education is included.
Concurrent Work-Education
The title of the report, Concurrent Work-Education Programs, is
an attempt to use a term which is comprehensive enough to include a
variety of vocational education activities. The tenm "concurrent work-
education programs" includes all pUblic high school and junior college
programs that provide students with fOrmal education and conjunctive
vork experience. This definition is broad enough to include programs
encompassed by various other general titles in common usage such as
Cooperative Education, Work Education, and Work Experience. More
specific titles within the realm of concurrent work-education programs
include: Distributive Education (D.E.), Office Occmpations (0.0.),
Diversified Occupations (D.O.), and many other but usually less
universal titles such as Part-Time Industrial Cooperative Education
and Agri-Business. Differences in usage of terminology did not eliminate
programs from this study.

Introduction 4
Methodoioa
This report is basicni4 E. descriptive reDort of the conduct or
status of concurrent vork-edwation programs (as per the dbove description)
in each of the fifty states. The data were solicited from each of the
state offices via personal visits to the states and from individual school
districts via mailed questionnaire. It is recognized that each state
submits a statistical report and a descriptive report to USOE every year
concerning their programs. However, USOE is generally three years behind
in processing these reports; and even then they are of necessity very
brief and concern themselves mainly with the expenditures of federal
monies. This report concerns itself primarily with the activities in
which the students become involved.
Data Collection Procedures. Typically, the research staff arrived
at the state department of education unannounced. The state superintendent
and the state director of vocational education were contacted in that
order and their approval for data collection was always readily givan.
Early attempts to set up appointments for data collection proved to
be ineffectual since many of the vocational education staff spend much
of their time in the field. Further, the information needed was always
available from the secretarial staff and did not require the presence of
area supervisors. This vas the case not only with vocational education,
but also with the superintendent's office from which general data about
the schools in the state were Obtained.
The data collection procedure involved the use of the reports made
to USOE and in addition, and of considerable more importance, the reports
VeYA-Ou

Introduction / 5
made by the individual school districts to the state office. In instances
where the school reports to the state offices were missing, the project
staff solicited this information directly from the schools. The absences
of reports from the schools most oftln resulted from large cities within
the state taactioning relatively independently of the state office. A case
in point would be New York City which submits only gross reports to the
state office in Albany.
The state superintendent's office usually had certain information
desired by this project in published form, and occasionally the vocational
education office had some of the information in published form; but most
of the information had to be duplicated by the research staff.
In order to give some flavor to this report and better enable the
author to present accurate descriptions of vocational education in each
state, copies of the state plan for vocational education, annual descrip-
tive reports, coordinators' handbooks and similar state publications were
collected.
The questionnaire data to be reported herein were solicited from a
random sample of the public high schools, junior colleges, and post-high
school vocational schools via the mail. The sample was selected prior to
the visits to the state offices so that general data 7ould include those
schools in the sample whether or not they had concurrent work-education
programa plus all other schools which had concurrent work-education
programs.
It has been hypothesized for many years that there are two kinds of
vocational education programs. There are those that receive reimbursement

Introduction / 6
for a portion of the cost from federal funds (data on these are senerallt
conceived to be readily available); then there are others that are reim-
bursable for which the school elects not to claim reimbursement. As the
consequence, there is no statewide or nationwide information available
on non-reimbursdble programs. One of the functions of the data collected
on the random sample was to test this hypothesis.
Whereas, the data collection from the state offices required only
that the project staff know precisely what it was they wanted and the
appropriate offices to visit to get the information, the mailed questionnaire
required careful development and two pilot studies to insure prompt, caa-
plete returrm with reliable and valid responses.
In an attempt to insure a high percentage of response, the initial
questionnaire required only the return of a self-addressed postcard (this
instrument and all others appear in the appendix). The response solicited
on this postcard was merely a Check to indicate whether or not a given
school had a reimbursed concurrent work-education and/or non-reinbursed
OWE program. It le obvious that the collection of information about
reimbursed programs was redundant since this information is available
from the state offices. The advantage of the redundancy is that it
provided a built-in reliability check.
Indiana vas used for the first pilot study on the questionnaire.
Each of the administrators who did not return the questionnaire VAS called
to determine why he did not respond. Each was encouraged to be as candid
as possible and care was taken to develop sufficient rapport. No less
than 21 of the administrators said they "did not receive the letter or
did not remember receiving it." Their replies were the only evidence

Intlooduction / 7
available and force0 the conclusion that somehow the questionnaire was not
reaching the addressee (or his attention). Consequently, the revision
dictated was to print "ATTENTION OF PRESEr HIGH SCHOOL ADMINISTRATOR"
below the name and address on each envelope. The opening paragraph was
revised and a quick re-mailing for non-respondents was planned. The second
mailing (typical practice in mailed questionnaires) is based on the
hypothesis that administrators inadvertently and intentionally consign
some of their mail to the "this can wait pile" without inspection. The
hope is that administrators will not be dead-ending quite as much mail
on the day they receive the second mailing.
The Indiana pilot gave no evidence that the use of a postcard for
return enhanced the return. As a consequence the second pilot on the
questionnaire (sent to schools in Illinois) omitted the postcard and
inserted instead a self-addressed envelope for returning the one page
questionnaire. A second mailing and phone calls were both used with the
non-respondents in the Illinois pilot. The phone calls led the project
staff to conclude that the questionnaire was sufficiently refined for
nationwide mailing. (The phone calls to non-respondents in Indiana and
Illinois account for the one hundred percent return report for those two
states.)
Variables, Coding., and Rationale. Consistent with this author's
feelings about the function of research in relation to the graduate
students employed, much of the data collected via the mailed questionnaire
(see the appendix) and much of the information collected at state offices
was for the benefit of the graduate students and not directly related to
this report. The additions requested by the graduate students were

MEP
Introduction / 8
honored in all cases in which :ale additions did not impose a hardship on
the project or detract from the pousibility of satisfactory returns.
The doctoral candidates employed on this project satisfied the
requirement of doing independent research 'while gaining an apprenticeship
via sponsored research. The project research aud the research of the
doctoral candidates were independent but related and any data collected
for the candidates were collected without cost to the project.
The variables discussed in this section will be only those directly
related to this report. MuCh of the information collected by the project
staff 4ll not be reported herein due to limitations in funds which pro-
hibit detailed analysis of individual student data. (The funds for this
project were cut 57% as the result of unexpectedly small congressional
appropriations for vocational education research.)
Size of School: USOE collects and tabulates enrollment figures
for schools such as junior colleges and area vocational schools. It is
possible from published reports to get a picture of the relative size
of these programs across the various states. However, this is not the
case with high schools. There area variety of high school organizations
ranging from six-year schools to two-year schools. In order to have a
uniform assessment of the student body size, this project tabulated the
enrollment figures in grades ten, eleven, and twelve exclusively. The
intent of this data was to differentiate as accurately as possible among
schools by the size of student body. It vas expected that the size of
the student body would have an influence upon the number or programs
that the school could offer. The reason for selecting the enrollments

Introduction / 9
in grades ten, elevens and twelve was to permit some consistency across
all schools. There are a variety of school organizations ranging from
those that include grades seven through twelve to those that include
grades ten, eleven, and twelve only. In addition to the desire to be
consistent in the interpretation of the size of the student body, there
was also the recognition that CWE programs are by and large restricted
to tenth, eleventh, and twelfth graders; in fact, they are restricted
to twelfth graders only in many high schools.
As vas mentioned dbove, it was expected that the size of the student
body would have an influence on the offerings in the school. It was
also expected that the organization of the district and of the school
could have some effect upon the breadth of offerings. CWE programs are
not easy to organize, develop, and maintain. It was hypothesized that
the greater the range of administrative responsibility, the less likely
that there would be CWE programs; for example, a school district where
the superintendent is responsible for grades K through twelve might be
less likely to have CWE programs than would a high school district where
both the superintendent and principal had the administrative responsibility
for grades ten, eleven, and twelve only. It was not expected that this
scope of administrative responsibility would carrr over to post4ligh
school institutions, because they are unique in cOmparison to the high
schools. The breadth of administrative responsibility in post-high
school institutions is more commonly related to the objective of the
institution; that is to say, area vocational schools have more precise
and limited objectives than do the community colleges. For the above
reasons the lowest and highest grades in the district and in the high
school were recorded for each school in the study.

Introduction / 10
Enrollments in CWE Programs: The heart of this report involves
the data collected about students enrolled in concurrent work-education
programs. These data included (wherever possible) age, sex, grade, jOb
assignment activities, and the hourly wage. It should be noted here that
hourl,y wage vas seen as an essential element in the work assessment. It
is the conviction of the research staff that in order for a student to
have a bonafide job experience, he needs to be working for an hourly wage
and have the concomitant productive responsibility and accountability.
This, of course, eliminates from this study project-oriented programs
such as those conducted by Agriculture Education where the student works
on the family farm and ends up selling the.pig. Individuals and groups
within otherwise acceptable CWE programs who were involved in the project-
oriented programs were eliminated also.
Anyone inspecting our data on the limber of Work-Study students
and comparing it with the number of students reported by each state to
the United States Office of Education, will find the "N" reported herein
greatly depressed in comparison. The explanation of this difference is
rather straightforward. This project assumed that the number of students
actively involved in Work-Study at the time (at the end of the spring
semester 1966) the data were collected would approximate the average
daily number of students in Work-Study. It is not atypical for students
to enter and drop out of Work-Study continuously through the year.
States report the number of students who were involved regardless of the
length of tine they spend in the program.

Introduction / 11
Summer Work-Study programs occasionally have a far greater enrollmant
than the regular semester programa, and the aummer programs for 1966
were reported for the fiscal year 1966. The research project ignores
summer programs and this again contributed to the difference in "N"
between our report and USOE reports. I would defend the project "N" used
as more accurate and defensible than the USOE "N", because the "N" reported
herein more closely approximates the average daily student membership
in Work-Study throughout the 1965-66 school year.
Financing the Instructional Programs: In addition to the financial
data available from the annual reports made to USOE, which give a rather
detailed breakdown of the distribution of federal funds for vocational
education, it was considered necessary to make an assessment of the
financial capability of the individual schools. The predominant reason
given for limited offerings particularly in vocational education is the
lack of funds. Consequently, it was deemed necessary to make some evalua-
tion of the money available for instructional purposes for each of the
schools included in the study. This was accomplished in the following
way: The states were ranked from one through fifty on the basis of data
anakyzed by the National Education Association. The differentiation
within states was in terms of high, medium, and low categorization of
the money available for instruction. The data used was dependent upon
what was available from the individual state offices. When available,
the average daily costs for instruction (not including capital outlays,
debt retirement, and transportation) was used to divide the schools in
the state into the three aforementioned categories. In instances where

SNIP
Introduction / 12
these data were not available more gross measures had to be utilized.
The research staff is confident that as the result, we have the states
ranked in terms of finances available for instruction and the schools
within the states categorized on a similex basis.
Population Density: The states spend a coasiderable amount of
time preparing reports for USOE on students enrolled in vocational educa-
tion programs, but the identity of the individual schools is lost. In
this study the identity was retainea so that an assessment could be made
of the population density of the area in which the schools were located.
It vas felt that to identify a hig4 school, area school, or community
college as residing within a given state was not sufficiently discriminating
for the purpose of this study, since the variance within states almost
equals the variance across states in terns of population density. For
this reason, in addition to identifying each school within the sample and
each school with CWE programs with their respective state, they were
also identitied with the city in which the school resided; and from this,
it was possible to determine the population density of the area in which
the school was located. The population density was coded according to
the following criteria: The code of "1" was given those schools in the
25 large cities of the United States as identified by the Bureau of
Census. These, of course, upon occasion, are more than one political
entity such as the Minneapolis-St. Paul area. The code of "2" was
assigned to the Standard Metropolitan Areas which also include upon
occasion more than one political entity such as the Allentown-Bethlehem-
Easton area of Pennsylvania. The code of "3" was assigned to cities

Introduction / 13
over 50,000 that were not Standard Metroaolitan Statistical Areas as
per the census. A "4" was asoigned to cities between 25,000 and 49,999;
"5" to cities between 10,000 and 24,999., "6" to cities between 5,000
and 9,999; and "7" to those under 5,000. The intent of coding the
school location by population density waa to differentiate (although in
a gross fashion) the large industrial complex from the smaller school
locations, because it was felt that placement opportunities in cooper,-
ative programs might well be related to this factor.
Non-ReiMbursed Programs: The intent of the questionnaire was to
discover whether or not schools in the random sample had CWE programs
which were reimbursable but for which they did not request reiMbursement.
This required that the respondents be given a definition sufficiently
precise to permit them to interpret their offerings. All other questions
on the questionnaire were either redundant in light of data available
from the state office (as mentioned before) or were included as a service
to the graduate students employed on the project.
Organization of the Repozt
About 1960, it was reported that there were over 1,500 concurrent
vork-education programs among 27,000 pUblic high schools and an unknown
nuniber of programs in the more than 500 junior colleges in the United
States. CWE data and methods of collection and reporting data differ
from state to state. This report will attempt to systematize and con-
solodate the data that exist relative to concurrent work-education
programs in the various governmental offices throughout the 50 states.

Introduction / 14
The data collection relative to concurrent work-education programs
from the states and schools was considered to be slightly independent of
data collection via mail questionnaires to the random sample; and as the
consequence, these two shall be treated independent4 in each phase of
the report. In addition, since the phase of concurrent work-education
programs typically considered cooperative education, differs significantly
from work-education programs supported under Section 13 of Pnblic Law
88-210, these will be treated independently also.

CHAPTIM II
WORK-STUDY
777-

Chapter II - Work rtudy 16
Conditions Set by_Public Law 88-210
The simplest way to describe the conditions under which Work-StudY
programs can be operated is to quete from the Law1. These stipulations
are as follows:
Work-Study Programs for Vocational Education Students
Sec. 13. (a) (1) From the sums approprlaeed pursuant tosection 15 and determined to be far the purposes of this sectionfor each fiscal year, the Commissioner shall allot to each Statean amount which bears the same ratio to the SUM3 so determinedfor such year as the population aged fifteen to twenty, inclusive,of the State, in the preceding fiscal year bears to the populationaged fifteen to twenty, inclusive, of all the States in such pre-preceding year.
(2) The amount of ary State's allotment under paragraph(1) for any fiscal year which the Commissioner determines will notbe required for such fiscal year for carrying out the State's planapproved under subsection (b) shall be available for reallotmentfrom time to time, on such dates during such year as the Commis-sioner may fix, to other Statee in proportion to the originalallotments to such States under paragraph (1) for such year, Letwith such proportionate amount foe any of sueh other States beingreduced to the extent it exceeds ehe sum the Cemmissioner estimatessuch State needs and will ix able to use for such year and teetotal of sucll reductions shall be similarly reallotted among theStates not suffering such a reduction. Any amount reallotted toa State under teals parelgraph during such year shall be deemed partof its allotment for such year.
(b) To be eligible to participate in this section, a Statemust have in effect a plan approved under section 5 and must sub-mit through its State board to the Commissioner a supplement tosuch plan (hereinafter referred to as a "supplementary plan"),in such detail as the Commissioner determines necessary, which--
(1) designates the State board az the sole agency foradministration of the supplementary plan, or for supervisionof the administration thereof by local educational agencies;
(2) sets forth the policies and procedures to be followedby the State in approving work-study programs, under whichpolicies and procedures funds paid to the State from iteallotment under subsection (a) will be expended solely forthe payment or compensation of students employed pursuantto work-study programs which meet the requirements of sub-section.(c), except that not to exceed 1 per eentum of anysuch allotment, or $101000, whichever is the greater, may beused to pay the cost of developing the State's supplementaryplan and the cost of administering Buell supplementary planafter its approval under this section;

Chapter 11 - Work-Study 17
(3) sets forth principles for determining the priority tobe accorded applications from local educational agencies forwork-study programs, which principles shall give preferenceto applications submitted 'by local educational agencies servingcommunities having substantial numbers of youths who havedropped out of school or whe are unemployed, and provided forundertaking such programs, insofar as financial resourcesavailable therefor make possible, in the order determined bythe application of such principles;
(4) sets forth such fincal control and fund accountingprocedures as may be necessary to assure proper disbursementof, and accounting for, Federal funds paid to the State(including such funds paid by the State to local educationalagencies) under this section;
(5) provides for making such reports in such form andcontaining such information as the Commissioner may reasondblyrequire to carry out his functions under this section, and forkeeping such records and for affording such access thereto asthe Commissioner may find necessary to assure the correctnessand verification of such reports.
(c) For the purposes of this section, a work-study programshall --
(1) be administered by the local educational agency andmade reasonably available (to the extent of available funds)to all youths in the area seTved by such agency who are ableto meet the requirements of paragraph (2);
(2) provide that employment under such work-study programshall be furnished only to a student who (A) has beenaccepted for enrollment as a full-time student in a vocationaleducation program which meeta the standards prescribed bythe State board and the local educational agency for voca-tional education programs assisted under the precedingsections of this part, or in the case of a student alreadyenrolled in such a Drogram, is in good standing and infull-time attendance, (B) is in need of the earnings fromsuch employment to commence or continue his vocationaleducation program, and (C) is at least fifteen years of ageand less than twenty-one years of age at the commencementof his employment, and is capable, in the opinion of theappropriate school authorities, of maintaining good standingin his vocational education program while employed under thework-study program;
(3) provide that no student shall be employed under suchwork-study program for more than fifteen hours in any weekin which classes in which he is enrolled are in (session, orfor compensation which exceeds $45 in any month or $350 inany academic year or its equivalent, unless the student isattending a school which is not within reasonable commutingdistance from his home, in which case his compensation maynot exceed $60 in any month or $500 in any academic year orits equivalent;

Chapter II - Work-Study / 18
(4) provide that employment under such work-study programshall be for the local educational agency or for some otherpublic agency or institution;
(5) provide that, in each fiscal year during which suchprogram remains in effect, such agency shall expend (fromsources other than payments from Federal funds under thissection) for the employment of ita students (whether or notin employment eligible for assistance under this section) anamount that is not less than its average annual expenditurefor work-study programs of a similar character during thethree fiscal years preceding the fiscal year in which itswork-study program under this section is approved.
(d) Subsections (b), (c), and (d) of section 5 (pertainingto the approval of State plans, the withholding of Federal pay-ments in case of nonconformity after approval, and judicial re-view of the Commissioner's final actions in disapproving a Stateplan er withholding payments) shall be applicable to the Commis-sioner's actions with respect to supplementary plans under this
section.
(e) From a State's allotment under this section for thefiscal year ending June 30, 1965, and for the fiscal year endingJune 30, 1966, the Commissioner shall pay to such State an amountequal to the amount expended for compensation of students employedpursuant to work-study programs under the State's supplementaryplan approved under this section, plus an amount, not to exceed1 per centum of such allotment, or $10,000, whichever is the greater,for the administration of such plan after its approvsl by the
Commissioner. From a State's allotment under this section fortale fiscal year ending June 30, 1967, and for the next succeedingfiscal year, such payment shall equal 75 per centum of the amountso expended. No State shall receive payments under this sectionfor any fiscal year in excess of its allotment under subsection(a) for such fiscal year.
(f) Such paymente (adjusted on account of overpayments orunderpayments previously made) shall be made by the Commissionerin advance on the basis of such estimates, in such installments,and at such times, as may be reasonably required for expendituresby the States of the funds allotted under subsection (a).
(g) Students employed insection shall not by reason ofof the United States, or theirpurpose.
work-study programs under thissuch employment be deemed employeesservice Federal service, for any

Chapter I/ - Work-Sbudy / 19
among States
It was not the intent of this study to collect data about the
intent of school districts to maintain or expand concurrent Work-Study
programs; however, the unsolicited comments are worth reporting prior
to reporting on the data.
To generalize across the states, it seems fair to say that there
is a concentrated effort to expand concurrent work-education programs.
This requires an investment of time t4 gain employment stations and to
overcome difficulties with labor unioa restrictions; but the investment
is made by individual teachers, often at the expense of their free time.
Work-Study with its "make wrrk" provisions is a different story. The
states and the schools had great hope for this provision of PUblic
Lor 88-210, but no money to finance it. nerefore, it was expected
that the required local contribution of 25% would bring about a decline
in emphasis during the 1966-1967 school year. Questionnaire results
showed a decline in the number of schools with Work Study for only
five states, 30 shoved an increase and 15 remained the same. There
was a nationwide growth of 5.3% in t).1 number of schools with work-
study programs.
This was the first time vocational education money went to the
student. It provided spending money, and more often than not provided
schools and teachers with much needed assistance. Experience as a
teacher's assistant may have induced many youngsters to consider
teaching as their lifesawork.

Chapter II - Work-Study / 20
A federal spending program that eontributes almost all of the
costs for roads, dams, etc., should be dble to support (ever so modestly)
the greatest resource of all--students. To support students within the
social system of the school seems more defensfble than to remove them
(via the job corps) or engage them in social problems (via the N.Y.C.)
with which they are already overburdened. It is pleasant to report that
in pUblic vocational edmation, the programa that are propoted by full
federal support do not vanish as soon as the state or local. educational
agency is required to make a financial', contribution.
ft_enditui_lorkrEtudy
During the school year, the 50 states spent in excess of $757
million on vocational education, of which slightly over $2211 Wall.= came
from the federal government. Of the money that came from the federal
government, slightly over $20 million was spent on Work-Study. Another
way of statiug this would be that, of the total amount of money spent
fOr vocational education among the 50 states, 29.7% came from the
federal government; and the expenditures on Work-Study represent nine
percent of this. If we look at the expenditures on Work-Study in relation
to the total expenditures for vocational education, wy find that
approximately 2.7 percent of the money spent was used for Work-Study.
The expenditures across states are reported in Table I and Tdble II of
the appendix. The purpose of discussing the amount of money spent on
Work-Study is to /Anpoint its rather modest place in vocational education.

Chaoter /I - Work-Study / 21
Schools with Work-Study Programs
Sven though Work-Study wya funded late and the school year 1965-
1966 was the first year for this program, there were a total of 2704
schools across the United States that had operating programs during the
school year.
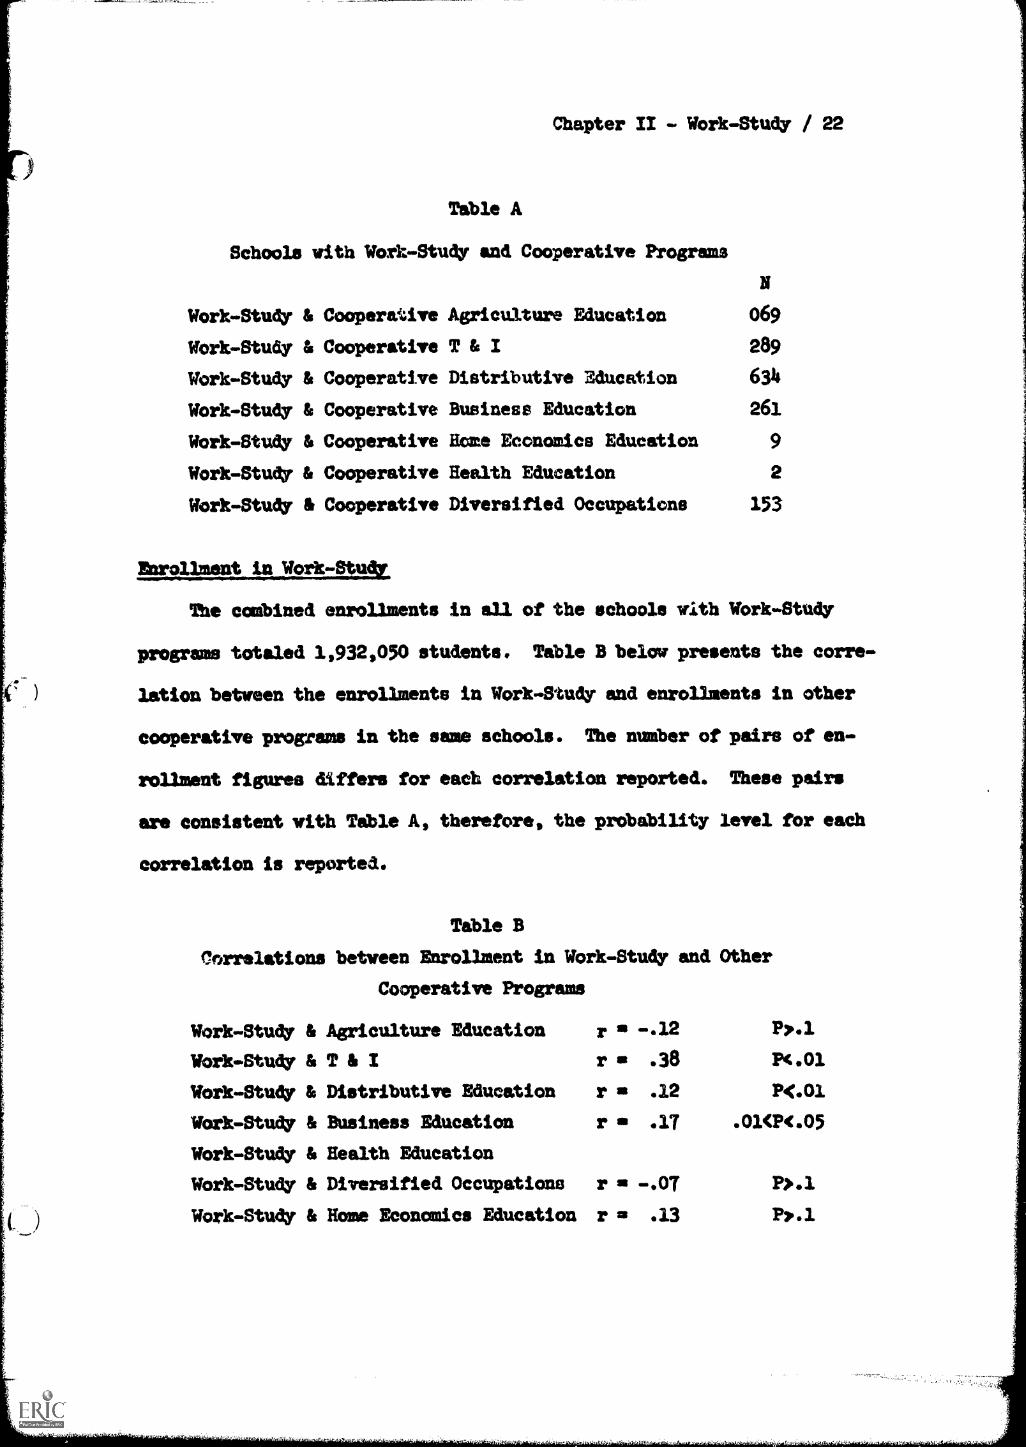
Tdble A below presents the nuMber of schools with Work-Study programs
and with cooperative programs in the various areas of vocational education.
The cooperative programs will be discussed later; the intent of the pre-
sentation or this table is to indicate the relationship between the
existence or cooperative programs in the various services and Work-Study
programs. The law stipulatas that students enrolled in Work-Study must
also be enrolled in a vocational program. Table A does not present the
relationship between the existence or Work-Study and the existence of
-a vocational education offering, since it can be assumed that every
school that had a Work-Study program also had some form of vocational
education. The nature of the Work-Study program with its supervised
work activity is very similar to cooperative programs, and the thought
here is that the existence or cooperative programa with the concomi-
tant personnel capabilities should have facilitated the establishment
of Work-Study programs. The data indicate that only one-third or the
enrollment in all cooperative programs wys in schools which also had
Work-Study. It is therefore obvious that a number of schools which
previously had no programs of organized work activity for the students
were encouraged to generate such a program by the Work-Study provision
of Public Law 88-210.
Chapter II - Work-Study / 22
Table A
Schools with Work-Study and Cooperattve Programs
Work-Study & Cooperative
Work-Study & Cooperative
Work-Study & Cooperative
Work-Study & Cooperative
Work-Study & Cooperative
Work-Study & Cooperative
Work-Study & Cooperative
Asriculture Education
T & I
Distributive 3ducation
Business Education
Home Economics Education
Health Education
Diversified Occupations
069
289
634
261
9
2
153
The combined enrollments in all of the schools with Work-Study
programs totaled 1,932,050 students. Tdble B below presents the corre-
lation between the enrollments in Work-Study and enrollments in other
cooperative programs in the same schools. The nudber of pairs of en-
rollment figures differs for each correlation reported. These pairs
ere consistent with Tble A, therefore, the prObability level for each
correlation is reported.
Tdble B
Correlations between Enrollment in Work-Study and Other
Cooperative Programs
Work-Study
Work-Study
Work-Study
Work-Study
Work-StudY
Work-Study
& Agriculture Education
& T & I
& Distributive Education
& Business Education
& Health Education
& Diversified Occupations r gl -.07 P>.1
Work-Study & Home Economics Education r = .13 P,1

Chapter II - Work-Stukr / 23
Correlations were also computed between enrollments in Work-Study
wove= and selected demographic, economic, and organisational variables
related to the individual schools. Because of the nature of the data,
different correlation techniques were used in each case; however, with
these variables, all 2704 Work-Study programs were included in the
calculations.
Table C
Correlation of Work-Study Enrollments with
Demographic, Economic, and Organisational Variables
Wort-Study Enrollment & Population Density orthe School Location r a -.26
Wort-Study Enrollment & Total Enrollment of-the School rip .24
Wort-Study Enrollment & The Lowest Grade inthe District r a .32
Work-Study Enrollment & The Lowest Grade inthe School r a .19
Worb-Study Enrollment & The Rank Order of State
on Expenditures forEducation r 0 -.23
Work-Study Enrollment & Comparative Wealth ofSchools within States
Correlation between Work-Study enrollment and population density,
although differing in direction frau the correlation between Work-Study
and total enrollment, are indicative of the same thing. The reason for
the difference in direction between the two correlations is the coding
system used for population density, which was explained previously.
Further verification of the similar meaning of the aforementioned
correlation is the correlation between population density coding and
total enrollment, which is equal to ..59. Fromthese correlations, it
is concluded that the large cities and large schools are more likely to

Chapter II - Work-Study /
have Work-Study programs than are the small schools in the smaller cities
or towns.
The system used to inspect the school district organisation and
individual school organisation was to correlate the lowest grade under
the superintendent's Jurisdiction and the lowest grade under the princi-
pal's jurisdiction with enrollment in Work-Study and the 'other variables.
The district organisation is related to poPulation density' and total
enrollment with a correlation of -.19 and .32 respectively. The same is
true for the school organisation except that the correlations are slightly
higher, being -.33 and .37 respectively'. Therefore, the inspection of the
relationship between the existence of Work-Study program and school
district organisation is confounded because of the correlation of
organisation with population. It is possible that partial correlation
might give some insight, but the descriptive nature or this report does
not warrant such detailed statistical analysis.
The relationship between enrollments in Work-Study programs and
the measures of school wealth showed that the states that have the greater
amount of funds available for education are more likely thm the poorer
states to have taken aulvmtage of the Work-Study provision of Public Law
88-210. Within the states, there is no relationship between the compara-
tive wealth of school districts and the existence of Work-Study programs.
The reader is cautioned against making my great conclusion* as the
result of these correlations, because poverty-stricken children cm and
do exist in even the wealthiest social setting and Work-Study is designed
to serve them wherever they are. This does, however, indicate that the
intent of the Work-Study provisim to alleviate some pockets of poverty
did not find realisation.

Chapter /I - Work-Study / 25
There vere approximately 18,000 high schools (schools offering
grades ten, eleven, and twelve) in the United States during the school
year 19654966. Of these, 2509 had a Work-Study offering. (See Table IV
in the appendix for programs by states.) This represents 14% of the high
schools. The total high school enrollment in grades ten, eleven, and
twelve fOr the 1965-1966 school year was 8575,000. The total enrollment
of the high schools with Work-Study programs wen 1,616,310 which is equal
to 18.8% of the aforementioned total enrollment. The higher percentage
of enrollment represented, as a contrast to the percentage of schools
represented, is another indication that Work-Study programs were slightly
over represented in larger schools.
There were 195 Work-Study programs operated by post-high' school
institutions; these included area vocational schools, community colleges,
and technical institutions which were part of four-year colleges. Because
of the diversity of these institutions, it is impossible to make any
statements relative to the percent of institutions or the proportion of
the enrollment represented in Work-Study programs.
There were 44,817 high school students enrolled in Work-Study
programs and 7,418 post-high school students; these two coMbine for a
total of 52,235 students in Work-Study programs. As would be expected,
because of the requirements for enrollment in Work-Study, a small pro-
portion of the total nuMber of students enrolled in United States high
schools were represented in the Work-Study programs; in fact, they
represent .52% of the high school enrollment. Nevertheless, the growth
in less than one year from no programs to 2709 programs with an enrollment
of over 52 thousand students must be regarded as phenomenal.

Chapter I/ - Work-Study / 26
estionnaiire noes on Work-Study
In concluding this chapter, it is in order to discuss briefly the
questionnaire responses. As was explained earlier in this report, a
questionnaire vas sent to a random sample of schools throughout the
United States and information was solicited from these sdhools as
to whether or not they had a Work-Study program. This was a redundant
question since the project collected data from the state offices on all
programs that existed during the 1965-1966 school year.
Analysis of the questionnaire responses in relation to existing
enrollment data shows that there was agreement between the questionnaire
responses and the state office data on 1216 respcnses out of the 1535
returned; or 79% of the responses agreed with the data collected from the
state office. Of the remaining 21%, a sisdble portion could not be re-
solved because the respondents may have answered that they had Work-Study
programs in disagreement with the project data, because they had them
during the summer only. However, there are 125 cases where schools re-
ceived reimbursement for Work-Study programs and in the questionnaire
response said "no, we did not have a Work-Study program during the school
year 1965-1966." This is an error rate of eight percent. The error
rate across states varied from sero percent in sparsely populated states
with small schools to 14.6% in densely populated states with large
schools. Errors of this magnitude could lead to the conclusion that still
another nail has been driven in the coffin of mailed questionnaire studies.
The error rate cited could also lead one to question the data supplied
to state offices. This author is prone to blame mailed questionnaires.

Tdble D
Relationship of Questionnaire Res
questionnaire
Responses
Programs EXi
Academic Ye
Chayter II - Work-Study / 27
ponses to State Office Data
sting During
ar 1965-1966
YES NO
YES 161 194 355
NO 125 1055 1/80
286 1249 1535
(1535 returns r resent 83.6% of the 1836 questionnaires mailed)


Chapter III - Cooperative Work-Education / 29
Objectives and Conditions
The Vocational Education Aat of 1963 Is permissive in terms of
the states operating cooperative vork-education programs. The operating
conditions are specified in each state plan and thereby become the legal
conditions governing the conduct of cooperative programs. There is over-
all agreement among the 50 state plans upon the requirements that cooper-
ative programs must meet in order to be 43.igfble for reimbursement. Two
state plans are cited below -- California and Texas:
California: Section 2.38-52: Cooperative Education Programs
Cooperative education programs will be offered to provideoccupational training for persons who, through a cooperativeagreement between the school and the employer, receive relatedoccupational instruction and on-the-ja training through part-time employment.
Training plans (preferably in wTiting) will be developedcooperatively between the school and employers. Such agree-ments will provide for: (a) the employment of student-learnersin conformity with federal, state, and local laws and regula-tions and in a manner not resulting in exploitation of suchstudent-learners for private gain (b) an organized progran oftraining on the jhb (c) related occupational instruction inschool.
Student-learners will be paid the prevailing wage forpart-time employment and will receive school credit for on-the-jOb training.
Texas: Section 2.38-52: Cooperattve Work Experience Programs
Cooperative work experience programs shall be providedthrough cooperative arrangements between the school andemployers in which students recetve part-time vocationalinstruction in the school and on-the-ja training throughpart-time employment.
Such classes must be organized through cooperativearrangements in writing between the schools providingvocational instruction to student-learners in the class andthe employers providing on-the-jOb training through part-time employment of suel student-learners. Such arrangements

Chapter III - Cooperative Work-Education / 30
shall provide for (1) the employment of student-learnersin conformity with Federal, State, and local laws andregulations in a manner not resulting in exploitation ofsuch student-learners for private gain, (2) an organisedprogram of training on the job for a minimum average offifteen hours per week, and (3) supplemental vocationalinstruction in school for an average of one class periodper day.
The citations from California and Texas were selected because they
represent the two areas of difference relative to conditions for coopera-
tive education. All of the states require (quite natural4 since a
program could not exist without it) an agreement between the school, the
student, and the employer. The only difference that exists is that some
of the states require that this agreement be in vriting and others do
not stipulate that it must be in writing. California, as can be seen
above, leaves the agreement optional, ....vhereas Texas requires a written
agreement.
Neither California nor Texas stipulate that the student must
have released time during the school day for work. Five states do so
stipulate and three of them specifY that the student must be released
five hours per week. All of the states require that there be supplemental,
formal classroom instruction. Referring agan to the citations above,
California does not specify how many hours this need be; but Texas, as
do five other states, stipulates that there must be five hours of supplemental
instruction per vaek.
California is one of four states that specifies that the student
will receive school credit for his on-the-job training. The rest, as
does Texas, fail to mention credit for the work experience. Only three

Chapter III - Cooperative Work-Education / 31
of the states, Connecticut, FlOrida, and Rhode Inland, specify a minimum
age for the student to participate in ceoperative programs, and in each
came this minimum age is 16 years.
Texas and nine other states require that the student be employed
a minimum number of hours per week, for nine of the states this minimum
is 15 hours; Nebraska, which also specifies a minimum, lists that
minimum as ten hours per week.
Each and every state plan makes same mention of the wage that the
student-learner must be paid. The California and Texas citations are tbe
most common form used. Eight states elaborate upon the common wage
requirements to require that the hourly rate paid the student must be
consistent with the prevailing wage for a given occupation in the geo-
graOhical area in which the student Is working.
It is apparent from reviewing the 50 state plans that USOE has had
a considerable influence on not only the structure of the state plan, but
also on the terminology used in preparing it. The Objectives of coopers,.
tive work-education are inherent in the conditions cited above; the over-
riding Objective stated in descriptive literature from the states and
specified in Pane Law 88-210 is to prepare a student for gainful
employment.
Cooperative Work-Education Programs among the States
There vere a total of 4800 cooperative vork-education programs among
the various states during the 1965-1966 school year. This does not
mean that there were 4800 individual schools with coorerative programs,
because that is not the case. However, the Woo figure is more represent-
ative of the opportunitY for cooperative work-education experience offered

Chapter /II - Cooperative Work-Education / 32
to United States high school students than are the figures reported by
UWE. USOE generally reports on the number of coordinators and often times,
especially in Distributive' Education where the enrollment is high, there
will be more than one coordinator to a school. Before discussing in detail
the distribution of cooperative work-education programs among the states
and among the areas of.vocational education, it is in order to present
briefly a relationship between cooperative programs and the Work-Stuly
programs discussed in the previous chapter. Table E below shows the
enrollment in cooperative programs for the various vocational services
dichotomised on schools with Work-Study and schools without Work-Study.
Table E
Enrollments in Cooperative Work-Education Programs by Service
Across Work-Study and No Work-Study Nigh Schools
Work-Study No Work-Stud,
Agriculture 550 29)489
T & I 7,238 15,652
Distributive Education 15,966 41,513
Business Education 6,357 11,498
Nome Economics Education 136 44o
Diversified Occupations 5,289 10,014
%%Mao 35,537 81,606
The enrollments by services and in tete' again indicate that although
there is some overlap, there is a different segment of the school popups
lation being served by Work-Study and cooperative work-education
respectively.

Chapter III - Cooperative Work-Education / 33
An additional point to be handled here is the natter of cooperative
work-education 1Drograms in the Health Occupations. The Health Occupations
typically have clinical experience as part of their education program.
The clinical experience satisfies many of the conditions of cooperative
work-education, but because these occupations have been studied in depth
and described in detail by other research reports, they are not considered
as part of this study, with the exception of two programs in Connecticut
which had a bonafide cooperative work arrangement for their students in
the Health area. These two programs are cited here and will receive no
fUrther mention in this report.
Granted that each of the services in vocational education has something
unique to offer students in cooperative programs, there is undoubtedly
more difference between cooperative programs and other vocational education
programs than there is difference among the cooperative programs of the
various services. This is to suggest that a cooperative program, particularly
a Diversified Occupations program, is a unique offering in any school.
Roughly two-thirds of the schools that had a cooperative offering had
only one such cooperative; about 22% had two cooperative programs;
approximately nine percent had three cooperative programs operating
concurrently; a few bad four, but no school had more than four programs.
Table F shows the pairings of cooperative programs; that is the schools
that have for example both Agriculture and Distributive Education or both
Agriculture and Diversified Occupations.

Chapter III - Cooperative Work-Education /
Table F
Pairs of Cooperative Programs
Agriculture 296
T & I 37 926
Distributive Education 51 560 2193
Business Education 29 318 564 846
Home Economics Education 0 11 25 9 38
Diversified Occupations 3 68 144 82 8 515
Ag T & I D.E. B.E. H.E. D.O.
Before discussinz the separate offerings, the relationship between
some of the demographic variables and cooperative programs in general
will be disQussed briefly% A contingency coefficient derived from a
chi-square frequency table indicates a valw of a a .39 as a measure of
relationship between the number of cooperative education programs in a
given school and the population density of the locality in which the school
resides. This is sufficiently large to demonstrate that the larger schools
in the larger cities are more likely than smaller schools to have one or
more cooperative programs.
The wealth of the state in terms of its ability to support education
is correlated with population density and total enrollment in the school.
These in turn, are correlated with the existence of cooperative programs.
Therefore, even though the contingency coefficient c = .55 is large for
a measure of association between the wealth of the state and the existence
of cooperative programs, there are a number of confounding variables
associated with this contingency. When the existence of cooperative
programs within the state is tested for relationship with the differential
wealth of the school district within that state, the contingency coefficient

Chapter III - Cooperative Work-Education / 35
decreases; c is .13. In Table F above, the pairs of cooperative offerings
were shown. Table G below gives the correlation between enrollments in
these pairs.
Table G
Correlations between Enrollments
in Cooperative Programs
Agriculture
T & I .13
Distributive Education .23
Business Education .29
Home Economics Education .00
Diversified Occupations -.26
.35*
.55*
.93*
.49*
.41*
-.22 -.41
.12 .09
B.E.Ag T & I D.E.
* Significant beyond .01
.99*
H.E. D.O.
The significant correlation between Distributive Education and
Business and Office Occupations is quite a natural relationship, since
both programs concentrate on placing students in sales-oriented enterprises.
Although Home Economics cooperative enrollments are significantly correlated
with enrollments in T & I and Diversified Occupation, the N, as seen in
Table F, is small; and as a consequence, there is nothing much to be
said about these correlations. It is very common for T & I supervisors to
have responsibility for the establishment and operation of Diversified
Occupations programs. It is therefore not unexpected that there is a
significant correlation between the enrollments in these two programs. The
significant correlation between the enrollments in T & I and cooperative
Distributive and Business and Office Occupations programs is undoUbtedly

Chapter 2a - Cowarative 1ork-Education/36
due to the existence of al4.1 three of theta in the-major population centers
of the United States; whereas the lack of significant correlation between
the enrollments in cooperative Agriculture and the other services seems to
reinforce the ideathat Agricultural cooperative promote are found more
often in the smaller, less densely popilated arms.
The diseissing of cooperative provisos across the services, will
start with Distributive Edue4tion bezause it has the largest enrollment,
and treat the programs in oiler of &ascending earollment.
Cooperstivø Distribrive Eduestion
Distrautive ucatL bas the longetst hts.tory of involvenorzt with
cooperative progra* . rd; also has the greatest number of pr.,vams (a total
of 2193 across all of the states), and the largrast total enrol:twist of
59,893 of which 14.7,479 students are in the higla school. (For n distribution of
Distributive Education programs across the states, see TAKE XV in the
appendix.)
The enrolls:nits in cooperative Distributive) Education programs
were correlated with population density, total enrolMent of the school,
school district organisation, school organization, rank order of wealth of
the state, and the comparative wealth of the schools within the state.
(See Table II). Of these correlations, the first four are significant and
indicate again that Distributive Educatice programs art founi in large cities,
in schools with large enrollments, and in school districts mad high schools
that have narrow range of administrative responsibility. There is, how-
ever no significant correlation between the enrollments and the wealth of
the state or of the particular school districts within the state.

Chablter XII Cooperative Work-Education/37
Table R
Correlation of Distributive Educntion Ennaineuts with
Demographic, Ecommic, and Organizational rariablee
Distributive Education Errollmenia & PopuLatiot Denstiy orthe School Location
Distributive Education
Distribut ive Education
DI Litributive Educat Lon
Distributive Education
Etroliments & Total. &raiment ofthe school
Enrollments & The Lowest Grade inthe District
Enrollments & The '4towest Grade inthe School
Enrollments & The nal* Order ofState on Expendituresfor Education
r= -.21
rim .25
3
rm .16
r= -.03
Distributive Education Enrollments & Comparative Wealth ofSchoois within the Statet rrs -.03
T& 1, vith 923 programs in the 50 states vith a total enrollment
of 23,845 of which 22,890 students were la high schools, ie second to
Distributive Education in.size. It is altiv second in terms of the length
of Involvement in cooperative programs. The correlation of enrollments in
T & I programs and demographic, economic, and organizational varitibles is
presented in Table X. The pmttern and thq interpretatAon of these corre-
lations would be the same as those for DiGtributive Education, with the
exception that the correlation between school district organization aud
T & I enrollments le not sufficiently high to be significant at the .01
level. This lack of relationship between the grade span of the district
z:nd enrollments in T & I programs may result from the relationship of T & I
In general to industrial arts programs ALVA exist across elementary and
high schools.

Chapter /I/ - Cooperative Work-Education/38
Table I
Correlation of Trade and Xndustrial Education Enrollments with
Demographic, Economic, and Organizational Variables
T & / Enrollment & Pppulation Density orthe School Location r= -.27
T & / Enrollment & Total Enrollment ofthe School r= .19
T & / Enrollment & The Lowest Grade inthe District r= .02
T & I Enrollment & The Lowest Grade inthe School r= .11
T & I Enrollment & The Rank Order of Stateon Expenditures forEducation r= -.04
T & I Enrollment & Comparative Wealth ofSchools within States r= -.05
Cooperative programs in Business Education (henceforth Business
Education is being used and interpreted to include Office Occupations)
were newer on the educational scene than either Distributive Education or
T & I. They do, however, exist in 29 of the 50 states with a total of 846
programs and an enrollment of 18,248 students. As was the case with the
cooperative programs discussed previously, by far the rajor portion of the
enrollment is in high schools. In this case, Business Education has 17,855
students enrolled in cooperative programs in high schools. The correlations
of enrollments with other schools and social data are presented in Table J.
The pattern of correlations for cooperative Business Education follows that
of T & I, except that In this case there is a significant correlation be-
tween the comparative wealth of the schools within the states and the'
enrollment in cooperative Business Education programs.

Chapter III - Cooperative Work-Education/39
Table J
Correlation of Business Education Enrollments with
DemogTaphic, Economic, and Organizational Variables
Business Education Enrollment & Population Density orthe School Location
Business Education Enrollment & Total Enrollment ofthe School
Business Education Enrollment & The Lowest Grade inthe District
Business Education Enrollment & The Lowest Grade inthe School
Business Education Enrollment & The Bank Order of Stateon Expenditures forEducation
Business Education Enrollment & Comparative Wealth ofSchools within States
CoOPerative DtversIfied Occupations
r= -.30
r= .34
r= -.04
r= .18
r= -06
r= -.14
Diversified Occupations, a relatively new program typically has
a strong relationship to cooperative T & I. The reader is to be reminded
here that Diversified Cccupations is not necessaray the term used in all
of the states, but it seemed to be the term most applicable to programs in
which students were not restricted to employment in areas which could not
be categorized according to a specific vocational education area. Diversified
Occupations programs exist in 18 states in which there are a total of 515
schools with programs and a total student enrollment of 15,540. Table K
presents the correlations tetween variables in the same fashion as they
have been presented for the previous cooperative programs. In this instance,
district organization and the comparative wealth of schools are not significantly
correlated with enrollment in Diversified Cccupations.

Chapter III e Cooperative Work-Education/40
Table K
Correlation of Diversified Occupations Enrollment with
Demographic, &anomie, and Organizatioael Variables
Diversified Occupations Enrollment & Population Density orthe School Location
Diversified Occupations Enrollment & Total Enrollment ofthe School roz .44
Diversified Occupations Enrollment & The Lowest Grade inthe District r= -.01
Diversified Occupations Ebro natant & The Lowest Grade inthe School re, .14
Diversified Occupations tiro llment & The Rank Order of Stateon Expenditures forEducation
Diversified Occupations Enrollment & Comiarative Wealth ofSchools within States
rizg...avresUrieulture Education
Cooperative programi' in Agriculture ami Komi Economies are a very
recent vintage. Nome Eeeiomies has only 38 programs in seven states with a
modest enrollment of 624 students; therefore, it is not being discussed.
Agriculture: however, has a total of 296 programs with an enrollment of
3,235 students in 11 states. With the exception of Michigan, all 12 of
the states are noted for having large agrieulturul enter,prises, and the
existence of cooperative programs in Agriculture Education seems to make
good sense.
As was discusseCearlier, cooperative Agriculture programs stand
alone in terms of their location in the school districts within the states.
Following the pattern of presenting correlations between cooperative en-
rollments and selected variables, these correlations will be tbund for
cooperative Agriculture in Table 1. The only significant correlation is
between the orgenizational structure or the district and enrollment in

Chapter M Cooperative Work-Education/41
cooperative Agriculture. The lack of a significant correlation with popu-
lation density, wealth of the state, and wealth of the school reinforces
the earlier comments that cooperative Agriculture programs are aore likelyto be found in the smaller schools in the smaller towns.
Thble L
Correlation of Agriculture Educsaion Enrollments withDewalOties Receades ala Organisational Variables
Apiculture Mication Enrollment & Population Density orthe School Location
Agriculture Education Enrollment & Total ftrolbeant ofthe School
Agriculture Education Enrollment & The Lowest Crade inthe District
Apiculture Education Enrollment & The Lowest Grade inthe School a .ar
Apiculture Education Enrollment & The Rank Order of Stateon Expenditures forEducation rag .09
Agriculture Education Inreatuent 80 Comirative Wealth ofSchool° within States ray -.05
tionnaire Re neIonqqgztjye Work-Education
As vas "Nation,* before, 1836 queitionnaires were sent to a random
NMI* of schools in the United States. Of these, there were 1757 high
schools and 88 post-high achool institutions. The 1757 represents 9.3 per-cent of the 18/6 pUblie high schools in the Ihdted States during the ma-date Tear 1965-1966. ot the mailed questionnaires, 1535 were returned, . ofwhich 425 indicated they had leursed Cooperative education progress.
To extrapolate frau the sample to the total population would lead tothe conclusion that over 4000 high schools had cooperative vocational

Chapter III - Cooperative Work-Education/42
education programs during the school year 1965-1966 and that an additional
four percent instituted new cooperative programs during the 1966-1967 school
year. Following the same extrapolation procedures from questionnaire data
leads to the conclusion that there were over 18c0 schools with reimbursedble
prcsrams for which they did not request reimbursements.
According to the data collected from state offices, there were 3333
individual institutions with reimbursed cooperative vocational education
programs during the school year 1965-1966. As was suggested in the brief
discussion of questionnaire responses to work-study programs, the discrepancies
between the questionnaire data and the state office data mAy well be due to
the inherent shortcomings of mailed questionnaires regardless of how well
they are structured.
Mach of the data from state offices were in fact questionnaire data in
that the schools responded to the state office requests for information dbout
their programs. The project staff considered information dbout the students
job assignment, career aspirations, hours wcrked, and wages so suspect that
these data were not tabulated. However, throughout this report it is assumed
that the names of students enrolled in cooperative programs are not fictitious.
It is fdrther assumed that the disbursement of fUnds to schools for cooperative
programs is evidence of the erlstence of a program at that school. Therefore,
when a discrepancy exists betweenq uestiotnaire data and state office data,
the state office data will be assumed to be the more valid.


Chapter IV Buloary /
Distributive Blucatiou has the longest history of cooperative pro.
gnus and the greatest number of programs and the greatest number of stu-dents enrolled. Blicaus. ai the nature of job placement in DistributiveEducation, there wrii no raison to expect concentration in either the major
population centers or in miler toms. The program enrollment ranged
tram one to 228 students with the mode being 20 students. There vas, how-
ever, a rather significant oldntering of tbe prowess (accounting far about33% of the total nuriber of progress.) in cities aver 50,000.
The enrollment in T & I cooperative programa ranged from one eft-
dent to 415 students. The model enrollment is 25. JUst as we would expect
Aviculture to be located in the smaller rural cities, ve would also expect
T lb I to be located in the centers of population wherein reside the major
manufacturing camplexeS. :ft is true that the greatest proportion of stu-dent enrollment in T & I was in the major population centers; however, T & I
has cooperative programs across all of the classifications of population
dennity used by this research project.
The enrollment in Business Education ranged from one student to
1.61 students vith the made being 18. The distribution of program across
centers of population vas much the sans for Business and Office Occupations
as it was for Distributive Education. In thin case, rceghly 37% of the
programs were *nettles of over 50,000.
Diversified Occupations, which by its nature should have no rela-
tionship to population density since students are permitted to work at
just aboat any occupation, did find program distributed across all of thepopulation density classificatt OnSi and it had a student enrol/went range
from one to 216 with the node being 25. It must be recogrined, hovever,

Chapter IV - Summary/45
that Diversified Occupation programs have not yet found favor with all of
the states. Alabama, Florida, Illinois, Minnesota, Missouri and North
Carolina account for the major portion of Diversified Occupation cooperative
programs.
The programs in cooperative Agriculture ranged in enrollment from
one sutdent to 95 students with approximately 78% of the programs having
12 or fewer studerts enrolled.
It was to be expected that cooperative Agriculture programs
would find their major emphasis in the smaller rural, agriculturally oriented
communities. Although there were Agriculture programs recorded in even
the largest metropolitan centers, over half of all of the Agriculture
programs were in cities or towns of less than 25,000 people with over 28%
of the cooperative programs being in towns of less than 5000.
There are so few programs of a cooperative nature in Home Economics
that it does not seem worthy of anal,ysis. Those that did exist clustered
in seven states. Suffice it to say the enrollments ranged from six to 36
students and the programs were found in all population centers with the
exception of the 25 major megalopolises.
There were 2451 schools that had cooperative programs but did not
have Work-Study programs; there were 1823 schools that had Work-Study pro-
grams and no cooperative programs. Of the schools with cooperative
work-education program, two-thirds had only one offering.
Some of the data collection and analysis provided less than over-
whelming information. For example, using correlations to assess the rela-
tionship between the financial capabilities of the educational institutions
across the states proves to be a rather fruitless end7svor. The sane vas

Chapter IV - Summary/46
true of the correlation analysis of financial cLpabilities of the schools
within the states. This is to say, that there veemed to be no significant
relationship between wealth of states or wealth of the schools within the
states and any of the offerings in concurrent work-education.
In the process of summarizing the state data, correlations were
computed betw:en employment, unemployment, and number of offeringspin each
of the cooperative programs and in Work-Study by atates. These, in turn,
were tested for relationship with the rank order of the state on money
available to education. It was expected that there would be a significant
correlation between the number of Work-Study programs and the total unem-
ployment in a given state, as well as between the number of Work-Study
programs Elul the money available to education in a given state. Only one
of these correlations proved to be significant 'beyond the .01 level: Work-
Study--unemployment r = .56. However, the nunber of offerings in cooperative
Apiculture was also highly correlated with unemployment: Cooperative
Agriculture--unemployment r = .58. The nuMber of offerings in cooperative
Agriculture, T & /, Distributive 2ducatIon, Business Education were all
highly inter-correlated. The correlation between the wealth of the state
and the other summary variables was in no case sufficiently high to be
significant to the .01 level.
In discussing some of the futility of data collection, it is
necessary to summarize the disconcerting amouut of error in the returns
on the mailed questionnairm. The project was fortunate to have data from
the state offices about reiMbursed cooperative programs and Work-Study
programs. In cheekieg these data against the yes-no responses on the mailed

Chaptlr - Summa17/47
questionnaires, there was no alternaive but to conclude that the mailed
questionnaire data was of doubtfUl validity and reliability. As the con-
sequence, not much could be said about the existence of non-reimbursed
cooperative programs.

CRUM V
DISCUSSION AND IIIMBNPRITATION

Chapter V - Discussion and Interpretation/49
As the result of visits, ranging from a few hours to a number of
days, with the offices of education in the various states, the research
staff developed some subjective feelings about a number of aspects of these
educational bureaus. The subjective feelings of each of the persons who
visited a given state were recorded in the form of anecdotal comments (fOr
a significant portion of the states there was more than one person involved).
Thankfully the anecdotal comments demonstrated relidble interpretations
among the metbers of the research staff in relationship to the factors about
to be discussed.
The reader is cautioned not to interpret the forthcoming remarks as
an assessment of the strengths of the vocational programs in the states.
In some respects this chapter seems to be totally unrelated to the strength
ofthe programs:
As was discussed earlier in this report, some of the information gathered
about schools came from the state superintendent's office, although the buIk of
information came from the Vocational EdUcation Department. In the process of
gathering infOrmation frOm these two sources, the research staff developed some
feeling about the extent to which there was communication among the various services
in the state office. SO assessment can,be made as to whether Special Education,
for example, has a strong pattern of continuous communication with the related
services in the state office; but an assessment can be made for vocational
education. It was generally considered that vocational education did not maintain
active communication with the other departments within the state office; and
generally, it did not maintain communication with departments from whichAroca-
tional education could benefit by having contact. An example of the lack of
communication would be the state of Wisconsin, whereas an example of a strong
pattern of continuous communication would be Colorado.

Chapter V-Ddscussion and Interpretation/50
Integration and communication are naturally highly correlated but
are independent here because facilities can also be considered. Some
state offices of education are scattered throughout a nmiber of buildings,
whereas others are all housed in the same structure. Pennsylvania, Oregon,
and Washington have all their state educational offices in the same building,
whereas Oklahoma and New Ybrk are examples of offices being scattered. It
is very common for vocational education to be houaed independently of the
rest of the education enterprise as soon as there is need for more than one
building. Oklahoma, for example, has its vocational education office 65 miles
removed from the rest of the state offices. It seems apparent that physical
separation mitigates against integrated activity and continuous communication;
however, some states have managed to maintain integration and communication
even though separate facilities are used. I 'would cite Idaho as an exemPle
of this.
Although the intent of the Vocational Education Act of 1963 was in
part to enhance the cooperation among services of vocational education,
there are numberous instances where this has yet .to be accomplished. Illinois
is a good bad example. It cannot be suggested that the size of the program
makes integxstion within vocational education difficult or impossible, because
a fine example of an integrated state office for vocational education exists
in one of the largest programs in the countryTexas.
It would be expected that of the various offerings in public education,
vocational education would be the area most eager to use and most capable
of understanding electronic data processing. Vocational education is after
all, committed to maintaining up-to-date knowledge about technological advances,

Chapter 17-Discussion and Interpretation/51
particularly those that have influence upon the occupational structure.
FUrther, it seems that vocational education at the state office level has
the greatest need for a system that facilitates accounting. The school
districts sUbmit totthe state office in some cases very detailed informa-
tion about vocational education programsteachers, students, activities,
and related information. A portion of this information is required to be
tabulated and submitted to UWE to justify the expenditures of federal
funds. It is readily apparent that communication among state office
departments, physical and administrative integration within the state
office and within vocational education is necessary in order that data
processing Elystems can be efficiently used. Although many of the state
departments of vocational education do not take advantage of data processing
facilities of the state office when they exist, it is pleasing to note
that there is a movement toward the use of these systems. Oregon and
CalifOrnia are currently formulating plans which will permit vocational
education.
One recommendation to vocational education designed to facilitate
the use of data processing equipment in student accounting is in order.
Vocational education should use Social Security numbers as the means of
student identification, which is identical to the system being used by
Florida in vocational education, by the University of Illinois for all of
its students, and by the Iowa Educational Information Service for all students
within the state of Iowa.
The research staff collected data not only from the state offices,
but also from related agencies, particularly the State Teachers Association.
In some instances the State Teachers Association had more discrete enroll.

Chapter lb.Discussion and Interpretation/52
ment data than did the state office. In all cases the State Teachers Association
had more complete information on teachers' salaries. In one instance, the state
of Arkansas, the source of student enrollments in grades ten, eleven, and
twelve was the Athletic Association.
Within vocational education the location and arrangement of data relating
to public school offerings ranged from an individual to a structured system.
It Vas not uncommon for the individual who was capable of locating and
explaining vocational education data to be a secretary. NOr was it uncommon
for the professional personnel to have changed positions and still be con-
sidered the repository of information about the programs they had supervised on
their previous assignment. /t may be considered rather pleasing that many
of the state offices are personality oriented in terms of information about
programs; but the lack of continuity as personnel change becomes distressing.
It seems desirable to develop a uniform information reporting system and a
system-oriented means of recording, storing, tabulating, and reporting this
information. TWO good examples of a well organized system are Colorado and
Florida. The best example of uniform recording fOrmats across the states is
in the area of Distributive Education.
The professional vocational educators who originally organized state
programs in vocational education back in the twenties either have retired or
are about to retire. The first generation is on its way out. The size of
the staff, which in most respects is unrelated to the size of the program in
the state, has become fairly stable. / think it can be expected that second
and third generation vocational educators will shortly, if not already, be
responsible for the functions in vocational education. Most of the state
offices are still manned by the "old guard" ("old guard" is used here with

Te-ITCR',,,r7r77rfaRPFILrOM:
Chapter V - Discussion and Interpretation/53
affection), but there are individuals and rare areas among the states where
the "young turks" (used here with affettion) have taken over the reins.
Missouri and New Jersey have their young turks. It will be interesting in
years to come to see what effect, if any, they have upon state structure invocational education.
Following is a brtef discription of some isolated but pertinent situationsthat point up unique state departunit involvements in cooperative education.
Nye York City had a rather interesting program called SM. This was
desigmed to offer a work-study program for potential dropouts. STEP (The
School to Employment Program) has a minimum age requirement of 15 or 16.
A well organised progrem such as STEP fits the D.0, category of many other
school districts. Weever, it was specifically designed to combat the drop-
out problem. ttpon inspection of the job placement of students, it was ccecluded
that the actual operation was similar to Diversified Occupations programs in
other states.
In Missouri the student enrollment in T & I and Distributive Education are
reported on the sane form. Although a differentiation is made between the
two programs in some instances, it is not made coreistently; and in many cases
the two programs are band.led by the same coordinator. As the result of this
mix and without making avy judgment of the efficiency of the arrangement, the
research project tabulated all the enrollments under diversified occupations
since D.O. is typically designed to handle cooperative programs that cut
across tbe traditional areas. This seems consistent with the fact that
cooperative programs are under one supervisor at the state level, rather
than under individual services. The term C.O.S. is the generic term used
on all report forms. C.O.S. is used interchangeably with D.E. and Is

Chapter V - Discussion and interpretation/511
in designating the related class period on tha schedule, SIC ad DOT nuabers
are frequently reported la mixed sequence.
Utah had a program that placed undui-achleving students In service occupa-
tions. Although the programs received some guidance from the state supervisor
of Distributive Educationl they did not limit the student placement to distri-
butive occupations. There were five such programs with .11, tmal enrollment of
exactly 100 students, Because tif the varied nature of student enployment,
these progress were tdbulated under Distritutive Occuputions.
California has & program called Work ftperleace that exists both in the
high school and the junior college. In taw woo it lc not unlike Work-StuAy
under the provision of Public low 88-210. One majordifferance is that the
students do not have to demonstrate financial need. There have been some
state supported studies of the Work Experience program, but there are not
data of a statewide nature available.
The Vark-Study programs in Wisconsin were concentrated in the post-
high school institutioms by design, and a significant proporttan or the
students were employed as aids to teachers.
Although cooperative work-education programs are not widespread in post-
high school institutions across the fifty states, the state or Washington has
a rather unique and extensive cooperative program in Business Education called
"Mid...Management." This program is attracting considerable attention In
other states and can be expected to generate additional cooperative programs
especially in junior colleges.
It maybe that tax supported agencies must lead the way in providing work
stations for students. MASA: Huntsville, has the Largest cooperative work-

Chapter V - Diecussion and Interpretation/55
education proves for college students in the United States. The United States
Navy has long been involved in cooperative programs for engineering students.
Placement is the problem.
The federal legIs3.ation seemed t irdicate that USOE was desirous of
doing away with or at least modifying, the influence of the various divisions
within the state offices of vocational education. Typically each
state office has a diviston for Trade and Industrial Education, Distributive
Education, Office Occupations Education, Home Economics Education, Agricultural
Education, Technical Education, and in some cases Diversified Occupaticns
Education. When the states are considered in tctal, each of these divisions
has acme cencurrent work-education pmgrams; however, with the exception of
Distributive Education, ttare are no divisions that have concurrent work
edetcation programs across all of the states.
There are =term authorities in edueation and social science through-
out the United States (Morris Jancrwits of Chicago being a prime example)
who consider bonafide occupational experience as being socially meaningful
regardless of the kind of task the student performs . This idea, coupled with
the apparent rivalry among the areas of vocational education and a tendency to
group cooperative education students into Diversified Occupations in those
cases where either the program at the school is relatively smell or where
coordinators and/or the state office are unable to agree upon which area of
vocational education the student should be assigned, leads one to believe that
cooperative education should be considered as an entity without subdivisions.
It has been said that "ice who pare the piper calls the tune." msa
aspects of data reporting on vocational education are consistent with the
above quote in that states report. to USOE those things that they are required

Chapter V-Discuseion and Interpretation/56
to report in order to justify the expenditures of federal money. By and large,
these reports re/ate to the number of teacaers avd coordinators employed tL'augh-
out the state. In addition, there are reports about the occupational fields
they are serving by the various areas of vocational education. The tabulation
of the number of students involved is not essential for reimbursement and
therefore is very loosely calculated and generally includes anyone who ever
enrolled: if for only one day.
The state,, in turn, requires information frem the schools which is gener-
ally considerably more extensive than that which is reported to USOBJ and there
are tany filing cabinets in state offices filled with information about students
that has never been used in any fashion. The easiest thing to come by is a
tabulation of tde names, addresses, and phone nuffibers of instructors, coordina-
tors, and supervisors by service area. The United States Department of Agricul-
ture can tell you how many pigs were slaughtered in Chicago any morning and
provide this information by two p.m. of that same day. We in vocational
education generally cannot provide accurate information about the nunber of
students involved in our prograns even if given a few months to perform the
tabulations. Hopefully this report provides some information about students
and the offerings available to them across schools among the fifty states.

TABLE
A Sohools with Work-Study and Cooperative Programs 22
Co.crelations between Enrollment in Work-Study andOther Cooperative Programs 22
LIST OF TABLES
NAME PAGE
Correlation of Work-I:tudy Enrollments with Demographic,Economic, and Crcanizational Variables 23
Relationship of Questionnaire Responses to StateOffice Data 27
Enrollments in Cooperative Work-Education Programsby Service Across Work-Study and No Work-StudyHigh Schools 32
Pairs of Cooperative Frograms 34
G Correlations between Enrollments in Cooperative Programs 35
Ii Correlation of Distributive Education Enrollments withDemographic, Economic, and Organizational Variables 37
Correlation of Trade and Industrial Education Enrollmentswith Demographic, Economic, and OrganizationalVariables 38
Correlation of Business Education Enrollments withDemographic, 2conomic, and Organizational Variables 39
Correlation of Diversified Occupations Enrollmant withDemographic Economic, and Organizational Variables 40
Correlation of Agriculture Education Enrollments withDemographic, Economic, and Organizational Variables 41
Distribution by Sew by Areas of CWE 59
N Distribution of Student by Age Across CWE Programs 60
O Range and percentage Distribution by Grade 61
P Student/Coordinator Ratios 62
Q Distribution of Employment Across Major Occupational 65

:Lulu
V
LIST OF TABLES(acme:mixed)
RAHL PACE
Husiosrs of Junior evd Savior Students Enrolled in VorkPrograms and the Rtsidual School Population 70
Numbcirs and Percentages of CVE students by Sub-Groups 71
Age of CVE and 'Random Samp/e Studvate at theBeginning of the 3tudy 72
Race of CVE and Random iample Students 73
Devitttion I.Q. Scores of CVE end Random Sample Students 74
Fatheeo Occupational Level for CVE and Random SampleStudents 75
X Patheez Educational Level for CVE and Random SampleStudents 76
Humbcr of Absences for CVE and Random Semple StudentsDuring the School Year Preceding thin Study 77
School Status of CVE and Random Semple STudents atthe and of the Year of the Study 78
AA Humbs.,: of Absences for CVE and Random Sample StudentsDuring the Year of the Study so
ER Grade-Point Average of CVZ end Random Sauple StudentsDuring the Year of the Study
CVZ snd Random Sample Students Employed for a MajorPortion of the Yetr of the Study
DD Area of Employment for CVE and Rave,om Sample StudentsDuring the Gear of the Study
HignUr of Hours Worked Waskdays by CVZ and.RandomSample Students
81
82
82
83'
Ft Number of Hours 4orked qeekende by CVE and RandomSample Students 84
GG Total Number of Hours Worked Per Week by CVE andRandom Sample Students 85
EH Hourly thaw of CVE Lnd Random Sample Studeuts 86
t 4 1..

CHAPTER VI
Characteristics of Students
and
Programs
11.

Charecteristica/58
There w::.1.1 he no attempt to comp6ire the age, grade, and sex
distributione of CWE students with the normal schbol population. The
intent of gathering this data was oxiginally to set the stage for che
eecond phase of the study which lea's to hsve been aa in depth study of
selected schools through:AA the United States.
The stipulations relative to grades in which CWE programs will be
offered varies from state to state with the exception of Work Study.
The modal restriction across all kinds of programs, again with the excep-
tion of Work Study, is that the students aust be seniors. This is
particularly true with Distributive Education since it has the most
uniform practices across the states.
The distribution of students by sex is, as would be expected,
coaditioned by the kinds of occupations for which the programs are
designed to prepare the students. Distributive, Office, Health, and
Home Education programs have the most appeal for female students while
Agriculture, T 1, and Diversified Occupatione have the most appeal for
the male students. (Because of the small N, cooper'ative health occupa-
tion programs and CooperatiVe Home Economic& programs will not be
discussed here; see page 33.)
Distributiolliajex,:
In the table M, on the following page, is ahown the distributien
by sex for each of the major divisions of CWE programs. This Includes the
range percentage across the 50 states, plus the overall percentage male-
female diseributi,on.

Characteriatic6/59
TABLE M
DISTRIBUTION L. SEX EY AREAS OF OWE
(c.ale shown-female would be the residual)
RANCE OVERALL
Distributive .-,ducaticn
Male Across States
48 to BO 55.9
Business/OfEic,2 Occupatiots 03 to 35.2 195
r to 89.4 88.5
Trade and Industrial 57.8 to 91 83.3
Diversifiee Occupations 55.8 to 71 60.3
Work-Study 46.7 to 100 62.07
Distribution lly Aoe:.................................-.. ...a...A.6..
Age was categorized as 16 or less; 17, 18; aud over 18. The
percentage range in each category by.major.df.vit.ion includes such unique
aspects as the limitation of Work Study in WIsconsin to the zlrea voca-
tional sc:hools and junior colle;es. It was expected that in the secon6
phase of the study some explacotions wo,21d be in. order for the variance
of age distributim across sch.3o1s and across major classificaitons
within vocational education. t this writivso a descriptive table must
suffice. Tho agrts rpo.cted in Tabiki N, on the following pages
are based np'Dn their ag fi. as of the last full month of 1965-66 academic
year (May),

clg1reateristS.co/60
TABLE N
DISTRIBUTIO OF STUDENT BY AGE
ACROSS CWE PROGRAMS
16 or less 17 18 over 18ea wwilma elworw.4/ .ftwlowl.01V1. 44A .10.41..4....**.1Distributive Education 11.5 45.4 32,2 10.9-..,.....^.VIIMMIAII, +,*"-Mman*. ,.......-,t 41111Business/Office Occupations 5 4 48.8 35.4 10.6
W ^0 .1*Aviculture 22.2 37.1 28.0 12.7Na.MMn v10....itawno.-- VAIN. Mre......
Tride S Industrial 16.0 44.1 31.6 6.3'an 8.11.L r. **Diersified Occupations 12.1 56.1 24.3 7.5.11Na yoegweameameasak....... o.....ea."Nocawalp.r...nirmaramooli....maqva.. oallWock-Study 29.5 18.9 30.1 21.5INIONMe vWatI.IMCM.10a...M.I.A.n.v.rn.umo....wom.m.agsw.v.waiNo 10.1.001=
Dit?tributio
As was mentioned earlier, cooperative programs are restricted to
thl twelfth grade in many states with the exception of Diversified Occu-
pattons. Work Study, of course, has to be viewed separately, Table 0,
shovn on page 61, shows the range and the percentage of the lOth, llth,
12tt, 13th and 14th grades across the 50 states, plus th,e overall percen-
tag4 in each grade by major classification. It should be noted here
that the 13th and 14th grades inzlude junior colleges, community colleges,
and 3ost high school area vocatiowil schools.
The etate of WasMagton has by far the largest cooperative post
high school programs in Distribve Education. /.1y the 1968-69 school
yew: it is expected that each of the Community ;:olleges in Washington
will have a cooperative mid-management program.

Diatriburive Education
.tharact.erietice/61
MALE 0
FANCE AHD PERLENTAGE
DISTRIMITION BY GUDE
10th llth 12th Tee:et-114h
.111....0
0.2 15.9 79.3 4.6
,tenwe.51*NO-%,.7%wM4./..n.w.0-.....4010....0=4040'r.....*SaMb,..,-Business/Office Occupations 8.1 90..4 1.5. 'WO V.10.111174......
Agriculture 21.3
xma0.4"..+-
78.7
weeensair...a.M.9Mln.,..
0
4.7,11..1...........+M.0.10w....110..s,14.1310....AOMM.O*AMMJNO,......011...11.6.10.,0111*4111e.....111011.4.111...f.......a......
Trade 6 in6.stria1 0.9 41.4 57.7 0
Nor4Mileisay.Ormemi........w.O.N.MMR7IONOWWMV....**.eMMI,No.am./.....watWaM.*41/1 .Am.age .....yomMOrMMMMwaMw.1
Diversified Occupations
Ration of Coordinittors to Students:
26.2 73.6 011.111.0.1 16.411.61111...0.14
As programs a'.:e started it is understandable that the coordinator
of a Cooperative piogram may have very few students. Ae the program
matures there is a saturation point where no more students can be admitted
without an additional coordinator, if the on-the-job supervision ie to
be maintained. The range in number of students per coordinator reported
on page 62 (Table P) indicatee fhe extent to which eome coordinatora
are overloaded, whereas the meat ration of stydents to coordinators reflects
the maturity of the offerings.
Again we find Work Study to be different from the cooperetive programe.
By far the majority of Work Study etudents were employed by the school
district in which they eee enrolled. In effect, tIze Work Study coordinator
was au accountant and the otudenta were supervised by a teacher, administra-
tor or one of the supporting porsoneel in the school for whom he or ehe
worked. Thus, there was practically a on to one relationship in Work-Study.

TABLE P
tharactcristica/62
STUDENT /COORDINATOR RATIOS.
RANCE
Axtross All States
OVERALL
Mem,
Distributive Educsti'A 1 - 48 27.3
business/Office Occupations 1 - 40 21.5
Agriculture 2 - 49 10:9
Trade and Industrial 2 - 65 25.8
Diversified Occupations 9 - 39 30.1
Work-Study 1 - 501 19.3
Distribution of Students across Jobs:
The tabulations of specific jobs in which students were gmployed
VAS not only an impossible but would.have'been a meaningless activity,
eince the.reporting system ranges from career objectives in DistrPlutive
flucation through the newt of the employer in some programs, to the name
of the specific tjob with the appropriate DOT number in selected T & I
programs. Therefore, the folloqing table (Table Q) was prepared which
categorized occupation, in terma of the relative consistency with the
de2inicion8 of the major subdivisions of Vocational Education.
The major service areas in Vocational Education are defined as
fol/ows. (Diversified Occupations programs cut across all service areas
and Work-Study was defined on pnges 16-18 )
- ' tg - " 4!.',Arezt..!,!...

Characteristics/63
AGRICULTURE EDUCATION
in Agricultural subjecLo for occupations which perform one or more
of the agricultural functions of producing, processing, and distributing
agricultural products, and related services. Competencies are elnpha-
sized on one of the primary areas of plant science, soil science, animal
science, farm management, agricultural mechanization or agricultural
leadership. Au a3ricultural occupation may include on or ally combination
of these areas.
DISTRIBUTIVE EDUCATION
Distributive education (Distribution and Marketing) includes various
combinations of subject matter and learning experiences related to the
performance of activities that direct the flow of goods and services,
including their appropriate utilization, from the producer to the consumer
or user. These activities include buying, selling, transportation, storage,
marketing research and communications, marketing finance, and risk,
management.
EUSINESS AND OFFICE EDUCATION
Business and Office Occupations includes those programs which relate
to the facilitdting function of the Office and include such activities
as recording and retrieval of data, supervision and coordination of office
activities, internal and external communications and reporting'of activities,
internal and external communications and reporting of information.
Training in specific skills includes: stenographic; typing, filing,
and related courses; computing and accounting material and production;
ftro

Characteristics/64
recording, message distribution, accounting, auditing, :budget, personnel
and training, clerical functons, and data processings.
TRADES AVD /NDUSTRIAL EDUCATION
Trades and industrial education includes training for occupations
Wit sue skilled or semiskilled and are concerned with layout designing)
produc:Jag, processing, assembling, testing, maintaining, servicing, or
repair:ng any product or commodity. Instruction is provided (1) in basic
manipulative skills, safety judgement, and related occupational informa-
tion :n mathematics, drafting, and science required to perform successfully
in thf: occupations, and (2) through a combination of shop or laboratory
exper emcee simulating those found in industry and classroom learning.
Incluced is inatruction for ap?rentices in apprenticeable occupations or
for :turneymen already engaged in a trade or industrial occupation. Also
inclued is training for service and certain seml-professional occupations
connieered to be trade and industrial lu nature.
From the above definitionm it is apparent the cleai cut distinctions
canot be made among the service areas of Vocational Education. Hovever,
tbl areas cd major distinCtions were used to categorize job.stations in
'c,,rE programs, The categories, waitress, custodian, and teacher's aide
save added to provide a more complete breakdown of work-study jobs. Health
(ccupatioas was added because cf the significant number of these jobs
eld by students classified under trade and industrial education.

_ =IP
r, rt-
TARE Q .
Characteristici/45
DISTaIMITIOH OF EMPLOYMENT ACROSS MAJOR OCCUPATIONS
Distil. Bus./Office Trade/Indus. Agric. Divers. WorkEduce. Occbp. Education Educe. Occupa. Study
ow Oa eftwomoaMooOrowOm ammo OWoOMOO.OMoomolo.sol1OhOBOOMMOMOMOMOIOMOMO0000k000nomOo.o....yetwoomopoowe
Sales 91.0ZM00000.011W.I.AemOmoloomMOOmmO0A.O...WANyomm.
Office
3.2% 9.9% 3.3% 3.22 1.72o-,OOwINSAIMPIIINan/O.ONONIOIIO.MOONOIIONISomilOWNEOOMI.011+4.
2.0% 95.5% 3.924.0...OmmOrmOmenwar, od0O.M11.40e.MMOOMilwo....ftoMOOMOIMO11110,11111woolWiloe
Feral ng IN OMB,
Traas 0.3%ADM.
Waitress 0.7%ofil/oNOONO .111Mon011iMMIIINO1
Custadian
01110..1116
6.5% 40.02
0.52 90.0% 0.62 0.92..1.40mourailmOMIO.womorm*UrommimmioroolornaLormNOWINommommowmwoOom...,
06O1/011O
ORONO MO
wet MONO =MOM 011.
59.2% 5.7% 48.12:
5.1% ow 4.1110 2.8% 3.41MBOIONWOMPOPOOPoodOPOIMOSoodoOMOMIONO morOillogiOIIROOKOSIOno
1.7% 1.1Z 26.2Zoop000m0000rrima moomolo.O WatOoownemodoromosiModwriawinnmaewswomoommolO Ooftlowom
Hea3th Occuo.
OtherrooloolOr..
OM foNOD 3.6% 16.7% 0.9%...M.MINDMIP.....WoWW..M0......10.1,WMIP
6.0%
re& 4111.40111111.
1.3Z 16.1% 1.0% 20.6% 1.72No/POOO,OldOollOMeigOOMOolOMOI.OMMO011Ool11.1111POOPOOOlo..=11,11A.
Alvbere .4% 20.92.
There are instances (Ohio would be an example) where the state
suparvisor of the given cooperative area refused to permit the students
to enroll Iho were employed in jobs outside the Purvue of the area.
TrAcally, in less populated states and in smaller programs, such fine
e.stinctioas were not made, and it is the author's opinion that the value
ri part-time employment may. well be independent of the occupation.
It ifi my opinion that the over-lap of vocational areas (even across
'broad cla:sifications such as Table Q) suggests the need to treat CWE
programs S au entity without subdivisione.
Selected Ln Denth Studies:
The data and dIscourse that follow were abstracted from the
dissertations of Dr. Thomas R. Jensen and Dr. Lewis Holloway. Dr, Jensen
studied CUE programs for students with handicaps and Dr. Holloway's
studies are on experimental programs in one high school.
' %I nor' " "' *tr. ajr r ,. r A . re,

Characteristics/66
Conitureent Work-EducgalgLIer Handicque Studtat_OKELI:
A careful analysis of respouses to a seiles of questionnaire items
related to administrative characterietics of CWE/H programs resulted in
the administrative model represented below.
This model also indicates the distribution of CWE/H return among
administrative categories and corresponding cell percentages.
Spatial.
Special Education Other
Education and Dirit NYC CWE/H
Independent
Augumented
N e 27 N a 37 N e 24
N 11 N 27, N 7
38 64 31
N ea 12
7
19.152
"Independent" CWE/H programs were administered solely by the designated
"primary agency" whereas "augmented" CWL/H programs were those in which
the "primary agency" was involved in a joint undertaking with another
agency. Tor example', an on-going special education CWE/H program which
integrates NYC funds and work stations was classified as an "augmented"
program.
Responses to another series of questionnaire items were employed to
determine the nature of the handicaps possessed by the clientele of CWE/H
programs. It was found that the types of handicaps fell into three
general categories and could be represented on a continuum with handicaps
associated with cultural deprivation at one end, handicaps associated
with mental retardation at the other, and a combination of the extremes
in the'center. The latter were referred to as the "broadly handicapped."
The CWL/h return indicated that a disproportionate number of CUM pro-
grams were serving the mentally retarded which was not surprising aince
67 percent of the CWE/H programs were administered by special education
and special education--OVR.

Characteristics/67
Spokesmen for CWE/H of all typea indicated objectives which
reflIcted a concern for the development of "general work traits." Haley
CWE/H programs had objectives reflecting secondary emphases, e.g., objec-
tives indicating a concern for job placement, per pe, and objectives
indicating a concern for developing job skills. Roughly 38 percent of
the CWE/H programs were concerned with developing general work traits
ask& 42 percent were concerned with general work traits and skill
development. Special educationDVS programm were found to emphasize
placement, and to a lesser extent skills, more frequently than did
special education programs. NYC programs, on the other hand, emphasize
placement and have a noticeable lack of emphasis on general work traits
only and general work traits plus job skills.
The average number of studentis per CWE/H program was 19.6 and this
figure was stable across administrative types. On the average there
were one or two fewer females than males in CWE/H programs and one-third
of the clientele were non-white. NYC programs deviated somewhat by
virtue of the fact that they enrolled as many girls as boys and as many
non-vhite as white.
Information was collected regarding the five types'of work-experience
settings: (1, on-campus. in-class; (2) on-campus, ont-of-class; (3)
sheltered workshop; (4) off-campus, non-profit institution; and (5) off-
campus, profit-making enterprise. In the same order as presented, the
modal entry grade levels were 10, 10, 11, 11, and 11-12. The modal age
level at entry for all types of work-experience settings was 16. Wages
were more frequently paid in the off-campus settingt. 0n-campus, in-class
(1) was a poor last in wage payment with only 31 percent of such settings

Characteristics/68
providing wages, Students placed in off-campus, profit-making enterprises
were more frequently given course credit and related classes than students
in other settings.
When CWE/H programs were claissified according to the nature of work-
experience setting sequences available, there were 44 "single choice"
programs, 23 direct-line "sequential" programs, 32 "sequential-brancaing"
programs, and 50 "concurrent" programa. Special education--DVR prograna
exhibited a higher than empected frequency of sequential and sequential-
branching programs which may indicate more structure, planning, and
articulation thav other types of CWE/H programs. NYC was strongly indenti-
fied with single choice offerings. As expected, augmented programa had a
disproportionate number of sequential-branching and concurrent offerings,
thus enabling such programs to offer more work-experience setting
alternatives to students.
Among all types of CWE/H programs, the five factors thought most
contributory to the success of individual programs were acceptance and
commitment to the program by (1) school administrator() and board, (2)
CWE/H teachers, coordinators, and counselors, (3) CWE/H students, (4)
employers, and (5) freedom to try new approaches. The five factors
presenting the most serious obstacles to greater success were lack of
(1) time for counseling, (2) time for job visitations, (3) CWE/H guide-
lines, (4) facilities, and (5) curriculum materials.
There vex little evidence to indicate that CWEiH respondents felt
that affiliation with a more comprehensive CWE program for "normal
students" would help their CWE/H programs.
Special education--DVR had a diaproportionate number of positive
responses for every "success contributory factor" examined. Only.success
"777`cT

Characteristics/69
contributory factor items baying s Pe .30 were examine4. NYC had a
disproportionate lack of positive responses in every case examined
except one: funds. For all factors examined, augmented CWE/H programs
had more positive responses than independent programs.
If essential cooperating agencies are discounted, e.g., individual,
business concerns or the Office of Economic Opportunity for NYC programs,
one must conclude from the data that CWE/H programs in general fail to
take advantage of potential cooperating agencies in the community.
Special education--DVR and NYC.programs generally indicated non-
local initiation factors whereas the converse' was true of special educe-
tiOn and "other CWE/H" programs. With respect to permanence, special
education--DVR, special education, "other CWE/H," and NYC respectively
were coneidered progressively less established in the curriculum. Over
50 percent of the CWE/H programs came into existence during the last two
years.
In considering a number of miscellaaeous questions, it was.clear
that spacial education--DVR programs tend to provide more services and to
use more resources than other programs. NYC was on the other end
of the continuum. In response to whether respondents thought their
program was worth copying, special educatien--DVR respondents had a
disproportionate zeal for their programs and NYC and "other CWE/H" had
a reciprocal lack of enthusiasm for their programs.
When CWE/H programs are classified according to type of work-
experience setting sequences it was found that a disproportionate number
of single choice programs were not considered worth copyini and that
sequential-branching appears to be slightly more desirable than sequential
and concurrent.

Characteristics/70
The CVE, or Experimental Group. The primary subjects of this study
were those junior and senior students, during the 1966-67 school year, who
were first-year enrollees in the Cooperative Vocational Education (CVE).
The 119 CVE students who made up the experimental group represented
10.88 percent of the total number of juniors and seniors at the High
School. Examination of Table R shows that 89 (74.70 percent) of the CVE
students were seniors.
TABLE R
NUMBERS OF JUNIOR AND SENIOR STUDENTS ENROLLEDIN WORK PROGRAMS AND THE RESIDUAL SCHOOL POPULATION
CVEProgram
Other ProgramsWhich Include SomeWork Experience
.00011MTotal Population
Residual of Jvniors andSeniors Seniors
Junior Boys 11 11 183 205
Junior Girls 19 5 197 221
All Juniors 30 16 380 426
Senior Boys 45 24
rileMINIMONmml/111........11110272 341
Senior Girls 44 15 267 326
All Seniors 89 39 539 667
Total of AllStudents
119 55 919 1093
JMOwwwwWwMme......wroureNOMMNP1011.raMyamri.y.*The experimental group was bout equally divided between the sexes
with 56 boys.representing 47.06 percent of the 119 CVE students.
The CVE students were divided into sub-groups which were in most
caaea indicative of their type of employment. The one sub-group where
the name does not indicate the work area was that of Diversified Occupations.
As might be expected, there was vide range of work stations in this sub-
group, some of which zight seem to be more appropriate for other sub-groups.
4

Characteristics/71
This overlapping was cruised by such factors as coordinator load and
prerequisite courses for particular sub-groups. The number and percentage
of students in each of the sub-groups are shown in Table S.
TABLE S
NUMBERS AND PERCENTAGES OF CVE STUDENTS BY SUB-GROUPS
%111111...11111.1101=00
Name
.........01141011.111111101.=1.1.1111.111..111.11111
NumberPercent ofTotal
1. Office Occupations 26 21.85
2. Distributive Education 21 17.65
3. Diversified Occupations 45 37.81
4. Food Service 22 18.49
5. Agri-Business 5 4.20
TOTAL 119 100.00
During the year of the study, two CVE students transferred out of
the program, another was graduated at mid-term, and sixteen dropped out
of school. Of the original 119 CVE students, 100 completed the program.
In desCribing, CVE students, the entire 119 were included, but for data
analysis on other factors the totalwas necessarily rechiced to 100.
The Random SIET1e. For Comparison purposes a random sample of 119
students was drawn from the residual school population. Since the main
difference in the treatment of the CVE students was their supervised work
experience, it was felt that no students in the random sample should be
in a work experience program. Table R shows there were 55 students who
were excluded from the residual group for this reason. These 55 students
were composed of a special education group of socially maladjusted students

- , ""`""''''""1"7""!;17=210W-
Characteristics/72
and soma individual students who were only in need of several credits
to be graduated and had been given permission to work half-time without
being a part of any work-education program.
Comparisons CVE and Randomatati. A comparison of the CVE and
random sample groups on age as of October 1, 1967 is presented in Table
T. Though there was not enough variation between the groups to cause
a significant difference, most of the variation was at one age level.
By observing the individuals involved, the puthor (Dr. Holloway) was
able to note that a large number of the seventeen CVE students in the
older age group were former dropouts. The median age of CVE students
was 16.90 years while the median age of random sample students was 16.76.
TABLE T
AGE OF CVE AND RANDOM SAMPLE STUDENTS
AT THE BEGINNING OF THE STUDY
AGECVE
No. ofStudents,11
Not Available 0
15 and under 3
16 28
17 71
18 and over 17
TOTAL 119.111101NMIN0....1MMI......Mbvw
dIallo.Random Sample Total
No. of No. of
Percent Students Percent Students Percent11M01.=ma
0.00 1 .84 1 0.42
2.52 7 5.88 10 4.20
23.53 32 26.90 60 25.21
59.66 72 60.50 143 60.09
14.29 7 5.88 24 10.08
100.00
4111119 100.00 238 100.00
X2 ss 5.08 df 2 .05 4 1)4 .10
111171%IM11.11.CVE Median = 16.90
Random Sample Median = 16.76
WWW;,T4K,Wil"'

Characteristics/73
There were twelve non-white students in the CVE group as compared to
nine in the random sample. From the chi-square and internal consistency
of Table Ut it was concluded that there is not appreciable difference
between these groups as to their racial make-up.
TABLE U
RACE OF CVE AND RANLOM SAMPLE STUDENTS
RACE
.10.11/0.8101.1
CVENo. ofStudents Percent
Random SampleNo. ofStudents Percent
YOE,* .Total
No. ofStudents Percent
White
.Non-White
107
12
89.92
10.08
110
9
92.44 217
7.56 21
91.18
8.82
UMIMIKOMMON.1111.,
TOTAL
,'119 100.00 119 100.00 238 100.00.. AMMP ....
0;47 df a 1 P .25
Although I.Q. scores have come into some criticism in recent years
as measure of "Innate ability" it is known that such measures are good
predictors of academic success in regular school programs. Deviation I.Q.
scores of CVE and random sample students were gathered from their cumula-
tive folders and the resultant comparison is shown in Table V. Upon the
basis of the chi-square it is concluded that the deviation 1.Q. of random
sample students wss significantly higher than that of CVE students. The
median deviation i.Q. score for CVE students was 100.10 as compared
with a median of 112.85 for random sample students.

SCORE
Characteristics/74
TABLE V
DEVIATION I.Q. SCORES OF CVE AND RANDOM SAMPLE STUDENTS
4:41,4111110.1MIMINIINICIPIIMIcamlp
CVE Random SampleNo. of No. ofStudents Percent Students Percent
Not Available 9 7.56 10 8.40
2 1.68 1 .84
13 10.92 4 3.36
38 31.94 19 15.97
47 39.50 34 28.57
10 8.40 41 34.46
0 0.00 10 8.40
52 - 67
68 - 83
84 - 99
100 - 115
116 - 131
132 - 148
TOTAL 119 100.00 119. 100.00
TotalNo. ofStudents Percent
19 7.98
3 1.26
17 7.14
57 23.95
81 34.04
51 21.43
'10 4.20
238 100.00
240.97 df 3 Pe .001 CVE Median 100.10
Random Sample Median se 112.85* CaliUmnia Test of Mental Maturity
2. Family Background. Probably the most enlightening factor of
family background is a measure of socio-economic class. Father's occupa-
tional level is the best single predictor of socio-economic class. Data
gathered on father's occupational level is presented in Table W. The
chi-square for this comparison was sufficient to conclude that CVE stu-
dents tend to come from families of the lower socio-economic classes.
An example of how the CVE students must be classed as coming from lower
socio-economic levels is indicated by the fact that only two of the CVE
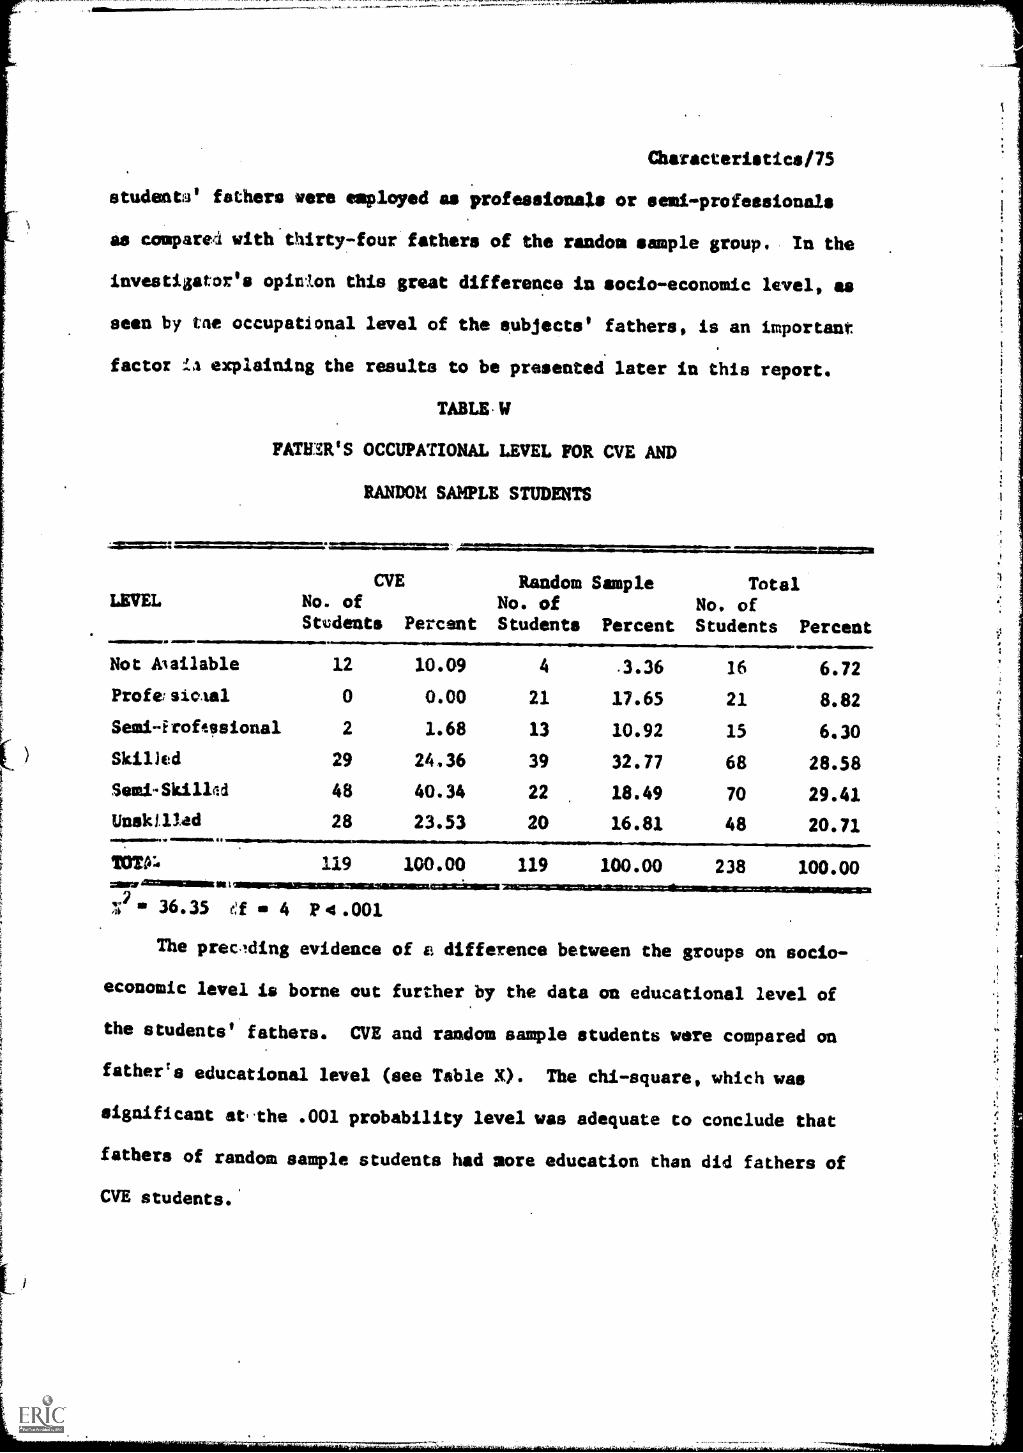
Characteristics/75
studenta' fathers were employed as professionals or semi-professionas
as compared with'thirty-four fathers of the random sample group. In the
investigator's opinlon this great difference in socio-economic level, as
seen by tne occupational level of the subjects' fathers, is an important
factor :!.4 explaining the results to be presented later in this report.
TABLE,W
FATIBR'S OCCUPATIONAL LEVEL FOR CVE AND
RANDOM SAMPLE STUDENTS
CVELEVEL No. of
Students
Not A3ai1ab1e 12
ProfesioAal o
Seml-froftesional 2
Skilied 29
Semi-Skillfid 48
Unsktllad 28ommeNIMINONNev I
..=mmlimmumat
1;7 ay 36.35 ef 4 P 4 .001
119
Percent
Random SampleNo. ofStudents Percent
TotalNo. ofStudents Percent
10.09 4 .3.36 16 6.72
0.00 21 17.65 21 8.82
1.68 13 10.92 15 6.30
24.36 39 32.77 68 28.58
40.34 22 18.49 70 29.41
23.53 20 16.81 48 20.71
100.00 119 100.00 238 100.00
The prec.Iding evidence of el difference between the groups on socio-
economic level is borne out further by the data on educational level of
the students' fathers. CVE and random sample students were compared on
father's educational level (see Table X). The chi-square, which was
significant at-the .001 probability level was adequate to conclude that
fathers of random sample students had more education than did fathers of
CVE students.'

Years ofSchooling
Not Available
1 - 8
9 - 12
13 - 16
17 or more=1.1111
Tc :al
MO 1
Characteristics/76
TABLE X
FATHER'S EDUCATIONAL LEVEL FOR CVE AND
RANDOM SAMPLE STUDENTS
CVENo. ofStudents Percent
Random SampleNo. ofStudents PercentAl
24 20.17 5 4.20
3 2.52 1 0.84
26 21.85 17 14.29
62 52.10 59 49.58
4 3.36 37 31.09
119 100.00 119 100.00
X.2
0 27.72 df E, 2 P4 .001
TOtalNo. ofStudents Percent
29 12.18
4 1.68
43 18.07
121 50.84
41 17.23
238 100.00
Absentee records for the year preceding the study mere examined for
boti CVE and random snmple groups. The absence data reported in Table Y
pretuced a chi-square sufficient to conclude that a significant difference
exi ted between the groups. Examination of the table indicates that CVE
etelents had a decidedly higher absence rate than did random sample
stuients. The median number of absences for CVE students during the year
pre:eding the study was 14.5 days as compared with 4.9 days for the
rank= sample students.
It was found that random sample etudente take more units of credit
in most of the academic subject areas. In order to somewhat even out the
newer of units taken, it is likely that there would be at least one area
in drich CVE students took more units of sophomore credit than random
stmle students. The area in question was vocational, technical and

.TABLE
Charsctiristics/77
NUEBER OP ABSENCES FOR CVE AND RANDOM 'SAMPLE STUDENTS
. DURING Tat SCHOOL YEAR PRECEDMG THIS STUDY
No. of DaysAbsent
CVENo. ofStudents Percent:
Random SampleNo. ofStudents Percent
TotalNo. ofStudents Percent
Not Available
...-arlow1111.01110..P.
13 10.92 5 4.20 18 7.560 .. 4 14 11.76 38 31.93 52 21.845 s. 9 19 15.97 37 31409. 56 23.52
10 14 20 16.82 17 14.30 37 15.5515 .. 19 18 15.13 13 10.92 31 13.0320 -.' 29 14 11.76 5 4.20 19 7.9830 49 U. 9.24 3 2.52 14 5.8850 and above 10 8.40 1 0.84 11 4.62=amme,Totals 119 100.00 119 100.00 238 100.00
33.49 df 5 P4.001
practical arts. Under tbis area are grouped the following types of
courses: Business education, homemaking, trade and industrial arts,
art, and agriculture. The extent of the difference between the groups
is noted by the hut that may 5.88'percent of the CVE students did not
take any vocational, technical and practical arts courses during theX
P
sophomore year as cowpared with 46.22 percent of the random sample students.
With CVE students having taken more courses in the areas requiring
less rigorous academic ability one would expect this to have a leveling
effect upon the over-all grade-point average. If there was such an*effect
it was hidden by the overwhelming superiority of random sample students in
earning higher sophomore grades. The median grade-point average for CVE
'students was 3.61 as compared with 3.62 for random sample students.
A

......,,,,,1111,1111111111111111,11111-111rs,1ye. J.1-1.
Characteristics/78
The Year of ghtitgALABLEIERIMMEat
1. Dropouts. Of the 119 CVE, students who became a part of the
study on October 1, 1966, 100 completed the school year as compared to 114
of the original 119 random sampIe.students. ExAmination of Table Z shows
that the number of mid-term graduates.and transfers were approximately
equal for the two groups. Based upon, the chl-square for this table 41 waa
concluded that there was & difference.in the dropout rate between the CVE
and random sample students. The major difference between the groups is
accounted for by the sixteen CVE students who dropped out of school as
compared with only three random sample students.
TABLE Z
SCHOOL STATUS OF CVE AND RANDOM SAMPLE STUDENTS AT
THE END OF THE YEAR OF THE STUDY
111111111.
-imr_ms=====immr.mCVE Random Sample Total
No. of No. of No. ofStudents Percent Students Percent Students Percent
ollorarammeor
Completed the100 34.03 114 95.90 214 89.92School year
Dropped out of School 16 13.45 . '3 2.52 19 7.98
Graduated mid-term3 2452 2 1.68 5 2.10or transferred41111. .
Total 119=sorgamiunimona=wrimmipszsra=simig=
X2 m 10.01 df m 2 0054 P 4.01
100.00 119 loom 238 100.00
Much of the related information reviewed for this study indicated that
work-education programs were, or might be, the answer to reducing the high
number of school dropouts. As the CVE and random sample groups were not
equated, it was not possible to access the holding power of the CVE
program. Even when a card sorting technique was used to select those

Characteristics/79
students in each of the groups who were dropout prone,' the CVE groups
showmd a higher percentage of dropouts. To achieve properverspective in
this situation it must be emphasised that in addition to the many dropout
prone enrolled in this program a substantial number of these students were
dropouts from previous years. Several of the sixteen CVE dropouts left
school very early in the school year.and had such poor attendance prior
to their dropping out'that the activities of the program could have had
little if any, effect upon them. It may well be'that based upon the
characteristics of the CVE student; it is surprising that no more than
sixteen of the original 119 dropped from school.
2. Attendance. The number of absences recorded for CVE and random
sample students are presented in Table AA. In considering attendance
during the year of the study a special factor must be weighed. The CVE
students were attending school in the morningssand were at their work
stations in the afternoon. The means for keeping an accurate attendance
record on these students was questionable. Because of this special
situation no claims will be made as to similarity or difference between
the groups. It will be noted though that the two groups differ at the
4 .001 probability level on sophomore attendance. The median number of
days absent during the year of the study for CVE students was 11.30 as
compared with 10.00 for random sample students. It is interesting to
note the absence rate for CVE students went down when compared with their
sophomore reCord, while there was an increase in absences for random
sample students.
727,PC:47Z.

TABLE AA
Characteristice/80
NUMBER OF ABSENCES FOR CVE AND'RANDOM SAMPLE STUDENTS
DUR/NG THE YEAR OP THE STUDY,
ANIMAINIMININNII11111111MILw
.
Daya AbsentCVE
No. ofStudents Percent
.11111=111111P 11101111111110011
Random Sample TotalNo. of No. of.Students Percent Students Percent
NoCAvailable 19 15.97 5 4.20 24 10.08
0 - 4 16 13.45 29 24.37 45 18.91
v9 25 21.01 25 21.01 50 21.01
14 - 14 25 21.01 28 23.53 53 22.27
L.5 - 19 18 15.13 15 12.61 33 13.87
20 - 29 7 5.88 13 10.92 20 8.40
30 - 49 9 7.55 3 2.52 12 5.04
50 and above 0 0.00 1 0.84 0.42
Total 119 100.00 119 100.00 238 100.00
..01011.01101I
X2
7.04 df le 5 .10 41P 4.25 CVE Median 11.30
Random Sample Median 10.00
3. Grade-Poiat Average. The comparison between CVE and random
sample studente on grade-point average during the year of the study is
presented in Tabig BB. On the basis of the chi-square and examination of
the table it is concluded that random sample students had higher grades
than CVE students. For CVE students the median grade-point average was
4.35 while that of the random sample was 5.22.

TAMS BB
Cheracteritics/81
GRADE-POINT AVERACE OF CVE AND RANDOM SAMPLE STUDENTS
. Dump Tax YEAR OF THE STUDY
ilIMINIMP.111111111111.4011111111.1110MMIII011=41111~.111111MMNION
Grade-Point*
00111
CVE Random SampleNO. of No. OfStudents Percent. Students 'Perceit
TotalNo. of.
Students Percent11r.Not Available 19 15.97 5 4.20 24 10.08
1.9 2 1..68 1 0.84 3 1.26
2.0 - 2.9 34 28.57 21 17.65 55 23.11
3.0 - 3.9 45 37.81 38 31.93 83 34.88
4.0 - 5.0 19 15.97 54,
45.38 73 30.67
Total 119 100.00 119 100.00 238 100.00
ee 19.92 df 2 P4 .001 CVE Median 4.35
Random.Sample Median 5.22*1 oF 2 lelD 4.5 541A
4. Work Experience. It is noted that data on.värk experience
during the year of the study was obtained from different sources for the
two groups. Data for CVE students were gathered from forms filled out by
the students for their training station late in the school year. These
forns were checked by their coordinator. The information on random sample
students was obtained from these responses to a questionnaire.
A presentation is made in Table CC of a comparison between the
employment of CVE and random sample students. The ninety-eight employed
students were not necessarily employed all at one time, but did work for
a major portion of the school year. Inspection of the table and chi-square
are sufficient to conclude that the employment rate of CVE students was
higher than that of random sample students. It is interesting to note that
a large portion (62.18 percent) of the random sample studentr were employed.

TABLE CC
Characteristics/82
CVE AND RANDOM SAMPLE STUDENTS EMPLOYED FOR A MAJOR
PORTION OF THE YEAR OF THE STUDY
CVE Random Sample Total
Employment No. of No. of No. of
Students Percent Students Percent Students Percent
Not Available 19 15.97 5 4.20 24 10.08
Employed 98 82.35 74 62.18 174 73.12
Not Employed 2 1.68 40 33.62 40 16.8011111111011.111111M11111111=MMIMMIn
Total 119 100.00 .119 100.00
.pworlognie
238 100 0011111111M11
.
38.50 df 1 P4 .001
The area of emplpyment for CVE and random sample students is presented
in Table DD. The Chi-square is large enough to conclude that a difference
exists between the groups. In examining the table it is found that no
ingle segment produces a very large proportion of the difference. The
'CVE group bas a larger propOrtion of workers in office occupations and
,the trade and technical area while random iample students are more likely
to be employed in sales, food service and general service.
TABLE DD
AREA OF EMPLOYMENT FOR CVE AND RANDOM SANPLE STUDENTS
DURING THE YEAI OF THE STUDY
CVE Random Sample Total
.No. of No. of No. of
Students Percent Students Percent Students
Not Available and 28 23.53 45 37.81.. unemployed
Office Occupations 30 2521 13 10.92
Sales 19 15.90 19 15.97
Trade and Technical 12 10.09 0 0.00
Food Service 12 10.09 15 12.61
General Service 18 15.12 27 '22.69
Total 119 100.00 119 100.00
1111111.111111111011111211111111111111011. 011111=111111011111111MIL
43
38
12
27
45
238 100.00
Percept
73 30.67
18.07
15.97
5.04
11.35
18.90
X2
19.31 df 4 P 4.001

TABLE CC
Characteristics/82
CVE AND RANDOM SAMPLE STUDENTS EMPLOYED FOR A MAJOR
PORTION OF THE YEAR OF THE STUDY
woolmowndrarammenesmommIlli+m
111P11114
Total
X an 38.50 df 0 1 P 4 . 001
CVE Random Sample Total
Employment No. of No. of No. of
Students Percent Students Percent Students Percent
Not Available 19 15.97 5 4.20 24 10.08
Employed 98 82.35 74 62.18 174 7312
Not Employed 2 1.68 40 33.62 40 16.80
119 100.00 119 100.00 238 100.00
NOIIIIIIMPIIIMINNINOMIMINIOMMI11001111MAINIINIMIN.
.
The area of emplpyment for CVE and random sample students is premium'
in Table DD., The chi-square is large enough to conclude that a difference
exists between the groups. In examining the table it is found that,no
single segment produces a very large proportion of the difference. The
'CVE group has a larger proiortion of workers in office occupations and
-the trade and technical area while random sample students are more likely
to be employed in sales, food service and general service.
TABLE DD
AREA OF EMPLOYMENT folk CVE AND RANDOM SAMPLE STUDENTS
DURING THE TEAR OF THE STUDY
.MMWMMIIIMOMMMOMMUMMMUNIMMINMMUM
Not Available and.. unemployed
Office Occupations
Sales
Trade and Technical
Food Service
General Service
Total
30
19
12
12
23'611
15.90
10.09
10.09
CVE Random Sample
.No. of No. of
Students Percent Students
Tots/No. of
Percent Students Percept
28 23.53 45 37.81 73 30,67
13 10.92 43 18.07
.19 15.97 38 15.97
0 0.00 12
15 12.61 27
18 15.12 27 '22.69 45
119 100.00 119 100.00 238
5.04
11.35
18.90
100.00
al 19.31 df 0 4 P 4.001

_AMY
arr..
Characteristics/83
The next terms of work experience investigated was the number of hours
worked by CVE and random sample students. It has been shown that CVE
students are more likely to. be employed than random sample students, but
for this section only those students who are, or have been, employed for
a major portion of the school year are included. Presented in Table EE
is a comparison of the number of hours worked weekdays by the two groups.
Examination of the table and the Chi-square are basis for concluding that
CVE students work more hours during the week than do random sample
.students. The above is not surprising for CVE students are relased from
school during the week for the purpose of working. The median hours
workei weekdays by CVE students was 21.30 as compared with 14.00 hours
for random sample students.
TABLE EE
NUFAER OF HOURS WORKED WEEKDAYS BY CVE AND RANDOM SAMPLE STUDENTS=No. ofStudents
CVE
Percent
Not AvailableOr uremployed
0
28
0
23.53
0.00
1 - 6 5.04
10 - 34 10 8.40
15 - 19 15.96
20 - 113 51 42.8;
30 - 39 5 4.20
40 - 49 0 0.00
Tout 119 100.00
Random Sample TotalNo. of No. ofStudents Percent Students Percent
45 37981 73 30.67
9 7.56 9 3.78
7 5.88 13 5.46
22 18.49 32 13.45
10 8.40 29 12.19
21 17.65 72 30.25
3 2.52 8 3.36
2 1.68 2 ,84
119 100.00 238 100.00
X2
14.41 df 3 P 4.005 CVE Median 21.30
Random Sample Median m 14.00

Characteristics/84
A difference again appeaWwhen CVE and random sample groups are
compared on the Dumber of hours worked on weekends, Table FF. In this
case though, the difference is in the opposite direction. Based upon
the chi-square and examination of Table FF it is concluded that employed
random sample students work more hours on weekends than do CVE students.
On weekends the median number of hours worked for CVE students was 5.0
as compared with 11.1 hours worked by random sample students.
TABLE FF
NUMBER OF HOURS WORKED WEEKENDS BY CVE
AND RANDOM SAMPLE STUDENTS
41..1111=1,.1/11000.110.111
CVE Random Sample TotalNo. of No. of No. ofStudents Percent Students Percent Students Percent% agYmagy=.10111M1110
Not Availableor unemployable 28 23.53 45 37.81 73 30.670 32 26.90 7 5.88 39 16.39- 9 45 37.81 27 22.69 72 30.25
10 - 14 8 6.72 20 16.81 28 11.7715 - 19 6 5.04 19 15.97 25 10.5020 - 29 0 0.00 1 .84 1 0.42
11011111110 ,...mstpTotal 119 100.00 119 100.00 238 100.00
X2
Is 16.74 df s= 2 P 44 .001
INNawF11........../M11/1111.....11.1001. =01.1.6
CVE Median 5.0
Random Sample Median m 11.1
With CVE students working more hours weekdays and the employed random
sample students working more on weekends, it seemed likely that Ole total
number of hours worked might not differ. The total number of hours
worked per week by the two groups are compared and presented in Table W.
From the chi-square and the internal consistency of the table it is
concluded that Cvl: and employed random sample students did not differ as

Characteristics/85
to the total number of hours per week. Par CVE students the median
number of hours was 24.45 while that of random sample students was 24.72.
TABLE CC
TOTAL NUMBER OF HOURS WORKED PER WEEK BY
CVE AND RANDOM SAMPLE SMUTS
=========CVE
No. ofStudents
HOURSRandom Sample Total
No. of No. ofPercent Students Percent Students Percent
Not Available28
or unemployed23.53 45 37.81 78 30.67
1 - 9 1 0.84 4 3.36 5 2.10
10 - 14 10 8.40 3 2.52 13 5.45
15 - 19 9 7.57 10 8.40 19 7.98
20 - 29 46 38.66 34 28.58 80 33.61
30 - 39 20 16.80 18 15.13 38 15.97
40 and above 5 4.20 5 4.20 10 4.20
Total 119 100.00 119 100.00 238 100.00..a. ....smemini........=/.111111111.
X? 0.51 df m 2 P .75 CVE Median w 24.45
Random Sample Median m 24.72
comparison was alos made of the hourly wages of CVE and employed
random sample students (See Table HH). Based upon the size of the
chi-square and observing the table it was concluded that the two groups
did not differ on hourly wages earned. The median hourly wage of CVE
students was $1.33 as compared with $1.42 for random sample students.
It was deemed advisable to ascertain whether the larger number of
CVE students VAS in any way related to the relationships which exist
between the two groups. Employment figures (See Table CC) have shawn
that ninety-eight CVE students were employed as compared with seventy-
four random, sample students. Comparisons were made of the two groups

Characteristics/86
across all data factors using only employed students. Chi-squares were
quite similar to the original comparison on which the total groups were
used. Therefore, it was concluded that the differences between groups
could not be attributed to the students mployment status during the
year of the study.
TABLE HH
HOURLY WAGES OF CVE AND RANDOM SAMPLE STUDENTS
Hourly Wage No,, of
Students
CVE
Percent
Random SampleNo. ofStudents Percent
TotalNo. ofStudents Percent
Not Availableor unemployed
.01 - .99
28
3
23.53
2.52
45
3
37.81
2.52
78
6
30.67
2.52
1.00 - 1,.24 14 11.76 9 7.57 23 9.66
1.25 - 1.49 50 42.02 35 29.41 85 35.72
1.50 - 1.74 18 15.13 21 17.65 39 16.39
1.75 and above 6 5.04 6 5.04 12 5.04
,Total 119 100.00 119 100. 00 238 100.00
X2 2.01 df s 3 P> .50

BIBLIOGRAPHY
1. Ausubel, David P. "Teaching Strategy for Culturally DeprivedPupils: Cognitive and Motivational Considerations,"School Review, 71 (Winter, 1963), 454-463.
2.311.07.JOALFIalleg_g_Ehal_anlatatat.
New York: Grune & Strattor, 1958.
ALAgke For Part-Time Coontrative Eiticatkomalsmams. Trenton:Vocational Division, Department of Education, State ofNew Jersey, 1965.
4. /lard, Barnard. "Why 7;:opout Campaigns Fail," allapitAmtm,(September 17, 1966), 78-79.
5. Barnes, Fred P, Research Tor Thu Practitioner In Education.Washington, D. C.: Department of Elementary SchoolPrincipala, National Education Association, 1964.
6. Benjamin, Judith G. Seymour Lash, and Marcia K. Freedman.
EmdgmtqaMalge.ALLtaganaktt. U. S. Departmentof Health, Education, and Welfare, Welfare Administration,Office of Juvenile Delinquency and Youth Development.Washington: U. S. Government Printing Office, 1965.
7. Burchill, George W. Work-Studyjlomoljgr.alenated Youth:A Casebook. Chitsgo: Science Research Associates, Inc.,1962.
8. Burke, Nelson and Alfred Simons. Some Implications froma Studyof IncmsgrgsgALRegolusg.. (Brochure) Chicago: The AmericanFederation of Teachers, AFL-CIO, 1966.
9. California.State Department of Education. Handbook of Workgag/lance Education: A Guide to tha Or anization and.glu#tion of Work Experienci_kagalgallagml. Sacramento:Author, 1965.
10. . Vocational Education Section. "Vocational EducationFor Persona with Special Needs," RCU Research Summaries.Sacramento: Author, 1966.
11. Centers, Richard. The PlycholoAy of Social Class. Princeton,New Jersey: Princeton University Press, 1949.
12. Champaign Public Schools. Prevocationa1 Services for HandicappedYouth,. Champaign, Illinois: Champaign Community Schools, 1961.

13, Conant, James Z. §lums and Suborbo. New York: McGraw Hill, 1961.
14. Confeopce.proceedinal. Washington: Golden Anniversary White HouseConference on Children and Youth, 1960.
15. Coompqixe StimalgaLlgUiciplu. Springfield, Illinois: Boardcf Vocational Education and Rehabilitation, State of Illinois,1966.
16. Coonerkave Vocational Education Materials. Champaign, Illinois:An Unpublished Collection of Project Materials. Office ofThe Chairman, Cooperative Vocational Education Program, 1966.
17. Crites, ,John O. "Measurement of Vocational Maturity in Adolescence:1. Attitude Test of the Vocational Development Inventory,"Psyshological mengaglig_glaspl and Applied, 79 (1965).
18. Draper, Dale C. Educating for Work. Washington: The NationalCommittee on Secondary Education of the National Associationof Secondary School Principals, 1967.
19. EducationashanAlmypyld of Work. Washington: Panel ofConsultants on Vocational Education, U. S. Department of Health,Education and Welfare, U. S. Governnent Printing Office, 1963.
20. Education Research Information Center (EV.C). Cataloa_of SelectedDocuments on the Disadvantaged: Number and Author Index.0E-37001. U. S. Department of Health, Education, and Welfare,Office of Education, Bureau of Research. Washington: U. S.Government Printing Office, 1966.
21. qaillogof Selected Documents on the Disadvantaaed:Sulliect index. U. S. Department of Health, Education, andWelfare, Office of Education, Bureau of Researcn. Washington:U. S. Government Printing Office, 1966.
22. Eisen, Norman B. "The Guidance Tool Called Work ExperienceEducation." Journal of Secosdary Education, 39 (December, 1964),372-50
23. Emerson, Lynn A. "The Way Ahead: Youth aud Vocational Education,"Chilaglny Education for a chaulayorld of Work. pp. 45-49.Chf.cago: The Research Council of the Great Cities Programfor School Improvement, 1966.
24. "Facts on American Education," NEA Resear.ch Bulletin, 44.
25. Federal Ileglgter. January 14, 1966.
2

26. Hickson, Ncthaniel. EducaCion for Alienation. Englewood Cliffs,
New Jersey: Prentice-Hall, Inc., 1966.
27. "Happenings In Industrial Educetion," School Shop,, (June) 1966), 7.
28. Holland, John L. Ths Pazsbolosy of lesmuujsmuLgsgsl. Waltham,
Massachuaetts: Blaisdell Publishing Co., 1966.
29. Huffman, Harry (Conference Coordinator). Guidelines for CooperativeEducation and Selected Materials from the National Seminar Held
Aueust 1-1.1966. Columbus, Ohio: The Center for Vocationaland Technical Education, The Ohio State University, 1967.
30. Hunt, David E. "Adolescence; Cultural Deprivation, Poverty and theDropout," Review of Educational Research, XXXVI: 4,
(October, 1966), 463-473.
31. Hunt, J. McVickers. htgagenceancerience. New York:
Ronald Press, 1961.
32. Illinois Board of Vocational Education and Rehabilitation, Vocationaland Technical Education Division. Cas2211;ive Supervised JobTrainimpulamAnynterim Evialuation Report, AuguEs2.1965...Springfield: Author, 1965.
33. Part-time Industrial Cooperative Education in Illinois,A Manual for Administrators and Coordinators. Series B,
Bulletin 198. Springfield: Author, 1966.
34. Janowitz, Gayle. Helping=Hands: Volunteer Work in Education.
Chicago: University of Chicago Press, 1965.
35. "Jobs and Occupations: A Popular Evaluation," 9111112n News,
9 (September, 1947), 3-13.
36. Jones, Edna X. Guide to Jobs for the Mental/Retarded. (Revised
Edition); Pittsburgh: American Institutes for Research, 1964.
37. Karnes, Merle. rrevocational ServimufarlIETILsamed Youth.Champaign, Illinois: Champaign Community Schools, 1961.
38. Kemp, Barbara H. "The Youth We Haven't Served," American Vocational
Journal, October, 1965. (Entire issue devoted to "Vocational
Programs for Disadvantaged Youth.")
39. The Youth We Haven't Served: A.chajler_aLsalesalEdttcation. U. S. Department of Health, Education, and Welfare,
OLUce of Education. Washington: U. S. Government Printing
OVice, 1966.
3

40. Kirk, Samuel A. EducatinaExceptional Children. Boston: HoughtonMifflin Co., 1962.
41. Kloes, Harold E. Illeschislaswa. Olympia, Washington: StateOffice of Public Instruction, 1963.
42. Kolstoe, 0. P. and R. M. Frey. ALLI/Eh School Work-Study ProeramFor nentallv Subnormal Students, Carbondale, Illinois:SouthernIllinois University, 1965.
43. Laycock, Samuel R. als&ellducatior in Canada. Toronto:W. J. Gage, Ltd., 1963.
44. Lord, Francis E. (Ed.) Work EducatioL :7or Educable Retarded Youth,Institutes on (Report). Los Angehs. 1964. Copies availablefrom College Bookstore, 5151 State Colleo Drive, Los Angeles,California, 90032.
45. Low, Seth. American's Children and Yeuth in Institutions, 1950-1960-1964: Almumtphis_Analysis,. U. S. Department of Health,Education, and Welfare, Welfare Ldministration, Children'sBureau, publication number 435-1ti5. Washington: U. S.Government Printing Office, 1965.
46. Mason, Ralph E. and Peter G. Haines. ApmatlygossimaismatEducation, and Work Experience in the Curriculum. Danville,Illinois: The Interstate Printers and Publishers, Inc., 1965.
A7. Massimo, J. L. and M. F. Shore. "Job-Fcaused Treatment ForAntisocial Youth," Children, 11 (Ju4-August, 1964), 143-6.
48. Meissner, Hanna H. (Ed.) Poverty in the_Affluent Society.New York: Harper & Row, 1966.
49, Montgomery County Public Schools. The Wo.O. Orientated Curriculum,Phase III Grade II. Rockville, Mary!and: Board of Education1964.
50. Murray, Evelyn. "Work: A Neglected Resource For Students,"Personael and Guidance Journal, 41 (immber, 1962),229-33.
51. National Society for the Study of Education. The Education ofExleptapalChildrsai.Forttearb!ok Part II.Chicago: The University of Chicago Press, 1950.
52. New Hampshire State Department of Education, Division of VocationalTeahnical Education. A Guide to the Orsanization end Operationof.Workaudx_Proerams. Concord: Auth:r, 1966.
4

53. O'Connor, Charles A., Jr. "Cooperative Work-Experience Program,"School Board Journal, 150 (March, 1965), 20.i
54. Pavlov, A. Harry. (Ed.) Education in De ressed Areas. New York:
Columbia University, Teachers College, 1963.
55. Pro ect Talent. Pittsburgh: liniversity of Pittsburgh, Schoolof Education, 1965.
56. Public Law 88-210. 88th Congress, Washington: U. S. GovernmentPrinting Office, 1963.
57. Rankin, L. S. and J. N. Gibson. Vocational Rehabilitation Servicesfor HiRh School Dropouts. Research Report 10-01,; June 1966.
Olympia, Washington: Research Office of the Department ofPublic Instruction, 1966.
58. Reeve, C. L. "Work-Study Programs: An Integral High SchoolCurricula," Journal of stelackimmmation, 39, (January, 1964),38-42.
59. Riessnan, Frank. The Cullatilly_peprived Child. New York:
Harper & Bros., 1962.
60. Roe, Anne. IbliughalogLat Occupations. New York: John Wiley .
and Sons, Inc., 1956.
61. Sanders, George. "The Work-Study Program Under the VocationalEducation Act of 1963," The Bulletin of the NationalAssociation of Secondary-School Principals, 49:301(May, 1965), Entire issue devoted to "Vocational Education:Tina for Decision."
62. Schreiber, Daniel. The School Dropout. Washington: ProjectSchool Dropout, National Education Association, 1964.
63. . Nork-Experience Programs," Social DeviancyAmonlyough. Chicago: National Society for the Study ofEducation, University of Chicago Press, 1966.
64. Siegel, Sidney. Non Parametric Statistics For The Behavioral
Sciences. New York: McGraw-Hill Book Co., Inc., 1956.WAINI..IMMONOMi
65. Slotkin, Herman. "New Prograns For Dropouts," The VocationalGuidan ce OuantELE, 12 (Winter, 1963-64), 127-32.
66. Stahlecker, L. V. "School-Work Programs For The Slow Learners,"
p_s_juka House, 38 (January, 1964), 299-301.
5

67. State of Iowa, State Department of Public Instruction. propoutl:Iowa Public Schools, July 1, 1963--June 30, 1964.Des Moines: Author, 1965.
68. The Qccjo and Technical Educattita,Fir,AA.Bmovi, Cambridge; Massachusetts Institute ofTeelnology, 1965.
69. Iraining ?or New Careers. The President's Committee on JuvenileDelinquency and Youth Crime, Washington: The Center ForYouth and Community ftudies, Howard University, 1965.
70. Vocatione.1 Versus Academic Students How They Compare AfterGrncl,pation. Pitnsburgh: The American Institute ForResnaech, 1966.
71. Urdal, Lloyd 6. (Principal investigator) plansam.ha_plalusaof Pnrsonal Variables Within the School Situation. ResearchRepont 02-01. Olympia, Washington: Office of State Super-intendent of Public Instruction, 1963.
72. U. S. Depnrtment of Agriculture, Economic and Statistical AnalysisDivision, Economic Research Service. Characteristics ofSchooi Dropouts and Hi h School GraduatIEL_Farm and Nonfarm,1960. Agricultural Economic Report No. 65. Washington: U. S.
Government Printing Offica, 1965.
73 U. S. Department of Commerce, Bureau of the Census, StatisticalRepotts Division. Statistical Abstract of the United States,1966 :87th annual edition). Washington: U. S. GovernmentPrintnng Office, 1966.
". U. S. Depnrtment of Health, Education, and Welfare. Education and
Traiet'A.E=Tattc,_&portunitx. Fourth Annual Report of theDepartment of Health, Education, and Welfare to the Congress onTraining Activities Under the Manpower Development and TrainingAct. Washington: U. S. Government Printing Office, 1966.
Office of Education. A Chance for a Chan e: New
School ProgrATTII&_NisakatitagecL. Washington: U. S.
Govertment Printing Office, 1966.
76. Directory of Public Seconder), Day Schools 1958-59.
0E-20(31. Washington: U. S. Government Printing Office, 1961.
77. . Amouts: Selected References. 0E-20070.
Washington: U. S. Government Printirg Office, 1964.
78. EduC-4..51.2AnfaULS.1149.2k1.2.211,14.-91-14olji,--Report,01.11 .of the Panel of Consultants on Vocational Education. 0E-80021.
Washington: U. S. Governmnnt Printing Office, 1963.
6

79. U. S. Department of Health, Education, and Welfare. Education '65shavort_tothe Profession. 0E-11006. Washington: U. S.Government Printing Office, 1966.
80. National Conference on Education of the Disadvantaged.held in Washington, D. C.,U. S. Government Printing
Repose of a national oonfersnesJuly 18-20, 1966. Washington:Office, 1966.
81. U. S. Department of Health, Education, and Welfare, Public HealthService. Mental Illness and its Treatment: Past & Present.Publication Number 1345. Washington: U. S. GovernmentPrinting Office, 1965.
82. U. S. Department of Healtt, Education, and Welfare, The Secretary'sCommittee on Mental Retardation. An Introduction to MentalRetardation: Problems. Plans and Ptomams June 1965.Washington: U. S. Government Printing Office, 1965.
83. . Mental Retardation Activities of the Department ofHealth Education andjlelfare: Annual Aaart, January 1966.Washington: U. S. aovernment Printiag Office, 1966.
34. U. S. Office of Education and Office of Economic Opportunity(joint publication). Education: An Answer to Povert .
Washington: U. S. Government Printing Office, 1966.
85. U. S. Department of Health, Education, and Welfare, VocationalRehabilitation Adminivtration. Rehabilitation--SpecialEducation Cooperation on Prevocational Programs forHandicapped Young Aduli:s. Proceedings of a Conference atHighland Park, Illinois, October 30-31 and November 1, 1961.Washington: U. S. Government Printing Office, 1963.
86. . Special Probleqa in Vocational Rehabilitation of theMentally_Egtarded. Proceedings of a conference sponsored bythe University of WisConsin, Madison, November 3-7, 1963.Rehabilitation Series No. 65-16.
87. . kaimApy Guidas in Case Load Mana ement for VocationalRehabilitation Staff. Third Institute on RehabilitationServices, May 24-27, :.965. Rehabilitation Services SeriesNumber 66-22. Washing:on: U. S. Government Printing Office, 1965.
88. U. S. Department of Health, Education, and Welfare, WelfareAdministration, Chilchen's Bureau. 21.hmuglellfglawyglcarlimIs.1.No. 421, Washington: U. S. Government Printing Office, 1964.
7

89. U. S. Department of Health, Education, and Welfare, Welfare
Administration, Children's Bureau. Research Relatim_to
_Children Studies in Progress on. Bulletin 19, January--
September 1965. Washington: U. S. Government Printing
Office, 1966.
90. U. IL Department of Roalth, Education, and Wolfare, Welfare Adminis-tration, Office of Juvenile Delinquency and Youth Development.
Youth Evjgxmenlirograms in Perspective. National Committee
on Employment of Youth. Washington: U. S. Government Printing
Office, 1965.
91. Getting HiKeL Getting Trained: A Study of Industrial
ilractices and Policies 43nl[gAILIEFIlsolswi. National
Committee on Employment of Youth. Washington: U. S.
Government Printing Office, 1965.
92. U. S. Department of Labor. nnpower Re ort of the President andA Renort of Manpower Requirements, Resources Utilization,
and Tratalna. Washington: U. S. Government Printing
Office, 1966.
93. Manpower Administration. DouL_JERIdetyl_plAtIonIL
of NYC Enrollees yiabjjaikna. Washington: U. S.
Government Printing Office, 1966.
94. , Manpower Administration, NYC. Americans's Youth at
Workl, NYC 1966. Washington: U. S. Government Printing
Office, 1966.
95. . pirectory_pf Nei hborhood Youth corps_kongors,
June 30 1966. Washington: U. S. Government Printing
Office, 1966.
96. :From a World of PolgIty_to_a Life outaat A Year
in the nYg. Washington: U. S. Government Printing Office,
(no date).
97. . NYC First National ConfereEctigport 1966.
Washington: U. S. Gevernment Printing Office, 1966.
96. University of the State of New York (The), The State Education
Department, Bureau of Guidance. kle1Eplaitaarklsk4Programs for Potential Drolagit=2Ltianual---STEP: The
§clos_LsoLlgammentimme. Albany: Author, 1965.
99. Vocational Services Committee, Illinois Commission on Children.
&Guideline foLam.trative Vocational Services for
Hayldicsmat_youth,at the 11111101 Level. Room 1010
Myers Building, Springfield, Illinois: Author, 1965.
8

100. Walsh, Raymond.. "The Relat±onship of Enrollment in PracticalArts and Vocational Courses to The Holding Power of TheComprehensive High School." Unpublished DoctoralDissertation, University of Missouri, Columbia, Missouri,1966.
101. Waber, George H. and Raymond L. Monello. IbmjnatputionolCare and TreatmenkcIES1liguLlbwerussegsks_DelifiquentChildren. No. 19. Department of Health, Education, andWelfare, Welfare Administration, Children's Bureau.Washington: U. S. Government Printing Office, 1965.
102. Wilson, James W., and Edward H. Lyons. Work-Study_Colagebsqualtu_layaisal and Re ort of the Study_oLemamvatgatEducation. New York: Harper 61 Brothers, 1961.
103. Wolfbein, Seymour.aim, 24 (Fe
"Employing The Next Generation."bruary, 1965), 26.
104. Younie, William J. (.d.). Guidelines for EsIghlAging_pchool-asijsylly Progiams For Educable Mentally Retarded Youth.48:10 Richmond, Virginia: Special Education Service,State Department of Education, 1966. .

UNPUBLISHED MATERIALS
1. Barich, George W. "Redlands Senior High School ComprehensiveWork Experience Education Program," Redlandi UnifiedSchool District, Redlands, California. (Mimeographed.)
2. Berta, Kenneth. "The Work-Study Program for the Educable MentallyRetarded in the Public High Schools" (an independent studyin special education at the University of Illinois, Champaign,1967).
3. Centko, Thomas John. "An Analysis of Cooperative.SecondaryPrevocational Programs for Exceptional Children" (unpublishedMaster's thesis, Illinois State University, Normal, 1966).
4. Demsher, Don, and Norvin Spence. "How Work Experience EducationCan Meet Specific Needs of Students Such As: Dropouts,Culturally Deprived, and Physically and Mentally Handicapped"(talk given at the Annual Conference of the CaliforniaAssociation of work experience educators, Northern CaliforniaSection, Asilomar Conference Center, Pacific Crove, February 3,
1967). (Mimeographed.)
5. Eisen, Norman B. "Work Experience Education in California High
Schools: Status, Evaluation, and Implications" (unpublishedDoctoral Dissertation, Education, University of SouthernCalifornia, Los Angeles, 1966).
6. Gilmore, Vern. "Results of Work Experience Education Questionnaireon Load and Responsibility" (a preconference survey for a
sectional meeting at the Annual State Convention of theCalifornia Association of Work Experience Educators atSan Diego, May 23, 1967).
7. Hillsborough County Public Schools. "Case Studies--The Work
Experience Program" (Tampa, Florida: Superintendent of
Schools, 1966). (mimeographed.)
8. Leimer, Margaret L. "A Survey of Work-Study for Junior High andSenior High Students Throughout the United States, with
Special Reference to Educable Mentally Handicapped Adolescents"
(unpublished Master's thesis, Chicago Teachers College, 1961).
9. San Juan Unified School District. "Work Experience Education"
(San Juan, California). (Mimeographed.)
10

10. Smith, Wes. "The Unique Contribution of Work Experience toSecondary Education" (paper read at the Annual Conferenceof the California Association of Work Experience Educators,Northam California Section, Asilomar Conference Center,Pacific Grove, February 3, 1967). (Mimeographed.)
11. Texas Education Agency. "Programa of Occupational Training"(selected outlines of modified curricula provided by WilliamE. Lovelace, Instructional Program Director, Austin, no date).
12. Venn, Grant, "Education, The Bridge Between Man and His Work"(paper read at the 29th Annual conference of the CaliforniaIndustrial Education Association, Sacramento, March 16, 1967).
11


TAME I
EXPENDITURES FOR VOCATIONAL =NATION, FISCAL YEAR 1966 C/
TOTAL
AlabamaAlaskaArizonaArkansasCaliforniaColoradoConnecticutDelawareFloridaGeorgiaHawaiiIdahoIllinoisIndianaIowaKansasKentuckyLouisianaMaineMarylandMassachusettsMichiganNInnesotaMftssissippiMissouri
MontanaNebradkaNevadaNew HampshireNew JerseyNew MexicoNew YorkNorth CarolinaNorth DakotaOhioOklahomaOregonPennsylvaniaRhode IslandSouth CarolinaSouth DakotaTennesseeTexasUtahVermontVirginiaWashingtonWest VirginiaWisconsin
Wyoming
Total$7717.47.787
Federal State Local9 $22g7a7946
18,031,262729,840
6,179170291157,514
61,067o 9926,118,3229,539,9172,430,690
30,865,94519,720,627
2,734o 3352,940,186
25,461,22616,100,6838,276,648To 960,435
14,005,95214,403,9152,658,676
14,958,85326,414,97032,820,85615,1451,76112,447,7918,881,869
1,700,8514,389,8104,763,2294,080,963
19° 2_,66,5103,9490576
74,556,12031,105,5833,3830710
330091464713,062,263
7,302032940,329,0144,051,833
12,887,2112,878,488
16,981,04854,673,85o6,026,1112,108,453
19,437008714,38700998,375,107
19176342182320801
24.1%49.1%30.0%35.9%27.2%55.5%*25.0%25.3%22.2%34.2%36.6%37.7%38-7%35.1%141.1%36.0%35.3%35.6%40.6%25.1%19.5%29.2%30.5%36.1%31:2%
35.3%44.3%12 .2%20.0%32.1%38.0%24.3%29.4%370%33-2%28..6431 57031.2%28.'634.1%37.5%36.2%
23.7%29.8%29.1%25.2%34 .9%5.9%
55.6%
3503% 40.6%25.7$ 25.2%
30.9% 37.1%34.5% 2906%1.3% 71.5%7.1% 37.4%
66.2% 88.8%66.8% 7.9%18.0% 59.8%26.7% 39.1%63.4%23.2% 39.1%18.5% 4208%10.9% 54.0%8.8% 50.116
11.4* 52.6%44.3% 20.4%4.5% 594%
41.5% 17.9%37.0% 37.9%31.7% 48.8%
9.3% 61.5%26.2% 43.3%29.9% 34.0%10.0% 58.8%
17.6% 47.1%11.2% 44.5%7.0% 80.8%
18.0% 62.0%29.8% 38.1%
5.6% 56.1437.1% 38 GO45.8% 24.8%26..3% 36.030.0% 36.8%8.4% 630%31.7% 36.8%17.6% 63.0%57.0 14.2%
36.5% 29.4$8.7% 53.8%
31.9% 31.9%
52.6% 21.43.o$ 73.3%
43.3% 26.9%32.9$ 31.8. o%
25.6% *9.cr9.4%
27.7%44.4%

TABLE II
EXPENDITURES FUR WRX-STUDY 1965-1966
Federal
Tar= $20,192,878
Alabama 263,286Alaska 000Arizona 190,037Arkansas 348-992California 1,673,186Colorado 207,697Connecticut 153,941Delaware 322 so 1160Florida 748,757Georgia 623,133Hawaii 107,771Idaho 7,480Illinois 875,781Indiana 208,274Iowa 201,157Kansas 107,921Kentucky 415,559Louisiana 537,117Maine 38,514Maryland 109,471Massachusetts 733,096Michigan 1,037,441Minnesota 306,232Mississippi 500,136Missouri 5,553Montana 2,009Nebraska 183,350Nevada 45,575New Hampshire 12,589New Jersey 914,011New Mexico 146,539New York 2,717,486North Carolina 572,948North Dakota 109,283Ohio 448,587Oklahoma 417,388Oregon 189,696Pennsylvania 959,266Rhode Island 144,994South Carolina 394489South Dakota 25,832Tennessee 6280203Texas 1,324,053Utah 211,840Vermont 000Virginia 161,027Washington 410,643West Virginia 356,232Wisconsin 2340440Wyoming 59,706
State and/ Percent of Federalor Local
$528,523
8,8326,117
50000
1.965
45,339
1,755
218,2428,24419,855
45,494693
13,035
85,50823,444
Imnit on
8-97%
6.06%
10.15%10.62%10.006.12%6.45%19.9$10.93%9.24%10.80%6.73%8.89%
3-68%7.10377%8.41%10.47%3.56%
14.23%10.82%6.50
11.13%.20%.34%
9-43%7.84%15.42%14.78%
9-7414.99%6.26%
8.73%4,08%11.108.25%
1341%64208-97%2.93%30.22%2.42%9.13%
2.84%11.31%12.18%11.86%5-73%

Alabama
Alaska
Arizona
Arkansas
CalifOrnia
Colorado
Connecticut
Delaware
Florida
Georgia
Hawaii
Idaho
tllinois
Indiana
!owe
Kansas
Kentucky
Louisiana
Maine
Maryland
Massachusetts
Michigan
Minnesota
Mississippi
Missouri
TAME I/I
TCPAL ENROLLMENT GMADES 10; 11, 12 and 12 ONLY
PUBLIC HIGH SCHOOLS ONLY
1,01
_142
_12
163,
508
8,94
966
,6io
89,8
78831,071
94,042
102,278
20, 402
245,059
194,604
30,379
38,890
376,607
220,205
129,994
107,166
144,034
143,037
42,416
143,938
192,749
342,253
173,423
103,023
183,657
12 only,
47,692
2,575
20,252
27,347
250,388
29,288
31,766
6,109
51,537
81,868
11,735
13,883
123,057
69,451
48,019
35,717
40,583
41,769
13,952
43,621
58,500
111,000
54,549
30,355
57,267
Montana
Nebraska
Nevada
Nev Hampshire
New jersey
New Mexico
New York
North Carolina
North Dakota
Ohio
Oklahoma
Oregon
Pennsylvania
Rhode Island
South Carolina
South Dakota
Tennessee
Texas
Utah
Vermont
Virginia
Washington
West Virginia
Wisconsin
Wyoming
Tyr
=
10, 11, 12
34,465
65,810
18,391
25,168
251,000
51,603
629,330
35,205
31,650
437,787
123,868
99,118
463,794
20,240
1C7,615
34,687
167,240
446,808
55,874
/6,301
182,201
153,960
92,855
186,362
17,328
8014
0:92
0
E.2E1X
10,633
20,490
5,273
7,882
79,000
15,754
180,463
69,117
10,012
140,746
37,320
31,127
142,5C7
9,238
34,715
10,739
50,287
182,488
16,491
4,997
54,323
49,764
27,839
59,342
6,031
2,558,858

TABLE
Pr
CONCURRENT WORK-RDWATION PROGRAM
Total
mopLytr AmaeltEnt
T & I
D.E.
B.E.
ROme Ed D.O.
Cooperative
TOTALS
2704
296
923
2193
846
25
515
4800
Alabama
94
o68
66
37
o30
201
Alaska
0o
o4
oo
o4
Arizona
19
09
32
7o
o48
Arkansas
152
00
21
00
17
38
California
126
131
086
oo
o217
Colorado
44
56
37
04
o52
Connecticut
43
01
23
32
233
Delaware
29
0o
9o
oo
9Florida
78
co
o60
36
o142
238
Georgia
13
00
43
40
o75
158
Hawaii
34
03
lo
5o
018
Idaho
3o
010
9o
120
Illinois
117
11
79
87
35
o93
305
Indiana
11
10
34
34
29
1go
Iowa
66
00
27
28
31
co
86
Kansas
26
514
23
16
o2
60
Kentucky
Louisiana
Maine
Maryland
Massachusetts
Michigan
Minnesota
Mississippi
Missouri
56
0111
05
019
134
0
113
97
12
0119
0108
0
052
00
052
o35
12
00
47
10
4o
oo
14
618
1ea
o26
19
31
8o
o58
145
13 24 0
189
201
4130
18
o0
0
00
632
020
104
oo
42
0TT
TT
Table IV continued

TA
BL
E /V
(co
ntin
ued)
CO
NC
UR
RE
NT
WO
PK-E
DU
CA
TIO
N P
RO
GR
AM
S
Wor
k.St
udy
Agr
icul
ture
T &
ID
.E.
13.E
.R
ome
Ec
Tot
al
Mon
tana
10
09
oo
o9
Neb
rask
a32
23
120
09
26N
evad
a6
o0
72
02
li
New
Ham
pshi
re3
00
3.o
oo
1N
ev J
erse
y95
o48
48
34
o0
130
New
Ab3
ci.c
o32
o0
171
03
23.
New
Yor
k16
9o
49
149
69
032
299
Nor
th C
arol
ina
139
olio
133
00
o24
3N
orth
Dak
ota
33
o0
1233
0o
45
Ohi
o49
o4
113
565
017
8
Ckl
ahom
a62
422
3825
00
89O
rego
n22
o0
41o
oo
41
Penn
sylv
ania
270
063
.o
00
61R
hode
Isl
and
11
66
3o
3.0
16
Sout
h C
arol
ina
105
o26
62
o0
0.88
Sout
h D
akot
a2
00
121
o2
15T
enne
ssee
600
2149
o0
070
Tex
as22
08
83.
223.
50o
236
2U
tah
40
02
3017
45
58V
erm
ont
o16
26
00
024
Vir
gini
a75
o90
105
76o
027
1W
ashi
ngto
n47
o0
79
oo
079
Wes
t Vir
gini
a47
00
111
oo
12W
isco
nsin
210
15
5o
o11
Wyo
min
g7
00
83
00
11

TABLE V
CONCURRENT WOMEDUCATION MOW=
BY PROGRAM
Total Enrollment in Schools with CWE
Total &reales*. in CWE Programs
Total Enrollment in WorkStudy
Total Enrollment in all Cooperative Programs
Total Enrollment in Cooperative DistributiveEducation
Tata Enrollment in CooperativeIndustry
in CooperativeEducation
in Di Versified
in Cooperative
in Cooperative
in CooperativeOccupations
Total Enrollment
Total Enrollment
Total Enrollment
Total Enrollment
Total Enrollment
Trade and
Business
Occupations
Agriculture
Rome Economics
Health
TMALS
4,285,587
173,513
52,235
123,278
59,893
23,845
18,248
15,540
3,235
454
63
MGR SCHOOLSONLY
3,9698847
161,852
44,817
117,035
57,479
22,890
17,855
15,303
3,039
406
63

APPENDIX

CODING FORMAT FOR clusenomaxaz
Column Item
1 Reimbursed Concurrent Work-Education, 19654966
2 Reimbursed Concurrent Work-Education, 1966-67
3 Work-Study, 1965.1966
Work-Study, .1966.3.967
5Non-Reinibursed Concurrent Work.Education, 1.965.1966
6 Non-Reisibareed Concurrent Work-Education, 19661967
Concurrent Work-ftic=tion for Handicapped, 1965-1966
8 Concurrent Work...Education ftrandicapped, 19664967
9 31ank
10 Nutber of Programs Participating for Handicapped
11 Blank
First or Second Questionnaire Returned

CODING FORMAT FOR DATA COLLECTED FOR EACH SCHOOL WITH A OWE PROGRAM
COLUMN ITEM CODE
1 thra 12 school name
13 blank
14 thru 26 city
27 blank
28 population density the 25 metro areas
292 other std. stet. areas
3s other cities over 50,000
4s cities between 25,000 and
49,999
5. cities 10,000 to 24,999
6s towns 5,000 to 9,999
Ts' all others
29,30,31,32 total enrollment in grades 10,11, and 12
33,34 lowest grade in school district
35,36 highest grade In school district
37,38 lowest grade in the school
39,40 highest grade in the school
41,42 rank order of state on money available to education
43 classification of school within the state on finance
high
28. middle
3" low
4105,46 enrollment in work-study
47,48,49 enrollment in coop. agriculture
50,51,52 enrollment in coop. trade and industry
53,54,55 enrollment in coop. distributtve education
56,57,58 enrollment in business and office occupations
59,60,61 enrollment in coop. home economics
62,63,64 enrollment in coop. experimental programs
65,66,67 enrollment in coop. health occupations
68,69,70 enrollments in programs not classified elsewhere
71,72,73 enrollment in diversified occmpations programs
74,75,76 school77,78 state I.D.
79,80 card I.D. (03)
-

CHECK LIST
F/LL IN CORRECT NAMES FROM DIRECTORY BEFORE LEAVING THE OFFICE.IF NECESSARY MAKE CHANGES DURING VISIT.
State.
ec, HELLO to:
Researcher
State Superintendent of Instruction
Etplain Project (briefly) to:State Director of Vo-Ed
Visit Supervisors:
Request:
Secretary
Work-Study
Secretary
T I
(1) 4o42.4o48forms
(2) State Plan Secretary(3) Areas vith
CWE(4) Note Grade Agriculture
RestrictionProgram
Secretary
D.E.
Secretary
Business Ed
Secretary
Office Occupations....
Secretary
D.O.
Date
Home Economics
Secretary
bther
Obtain from each:
Students by:
(1) age(2) grade
(3) job(4) school
Obtain from someone:
(1) school enrollments10, 11, and 12
(2) finances(3) pertinent pUblicse.
tions
Use back of this sheetfor anecdotal comments.

UNWICESITY or ILLINOIS COLT...a:am or EDUCATION
Wt)Rk t DM A CUN[ '1E- AR( H (E NTER
iDEPARTMENT OF VOCATIONALAND TECHNICAL EDUCATION
57 EAST ARMORY AVENUECHAMPAIGN, ILLINOIS 61820TELEPHONE (217) 333- 6178
Dear School Administrator:
Concurrent work-education programs are a rapidly expanding type of educational program.Some educators feel they are especially suitable to the needs of many non-University bound stu-dents and, as such, a welcomed addition to the curriculum. It is vital to our national study thatyou, as a representative of a carefully selected sample of schools, be responsive to this letter.
"Concurrent work-education programs" include all school programs which provide studentswith formal education and conjunctive work experience. Please check the boxes below indicat-ing whether you had various types of concurrent work-education programs in the years noted.Answer completelypositive and negative responses are equally important to us.
65-66 66-67 Reimbursed Cooperative Vocational Education: ?rogram titles such as Distri-ElYes nYes butive Education, Otiice Occupations, Diversified Occupations as well as many
ENo riNo less universal titles are included. Also included are agriculture programswhich intend to place all students in part-time jobs for wages during the regularschool year. Excluded here are (1) vocational programs which occasionally orincidentally place studertts, and (2) reimbursed cooperative programs described
in the categories below.
65-66 66-67 Work-Study: A program where students in vocational programs, who have need
FlYes FlYes of financial assistance, are placed in public agencies(mainly the local school).
riNo riNo This program is defined and subsidized under the provisions of Public Law88-210.
65-66 66-67 Non-reimbursed Cooperative Vocational Education: These programs may inFlYes many respects be similar to "Reimbursed Cooperative Vocational Education"
No riNo above but they do not receive Federal reimbursement under the provisions ofvocational education legislation. Excluded here are special programs for the"handicapped" described below.
65-66 66-67 Work-Education for "Handicapped": Students who are not likely to profit fromYes nYes regular academic and vocational offerings are, for our purposes, considered
ONo FiNo handicapped. They may or may not be served by special education personnel.All of the following descriptive terms are applicable to this concept of handi-capped: mentally retarded, slow learners, reluctant learners, potential drop-outs, economically disadvantaged, culturally deprived, and alienated.
How many distinct types of work-education programs are provided particu-larly for handicapped students? (Excluding Work-Study.)
ClYes
N =CD
Respondent's Nome
Respondent's Position
Sincerely and appreciatively,
William John SchillProject Director
s

IL
Established pursuant to a contract with the United States Department
of Health, Education, and Welfare, Office of Education, to investigatethe conduct and consequences of concurrent work-rducation programswithin the public schools.
UNIVERSITY OF ILLINOISCOLLEGE OF EDUCATIONDEPARTMENT OF VOCATIONAL AND TECHNICAL EDUCATION
,
\A

CONDUCT AND CONSEQUENCES
Concurrent work-education is an old educational con-cept that has grown in application during the pastfew years. Regardless of the reasons for the recentgrowth of concurrent work-education programs, it isessential that a nationwide assessment be conductedif the overall planning activity of vocational andtechnical education is to be properly guided. Thisproject is designed to satisfy the need for a nation-wide assessment.
DEFINITION
The term "concurrent work-education programs" in-cludes all puolic high school and junior college pro-grams that provide students with formal educationand conjunctive work experience. This definition isbroad enough to include pi ograms encompassed byvarious other general titles in common usage such asCooperative Education, Work Education, and WorkExperience. More specific titles within the realm ofconcurrent work-education programs include: Dis-tributive Education (D.E.), Office Occupations(0.0.), Diversified Occupations, (D.0.), and manyother but usually less universal titles such as Part-timeIndustrial Cooperative Education and Agri-business.Recently, the term work-study has been specificallydefined under Public Law 88-210, and it, too, is in-cluded. It is the intent of the above definition, there-fore, that any and all programs which satisfy thecriteria noted be included in this study. Differencesin usage of terminology shall not eliminate programsfrom this study.
RESEARCH FORMAT
This project has two interrelated parts or phases: (a)a descriptive study of the conduct or status of con-current work-education programs in each of the 50states, and (b) an in-depth study of the consequencesof concurrent work-education programs at thirty sites.
CONDUCT (DESCRIPTIVE PHASE) :
There are over 1,500 concurrent work-educationprograms among 27,000 public high schools and anunknown number of programs in the more than 500junior colleges in the United States. Work-educationdata and methods of collection and reporting datadiffer from state to state. This phase will attempt tosystematize and consolidate the data that exist relativeto concurrent work-education programs in the variousgovernmental offices throughout the 50 states and theDistrict of Columbia.
It is expected that the records at U.S.O.E. and the 50state offices of public instruction will provide some ofthe following data about concurrent work-educationprograms:
1. Number of students in concurrent work-educationprograms by occupational area and sex. IL)
2. Names of schools with concurrent work-educationprograms and the pertinent school official names.
3. Type of federal assistance given each program andthe approximate per cent of the federal contribu-tion to the total cost.
4. Type and number of professional personnel as-signed to concurrent work-education programs.

RESEARCH FORMATThis project has two interrelated parts or phases: (a)a descriptive study of the conduct or status of con-current work-education programs in each of the 50states, and (b) an in-depth study of the consequencesof concurrent work-education programs at thirty sites.
CONDUCT (DESCRIPTIVE PHASE)
There are over 1,500 concurrent work-educationprograms among 27,000 public high schools and anunknown number of programs in the more than 500junior colleges in the United States. Work-educationdata and methods of collection and reporting datadiffer from state to state. This phase will attempt tosystematize and consolidate the data that exist relativeto concurrent work-education programs in the variousgovernmental offices throughout the 50 states and theDistrict of Columbia.
It is expected that the records at U.S.O.E. and the 50state offices of public instruction will provide some ofthe following data about concurrent work-education
programs:
1. Number of students in concurrent work-educationprograms by occupational area and sex.
2. Names of schools with concurrent work-educationprograms and the pertinent school official nameF.,
3. Type of federal assistance given each program andthe approximate per cent of the federal contribu-tion to the total cost.
4. Type and number of professional personnel as-signed to concurrent work-education programs.
In instances where the data are incomplete, data willbe solicited from individual schools.
Direct contact with a 10 per cent sample of seniorhigh schools in the United States will be conducted
to identify schools operating concurrent work-educa-tion programs without financial assistance from thefederal government.
CONSEQUENCES (DEPTH STUDY PHASE)
There are many objectives of concurrent work-educa-tion programs. Desirable as these objectives may be,the extent to which concurrent work-education con-tributes to their realization has yet to be tested. Thedegree to which these objectives are realized canprovide a measure of assessment of the various typesof concurrent work-education programs. This assess-ment will also include the relative accessibility of theprograms to the students and the extent to whichemployers are willing to cooperate by providing work
stations.
From the universe of concurrent work-education pro-grams, an atypical sample of 30 schools with two or
alore concurrent work-education programs will belected for study in greater depth. The selection of
this sample will be the responsibility of the projectdirector and, in each case, will require the consent of
pertinent school administrators.
It is not intended that 30 schools will provide statis-tical reliability which permits generalization to con-current work-education programs across the country.However, the 30 schools selected will provide data

which will illuminate the relationships between thecharacteristics of particular programs and changes instudent behavior.
DATA COLLECTION, ANALYSIS,AND DISTRIBUTION OF REPORTThe University of Illinois is responsible for the com-pilation and analysis of all data. However, to mini-mize travel and expedite data collection, professorsfrom five other institutions are involved in the actualdata collection. The research staff at the Universityof Illinois has collected the data from U.S.O.E. andselected midwestern state offices, refining the formatfor use by the regional data collectors.
Most of the data are quantitative and consequentlycan be reported in raw form with measures of centraltendency. All data collected will be held in strictconfidence by the professional research staff. No indi-vidual or institution will be identifiable in the reports.Upon completion of the study, the final report will bemade available upon request free of charge to allparticipating programs, agencies, organizations, andindividuals.
CONDUCTED BY:Work-Education Research CenterUniversity of Illinois57 East Armory AvenueChampaign, Illinois 61820Phone: 217 333-6178
217 333-6179
WERC STAFF:Dr. William J. SchillPrincipal Investigator and DirectorMr. Phillip BairdAssistant to the Director
RESEARCH ASSOCIATES:
Mr. Menno DiLibertoMr. James E. GallagherMr. Thomas R. JensenMr. J. William Ullery