from emergency department to hospitalization: using ... · pdf file1 introduction and...
TRANSCRIPT
From Emergency Department to Hospitalization:Using Simulation, Empirical and Theoretical Models forthe Operational Analysis of ED, IW, and their Interface
or
Emergency Department, Hospitalization (or IW), andeverything in between: Using Simulation, Empirical and
Theoretical Models for the Operational Analysis ofHospitals
January 8, 2009
Avishai Mandelbaum • Yariv Marmor • Yulia Tseytlin • Galit Yom-Tov
Faculty of Industrial Engineering and Management,Technion – Israel Institute of Technology, Haifa, 32000, ISRAEL
[email protected] • [email protected] • [email protected] •[email protected]
Abstract
Write an abstract...
Contents
1 Introduction and Literature Review 3
1.1 Background: Hospital, ED and IW . . . . . . . . . . . . . . . . . . . . . . . 3
1.2 Process Charts . . . . . . . . . . . . . . . . . . . . . . . . . . . . . . . . . . 4
1.2.1 ED . . . . . . . . . . . . . . . . . . . . . . . . . . . . . . . . . . . . . 4
1.2.2 ED to IW . . . . . . . . . . . . . . . . . . . . . . . . . . . . . . . . . 4
1.2.3 IW . . . . . . . . . . . . . . . . . . . . . . . . . . . . . . . . . . . . . 4
1.3 Literature Review . . . . . . . . . . . . . . . . . . . . . . . . . . . . . . . . . 13
1.4 Measurements . . . . . . . . . . . . . . . . . . . . . . . . . . . . . . . . . . . 13
1.5 Data Description . . . . . . . . . . . . . . . . . . . . . . . . . . . . . . . . . 13
1

2 Analysis of the collected data and validation of the empirical and simula-
tion models 16
2.1 Empirical Analysis of Emergency Department . . . . . . . . . . . . . . . . . 16
2.1.1 Arrival, Departure, and Occupied Beds rate in the ED . . . . . . . . 16
2.1.2 Length Of Stay (LOS) in the ED . . . . . . . . . . . . . . . . . . . . 18
2.1.3 The impact of Bed Occupancy on LOS . . . . . . . . . . . . . . . . . 18
2.2 Empirical Analysis of Internal Wards . . . . . . . . . . . . . . . . . . . . . . 23
2.2.1 Length Of Stay (LOS) in the IW . . . . . . . . . . . . . . . . . . . . 23
2.2.2 Arrivals and Departures in the IW . . . . . . . . . . . . . . . . . . . 23
2.2.3 Determining Length Of Stay in IW as a function of the work load (see
Appendix A - 1). . . . . . . . . . . . . . . . . . . . . . . . . . . . . . 24
2.3 Empirical Analysis of Transfers in the system . . . . . . . . . . . . . . . . . 31
2.3.1 Waiting times from ED to IW . . . . . . . . . . . . . . . . . . . . . . 31
2.3.2 Waiting times from ED to ICU . . . . . . . . . . . . . . . . . . . . . 31
3 Analysis of the system (using combined simulation and/or analytical mod-
els). 32
3.1 Two interesting questions for ED . . . . . . . . . . . . . . . . . . . . . . . . 32
3.2 Two interesting questions for IW . . . . . . . . . . . . . . . . . . . . . . . . 32
3.3 Two interesting questions for the transfer process from ED to IW . . . . . . 32
3.4 Two interesting questions for the whole process . . . . . . . . . . . . . . . . 33
4 Special events 33
A Meetings summary 35
2

1 Introduction and Literature Review
Health care systems in general, and hospitals in particular, represent a very important part
of the service sector. Over the years, hospitals have been successful in using medical and
technical innovations to deliver more effective clinical treatments while reducing patients’
time spent in the hospital. However, hospitals are typically rife with inefficiencies and delays,
thus present a propitious ground for many research projects in numerous science fields, and
in the Operations Research field in particular.
A hospital is an institution for health care, which is able to provide long-term patient
stays. Hospitals include numerous medical units specializing each in a different area of
medicine, such as internal, surgery, intensive care, obstetrics, and so forth. In most of the
large hospitals there are several similar medical units operating in parallel. In our research
we focus on an Emergency Department (ED), five Internal Wards (IW) and an interface
between them in Rambam/ Anonymous? Hospital.
This report is structured as follows: first we provide a background on the hospital, the
medical units in question, the problems involved, and survey the relevant literature. Then
...
1.1 Background: Hospital, ED and IW
Anonymous Hospital is a large Israeli hospital with about 1000 beds, 45 medical units,
and about 75,000 patients hospitalized yearly. Among the variety of its medical sections,
the hospital has a large Department of Emergency Medicine with a capacity of 40 beds; and
five Internal Wards, denoted from A to E.
The ED receives and treats more than 200 patients daily, and is divided into two major
subunits: Internal and Trauma (surgical and orthopedic patients), each of those is divided
into “walking” and “lying” subunits, according to the state of patients treated there. An
internal patient, whom the ED decides to hospitalize, is directed to one of the five Internal
Wards according to a certain routing policy - and this process is precisely our focus of
interest.
Internal Medicine Departments are responsible for the treatment of a wide range of
internal disorders, providing inpatient medical care to thousands of patients each year. Wards
A-D are more or less the same in their medical capabilities - each can treat multiple types
3

of patients. Ward E, on the other hand, treats only “walking” patients, and the routing
process from the ED to it differs from the one to the other wards.
1.2 Process Charts
Below we describe the simulation models (ED, ED to IW, and IW) by using flow charts,
such as Resources Flow charts, Information Flow charts, Activities Flow Charts, and Activ-
ities - Resources Flow Chart.
1.2.1 ED
When patients arrive to the ED, either walking or assisted by a stretcher or wheelchair, the
first step is assessment, which is typically followed by directing the patients to an appropriate
bay where they wait for their next stage of treatment. This stage of the medical-process is
called Triage if performed by the medical staff (nurse or physician). There are possibly pro-
cedures prior to the Triage, which include an initial assessment, by medical and non-medical
personnel, such as clerks and ambulance officers (Brentnall 1997), and/or the initiation of
diagnostic tests, by a (registered) nurse (Cheung et al., 2002). Such pre-Triage steps aim at
accelerating patients flow.
In the following figures, we depict the overall patient’s process within the ED, from
some varying point of views: a precedence diagram of activities, patients’ flow among the
resources, a combined activity-resource diagram, and information flow.
1.2.2 ED to IW
One can fully appreciate the complexity of the process in the Integrated (Activities - Re-
sources) Flow Chart (see Figure 5) and other flow charts (see Figures 6, 7 and 8).
1.2.3 IW
4

) 08/01/2009(
4
Figure 1 - Activity (Flow) Chart
Labs
Treatment
Awaiting
evacuation
Administrative reception
Vital signs & Anamnesis
First
Examination
Imagine:
X-Ray, CT,
Ultrasound
Follow-up
Instruction prior
discharge
Waiting
hospitalized
Administrative discharge
Consultation
Decision
A A A B
B
B
C
C C C
C
Alternative Operation -
Ending point of alternative operation -
C
Figure 1: Activities Flow Chart in the ED
5

) 08/01/2009(
5
Administrative secretary
Nurse
Labs
Physician
Consultant
CT
X-Ray
Ultrasound
Alternative Operation -
Recourse Queue - Synchronization Queue –
Ending point of alternative operation -
C
Figure 2 - Resource (Flow) Chart
A
A
A
A
A A B
B
B
B
B
C
C D
D
Figure 2: Resources Flow Chart in the ED
6

) 08/01/2009(
6
Ending point of alternative operation -
Figure 3 - Information (Flow) Chart
Backgrounds
Receptions
Family doctor/ Internet/
Community
Clinical Information
Nursing Information
Nurse
Physician
Test tube and results
Labs
Shot result or prognosis
Imagine
Clinical Information
Consult
Collecting ResultNurse
Clinical Information
Coordination with outsources
Nurse / ED Receptions
Figure 3: Information Flow Chart in the ED
7
) 08/01/2009(
7
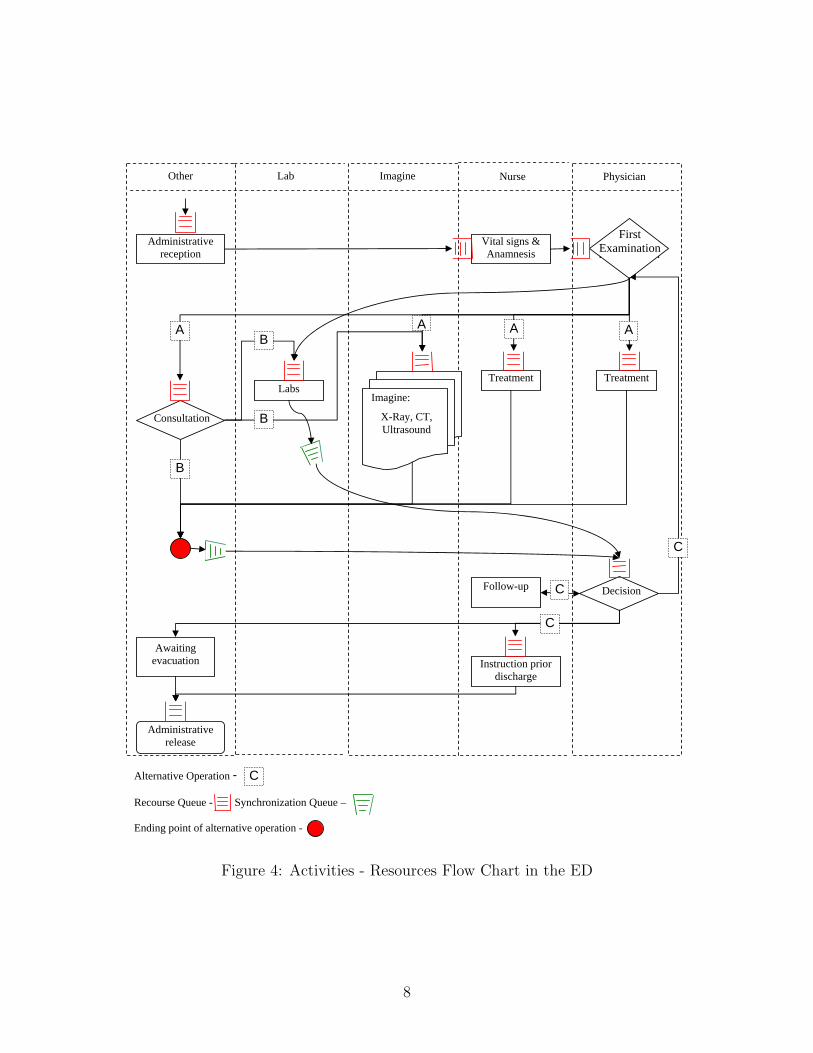
Figure 4 - Activities-Resources (Flow) Chart
Physician NurseImagineLabOther
Follow-up
Instruction prior discharge
Awaiting evacuation
Administrative release
First
Examination
Decision
Labs Treatment
Administrative reception
Vital signs & Anamnesis
Imagine:
X-Ray, CT, Ultrasound
Treatment
Consultation
First Examination
Alternative Operation -
Recourse Queue - Synchronization Queue –
Ending point of alternative operation -
C
A A A A B
B
B
C
C
C
Figure 4: Activities - Resources Flow Chart in the ED
8

Figure 5: Integrated (Activities - Resources) Flow Chart
ED physician
IW nurse, Help force
Stretcher Bearer
IW nurse in charge
General NurseReceptionistED nurse in
chargeIW
physician
Hospitaliza-tion
decision
Patient allocation request
Transferal time
decision
Patient’s status
updating
Coordination with the IW
Running the Justice Table
Request skipping?
Approve skipping?
Initial measurements
collection
Patient’s transferal
Availability check
Bed preparation
Initial medical check
Yes
No
YesNo
Resource Queue - Synchronization Queue -
Availability check
Ventilated patient
- Ending point of simultaneous processes
Transferal time
decision
“Walking patient” Ward E
Ward E
Ward E
9

Figure 6: Activities Flow Chart
Hospitalization decision
Assigning Ward (A-D) with the Justice Table
Ward requests skipping
Transferal time decision
Patient’s status updating
Management approves skipping
Bed preparation
Yes
No
Yes
No
Initial measurements collection
Transferal to the Ward
Initial physician check
Coordination with medical staff
Ventilated patient?
No
YesCoordination with medical staff in
the ED
“Walking” patient? Yes
No
Assigned to Ward E
* Processes in broken line occur in the IW
- Ending point of simultaneous processes
Ward E
Wards A-D
Bed preparationWard E
10

Figure 7: Resources Flow Chart
Resource Queue - Synchronization Queue -
ED physician
ED nurse in chargeReceptionist IW nurse in
charge
General Nurse
IW physicianStretcher Bearer
Help forceIW nurse
Allocation
Skippingrequest
Ventilated patient
- Ending point of simultaneous processes
Transferal
Measurements
Medical check
Coordination
11

Figure 8: Information Flow Chart
ED medical file
ED physician
Type (regular, special care, ventilated)
ED nurse in charge
Allocation: Ward A-D
Receptionist
Transfer time
IW nurse in charge
Skipping granted/ not granted
General nurse
Skipping request + reasons
IW nurse in charge
Patient’s status updating
ED nurse in charge
Type + medical information
ED nurse in charge
Preparation for patient’s admission
IW nurse in charge
Medical check results
IW physician
Initial measurements results
IW nurse in charge
Availability check
Bed readiness check
Help force
Clinical information
ED physician
Ventilatedpatient
Transfer time updating
ED nurse in charge
Availability check
- Ending point of simultaneous processes
Availability check
ED physician or nurse
Ventilatedpatient
Ventilatedpatient
IW nurse
IW physician
12

1.3 Literature Review
OR in health care - general (Green): [4], [5]
Yariv’s simulation: [7]
The Impact of Work Load on LOS: [3]
Some more on hospitals...: [1], [6], [2]
Add: Galit’s thesis, paper about measures, Yulia’s and Asaf’s project, more?
1.4 Measurements
As it was shown in above, the ED presents a very complicated service system. As we
know, every patient that enters the hospital implies a certain amount of workload on the
system. The uniqueness of the ED emerges from several facts (but these facts are true for
all the wards?):
1. Each patient undergoes few processes in the ED, and some of them are recurrent. For
example, a typical walking patient’s routing might be: nurse, doctor, blood test, nurse,
doctor.
2. There are several types of patients (internal, surgical, walking, lying etc.), and each
type requires different resources of the ED.
3. The arrival process to the ED is time-dependent.
These facts might arouse difficulties in using the typical OR measurement - some measure-
ments require adjustments. From the literature we learn about several measurements that
were designed exclusively for measuring ED workload, such as EDWIN, NEDOCS, READI
and Work Score (add reference).
1.5 Data Description
This documentation describes patient-level data at Emergency Department of “Anony-
mous” Hospital in Israel. The data was recorded over the following periods: 1/1/2004 -
1/12/2008. There are four compatible tables, that describe the hospital operations. The
first table (ED) contains the following individual patient’s arrivals data records: The details
of the patients and time stamp of his arrival and his departure. The second table (Jus-
tice Table) contains the details of the patients transferred from ED to IW. The third table
13
(Hospital Transfers) contains individual patient’s arrivals and departures records from hos-
pital’s wards. The fourth table (OR) contains individual patient’s arrivals and departures
records from hospital’s operation rooms.
We now present the field descriptions for each of the tables.
1. ED Table
• key - a unique number identifies each patient. The hospitals replaced the patients
ID numbers with a unique generate number.
• AdmissionNo - Patients in ”Anonymous ED” are identified by a serial num-
ber starting with the year and continued by sequential 6 digits number (e.g.
1999000001)
• AdmissionDate - The patient’s arrival time and date. It is recorded when the
admission secretary type the patient into the system. The format is ”dd/mm/yyyy
hh:mm:ss”.
• Discharge - The patient’s departure time and date. It is recorded when the ad-
mission secretary type the patient into the system. The format is ”dd/mm/yyyy
hh:mm:ss”.
• SubUnitID - The code type of ward where the patients are admitted in the ED
(as typed by the admission secretary). The explanations of the codes are given in
the next column. (5 digits)
• UnitName- The name of the ward where the patients are admitted in the ED.
• BirthDate - The patient’s day of birth.
• Gender - The gender of the patient (”M” for male and ”F” for female).
• AdmissionCode - The code describing the patients general cause of admitting (as
typed by the admission secretary). The description of the code is listed in the
next column.
• AdmissionDesc - The description of the patients general cause of admitting.
• SendByCode - The code describing the authority that sends the patients to the
ED (as typed by the admission secretary). The description of the code is listed
in the next column.
14
• SendByDesc - The description of the authority that sends the patients to the ED.
• SendLetter - The presence / absence of an application letter from the authority
that send the patients to the ED. (”Y” for presence and ”N” for absence).
• ComplainRsnCode - The code describing the patient’s complains in his arrivals
to the ED (as typed by the admission secretary). The description of the code is
listed in the next column.
• ComplainRsnDesc - The description of the patient’s complains in his arrivals to
the ED.
• BodyPartCode - The code describing the patient body part on which he com-
plained for admitting (as typed by the admission secretary). The description of
the code is listed in the next column.
• BodyPartDesc - The description of the patient body part on which he complained
for admitting.
• ArrivalStateCode - The status code of the patient arrivals (as typed by the ad-
mission secretary). The description of the code is listed in the next column.
• ArrivalStatusDesc - The description of the patient’s status arrivals to the ED -
wheelchair / stretcher.
• ProcedureCode - The code describing the procedures the patient went through
while in the ED (the procedures that the staff typed into the patient’s log). The
details are listed just for the patients that released from the ED. The description
of the code is listed in the next column.
• ProcedureDesc - The description of the procedures the patient went through while
in the ED.
• ReleaseStatCode - The status code of the patient departure from the ED (as
typed by the admission secretary). The description of the code is listed in the
next column.
• ReleaseStatDesc - The description of the patient departure from the ED.
• Ward - The ward where the patient is hospitalized to .
15

2 Analysis of the collected data and validation of the
empirical and simulation models
2.1 Empirical Analysis of Emergency Department
As we started investigating the database that we have on the ED, we have found four different
patients types: Internal (Int), Surgical (S), Orthopedic (O), and Trauma (Trauma) patients.
We also know from the hospitalization data, which of the patients were sent to ICU, and
which of the patients were sent to semi-intensive care units. We have marked those patients
by their future severity classes as ’ICU’ and ’V’ respectively. Those not belong to ICU nor
to V classes were marked as regular patients (R). In Figure ?? we can see the number of
patients in each category.
Table 1: Number of Patients in each category
ED Type R ICU V Total
Int ED 257,708 (97%) 5,915 (2%) 2,782 (1%) 266,405 (59%)Ort ED 109,941 (100%) 212 (0%) 49 (0%) 110,202 (25%)Surg ED 67,045 (98%) 1,194 (2%) 65 (0%) 68,304 (15%)Tra ED 2,237 (56%) 1,687 (42%) 52 (1%) 3,976 (1%)Total 436,931 (97%) 9,008 (2%) 2,948 (1%)
In the following subsections we shall show the arrivals, departures, and occupied beds
rate. We shall analyze the Average Length of Stay (ALOS) of the different types of patients.
Finally, we shall try to show how the crowdedness in the ED can influence the patients’
ALOS.
2.1.1 Arrival, Departure, and Occupied Beds rate in the ED
We shall start by analyzing the arrivals rate from a database of about four years. In Figure
9 we can see the minor fluctuation of the arrivals over time, except in a distinguished period
of two months around June 2006. It seems that a war fought in the north of Israel had
an influence on the arrivals rate. From Figure 10 we can see more clearly that in the two
months of war the regular patients rate (Int, Ort, and Sur) dropped rapidly, while the rate
of patients that need more intense care, such as Trauma patients, dramatically increased.
The next step is to look on the time variation during a day. As the day of week is
influencing the patient’s arrivals patterns, we have analyzed those separately. Figure 11
16

0
20
40
60
80
100
120
140
160
180
2004
_01
2004
_04
2004
_07
2004
_10
2005
_01
2005
_04
2005
_07
2005
_10
2006
_01
2006
_04
2006
_07
2006
_10
2007
_01
2007
_04
2007
_07
2007
_10
2008
_01
2008
_04
2008
_07
2008
_10
Time [Year_Month]
Dai
ly A
vera
ge A
rriv
als
Int_ED Ort_ED Surg_ED Tra_ED
Figure 9: ED Arrival rate by Time
0%
50%
100%
150%
200%
250%
300%
350%
400%
2004
_01
2004
_04
2004
_07
2004
_10
2005
_01
2005
_04
2005
_07
2005
_10
2006
_01
2006
_04
2006
_07
2006
_10
2007
_01
2007
_04
2007
_07
2007
_10
2008
_01
2008
_04
2008
_07
2008
_10
Time [Year_Month]
Dai
ly A
vera
ge A
rriv
als
[%]
Int_ED
Ort_ED
Surg_ED
Tra_ED
Figure 10: Percentage of ED Arrival rate by Time
17

shows us the arrival, departure and occupied beds pattern of Orthopedic (O) patients during
Sunday. We can see that all measurements have low rate during the night. The arrival rate
is getting to its first peak at 11 AM, while the number of beds and departure rates are
keep climbing until late afternoon. The same pattern we can see with Internal (Int) patients
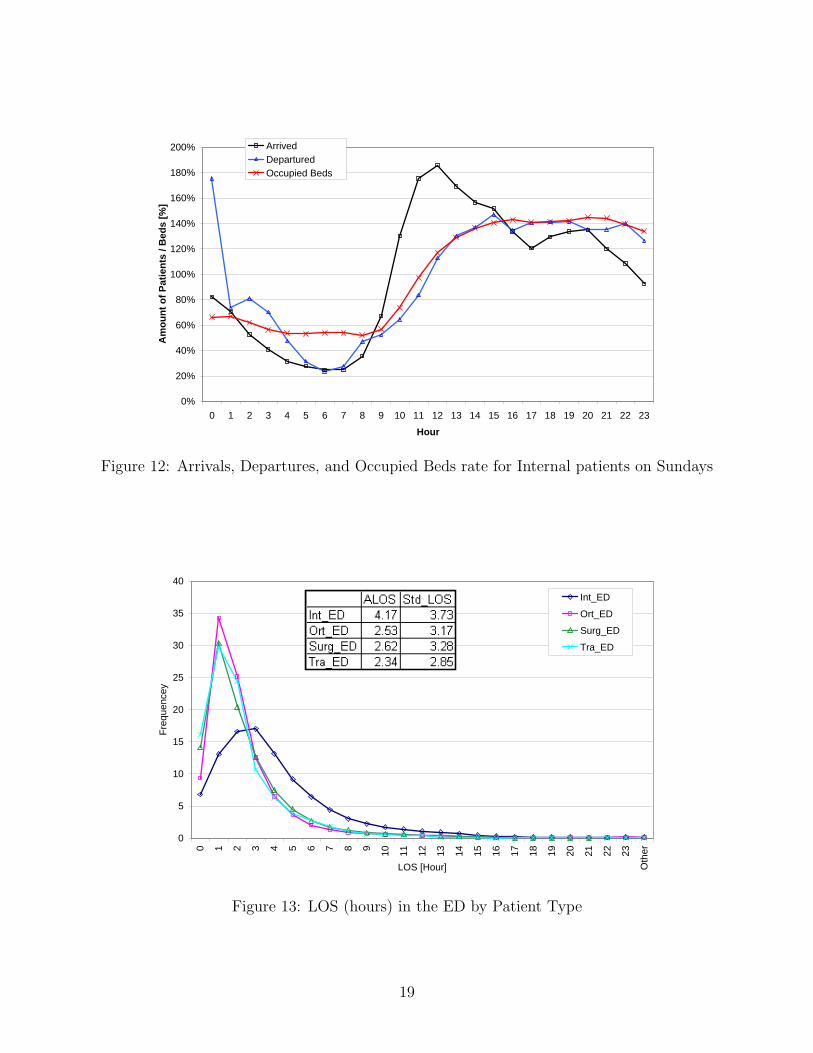
during Sundays on Figure 12.
0
2
4
6
8
10
12
14
16
0 1 2 3 4 5 6 7 8 9 10 11 12 13 14 15 16 17 18 19 20 21 22 23
Hour
Am
ount
of P
atie
nts
/ Bed
s
Arrived Departured Occupied Beds
Figure 11: Arrivals, Departures, and Occupied Beds for Orthopedic patients on Sundays
2.1.2 Length Of Stay (LOS) in the ED
Figure 13 shows the LOS distribution of the four ED patients. It can be seen that, excluding
some very short stays, the gamma and log-normal distributions fit the data well.
We have further investigate the influence of the severity of the patients on the LOS
distribution. In Figure 14, and Figure 15, we can see that the higher the severity the shorter
the patient stays in the ED.
2.1.3 The impact of Bed Occupancy on LOS
Figure 16 shows the ALOS of the four ED patients type by their Regular Severity Beds
Occupancies. We see that ALOS is starting to increase when the Occupancy rate is rising,
until a certain point when it stopped influencing the LOS, and when the occupancy is in its
peak, the LOS start to decrease. We can provide the following psychological explanation:
When the ED is empty, each patients adds to the staff load, and the patients waiting times
18
0%
20%
40%
60%
80%
100%
120%
140%
160%
180%
200%
0 1 2 3 4 5 6 7 8 9 10 11 12 13 14 15 16 17 18 19 20 21 22 23
Hour
Am
ount
of P
atie
nts
/ Bed
s [%
]Arrived Departured Occupied Beds
Figure 12: Arrivals, Departures, and Occupied Beds rate for Internal patients on Sundays
0
5
10
15
20
25
30
35
40
0 1 2 3 4 5 6 7 8 9 10 11 12 13 14 15 16 17 18 19 20 21 22 23
Oth
er
LOS [Hour]
Freq
uenc
ey
Int_ED
Ort_ED
Surg_ED
Tra_ED
Figure 13: LOS (hours) in the ED by Patient Type
19

0%
20%
40%
60%
80%
100%
120%
0 30 60 90 120 150 180 210 240 270 300 330 360 390 420 450 480 510 540 570 600
LOS
Acc
umul
ated
Fre
quen
cyInt_ED, R Int_ED, ICU Int_ED, V
Figure 14: LOS (Minutes) of Internal Patient by Severity
0%
20%
40%
60%
80%
100%
120%
0 30 60 90 120 150 180 210 240 270 300 330 360 390 420 450 480 510 540 570 600
LOS
Freq
uenc
y
Tra_ED, R Tra_ED, ICU Tra_ED, V
Figure 15: LOS (Minutes) of Trauma Patient by Severity
20

start to increase. When the ED start to be overcrowded, the staff gives high priority to the
patients that are waiting to leave the ED and promote them in the queues.ED_Clean_Q_new2 By (AvgQ)- Overlay Plot Page 1 of 1
0
1
2
3
4
5A
LOS
[Hou
r]
-5 0 5 10 15 20 25 30 35 40 45 50 55 60 65 70 75 80Average Occupancy of Regular Beds
Overlay Y's
Y ED_Int ED_O ED_S ED_Trauma
Overlay Plot
Figure 16: ALOS (hours) in the ED by Regular Beds Occupancy for each Patient Type
Figure 17 shows the ALOS of the four ED patients type by the average amount of
ICU cases the patients saw while in the ED. It seems that Internal and Surgical patients
LOS decrease while the amount of ICU cases the ED exposed to while in the system. The
explanation could be that the staff knows in advance when ICU patients are expected to
arrive. It could force them to give high priority for preparing patients for departure. Figure
18 shows the ALOS of the Internal patients by the average amount of V cases the patients
saw while in the ED. It seems that Internal ICU patients are not influence by the amount
of V cases, while both V and Regular Internal patients mostly go faster out of the ED when
the number of semi-intensive cases are in the ED. Since these last two figures are not easily
explained, we can provide kind of mathematical explanation: The ICU and V patients are
relatively sparse, and seeing on average couple of cases during patients stay is more rare.
The shorter the stay the higher the chance of catching more rare events on average, and
not vice versa. Therefor, more investigation is needed before making any assumption on the
influence of ICU and V beds occupancy on the ALOS.
21

Journal: Untitled 3 Page 1 of 1
0
1
2
3
4
5A
LOS
-1 0 1 2 3 4Average Occupancy of ICU Beds
Overlay Y's
Y ED_Int ED_O ED_S ED_Trauma
Overlay Plot
Figure 17: ALOS (hours) in the ED by ICU Beds Occupancy for each Patient Type
Journal: Untitled 5 Page 1 of 1
0
1
2
3
4
5
ALO
S
-1 0 1 2 3 4 5Average Occupancy of V Beds
Overlay Y's
Y ED_Int R ED_Int ICU ED_Int V
Overlay Plot
Figure 18: ALOS (hours) in the ED by V Beds Occupancy for each Patient Type
22

2.2 Empirical Analysis of Internal Wards
2.2.1 Length Of Stay (LOS) in the IW
As a first stage we would like to investigate the distribution of LOS in the various departments
of the hospital. We can find various patterns in the LOS distribution. Figures 19 and 20 show
the LOS distribution in one of the Internal Wards. It can be seen that, when considering
daily resolution, the gamma and log-normal distributions fit the data well. The second graph
is on hourly resolution and illustrates the impact of the discharge policy: the decision on
discharging patients is done once a day, hence the stay distribution has peaks in jumps of
24 hours.Journal: Untitled 2 Page 1 of 1
0.03
0.05
0.08
0.10
0.13
Pro
babi
lity
0 2 4 6 8 10 12 14 16 18 20 22 24 26 28 30 32 34 36 38 40 42 44 46 48 50
MeanStd DevStd Err Meanupper 95% Meanlower 95% MeanN
6.45246747.38443520.07987496.60904166.2958933
8547
MomentsLOS_days
0.01
0.01
0.01
0.02
0.03
0.03
0.04
Pro
babi
lity
0 6 12 21 30 39 48 57 66 75 84 93 102 114 126 138 150 162 174 186 198 210 222 234 246 258 270 282 294
MeanStd DevStd Err Meanupper 95% Meanlower 95% MeanN
154.85922177.226451.9169981
158.617151.10144
8547
MomentsLOS_hous
LOS (days)
LOS (hours)
Figure 19: LOS (days) in internal ward A
Journal: Untitled 2 Page 1 of 1
0.03
0.05
0.08
0.10
0.13
Pro
babi
lity
0 2 4 6 8 10 12 14 16 18 20 22 24 26 28 30 32 34 36 38 40 42 44 46 48 50
MeanStd DevStd Err Meanupper 95% Meanlower 95% MeanN
6.45246747.38443520.07987496.60904166.2958933
8547
MomentsLOS_days
0.01
0.01
0.01
0.02
0.03
0.03
0.04
Pro
babi
lity
0 6 12 21 30 39 48 57 66 75 84 93 102 114 126 138 150 162 174 186 198 210 222 234 246 258 270 282 294
MeanStd DevStd Err Meanupper 95% Meanlower 95% MeanN
154.85922177.226451.9169981
158.617151.10144
8547
MomentsLOS_hous
LOS (days)
LOS (hours)
Figure 20: LOS (hours) in internal ward A
2.2.2 Arrivals and Departures in the IW
Patients arrive to the hospital on random times according to Poisson process with time
dependent arrival rate (prove!!). Most patients arrive to the ED during the day (see Figure
??). The process of admissions to the wards (transferals from the ED) has the following
pattern: most of the patients arrive between 15:00 - 24:00, and depart between 13:00-17:00.
Thus, the number of patients in the ward during the afternoon hours (when the rate of
23

arrivals and departures is high) is significantly lower then the average number of patients
during the whole day or during the patients’ stay. For example Figure 21 illustrates such
pattern in Ward A - it shows average of all week days. Figure 22 illustrates such pattern
in Ward A by week days for days 1,2, and 7, and Figure 23 illustrates the same pattern in
Ward A during the entire week.
-2.5
-2
-1.5
-1
-0.5
0
0.5
1
1.5
2
0 1 2 3 4 5 6 7 8 9 10 11 12 13 14 15 16 17 18 19 20 21 22 23
Hour
Fluc
tuat
ions
aro
und
the
aver
age
Number of patientsArrivalDeparture
Figure 21: Arrival, Departures, and Number of Patients Patterns in Ward A
2.2.3 Determining Length Of Stay in IW as a function of the work load (seeAppendix A - 1).
We want to determine the impact of workload on the LOS in Internal Wards. The similar
attempt was done at [3]. There are few ways to define workload. The simplest way is to look
at the patient-load, for example, the number of patients in the ward or the percentage of
occupied beds. A more sophisticated view is to look at the workload on the service providers
(i.e. nurses and doctors). These two workloads are connected; we shall examine both.
Length of stay as a function of patients load in the ward
When considering the LOS versus the patient load in the system, we find that during
one patient’s stay the load can be changed dramatically.
Figure 24 illustrates the number of patients a random patient sees in the ward during
his/her stay, and the workload on nurses s/he sees. The work load on nurses is calculated
using Formula 1 assuming Ts = 0.25, TINI = 0.5 hours and fs = 0.4 requests per patient
24

-3
-2
-1
0
1
2
0 1 2 3 4 5 6 7 8 9 10 11 12 13 14 15 16 17 18 19 20 21 22 23
Hour
Fluc
tuat
ions
aro
und
the
aver
age
1 - Number of Patients1 - Arrival1 - Departure2 - Number of Patients2 - Arrival2 - Departure7 - Number of Patients7 - Arrival7 - Departure
Figure 22: Arrival, Departures, and Number of Patients Patterns in Ward A for Days 1,2,and 7 in the Week
-5
-4
-3
-2
-1
0
1
2
3
4
1_00
1_06
1_12
1_18
2_00
2_06
2_12
2_18
3_00
3_06
3_12
3_18
4_00
4_06
4_12
4_18
5_00
5_06
5_12
5_18
6_00
6_06
6_12
6_18
7_00
7_06
7_12
7_18
Day Of Week and Hour
Fluc
tuat
ions
aro
und
the
aver
age
Number of Patients Arrival Departure
Figure 23: Arrival, Departures, and Number of Patients Patterns in Ward A During theWeekdays
25

per hour. (WE MUST ESTIMATE IT AGAIN) One can observe the same patterns of the
number of patients in the ward. It is important to notice that, while the number of patients
drops between 13:00 and 23:00, the workload does not decrease but increases. (remark: can
we add the waiting probability or averages he observes?)Chart1
Page 1
30
35
40
45
50
55
3_24
4_06
4_12
4_18
4_24
5_06
5_12
5_18
5_24
6_06
6_12
6_18
6_24
7_06
7_12
7_18
7_24
1_06
1_12
1_18
1_24
2_06
2_12
2_18
2_24
3_06
3_12
3_18
3_24
4_06
4_12
Time (DOW_Hour)
Num
ber o
f Pat
ient
s
3
4
5
6
7
8
9
10
Offe
red
Load
Number of Patients
Offered Load
Figure 24: Number of patients and workload during the LOS of a random patient
Summarizing the above, we conclude that although one usually measures the load that
patient sees at his/her entering time to the system, in our case this will underestimate the
real load that the patient observes. In order to overcome this problem, we calculate the
average number of patients in the ward during each patient’s stay. Figure 25 shows the
ALOS [in days] of patients as a function of the average beds occupancy rate. Occupancy
rate is calculated relatively to the maximal number of beds in the ward.
We also need to calculate it by average number of people at 7:00.
Length Of Stay as a function of nurses work load in the ward
In order to define the workload that each patient brings to the ward, we use a model
that is close to the one described in Galit’s thesis (reference). Each patient during his
stay alternates between “needy” and “content” states. When a patient is needy he requires
service from a nurse. A patient starts and ends his stay in a needy states. The average time
26

Journal: Untitled 2 Page 1 of 1
-2
0
2
4
6
8
LOS
(day
s)
0 .5 1 1.5
Beds Occupancy
Overlay Y's
Y Mean of LOS_D, IW_A Mean of LOS_D, IW_B Mean of LOS_D, IW_C Mean of LOS_D, IW_D Mean of LOS_D, IW_E
Overlay Plot
ByMaximal Number of Beds
Journal: Untitled Page 1 of 1
-2
0
2
4
6
8
10
LOS
(day
s)
0 .1 .2 .3 .4 .5 .6 .7 .8 .9 1 1.1 1.2 1.3 1.4 1.5 1.6 1.7 1.8 1.9 2
Beds Ocuupancy
Overlay Y's
Y Mean of LOS_D, IW_A Mean of LOS_D, IW_B Mean of LOS_D, IW_C Mean of LOS_D, IW_D Mean of LOS_D, IW_E
Overlay Plot
ByStandard (“TEKEN”) Number of Beds
Figure 25: ALOS as a function of bed occupancy in wards A-E
27

of the first and last services (when her is admitted or discharged from the ward) could be
different from the average service time of regular service (we don’t have data on that, but it
is reasonable to assume that, and that is what the IW B nurse has told us). Thus, in order
to define the workload that a specific patient sees during his stay, we shall count the number
of patients that arrive and depart during his stay and the number of patients hospitalized
in his ward in every hour, and multiply them in the service time they require.
Define At - The total number of customers that entered the system till time t, Dt - The
total number of customers departed from the system till time t. A−1(i) - The arrival time of
customer i, D−1(i) - The departure time of customer i. Qt - The number of customers in the
system at time t, therefore Qt = At−Dt. Define Ei[Q] - The average number of customers in
the system when customer i is in the system, and LOS(i) - The Length of Stay of customer
i, LOS(i) = D−1(i)− A−1(i), therefore:
Ei[Q] =
D−1(i)∫A−1(i)
Qtdt
LOS(i).
Define INIi as the average number of admissions and discharges during the stay of customer
i, and Loadi as the average load customer i sees during his stay. Therefore:
INIi =A(D−1(i))− A(A−1(i)) + D(D−1(i))−D(A−1(i))
LOS(i),
and
Loadi = INIi ∗ TINI + Ei[Q] ∗ Ts ∗ fs, (1)
where TINI is the average time that admission or discharge takes, Ts is the average service
time , and fs is the frequency of service requirements of customer per hour (?). We assumed
Ts = 0.25, TINI = 0.5 hour and fs = 0.4.
Figure 26 shows ALOS of patients as a function of their INIi for each ward.
Figure 27 shows ALOS of a patient as a function of the total service work load s/he
observes during his stay - Loadi.
In order to account for the influence of ward size the Figure 28 shows ALOS as a function
ofEj [Loadi]
Nj, where Nj is the maximum number of beds in ward j and Ej[Loadi] is the average
load of customers in ward j.
28

Journal: Untitled 11 Page 1 of 1
-1
01
2
34
56
7
89
10
LOS
(day
s)
0 5 10 15 20 25 30 35 40
INI (days)
Overlay Y's
Y IW_A IW_B IW_C IW_D IW_E
Overlay Plot
Journal: Untitled 10 Page 1 of 1
-1
0
1
2
3
4
5
6
7
8
9
10
11
12
13
LOS
(day
s)
0 5 10 15 20 25 30 35 40
INI (days)
Overlay Y's
Y IW_A IW_B IW_C IW_D IW_E
Figure 26: LOS as a function of INI by ward
29

Journal: Untitled 14 Page 1 of 1
-1
0
1
2
3
4
5
6
7
8
LOS
(day
s)
0 10 20 30 40 50 60 70 80 90 100 110 120 130 140 150 160 170
Load
Overlay Y's
Y IW_A IW_B IW_C IW_D IW_E
Overlay Plot
Figure 27: ALOS as a function of working load of a nurseJournal: Untitled 15 Page 1 of 1
0
1
2
3
4
5
6
7
8
9
LOS
(day
s)
1 1.5 2 2.5 3 3.5 4 4.5 5
Load per bed
Overlay Y's
Y IW_A IW_B IW_C IW_D IW_E
Overlay Plot
Figure 28: LOS as a function of working load of a nurse
30
2.3 Empirical Analysis of Transfers in the system
2.3.1 Waiting times from ED to IW
Empirical analysis of waiting time for transferring from ED to the IW (see Appendix A - 3)
by customer type (patients that are given artificial respiration or not).
2.3.2 Waiting times from ED to ICU
is there blocking? maybe we should transfer this to the next chapter?
31

3 Analysis of the system (using combined simulation
and/or analytical models).
Answering what-if questions. Two for each part; the first will consider an operational issue
(such as pooling or priority), and the second will try to explain an interesting empirical
findings.
3.1 Two interesting questions for ED
For example capacity analysis of ED:
a. Resources (staff, beds, and supported activities) utilization
b. How many patients’ arrival per day can the system handle?
c. The impact of time-varying arrivals and the impact of mass casualty events (e.g. car
accident or terrorist attack).
d. What is the bottleneck of the process?
e. Staffing policy - the use of analytical models (see Appendix A - 6a).
f. input control - ambulance diversions.
h. Using simple analytical model for the ED.
i. Replacing simulation sub-models with analytical models (see Appendix A - 4)
j. Using priorities (see Appendix A - 9).
k. Designing of teams (pooling decisions as in Appendix A - 6c).
3.2 Two interesting questions for IW
Investigating the connection between Lambda, Mu, Q and time in IW
3.3 Two interesting questions for the transfer process from ED toIW
For example:
justice
heterogenic wards?
a. How do different routing schemes affect system’s performance (fair allocation)?
b. Where the queue should be: IW or ED (see Appendix A - 5).
c. Using incentive (auction) mechanism (game theory -Pulling method)?
32
3.4 Two interesting questions for the whole process
For example:
The impact of IW/OR/ICU work load on the capacity analysis of the ED (see Appendix A
- 1).
4 Special events
a. The war. b. Moving to the temporary location. c. Special days (with many Multi
Trauma). d. Months with flu patients.
33
References
[1] R. Bekker and A.M. de Bruin, Time-dependent analysis for refused admissions in clinical
wards, Submitted to AOR-ORAHS’s special volume (2008).
[2] A.B. Cooper, E. Litvak, M.C. Long, and M.L. McManus, Emergency department diver-
sion: causes and solutions, Academic Emergency Medicine 8 (2001), 1108–1110.
[3] K.C. Diwas and C. Terwiesch, The impact of work load on productivity and quality: an
econometric analysis of hospital operations, Manuscript under review (2008).
[4] L. Green, Capacity planning and management in hospitals, Operations Research and
Health Care (Brandwau et al editors) (2004), 14–41.
[5] , Using operations research to reduce delays for healthcare, Tutorials in Operations
Research, Informs (2008).
[6] O.B. Jennings and F.d. Vericourt, Nurse-to-patient ratios in hospital staffing: a queuing
perspective, Working Paper, Duke University.
[7] Y. Marmor and D. Sinreich, Emergency departments operations: the basis for developing
a simulation tool, IIE Transactions 37 (2005), no. 3, 233–245.
34

A Meetings summary
1. The impact of load (workload per server per time unit) on the length of service (in
Internal Wards - LOS, in ED - treatment time (nurse, physician), in Call Center -
duration).
Remark: one need to consider the influence of ward size and the number of nurses and
doctors.
(a) Empirical model (statistical approach): from the Hospital Database and observa-
tions.
(b) Compare with other fields (call centers). Explanation based on psychological
/ economical model. We would look on papers from Health care (Yulia) or in
OR/MS.
(c) Influences on Analytical model (call centers staffing; health care staffing, bed al-
location and routing policy).
1. Compare simulation with changing service time (M/Mρ/N/(K)) to M/M/N,
M/M/N/K models check the accuracy of probability of blocking and beds’ uti-
lization.
2. Can we estimate LOS function in such a way that one can develop a closed
form solution to (M/Mρ/N/(K))?
Challenges: how to define Load.
2. Support mathematical basis for the QED model: check empirically that the probability
of waiting, in the meaning of the probability for an empty bed, is between 0 and 1.
Check it for different seasons.
3. Modeling waiting time for moving from ED to IW (accounting for constrains in the
IW). The possible approaches are :
(a) As currently in the simulation - the delay is exponentially distributed with em-
pirically found average (does not account for congestion in Internal Wards).
(b) Empirical model possibly based on the database from Rambam.
(c) Green and Yancovitch model which accounts for blocking that are caused by lack
of nurses, physician, or beds.
35

(d) Combined with Galit’s model (use the probability of blocking and waiting to
predict nurses’ availability).
(e) Procedural constrains in the IW, such as shift changing periods, meals times,
cleaning patients time and so on.
4. Comparison of Simulation Model of the ED+IW to Erlang-C, Erlang-B, or M/M/? or
Galit’s model:
(a) What is the meaning of ”the number of servers” in such models, and how to
estimate the right one as the combination of Nurses, X-Ray, Beds, or Physicians?
M/M/S + M (2)
S = WP ∗ P + WN ∗N (3)
where P is the Number of Physicians and N is the Number of Nurses
(b) Different measures: LOS pdf, waiting times, occupancy, patients’ departures from
the ED etc.
(c) Influences of the model on operational decisions (e.g. staffing, bed allocation, and
routing).
5. Moving patients from the ED to the IW: Compare between policy in which patients are
waiting in the ED for their placement (Rambam) vs. in which patients are waiting in
the IW for their admission (Nahariya or Pnimit Hei in Rambam). (Could be relevant
to ED vs. ER). Green also mentioned this conflict in the US.
6. Using the Simulation for interesting questions:
(a) Determine staffing policy for Beds, Nurses, and Physicians (developing staffing
algorithm and use of Analytical Model vs. Simulation).
(b) The influence of IW congestion on the ED.
(c) Treatment times are influenced by learning and forgetting. Forgetting is influ-
enced by congestion (time between treatments of the same patient) and by amount
of patients per staff member (information overload problems). Can one estimate
these influences and their impact on staffing decisions?
36
(d) Using shared X-Ray or dedicated X-Ray to the ED. If shared, then how the
priorities are determined.
(e) The operational strategies impact on the LWBS/abandonment-rate and the Re-
turns rate.
(f) DEA (Data Envelop Approach).
7. Combination of incentives mechanism (in IW) and routing policy (ED to IW) in a way
that encourages operational improvement (e.g. reduce LOS, increase staffing and bed
efficiency) without interfering with the clinical aspects (as quality of care). Remark:
patient allocation can be in Push-mode or by Pull-mode (e.g. auction-like).
8. Clinical aspects: building a connection between quality of treatment (urgency of treat-
ment needed) and waiting time using known clinical procedures for different cases and
their frequency in population. The outcome would be the quality of service function
that can be used for staffing decisions instead of the regular waiting time function,
or in order to define appropriate waiting time standards for staffing in EDs (opti-
mal ”cost/profit as opposed to constraint satisfaction). Return rate as a quality of
treatment measure.
9. The impact of using priority on operational decisions and measures:
(a) Triage and priority schemes.
(b) Imaging priority (can be used to reduce the load in the ED).
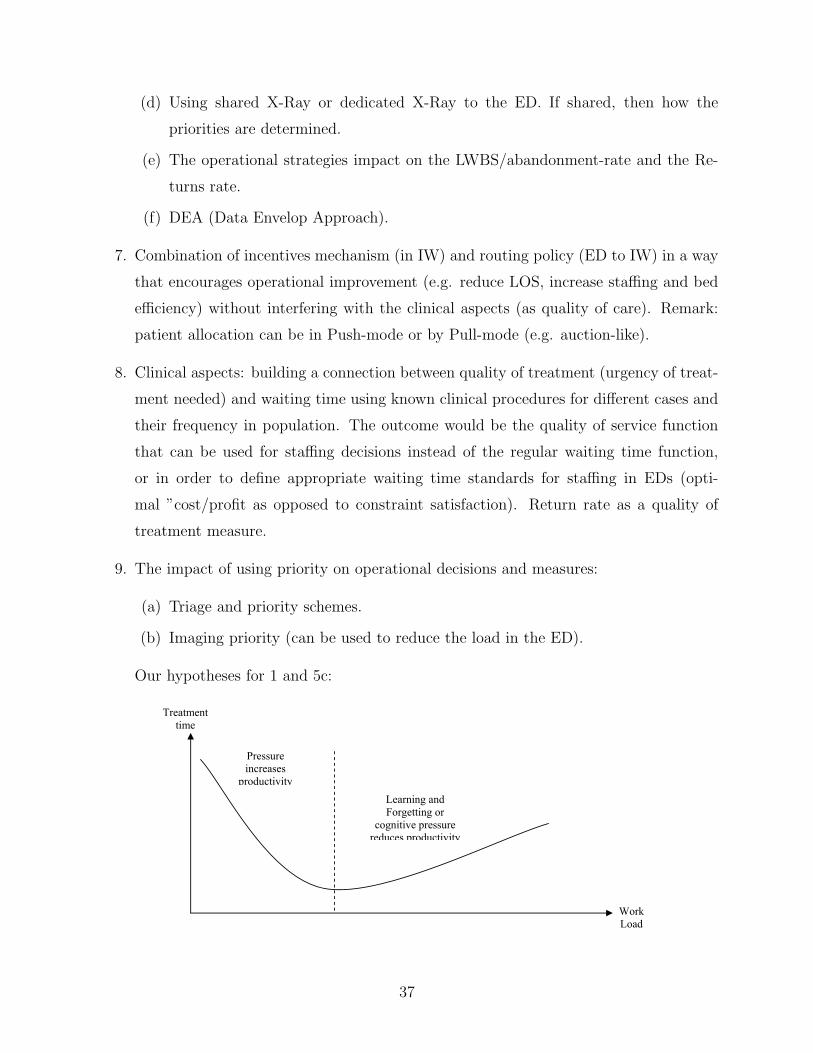
Our hypotheses for 1 and 5c:
Updated on 31/08/08
3
9. The impact of using priority on operational decisions and measures:
a. Triage and priority schemes.
b. Imaging priority (can be used to reduce the load in the ED).
Our hypotheses for 1 and 5c:
Treatment time
Work Load
Pressure increases
productivity Learning and Forgetting or
cognitive pressure reduces productivity
37