from field studies to an expert system: entry routes ... · from field studies to an expert system:...
TRANSCRIPT

From field studies to an expert system:
Entry routes, effects and biological indication of pesticides in small streams
with mainly agricultural used catchments
Von der Gemeinsamen Naturwissenschaftlichen Fakultät
der Technischen Universität Carolo-Wilhelmina
zu Braunschweig
zur Erlangung des Grades eines
Doktors der Naturwissenschaften
(Dr.rer.nat.)
genehmigte
Dissertation
Kumulative Arbeit
von Michael Neumann
aus Marburg a.d. Lahn
1. Referent: Prof. Dr. G. Rüppell
2. Referent: PD Dr. R. Schulz
eingereicht am:
mündliche Prüfung (Disputation) am: 28.03.2002


Contents
Vorveröffentlichungen der Dissertation............................................................. 1
Veröffentlichungen (allgemeiner Art) ............................................................... 2
Summary ....................................................................................................... 3
Introduction and Overview .............................................................................. 4
Acknowledgements....................................................................................... 14
I A qualitative sampling method............................................................... 15
II The significance of entry routes of pesticides .......................................... 22
III Diffuse und punktuelle Eintragspfade für Pflanzenschutzmittel................. 34
IV The impact of runoff on stream benthos in Hong Kong, China.................. 40
V The database of the expert system LIMPACT.......................................... 50
VI The knowledge base of the expert system LIMPACT................................ 63
VII http://www.limpact.de .......................................................................... 76
VIII Das Expertensystem LIMPACT.................................................................. 77
Curriculum vitae ........................................................................................... 86
Complete list of publications (January 2002) .................................................. 87

1
Vorveröffentlichungen der Dissertation
Teilergebnisse aus dieser Arbeit wurden mit Genehmigung der Gemeinsamen Naturwissenschaftlichen Fakultät, vertreten durch den Mentor Prof. Dr. G. Rüppell, in folgenden Beiträgen veröffentlicht:
Publikationen
Neumann M., Liess M., Schulz R. (2002) A sampling method for monitoring water-quality in temporary channels or sewers with pesticide contamination as example; Chemosphere: in press
Neumann M., Schulz R., Schäfer K., Müller W., Mannheller W., Liess M. (2002) The significance of entry routes as point and non-point sources of pesticides in small streams. Water Research: 36 (4) 835-842
Neumann M., Schulz R., Liess M. (1999) Diffuse und punktuelle Eintragspfade für Pflanzenschutz-mittel und ihre Bedeutung für zwei kleine Fließgewässer. Erweiterte Zusammenfassung der Jahrestagung der Deutschen Gesellschaft für Limnologie (DGL) Rostock 1999 Band 1, 503-508.
Neumann M. and Dudgeon D. (2002) The Impact of Agricultural Runoff on Stream Benthos in Hong Kong, China; Water Research: 36 (12) 3093-3099
Neumann M., Liess M., Schulz R. (2002) LIMPACT: An expert System to estimate the pesticide contamination of small streams with macroinvertebrate bioindicators, Part 1: The database; Ecological Indicators: in press
Neumann M., Baumeister J., Liess M., Schulz R. (2002) LIMPACT: An expert system to estimate the pesticide contamination of small streams with macroinvertebrate bioindicators, Part 2: The knowledge base; Ecological Indicators: in press
Neumann M., Baumeister J., Liess M., Schulz R. (2002) LIMPACT: Ein Expertensystem zur Abschätzung der Pflanzenschutzmittel-Belastung kleiner Fließgewässer mittels der Makroinvertebraten-Fauna; Umweltwissenschaften und Schadstoff-Forschung: in press
Internet
http://www.limpact.de
Tagungsbeiträge
Neumann M., Baumeister J., Liess M., Schulz R. (2001) LIMPACT: Ein Expertensystem zur Abschätzung der Pflanzenschutzmittelbelastung kleiner Fließgewässer mittels der Makroin-vertebraten Fauna. Vortrag auf der SETAC-GLB Tagung 10.09. bis 11.09. 2001 in Berlin
Neumann M., Schulz R., Liess M. (1999). "Konzentrationen von Pfla nzenschutzmitteln in kleinen Fließgewässern.” Vortrag SETAC-GLB Tagung 13.09. bis 14.09. in Weihenstephan.
Neumann M., Schulz R., Liess M. (1999). "Diffuse und punktuelle Eintragspfade für Pflanzen-schutzmittel und ihre Bedeutung für zwei kleine Fließgewässer.” Vortrag auf der Tagung der Deutschen Gesellschaft für Limnologie (DGL) 27.09. bis 01.10. 1999 in Rostock

2
Veröffentlichungen (allgemeiner Art)
Publikationen
Neumann & Liess (1999) Abschätzung und Bewertung der Insektizidbelastung kleiner Fließgewässer durch ein regelbasiertes Expertensystem. In Ökosystemare Ansätze in der Ökotoxikologie, eds. J. Oehlmann and B. Markert, pp. 516-520. Ecomed Verlag, Landsberg.
Liess, Schulz & Neumann (1996) A method for monitoring pesticides bound to suspended particles in small streams. Chemosphere 32, 1963-1969.
Neumann & Liess (1996b) Abschätzung der Insektizidbelastung in Agrarfließgewässer - Aufbau eines regelbasierten Expertensystems. Erweiterte Zusammenfassungen der Jahrestagung der Deutschen Gesellschaft für Limnologie (DGL) Schwedt/O. 1996 Band 2, 612-616.
Tagungsbeiträge
Neumann & Liess (1998) Abschätzung und Bewertung der Insektizidbelastung kleiner Fließgewässer durch ein regelbasiertes Expertensystem. Poster SETAC-GLB Tagung, Zittau 1998
Neumann M. and Liess M. (1997) Vergleich der durch Feststoffe veränderten Toxizität zweier Insektizide und ihrer Formulierung in dem Gammarus pulex-Biotest. Vortrag auf der zweiten deutschsprachigen SETAC-Tagung; 24.-25.02.1997 Aachen
Neumann & Liess (1996a) Abschätzung der Insektizidbelastung in Agrarfließgewässer - Aufbau eines regelbasierten Systems. Vortrag auf der Jahrestagung der Deutschen Gesellschaft für Limnologie (DGL) Schwedt/O. 1996
Gutachten
Neumann et al. (1999c) Untersuchung der diffusen und punktuellen Pflanzenschutzmittel-Einträge im Einzugsgebiet der Nette. Unveröffentlichtes Gutachten im Auftr. des Niersverbandes, der Stadtwerke und des Kreises Viersen, 78 Seiten.
3
Summary
Streams in agricultural regions are severely affected by inputs from the sur-roundings, and pesticides in particular, act as stressors for the aquatic commu-nity. The research presented here is part of the program of the Limnology and Ecotoxicology division of the Zoological Institute of the Technical University of Braunschweig. The thesis incorporates the three most important aspects of eco-toxicological field studies. First, there is an examination of the entry routes for pesticides, and a new sampling device is presented. Next, an example for the ecological effects of contamination and the reaction of the aquatic community is given. And finally, a synthesis is achieved by constructing a biological indicator system: the extensive data analysis is transferred into the knowledge base of an expert system, making complex ecological relationships generally accessible.
Section I – III: In an agricultural catchment area in Germany I compared the pesticide contamination of entry routes. In the farmyard runoff high herbicide concentrations were found, presumably caused by cleaning the spraying equipment. The field runoff and the rainwater sewer contained less load, but included insecticides. I developed a sampling device to monitor the quality of periodically inflowing water from point sources. It inexpensively and easily enables qualitative monitoring of these entry routes. In one stream the sewage plant caused a slight but continuous contamination by herbicides, and in the other stream non-point sources caused high peaks of herbicides and contamination by insecticides.
Section IV: In the New Territories of Hong Kong, China I investigated three small streams. In each stream the benthic macroinvertebrate fauna of one site upstream of an area of agricultural land was compared with a second site immediately downstream. Samples were taken at the end of the dry season (March 2000) and again (April 2000) just after heavy rainfall had caused runoff from the fields. The potential acute toxic effect of runoff became clear by focusing on the most sensitive benthic fauna. All streams showed a significant downstream decrease in the number of sensitive taxa in April, while in two streams the number of relatively tolerant taxa increased. The effect magnitude varied, which may reflect differences in the composition of the agricultural runoff.
Section V – VIII: I developed an expert system (LIMPACT) to estimate the pesticide contamination of streams using macroinvertebrate indicators. The database consisted of 157 investigations of small headwater streams with an agricultural catchment area. The pesticide load was categorised, on the basis of standardised toxicity’s, as Not Detected (n=55), Low (34), Moderate (42) and High (26) contamination. Additionally, nine water-quality and morphological parameters were evaluated with regard to their influence on the fauna and when applying LIMPACT are used to exclude unsuitable streams. The benthic macroinvertebrate fauna data were divided into four time frames (March/April; May/June; July/August; September/October) and analysed regarding the abundance of the 39 most common taxa. I differentiated between positive indicator (PI) taxa, which indicate contamination by high abundance values, and negative indicator (NI) taxa, a high abundance of which rules out contamination and indicates an uncontaminated site. The heuristic knowledge base was developed with the shell-kit D3 and contains 921 diagnostic rules. The correct diagnosis for the 157 investigations per stream and year is established by LIMPACT in 66.7 to 85.5% of the cases. The potential application of LIMPACT could be a yearly monitoring of streams and would reduce chemical analysis to the mandatory cases.

4
Introduction and Overview
The subject matter
Water has always been interesting to scientists for many reasons. Small streams are of particular interest: they are an important ecosystem with unique structure and function (Cummins, 1974). Each stream may be short, but together they add up to an enormous distance, so that they are present everywhere in the rural landscape and contribute to its character. Although small, they constitute one of the most important limnological habitats, and they are more severely affected by the surrounding land than almost any other aquatic habitat (Blanchard and Lerch, 2000; Carpenter et al., 1998). And although the conditions in the stream itself vary widely in the course of a year, it houses a community variable in forms and species that reflects primarily the external factors that affect stream life.
Holistic approach
When investigating such a diverse ecosystem, at the beginning it is important to use various methods of different sciences to understand the mechanisms that take effect. As a synthesis the data may be assembled for a model-based analysis of the complex relationships like it is common in geoecology science (Brunotte et al., 2001). Such a holistic approach enables to understand spatio-temporal processes, the states of the ecosystem, and the effects of human exploitation.
Although small streams are not in the strict sense exploited directly by man, humans have a very strong influence on them (Dudgeon, 1996) and can markedly change their character. The typical stream in an agricultural catchment area is small and has been artificially reconfigured, deepened and reinforced, its fringes deforested, and it is affected by input of materials from the surroundings (Loague et al., 1998). Whereas the members of this special category of bodies of water have much in common, the inputs of materials are a variable factor. Especially where pesticides are concerned they can be greatly altered according to the properties of the catchment region (soil types, land use) and the vagaries of the weather (Wauchope, 1996).
Pesticide contamination
The extent to which small streams are contaminated by pesticides and the potential point- and non-point-source entry routes have by no means been thoroughly investigated and are still not well enough understood (Line et al., 1997). It follows that the consequences of these inputs, including their effects on the aquatic community, also cannot be fully understood (Cooper, 1993; Willis and McDowell, 1982). Hence an ecotoxicological field study must always be based on a comprehensive sampling and measurement of the input of contaminants (Fig. 1: exposure assessment). The reactions of the aquatic community (Fig. 1: effect assessment) can only be interpreted in the light of the pollutant load. In very complex ecosystems often there are no simple relationships, so that for constructing models an extensive database and extended expert knowledge must be available (Fig. 1). The knowledge acquisition is often done by a knowledge engineer (Feigenbaum, 1980). It tends to be rare for the domain expert and the knowledge engineer to be the same person.

Introduction and Overview 5
Expert systems
With a knowledge-based system (expert system) it becomes possible to make use of uncertain knowledge (Puppe, 1993) and to implement even ambiguous effects of the aquatic community. Modern shell-kits (Kuesten and McLellan, 1994) offer a web-based user interface which enables the knowledge engineer to set up the expert system in the internet (Puppe et al., 1996). The last step of the development process should consider the use and the practicability for the clients. Wilde (1994) gives a review about the rather low acceptance of expert systems in Australia. Link et al. (1995) reviews 81 systems for agricultural use and criticises the unintelligible menu prompt.
Figure 1: The time course and the interactions of this thesis for knowledge engineering from field studies to a web-based expert system. References to external work and data are given and sections within this thesis are indicated.
The present thesis emerged in the Division of Limnology and Ecotoxicology at the Zoological Institute of the Technical University of Braunschweig. It treats three aspects of an ecotoxicological field research on the pollution of small streams by pesticides in particular:
– Entry routes,
– Ecological effects,
– Biological indicator systems.
Hence this thesis contains studies on the mechanism of input of pesticides and their entry routes (section II/III), as well as the development and refinement of sampling procedures used to monitor the inputs (section I). The reaction of the aquatic community to contamination was exemplary investigated (section IV) and an extensive analysis of complex relationships was proceeded with the data of our Braunschweig group (section V). The outcome was a biological indicator system in the form of an expert system to estimate the pesticide contamination of small streams by means of the macroinvertebrate fauna (section VI–VIII).

Introduction and Overview 6
The time course and the interactions of this thesis are illustrated in Figure 1. Details of the individual steps are described in the following segments of this introduction. The effect assessment and the exposure assessment are only exemplary treated within this thesis. This built up the own expert knowledge. An important step for knowledge acquisition was the construction of an extensive relational database in which all the field data could be sorted and evaluated. The streams were investigated by the Zoological Institute, Division of Limnology and Ecotoxicology at the Technical University of Braunschweig, Germany between 1992 and 2000. An overview of the data is given in Liess (1993), Schulz (1997), Döhler (1998), Wogram (2001) & Neumann et al. (2002).
This procedure enabled the main focus of this thesis: the development of a biological indicator system for pesticides. It executes a synthesis of the exposure assessments and the effect assessment done by our group during the past. A special feature of the system presented here is the web-based user interface. The expert system can be accessed and operated at the internet address http://www.limpact.de, so that users can reach it easily and at any time. After the necessary data have been entered, the expert system provides a result immediately.
Exposure assessment
During exposure assessment the first and usually the most important step is the sampling itself. It is of major importance in view of the correct description and monitoring of environmental contamination (Liess and Schulz, 2000). The strategy to be employed depends to a great extent on the details and individual peculiarities of the ecosystem and the kind of contamination of interest. The discharge of small streams, in comparison with larger rivers, is highly dynamic and greatly influenced by inputs from non-point (Line et al., 1997; Mohaupt et al., 1999) and point sources (Adams et al., 1996). The brief, unpredictable inputs following heavy precipitation are difficult and time-consuming to monitor, and expensive equipment is needed. In the Division of Limnology and Ecotoxicology at the Zoological Institute of the Technical University of Braunschweig, in recent years several sampling procedures have been developed specifically for use in small streams.
Stream water sampling methods and the exposure found
A Suspended Particle Sampler (Liess et al., 1996) was developed to sample the potentially contaminated suspended particles in small streams. A sedimentation vessel through which the water flows continuously is positioned in the stream, and the suspended particles it accumulates can be collected at regular intervals. This method cannot be used to measure the exact maximal concentration but gives the mean sediment contamination during a particular period. When it was used during research for a Diploma thesis (Döhler, 1998), it indicated that 12 of the 24 small streams studied in the vicinity of Braunschweig were distinctly polluted with pesticides. The highest concentrations were found for the only slightly water-soluble insecticide fenvalerate (up to 11 µg L-1) and for fungicides (up to 44 µg L-1) (see section V).
In the course of the same Diploma research (Döhler, 1998) a passive high-water sampler was developed. Several glass flasks were attached to a stand in a stream at various distances above the normal water level. When the discharge of the stream increased, the flasks filled up at a corresponding rate, and afterwards they could be removed and emptied. This method makes it possible to sample

Introduction and Overview 7
the water at times controlled by the occurrence of precipitation. A practical application of the sampler, to investigate two small streams near Viersen, is described in section II/III and section V: One stream was contaminated mainly by herbicides. Every sample showed contamination. In April isoproturon (6.7 µg L-1) and chloridazon (1.2 µg L-1) were unequivocally detected and in June the most important contaminants were metamitron (5.1 µg L-1) and ethofumesate (2.1 µg L-1). No insecticides or fungicides were detected. The contamination of the second stream was different, with a greater variety of pesticides and higher concentrations resulting from precipitation-induced inputs (e.g., diuron at 4.3 and 2.4 µg L-1 and atrazine at 2.5 µg L-1). The peak concentrations were 31.1 µg L-1 for terbuthylazine and 14.5 µg L-1 for metamitron. Relatively large amounts of fungicides were present, and a high level of contamination by the insecticides fenvalerate and parathion-ethyl was observed.
An automatic water sampler controlled by a computer was described and used by Liess et al. (1997). The conductivity of the stream water is measured continuously and water samples are taken when it decreases drastically owing to dilution by rainwater during overland runoff events. This method enables the accurate measurement of the maximum pesticide concentration in the stream water, and makes it possible to detect peak concentrations of insecticides even if they have low water solubility (fenvalerate up to 6.2 µg L-1 and parathion-ethyl up to 6.0 µg L-1) (Liess et al., 1997) (see section V).
Entry route sampling methods and the exposure found
To investigate the contamination of inflow from entry routes a passive water sampler for the edge-of-field runoff was developed by Schulz et al. (1998). A glass bottle is placed in the embankment and passively collects the runoff water flowing into the stream from cultivated fields. In section II/III this method was used and 19 pesticides were detected (Neumann et al., 1999a). Samples from April were found to be either still uncontaminated or contaminated only by metribuzine. As the period of pesticide application progressed, the spectrum expanded and several pesticides were present simultaneously. The highest detected herbicide concentration was 2815 µg L-1. Insecticides and fungicides were rarely present, because the frequency and the amount of application were low. Overall, 82% of the samples were contaminated with pesticide.
The runoff from farmyards was monitored with this method for the first time during the same investigation of section II and III: 17 pesticides were found, and again the herbicides dominated, occurring at extremely high concentrations and frequencies. In April, contamination was present only occasionally, e.g. isoproturon (115 µg L-1) or metribuzine. In June, several pesticides were detected at high concentrations: prosulfocarb (1451 µg L-1), metamitron (846 µg L-1) and ethofumesate (266 µg L-1). Altogether 95% of the water samples were contaminated with at least one pesticide.
Development of a new entry route sampling method
Section I describes a new water sampler for point sources. It can be used to monitor the quality of the water periodically and temporary inflowing from concrete tubes, sewers or channels. We used the new sampling method to monitor the water quality in an emergency overflow of a sewage sewer, the outlet of a rainwater sewer and two small drainage channels. In the water from the rainwater sewer 17 pesticides were found. The concentrations of the

Introduction and Overview 8
herbicides were particularly high, with atrazine found at 10.5 µg L-1, terbuthylazine at 19.5 µg L-1, prosulfocarb at 8.3 µg L-1 and diuron at 11.2 µg L-1. Fungicides were found at the end of May and June in rather low concentrations. The insecticide parathion-ethyl was found once. In the drainage channel extremely high herbicide concentrations were found almost permanently, with peak concentrations at 130 µg L-1 for prosulfocarb, 92 µg L-1 for metamitron and 51.1 µg L-1 for ethofumesate. Diuron was found once at 17.3 µg L-1. Insecticides were not found at all, and fungicides were found infrequently in concentrations up to 5.5 µg L-1 for propiconazole. In the sewage sewer herbicides were found nearly continuously, in concentrations up to 9.4 µg L-1 for metamitron and 5.4 µg L-1 for ethofumesate. Diuron was found at 2 µg L-1. No insecticides and fungicides could be detected.
Significance of exposure
In the investigation described in section I–III, for the first time water flowing through all relevant entry routes in a catchment area after precipitation was sampled and a broad spectrum of 20 pesticides was analyzed. The significance of the individual entry routes has previously been assessed by measuring the water in the streams and not by direct sampling of the entry routes themselves (Seel et al., 1996).
The pesticide contamination observed in the streams and in the entry routes is above loads that have been shown to affect the benthos in microcosm studies (Liess and Schulz, 1996; Schulz and Liess, 2000). Cooper, (1993) has reviewed the acute toxic and sublethal chronic effects of non-point sources, and has identified pesticides as one of the major stressors of aquatic communities. In Germany the Federal Environmental Agency has recently published a proposal with quality targets for 35 pesticides in watercourses (UBA, 1999). For drinking water the European Union has generally a target level of 0.1 µg L-1 for each single pesticide. In the USA the Clean Water Act (CWA) of 1972 demands no emission of toxic substances into watercourses. The US EPA developed Water Quality Criteria (WQC) and Sediment Quality Criteria (SQC) and distinguishes between criteria for maximum concentration (CMC) and criteria for chronic concentration (CCC) (USEPA, 1991; USEPA, 1999).
Effect assessment
During field studies the effects of environmental contamination and the reaction of the aquatic community are investigated. This is the most complex type of ecotoxicological investigation (Buikema Jr. and Voshell Jr., 1993). Whereas laboratory systems and artificially contaminated streams provide precise (though perhaps not entirely realistic) results, measurements in the field of the relationship between contamination and biological effect can only give approximations. Review articles demonstrate that there is still very little information about the impact of pesticides on aquatic communities derived from field studies (Cooper, 1993; Willis and McDowell, 1982).
The effect of runoff on stream benthos
The investigation in section IV was performed at three streams in Hong Kong (Neumann and Dudgeon, 2002) and the experiment was designed so that only the input by runoff would vary independently, and all other influential factors would change in the same direction. This was achieved by comparing two sampling sites, one above and the other below a cultivated field. In this study

Introduction and Overview 9
the pesticide content of the water was not determined; nevertheless, an enormous influence of surface runoff was documented, and the main cause was most probably the introduction of pesticides. The proportion of relatively sensitive species in the aquatic community was reduced. Although the abundance of such species decreased following runoff, more tolerant species were found to become more abundant.
The distinction between sensitive and tolerant species in the present thesis was accomplished by programming a comprehensive, relational database application that was also used in the work for a Diploma (von der Ohe, 2001). Data derived from toxicity tests were expressed in relation to those for Daphnia magna (Wogram and Liess, 2001), so that a mean relative sensitivity could be calculated for the individual taxa (see section IV). Liess et al. (2001) found that the measured level of pesticide contamination was correlated with a sensitivity index calculated for the aquatic community and proposed that a biological indicator system should be developed following the model of the saprobe index.
Knowledge acquisition for section V from various investigations
In the surroundings of Braunschweig, for several years Wogram (2001) studied the level of pesticide contamination and the characteristics of the aquatic communities. He found that the communities were chronically influenced and adapted to this contamination, but could not detect any acute effect levels. However, acute effects of comparable contamination were clearly evident when micro- and mesocosms were examined (Liess and Schulz, 1996; Schulz and Liess, 2000).
24 brooks were closely examined with respect to pollution by pesticides, and at the same time the aquatic macroinvertebrate community was described in detail (Döhler, 1998). In severely contaminated streams a decrease in both diversity (as assessed by the SHANNON-WEAVER criterion) and number of species was observed. Some species (e.g., Limnephilus lunatus) exhibited declining abundance, whereas other species (e.g., Gammarus pulex) became more prevalent and dominated such streams. The degree of organism drift showed no correlation with the measured contamination.
Two small streams near Viersen (Nordrhein-Westfalen) were shown to be heavily contaminated by pesticides (Neumann et al., 1999a; Neumann et al., 2002a; Neumann et al., 2002b) and also to contain seriously impoverished communities (Neumann et al., 1999b). At the very beginning of the investigation, in May 1998, the community here was dominated by molluscs, leeches and fresh-water isopods. The drifting of the organisms was monitored, and the highest drift rates of Asellus aquaticus were found to coincide with the periods of most severe pesticide contamination. However, the effects found here could not be indisputably correlated with the pesticide level.
The data and expert knowledge that had been accumulated by the members of the Division of Limnology and Ecotoxicology at the Zoological Institute of the Technical University of Braunschweig were used to evaluate the reaction of the aquatic community to pesticide pollution. This aim was achieved by employing a relational databank system, which is presented in section V.

Introduction and Overview 10
Negative and positive indicator
In a first step the number of individuals and the number of taxa were analysed. The number of individuals of rather sensitive (negative indicator) taxa showed a significantly lower abundance at increased contamination. The more tolerant (positive indicator) taxa showed the opposite trend, with higher numbers in contaminated streams. The number of taxa were lower only in the most severely contaminated streams. Overall the data showed a strong correlation between the abundance data and the pesticide contamination but not between the number of taxa and pesticide contamination. Consequently, I focused on the abundance data and the abundance dynamics while developing the biological indicator system (see section V).
Knowledge engineering
Knowledge acquisition for expert-system development has come to be termed knowledge engineering, following Feigenbaum´s (1980) use of the term to describe the reduction of a large body of knowledge to a precise set of facts and rules. The term "knowledge engineer" has come to be used for the person responsible for such system development.
Expert systems are programs for reconstructing the expertise and reasoning capabilities of qualified specialists (Puppe et al., 1996). The advantages are that expert systems can utilize even uncertain information, consider the ecological complexity and ideally come to the same solution, as the expert would do. Our aim was to develop a biological indicator system in the form of an expert system that estimates the pesticide contamination of small streams.
Monitoring systems for small streams
In Germany, the only recurrent monitoring in small streams done by governmental environmental agencies considers contamination by biodegradable organic pollutants, monitored with the bioindicator-based saprobic system (Friedrich, 1990). After reviewing a wide range of ecological evaluation systems for running waters, Braukmann and Pinter (1997) proposed an expert system for evaluation purposes. There are various approaches to evaluate the water quality of streams (Böhmer and Kappus, 1997), but no biological indicator system is known to indicate the pesticide contamination of small streams. The indication via benthic macroinvertebrate bioindicators could give evidence over a longer period and therefore would be more cost-efficient. Furthermore, it would indicate the toxicity of the contamination and not only the concentration of chemicals. Consequently, a biological indicator system should be able to indicate agricultural short-term impact from non-point sources with low acquisition effort.
Constructing a relational database in section V
The first step was to construct a comprehensive database application incorporating all 159 investigations per stream and year, comprising 660 samples of the animals present and 555 pesticide samples. Each of the 159 investigations per stream and year was assigned to one of four contamination categories. The crucial step in setting up the expert system was to find rules for diagnosing the level of pollution in terms of the four categories. The procedure was to assign each of the 157 stream-years to one of the categories, to analyze the abundance of 39 taxa at four times in the course of the year, or the change in abundance from one of these times to the next, and in each case to determine whether the taxon is a positive or a negative indicator (see section V – VIII).

Introduction and Overview 11
Those taxa with low abundances in polluted streams were called negative indicators. A negative indicator is thus a taxon with abundance negatively correlated with the pesticide contamination. The abundance of a positive indicator taxon is positively correlated with the contamination. High abundances of NI therefore indicate low or no contamination, while high abundance of PI suggests high contamination. In addition, nine water-quality and morphological parameters were included in the analysis (see section V – VIII).
Encoding the knowledge base in section VI
On the basis of this evaluation, 921 rules were established and programmed into a heuristic knowledge base. I named this expert system LIMPACT (from Limnology and impact) and made it available over the internet. The input parameters of LIMPACT are benthic macroinvertebrate abundance data and basic water-quality and morphological parameters. The output is an estimation of the pesticide contamination according to four classes without any specification of the chemical agents (see section V – VIII).
Application range of the expert system
A general restriction of biological indicator systems is that indicator species must be present at the investigation site. This is also a limitation of LIMPACT. Until now, LIMPACT considers 39 species or taxa. If none of these taxa is present at a sampling site, none of the rules of the knowledge base of LIMPACT can fire. Consequently such a sample site cannot be classified. For low numbers of indicator taxa LIMPACT may only suspect a classification. This level of safety against errors was optained by applying only low diagnosis scores. Another level of safety is the establishment of the suitability of the considered stream before classification.
The expert system LIMPACT is available over the internet at http://www.limpact.de. The potential application of LIMPACT could be a yearly monitoring of streams and would reduce chemical analysis to the mandatory cases. Furthermore, it could be used to evaluate the degree to which risk mitigation strategies in the catchment area have succeeded in reducing the impact of pesticides (see section VI – VIII).
References Adams S. M., Ham K. D., Greeley M. S., Lehew R. F., Hinton D. E. and Saylor C. F. (1996)
Downstream gradients in bioindicator responses: Point source contaminant effects on fish health. Can. J. Fish. Aquat. Sci. 53, 2177-2187.
Blanchard P. E. and Lerch R. N. (2000) Watershed vulnerability to losses of agricultural chemicals: Interactions of chemistry, hydrology, and land-use. Environ. Sci. Technol. 34, 3315-3322.
Böhmer J. and Kappus B. (1997) Ökologische Bewertung von Fließgewässern in der Europäischen Union und anderen Ländern -Literaturstudie -. Literaturstudie im Auftrag der Landesanstalt für Umweltschutz Baden-Württemberg, Stuttgart, Reihe Handbuch Wasser 2 Bibliothek der Landesanstalt für Umweltschutz Baden-Würtemberg
Braukmann U. and Pinter I. (1997) Concept for an integrated ecological evaluation of running waters. Acta Hydrochimica et Hydrobiologica 25, 113-127.
Brunotte E., Gebhardt H., Meurer M., Meusburger P. and Nipper J. (2001) Lexikon der Geographie. Spektrum Verlag
Buikema Jr. A. L. and Voshell Jr. J. R. (1993) Toxicity studies using freshwater benthic macroinvertebrates. In Freshwater biomonitoring and benthic macroinvertebrates, eds. D. M. Rosenberg and V. H. Resh, pp. 344-398. Chapman & Hall, New York.

Introduction and Overview 12
Carpenter S. R., Caraco N. F., Correll D. L., Howarth R. W., Sharpley A. N. and Smith V. H. (1998) Nonpoint pollution of surface waters with phosphorus and nitrogen. Ecol. Appl. 8, 559-568.
Cooper C. M. (1993) Biological effects of agriculturally derived surface -water pollutants on aquatic systems - a review. J. Environ. Qual. 22, 402-408.
Cummins K. W. (1974) Structure and Function of Stream Ecosystems. BioScience 24, 631-641.
Döhler G. (1998) Einträge von Pflanzenschutzmitteln in kleine Agrarfließgewässer und ihre Auswirkungen auf aquatische Makroinvertebraten. Technische Universität Braunschweig, Diplomarbeit: 70 S.
Dudgeon D. (1996) Anthropogenic influences on Hong Kong streams. GeoJournal 40, 53-61.
Feigenbaum E. A. (1980) Knowledge Engineering: the Applied Side of Artificial Intelligence. Report STAN-CS-80-812. Department of Computer Science, Stanford University.
Friedrich G. (1990) Eine Revision des Saprobiensystems. Z. Wasser. Abwasser. Forsch. 23, 141-152.
Kuesten C. L. and McLellan M. R. (1994) Expert system shells--Selecting the most appropriatedevelopment environment. Food research international. - ISSN 09639969 27(2), 101-110.
Liess M. (1993) Zur Ökotoxikologie der Einträge von landwirtschaftlich genutzten Flächen in Fließgewässer. Cuvillier , Göttingen
Liess M. and Schulz R. (1996) Chronic effects of short-term contamination with the pyrethroid insecticide fenvalerate on the caddisfly Limnephilus lunatus. Hydrobiologia 324, 99-106.
Liess M., Schulz R., Kreuzig R., Rother B., Bahadir M. and Rueppell G. (1997) Quantification of insecticide contamination in agricultural headwater streams. Wat. Res. in press.
Liess M., Schulz R. and Neumann M. (1996) A method for monitoring pesticides bound to suspended particles in small streams. Chemosphere 32, 1963-1969.
Liess M. and Schulz R. (2000) Sampling methods in surface waters. In Handbook of water analysis, eds. L. M. L. Nollet, pp. 1-24. Marcel Dekker, New York.
Liess M., Schulz R., Berenzen N., Nanko -Drees J. and Wogram J. (2001) Pflanzenschutzmittel-Belastung und Lebensgemeinschaften in Fließgewässern mit landwirtschaftlich genutztem. Abschlußbericht des FE-Vorhabens 296 24 511 im Auftrag des Umweltbundesamtes , Braunschweig
Line D. E., Osmond D. L., Coffey S. W., McLaughlin R. A., Jennings G. D., Gale J. A. and J. S. (1997) Nonpoint sources. Water Environment Research 69, 844-860.
Link P., Kuhlmann F. and Wagner P. (1995) Expertensysteme für die Landwirtschaft - Bestandsaufnahme und Perspektiven. Berichte über Landwirtschaft : Zeitschrift für Agrarpolitik u. Landwirtschaft 73(1), 1-32.
Loague K., Corwin D. L. and Ellsworth T. R. (1998) The challenge of predicting nonpoint source polluation. Environmental Science & Technology 32, 130-133.
Mohaupt V., Bach M. and Behrendt H. (1999) Overview on diffuse sources of nutrients; pesticides and heavy metals in Germany - Methods, results and recommendations for water protection policy. Erweiterte Zusammenfassung der Jahrestagung der Deutschen Gesellschaft für Limnologie (DGL) Rostock 1999 1, 479-487.
Neumann M. and Dudgeon D. (2002) The impact of agricultural runoff on stream benthos in Hong Kong, China. Wat. Res. 36 (12) 3093-3099
Neumann M., Liess M. and Schulz R. (2002a) A qualitative sampling method for monitoring water-quality in temporary channels or point-sources and its application to pesticide contamination. Chemosphere under revision,
Neumann M., Schulz R. and Liess M. (1999a) Diffuse und punktuelle Eintragspfade für Pflanzenschutzmittel und ihre Bedeutung für zwei kleine Fließgewässer. Erweiterte Zusammenfassung der Jahrestagung der Deutschen Gesellschaft für Limnologie (DGL) Rostock 1999 1, 503-508.
Neumann M., Schulz R. and Liess M. (1999b) Untersuchung der diffusen und punktuellen Pflanzenschutzmittel-Einträge im Einzugsgebiet der Nette. Unveröffentlichtes Gutachten im Auftrag des Niersverbandes, der Stadtwerke und des Kreises Viersen, 78 Seiten.

Introduction and Overview 13
Neumann M., Schulz R., Schäfer K., Müller W., Mannheller W. and Liess M. (2002b) The significance of entry routes as point and non-point sources of pesticides in small streams. Wat. Res. 36, 835-842.
Neumann M., Baumeister J., Liess M. and Schulz R. (2001a) An expert system to estimate the pesticide contamination of small streams using benthic macroinvertebrate as bioindicators, Part 2: The knowledge base of LIMPACT. Ecological Indicators under revision,
Neumann M., Baumeister J., Liess M. and Schulz R. (2001b) LIMPACT: Ein Expertensystem zur Abschätzung der Pflanzenschutzmittel-Belastung kleiner Fließgewässer mittels der Makroinvertebraten-Fauna. Umweltwissenschaften und Schadstoff-Forschung
Neumann M., Liess M. and Schulz R. (2001c) An expert system to estimate the pesticide contamination of small streams using benthic macroinvertebrate as bioindicators, Part 1: The database of LIMPACT. Ecological Indicators under revision,
Neumann M. and Liess M. (1999) Abschätzung und Bewertung der Insektizidbelastung kleiner Fließgewässer durch ein regelbasiertes Expertensystem. In Ökosystemare Ansätze in der Ökotoxikologie, eds. J. Oehlmann and B. Markert, pp. 516-520. Ecomed Verlag, Landsberg.
Neumann M., Schulz R. and Liess M. (1999) Untersuchung der diffusen und punktuellen Pflanzenschutzmittel-Einträge im Einzugsgebiet der Nette. Unveröffentlichtes Gutachten im Auftrag des Niersverbandes, der Stadtwerke und des Kreises Viersen, 78 Seiten.
Puppe F. (1993) Systematic Introduction to Expert Systems. Springer-Verlag , Berlin Heidelberg 3-540-56255-9.
Puppe F., Gappa U., Poeck K. and Bamberger S. (1996) Wissensbasierte Diagnose- und Informationssysteme: Mit Anwendungen des Expertensystem-Shell-Baukastens D3. Springer , Berlin, Heidelberg, New York 3-540-61369-2.
Schulz R. (1997) Aquatische Ökotoxikologie von Insektiziden - Auswirkungen diffuser Insektizideinträge aus der Landwirtschaft auf Fließgewässer-Lebensgemeinschaften. Ecomed Verlag , Landsberg
Schulz R., Hauschild M., Ebeling M., Nanko -Drees J., Wogram J. and Liess M. (1998) A qualitative field method for monitoring pesticides in the edge-of-field runoff. Chemosphere 36, 3071-3082.
Schulz R. and Liess M. (2000) Toxicity of fenvalerate to caddisfly larvae: chronic effects of 1-hr vs. 10-hr pulse-exposure with constant doses. Chemosphere 41, 1511-1517.
Seel P., Knepper T. P., Stanislava G., Weber A. and Haberer K. (1996) Kläranlagen als Haupteintragspfad für Pflanzenschutzmittel in ein Fließgewässer - Bilanzierung der Einträge. Vom Wasser 86, 247-262.
USEPA (1991) Technical support Document for water quality-based toxics control. EPA/505/2-90-001, PB91-127415.
USEPA (1999) National recommended water quality crieria-correction. United States Environmental Protection Agency. Washington, DC. Office of Water. EPA-822-Z-99-001. PB99-149189.
von der Ohe P. (2001) Ökologische Charakteristika von Makroinvertebraten als Indikator für die Pestizidbelastung kleiner Fließgewässer. Diplomarbeit, Technische Universität Braunschweig
Wauchope R. D. (1996) Pesticides in Runoff: Measurement, modelling and mitigation. Journal of Entomological Science and Health. Part B 31, 337-344.
Wilde W. D. (1994) Australian Expert Systems for Natural Systems. AI Applications 8, 3-12.
Willis G. H. and McDowell L. L. (1982) Pesticides in agricultural runoff and their effects on downstream water quality. Environ. Toxicol. Chem. 1, 267-279.
Wogram J. (2001) Pflanzenschutzmittel und Lebensgemeinschaften in Fließgewässern mit landwirtschaftlich genutztem Umland. Dissertation, TU Braunschweig , Braunschweig
Wogram J. and Liess M. (2001) Rank Ordering of the sensitivity of macroinvertebrate species to toxic compounds, by comparison with that of Daphnia magna. Bull. Environ. Contam. Toxicol. 67, 360-367.
14
Acknowledgements
Prof. Georg Rüppell was not only my PhD thesis supervisor, but took a fatherly interest in my scientific education and supported me even in difficult situations.
PD Ralf Schulz reviewed nearly all my manuscripts and was the second referee of this thesis. He is a valued friend, has always been willing to answer my questions and has spent a lot of time on me.
Prof. Andreas Herrmann took an active part in the disputation.
Prof. David Dudgeon allowed me to work in his group at the Hong Kong University and reviewed a manuscript.
PD Matthias Liess has been a close friend and a very important tutor for many years. Most of my knowledge and know-how I owe to him.
Many members of the limnology group at the Technical University of Braunschweig made their data available to me. This thesis would not have been possible without the help from the group. Some of my colleagues were Jörn Wogram, Norbert Berenzen, Jakob Drees, Guido Döhler, Steffen Wahrendorf, Peter von der Ohe and Reinhard Huwe.
PD Robert Kreuzig, Bernd Rother and Heike Dieckmann, of the Institute for Ecological Chemistry at the Technical University, carried out the pesticide analyses.
Lars Jansen was always open for ideas, questions and discussions and reviewed the manuscript.
My parents supported my study and gave me a very good and helpful upbringing, to which I owe the best of what I have become.
I had senseless and nerve-wracking discussions with my brother.
This PhD thesis was financed by The Deutsche Bundesstiftung Umwelt (German Federal Environmental Foundation), An der Bornau 2 in 49090 Osnabrück, Germany.
The field studies in Viersen was financed by funds from local agencies: the Niersverband GmbH in Viersen, the Stadtwerke Viersen GmbH and the Amt für Wasser- und Abwasserwirtschaft, Kreisstrassen des Kreises Viersen, Germany. The STUA Krefeld and The STUA Düsseldorf performed sampling and pesticide analyses effort.
The sojourn in Hong Kong was financed by The Deutscher Akademischer Austauschdienst (German Academic Exchange Service), Kennedyallee 50 in 53175 Bonn, Germany.
Thank you all

15
I 2002
Chemosphere: in press
A qualitative sampling method for monitoring water quality in temporary channels or point sources and its
application to pesticide contamination
Michael Neumann1*, Ralf Schulz1, Matthias Liess2
1Zoological Institute, Department of Limnology; Technical University Braunschweig, Fasanenstrasse 3, D-38092 Braunschweig, Germany
2Department of Chemical Ecotoxicology; UFZ Center for Environmental Research, Permoserstr. 15, D-04318 Leipzig, Germany
*Author to whom all correspondence should be addressed: Tel: +49-531-3913180; Fax: +49-531-3918201; email: m.neumann@tu-
bs.de
Abstract
A water-sampling device to monitor the quality of water periodically and temporarily flowing out of concrete tubes, sewers or channels is described. It inexpensively and easily enables a qualitative characterization of contamination via these point-source entry routes. The water sampler can be reverse engineered with different sizes and materials, once installed needs no maintenance, passively samples the first surge, and the emptying procedure is short. In an agricultural catchment area in Germany we monitored an emergency overflow of a sewage sewer, an outlet of a rainwater sewer and two small drainage channels as input sources to a small stream. Seven inflow events were analysed for 20 pesticide agents (insecticides, fungicides and herbicides). All three entry routes were remarkably contaminated. We found parathion-ethyl concentrations of 0.3 µg L-1, diuron up to 17.3 µg L-1, ethofumesate up to 51.1 µg L-1, metamitron up to 92 µg L-1 and prosulfocarb up to 130 µg L-1.
Key words
Herbicides; Fungicides; Insecticides; Small streams; Point sources; Sewage plant; Rainwater sewer; Pipes
Introduction
Streams receive inflow via a wide range of entry routes. Besides nonpoint sources there are various point sources like drainage channels, outlets from industrial plants or sewage plants and sewers or concrete tubes. Monitoring of the water quality in continuous outlets can easily be done by hand sampling. However, taking water samples at outlets with a high variability in time or even with periodic and temporary inflow events is difficult (Liess and Schulz, 2000). These events occur only after rainfall or emergency overflows during a short period of time. Hence, they can only be monitored with event-controlled samplers. As is known from nonpoint sources (Spalding and Snow, 1989; Schulz, 2001), the highest contamination and the poorest water quality can be expected for the first surge, which is nearly impossible to sample by hand. Therefore an ideal water sampler should be easy to install with no maintenance needed and should sample mainly the first surge of an inflow event. Such a sampling method is known only for the agricultural edge-of-field runoff (Schulz et al., 1998).

I A Sampling Method 16
Even in catchment areas where intensive agriculture is practised, for certain pesticides classes the point sources can cause a stronger contamination than the nonpoint sources (Fischer et al., 1996; Mohaupt et al., 1999). Waste-water treatment plants are known to be a major point source of pesticides (Seel et al., 1996). Neumann et al. (2002) found the outlets from farmyards to be responsible for an average of 24 g pesticides during an application period, presumably caused by cleaning the spraying equipment. In this study we describe a qualitative sampling device, which was used to monitor the pesticide contamination of a rainwater sewer, an emergency overflow of a sewage sewer and two temporary drainage channels.
Methods
Construction of the water-sampling device
The water sampler is built from a glass tube (∅: 7 cm) that is 60 cm long and has been sealed on both ends (Fig. 1, 1). The resulting sampling volume is 1.3 litre. The inflow opening (Fig. 1, 2) is only 2 cm wide, 0.5 cm high and is positioned at a height of 6 cm. The sampler is placed parallel to the current with the opening through which the water enters at the posterior end. This approach prevents the opening from becoming occluded by drift material in the stream water. At the front end a pipe, 3 cm long and 0.5 cm wide, is placed on top of the sampler body (Fig. 1, 3) to allow air to leave the sampler during the passive filling procedure. The water sampler was attached at the bottom of the concrete tubes and the lined channels. This was done during dry periods. They were fixed in position by steel straps (Fig. 1, 4). The sampler could easily be taken out and replaced after the emptying-procedure.
Figure 1: Construction of the water sampling device. 1: body of sampler with a length of 60 cm and a diameter of 7 cm; 2: inflow opening with a width of 2 cm, a height of 0.5 cm, disposed 6 cm above the bottom of the sampler; 3: deaeration pipe 3 cm long and 0.5 cm wide; 4: steel straps for fixation.
Study area
Near Viersen in the Niederrheinische Bucht in Nordrhein-Westfalen (NRW) in Germany the catchment area of the Nette was investigated. Intensive agriculture prevails in the catchment area of this small stream: predominantly grain and potatoes (each 25% of the total area), then sugar beet (19%) and maize (14%), other vegetable crops (4%) and grassland plus pasture (6%). The sampling was done while pesticide application to the fields was most intensive, from mid-April to mid-July 1998. We used the sampling method described here to monitor the water quality in an emergency overflow of a sewage sewer, the outlet of a rainwater sewer and two small drainage channels as input sources to the stream. The outlets of both sewers were 80 cm concrete tubes. The drainage channels

I A Sampling Method 17
were 50 cm wide and were lined with wooden planks at the bottom and both sides. All entered the stream through the embankments. The water samplers were installed at the beginning of the investigation. Whenever water flowed through the entry routes into the stream, the water sampler passively filled up with water. Hence, it had to be emptied after every inflow event. To ensure this, the status of the water sampler was routinely monitored once a week as well as directly after rainfall events. For cleaning, the water sampler was rinsed with acetone after each sampling.
Pesticide analysis method
All water samples were concentrated by solid-phase extraction (RP-C18) directly after sampling and then stored at –18°C. At the end of the investigation period the Institute for Ecological Chemistry of the Technical University of Braunschweig analysed our selected samples by a GC/MS method similar to that described by Liess et al. (1999). Tests were carried out for two insecticides (fenvalerate and parathion-ethyl) and five fungicides (azoxystrobin (= pyroxystrobin), kresoxim-methyl, epoxiconazole, fenpropimorph, propiconazole). Of the 13 herbicides of interest, atrazine and simazine are prohibited for agricultural use. Terbuthylazine, metazachlor, chloridazon, ethofumesate, metamitron, isoproturon, prosulfocarb, metribuzin, and metobromuron are currently used agricultural herbicides. The samples were also tested for bromazil (= imazalil) and diuron, although these are not used agriculturally. The detection limits reached 0.1-0.5 µg L -1 depending on the matrix loading. The detection limit for metobromuron and diuron was 1 µg L -1.
Results and Discussion
Evaluation of the sampling device
The water sampler was applicable to monitor the input sources over a relatively long period of time and thus took water samples from all inflow events that exceeded the height of the opening. Once it has been filled with water through the small openings, the replacement and the mixing of the sample with the flowing water is negligible even under strong current. The water sampler is cheap to construct and easy to handle, with no movable components. The construction material should be selected with regard to the substances of interest. Here, we used glass as a rather inert material, because pesticides have high tendency to become bound to plastic materials. The sampling volume used here was 1.3 litre, but for other purposes the water sampler can be dimensioned as needed. Once installed, the water sampler needed no maintenance. The use of straps for mounting shortened and simplified the emptying procedure.
During the investigation period several relatively strong rainfall events occurred (Fig. 2). A total of 13 samples were taken at the rainwater sewer (RS), nine (C1) and eight (C2) samples at the drainage channels and four samples at the emergency overflow of the sewage sewer (SS). Here we present the results from the sampling of seven rainfall events. They were selected, because they caused the most inflow events in the considered entry routes. Table 1 gives the concentrations of pesticides found in the water samples. Three rainfall events did not cause an inflow event at the emergency overflow of the sewage sewer, so no sample (n.s.) was available. This demonstrates that this entry route causes inflow only after heavy rainfall, lasting long enough that the capacity of the waste-water treatment plant is exceeded. The other entry routes caused inflow events for all of the seven rainfall events considered, but seven samples were

I A Sampling Method 18
not analysed (n.a.). Three water samples had a specific conductivity between 364 and 693 µS cm-1 and all other samples had values lower than 100 µS cm-1. The low conductivity values prove that the inflow was mainly composed of rainwater.
Figure 2: Amount of daily rainfall (mm) during the investigation period. The arrows indicate the seven selected inflow events in the entry routes from which water samples were taken and analysed for pesticides.
Pesticide contamination in the rainwater sewer
In the water of this entry route 17 pesticides were found. All samples were contaminated with minimally three and maximally 14 pesticides. The concentrations of the herbicides were particularly high, with atrazine at 10.5 µg L-1, terbuthylazine at 19.5 µg L-1, prosulfocarb at 8.3 µg L-1 and diuron at 11.2 µg L-1. Fungicides were found at the end of May and June in rather low concentrations. The insecticide parathion-ethyl was detected once.
In the sewage systems of many small villages an effort is made to separate sewage and rainwater, so that the rainwater need not be treated. The rainwater sewer studied here collects the water drained from the eaves of buildings, the streets and the paved surfaces of a small village. Our analyses show that such a rainwater sewer can carry pesticides into streams. The real cause of this entry route for pesticides is probably the cleaning of spraying equipment on the paved farm yard (UBA, 1997).
Pesticide contamination in the drainage channels
Three water samples from the channel C1 and five from C2 were analysed and 14 pesticides were found. Extremely high herbicide concentrations were found nearly permanently with peak concentrations at 130 µg L-1 for prosulfocarb, 92 µg L-1 for metamitron and 51.1 µg L-1 for ethofumesate. Diuron was found once with 17.3 µg L-1. Insecticides were not found at all and fungicides were found infrequently with concentrations up to 5.5 µg L-1 for propiconazole.

I A Sampling Method 19
SS
11.7
.
408 - - - - - - 0.3 - - - - - - - - - - -
C2
n.a.
-
C1
n.a.
-
7
RS
08.7
.
281 - - - 0.2 - - - - - - - 0.3 - -
0.23
- -
SS
n.s.
-
C2
n.a.
-
C1
1.7.
127 - 0.6 - - - - 0.3 - 0.8 - -
18.9
7.4
1.5
1.5
0.5 -
17.3
6
RS
1.7.
152 - - - - - - 0.2 - 3 - - - 0.6
0.2
0.9 - -
11.2
SS
15.6
.
364 - - - - - - - - - - 0.5
0.5
2.2 - 0.3 - - -
C2
12.6
.
109 - - - - - 1.2 - - - 1.9
1.6
1.8
2.5 - 2.1
1.8 - -
C1
n.a.
-
5
RS
12.6
.
543
0.3 - 0.2
0.3 - - 0.3 -
19.5
0.1 - 0.3
0.6 - 0.9
1.9 - -
SS
6.6.
237 - - - - - - 0.2
0.3
1.7
0.2
2.7
5.4
7.1
0.2
0.8
0.4 - 2
C2
6.6.
78
- 2.6 - 2.4 - 5.5 - - - - 8.6
15.7
31.3
-
10.8
5.8
3.4 -
C1
6.6.
164 - 0.7 - - 0.2
1.1
0.2 - 0.7 - - 0.4
0.7
2.2
1.4
0.5 - -
4
RS
6.6.
693 - 0.2
0.3
0.4
0.1
0.9
0.2 - 2.9 5 2.6
3.4
9.1
2.5
7.7
2.9 - -
SS
29.5
.
207 - - - - - - 0.3 - 0.3 - 0.6
1.6
9.4
0.2
1.4
1.5 - -
C2
29.5
.
131 - - - 0.5 - - - - - -
10.2
29.3
92
0.47
17.5
18.9
1.4 -
C1
29.5
.
157 - - - - 0.3 - - - 0.2 - - 2.3 6 2 6 1.3 - -
3
RS
29.5
.
250 - 0.2
0.2
0.4 - 0.4
3.5
0.9 3 - 0.5
2.1
2.2 2 8.3
2.5 - 1.9
SS
n.s.
-
C2
6.5.
180 - - - - - - - - - -
15.4
16.9
15.7
2 130
25.4
5.1 -
C1
n.a.
-
2
RS
6.5.
267 - - - - - -
10.5
0.2
8.9 - 1 0.4
0.7
1.7 - 1.4 - -
SS
n.s.
-
C2
28.4
.
100 - - - - - 0.6 - - - - -
51.1
57.9
0.5
0.5 - - -
C1
n.a.
-
1
RS
n.a.
-
(0.0
05)
(-)
(-)
(-)
(-)
(-)
(-)
(0.1
)
(0.5
)
(0.4
)
(10)
(-)
(-)
(0.3
)
(-)
(-)
(-)
(0.0
5)
Tab
le 1
: Pes
ticid
e co
ncen
tratio
n (µ
g L-1
) in
the
ent
ry r
oute
s af
ter
seve
n ra
infa
ll ev
ents
. Fe
nval
erat
e an
d br
omaz
il w
ere
not
foun
d at
all.
RS
: ra
inw
ater
sew
er; C
1. C
2: d
rain
age
chan
nel o
ne a
nd tw
o; S
S:
sew
age
sew
er;
n.a:
sam
ple
not
anal
ysed
; n.
s.:
no s
ampl
e; -
: be
low
det
ectio
n lim
it; v
alue
s in
bra
cket
ref
er t
o th
e qu
ality
tar
gets
for
aqu
atic
com
mun
ities
(µg
L-1)
from
the
Ger
man
Fed
eral
Env
ironm
enta
l A
genc
y
Eve
nt #
Poi
nt s
ourc
e
Dat
e
Con
duct
ivity
(µS
cm
-1)
Par
athi
on-e
thyl
Azo
xyst
robi
n
Kre
soxi
m-m
ethy
l
Epo
xico
nazo
le
Fenp
ropi
mor
ph
Pro
pico
nazo
le
Atra
zine
Sim
azin
e
Terb
uthy
lazi
ne
Met
azac
hlor
Chl
orid
azon
Eth
ofum
esat
e
Met
amitr
on
IIsop
rotu
ron
Pro
sulfo
carb
Met
ribuz
in
Met
obro
mur
on
Diu
ron

I A Sampling Method 20
The contamination found in the drainage channels has to rate as extremely high. The pesticides in this entry route are probably introduced by field drainage pipes (Gentry et al., 2000; Kladivko et al., 1999) and by runoff (Schulz et al., 1998) from the adjacent agricultural fields.
Pesticide contamination in the sewage sewer
Four of the seven investigated rainfall events caused inflow from this entry route into the stream. All samples were contaminated with at least one herbicide and a maximum of eleven. Herbicides were found nearly continuously with concentrations up to 9.4 µg L-1 for Metamitron and 5.4 µg L-1 for Ethofumesate. Diuron was found at levels up to 2 µg L-1. No insecticides or fungicides were detected.
The sewage sewer carries the sewage entering a sewage plant. After heavy precipitation the input flow exceeds the capacity of the sewage plant and causes an emergency overflow into the stream. This could be prevented only by increasing the temporary storage capacity of the plant. The introduction of unclarified sewage to a body of water as a source of agricultural pesticides has attracted little attention till now. The causes are the cleaning of the spraying equipment on paved farmyards (UBA, 1997) and the handling of pesticide containers at wash basins after agricultural or private use (Seel et al., 1996).
Overall we found remarkable pesticide contamination in the entry routes we considered. In Germany no target value for pesticides in entry-route water is available at all. For stream water the Federal Environmental Agency has recently published a proposal with quality targets for 35 pesticides (UBA, 1999). Of the 20 pesticide agents investigated here only eight (Table 1) have such a quality target. We found that seven (chloridazon, diuron, isoproturon, metazachlor, parathion-ethyl, simazine, terbuthylazine) of these exceeded the quality target. The pesticide contamination via the investigated entry routes can be evaluated as significant. The concentrations found for the three pesticide classes correlate with the amount applied on average in the catchment area during the investigation period (Neumann et al., 2002). Herbicides caused the highest contamination and were applied at a rate of 1.5 kg per hectare, while fungicides were only applied at 0.18 kg ha-1. Insecticides were on average only used at 0.0002 kg ha-1 in the catchment area and detected only once.
Conclusion
- The water-sampling device presented here monitors the water-quality of point sources periodically entering surface water. It demonstrates whether an inflow event occurred at all and at the same time passively samples the inflow event to specify the relative pesticides levels.
- Besides the output from waste-water treatment plants, the emergency overflow of sewage sewers and the outlets of rainwater sewers and small drainage channels can be regarded as point sources of pesticides to streams.
Acknowledgement
This study was supported by funds from local agencies: the Niersverband GmbH in Viersen, the Stadtwerke Viersen GmbH and the Amt für Wasser- und Abwasserwirtschaft, Kreisstrassen des Kreises Viersen, Germany.

I A Sampling Method 21
References Gentry L. E., David M. B., Smith-Starks K. M. and Kovacic D. A. (2000) Nitrogen fertilizer and
herbicide transport from tile drained fields. J. Environ. Qual. 29, 232-240.
Fischer P., Bach M., Burhenne J., Spiteller M. and Frede H.-G. (1996) Pesticides in streams Part 3: Non-point and point sources in small streams [in german]. DGM 40, 168-173.
Kladivko E. J., Grochulska J., Turco R. F., Van Scoyoc G. E. and Eigel J. D. (1999) Pesticide and nitrate transport into subsurface tile drains of different spacings. J. Environ. Qual. 28, 997-1004.
Liess M., Schulz R., Liess M. H.-D., Rother B. and Kreuzig R. (1999) Determination of insecticide contamination in agricultural headwater streams. Wat. Res. 33, 239-247.
Liess M. and Schulz R. (2000) Sampling methods in surface waters. In Handbook of water analysis, eds. L. M. L. Nollet, pp. 1-24. Marcel Dekker, New York.
Mohaupt V., Bach M. and Behrendt H. (1999) Overview on diffuse sources of nutrients; pesticides and heavy metals in Germany - Methods, results and recommendations for water protection policy. Erweiterte Zusammenfassung der Jahrestagung der Deutschen Gesellschaft für Limnologie (DGL) Rostock 1999 1, 479-487.
Neumann M., Schulz R., Schäfer K., Müller W., Mannheller W. and Liess M. (2002) The significance of entry routes as point and non-point sources of pesticides in small streams. Wat. Res. 36, 835-842.
Schulz R. (2001) Rainfall-induced sediment and pesticide input from orchards into the Lourens River, Western Cape, South Africa: importance of a single event. Wat. Res. 35, 1869-1876.
Schulz R., Hauschild M., Ebeling M., Nanko -Drees J., Wogram J. and Liess M. (1998) A qualitative field method for monitoring pesticides in the edge-of-field runoff. Chemosphere 36, 3071-3082.
Seel P., Knepper T. P., Stanislava G., Weber A. and Haberer K. (1996) Sewage plant as entry route of pesticides in a stream [in german]. Vom Wasser 86, 247-262.
Spalding R. F. and Snow D. D. (1989) Stream levels of agrochemicals during a spring discharge event. Chemosphere 19, 1129-1140.
UBA (ed.) (1997) Pesticide impact in streams from agricultural farmyard runoff [in german]. 87/97, Federal Environmental Agency Berlin ISSN 0722-186X.

22
II 2002
Water Research 36(4): 835-842
The significance of entry routes as point and non-point sources of pesticides in small streams
Michael Neumann1*, Ralf Schulz1, Karin Schäfer2, Wolfgang Müller3, Wilfried Mannheller4 & Matthias Liess5
1Zoological Institute, Department of Limnology; Technical University Braunschweig, Fasanenstrasse 3, D-38092 Braunschweig, Germany
2Staatliches Umweltamt Düsseldorf, Schanzenstrasse 90, D-40549 Düsseldorf, Germany;
3Staatliches Umweltamt Krefeld, St.-Töniser Strasse. 60, D-47803 Krefeld, Germany;
4Niersverband, Freiheitsstrasse 173, D-41747 Viersen, Germany
5Department of Chemical Ecotoxicology; UFZ Center for Environmental Research, Permoserstr. 15, D-04318 Leipzig, Germany
*Author to whom all correspondence should be addressed: Tel: +49-531-3913180; Fax: +49-531-3918201; email: m.neumann@tu-
bs.de
Abstract
In an agricultural catchment area in Germany we analyzed water samples from five entry routes for 2 insecticides, 5 fungicides and 13 herbicides. The sewage plant outlet and the emergency overflow of a sewage sewer contained only herbicides. In each farmyard runoff we found on average 24 g pesticides during application period, presumably caused by cleaning the spraying equipment. In comparison, the field runoff and the rainwater sewer contained less load, but also insecticides, fungicides and herbicides. The sewage plant caused 65.9% of the total herbicide load, the sewage sewer 19.8% and the farmyard runoff 12.8%. The farmyards also caused 83.7% of total insecticide and 83.8% of fungicide load. The total load of all entry routes is correlated with the amount of pesticides applied in the catchment area and the Ko/w value for each pesticide (mult. regress. r2: 0.82; p < 0.0001; n=14). In stream A the sewage plant caused a slight but continuous contamination by herbicides with 82% of the total load found during low-water phases. In comparison, stream B had only farmyard runoff and non-point sources, which caused high peaks of herbicide and a contamination by insecticides. Consequently high-water phases generated 70% of the total pesticide load.
Key words
Pesticides, Herbicides, Fungicides, Insecticides, Small streams, Catchment, Non-point source, Entry routes, Farmyard runoff, Sewage plant.
Introduction
Streams contaminated by pesticides are impaired because they can in turn pollute groundwater and the contamination can severely affect the aquatic community (Liess and Schulz, 1999; Schulz and Liess, 1999). Small streams with intensively cultivated catchment areas receive non-point input of pesticides via field runoff (Liess et al., 1999; Wauchope, 1978; Williams et al., 1995) and field drainage pipes (Gentry et al., 2000; Kladivko et al., 1999). Sewage plant outlet (Nitschke and Schüssler, 1998), sewer overflows (Iannuzzi et al., 1997) and runoff from farmyards (UBA, 1997) also make a significant contribution. Less
II Entry routes as sources of pesticides 23
important are inputs by drift, direct spraying or from the atmosphere in precipitation.
Input by most entry routes depends on heavy precipitation, so that their contribution to stream pollution is brief and unpredictable. It is generally thought that the insecticides so introduced are mostly bound to suspended matter, whereas herbicides are transported in dissolved form (Fawcett, 1994; Wauchope, 1978). The input of herbicides from point sources, farmyard runoff (Bach and Frede, 1996; Seel et al., 1996) and field drainage pipes (Gentry et al., 2000; Kladivko et al., 1999) has been investigated. Input of insecticides in the water phase has so far been documented mainly for field runoff (Liess et al., 1999; Schulz et al., 1998).
The significance of the individual entry routes has previously been estimated by measuring the water in the streams and not by direct sampling of the entry routes themselves (Seel et al., 1996). Our aim was to fill this gap by extensive sampling of the water flowing through all relevant entry routes in the catchment area after precipitation, and to analyze a broad spectrum of 20 pesticides. Using these data, the entry routes were compared and their contribution to pesticide contamination estimated. Another objective was to compare the contamination profiles of each stream following heavy precipitation and periods of dry weather.
Materials and Methods
Study area
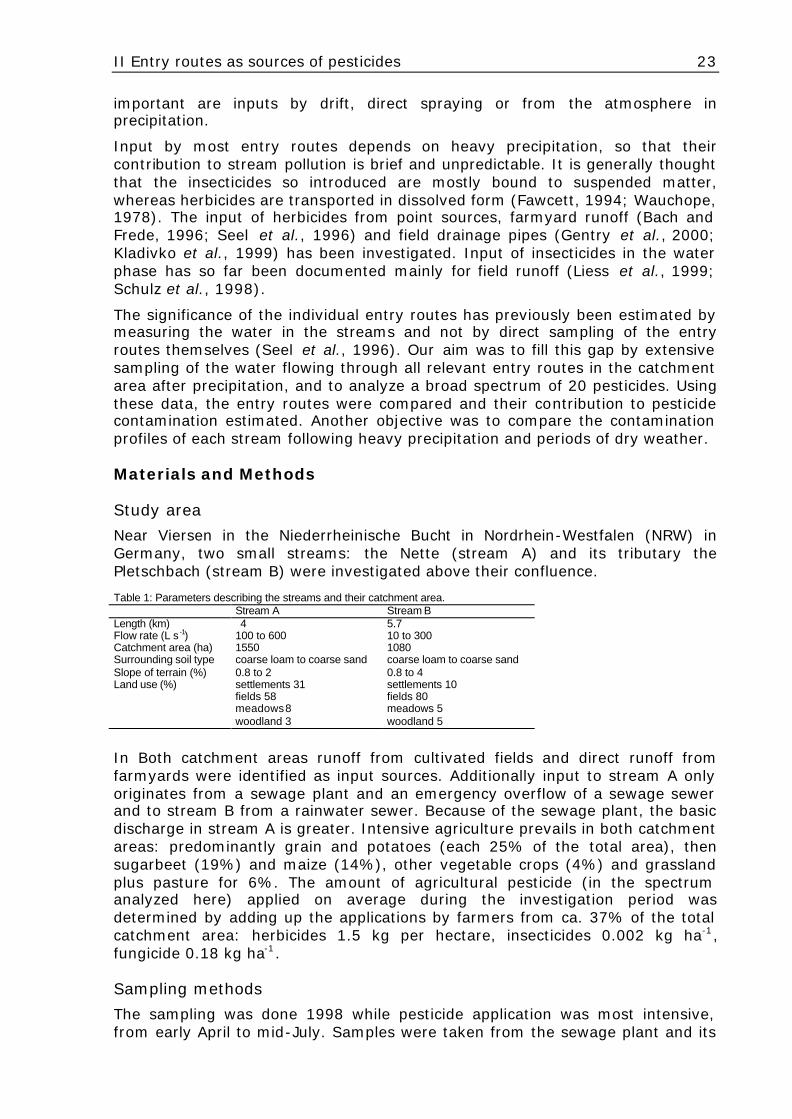
Near Viersen in the Niederrheinische Bucht in Nordrhein-Westfalen (NRW) in Germany, two small streams: the Nette (stream A) and its tributary the Pletschbach (stream B) were investigated above their confluence. Table 1: Parameters describing the streams and their catchment area.
Stream A Stream B Length (km) 4 5.7 Flow rate (L s -1) 100 to 600 10 to 300 Catchment area (ha) 1550 1080 Surrounding soil type coarse loam to coarse sand coarse loam to coarse sand Slope of terrain (%) 0.8 to 2 0.8 to 4 Land use (%) settlements 31
fields 58 meadows 8 woodland 3
settlements 10 fields 80 meadows 5 woodland 5
In Both catchment areas runoff from cultivated fields and direct runoff from farmyards were identified as input sources. Additionally input to stream A only originates from a sewage plant and an emergency overflow of a sewage sewer and to stream B from a rainwater sewer. Because of the sewage plant, the basic discharge in stream A is greater. Intensive agriculture prevails in both catchment areas: predominantly grain and potatoes (each 25% of the total area), then sugarbeet (19%) and maize (14%), other vegetable crops (4%) and grassland plus pasture for 6%. The amount of agricultural pesticide (in the spectrum analyzed here) applied on average during the investigation period was determined by adding up the applications by farmers from ca. 37% of the total catchment area: herbicides 1.5 kg per hectare, insecticides 0.002 kg ha-1, fungicide 0.18 kg ha-1.
Sampling methods
The sampling was done 1998 while pesticide application was most intensive, from early April to mid-July. Samples were taken from the sewage plant and its

II Entry routes as sources of pesticides 24
emergency overflow of the sewage sewer (only stream A), the outlet from a rainwater sewer (only stream B), farmyard runoff (3 out of 25 farmyards) and surface runoff from cultivated fields (7 out of 20 fields). Drainage pipes as entry route of water percolating through the ground were not investigated because they are rare in this region.
Water samples from the streams were taken during high-water and low-water phases. After dry-weather phases we used hand-sampling. When precipitation exceeded 10 mm d-1 we used computer-controlled water samplers described by Liess et al. (1999). Simultaneously, passive high-water samplers were employed, in which a container filled up with water whenever the stream level rose by more than 5 cm. We assumed that the characteristic of the samples where the same for both sampler types. The 24-h precipitation was measured daily. From all available high-water-phases samples only those taken after heavy precipitation where analysed.
In the entry routes we used various sampling methods. Runoff from cultivated fields was collected in sampling bottles at the entrance to the stream described in Schulz et al. (1998). This sample principle was also applied to the farmyard runoff, the emergency overflow of the sewage sewer and the discharge from the rainwater sewer. From the sewage plant outlet a composite sample (100 ml per hour) was taken every day by an automatic sampler.
Analysis methods
The water samples were analysed in two different laboratories. The water samples taken from the streams after heavy precipitation and the water samples from all entry routes were analyzed at the Institute for Ecological Chemistry of the Technical University of Braunschweig. The samples were concentrated by solid-phase extraction (RP-C18) and analysed by GC/MS similar to the method described by (Liess et al., 1999). Two insecticides (fenvalerate and parathion-ethyl) and five fungicides (azoxystrobin (= pyroxystrobin), kresoxim-methyl, epoxiconazole, fenpropimorph, propiconazole) were analyzed. Of the 13 herbicides analysed, atrazine and simazine are prohibited for agricultural use. Terbuthylazine, metazachlor, chloridazon, ethofumesate, metamitron, isoproturon, prosulfocarb, metribuzin, and metobromuron are actual agricultural herbicides. Bromazil (= imazalil) and diuron were also analysed, although not used agriculturally. The detection limits reached 0.1-0.5 µg L-1 depending on the matrix loading. Four (5%) heavily matrix-loaded samples gave only detection limits of 0.6-1 µg L-1. The detection limit for metobromuron and diuron was 1 µg L-1.
The stream samples taken after dry-weather phases were analysed by the Staatliches Umweltamt Düsseldorf, Germany. The samples were taken and analysed according to the norms DIN 38407-2 (1993-02) and DIN EN ISO 11369 (1997-11). After liquid-liquid extraction the extracts were analyzed by GC/ECD. A determination limit of 0.1 µg L-1 was reached. From the 20 agents presented in this paper this analysis included no insecticides, no fungicides and only 10 herbicidal agents (atrazine, simazine, terbuthylazine, metazachlor, chloridazon, metamitron, isoproturon, metribuzine, metobromuron and diuron).
Stream load calculation
The hydrograph curve of discharge gauges indicated that 6 hours was the average duration of a flood event. Therefore the concentrations measured for a high-water phase were expressed to the respective 6-hour discharge volume.

II Entry routes as sources of pesticides 25
Concentrations after dry-weather phases were averaged and loads were calculated using the average discharge between flood events.
Entry route load estimation
The sewage plant outlet and the emergency overflow of the sewage sewer were measured with level recorders, so that the respective pesticide loads could be estimated from the measured concentrations. The plant treats the sewage output from 23,000 inhabitants and industrial waste water equivalent of 22,000 inhabitants with multistage mechanical, biological and chemical treatments.
Field runoff could only be observed when precipitation exceeded 10 mm d-1. According to models calculating the amount of effective precipitation (Huber et al., 1998) this means that at least 2% of the precipitation became field runoff. For load estimation we used 2% as a fixed value for all amounts of precipitation because only the first surge was sampled and is considered to be contaminated. The catchment area of each field runoff sampler was estimated from a 1:5000 map. For the runoff from farmyards the estimated area and only the first millimetre of precipitation (first-surge approach) were used for discharge-volume calculation. For the rainwater sewer (stream B) a modified first-surge approach was used. Given the width (800 mm) and gradient (1:500) of the concrete tube, the level signalled by the sampler (16 cm) according to the standard formula indicated a discharge of 3600 L min-1. This rate was applied to a 20-min surge to calculate the volume of contaminated water.
Results and Discussion
Pesticides in the entry routes
The five investigated entry routes differ widely in the degree of pesticide contamination. Figure 1 shows an overview of their contamination profiles, based on a total of 57 water samples. The mean values for the positive readings are shown together with the maximal concentration and the percentage of contaminated samples.
a. Field runoff
In the water phase of the field runoff 19 pesticides were detected with a total load of 66.2 g during the investigation period. Samples from April were found to be either still uncontaminated or contaminated only by metribuzine. As the period of pesticide application progressed, the spectrum expanded and several pesticides were present simultaneously. The herbicides were detected at highest concentrations, with greatest frequencies. Remarkably, even herbicides not permitted in Germany were detected: atrazine and simazine as well as Diuron twice at an asparagus field. The herbicide Metazachlor was detected at a very high concentration shortly after application. The corresponding stream water sample had a low concentration, which can be explained by dilution. Insecticides and fungicides were rarely present, because the number and the amount of application is low. Overall, 82% of the samples were contaminated with pesticide, though only small amounts were present.
High herbicide concentrations in the runoff from agricultural areas and the input to streams of insecticides bound to suspended particles have been described in depth (Wauchope, 1978; Williams et al., 1995). Less is known about insecticides and fungicides carried in the water phase of field runoff (Fawcett, 1994; Liess et al., 1999; Schulz et al., 1998).

II Entry routes as sources of pesticides 26
b. Farmyard runoff
In the runoff from farmyards 17 pesticides were found, and again the herbicides dominated, occurring at extremely high concentrations and frequencies. In April, only a scattered contamination was present, e.g. isoproturon (115 µg L-1) or metribuzine. In June, several pesticides were detected at high concentrations: prosulfocarb (1451 µg L-1), metamitron (846 µg L-1) and ethofumesate (266 µg L-
1). It is notable that diuron, which is not permitted as an agricultural herbicide, was present (9.5 µg L-1), as was atrazine in 58% of the samples, although it has been prohibited since the mid-1980’s. Altogether 95% of the water samples were contaminated with at least one pesticide.
Farmyard runoff, carrying an estimated average of 24 g per farm (total: 604 g during investigation period), clearly contributes to the contamination of the streams. This value is well within the published range of 11 to 48 g (Bach and Frede, 1996; Seel et al., 1996). Crucially, insecticides and fungicides also enter the streams by this route in the water phase, which has rarely been described in the literature.
c. Rainwater sewer
In the water of this entry route 17 pesticides were found. All samples were contaminated with minimally 3 and maximally 14 pesticides. The concentrations of the herbicides were particularly high. The total loading of this route was estimated at 18.5 g during the investigation period.
In the sewage systems of many small communities an effort is made to separate sewage and rainwater, so that the rainwater need not be treated. The rainwater sewer studied here collects the water drained from the eaves of buildings, the streets and the paved surfaces of a small village. Our analyses show that even such rainwater sewer can carry pesticides into streams. The spectrum of detected substances includes insecticides and fungicides, consequently, this entry route is comparable to the runoff from fields and farmyards.
d. Sewage plant
The only contaminants detected in the sewage-plant outlet were 12 herbicides with a total load of 3068.6 g during the investigation period. All the samples were contaminated with a broad spectrum (up to 11) of pesticides, of which atrazine, ethofumesate, terbuthylazine, chloridazon and metamitron were present almost continuously. The concentrations were low. From unpublished examination by the Staatliches Umweltamt Düsseldorf, Germany we know that Diuron is presented in this sewage plant almost continuously with concentration lower than our detection limit. No insecticides or fungicides were detected, presumably because only small amounts are applied and treatment in the plant causes marked dilution and mixing, sorption and decomposition.

II Entry routes as sources of pesticides 27
Fig. 1.: Overview of the contamination of the five entry routes, showing the mean concentration for the positive readings of the pesticides (bars), maximal concentration (brackets) and the percentage of samples contaminated.

II Entry routes as sources of pesticides 28
Sewage plants are known to introduce large quantities of herbicides to bodies of water (Nitschke and Schüssler, 1998; Seel et al., 1996; Stangroom et al., 1998). Because of the high flow rate and great dilution their final concentrations are low, but their constant presence produces a large total load.
e. Sewage sewer
The sewage sewer carries the water entering the sewage plant. During the study period heavy precipitation caused emergency overflow seven times. Five of these inputs were analyzed. All samples were contaminated with at least one herbicide and a maximum of eleven. The concentrations and frequencies of contamination generally exceeded those for the sewage plant.
Although the emergency overflow accounts for only 4.2% of the total output volume (plant plus overflow), it contains 23.2% (924.8 g) of the total amount of pesticide introduced to stream A by the two entry routes.
The introduction of unclarified sewage to a body of water as a source of agricultural pesticides has attracted little attention till now. This input route however, has proved more significant than the sewage-plant outlet. The entry from this source can be only prevent by increasing the temporary storage capacity of the plant.
Relationship between entry route load and applied amount
By regression analysis we attempted to explain the load of each pesticide found in the entry routes on the basis of certain variables. The amount of each substance applied was determined by asking the farmers. No use was reported for parathion-ethyl, atrazine, simazine, metazachlor, bromazil or diuron. The octanol/water distribution coefficient (Ko/w value) for each pesticide was taken from Perkow (1988). For the regression calculation both quantity variables were expressed as logarithms and the normal distribution was confirmed by the Kolmogorov-Smirnov test. Both variables are correlated with the summed loads of all entry routes for each pesticide with r2= 0.43; p < 0.0106; n=14 (Ko/w value) and with r2= 0.65; p < 0.0005; n=14 (Log (amount applied)).
In the multiple regression shown in Table 2 they correlate with r2 of 0.81. It was confirmed that the two variables are not correlated with one another (r2= 0.12; p: n.s.; n=14). Table 2: Multiple linear regression to explain the summed loads of all entry routes by the amount applied and the Ko/w value for each pesticide. The two independent variables are not correlated with one another (r2 = 0.21; p: n.s.; n = 14).
Dependent variable Log (entry routes)
mult. r2 0.81
p 0.0001
n 14
Indepependent variables Log (amount applied) Ko/w constant
B 1.57 -0.49 -4.06
SE B 0.33 0.16 1.69
Beta 0.66 -0.42 -
p 0.0006 0.0103 0.0352
The amount applied in the catchment region and Ko/w value both significantly influence the loads found in the entry routes. The more important factor is the amount applied. The Ko/w value is negatively correlated with the load detected,

II Entry routes as sources of pesticides 29
i.e. the stronger the tendency of a substance to bind to particles, the smaller the amount found in the water phase. The same relation to Ko/w value was found by Iwakuma et al. (1993). The solubility of a substance is strongly correlated with its Ko/w value and does not improve the multiple regression. The half-life times could not be considered as they have not been measured with comparable methods for all substances.
It is generally thought that chemical properties (e.g., sorption) are the crucial determinants of input in the water phase of surface runoff (Iwakuma et al., 1993; Wauchope, 1978). Our focus on the individual entry routes in Table 3 shows however that the amounts applied are mainly responsible for the pesticide load, for all pesticide classes considered. The contribution increases the shorter the studied entry route is and with less chance for sorption or degradation.
In no case was a multiple regression with amount applied and Ko/w value significant. A dependence on Ko/w value was found only for the field runoff, which is the only place pesticides should be applied. All other entry routes can be dramatically reduced by following the good agricultural practice and careful pesticide-handling. This is the same for the outlet from the sewage plant and the emergency overflow of the sewage sewer although no correlation was found here. These entry routes are caused by farmyards connected to the sewage sewer and by non-agricultural use.
Relative contribution of each entry route
We can now estimate the amounts of pesticides in each class and the percentage contributed by each entry route for the summed catchment area of streams A and B. This is done by direct event-controlled sampling in the entry routes. Measurements in the stream would not reveal small amounts of contamination, owing to dilution in the large volume of water. Table 3: Linear regression to explain the loads in the individual entry routes either by the amount applied or the Ko/w value for each pesticide. Dependent variable Independent variable r2 p B SE B n Log (farmyard runoff) Log (amount applied) 0.61 0.002 1.52 0.36 13 Log (field runoff) Log (amount applied) 0.35 0.026 0.82 0.32 14 Log (field runoff) K o/w value 0.36 0.023 -0.41 0.16 14 Log (rainwater sewer) Log (amount applied) 0.49 0.011 0.63 0.20 12 Log (sewage plant) Log (amount applied) - n.s. - - 7 Log (sewage sewer) Log (amount applied) - n.s. - - 7
In similar comparative studies sewage plants have been viewed as the most important source (Seel et al., 1996). Here, however, as table 4 shows, this applies only to herbicides and, remarkably, an additional ca. 20% is contributed by the emergency overflow of the sewage sewer. The reason for this large contamination are farmyards connected to the sewage sewer and non-agricultural use. Insecticides and fungicides could not be detected. For these the most important input route is farmyard runoff.
For the smaller stream B, with no sewage plant or sewage sewer in its catchment area, the significance of non-point sources was confirmed. Here the farmyard runoff accounts for 89.8% and field runoff for 7.5% of the herbicide input. Farmyard runoff is the most important input to stream B for all classes of pesticides. This reflects the typical structure of the landscape, throughout which individual farms are scattered.

II Entry routes as sources of pesticides 30
Table 4: Proportion of total pesticides in the three pesticide classes contributed by each entry route, for the whole catchment area of streams A and B. Also shown are the estimated absolute amount (g) and the number of pesticides analyzed per class.
Insecticides (n = 2) Fungicides (n = 5) Herbicides (n = 13) Total Load (g) 0.32 9.82 4656.4
Field runoff (%) 3.9 7.7 1.1 Farmyard runoff (%) 83.7 83.8 12.8 Rainwater sewer (%) 12.4 8.5 0.4 Sewage plant (%) n.d. n.d. 65.9 Sewage sewer (%) n.d. n.d. 19.8
Pesticide concentrations in the streams
From the two streams a total of 21 water samples were taken during high-water phases and 12 after dry-weather phases. The contamination found in each stream was consistent with the findings for its individual entry routes. The profiles are typical of a stream with a sewage plant in its catchment area (A) and one with a catchment area, having mainly non-point sources (B).
Stream A was contaminated mainly by herbicides. Every sample showed contamination. In April isoproturon (6.7 µg L-1) and chloridazon (1.2 µg L-1) were unequivocally detected and in June the most important contaminants were metamitron (5.1 µg L-1) and ethofumesate (2.1 µg L-1). As Figure 2 shows, no insecticides or fungicides were detected. The contamination profile of stream A reflects the input from the sewage plant and its emergency overflow, with relatively low concentrations and a dominant herbicide component. Concentration peaks from other entry routes are diminished by dilution in the large volume of water. After dry-weather phases the contamination is almost constant at a low level.
The contamination profile of stream B was different, with a greater variety of pesticides and higher concentrations resulting from precipitation-induced inputs (e.g., diuron at 4.3 and 2.4 µg L-1 and atrazine at 2.5 µg L-1). The peak concentrations were 31.1 µg L-1 for terbuthylazine and 14.5 µg L-1 for metamitron. Relatively large amounts of fungicides were present, and a high level of contamination by the insecticides fenvalerate and parathion-ethyl was observed. After dry-weather phases the pesticide load in stream B was distinctly lower, but even then all the water samples were contaminated.
The volume flow rate after dry-weather phases is 7-fold higher in stream A than in stream B and the total contaminant load is also higher, by a factor of 8.4. On average, therefore, the concentrations are higher in stream A. In high-water phases, however, the contaminant load in stream A is only 2.2-fold higher than in stream B, which therefore contains distinctly higher concentrations.
In stream B 70% of the estimated load is introduced during brief events with a high contamination rate. In stream A continuous contamination of the steady volume flow during dry weather accounts for 82% of the estimated contaminant load.
The comparison shows that a stream with a sewage plant in its catchment area is continuously contaminated by herbicides, and any inputs of insecticides and fungicides are masked by dilution in the large volume of water. Streams with catchment areas including non-point sources are characterized by marked contamination peaks. During these events insecticides can be detected.

II Entry routes as sources of pesticides 31
Fig. 2.: Overview of the contamination of the water samples from the two streams during high water and after dry weather, showing the mean concentration for the positive readings of the pesticides (bars), the maximal concentration (brackets) and the percentage of samples contaminated.
Conclusion
- A sewage plant can be the quantitatively most important source of herbicides, contaminating a stream almost continuously. In such streams the low-water phase accounts for most of the contaminant load and non-point sources are insignificant.
- Farmyard runoff can be the second most important source of herbicides. After heavy precipitation farmyard runoff and non-point sources (field runoff) produce contamination peaks and account for most of the contaminant load of small streams.
- Both the emergency overflow of a sewage sewer and the outflow from a rainwater sewer contaminate streams with pesticides.

II Entry routes as sources of pesticides 32
- The amount of a pesticide in the precipitation-induced entry routes is determined primarily by the amount applied to the catchment area. In the runoff from farmyards the pesticides in current use are detectable. Hence cleaning of the spraying equipment should be done only on the fields or near the manure collection pit.
Acknowledgement
This study was supported by funds from local agencies: the Niersverband GmbH in Viersen, the Stadtwerke Viersen GmbH and the Amt für Wasser- und Abwasserwirtschaft, Kreisstrassen des Kreises Viersen, Germany.
References Bach M. and Frede H.-G. (1996) Pesticides in streams Part 2: ...[in german]. DGM 40, 163-168.
Fawcett R. S. (1994) The impact of conservation tillage on pesticide runoff into surface water. J. Soil Wat. Conserv. 49, 126-135.
Gentry L. E., David M. B., Smith-Starks K. M. and Kovacic D. A. (2000) Nitrogen fertilizer and herbicide transport from tile drained fields. J. Environ. Qual. 29, 232-240.
Huber A., Bach M. and Frede H. G. (1998) Modeling pesticide losses with surface runoff in Germany. The Science of the Total Environment 223, 177-191.
Iannuzzi T. J., Huntley S. L., Schmidt C. W., Finley B. L., McNutt R. P. and Burton S. J. (1997) Combined sewer overflows (CSOs) as sources of sediment contamination in the lower Passaic River, New Jersey. I. Priority pollutants and inorganic chemicals. Chemosphere 34, 213-231.
Iwakuma T., Shiraishi H., Nohara S. and Takamura K. (1993) Runoff properties and change in concentrations of agricultural pesticides in a river system during a rice cultivation period. Chemosphere 27, 677-691.
Kladivko E. J., Grochulska J., Turco R. F., Van Scoyoc G. E. and Eigel J. D. (1999) Pesticide and nitrate transport into subsurface tile drains of different spacings. J. Environ. Qual. 28, 997-1004.
Liess M. and Schulz R. (1999) Linking insecticide contamination and population response in an agricultural stream. Environ. Toxicol. Chem. 18, 1948-1955.
Liess M., Schulz R., Liess M. H.-D., Rother B. and Kreuzig R. (1999) Determination of insecticide contamination in agricultural headwater streams. Wat. Res. 33, 239-247.
Nitschke L. and Schüssler W. (1998) Surface water polution by herbicides from effluents of waste water treatment plant. Chemosphere 36, 35-41.
Perkow W. (1988) Active substanzes of Pesticides [in german]. Paul Parey Bd. 1+2, Berlin, Hamburg
Schulz R., Hauschild M., Ebeling M., Nanko -Drees J., Wogram J. and Liess M. (1998) A qualitative field method for monitoring pesticides in the edge-of-field runoff. Chemosphere 36, 3071-3082.
Schulz R. and Liess M. (1999) A field study of the effects of agriculturally derived insecticide input on stream macroinvertebrate dynamics. Aquat. Toxicol. 46, 155-176.
Seel P., Knepper T. P., Stanislava G., Weber A. and Haberer K. (1996) Sewage plant as entry route of pesticides in a stream [in german]. Vom Wasser 86, 247-262.
Stangroom S. J., Collins C. D. and Lester J. N. (1998) Sources of organic micropollutants to lowlnad rivers. Environmental Technology 19, 643-666.
UBA (ed.) (1997) Pesticide impact in streams from agricultural farmyard runoff [in german]. 87/97, Federal Environmental Agency Berlin ISSN 0722-186X.
Wauchope R. D. (1978) The pesticide content of surface water draining from agricultural fields - a review. J. Environ. Qual. 7, 459-472.

II Entry routes as sources of pesticides 33
Williams R. J., Brooke D., Matthiesen P., Mills M., Turnbull A. and Harrison R. M. (1995) Pesticide transport to surface waters within an agricultural catchment. J. Inst. Wat. Environ. Man. 9, 72-81.

34
III 2001
Tagungsbericht 1999 der DGL, Band I, S. 503-508
Diffuse und punktuelle Eintragspfade für Pflanzenschutzmittel und ihre Bedeutung für zwei kleine
Fließgewässer
Neumann, Michael & Schulz, Ralf & Liess, Mathias AG Limnologie des Zoologischen Institutes der TU Braunschweig, Fasanenstr. 3, 38092 Braunschweig; email: [email protected]
Zusammenfassung
Es werden Pflanzenschutzmittelnachweise aus der oberen Nette und dem Pletschbach (Kreis Viersen; NRW) vorgestellt. Die Wasserproben wurden mit ereignisgesteuerten Probenehmern im Zeitraum April bis Juli 1998 genommen. Beprobt wurde sowohl das Oberflächenwasser als auch alle relevanten Zuflüsse zum Gewässer.
Beide untersuchten Oberflächengewässer waren stark durch PSM-Wirkstoffe belastet. Die vorläufigen Zielvorgaben für PSM des LAWA-Arbeitskreis Zielvorgaben wurden deutlich überschritten. Die Nette ist in ihrem PSM-Belastungsprofil eindeutig durch die kontinuierlichen Einträge aus der Kläranlage dominiert. 77,4% der PSM-Fracht wird durch Belastungen bei Trocken-wetterabfluß verursacht. In dem Pletschbach wurden vor allem infolge niederschlagsgebundener Einträge hohe Konzentrationen gefunden. Es wurden auch die Insektizide Fenvalerat und Parathion-ethyl nachgewiesen. Die PSM-Fracht wird hier zu 85,8% durch die Belastung der diffusen Quellen verursacht.
Die Eintragspfade ins Gewässer konnten differenziert charakterisiert werden. Die Kläranlage Dülken verursacht 87% der gesamten Belastung mit Herbiziden (Insektizide und Fungizide nicht nachweisbar). Insektizide und Fungizide werden durch diffuse Quellen eingetragen. 76,3% werden durch direkte Abläufe von landwirtschaftlichen Hofflächen verursacht (11,2% der Belastung durch Herbizide). Der Oberflächenabfluß von Ackerflächen und der Ablauf eines Regenwasserkanals verursachen die weiteren festgestellten Einträge in die Oberflächengewässer.
Untersuchungsgebiet und Probenahmekonzept
Das Untersuchungsgebiet ist ein Teil des Nierseinzugsgebietes und liegt in der Niederrheinischen Bucht nordwestlich der Stadt Mönchengladbach, nahe der Grenze zu den Niederlanden. Es umfaßt das Einzugsgebiet der oberen Nette von Dülken bis zur Mündung in den Breyeller See und das Einzugsgebiet des Pletschbachs
Das Untersuchungsgebiet wird intensiv landwirtschaftlich genutzt. Kartoffeln dominieren mit ca. 25% gefolgt von Rüben mit ca. 20% die Flächennutzung. Der Getreideanbau findet insgesamt auf 25% der Fläche statt. Gemüsekulturen werden auf ca. 4% der Flächen betrieben.
Die Niers selber wurde bereits auf ihre Belastung durch Pflanzenschutzmittel (PSM) hin untersucht (Gladtke et al., 1997). Die Kläranlagen spielen dabei eine wichtige Rolle, wobei auch Hinweise auf die Bedeutung von diffusen Quellen
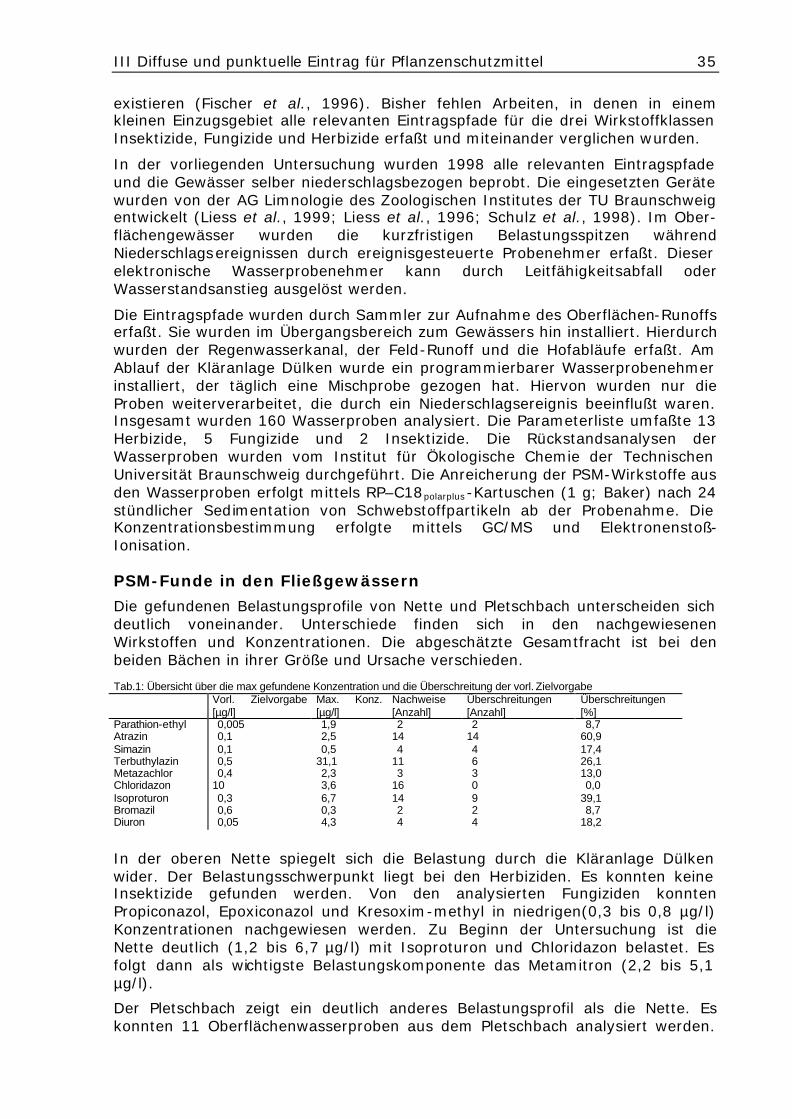
III Diffuse und punktuelle Eintrag für Pflanzenschutzmittel 35
existieren (Fischer et al., 1996). Bisher fehlen Arbeiten, in denen in einem kleinen Einzugsgebiet alle relevanten Eintragspfade für die drei Wirkstoffklassen Insektizide, Fungizide und Herbizide erfaßt und miteinander verglichen wurden.
In der vorliegenden Untersuchung wurden 1998 alle relevanten Eintragspfade und die Gewässer selber niederschlagsbezogen beprobt. Die eingesetzten Geräte wurden von der AG Limnologie des Zoologischen Institutes der TU Braunschweig entwickelt (Liess et al., 1999; Liess et al., 1996; Schulz et al., 1998). Im Ober-flächengewässer wurden die kurzfristigen Belastungsspitzen während Niederschlagsereignissen durch ereignisgesteuerte Probenehmer erfaßt. Dieser elektronische Wasserprobenehmer kann durch Leitfähigkeitsabfall oder Wasserstandsanstieg ausgelöst werden.
Die Eintragspfade wurden durch Sammler zur Aufnahme des Oberflächen-Runoffs erfaßt. Sie wurden im Übergangsbereich zum Gewässers hin installiert. Hierdurch wurden der Regenwasserkanal, der Feld-Runoff und die Hofabläufe erfaßt. Am Ablauf der Kläranlage Dülken wurde ein programmierbarer Wasserprobenehmer installiert, der täglich eine Mischprobe gezogen hat. Hiervon wurden nur die Proben weiterverarbeitet, die durch ein Niederschlagsereignis beeinflußt waren. Insgesamt wurden 160 Wasserproben analysiert. Die Parameterliste umfaßte 13 Herbizide, 5 Fungizide und 2 Insektizide. Die Rückstandsanalysen der Wasserproben wurden vom Institut für Ökologische Chemie der Technischen Universität Braunschweig durchgeführt. Die Anreicherung der PSM-Wirkstoffe aus den Wasserproben erfolgt mittels RP–C18polarplus-Kartuschen (1 g; Baker) nach 24 stündlicher Sedimentation von Schwebstoffpartikeln ab der Probenahme. Die Konzentrationsbestimmung erfolgte mittels GC/MS und Elektronenstoß-Ionisation.
PSM-Funde in den Fließgewässern
Die gefundenen Belastungsprofile von Nette und Pletschbach unterscheiden sich deutlich voneinander. Unterschiede finden sich in den nachgewiesenen Wirkstoffen und Konzentrationen. Die abgeschätzte Gesamtfracht ist bei den beiden Bächen in ihrer Größe und Ursache verschieden. Tab.1: Übersicht über die max gefundene Konzentration und die Überschreitung der vorl. Zielvorgabe
Vorl. Zielvorgabe [µg/l]
Max. Konz. [µg/l]
Nachweise [Anzahl]
Überschreitungen [Anzahl]
Überschreitungen [%]
Parathion-ethyl 0,005 1,9 2 2 8,7 Atrazin 0,1 2,5 14 14 60,9 Simazin 0,1 0,5 4 4 17,4 Terbuthylazin 0,5 31,1 11 6 26,1 Metazachlor 0,4 2,3 3 3 13,0 Chloridazon 10 3,6 16 0 0,0 Isoproturon 0,3 6,7 14 9 39,1 Bromazil 0,6 0,3 2 2 8,7 Diuron 0,05 4,3 4 4 18,2
In der oberen Nette spiegelt sich die Belastung durch die Kläranlage Dülken wider. Der Belastungsschwerpunkt liegt bei den Herbiziden. Es konnten keine Insektizide gefunden werden. Von den analysierten Fungiziden konnten Propiconazol, Epoxiconazol und Kresoxim-methyl in niedrigen(0,3 bis 0,8 µg/l) Konzentrationen nachgewiesen werden. Zu Beginn der Untersuchung ist die Nette deutlich (1,2 bis 6,7 µg/l) mit Isoproturon und Chloridazon belastet. Es folgt dann als wichtigste Belastungskomponente das Metamitron (2,2 bis 5,1 µg/l).
Der Pletschbach zeigt ein deutlich anderes Belastungsprofil als die Nette. Es konnten 11 Oberflächenwasserproben aus dem Pletschbach analysiert werden.

III Diffuse und punktuelle Eintrag für Pflanzenschutzmittel 36
Die Konzentrationsspitzen liegen für Terbuthylazin bei 31,1 µg/l und für Metamitron bei 14,5 µg/l. Bemerkenswert ist auch die höhere Belastung durch Diuron (4,3 und 2,4 µg/l) und Atrazin (2,5 µg/l). Es konnten vier Fungizidwirkstoffe nachgewiesen werden. Aus ökotoxikologischer Sicht ist auch die hohe Belastung mit den Insektiziden Fenvalerat (0,1 µg/l) und Parathion (1,9 µg/l) an zwei Terminen bedenklich.
Beide Bäche sind erheblich mit PSM belastet. 100% der Wasserproben enthielten PSM-Wirkstoffe. In der Nette wurden 15 Wirkstoffe mit Konzentrationen bis 6,7µg/l gefunden. Innerhalb der 15 Wirkstoffe ergaben sich 38% (für alle 20 Wirkstoffe 28%) Einzelwirkstoffnachweise. Im Pletschbach wurden 19 Wirkstoffe nachgewiesen mit der höchsten Konzentration bei 31,1 µg/l. Hier fanden sich 35% Einzelwirkstoffnachweise für die 19 Wirkstoffe und 33% für alle 20 Wirkstoffe. In der Nette wurden die vorläufigen Zielvorgaben (Kussatz et al., 1999) 18mal und im Pletschbach 21mal überschritten. Tab. 1 zeigt eine Übersicht über die nachgewiesenen Überschreitungen. Durch Analyse der Abfußganglinie gelang eine abschätzende Stofffrachtberechnung. Demnach ist die Stofffracht in der Nette zu 77,4% durch den Trockenwetterabfluß und im Pletschbach zu 85,8% durch die Hochwasserphasen verursacht.
PSM-Funde in den einzelnen Zuflüssen
Die Wasserproben des Feld-Runoffs sind teilweise extrem hoch belastet. Insgesamt waren 81% der Wasserproben belastet. Bis auf Bromazil wurden alle analysierten Wirkstoffe nachgewiesen. Extreme Spitzenkonzentrationen konnten für Metazachlor (568,1 µg/l und 2815 µg/l), Metobromuron (91,2 µg/l), Ethofumesat (26,5 µg/l), Terbuthylazin (20,6 µg/l) und Propiconazol (15,8 µg/l) nachgewiesen werden. Bemerkenswert ist der Nachweis von nicht zugelassenen Wirkstoffen wie Atrazin und Simazin sowie an einem Spargelfeld zweimal von Diuron.
Regenwasserkanal
Hofabläufe
Feld-Runoff
Kläranlage, AbschlagKläranlage,Ablauf
Eintragspfade [g]
Kläranlage, Ablauf 3068,6 Kläranlage, Abschlag 924,8 Regenwasserkanal 18,5 Hofabläufe 518,5 Feld-Runoff 66,2
Abb. 1: Abgeschätzte Stoffmenge der einzelnen Eintragspfade
Auch die direkten Abläufe von landwirtschaftlichen Betriebsflächen sind zum Teil extrem hoch mit PSM-Wirkstoffen belastet. 17 Wirkstoffe wurden nachgewiesen. 95% der Proben waren belastet. Im April waren die Hofabläufe nur durch Isoproturon (115 µg/l) belaste. Im Juni lassen sich in den Proben verschiedene Wirkstoffe nachweisen (Prosulfocarb (1451 µg/l), Metamitron (774 µg/l) und Ethofumesat (232 µg/l)). Die hohen Konzentrationen lassen sich nur durch einen vorherigen Einsatz dieser Substanzen durch den Landwirt erklären. Sowohl Insektizide (Parathion-ethyl (3,3 µg/l)) als auch das Totalherbizid Diuron wurden gefunden. 50% der Hofabläufe sind mit Atrazin belastet. Simazin, Bromazil und Fenvalerat konnten als einzige Substanzen nicht nachgewiesen werden.
Der Ablauf der Kläranlage ist ausschließlich mit Herbiziden belastet. 100% der Proben des Ablauf der Kläranlage und 88% der Proben der Mischwasserabschläge

III Diffuse und punktuelle Eintrag für Pflanzenschutzmittel 37
waren mit PSM-Wirkstoffen belastet. Es treten sehr breite Stoffspektren mit einer fast kontinuierlichen Belastung durch Atrazin, Ethofumesat, Terbuthylazin, Chloridazon und Metamitron auf. Die Konzentrationen liegen auf einem niedrigen Niveau. Der einzige Herbizidwirkstoff ohne Nachweis ist Metobromuron, bei dem lediglich eine Bestimmungsgrenze von 1 µg/l erreicht wurde. Die niedrigen Konzentrationen erklären sich durch die hohen Abflußwerte am Ablauf der Kläranlage. Das kontinuierliche Auftreten der Wirkstoffe kann durch die starke Durchmischung und Pufferung durch die Kläranlage erklärt werden.
Alle Wasserproben aus dem Regenwasserkanal waren durch PSM-Wirkstoffe belastet. Es konnten 17 Wirkstoffe nachgewiesen werden. Die Proben zeichnen sich durch hohe Belastung und ein breites Stoffspektrum aus. Bis auf Fenvalerat, Metobromuron und Bromazil wurden alle 17 anderen Wirkstoffe nachgewiesen. Mit Parathion-ethyl wurde ein Insektizid gefunden. Alle fünf Fungizide treten in niedrigen Konzentrationen auf. Bei den Herbiziden fallen Prosulfocarb, Metamitron und Terbuthylazin durch hohe Konzentrationen auf. Bemerkenswert ist auch, daß Atrazin fast kontinuierlich nachgewiesen wurde und mit 10,5 µg/l und 3,5 µg/l zwei deutlich erhöhte Meßwerte besitzt. Diuron konnte zweimal nachgewiesen werden (1,9 und 11,2 µg/l).
Im Bilanzzeitraum vom 31.03.1998 bis zum 16.07.1998 konnten für alle betrachteten Eintragspfade die verursachten Stoffmengen abgeschätzt werden. Die Stoffmengen wurden durch Annahmen und Faktoren auf das Untersuchungsgebiet und den Bilanzzeitraum hochgerechnet. Sie stellen damit nur eine grobe Annäherung dar, die aufgrund der konservativen Annahmen die wirklichen Stoffmengen wahrscheinlich unterschätzt.
Insgesamt wurden durch die Eintragspfade vermutlich 4596,2 g PSM Wirkstoff in das Untersuchungsgebiet eingebracht. Abbildung 1 zeigt, daß die Kläranlage dabei die größte Stoffmenge verursacht. Von den direkten Eintragspfaden sind die Hofabläufe die wichtigsten, gefolgt vom Feld-Runoff.
Unterscheidet man die Mengen nach den drei Stoffklassen, erkennt man, daß die Herbizide die beiden anderen Stoffklassen bei weiten übertreffen. Für die gemessenen Einträge von Insektiziden und Fungiziden scheinen ausschließlich die Hofabläufe, der Feld-Runoff und die Regenwasserkanalisation verantwortlich zu sein. Die Hofabläufe nehmen dabei den größten Anteil ein.
Von der Landwirtschaftskammer Rheinland Kreisstelle Viersen wurde für die 9,7 ha große Teilfläche des Untersuchungsgebietes auch die angewendeten Stoffmengen nach Wirkstoffen getrennt zur Verfügung gestellt. Diese Daten können die Anwendungen im gesamten Untersuchungsgebiet repräsentieren. In der folgenden Abbildung 2 wurden diese Daten den abgeschätzten Stoffmengen der Eintragspfade gegenübergestellt.
Man erkennt, daß für alle Wirkstoffe eine deutliche Korrelation zwischen der angewendeten Menge und der in den Eintragspfaden gefundenen Menge besteht. Dieser Zusammenhang ist unabhängig der physikalischen Eigenschaften der Stoffe. Die Insektizide, Fungizide und Herbizide bilden jeweils eine eigene Gruppe. Diese Clusterbildung wird aber durch die stoffgruppenunabhängige Korrelation mit einem r2 von 0,65 überlagert. Wirkstoffe für die keine Anwendungsinformationen durch die Landwirtschaft vorlagen sind grau dargestellt und nicht in die Berechnung der Korrelation einbezogen.
Für die Wirkstoffklasse der Insektizide ist nur ein Meßpunkt vorhanden, da Parathion-ethyl auf der ausgewerteten Teilfläche des Untersuchungsgebietes nicht angewendet wurde. Fenvalerat wurde von allen Stoffen am wenigsten

III Diffuse und punktuelle Eintrag für Pflanzenschutzmittel 38
angewendet und auch in den Eintragspfaden am wenigsten nachgewiesen. Von Fenvalerat, über die fünf Fungizide zu den Herbiziden Metobromuron, Isoproturon, Metamitron und Prosulfocarb ist eine eindeutige Korrelation zwischen der angewendeten Menge und der gefundenen Menge vorhanden.
0,001
0,01
0,1
1
10
100
1000
10000
1 10 100 1000
lg. der Stoffmenge [kg] auf einer Teilfläche des Gebietes
lg. d
er S
toffm
enge
[g]
alle
r Ein
trag
spfa
de
Fenvalerat
Parathion KresoximAzoxystrobin
Epoxykonazol
Propiconazol
Fenpropimorph
MetribuzinTerbuthylazin
ChloridazonEthofumesat
MetobromuronIsoproturon
MetamitronProsulfocarbAtrazin
Diuron
MetazachlorSimazin
Bromazil
y = 1,928x - 1,3598 R 2 = 0,6533
Abb.2: Die gefundenen Wirkstoffmengen in den Zuflüssen zu den Fließgewässern in Abhängigkeit von der Aufwandsmenge auf einer Teilfläche des Untersuchungsgebietes. (grau: Wirkstoffe ohne angegebene Anwendung)
Die Herbizid-Wirkstoffe Metribuzin, Terbuthylazin, Chloridazon und Ethofumesat zeigen diesen Zusammenhang nicht. Dies deutet auf weitere Einflußfaktoren hin. Da generell die Stoffmenge der Herbizide vor allem durch den Eintragspfad über die Kläranlage dominiert wird, wird hier ein Einflußfaktor vermutet. Durch die starke Verdünnung und Durchmischung könnte eine Abhängigkeit überlagert werden. Weiterhin ist ein Einfluß durch private Anwendungen im Einzugsgebiet der Kläranlage für dies landwirtschaftlich zugelassenen Herbizid-Wirkstoffe nur schwer zu kalkulieren.
Danksagung
Die vorgestellte Untersuchung wurde im Auftrag der Stadtwerke Viersen GmbH, des Niersverbandes und des Kreis Viersen durchgeführt und vom STUA Krefeld, STUA Düsseldorf und der Landwirtschaftkammer Rheinland unterstützt.
Literatur Fischer, P., M. Bach, J. Burhenne, M. Spiteller & H.-G. Frede, 1996. Pflanzenschutzmittel
in Fließgewässern Teil 3: Anteil diffuser und punktueller Einträge in einem kleinen Vorfluter. DGM 40: 168-173.
Gladtke, D., P. Heyer & P. Werner, 1997. Pflanzenbehandlungsmittel in der Niers - Vorkommen und Herkunft. Korrespondenz Abwasser 44: 687-694.
Kussatz, C., A. Gies & D. Schudoma, 1999. Bewertungsstrategien und Risikoanalyse - Wasser. In e. verlagsgesellschaft (ed.) Ökotoxikologie - Ökosystemare Ansätze und Methoden. Oehlmann Markert, 86899 Landsberg.
Liess, M., R. Schulz, M.H.-D. Liess, B. Rother & R. Kreuzig, 1999. Determination of insecticide contamination in agricultural headwater streams. Wat. Res. 33: 239-247.

III Diffuse und punktuelle Eintrag für Pflanzenschutzmittel 39
Liess, M., R. Schulz & M. Neumann, 1996. A method for monitoring pesticides bound to suspended particles in small streams. Chemosphere 32: 1963-1969.
Schulz, R., M. Hauschild, M. Ebeling, J. Nanko-Drees, J. Wogram & M. Liess, 1998. A qualitative field method for monitoring pesticides in the edge-of-field runoff. Chemosphere 36: 3071-3082.

40
IV 2002
Water Research: 36 (12) 3093-3099
The impact of agricultural runoff on stream benthos in Hong Kong, China
1*Neumann, Michael & 2Dudgeon, David 1Zoological Institute, Department of Limnology; Technical University Braunschweig, Fasanenstrasse 3, D-38092 Braunschweig, Germany
*Author to whom all correspondence should be addressed: Tel: +49-531-3913180; Fax: +49-531-3918201; email: m.neumann@tu-
bs.de;
2Department of Ecology & Biodiversity, The University of Hong Kong, Hong Kong SAR, China
Abstract We investigated three small streams in the New Territories of Hong Kong, China. In each stream we compared the benthic macroinvertebrate fauna of one site immediately upstream of an area of agricultural land (market gardening) with a second site immediately downstream. Each pair of sites was < 300 m apart. Samples were taken at the end of the dry season (March 2000) and again (April 2000) just after heavy rainfall had caused runoff from the fields. The total number of taxa at the downstream sites was the same as that in the upstream sites in March. In April, the total taxon richness was lower at the downstream localities although this difference was statistically significant in only one stream. The acute toxic effect of runoff became clearer when focusing on the group of sensitive benthic fauna. The grouping was done by ranking the relatively physiological tolerance to organotoxins following the relevant literature (Wogram and Liess, 2001). All streams showed a significant downstream decrease in the number of sensitive taxa in April, while in two of three streams the number of relatively tolerant taxa increased. Ordination (by n-MDS) confirmed this pattern. It revealed a marked temporal trend in all streams resulting from a decrease of sensitive taxa downstream that was not apparent at the upstream sites. The size of the observed effects varied among streams, and may have reflected differences in the composition of the agricultural runoff.
Key words Stream; benthic macroinvertebrates; agricultural runoff; sensitive taxa; organotoxins, Hong Kong, China
Introduction Runoff from agricultural fields introduces soil, organic matter, manure, fertiliser and pesticides into small streams, increasing the volume of stream discharge and changing water quality. Cooper (1993) has reviewed the acute toxic and sublethal chronic effects of such runoff, and has identified pesticides as one of the major stressors of aquatic communities. The New Territories (or northern, mainland portion) of Hong Kong, China (lat. 22o N), provides an opportunity to study the effect of agriculture runoff on the aquatic fauna of small streams in the monsoonal tropics. Crops are mainly high-value vegetables and flowers and are sprayed with a range of pesticides and fertilisers. Because land is at a premium in Hong Kong, fields are cultivated up to the stream margins where agriculture is practised. However, because of competition with farmers in mainland China, much agricultural land in Hong Kong has been abandoned in recent years (Dudgeon and Corlett, 1994). Active and abandoned agricultural land is generally situated in portions of drainage basins that do not receive industrial effluents and where, because of recent controls on livestock rearing (see Dudgeon, 1996), animal waste is unlikely to confound attempts to measure the impact of agriculture on the stream

IV The impact of runoff on stream Benthos 41
community. In this study, we investigated the effects of runoff from agricultural fields by comparing the benthic macroinvertebrate communities of paired sites upstream and downstream of farms along three streams. Communities were sampled once at the end of the dry season and again at the start of the wet season when the streams received runoff after heavy rainfall. Our null hypothesis was that the magnitude of the difference between the upstream and downstream pairs of sites would remain unchanged between sampling dates. We anticipated that any difference arising in the data set would be manifest during the wet season, when lower densities or species richness of macroinvertebrates might occur downstream of farmland.
Materials and methods
Study area We sampled three small streams that drain low hills covered with secondary forest and flow through areas of intensive cultivation of vegetables and flowers. Stream A is located near the village Man Uk Pin on the western side of the Sha Tau Kok Road, north-eastern New Territories. It drains into the Ng Tung Ho stream. Stream B flows from the eastern side of the same road and is located near the village of Loi Tung. Stream C is situated close to the village of Tai Wo on the eastern side of the Tai Po Road in the northern-central part of the New Territories.
Fig. 1: Schematic diagram of the sampling strategy in all three streams.
All sampling sites were unshaded and situated at low altitudes (< 60 m asl). They were low gradient (< 1%) streams with substrate of mixed sand and cobbles, and a discharge between 0.1 and 0.25 m s-1. Water depths varied between 8 and 20 cm and the width of the wetted channel ranged from 40 to 100 cm. Hong Kong streams are generally slightly acidic with soft water and few dissolved minerals (aside from silicates), reflecting the igneous geology of the territory (for details see Dudgeon, 1992; Dudgeon and Corlett, 1994). Water samples taken at upstream and downstream sites in March and April revealed that all three streams were well oxygenated (≥ 6 mg l-1) and circum-neutral (pH 6.1-7.2) with low conductivity (560-790 µS cm-1), low Nitrate (≤ 0.9 mg l-1) and some phosphate enrichment (≤ 0.3 mg l-1). The range of values is in line with those reported from unpolluted or slightly enriched streams in Hong Kong (Dudgeon, 1992; Dudgeon, 1996 and references therein).
In each stream an upstream site surrounded by abandoned fields was compared to a downstream section where there was active agriculture (Fig. 1). Apart from this difference, sites were selected to be similar in physical aspect, riparian features and substrate. To minimise the confounding effects of longitudinal variation, the upstream and the downstream sample point were no more than 300 meters apart. No point-

IV The impact of runoff on stream Benthos 42
sources of pollution were evident within the study reaches. We sampled both sampling sites in all three streams twice: on March 14th 2000 and April 8th 2000. Hong Kong receives an annual rainfall of 2214 mm. However, the first sample date corresponded to the end of the dry season when rain was infrequent. Indeed, total rainfall from February 1st to March 31st was only 70 mm (Fig. 2). The second sample was taken a few days after heavy rainfall (169 mm within 48 hours: Fig. 2) and consequent surface runoff.
Fig. 2: Daily rainfall recorded at the Hong Kong Observatory between February and April 2000 (http://www.info.gov.hk/hko/). The sampling dates are indicated.
Sampling and data analysis
Three replicate benthic samples were taken at each site on each date. Samples were equal effort (1-minute) kick samples taken with a 500 micron, D-frame net and preserved in 70% ethanol. Samples were sorted to species or morphospecies and counted.
Independent t-tests for equality of means (SPSS 10.0) were used to analyse differences in taxon richness and abundance of individual taxa between upstream and downstream sites on each sample date. The normal distribution of the data was confirmed by performing Kolmogorov-Smirnov tests. The equality of variances was checked by Levene´s test and, where necessary, we performed t-tests appropriate for unequal variances. Analyses were carried out on taxon richness per sample, and numbers per sample of the abundant taxa Baetis spp. (Baetidae: Ephemeroptera) and Brotia hainanensis (Thiaridae: Gastropoda).
To obtain an overall picture of the community change in response to agricultural runoff we performed an ordination on the data set. Rare taxa, which are liable to random and uninterpretable variations in abundance, may distort or obscure underlying patterns in the data. Accordingly, we eliminated those taxa that were collected at 3 or fewer of the 12 sampling sites (i.e. 6 stream sites times two sampling occasions). Two-dimensional ordination by nonmetric Multidimensional Scaling (n–MDS; strictly, Kruskal’s nonmetric procedure) was carried out on the data set using the z-score transformed abundance data and the Euclidean distance dissimilarity coefficient (SPSS 10.0). The optimal n-MDS solution minimises the metric space and is measured by the so-called “stress” (Kruskal, 1964). Kenkel and Orloci (1986) advocate n-MDS as the best strategy for ecological ordination, and Shepard (1974) recommends the use of only two, or at most three dimensions in n-MDS. Accordingly, we restricted our analysis to two dimensions.

IV The impact of runoff on stream Benthos 43
Table 1. List of all taxa with their relative abundance and the frequency of occurrence at sampling sites. The physiological tolerance (Trel) of each taxon to organic substances, relative to Daphnia magna is given (for details see Wogram and Liess, 2001). Taxa with Trel smaller than 0.41 were treated as “sensitive” taxa (S); the rest were classified as “tolerant” taxa (T).
order
taxon
family
Trel of
order
Trel of
family
sensitive
or tolerant
relative abundance in all
samples combined (%)
Frequency of
occurrence (n/12)
Turbellaria Dugesia sp. Dugesiidae (0.56) 0.48 T 5.7 5
Oligochaeta Naididae spp. Naididae 0.75 n.a. T 18.0 10
Hirudinea Helobdella sp. Glossiphoniidae 0.74 n.a. T 0.2 1
Eulamellibranchia Corbicula fluminea Corbiculidae (0.87) 0.25 S 1.2 2
Basommatophora Radix plicatulus Lymnaeidae (0.72) 0.6 T 0.7 4 Biomphalaria straminea Planorbidae (0.72) 1.18 T 3.3 9
Prosobranchia Pomacea lineata Ampullariidae 1 n.a. T 2.7 5 Brotia hainanensis Thiaridae 1 n.a. T 5.8 8
Decapoda Caridina cantonensis Atyidae 0 n.a. T 0.1 1
Coleoptera Elmidae sp. Elmidae 0.93 n.a. T 0.3 3 Eulichas sp. Eulichadidae 0.93 n.a. T 0.1 1 Hydrophilidae sp. Hydrophilidae 0.93 n.a. T 0.1 2 Lampyridae sp. Lampyridae 0.93 n.a. T 0.1 1 Eubrinax sp. Psephenidae 0.93 n.a. T 0.1 1
Diptera Chironomidae Chironomidae (0.33) 0.23 S 17.7 11 Simulium sp. Simuliidae (0.33) 0.64 T 1.1 5 Tipulidae sp. Tipulidae 0.33 n.a. S 0.7 7
Odonata Pyrrhosoma sp. Coenagrionidae (0.22) 0.11 S 0.54 3 Euphaea decorata Euphaeidae 0.22 n.a. S 0.5 4 Platycnemis sp. Platycnemididae 0.22 n.a. S 2.02 8 Sinictogomphus sp. Gomphidae 0.22 n.a. S 0.1 1 Brachythemis sp. Libellulidae (0.22) 0.89 T 1.8 9 Orthetrum sp. Libellulidae (0.22) 0.89 T 1.5 5 Zygonyx iris Libellulidae (0.22) 0.89 T 0.1 1
Ephemeroptera Alainites sp. Baetidae (-0.08) -0.23 S 0.4 2 Baetis spp. Baetidae (-0.08) -0.23 S 6.8 11 Liebebiella sp. Baetidae (-0.08) -0.23 S 0.3 1 Caenis spp. Caenidae -0.08 n.a. S 3.9 5 Serratella sp. Ephemerellidae -0.08 n.a. S 2.0 3 Ephemera sp. Ephemeridae -0.08 n.a. S 1.2 3 Cinygmina sp. Heptageniidae -0.08 n.a. S 10.5 4 Choroterpes spp. Leptophlebiidae -0.08 n.a. S 6.3 4 Isca purpurea Leptophlebiidae -0.08 n.a. S 0.9 2 Paraleptophlebia sp. Leptophlebiidae -0.08 n.a. S 0.4 1
Heteroptera Trephotomas sp. Helotrephidae 0.58 n.a. T 0.2 3
Megaloptera Neochauliodes sp. Corydalidae 0.93 n.a. T 0.2 4
Trichoptera Cheumatopsyche spp. Hydropsychidae (0.15) 0.35 S 1.2 3 Goerodes doligung Lepidostomatidae 0.15 n.a. S 1.2 6 Psilotreta kwangtungensis Odontoceridae 0.15 n.a. S 0.1 1

IV The impact of runoff on stream Benthos 44
Relative physiological tolerances Table 1 shows the relative physiological tolerance (Trel) for each taxon and their relative abundance and frequency in benthic samples. The tolerances were derived according to the methods of Wogram and Liess (2001), based on information from 2187 acute toxicity tests for 179 different organic substances derived from a total of 283 publications. The effect concentration was compared to that reported for Daphnia magna for the same
Fig. 3: Mean number (n = 3; ± SE) of taxa in the upstream and the downstream sampling points on each of Streams A, B and C in March and April 2000. Abundance data for Baetis spp. and Brotia hainanensis are shown, as examples of (respectively) “sensitive” and “tolerant” species. Differences between upstream and downstream sites (independent t-tests) are indicated: * P <0.05; ** P <0.01.
toxicity test. The raw data were obtained from the database “aquire” of the Environmental Protection Agency (United States EPA 2001). Wogram and Liess (2001) calculated Trel at the level of order only. To increase taxonomic penetration we calculated an independent Trel for family. This was only done if there were more than 5 test results available within a family. For Trel of order we used all available tests including those already used for family calculation. The number of available tests varied from 1 for Megaloptera to 726 for Diptera. Note that, based on the arithmetic mean score for all toxicity test, a positive Trel means that the taxon is relatively more tolerant to organic substances than Daphnia magna (and vice versa).
For further data analysis in this paper we divided all taxa into two groups. Those with Trel smaller 0.41 were grouped as “sensitive” taxa and those with T rel greater than 0.40 were treated as “tolerant” taxa. This boundary is, in some respects, rather arbitrary and a lack
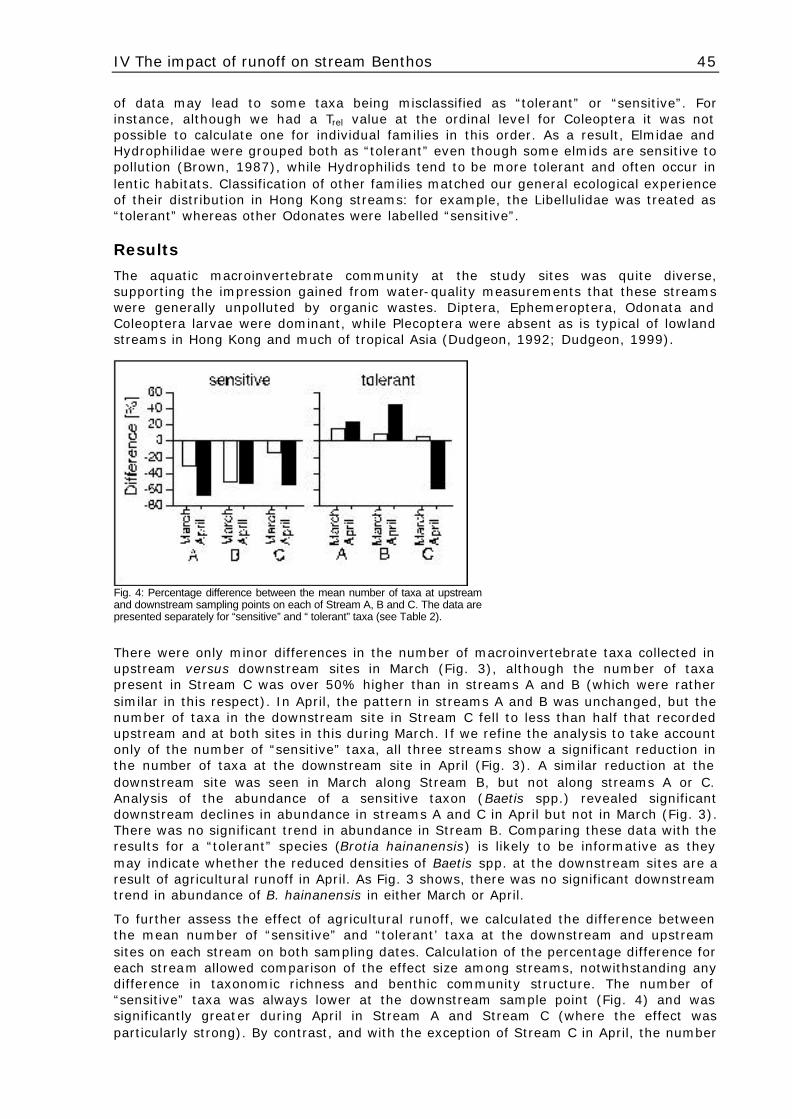
IV The impact of runoff on stream Benthos 45
of data may lead to some taxa being misclassified as “tolerant” or “sensitive”. For instance, although we had a Trel value at the ordinal level for Coleoptera it was not possible to calculate one for individual families in this order. As a result, Elmidae and Hydrophilidae were grouped both as “tolerant” even though some elmids are sensitive to pollution (Brown, 1987), while Hydrophilids tend to be more tolerant and often occur in lentic habitats. Classification of other families matched our general ecological experience of their distribution in Hong Kong streams: for example, the Libellulidae was treated as “tolerant” whereas other Odonates were labelled “sensitive”.
Results
The aquatic macroinvertebrate community at the study sites was quite diverse, supporting the impression gained from water-quality measurements that these streams were generally unpolluted by organic wastes. Diptera, Ephemeroptera, Odonata and Coleoptera larvae were dominant, while Plecoptera were absent as is typical of lowland streams in Hong Kong and much of tropical Asia (Dudgeon, 1992; Dudgeon, 1999).
Fig. 4: Percentage difference between the mean number of taxa at upstream and downstream sampling points on each of Stream A, B and C. The data are presented separately for “sensitive” and “ tolerant” taxa (see Table 2).
There were only minor differences in the number of macroinvertebrate taxa collected in upstream versus downstream sites in March (Fig. 3), although the number of taxa present in Stream C was over 50% higher than in streams A and B (which were rather similar in this respect). In April, the pattern in streams A and B was unchanged, but the number of taxa in the downstream site in Stream C fell to less than half that recorded upstream and at both sites in this during March. If we refine the analysis to take account only of the number of “sensitive” taxa, all three streams show a significant reduction in the number of taxa at the downstream site in April (Fig. 3). A similar reduction at the downstream site was seen in March along Stream B, but not along streams A or C. Analysis of the abundance of a sensitive taxon (Baetis spp.) revealed significant downstream declines in abundance in streams A and C in April but not in March (Fig. 3). There was no significant trend in abundance in Stream B. Comparing these data with the results for a “tolerant” species (Brotia hainanensis) is likely to be informative as they may indicate whether the reduced densities of Baetis spp. at the downstream sites are a result of agricultural runoff in April. As Fig. 3 shows, there was no significant downstream trend in abundance of B. hainanensis in either March or April.
To further assess the effect of agricultural runoff, we calculated the difference between the mean number of “sensitive” and “tolerant’ taxa at the downstream and upstream sites on each stream on both sampling dates. Calculation of the percentage difference for each stream allowed comparison of the effect size among streams, notwithstanding any difference in taxonomic richness and benthic community structure. The number of “sensitive” taxa was always lower at the downstream sample point (Fig. 4) and was significantly greater during April in Stream A and Stream C (where the effect was particularly strong). By contrast, and with the exception of Stream C in April, the number

IV The impact of runoff on stream Benthos 46
of “tolerant” taxa was always higher at the downstream point. In streams A and B (especially the latter) the relative abundance of “tolerant” taxa increased in April.
The n-MDS analysis included the 19 most frequent taxa representing 79.4% of the total abundance of all macroinvertebrates. They comprised 9 “sensitive” and 10 “tolerant” taxa (see Table 1). The two-dimensional solution had a stress value of 0.126 – i.e. it represented a good, useable summary of the sample relationships.
Fig. 5: N–MDS biplot of community composition at streams A, B and C in March and April (stress = 0.126). The open circles represent the March samples and the closed circles the April samples. Upstream and downstream sampling points on each of Stream A, B and C are indicated also.
Dimension 1 of the ordination plot (Fig. 5) appeared to represent the effect of agricultural runoff as upstream and downstream sample points on each stream were separated along this axis. Dimension 2 may have represented the difference between samples taken in March and April. All sample points (with the exception of the downstream site in Stream C) increased along Dimension 2 between March and April. This axis was negatively correlated with the abundance of Chironomidae, Naididae and Orthetrum sp. (Table 2) and thus the shift on the ordination plot was correlated with a decrease in these taxa.
Dimension 1 is the axis of particular interest here. All upstream sites shifted to the left of the plot between March and April, whereas all downstream sites moved to the right. Significantly, most of the macroinvertebrates correlated with Dimension 1 (Table 2) were “sensitive” taxa – especially among the Ephemeroptera and Odonata. Moreover, the three mayfly taxa listed in Table 2 constituted 17% of the total number of invertebrates collected during this study (see Table 1). A shift to the left of the ordination plot reflects an increase in these taxa. Note that the distance moved by the downstream sites is greatest for Stream C, which had the largest effect size (Fig. 4).
Discussion
Our investigation shows that agricultural runoff had a significant effect on the benthic community of three Hong Kong streams. This effect was evident from a comparison of upstream and downstream sites in the stream before and after heavy rainfall and consequent runoff from agricultural land, that impacted the downstream sites. Note that the comparison here was relative, not absolute, size of the effect. The size of the effect varied among the three streams but mainly influenced those taxa, particularly mayflies, that were relatively more sensitive to organic substances. This is evident from the large
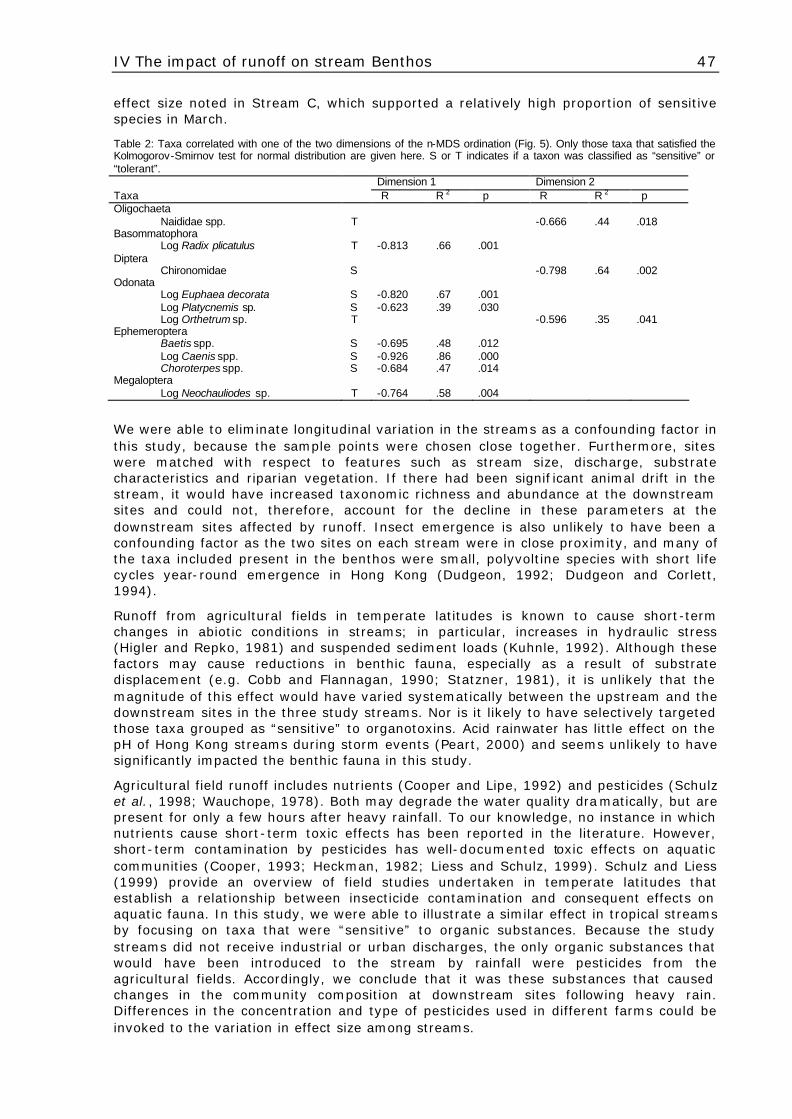
IV The impact of runoff on stream Benthos 47
effect size noted in Stream C, which supported a relatively high proportion of sensitive species in March. Table 2: Taxa correlated with one of the two dimensions of the n-MDS ordination (Fig. 5). Only those taxa that satisfied the Kolmogorov-Smirnov test for normal distribution are given here. S or T indicates if a taxon was classified as “sensitive” or “tolerant”.
Dimension 1 Dimension 2 Taxa R R 2 p R R 2 p Oligochaeta
Naididae spp. T -0.666 .44 .018 Basommatophora
Log Radix plicatulus T -0.813 .66 .001 Diptera
Chironomidae S -0.798 .64 .002 Odonata
Log Euphaea decorata S -0.820 .67 .001 Log Platycnemis sp. S -0.623 .39 .030 Log Orthetrum sp. T -0.596 .35 .041
Ephemeroptera Baetis spp. S -0.695 .48 .012 Log Caenis spp. S -0.926 .86 .000 Choroterpes spp. S -0.684 .47 .014
Megaloptera Log Neochauliodes sp. T -0.764 .58 .004
We were able to eliminate longitudinal variation in the streams as a confounding factor in this study, because the sample points were chosen close together. Furthermore, sites were matched with respect to features such as stream size, discharge, substrate characteristics and riparian vegetation. If there had been signif icant animal drift in the stream, it would have increased taxonomic richness and abundance at the downstream sites and could not, therefore, account for the decline in these parameters at the downstream sites affected by runoff. Insect emergence is also unlikely to have been a confounding factor as the two sites on each stream were in close proximity, and many of the taxa included present in the benthos were small, polyvoltine species with short life cycles year-round emergence in Hong Kong (Dudgeon, 1992; Dudgeon and Corlett, 1994).
Runoff from agricultural fields in temperate latitudes is known to cause short-term changes in abiotic conditions in streams; in particular, increases in hydraulic stress (Higler and Repko, 1981) and suspended sediment loads (Kuhnle, 1992). Although these factors may cause reductions in benthic fauna, especially as a result of substrate displacement (e.g. Cobb and Flannagan, 1990; Statzner, 1981), it is unlikely that the magnitude of this effect would have varied systematically between the upstream and the downstream sites in the three study streams. Nor is it likely to have selectively targeted those taxa grouped as “sensitive” to organotoxins. Acid rainwater has little effect on the pH of Hong Kong streams during storm events (Peart, 2000) and seems unlikely to have significantly impacted the benthic fauna in this study.
Agricultural field runoff includes nutrients (Cooper and Lipe, 1992) and pesticides (Schulz et al., 1998; Wauchope, 1978). Both may degrade the water quality dramatically, but are present for only a few hours after heavy rainfall. To our knowledge, no instance in which nutrients cause short-term toxic effects has been reported in the literature. However, short-term contamination by pesticides has well-documented toxic effects on aquatic communities (Cooper, 1993; Heckman, 1982; Liess and Schulz, 1999). Schulz and Liess (1999) provide an overview of field studies undertaken in temperate latitudes that establish a relationship between insecticide contamination and consequent effects on aquatic fauna. In this study, we were able to illustrate a similar effect in tropical streams by focusing on taxa that were “sensitive” to organic substances. Because the study streams did not receive industrial or urban discharges, the only organic substances that would have been introduced to the stream by rainfall were pesticides from the agricultural fields. Accordingly, we conclude that it was these substances that caused changes in the community composition at downstream sites following heavy rain. Differences in the concentration and type of pesticides used in different farms could be invoked to the variation in effect size among streams.

IV The impact of runoff on stream Benthos 48
Acknowledgements This study was financed by The Deutscher Akademischer Austauschdienst (German Academic Exchange Service), Kennedyallee 50 in 53175 Bonn, Germany and was supported by The Deutsche Bundesstiftung Umwelt (German Federal Environmental Foundation), An der Bornau 2 in 49090 Osnabrueck, Germany.
References Brown H. P. (1987) Biology of riffle beetles. Ann. Rev. Ent. 32, 253-273.
Cobb D. G. and Flannagan J. F. (1990) Trichoptera and Substrate Stability in the Ochre River, Manitoba. Hydrobiologia 206, 29-38.
Cooper C. M. (1993) Biological effects of agriculturally derived surface -water pollutants on aquatic systems - a review. J. Environ. Qual. 22, 402-408.
Cooper C. M. and Lipe W. M. (1992) Water quality and agriculture: Mississipi experiences. J. Soil Wat. Conserv. 47, 220-223.
Dudgeon D. (1992) Pattern and Processes in stream Ecology: a Synoptic Review of Hong Kong Running Waters. Schweizerbart´sche Verlagsbuchhandlung , Stuttgart.
Dudgeon D. (1996) Anthropogenic influences on Hong Kong streams. GeoJournal 40, 53-61.
Dudgeon D. (1999) Tropical Asian Streams: Zoobenthos, Ecology and Conservation. Hong Kong University Press, Hong Kong.
Dudgeon D. and Corlett R. T. (1994) Hills and Streams: an Ecology of Hong Kong. Hong Kong University Press , Hong Kong.
Heckman C. W. (1982) Pesticide effects on aquatic habitats. Environ. Sci. Technol. 16, 48A-57A.
Higler L. W. G. and Repko F. F. (1981) The effects of pollution in the drainage area of a Dutch lowland stream on fish and macroinvertebrates. Verh. Inernat. Verein. Limnol. 21, 1077-1082.
Kenkel N. C. and Orloci L. (1986) Applying metric and nonmetric multidimensional scaling to ecological studies: Some new results. Ecology 67, 919-928.
Kruskal J. B. (1964) Multidimensional scaling by optimizing goodness of fit to a nonmetric hypothesis. Psychometrika 29, 1-27.
Kuhnle R. A. (1992) Bed load transport during rising and falling stages on two small streams. Earth Surface Processs and Landforms 17, 191-197.
Liess M. and Schulz R. (1999) Linking insecticide contamination and population response in an agricultural stream. Environ. Toxicol. Chem. 18, 1948-1955.
Peart M. R. (2000) Acid rain, storm period chemistry and their potential impact on stream communities in Hong Kong. Chemosphere 41, 25-31.
Schulz R., Hauschild M., Ebeling M., Nanko -Drees J., Wogram J. and Liess M. (1998) A qualitative field method for monitoring pesticides in the edge-of-field runoff. Chemosphere 36, 3071-3082.
Schulz R. and Liess M. (1999) A field study of the effects of agriculturally derived insecticide input on stream macroinvertebrate dynamics. Aquat. Toxicol. 46, 155-176.
Shepard R. N. (1974) Representation of structure in similarity data: problems and prospects. Psychometrika 39, 373-421.
Statzner B. (1981) The relation between "hydraulic stress" and microdistribution of benthic macroinvertebrates in a lowland running water system, the Schierenseebrooks (North Germany). Arch. Hydrobiol. 91, 192-218.
Wauchope R. D. (1978) The pesticide content of surface water draining from agricultural fields - a review. J. Environ. Qual. 7, 459-472.
Wogram J. and Liess M. (2001) Rank Ordering of the sensitivity of macroinvertebrate species to toxic compounds, by comparison with that of Daphnia magna. Bull. Environ. Contam. Toxicol. 67, 360-367.

49
V 2002
Ecological Indicators: in press
An expert system to estimate the pesticide contamination of small streams using benthic
macroinvertebrates as bioindicators, Part 1: The database of LIMPACT
Michael Neumann1*, Matthias Liess2 & Ralf Schulz1
1Zoological Institute, Department of Limnology; Technical University Braunschweig, Fasanenstrasse 3, D-38092 Braunschweig, Germany
2Department of Chemical Ecotoxicology; UFZ Center for Environmental Research, Permoserstr. 15, D-04318 Leipzig, Germany
*Author to whom all correspondence should be addressed: Tel: +49-531-3913180; Fax: +49-531-3918201; email: m.neumann@tu-
bs.de
Abstract
We developed an expert system (LIMPACT) to estimate the pesticide contamination of streams using macroinvertebrate indicators. Here we present the database consisting of 157 data sets obtained from 1992 until 2000 through investigation of 104 small headwater streams with an agricultural catchment area. The contamination by pesticides (insecticides, fungicides and herbicides) during rainfall events varied greatly in both water and suspended-particle samples, occasionally reaching ecotoxicologically relevant levels. On the basis of standardised toxicities, the data sets were grouped into Not Detected (n=55), Low (34), Moderate (42) and High (26) contamination with pesticides. Additionally, nine water-quality and morphological parameters were evaluated with regard to their influence on the fauna and are used to exclude unsuitable streams from LIMPACT. The benthic macroinvertebrate fauna data were divided into four time frames (March/April; May/June; July/August; September/October) and analysed regarding the abundance and the abundance dynamics of the 39 most common taxa. In contaminated streams lower abundance for negative and higher for positive indicator taxa were observed. The number of taxa was significantly lower (unpaired t-test p<0.015) in the most severely contaminated streams. Information abstracted from this empirical approach was used to create rules indicating or not indicating contamination and to build up the heuristic knowledge base of LIMPACT as shown in the Part 2 paper (Neumann et al., this issue).
Key words
agricultural non-point pollution; surface water; insecticides, fungicides, herbicides, effect, runoff
Introduction
Small streams in agriculturally used catchment areas are subject to various stressors. During heavy rainfall, runoff from agricultural fields may introduce soil, nutrients and pesticides and increases the discharge (Cooper, 1993; Neumann and Dudgeon, in press). It has been shown that the impact of pesticides is an important parameter which influences the aquatic fauna (Liess and Schulz, 1999; Schulz and Liess, 1999). Small streams sum up to an enormous length on the

V The database of the expert system LIMPACT 50
landscape level and therefore the conservation and protection of their aquatic community should be a major concern. Consequently, a tool is needed to monitor water quality on the landscape level.
The indication of non-point source contamination via chemical analysis is costly. Because of its short-term character (Kreuger, 1995), only rainfall event-controlled sampling methods can reflect such transient contamination (Liess and Schulz, 2000; Liess et al., 1999). Hence the indication via benthic macroinvertebrate bioindicators could give evidence over a longer period and therefore would be more cost-efficient. Furthermore, it would indicate the toxicity of the contamination and not only the concentration of chemicals.
Our group has undertaken investigations of a large number of agricultural headwater streams during the last ten years. Event-controlled sampling methods and repeated sampling of the benthic macroinvertebrate fauna in the streams feature in the data sets. The aim of the present study was to use these data to develop a biological indicator system based on an expert system that estimates the pesticide contamination of small streams. The input parameters of the expert system are benthic macroinvertebrate abundance data and basic water-quality and morphological parameters. The output is an estimation of the pesticide contamination according to four classes. We name this expert system LIMPACT and in this paper we present the database. In Part 2 (Neumann et al., this issue) we present the development and the structure of the knowledge base of LIMPACT.
Materials and Methods
Data pool and considered streams
All of the 104 investigated streams are located in Germany within regions of intensive agricultural land use. The largest numbers of sampling points were located around the city of Braunschweig. Other sampling regions were close to Hamburg, Hannover, Kassel and Mannheim. All streams were carefully selected to ensure that the impact from agricultural land use is the major stressor. None of the sampling points was located in urban areas or received industrial discharge or animal farm waste. Only 7 streams received water from a sewage treatment plant.
All sampling sites were unshaded and represent lowland streams with low gradient (max. slope: 3°) and with substrate of mixed sand, loam and silt. Most streams had a current velocity lower than 0.5 m s-1; only 3 streams had a maximum between 0.5 m s-1 and 0.9 m s-1. Water depths varied between 5 and 70 cm, with only 8 streams at their maximum deeper than 50 cm. The width of the streams ranged from 25 to 400 cm, with only 8 streams at their maximum wider than 200 cm.
The streams were investigated by the Zoological Institute, Department of Limnology at the Technical University of Braunschweig, Germany between the years 1992 and 2000. Some streams were investigated repeatedly in different years. Consequently, we named the resulting data sets as "investigations per stream and year". An overview of the data sets is given in (Liess, 1993; Schulz, 1997; Wogram, 2001; Neumann et al., in press). Here we present the database application development. All data had to be gathered, classified in a common design and validity-controlled. The process of data entry and acquisition was the most time-consuming part of the development of LIMPACT.
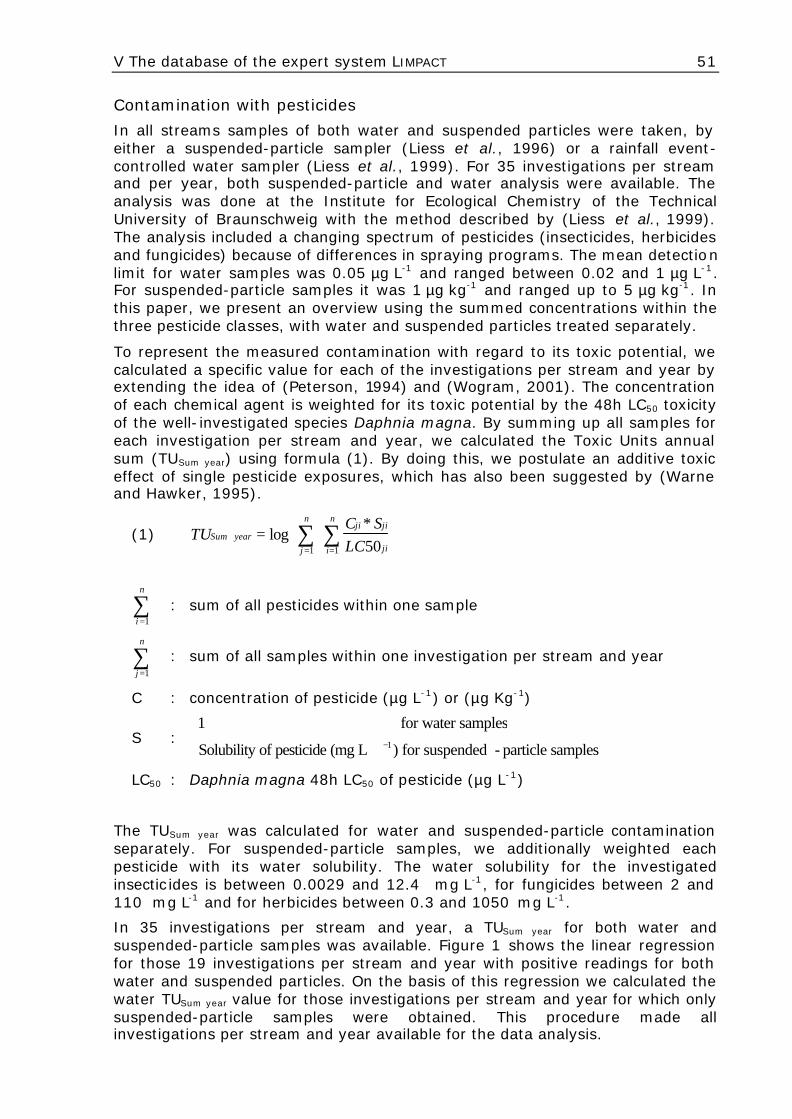
V The database of the expert system LIMPACT 51
Contamination with pesticides
In all streams samples of both water and suspended particles were taken, by either a suspended-particle sampler (Liess et al., 1996) or a rainfall event-controlled water sampler (Liess et al., 1999). For 35 investigations per stream and per year, both suspended-particle and water analysis were available. The analysis was done at the Institute for Ecological Chemistry of the Technical University of Braunschweig with the method described by (Liess et al., 1999). The analysis included a changing spectrum of pesticides (insecticides, herbicides and fungicides) because of differences in spraying programs. The mean detection limit for water samples was 0.05 µg L-1 and ranged between 0.02 and 1 µg L-1. For suspended-particle samples it was 1 µg kg-1 and ranged up to 5 µg kg-1. In this paper, we present an overview using the summed concentrations within the three pesticide classes, with water and suspended particles treated separately.
To represent the measured contamination with regard to its toxic potential, we calculated a specific value for each of the investigations per stream and year by extending the idea of (Peterson, 1994) and (Wogram, 2001). The concentration of each chemical agent is weighted for its toxic potential by the 48h LC50 toxicity of the well-investigated species Daphnia magna. By summing up all samples for each investigation per stream and year, we calculated the Toxic Units annual sum (TUSum year) using formula (1). By doing this, we postulate an additive toxic effect of single pesticide exposures, which has also been suggested by (Warne and Hawker, 1995).
(1) TUSum year = logCji * Sji
LC50 jii=1
n
∑
j =1
n
∑
i =1
n
∑ : sum of all pesticides within one sample
j =1
n
∑ : sum of all samples within one investigation per stream and year
C : concentration of pesticide (µg L-1) or (µg Kg-1)
S : 1 for water samples
Solubility of pesticide (mg L −1) for suspended - particle samples
LC50 : Daphnia magna 48h LC50 of pesticide (µg L-1)
The TUSum year was calculated for water and suspended-particle contamination separately. For suspended-particle samples, we additionally weighted each pesticide with its water solubility. The water solubility for the investigated insectic ides is between 0.0029 and 12.4 mg L-1, for fungicides between 2 and 110 mg L-1 and for herbicides between 0.3 and 1050 mg L-1.
In 35 investigations per stream and year, a TUSum year for both water and suspended-particle samples was available. Figure 1 shows the linear regression for those 19 investigations per stream and year with positive readings for both water and suspended particles. On the basis of this regression we calculated the water TUSum year value for those investigations per stream and year for which only suspended-particle samples were obtained. This procedure made all investigations per stream and year available for the data analysis.

V The database of the expert system LIMPACT 52
Fig. 1: Correlation between the summarised standard toxicity value TUSum year for water samples and for suspended-particle samples.
Water-quality and morphological parameters
In addition to the pesticide contamination and the aquatic fauna, other water-quality and morphological parameters were measured in the streams. During the process of data acquisition, we compared only those information common to all investigations per stream and year and had to group the information on a higher level. Our aim was to give LIMPACT information about those parameters that may influence the aquatic macroinvertebrate fauna the most.
(1) Organic pollution according to the German saprobic index (mean per year) (2) Morphological structures in the stream as the percentage of stream bed area covered by submerse and emerse plants, woody debris and tree roots (maximum per year) (3) Stream bed area consist of sand (maximum per year) (4) Current velocity (maximum per year) (5) Cross-sectional area of stream: width in cm multiplied by the depth in cm (maximum per year) (6) Drying out in summer (number of dry months) (7) Conductivity of the stream water, to reflect the general soil type (mean per year) (8) pH-value (mean per year) (9) Carbonate water hardness to differentiate between silicate and carbonate streams (mean per year)
Benthic macroinvertebrate fauna
The animal sampling was done with four to six replicate Surber samplers (area of 0.125 m2) per site and sampling date. Abundance data are given as the mean of individuals per square meter. When possible, the animals were identified at the species level. However, during the process of data acquisition we had to group some taxa on higher taxonomic levels.

V The database of the expert system LIMPACT 53
Fig. 2: Boxplots illustrating the distribution of pesticide concentrations in contaminated samples. Values in brackets are the total number of samples. Within each sample the sums for herbicides, fungicides and insecticides are presented separately.
Results and Discussion
Database of LIMPACT
After data acquisition and database application development we had access to biological data and pesticide contamination data from 104 sampling sites. Because some sampling sites were investigated repeatedly in different years, 157 investigations per stream and year were available. Animal sampling and measurement of water-quality and morphological parameters was done between one and seven times per year. Overall, our database had 660 sampling dates available.
Contamination with pesticides
For each investigation per stream and year we selected only those water and suspended-sediment samples that followed heavy rainfall (>10 mm d-1). A total of 555 samples were analysed. 286 samples were contaminated and 269 were below detection limit. Of the 317 water samples 64% (202) were contaminated with pesticide, whereas of the 238 suspended-particle samples only 35% (84) were contaminated. In water samples the level of contamination increased from insecticides to fungicides and herbicides (Fig. 2). For suspended-particle samples the low herbicide contamination reflects the lower tendency to become bound to particles.
In the USA the Clean Water Act (CWA) of 1972 demands no emission of toxic substances into watercourses. The US EPA developed Water Quality Criteria (WQC) and Sediment Quality Criteria (SQC) and distinguishes between criteria for maximum concentration (CMC) and criteria for chronic concentration (CCC) (USEPA, 1991; USEPA, 1999). None of the substances with a SQC (USEPA, 1992) and with a WQC are investigated here. In Germany the Federal Environmental Agency has recently published a proposal with quality targets for 35 pesticides (UBA, 1999). Of the 30 pesticide agents investigated here only nine have a quality target. We found that seven (Chloridazon, Bromacil, Diuron, Isoproturan, Lindan, Metazachlor, Paration-ethyl, Simazin, Terbutylazin) of these exceeded the quality target. For drinking water the European Union has generally a target level of 0.1 µg L-1 for each single pesticide. The stream water contamination we observed exceeds this level for 25 of the 30 pesticides. The pesticide load is above loads that have been shown to affect the benthos in microcosm studies

V The database of the expert system LIMPACT 54
(Liess and Schulz, 1996; Schulz and Liess, 2000). For suspended particles in stream water no target value is available in Germany at all. Sorption is known to decrease toxicity, but microcosm studies showed effects (Schulz and Liess, 2001a; Schulz and Liess, 2001b) at the same contamination level we found in the streams. We can state that the available data for the pesticide contamination of the streams show that some levels are above those that would be expected to affect the macroinvertebrate community.
Fig. 3: Number of investigations in each month with a) pesticide samples and b) macroinvertebrate samples for the 157 investigations per stream and year.
Figure 3 indicates for which month pesticide samples (a) or an animal sample (b) are available and shows that the most pesticide samples were taken in the months April, May, and June. This period is within the main application period for pesticides in Germany, which lasts from late April to early August.
Figure 4 shows the grouping of all 157 investigations per stream and year according to their TUSum year value. In the first class ND (not detected) streams without any contamination above detection limit were grouped. The other three groups contain streams with detectable pesticide contamination: L stands for low

V The database of the expert system LIMPACT 55
contamination (TUSum year < -4), M for moderately contaminated (TUSum year < -2) and H for highly contaminated (TUSum year ≥ -2).
Fig. 4: Distribution of the 157 investigations per stream and year over the four pesticide contamination classes.
The reason for grouping the streams rather than using the TUSum year as a continuous variable is that this makes the expert system less sensitive to errors. Here we choose a very conservative approach rather than overinterpreting the precision of our field measurements. These four groups of contamination are the basis for the development of LIMPACT and constitute the diagnoses which a user of LIMPACT will obtain as result (see Part 2 (Neumann et al., this issue)).
Water-quality and morphological parameters
Bioindicators can only work within a defined range of influencing factors. Consequently, we excluded from the expert system LIMPACT streams with extreme parameter values suggesting that other stressors than the pesticide contamination could influence the macroinvertebrate fauna. Of the nine parameters we considered, the five most important ones are presented in Figure 5. The range in which a stream would be excluded from LIMPACT is labelled as suspected (S) or established (E). For details refer to Part 2 (Neumann et al., this issue).
The organic pollution (Fig. 5 (1)) showed a normal distribution around a mean saprobic index of 2.2. According to (Friedrich, 1990) an influence on the macroinvertebrate fauna is expected for values higher than 2.3. LIMPACT does not accept streams with a saprobic index higher than 2.6. For values between 2.3 and 2.6 we only suspect (S) an unsuitable stream for LIMPACT. The mean over the four pesticide contamination classes shows a significant increase between the uncontaminated class and the two highest contamination classes (unpaired t-test, p<0.05). However, the absolute increase of the sabrobic index from 2.15 to 2.25 is within a very small range and thus rather negligible.
The morphological structures in the streams (Fig. 5 (2)) varied over the whole range. According to (Sabarth, 1999), streams with values below 20% are suspected (S) as unsuitable for LIMPACT, because a small amount of morphological structures may be an influencing factor for the macroinvertebrate fauna and may, e.g., indicate a recent stream clearance. Most of the streams are

V The database of the expert system LIMPACT 56
Fig. 5: Mean (±SE; n = 26 to 55) values of selected water quality and morphological parameters over the four contamination classes (left graphs) and the distribution of the values in the database (right graphs). The suspected (S) or established (E) exclusion of data sets with extreme values from LIMPACT is indicated. Different letters indicate significant differences.

V The database of the expert system LIMPACT 57
maintained for the purpose of drainage, which consequently reduces the structure in the stream. However, no trend is found in the mean amount of morphological structures over the contamination classes.
The proportion of stream bottom covered with sand (Fig. 5 (3)) varied over the whole range from 0 to 100%. The mean over the four classes shows a significant (unpaired t-test, p<0.05) decline from 45% to 22%. More severely contaminated streams have less sand, which could be caused by the soil type of the catchment area. The risk of runoff is lower for sandy soils. LIMPACT regards streams with values smaller than 20% or higher than 80% as unsuitable, because extreme values may influence the macroinvertebrate fauna (Sabarth, 1999; Wagner, 1986).
The maximum current velocity in the stream (Fig. 5 (4)) shows clearly that we considered small streams. Only three streams had a current velocity high enough to be considered unsuitable, along with the extremely low current velocities. The strong influence of current velocities on stream macroinvertebrates has been reported for example by Statzner (1981). The distribution of the means shows no correlation with contamination.
The cross section of the stream (Fig. 5 (5)) also reflected our main focus on small streams. Streams with cross-sectional areas greater than 8,000 cm2 are suspected to be unsuitable for LIMPACT. It is known that stream typology influences the aquatic community structure (Verdonschot, 1992). No trend is seen in the data, but there is a slight increase of mean size for moderately contaminated streams.
In small streams with an agricultural catchment area in Germany, the parameters (6) number of dry months, (7) conductivity, (8) pH-value and (9) carbonate water hardness are seldom stressors to the benthic macroinvertebrate fauna. None of these showed significant trends in the data set that could mask the effect of pesticide contamination on the macroinvertebrate fauna. In our data, no extreme values occurred; thus these parameters are not illustrated here. However, streams with extremely low and/or extremely high values for these parameters are also not accepted for the use in LIMPACT, because this may influence the aquatic fauna (Braukmann and Pinter, 1997).
Benthic macroinvertebrate fauna
To interpret the abundance dynamics of the benthic macroinvertebrate taxa within one year we established four time frames for which information about abundance is essential. These are T1: March/April, T2: May/June, T3: July/August and T4: September/October (Fig. 2). This approach adjusts the various investigations per stream and year. With regard to the expert system this reduces the number of necessary sampling dates that the user of LIMPACT has to provide. In our database 98% of the 157 investigations per stream and year provided sampling data during the main application period (Fig. 2).
The macroinvertebrate fauna was dominated by Trichoptera, Diptera, Oligochaeta, and Amphipoda (mainly Gammarus pulex). Oligochaeta and Gastropoda were found in 30% of the samples. A total of 386 taxa were found in the 104 sampled sites. Since rare taxa are liable to high sampling variability, for the development of the knowledge base of LIMPACT we used only the 39 most common taxa, representing 90.4% of the total abundance. A detailed list of these taxa is given in Part 2 (Neumann et al., this issue).

V The database of the expert system LIMPACT 58
Benthic macroinvertebrate fauna as indicator
The detailed analysis of the abundance data and the abundance dynamics of each of the 39 taxa is presented in Part 2 (Neumann et al., this issue). As part of an empirical approach we classified the taxa as a negative indicator (NI) or as a positive indicator (PI) (Murtaugh, 1996) for pesticide contamination. A negative
Fig. 6: Mean (±SE; n = 26 to 55) number of animals and number of taxa for the group of all taxa, negative indicator (NI) taxa and positive indicator (PI) taxa for each of the time frames T1 and T3 and each of the contamination group Not Detected, Low, Moderate and High. Different letters indicate significant differences within each time frame.
indicator is a species with an abundance negatively correlated with the pesticide contamination. The abundance of a positive indicator is positively correlated with the contamination. High abundance of a negative indicator therefore indicates low contamination, while high abundance of positive indicator suggests high contamination. In this paper, we used this grouping to analyse differences in

V The database of the expert system LIMPACT 59
number of taxa and abundance data for negative and positive indicators at variously contaminated sites.
Figure 6 presents for all taxa, for negative indicator taxa and for positive indicator taxa the mean (±SE) of number of individuals and the mean (±SE) of number of taxa. The results are given separately for the four classes of pesticide contamination during March and April (T1; before main spraying period) and July and August (T3; following main spraying period).
The number of individuals showed a non-significant tendency to lower numbers with increasing contamination. Negative indicator taxa showed a significantly lower abundance at increased contamination. This difference was even more pronounced in the period T3, with the mean number of individuals reduced from T1 to T3 by 57% in the most strongly and 33% in the two intermediately contaminated classes. The PI taxa showed the opposite trend, with higher numbers in contaminated streams. From T1 to T3 the mean number was nearly unchanged in uncontaminated and strongly contaminated streams and increased in the two middle classes.
The total number of taxa, the number of NI taxa and the number of PI taxa were always lower in the most severely contaminated streams. In the period T3 the number of NI taxa was higher in the uncontaminated streams while the number of PI taxa was higher in the two middle classes. From T1 to T3 the number of NI taxa was reduced by 35% in the highest contamination and in the two middle classes by over 20%. The number of PI taxa remained nearly unchanged from T1 to T3. Overall the data showed a strong correlation between the abundance data and the pesticide contamination but not between the number of taxa and pesticide contamination. Consequently, we focused on the abundance data and the abundance dynamics while developing LIMPACT.
Conclusions
(1) the pesticide contamination of small headwater streams with an agricultural catchment was represented by its toxic potential, was classified into four pesticide contamination classes and will be used as the diagnoses of LIMPACT
(2) abundance data and data on abundance dynamics are suitable parameters to indicate the pesticide contamination classes of LIMPACT
(3) high abundances of positive indicator (PI) taxa indicate a high pesticide contamination and high abundances of negative indicator (NI) taxa indicate only slightly contaminated streams
Acknowledgements
This study was supported by The Deutsche Bundesstiftung Umwelt (German Federal Environmental Foundation), An der Bornau 2 in D-49090 Osnabrück, Germany. The pesticide and macroinvertebrate data were gathered during various projects funded mainly by the Federal Environmental Agency (UBA: FKZ 296 24 511), the German Ministry for Science (BmBF: FKZ 0339804) and the Niersverband, Viersen. Jörn Wogram, Jakob Drees and Norbert Berenzen performed considerable parts of the field work.
References Braukmann U. and Pinter I. (1997) Concept for an integrated ecological evaluation of running
waters. Acta Hydrochimica et Hydrobiologica 25, 113-127.
V The database of the expert system LIMPACT 60
Cooper C. M. (1993) Biological effects of agriculturally derived surface -water pollutants on aquatic systems - a review. J. Environ. Qual. 22, 402-408.
Friedrich G. (1990) Eine Revision des Saprobiensystems. Z. Wasser. Abwasser. Forsch. 23, 141-152.
Kreuger J. (1995) Monitoring of pesticides in subsurface and surface water within an agricultural catchment in southern Sweden. British Crop Protection Council Monograph No. 62: Pesticide Movement to Water 81-86.
Liess M. (1993) Zur Ökotoxikologie der Einträge von landwirtschaftlich genutzten Flächen in Fließgewässer. Cuvillier , Göttingen
Liess M. and Schulz R. (1996) Chronic effects of short-term contamination with the pyrethroid insecticide fenvalerate on the caddisfly Limnephilus lunatus. Hydrobiologia 324, 99-106.
Liess M. and Schulz R. (1999) Linking insecticide contamination and population response in an agricultural stream. Environ. Toxicol. Chem. 18, 1948-1955.
Liess M. and Schulz R. (2000) Sampling methods in surface waters. In Handbook of water analysis, eds. L. M. L. Nollet, pp. 1-24. Marcel Dekker, New York.
Liess M., Schulz R., Liess M. H.-D., Rother B. and Kreuzig R. (1999) Determination of insecticide contamination in agricultural headwater streams. Water Res. 33, 239-247.
Liess M., Schulz R. and Neumann M. (1996) A method for monitoring pesticides bound to suspended particles in small streams. Chemosphere 32, 1963-1969.
Murtaugh P. A. (1996) The statistical Evaluation of ecological indicators. Ecol. Appl. 6, 132-139.
Neumann M., Baumeister J., Liess M. and Schulz R. (this issue) An expert system to estimate the pesticide contamination of small streams using benthic macroinvertebrate as bioindicators, Part 2: The knowledge base of LIMPACT. Ecological Indicators
Neumann M. and Dudgeon D. (2002) The impact of agricultural runoff on stream benthos in Hong Kong, China. Wat. Res. 36 (12) 3093-3099
Neumann M., Schulz R., Schäfer K., Müller W., Mannheller W. and Liess M. (2002) The significance of entry routes as point and non-point sources of pesticides in small streams. Water Res. 36(4) 835-842
Peterson D. R. (1994) Calculating the aquatic toxicity of hydrocarbon mixtures. Chemosphere 29, 2493-2506.
Sabarth A. (1999) Bedeutung von Substrat und Versandung für die Verteilung des Makrozoobenthos in naturnahen Heidebächen. Dissertation, Technische Universität , Braunschweig
Schulz R. (1997) Aquatische Ökotoxikologie von Insektiziden - Auswirkungen diffuser Insektizideinträge aus der Landwirtschaft auf Fließgewässer-Lebensgemeinschaften. Ecomed Verlag , Landsberg
Schulz R. and Liess M. (1999) A field study of the effects of agriculturally derived insecticide input on stream macroinvertebrate dynamics. Aquat. Toxicol. 46, 155-176.
Schulz R. and Liess M. (2000) Toxicity of fenvalerate to caddisfly larvae: chronic effects of 1-hr vs. 10-hr pulse-exposure with constant doses. Chemosphere 41, 1511-1517.
Schulz R. and Liess M. (2001a) Acute and chronic effects of particle-associated fenva lerate on stream macroinvertebrates: a runoff simulation study using outdoor microcosms. Arch. Environ. Contam. Toxicol. 40, 481-488.
Schulz R. and Liess M. (2001b) Runoff simulation with particle-bound fenvalerate in multispecies stream microcosms: importance of biological interactions. Environ. Toxicol. Chem. 20, 757-762.
Statzner B. (1981) The relation between "hydraulic stress" and microdistribution of benthic macroinvertebrates in a lowland running water system, the Schierenseebrooks (North Germany). Arch. Hydrobiol. 91, 192-218.
USEPA (1991) Technical support Document for water quality-based toxics control. EPA/505/2-90-001, PB91-127415.
USEPA (1992) Sediment classification methods compendium. Office of water (WH-556), EPA 823-R-006.

V The database of the expert system LIMPACT 61
USEPA (1999) National recommended water quality criteria -correction. United States Environmental Protection Agency. Washington, DC. Office of Water. EPA-822-Z-99-001. PB99-149189.
Verdonschot P. F. M. (1992) Macrofaunal community types of ditches in the province of Overijssel (The Netherlands). Arch. Hydrobiol./Suppl. 2, 133-158.
Wagner R. H. (1986) Effects of an artificially silted stream botton on species composition an biomass of trichoptera in Breitenbach. Proceedings of 5th International Symposium on Trichoptera 349-352.
Warne M. S. J. and Hawker D. W. (1995) The number of components in a mixture determines whether synergistic and antagonistic or additive toxicity predominate: The funnel hypothesis. Ecotoxicology and Environmental Safety 31, 23-28.
Wogram J. (2001) Auswirkungen der Pflanzenschutzmittel-Belastung auf Lebensgemeinschaften in Fließgewässern des landwirtschaftlich geprägten Raumes. Dissertation, Technische Universität , Braunschweig

62
VI 2002
Ecological Indicators: in press
An expert system to estimate the pesticide contamination of small streams using benthic
macroinvertebrates as bioindicators, Part 2: The knowledge base of LIMPACT
Michael Neumann1*, Joachim Baumeister2, Matthias Liess3 & Ralf Schulz1
1Zoological Institute, Department of Limnology; Technical University Braunschweig, Fasanenstrasse 3, D-38092 Braunschweig, Germany
3Department of Artificial Intelligence and Applied Computer Science; University of Würzburg, Am Hubland, D-97074 Würzburg, Germany
3Department of Chemical Ecotoxicology; UFZ Center for Environmental Research, Permoserstr. 15, D-04318 Leipzig, Germany
*Author to whom all correspondence should be addressed: Tel: +49-531-3913180; Fax: +49-531-3918201; email: m.neumann@tu-
bs.de
Abstract
The development and the evaluation of a biological indicator system for pesticide pollution in streams are presented. For small headwater streams with an agricultural catchment area, the expert system LIMPACT estimates the pesticide contamination according to the four classes Not Detected, Low, Moderate and High contamination without any specification of the chemical agents. The input parameters are the abundance data of benthic macroinvertebrate taxa within four time frames in a year (March/April; May/June; July/August; September/October) and 9 basic water-quality and morphological parameters. The heuristic knowledge base was developed with the shell-kit D3 and contains 921 diagnostic rules with scores either to establish or to de–establish a diagnosis. 418 rules had less than 3 symptoms, and only 47 rules had more than 4 symptoms in their rule condition. We differentiate between positive indicator (PI) taxa, which indicate contamination by high abundance values and positive abundance dynamics, and negative indicator (NI) taxa, a high abundance of which rules out contamination and indicates an uncontaminated site. We analysed 39 taxa and found 13 positive and 24 negative indicators. The database comprises 157 investigations per stream and year with rainfall event-controlled pesticide sampling and repeated benthic sampling as described in Part 1 (Neumann et al., this issue). For the evaluation of LIMPACT, we used the same cases. The correct class for the 157 investigations per stream and year is established by LIMPACT in 66.7 to 85.5% of the cases, with better results for uncontaminated sites. The overall alpha error probability (false positive) is 9.6% while the beta error probability (false negative) varied between 0% and 8% depending on the contamination class. If each stream is considered only once in the system (n = 104), the correct diagnosis is established by LIMPACT in 51.9 to 88.6% of the cases. In most of the remaining cases no diagnosis is established instead of a wrong one.
Key words
ecological indicator; pesticide contamination, small streams, heuristic knowledge base; model

VI The knowledge base of the expert system LIMPACT 63
Introduction
Small streams form the beginning of the water circuit. Simply because their lengths add up to a large total, they represent an important habitat for the aquatic fauna on the landscape level. After heavy rainfall, these habitats are influenced by short-term impact from non-point sources, involving factors such as hydraulic stress and the input of nutrients and pesticides (Cooper, 1993; Neumann and Dudgeon, 2002). Usually, no regular monitoring systems are established for these agricultural non-point sources of pollution. In Germany, the only recurrent monitoring in small streams done by governmental environmental agencies considers the contamination by biodegradable organic pollutants, monitored with the bioindicator-based saprobic system (Friedrich, 1990). After reviewing a wide range of ecological evaluation systems for running waters, Braukmann and Pinter (1997) proposed an expert system for evaluation purposes. Systems to monitor the influence of organic chemicals and pesticides are not in regular use, even though these substances are known to be very important stressors for the aquatic fauna (Schulz and Liess, 1999).
The main advantage of bioindicator systems is their easy and cost-efficient application. When they are used to monitor toxic contamination, they additionally indicate the ecotoxicological effect of the contaminant. They provide long-term information, whereas information from each chemical measurement applies at only one point in time. Consequently, a bioindicator system should be able to indicate agricultural short-term impact from non-point sources with low acquisition effort.
There are various approaches to evaluate the water quality of streams (Böhmer and Kappus, 1997), but no bioindicator system is known to indicate the pesticide contamination of small streams. In order to consider the ecological complexity and the uncertain knowledge in this domain, we used an expert system shell kit as a tool. The advantages are that expert systems utilize the uncertain expert knowledge and ideally come to the same solution as the expert would do. The user has full control over the expert system, can scrutinise the solution and, if he does not want to follow the given question trail, can select the next questions by himself.
Our aim was to develop a bioindicator system in form of an expert system that estimates the pesticide contamination of small streams. We name this expert system LIMPACT (from limnology and impact) and will make it available over the internet. The input parameters of LIMPACT are benthic macroinvertebrate abundance data and basic water-quality and morphological parameters. The output is an estimation of the pesticide contamination according to four classes without any specification of the chemical agents. The database of LIMPACT is documented in Part 1 (Neumann et al., this issue). In this paper, we present the development and the structure of the knowledge base of LIMPACT and the 39 benthic macroinvertebrate bioindicators it utilizes, together with a first evaluation of the system.
Materials and Methods
Introduction to expert systems
Expert systems are programs for reconstructing the expertise and reasoning capabilities of qualified specialists within their domains. The preliminary basic assumption is that experts construct their solutions from single pieces of knowledge, which they select and apply in a suitable sequence. For diagnostic

VI The knowledge base of the expert system LIMPACT 64
tasks, they have to specify a set of solutions (diagnoses) and a set of observations (symptoms) and the knowledge for interweaving these two sets.
Experts are able to express their knowledge in various ways. Consequently, there are various types of knowledge of which expert systems can be built. Three common types are heuristic, set-covering and case-based. Whereas set-covering knowledge requires different fault models for each possible solution implemented by the expert (Baumeister et al., 2001), case-based reasoning is appropriate when there is a large collection of successfully solved cases plus domain knowledge available (Puppe, 1998). Heuristic classification is suitable for problems in which the expert is able to express diagnostic ratings on the basis of observations or a combination of observations (Puppe, 1998).
The shell-kit D3
The shell-kit D3 (http://www.d3web.de) was utilized for the development of the expert system LIMPACT. The shell-kit D3 is applicable for diagnostic tasks, provides a web-based user interface (d3web) and offers a visual knowledge acquisition component for a wide range of knowledge types. After a one-day tutorial, most experts are able to construct expert systems by themselves. D3 has been already used in many medical, technical or service-support domains (Puppe, 1998; Puppe et al., 1996).
The knowledge representation
In the domain of interest here, we had the stream contamination as diagnoses, the abundance of taxa as observations and 157 investigations per stream and year as cases. Our aim was to build up a knowledge base to establish a diagnosis according to various possible observations. The domain expert was able to give certain scores (negative or positive) to types of stream contamination on the basis of given abundance data or combinations of them. For this reason, we chose the heuristic knowledge type for implementing LIMPACT. Heuristic classification is based on rules of the following kind:
“IF observation X then give diagnosis Y the score Z”
The observations X were clearly defined as the abundance of taxa, whereas the diagnoses are the graded amount of pesticide contamination in the stream. D3 provides a fixed range of seven positive and seven negative scores, which has been approved in previous different applications of D3 (Puppe, 2000). Reasoning with scores is easy and understandable for the expert: given a true condition, the corresponding rule fires and adds the stated score to the specified diagnosis. When defining a rule, the expert can choose between the seven categories N1 (-5%) to N7 (-100%) for negative scoring and the seven categories P1 (+5%) to P7 (+100%) for positive scoring. The sum of two equal categories results in the next higher category (e.g. P3+P3=P4). A diagnosis is established (confirmed), if the sum of the given scores exceeds the category P5.
The applied diagnoses
The database contained a chemical pesticide measurement for all 157 investigations per stream and year. As described in Part 1 (Neumann et al., this issue), we calculated an annual toxic sum and grouped it into four classes. Therefore, the vital diagnoses of LIMPACT are four classes of pesticide contamination named: Not Detected (ND), Low (L), Moderate (M) and High (H) contamination.

VI The knowledge base of the expert system LIMPACT 65
Since LIMPACT is only designed to estimate the pesticide contamination of small lowland headwater streams within an agricultural area, we implemented the diagnosis “unsuitable stream”. If the water-quality and morphological parameters are out of a specified range, LIMPACT establishes the diagnosis “unsuitable stream” (see Table 1). This causes all derivation rules for assessing the level of contamination not to fire and no contamination diagnosis will be established.
The observations
The most important parameters in the knowledge base are the abundances of taxa. We established four time frames for which information about abundance is requested. The time frames are T1: March/April, T2: May/June, T3: July/August and T4: September/October. For each taxa, LIMPACT allows abundance values to be entered for these four periods of the year. Additionally, LIMPACT interprets the increasing or decreasing abundance dynamics of a taxa by calculating the difference between the values for different time frames. Both the time-frame information and the abundance dynamics are used to build up rules.
Besides administrative information, such as stream name or stream location, LIMPACT evaluates water-quality and morphological parameters like stream size or conductivity of the water to characterise a given stream. For simplification, these parameters are abstracted to qualitative values, which are used by the derivation rules.
The cases
The database holds 157 investigations per stream and year, produced from several investigations of 104 streams between the years 1992 and 2000. A total of 555 chemical pesticide analysis, 660 benthic macroinvertebrate samples and a characterisation of the streams according to nine water-quality and morphological parameters are available. The 157 cases are grouped into the four contamination classes according to their measured pesticide contamination. Additionally, they provide abundance data for the four time frames defined. This is described in detail in Part 1 (Neumann et al., this issue).
The streams considered
The classification system LIMPACT is designed to consider only small lowland streams with an agricultural catchment. Streams with any interfering factors are excluded to ensure that the impact of pesticide is the main stressor to the aquatic macroinvertebrate fauna. At this stage, we exclude streams with any industrial waste impact. No high organic contamination or strong chloride or pH-values are acceptable, and no highland streams or larger streams are considered. For details see Part 1 (Neumann et al., this issue).
Results and Discussion
The implementation of the rules
We differentiated between two kinds of rules for the implementation of LIMPACT. Firstly, we designed rules to establish or de-establish the diagnosis "unsuitable stream". This procedure tests the suitability of a stream for a classification with LIMPACT. Altogether, we used 30 rules as suitability rules. Table 1 shows the parameters and a schematic view of the rules. Depending on the value of the parameter, either no rule fires or the score for the diagnosis unsuitable stream is set to P3 or P7. Within the normal range, no score is given. If the parameters are

VI The knowledge base of the expert system LIMPACT 66
within a range in which only a minor effect on the benthic fauna is expected, the diagnosis unsuitable stream is only suggested (P3) and all other rules will fire. If more than four minor criteria score with P3, the diagnosis unsuitable stream is established, which prevents LIMPACT from firing other rules, i.e. no contamination diagnosis can be established. This will happen in either case, if P7 is scored. Table 1: Water-quality and morphological parameters and a schematic view of the 30 rules to establish the diagnosis "unsuitable stream"
score for the diagnosis "unsuitable stream"
parameter P7 P3 no score P3 P7
1) organic pollution (saprobic index) - - ≤ 2.3 ≤ 2.6 > 2.6 2) morphological structure (%) - < 20 20 – 100 - - 3) proportion of sand (%) - >20 20 – 80 >80 - 4) maximum current velocity (m s -1) - <0.05 0.05 – 0.5 >0.5 >1 5) cross-sectional area (cm2) - - ≤ 8,000 > 8,000 >20,000 6) number of dry months - - 0 ≤ 3 > 3 7) conductivity (µS cm-1) ≤ 50 ≤ 150 150 – 2,000 > 2,000 > 3,000 8) pH value ≤ 6 ≤ 7 7 - 9 > 9 > 10 9) carbonate water hardness (mg CaCO3 L-1) ≤ 100 - 100 - 550 - > 550
The major part of the development of LIMPACT was to find and to implement the rules to estimate the stream contamination. During a first step, we selected those species and taxa that LIMPACT should consider. Rare taxa are liable to random and uninterpretable variations in abundance. Consequently we analysed the 39 most common species and taxa representing 90.4% of the total abundance of all taxa. Table 2 gives an overview of the 39 taxa including the frequency of their occurrence and the relative abundance.
The database was used to analyse the 157 cases for the 39 taxa regarding the grouping within the four contamination classes. We searched for a trend in the abundance data suitable to create rules with certain scores (positive or negative) to establish or de-establish the four diagnoses for pesticide contamination. Those taxa with low abundances in polluted streams, we named negative indicators (NI). A negative indicator is thus a taxon with an abundance negatively correlated with the pesticide contamination. The abundance of a positive indicator (PI) taxon is positively correlated with the contamination. High abundances of NI therefore indicate low or no contamination, while high abundance of PI suggests high contamination. All 39 taxa were analysed and classified (Table 2), with NI subdivided into those with clear, sensitive population dynamics (NI1) and without clear dynamics (NI2). Positive indicators were differentiated into those with population dynamics suggesting tolerance against pesticide pollution (PI1), those with no changes in abundance over time (PI2) and those that are stimulated by moderate contamination (PI3). Two taxa could not be grouped according to this scheme and were labelled as unsure.
This approach may be influenced by general ecological principles. While the high abundance of a NI clearly indicates low contamination, a low abundance does not automatically indicate high contamination. The same is true for PI: high abundances usually found in contaminated streams but PI may also occur in uncontaminated streams. As a result, the analysis of the abundance data was done with regard to nine water-quality and morphological parameters of the streams. Furthermore, the analysis of the population dynamics of the taxa gives valuable information.

VI The knowledge base of the expert system LIMPACT 67
Table 2: List of the 39 benthic macroinvertebrate taxa considered for LIMPACT, with frequency of occurrence and relative abundance at the 660 sampling dates as well as the classification as positive (PI) or negative indicator (NI) taxa. Order Taxon Classification Frequency (n/660) Relative abundance (%)
Turbellaria Dugesia gonocephala PI1 142 0.78 Oligochaeta Erpobdella octoculata PI2 403 1.30
Glossiphonia complanata NI2 307 0.38 Glossiphonia heteroclita PI2 144 0.09 Tubificidae PI2 307 3.34 Oligochaeta NI1 98 0.47
Gastropoda Pisidium sp. PI3 220 3.25 Potamopyrgus antipodarum PI2 74 2.43 Radix ovata PI2 213 1.75
Amphipoda Gammarus pulex PI1 587 60.00 Isopoda Assellus aquaticus NI1 213 1.46 Plecoptera Nemoura cinerea NI2 60 0.49 Coleoptera Dytiscidae PI3 135 0.24
Agabus sp. NI1 89 0.11 Platambus maculatus NI1 60 0.04 Elmis sp. PI2 180 0.6 Haliplus sp. NI1 79 0.08 Helodes sp. PI1 308 2.46
Diptera Ceratopogonidae PI2 82 0.11 Chironomidae "white" NI2 450 4.21 Chironomidae "red" NI2 396 6.06 Limoniidae unsure 139 0.13 Ptychopteridae NI1 65 0.58 Simuliidae NI1 183 1.68 Tipulidae NI2 111 0.11 Other Diptera unsure 89 0.34
Ephemeroptera: Baetis vernus NI1 62 0.23 Baetis sp. NI1 113 0.78 Ephemera danica NI1 68 0.4
Megaloptera: Sialis lutaria NI2 93 0.16 Trichoptera: Hydropsyche angustipennis NI1 60 0.14
Anabolia nervosa NI2 99 0.44 Chaetopteryx villosa NI1 158 0.85 Halesus radiatus/digitatus PI3 84 0.14 Ironoquia dubia NI1 69 0.13 Limnephilus lunatus NI1 379 3.68 Limnephilus extricatus NI1 145 0.28 Limnephilus rhombicus NI2 65 0.13 Plectrocnemia conspersa NI2 104 0.16
The heuristic diagnosis score pattern (Puppe, 2000) is able to deal with uncertain knowledge. Rules do not exclude one another but can fire at the same time. If the data did not count explicitly for one diagnosis, it was possible to score more than one diagnosis. We chose a conservative approach, with the strongest score set to P3. Consequently, a diagnosis needs at least five fired rules to be established. Up to now the knowledge base of LIMPACT has 921 diagnosis rules.

VI The knowledge base of the expert system LIMPACT 68
Fig. 1: Abundances or abundance dynamics of indicator taxa to illustrate the creation of rules. In f) the open circles indicate sites with a large amount of morphological structure (>80%) in the streams.
The taxon Chironomidae “red” is an example of a NI. In time frame 3 (T3), high abundances were found only in uncontaminated or slightly contaminated streams (Fig. 1a). Consequently, we created the rules 1 and 2 exemplified in Table 3, which fire simultaneously with the score P2. At the same time a high abundance of Chironomidae “red” at T3 is a strong indicator against a moderate and high contamination, which is expressed by score N4 in rules 3 and 4. No rule with a positive score for high or moderate contamination is used here.
The species Glossiphonia heteroclita is given as an example of a PI taxon (Fig. 1b). A high abundance indicates Moderate or High contamination (rules 5 and 6) and counts with negative score against no or low contamination (rules 7 and 8). This confirms the common view that oligochaetes are relatively tolerant taxa (Meller et al., 1998).

VI The knowledge base of the expert system LIMPACT 69
Chaetopteryx villosa as a NI species had population dynamics that may indicate less contamination (Fig. 1c). An increasing abundance from T2 to T3 indicates Not Detected or Low contamination (rules 9 and 10) and counts against moderate and strong contamination (rules 13 and 14). Trichoptera are known to be sensitive to pesticide impact (Schulz and Liess, 1995; Stuijfzand et al., 2000). A strong growth can explicitly indicate an uncontaminated stream, which is scored with P3 (rule 11) and counts against a Low contamination with score N4 (rule 12). Nearly unchanged dynamics are used to score P2 to High or Moderate contamination (rules 15 and 16). Even though the figure suggests that a strong decline indicates less contamination, no rules are created because this is not justifiable from the autecology of this species. The reason for this phenomenon is a generally lower abundance in contaminated streams at T2, which makes a strong decline highly improbable. In this case, the rules need to combine both abundance and abundance dynamics characteristics. Table 3: Schematic view of rules following the analysis of exemplary taxa in Figure 1. Rule No. Rule syntax 1 If Chironomidae “red” at T3 > 370 then give diagnosis ND the score P2 2 If Chironomidae “red” at T3 > 370 then give diagnosis Low the score P2 3 If Chironomidae “red” at T3 >370 then give diagnosis Moderate the score N4 4 If Chironomidae “red” at T3 >280 then give diagnosis High the score N4 5 If Glossiphonia heteroclita at T1 >8 then give diagnosis Moderate the score P2 6 If Glossiphonia heteroclita at T1 >8 then give diagnosis High the score P2 7 If Glossiphonia heteroclita at T1 >8 then give diagnosis ND the score N4 8 If Glossiphonia heteroclita at T1 >8 then give diagnosis Low the score N4 9 If Chaetopteryx villosa T2 to T3 10 to 75 then give diagnosis ND the score P2
10 If Chaetopteryx villosa T2 to T3 10 to 75 then give diagnosis Low the score P2 11 If Chaetopteryx villosa T2 to T3 >75 then give diagnosis ND the score P3 12 If Chaetopteryx villosa T2 to T3 >75 then give diagnosis Low the score N4 13 If Chaetopteryx villosa T2 to T3 >10 then give diagnosis Moderate the score N4 14 If Chaetopteryx villosa T2 to T3 >10 then give diagnosis High the score N4 15 If Chaetopteryx villosa T2 to T3 -10 to 10 then give diagnosis Moderate the score P2 16 If Chaetopteryx villosa T2 to T3 -10 to 10 then give diagnosis High the score P2
Ceratopogonidae showed population dynamics from T1 to T2 as a positive indicator (Fig. 1d). An increase was found only at contaminated streams and counts at the same time against less contamination. Meng and Lok (1985) found a starvation survival strategy for this group which indicates a tolerance to extreme situations. The abundance of Dytiscidae at T2 (Fig 1e) is typical of a tolerant taxon that has selectively high abundance at low and moderate contamination. A high abundance rules out the not and the highly contaminated streams. This taxon was found to be tolerant to high temperatures (Velasco and Millan, 1998). On the other hand, it seems to be sensitive to strong pesticide contamination.
The last example (Fig. 1f) illustrates how water-quality and morphological parameters could influence the creation of complex rules. Limnephilus lunatus is a NI taxon. High abundance is typical of uncontaminated streams and in contaminated streams, the database showed mostly low abundance. An exception occurs in streams with extremely rich morphological structures (>80%) covering the stream bed (open circles = "good" structures). This large amount of morphological structures is associated with high abundance of L. lunatus. This is also described by (Gower, 1967) and may mask the pesticide contamination so that no effect is observable. Consequently the rules have to include the structural information in the following way:

VI The knowledge base of the expert system LIMPACT 70
If L. lunatus at T2 >180 and structure is not “good” then give diagnosis ND the score P3
Most rules in the knowledge base are complex rules. 418 rules had less than 3 symptoms, but 457 had 3 or 4 symptoms and 47 rules had up to 7 symptoms in their rule condition. None of these rules combining two time frames, a time frame and one or two measures of population dynamics are presented here. Overall 622 rules have a positive score and count for a diagnosis while only 299 rules have a negative score against a diagnosis. The number of rules is nearly equally distributed over the four diagnoses with 226 for High contamination and 251 rules for Not Detected. However, the diagnosis ND has 83% positive scored rules while the diagnosis High contamination has only 48%. This proves that it is much easier to identify an uncontaminated stream because of its large number of taxa and the high abundance of negative indicator taxa.
Evaluation of LIMPACT
For the evaluation of the expert system, we present the classification result (Table 4) of those 157 investigations per stream and year (cases) that have been used to build up LIMPACT. The evaluation showed a very good classification result; however, it is not independently obtained. The correct diagnosis was established in 66.7% to 85.5% of cases. A high percentage of cases were not classified. Because of our conservative approach, LIMPACT established no diagnosis instead of a wrong one for cases with less data availability. As standard diagnostic measures we calculated the alpha and beta error probabilities for those cases that were classified, only. The overall alpha error probability (false positive) is 9.6% (13 out of 135). It varied from 0% (H class) to 18.7% (L class). Most classification errors occur between ND and Low and on the other hand between Moderate and High contamination. The fact that there are only very few cases existing with a false prediction between ND and Low on the one hand and Moderate and High contamiantion on the other hand, gives further evidence for the ability of LIMPACT to provide a reliable rough estimation of pesticide contamination in streams based on macroinvertebrate data. The beta error probability (false negative) indicates how often the system failed to reject the hypotheses Ho when it actual should reject it. Here the best result shows the class Low (0%) and Moderate (0.9%). For the class High we calculated a beta error of 4.4% and for Not Detected 8%. Table 4: Result of the classification of 157 investigations per stream and year at 104 sample sites using LIMPACT. For each of the 157 cases, the measured real contamination is given according to the four classes and compared with the percentage of cases classified by Limpact into the four groups. Correct classifications are indicated by bold values. The number of cases per contamination class is given in brackets.
classification result (%)
real contamination Not Detected Low Moderate High not classified Not Detected 85.5 0 1.8 0 12.7
(55) (47) (-) (1) (-) (7) Low 17.6 76.5 0 0 5.9
(34) (6) (26) (-) (-) (2) Moderate 2.4 0 66.7 11.9 19.0
(42) (1) (-) (28) (5) (8) High 0 0 0 80.8 19.2
(26) (-) (-) (-) (21) (5)
The 157 cases in our database refer to investigations at a total of 104 sampling sites. Consequently, we also estimated the classification result for these 104 investigations per sampling site (Table 5). We always selected the most recent

VI The knowledge base of the expert system LIMPACT 71
investigation. The results are comparable. The wrong classification rate is almost at the same level while the not classified rate is higher. The overall alpha error probability calculated for those cases with an established diagnosis only, is 12.5% (11 out of 88). The beta error probability varied from 0% to 8.9%. Both measures are comparable. We conclude from this that the repeated investigations have no significant influence on the quality of the classification result and consequently can be treated as independent investigations.
Possible reasons for classification errors and not classified data sets are the count of taxa at a sampling site and the number of sampling dates within a year. The more data the user provides, the more rules can be activated. In our data set not every investigation per stream and year provided data for all four time frames. T1 and T2 data were available in 98% of the cases, while T3 data exist in 78% and T4 in 72% of the cases. This is one reason why the rate of cases that were not classified is quite high. As mentioned previously, to give no classification result rather than a wrong one reflects our conservative approach while developing LIMPACT. Table 5: Result of the classification of 104 investigations per stream and year at 104 sample sites using LIMPACT. For each of the 104 cases, the measured real contamination is given according to the four classes and compared with the percentage of cases classified by LIMPACT into the four groups. Correct classifications are indicated by bold values. The number of cases per contamination class is given in brackets.
classification result
real contamination Not Detected Low Moderate High not classified
Not Detected 88.6 0 2.9 0 8.6
(35) (31) (-) (1) (-) (3) Low 13.8 75.9 0 0 10.3
(29) (4) (22) (-) (-) (3) Moderate 3.7 0 51.9 18.5 25.9
(28) (1) (-) (15) (5) (7) High 0 0 0 75.0 25.0
(12) (-) (-) (-) (9) (3)
We are not yet able to evaluate LIMPACT with an independent data set. As soon as new investigations are available, we shall use this data set for an independent evaluation and a refinement of the knowledge base. However, the knowledge base was built up by statistical data analysis and was adapted by domain knowledge of experts. This guarantees the high quality of the knowledge base of LIMPACT although it is based on a rather small number of cases.
Concluding discussion
A wide range of biological indicator systems to evaluate water-quality parameters is known. RIVPACS in Great Britain predicts the macroinvertebrate fauna to be expected at a site in the absence of environmental stress (Wright et al., 1998) and can be used to evaluate the present fauna. In the Netherlands, a similar approach is used for STOWA (Peeters et al., 1994). In Scotland, the integrated evaluation system SERCON (Boon, 2000) and in the USA the Rapid Bioassessment Protocols (Resh et al., 1995) were developed. The last one has been successfully used to locate stream contamination in large regions but is not able to specify the cause. In Germany, the saprobic index is well established to evaluate the biodegradable organic pollution in running waters (Friedrich, 1990). Systems to monitor heavy metals (Wachs, 1991), and acidification (Brakke et al., 1994) have been developed. However, no biological indicator system has yet estimated the pesticide contamination of small streams via benthic macroinvertebrate indicators.

VI The knowledge base of the expert system LIMPACT 72
Recently, a few expert systems were developed for stream water-quality evaluation. The ecological condition was estimated by expert system for rivers in agricultural landscapes (Sterba et al., 1997) and forest was found to be the main factor for river restoration. In Canadian watersheds a water quality model was coupled with an expert system to simulate the movements of pollutants (Ghosh et al., 2000) and in Korea an expert system was used to determine stream water quality from uncertain and imprecise ecological information (Lee et al., 1997). An integrated model (Jia-Haifeng et al., 1998) including an expert system was applied for sustainable development of river basins and water-quality planning in China. To evaluate the thermal pollution of rivers, Kontic and Zagorc (1992) presented an expert system and applied it to a nuclear power plant. However, no expert system is available to estimate the water quality of streams by using the aquatic fauna as indicator. Van Der Werf and Zimmer (1998) presented an expert system to estimate the environmental impact of pesticides by using the pesticide properties.
A general restriction of biological indicator systems is that indicator species must be present at the investigation site. This is also a limitation of LIMPACT. Until now, LIMPACT considers 39 species or taxa. If none of these taxa is present at a sampling site, none of the rules of the knowledge base of LIMPACT can fire. Consequently such a sample site cannot be classified. In the evaluation process of LIMPACT presented in this paper, an average of 5 of the 39 indicator taxa was present in each case.
For the process of refinement, we have three major aims. First, we want to extend the knowledge base by adding more species. This will increase the precision and improve the classification result. Second, we intend to enhance the general applicability of LIMPACT. This should be achieved by analysing higher taxonomic levels, which would cause more generalised rules and a wider practicability of LIMPACT without limitations imposed by the presence or absence of single species. Third, we want to reduce the number of essential sampling dates. LIMPACT considers four time frames within one year. An extended version of LIMPACT should give sufficient results based on a lower number of sampling dates. This would again increase the simplicity and reduces the effort expended on invertebrate sampling.
The potential application of LIMPACT could be a yearly monitoring of streams and would reduce chemical analysis to the mandatory cases. Furthermore, it could be used to evaluate the success of risk mitigation strategies in the catchment to reduce the impact of pesticides.
Conclusions
- the biological indicator system LIMPACT will be available over the internet
- LIMPACT could be utilized to monitor the water quality of small streams via benthic macroinvertebrates and could thus reduce chemical monitoring to the necessary limit
- an analysis of higher taxonomic levels could further increase the practicability of LIMPACT
Acknowledgements
This study was supported by The Deutsche Bundesstiftung Umwelt (German Federal Environmental Foundation), An der Bornau 2 in 49090 Osnabrück, Germany. The pesticide and macroinvertebrate data were gathered during

VI The knowledge base of the expert system LIMPACT 73
various projects funded mainly by the Federal Environmental Agency (UBA: FKZ 296 24 511), the German Ministry for Science (BmBF: FKZ 0339804) and the Niersverband, Viersen. Jörn Wogram, Jakob Drees and Norbert Berenzen performed considerable parts of the field work.
References Baumeister J., Seipel D. and Puppe F. (2001) Incremental development of diagnostic set-covering
models with therapy effects. Proc. of KI-2001 Workshop: Uncertainty in AI, Vienna, Austria
Böhmer J. and Kappus B. (1997) Ökologische Bewertung von Fließgewässern in der Europäischen Union und anderen Ländern -Literaturstudie-. Literaturstudie im Auftrag der Landesanstalt für Umweltschutz Baden-Württemberg, Stuttgart, Reihe Handbuch Wasser 2 Bibliothek der Landesanstalt für Umweltschutz Baden-Würtemberg
Boon-P-J (2000) The development of integrated methods for assessing rive r conservation value. Hydrobiologia 422 423, 413-428.
Brakke D. F., Baker J. P., Böhmer J., Hartmann A., Havas M., Jenkins A., Kelly C., Ormerod S. J., Paces T., Putz R., Rosseland B. O., Schindler D. W. and Segner H. (1994) Group report: Physiological and ecological effects of acidification on aquatic biota. In Acidification of freshwater ecosystems: Implications for the future, eds. C. E. W. Steinberg and R. F. Wright, pp. 275-312. John Wiley & Sons Ltd.,
Braukmann U. and Pinter I. (1997) Concept for an integrated ecological evaluation of running waters. Acta Hydrochimica et Hydrobiologica 25, 113-127.
Cooper C. M. (1993) Biological effects of agriculturally derived surface -water pollutants on aquatic systems - a review. J. Environ. Qual. 22, 402-408.
Friedrich G. (1990) Eine Revision des Saprobiensystems. Z. Wasser. Abwasser. Forsch. 23, 141-152.
Ghosh B. A., Singh V. P. and Bengtsson L. (2000) Application of environmental models to different hydrological systems. Ecol. Modell. 125, 15-49.
Gower A. M. (1967) A study of Limnephilus lunatus Curtis (Trichoptera: Limnephilidae) with reference to its life cycle in watercress beds. Transactions of the Royal Entomological Society London 119, 283-302.
Jia-Haifeng, Cheng-Shengtong, Gao-Lang and Hou-Jixiong (1998) The catchment integrated computer model system and its application in reservoir basin water quality planning [in Chinese]. Huanjing Kexue 19, 75-77.
Kontic B. and Zagorc K. J. (1992) A method for the evaluation of thermal pollution of rivers. Z. Wasser. Abwasser. Forsch. 25, 295-300.
Lee H. K., Oh K. D., Park D. H., Jung J. H. and Yoon S. J. (1997) Fuzzy expert system to determine stream water quality classification from ecological information. Wat. Sci. Technol. 36, 199-206.
Meller M., Egeler P., Roembke J., Schallnass H., Nagel R. and Streit B. (1998) Short-term toxicity of lindane, hexachlorbenzene, and copper sulfate to tubificid sludgeworms. Ecotox. Environ. Safety 39, 10-20.
Meng L. K. and Lok C. K. (1985) The biology of Dasyhelea ampullariae in monkey cups at Kent Ridge (Diptera: Ceratopogonidae). Journal of the Singapore National Academy of Science 14, 6-14.
Neumann M., Liess M. and Schulz R. (this issue) An expert system to estimate the pesticide contamination of small streams using benthic macroinvertebrate as bioindicators, Part 1: The database of LIMPACT. Ecological Indicators
Neumann M. and Dudgeon D. (2002) The impact of agricultural runoff on stream benthos in Hong Kong, China. Wat. Res. 36(12), 3093-3099
Peeters E. T. M. H., Gardeniers J. J. P. and Tolkamp H. H. (1994) New methods to assess the ecological status of surface waters in the Netherlands. Verh. Int. Ver. Limnol. 25, 1914-1916.

VI The knowledge base of the expert system LIMPACT 74
Puppe F. (1998) Knowledge Reuse among Diagnostic Problem Solving Methods in the Shell-Kit D3. International Journal of Human-Computer Studies 49, 627-649.
Puppe F. (2000) Knowledge formalization patterns. Proc. of PKAW in Sydney, Australia
Puppe F., Gappa U., Poeck K. and Bamberger S. (1996) Wissensbasierte Diagnose- und Informationssysteme: Mit Anwendungen des Expertensystem-Shell-Baukastens D3. Springer , Berlin, Heidelberg, New York 3-540-61369-2.
Resh V. H., Norris R. N. and Barbour M. T. (1995) Design and implementation of rapid assessment approaches for water resource monitoring using benthic macroinvertebrates. Australian Journal of Ecology 20, 108-121.
Schulz R. and Liess M. (1995) Chronic effects of low insecticide concentrations on freshwater caddisfly larvae. Hydrobiologia 299, 103-113.
Schulz R. and Liess M. (1999) A field study of the effects of agriculturally derived insecticide input on stream macroinvertebrate dynamics. Aquat. Toxicol. 46, 155-176.
Sterba O., Mekotova J., Krskova M., Samsonova P. and Harper D. (1997) Floodplain forest and river restauration. Global Ecology and Biogeography Letters 6, 331-337.
Stuijfzand S. C., Poort L., Greve G. D., Van der Geest H. G. and Kraak M. H. S. (2000) Variables determining the impact of diazinon on aquatic insects: Taxon, developmental stage, and exposure time. Environ. Toxicol. Chem. 19, 582-587.
van Der Werf H. M. G. and Zimmer C. (1998) An indicator of pesticide environmental impact based on a fuzzy expert system. Chemosphere 36, 2225-2249.
Velasco J. and Millan A. (1998) Insect dispersal in a drying desert stream: Effects of temperature and water loss. Southwestern Naturalist 43, 80-87.
Wachs B. (1991) Ökobewertung der Schwermetallbelastung von Fließgewässern. Münchener Beitrag Abwasser-, Fischerei- und Flußbiologie 45, 295-335.
Wright J. F., Furse M. T. and Moss D. (1998) River classification using invertebrates: RIVPACS applications. Aquatic Conservation Marine and Freshwater 8, 617-631.

75
VII
2001
http://www.limpact.de
The expert system LIMPACT itself is available over the internet. Here the user finds some information arround the biological indicator system and can run the system. LIMPACT ask several questions to the user. First LIMPACT asks questions about the water-quality and morphological parameter. Second LIMPACT asks questions about the abundances of the considered species. As a result LIMPACT gives all established and suspected diagnoses.
The Hompage http://www.limpact.de will be updated continuosly and will be available in German and in English.
Figure 1: Screenshot of the expert system LIMPACT (http://www.limpact.de) running in a webbrowser window.

76
VIII 2002
Umweltwissenschaften und Schadstoff-Forschung: in press
LIMPACT: Ein Expertensystem zur Abschätzung der Pflanzenschutzmittel-Belastung kleiner Fließgewässer
mittels der Makroinvertebraten-Fauna
Michael Neumann1; Joachim Baumeister2; Matthias Liess3 & Ralf Schulz1 1AG Limnologie des Zoologischen Institutes der TU Braunschweig, Fasanenstr. 3, 38092 Braunschweig
2Lehrstuhl für Informatik VI; Universität Würzburg
3UFZ; Centre For Environmental Research; Leipzig
Korrespondenzautor: Michael Neumann; e-mail: [email protected]
Zusammenfassung
Die Entwicklung, der Aufbau und die Evaluierung eines biologischen Indikatorsystems für die Pflanzenschutzmittel-Belastung in kleinen Fließgewässern wird vorgestellt. In Fließgewässern mit landwirtschaftlichem Einzugsgebiet stuft das Expertensystem LIMPACT die Belastung in vier Klassen „unbelastet/nicht nachgewiesen“, „gering“, „mittel“ und „hoch“ belastet ein. Eingangsdaten sind dabei die Abundanzdaten der benthischen Makroinvertebraten-Fauna zu vier Terminen im Jahresverlauf (März/April; Mai/Juni; Juli/August; September/Oktober) und neun physikalisch-chemische bzw. morphologische Fließgewässerparameter. Die Wissensbasis wurde mit dem Shellbaukasten D3 aufgebaut und enthält 921 Regeln zum etablieren oder de–etablieren einer Diagnose. Es wurden 39 Arten und Taxa analysiert und dabei 13 positive und 24 negative Indikatorspezies definiert. Positive Indikatorarten zeigen eine hohe Belastung durch hohe Abundanzen an, während negative Indikatorarten durch eine hohe Abundanz eine Belastung ausschließen und unbelastete Bäche anzeigen. Die Datenbasis enthielt 157 jährliche Untersuchungen und wurde auch zur Evaluierung eingesetzt. Die korrekte Klassifikationsrate liegt bei 66,7% bis 85,5% der Fälle. Die meisten verbleibenden Fällen werden nicht falsch eingestuft, sondern infolge der konservativen Bewertung bei geringer Datengrundlage nicht klassifiziert.
Schlagwörter
Bach; Belastung; biologische Indikatoren; diffuse Einträge; Evaluierung; Fungizide; Herbizide; Insektizide; Landwirtschaft; Modell; Oberflächen-Runoff; Wissensbasiertes System;
Abstract
The development and the evaluation of a biological indicator system for pesticide pollution in streams are presented. For small headwater streams with an agricultural catchment area, the expert system LIMPACT estimates the pesticide contamination according to the four classes Not Detected, Low, Moderate and High contamination without any specification of the chemical agents. The input parameters are the abundance data of benthic macroinvertebrate taxa within four time frames in a year (March/April; May/June; July/August; September/October) and 9 basic water-quality and morphological parameters. The heuristic knowledge base was developed with the shell-kit D3 and contains

VIII Das Expertensystem LIMPACT 77
diagnostic rules with scores either to establish or to de–establish a diagnosis. We differentiate between positive indicator taxa, which indicate contamination by high abundance values and positive abundance dynamics, and negative indicator taxa, a high abundance of which rules out contamination and indicates an uncontaminated site. We analysed 39 taxa and found 13 positive and 24 negative indicators. The database comprises 157 investigations per stream and year. For the evaluation of LIMPACT, we used the same cases. The correct diagnosis for the 157 investigations per stream and year is established by LIMPACT in 66.7 to 85.5% of the cases, with better results for uncontaminated sites. In most of the remaining cases no diagnosis is established instead of a wrong one.
Keywords
agricultural catchment; biological indicator; heuristic knowledge base; model; nonpoint sources; pesticide contamination; runoff; small streams;
Einleitung
Kleine Fließgewässer mit landwirtschaftlich genutztem Einzugsgebiet bilden wichtige Habitate und werden durch eine Reihe von Faktoren beeinflußt. Nach starken Niederschlägen werden durch Oberflächen-Runoff Schwebstoffe, Nährstoffe und Pflanzenschutzmittel eingetragen und der Abfluß stark erhöht (Cooper, 1993; Neumann et al., 2001; Neumann and Dudgeon, in press). Es wurde gezeigt daß dabei die kurzzeitig hohe Pflanzenschutzmittel-Belastung einen wichtigen Stressor für die aquatische Lebensgemeinschaft darstellt (Liess and Schulz, 1999; Schulz and Liess, 1999). Der chemische Nachweis dieser diffusen Stoffeinträge gelingt nur durch ereignisgesteuerte Probenehmer und ist deshalb aufwendig und teuer (Liess and Schulz, 2000; Liess et al., 1999). Ein biologisches Indikatorsystem könnte über einen längeren Zeitraum kostengünstig den Umfang einer Belastung erfassen und damit gleichzeitig den Effekt der Belastung bewerten.
In Deutschland findet eine routinemäßige Überwachung kleiner Fließgewässer vor allem hinsichtlich der biologisch abbaubaren organischen Belastung mit Hilfe des Saprobienindex (Friedrich, 1990) und hinsichtlich der Strukturgüte statt. Braukmann and Pinter (1997) kommen am Ende eines umfangreichen Reviews verschiedener Bewertungssysteme zu der Empfehlung, ein Expertensystem zur Überwachung einzusetzen. Böhmer and Kappus (1997) nennen eine Reihe von Bewertungssystemen, aber keines zur Überwachung der Pflanzenschutzmittel-Belastung. Ein spezielles System zur Abschätzung der Insektizidbelastung kleiner Fließgewässer wurde inzwischen vorgestellt (Neumann and Liess, 1999). Der Einsatz eines Expertensystems ermöglicht dabei auch unsicheres Wissen zu verarbeiten und gibt dem Anwender volle Kontrolle über den Frage-Antwort Dialog. Ziel dieser Arbeit war es, ein erweitertes biologisches Indikatorsystem in Form eines Expertensystems zu entwickeln, welches die Pflanzenschutzmittel-Belastung in kleinen Fließgewässern mit landwirtschaftlichem Einzugsgebiet abschätzen kann.
Material und Methoden
Datenbasis und Untersuchungsgewässer
Die Datenbasis dieser Arbeit entstammt Untersuchungen des Zoologischen Institutes der Technischen Universität Braunschweig aus den Jahren 1992 bis

VIII Das Expertensystem LIMPACT 78
2000. Die 104 Untersuchungsgewässer lagen in den Flachlandregionen um Braunschweig, Hamburg, Hannover, Kassel, Mannheim und Mönchengladbach. Alle Bäche besaßen ein landwirtschaftlich genutztes Einzugsgebiet ohne Einfluß von Städten oder Industrieanlagen. Sieben Bäche lagen unterhalb kleinerer Kläranlagen. Alle Probestellen waren unbeschattet, von geringem Gefälle (max. 3°) und von Sand, Lehm und Schluff geprägt. Die Fließgeschwindigkeit lag unter 0.9 m s-1 , die Tiefe zwischen 5 and 70 cm und die Breite zwischen 25 und 400 cm.
Die Pflanzenschutzmittel-Belastung wurde an allen Probestellen durch Schwebstoffsammler (Liess et al., 1996) und/oder durch ereignisgesteuerte Wasserprobenehmer (Liess et al., 1999) erfaßt und am Institut für Ökologische Chemie der Technischen Universität Braunschweig analysiert (Methode siehe Liess et al., 1999). Insgesamt lagen Analysen von 555 Proben vor. Die Nachweisgrenzen für die Wirkstoffe lagen zwischen 0.02 und 1 µg L-1 für Wasser und zwischen 1 und 5 µg kg-1 für Schwebstoffe. Je nach untersuchtem Stoffspektrum lagen Informationen zu 30 verschiedenen Wirkstoffen aus dem Bereich der Insektizide, Fungizide und Herbizide vor. Um das ökotoxikologische Potential der Belastung zu beschreiben und einen Vergleich verschiedener Untersuchungen zu ermöglichen, wurde für jede Untersuchung eine jährliche Belastungssumme berechnet. Hierzu wurde an der jeweiligen Probestelle alle Proben die in Folge eines Niederschlagsereignisses genommen worden waren, betrachtet. Die Konzentrationen der einzelnen Wirkstoffe wurde über die Toxizität auf die Beispielart Daphnia magna gewichtet und zur jährlichen Belastungssumme aufsummiert. Da das chemische Monitoring mit Einzelproben kein vollständiges Bild der Pflanzenschutzmittel-Belastung geben kann und zur Reduzierung der Probenahme. Die Untersuchungen wurden daraufhin in die vier Belastungsklassen „nicht nachgewiesen“ (NN), „gering“ (G), „mittel“ (M), „hoch“ (H) belastet eingeteilt.
Zusätzlich zur Pflanzenschutzmittel-Belastung lagen neun physikalisch-chemische bzw. morphologische Parameter vor:
(1) Organische Belastung nach Saprobienindex (Jahresmittelwert) (2) Morphologische Strukturen durch submerse und emerse Pflanzen, Gestöcksel und Baumwurzeln die den Gewässergrund bedecken (Prozentwert als Jahresmaximum) (3) Gewässergrund der aus Sand besteht (Prozentwert als Jahresmaximum) (4) Fließgeschwindigkeit (Jahresmaximum) (5) Gewässerquerschnitt: Breite in cm multipliziert mit Tiefe in cm (Jahresmaximum) (6) Austrocknung (Anzahl der Monate) (7) Leitfähigkeit des Wassers (Jahresmittelwert) (8) pH-Wert (Jahresmittelwert) (9) Carbonathärte (Jahresmittelwert)
Mit diesen Parametern wurde dem Expertensystem LIMPACT zusätzliche Informationen über weitere mögliche Einflussfaktoren auf die aquatische Makroinvertebraten-Fauna.
Die biologischen Abundanzen der bentischen Makroinvertebraten-Fauna (Indiv. pro qm) beruhten auf 660 Populationsaufnahmen jeweils durch vier bis sechs Wiederholungen mit dem Surbersampler (0.125 m2 Fläche). Die Artbestimmung lag, wenn möglich, auf Artniveau vor, mußte aber im Rahmen dieser Arbeit teilweise wieder auf höherem taxonomischen Niveau zusammengefaßt werden.

VIII Das Expertensystem LIMPACT 79
Die Wissensrepräsentation
Expertensysteme sollen das Fachwissen und die möglichen Schlußfolgerungen von qualifizierten Experten widerspiegeln. Zum Aufbau eines wissensbasierten Systems muß ein Set von Diagnosen (Lösungen) und ein Set von Beobachtungen (Symptome) vorliegen und das Wissen, wie diese beiden verknüpft werden (z.B. durch Regeln). Zur Programmierung wurde hier der Shellbaukasten D3 (http://www.d3web.de) verwendet und auf die heuristische Klassifikation zurückgegriffen. Bei dieser Wissensrepräsentationen bewertet der Experte die möglichen Diagnosen aufgrund der Beobachtungen in Form von Regeln (Puppe, 1998). Alle Regeln haben die folgende Form: “Wenn Beobachtung X dann erhält Diagnose Y die Bewertung Z”. Beispiele finden sich in Tabelle 1.
Die Bewertung
Die Beobachtungen X waren klar als die Abundanzen der Makroinvertebraten definiert (Abb. 1), während die Diagnose Y durch die vierstufige Pflanzenschutzmittel-Belastung repräsentiert wurde. Für die Bewertung Z stellt der Shellbaukasten D3 sieben positive von P1 (+5%) bis P7 (+100%) und sieben negative von N1 (-5%) bis N7 (-100%) Bewertungen zur Verfügung. Trifft die Regel zu, wird die Bewertung der Diagnose zuaddiert oder abgezogen. Die Summe von zwei gleichen Bewertungskategorien ergibt die nächst höhere Bewertungskategorie. Beispielsweise ergeben zwei aktivierte Regeln mit der Bewertung P3 in Ihrer Summe die Bewertung P4. Eine Diagnose gilt als bestätigt, wenn die Summe aller Bewertungen die Kategorie P5 übertrifft.
Die Diagnosen
Die Datenbasis enthielt für alle Untersuchungen eine chemische Analyse der Pflanzenschutzmittel-Belastung. Diese Belastung wurde jeweils einer der vier Klassen „nicht nachgewiesen“ (NN), „gering“ (G), „mittel“ (M) und „hoch“ (H) belastet zugeteilt. Diese vier Klassen bilden damit auch die möglichen Diagnosen des Expertensystems LIMPACT. Zusätzlich wurde eine Diagnose „ungeeignetes Fließgewässer“ erstellt. Diese Diagnose wird bestätigt, wenn die physikalisch-chemischen bzw. morphologischen Parameter außerhalb bestimmter Bereiche sind. Es werden keine Bäche mit industriellen Einträgen, extremen Salzgehalten oder pH-Werten sowie Bäche des Hügel- und Berglandes oder große Fließgewässer berücksichtigt. In einem solchen Fall würden keine weiteren Regeln aktiviert werden und somit auch keine Diagnose zur Belastung bestätigt.
Die Beobachtungen
Die Abundanzen der bentischen Makroinvertebraten stellen die entscheidenden Eingangsparameter für das Expertensystem dar. Es wurden vier Zeiträume T1: März/April, T2: Mai/Juni, T3: Juli/August and T4: September/Oktober im Jahresverlauf definiert, zu denen eine Messung der Abundanzen vorliegen sollte. Für jedes Taxa bietet LIMPACT eine Eingabemaske für die Abundanzen zu diesen Terminen. Zusätzlich berechnet LIMPACT die Abundanzänderungen zwischen zwei Zeiträumen, um diese ebenfalls auswerten zu können. Neben administrativen Informationen wie Fließgewässername oder Lage des Fließgewässers berücksichtigt LIMPACT auch physikalisch-chemische bzw. morphologische Parameter als Beobachtungen.
Die Fälle
Teilweise wurden die Probestellen mehrfach in verschiedenen Jahren untersucht, so daß insgesamt 157 Datensätze mit einer chemischen Analyse der Pflanzenschutzmittel, einer Aufnahme der physikalisch-chemischen bzw.

VIII Das Expertensystem LIMPACT 80
morphologischen Parameter und einer biologischen Erfassung der Makroinvertebraten Lebensgemeinschaft, vorlagen. Diese Datensätze werden im weiteren Verlauf mit dem Begriff „Bachjahre“ beschrieben.
Ergebnisse und Diskussion
Die benthische Makroinvertebraten-Fauna als Indikatoren
Die benthische Makroinvertebraten-Fauna wurde durch Trichoptera, Diptera, Oligochaeta, und Amphipoda (vor allem Gammarus pulex) dominiert. Insgesamt wurden 386 Taxa nachgewiesen. Da die Nachweise seltener Arten in Einzelproben stark von Probenahmefehlern beeinflusst wird, wurden zum Aufbau der Wissensbasis nur die 39 häufigsten Taxa analysiert. Diese bilden 90,4% der gesamten Abundanz aller Taxa.
Durch die empirische Auswertung wurde jedes Taxa entweder als negativer - oder als positiver Indikator (Murtaugh, 1996) für die Pflanzenschutzmittel-Belastung eingesetzt. Ein negativer Indikator ist eine Art, deren Abundanz umgekehrt proportional mit der Belastung korreliert ist. Die Abundanz einer positiven Indikatorart ist direkt proportional mit der Belastung korreliert. Hohe Abundanzen einer negativen Indikatorart zeigen also geringe Belastungen an, während hohe Abundanzen einer positiven Indikatorart auf eine hohe Belastung hinweisen.
Das Implementieren der Regeln
Beim Programmieren der Wissensbasis von LIMPACT wurden zwei Arten von Regeln aufgestellt. Zuerst wurden 30 Regeln aufgestellt, um die Diagnose „ungeeignetes Fließgewässer“ zu etablieren oder zu de–etablieren. Innerhalb eines Bereiches der physikalisch-chemischen bzw. morphologischen Parameter, in dem kein Einfluß dieser Faktoren auf die aquatische Lebensgemeinschaft zu erwarten war, wurde die Diagnose nicht bewertet. Außerhalb dieses Bereiches wurde für jeden Parameter entweder die Bewertung P3 oder bei extremen Parameterwerten die Bewertung P7 vergeben. Dies führt dazu, das bei Parametern mit geringem Effekt auf die Lebensgemeinschaft die Diagnose „ungeeignetes Fließgewässer“ von LIMPACT nur verdächtigt wird, bei einem starken Einfluß aber sicher etabliert wird. Im letzteren Fall wird als Konsequenz keine Diagnose zur Pflanzenschutzmittel-Belastung ausgegeben.
Im zweiten, entscheidende Teil beim Aufbau von LIMPACT, wurden Regeln zur Bewertung der vier Diagnosen zur Pflanzenschutzmittel-Belastung aufgestellt. Hierzu wurden in einer Datenbank die 157 Bachjahre den vier Belastungsklassen zugeordnet und die Abundanz sowie die Abundanzdynamik von 39 Taxa analysiert und jeweils als positiver oder negativer Indikator bewertet. Bei der Analyse musste berücksichtigt werden, dass neben der Belastung auch anderen Faktoren das Vorkommen beeinflussen können. Während eine hohe Abundanz eines negativen Indikators eindeutig eine geringe Belastung belegen kann, zählt eine geringe Abundanz nicht automatisch für eine hohe Belastung. Ähnliches gilt für positive Indikatoren: eine hohe Abundanz spricht für eine hohe Belastung, kann aber unter bestimmten Umständen auch in
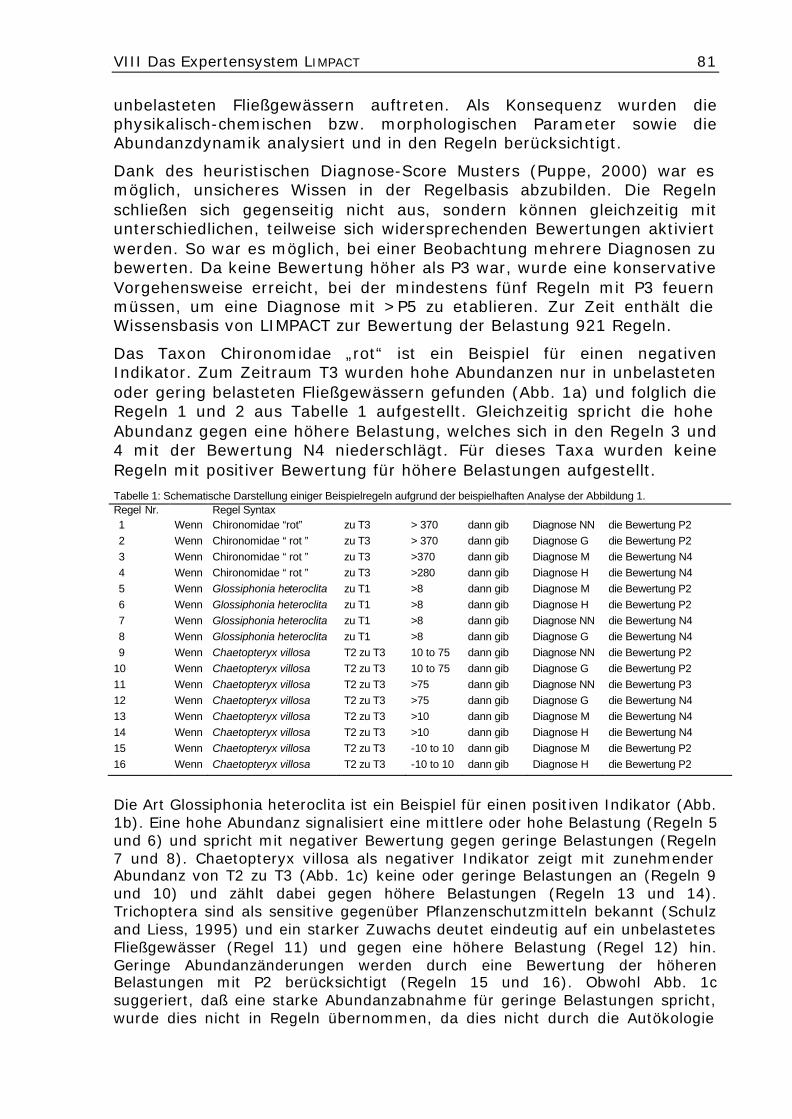
VIII Das Expertensystem LIMPACT 81
unbelasteten Fließgewässern auftreten. Als Konsequenz wurden die physikalisch-chemischen bzw. morphologischen Parameter sowie die Abundanzdynamik analysiert und in den Regeln berücksichtigt.
Dank des heuristischen Diagnose-Score Musters (Puppe, 2000) war es möglich, unsicheres Wissen in der Regelbasis abzubilden. Die Regeln schließen sich gegenseitig nicht aus, sondern können gleichzeitig mit unterschiedlichen, teilweise sich widersprechenden Bewertungen aktiviert werden. So war es möglich, bei einer Beobachtung mehrere Diagnosen zu bewerten. Da keine Bewertung höher als P3 war, wurde eine konservative Vorgehensweise erreicht, bei der mindestens fünf Regeln mit P3 feuern müssen, um eine Diagnose mit >P5 zu etablieren. Zur Zeit enthält die Wissensbasis von LIMPACT zur Bewertung der Belastung 921 Regeln.
Das Taxon Chironomidae „rot“ ist ein Beispiel für einen negativen Indikator. Zum Zeitraum T3 wurden hohe Abundanzen nur in unbelasteten oder gering belasteten Fließgewässern gefunden (Abb. 1a) und folglich die Regeln 1 und 2 aus Tabelle 1 aufgestellt. Gleichzeitig spricht die hohe Abundanz gegen eine höhere Belastung, welches sich in den Regeln 3 und 4 mit der Bewertung N4 niederschlägt. Für dieses Taxa wurden keine Regeln mit positiver Bewertung für höhere Belastungen aufgestellt. Tabelle 1: Schematische Darstellung einiger Beispielregeln aufgrund der beispielhaften Analyse der Abbildung 1. Regel Nr. Regel Syntax 1 Wenn Chironomidae “rot” zu T3 > 370 dann gib Diagnose NN die Bewertung P2 2 Wenn Chironomidae “ rot ” zu T3 > 370 dann gib Diagnose G die Bewertung P2 3 Wenn Chironomidae “ rot ” zu T3 >370 dann gib Diagnose M die Bewertung N4 4 Wenn Chironomidae “ rot ” zu T3 >280 dann gib Diagnose H die Bewertung N4 5 Wenn Glossiphonia heteroclita zu T1 >8 dann gib Diagnose M die Bewertung P2 6 Wenn Glossiphonia heteroclita zu T1 >8 dann gib Diagnose H die Bewertung P2 7 Wenn Glossiphonia heteroclita zu T1 >8 dann gib Diagnose NN die Bewertung N4 8 Wenn Glossiphonia heteroclita zu T1 >8 dann gib Diagnose G die Bewertung N4 9 Wenn Chaetopteryx villosa T2 zu T3 10 to 75 dann gib Diagnose NN die Bewertung P2
10 Wenn Chaetopteryx villosa T2 zu T3 10 to 75 dann gib Diagnose G die Bewertung P2 11 Wenn Chaetopteryx villosa T2 zu T3 >75 dann gib Diagnose NN die Bewertung P3 12 Wenn Chaetopteryx villosa T2 zu T3 >75 dann gib Diagnose G die Bewertung N4 13 Wenn Chaetopteryx villosa T2 zu T3 >10 dann gib Diagnose M die Bewertung N4 14 Wenn Chaetopteryx villosa T2 zu T3 >10 dann gib Diagnose H die Bewertung N4 15 Wenn Chaetopteryx villosa T2 zu T3 -10 to 10 dann gib Diagnose M die Bewertung P2 16 Wenn Chaetopteryx villosa T2 zu T3 -10 to 10 dann gib Diagnose H die Bewertung P2
Die Art Glossiphonia heteroclita ist ein Beispiel für einen positiven Indikator (Abb. 1b). Eine hohe Abundanz signalisiert eine mittlere oder hohe Belastung (Regeln 5 und 6) und spricht mit negativer Bewertung gegen geringe Belastungen (Regeln 7 und 8). Chaetopteryx villosa als negativer Indikator zeigt mit zunehmender Abundanz von T2 zu T3 (Abb. 1c) keine oder geringe Belastungen an (Regeln 9 und 10) und zählt dabei gegen höhere Belastungen (Regeln 13 und 14). Trichoptera sind als sensitive gegenüber Pflanzenschutzmitteln bekannt (Schulz and Liess, 1995) und ein starker Zuwachs deutet eindeutig auf ein unbelastetes Fließgewässer (Regel 11) und gegen eine höhere Belastung (Regel 12) hin. Geringe Abundanzänderungen werden durch eine Bewertung der höheren Belastungen mit P2 berücksichtigt (Regeln 15 und 16). Obwohl Abb. 1c suggeriert, daß eine starke Abundanzabnahme für geringe Belastungen spricht, wurde dies nicht in Regeln übernommen, da dies nicht durch die Autökologie

VIII Das Expertensystem LIMPACT 82
dieser Art bestätigt werden kann. Der Grund für dieses Phänomen sind die sehr geringen Abundanzen in belasteten Fließgewässern bereits zu T2. Um dies zu berücksichtigen, wurde hier eine komplexe Regel aufgestellt, die Abundanzen und Abundanzdynamiken miteinander kombiniert. 83% der Regeln in der Wissensbasis kombinieren zwei Beobachtungen und sind somit komplexe Regel.
Abbildung 1: Abundanzen (Indiv. pro qm) und Abundanzdynamiken einiger Indikatoren zur Verdeutlichung des Analyseprozesses und der Erstellung der Regeln. In f) signalisieren die weißen Kreise Bäche mit einem hohen Anteil an morphologischen Strukturen (>80%).
Ceratopogonidae zeigt von T1 zu T2 eine Abundanzdynamik eines positiven Indikators (Abb. 1d). Eine Zunahme wurde nur in belasteten Fließgewässern gefunden. Die Abundanz von Dytiscidae zu T2 (Abb. 1e) ist typisch für eine tolerantes Taxon, welches bei geringer und mittlerer Belastung höhere Abundanzen als in unbelasteten und hoch belasteten Fließgewässern besitzt. Limnephilus lunatus (Abb. 1f) als negativer Indikator zeigt nur in Fließgewässern mit hohem morphologischen Strukturanteil (>80%, weiße Kreise) auch bei höheren Belastungen eine hohe Abundanz. Hier mußten komplexe Regeln die Abundanzen mit den physikalisch-chemischen bzw. morphologischen Parametern kombinieren.
Insgesamt wurden 622 Regeln mit positiver und 299 Regeln mit negativer Bewertung aufgestellt. Dabei sind die Regeln über die vier Diagnosen gleichmäßig verteilt. Auffällig ist, daß von den 251 Regeln zu der Diagnose nicht nachgewiesen (NN) 83% und von den 226 Regeln zu der Diagnose hohe Belastung (H) nur 48% eine positive Bewertungen haben. Dies zeigt, daß es einfacher ist, ein unbelastetes Fließgewässer anhand faunistischer Merkmale zu erkennen.
Evaluierung von LIMPACT
Das Expertensystem wurde mit den 157 Fällen evaluiert, mit denen das System aufgebaut wurde. Das Ergebnis zeigt Tabelle 2. Das Klassifikationsergebnis ist gut, wurde aber nicht durch eine unabhängige Evaluierung erreicht. Die korrekte Klassifikation wurde in 66,7% bis 85,5% der Fälle erreicht. Die stärksten Fehler

VIII Das Expertensystem LIMPACT 83
treten bei der Unterscheidung zwischen unbelasteten und gering belasteten Gewässern sowie zwischen mittlerer und hoher Belastung auf. Der relativ hohe Anteil an Fließgewässern, die gar nicht klassifiziert werden, begründet sich durch unseren konservativen Ansatz, wodurch eine Falschklassifikation vermieden wird. Ohne die nicht klassifizierten Fälle ergibt sich für mittel-belastete Gewässer eine Klassifikationsrate von 82,4%, für unbelastete von 97,9% und für hoch belastete sogar eine korrekte Klassifikationsrate von 100%. Insgesamt demonstriert das Ergebnis die grundsätzliche Fähigkeit von LIMPACT, die Pflanzenschutzmittel-Belastung durch Abundanzdaten der Makroinvertebraten-Fauna abschätzen zu können. Tabelle 2: Ergebnis der Klassifikation von 157 Bachjahren durch LIMPACT. Angegeben ist die tatsächliche Belastung und der Anteil der klassifizierten Bäche jeweils für die vier Belastungsklassen als Prozentwert und in Klammern als absoluter Wert.
Klassifikationsergebnis (%)
tatsächliche Belastung Nicht Nachgewiesen Gering Mittel Hoch nicht klassifiziert
Nicht Nachgewiesen 85.5 0 1.8 0 12.7
(55) (47) (-) (1) (-) (7) Gering 17.6 76.5 0 0 5.9
(34) (6) (26) (-) (-) (2) Mittel 2.4 0 66.7 11.9 19.0
(42) (1) (-) (28) (5) (8) Hoch 0 0 0 80.8 19.2
(26) (-) (-) (-) (21) (5)
Eine Evaluierung von LIMPACT durch einen unabhängigen Datensatz wird durchgeführt sobald neue Bachjahre vorliegen. Dies wird zu einer Überarbeitung und Verbesserung der Wissensbasis führen. Da die Wissensbasis im Gegensatz zu anderen Expertensystemen ausschließlich durch statistische Datenauswertung aufgebaut und dabei durch Expertenwissen überprüft wurde, kann aber bereits jetzt von einer hohen Qualität ausgegangen werden. Dies wird durch die geringe Fehlerrate bestätigt.
Gründe für Klassifikationsfehler und nicht klassifizierte Fälle liegen in der Anzahl der vorkommenden Arten und der Anzahl der durchgeführten Populationsaufnahmen. Je mehr Daten der Anwender bereitstellt, desto mehr Regeln werden aktiviert. Von den hier untersuchten 157 Bachjahren hatten 98% Daten zu den Terminen T1 und T2, 78% zu T3 und nur 72% zu T4. Dies begründet auch zum Teil die nicht klassifizierten Fälle.
Um die Wasserqualität zu bewerten, werden von biologischen Indikatorsystemen verschiedene Parameter betrachtet. RIVPACS aus England sagt die potentielle Makroinvertebraten-Fauna an der betrachteten Probestelle ohne Stressfaktoren voraus (Wright et al., 1998) und erlaubt somit die tatsächlich gefundene Fauna zu bewerten. In den Niederlanden wird mit STOWA (Peeters et al., 1994) ein ähnlicher Ansatz verfolgt. In Schottland wurde das integrierte Bewertungssystem SERCON (Boon et al., 1996) und in den USA die Rapid Bioassessment Protocols (Resh et al., 1995) entwickelt. In Deutschland ist der Saprobienindex (Friedrich, 1990) etabliert um biologisch abbaubare organische Belastungen zu erfassen und Systeme zur Überwachung der Schwermetallbelastung (Wachs, 1991) und der Versauerung (Brakke et al., 1994) sind bekannt. Auch Böhmer und Kappus (1997) erwähnen in Ihrer Übersicht über Ansätze zur Bewertung der Wasserqualität in Fließgewässern kein biologisches Indikatorsystem zur Erfassung der Pflanzenschutzmittel-Belastung.
Grundsätzlich ist der Einsatz biologischer Indikatorsysteme auf Probestellen beschränkt, an denen die betrachteten Indikatororganismen auch vorkommen.

VIII Das Expertensystem LIMPACT 84
Dies gilt auch für LIMPACT und die 39 Arten und Taxa, die es berücksichtigt. Bäche, in denen keine dieser Taxa vorkommen, können nicht klassifiziert werden. Eine Weiterentwicklung von LIMPACT sollte deshalb die Anzahl der betrachteten Arten erhöhen und zusätzlich höhere taxonomische Ebenen berücksichtigen. Der Einsatz von LIMPACT würde durch eine Reduzierung der notwendigen Zeitpunkte, zu denen Abundanzdaten vorliegen sollten, deutlich vereinfacht werden. Zur Zeit werden vier Termine gefordert. Eine Reduktion auf zwei oder einen Termin würde die Möglichkeit eines routinemäßigen Einsatzes im Flächenmaßstab eröffnen. Ein jährliche Überwachung der kleinen Fließgewässer im landwirtschaftlichem Raum könnte chemische Pflanzenschutzmittelanalysen nur noch im konkreten Verdachtsfall notwendig machen. Dies wäre entweder durch im gleichen Jahr ereignisgesteuert-genommene und aufbewahrte Wasserproben oder im folgendem Jahr möglich. Durch das biologische Indikatorsystem könnten auch eintragsreduzierende Maßnahmen im Einzugsgebiet überwacht und bewertet werden.
Danksagung
Diese Forschungsarbeit wurde von der Deutschen Bundesstiftung Umwelt, An der Bornau 2 in 49090 Osnabrück, Deutschland durch ein Promotionsstipendium gefördert. Die Datenerhebung der Pflanzenschutzmittelbelastung und der aquatischen Lebensgemeinschaft erfolgte in verschiedenen Projekten, die größtenteils durch das Umweltbundesamt (UBA: FKZ 296 24 511), das Bundesministerium für Bildung und Forschung (BmBF: FKZ 0339804) und den Niersverband, Viersen gefördert wurden. Jörn Wogram, Jakob Drees and Norbert Berenzen leisteten dabei einen erheblichen Anteil der Datenerhebung.
Literatur Böhmer J. and Kappus B. (1997) Ökologische Bewertung von Fließgewässern in der Europäischen
Union und anderen Ländern -Literaturstudie-. Literaturstudie im Auftrag der Landesanstalt für Umweltschutz Baden-Württemberg, Stuttgart, Reihe Handbuch Wasser 2 Bibliothek der Landesanstalt für Umweltschutz Baden-Württemberg
Boon J. P., Holmes N. T. H., Maitland P. S., Rowell T. A. and Davies J. (1996) A system for evaluating rivers for conservation (SERCON): development, structure amd function. Freshwater Quality
Braukmann U. and Pinter I. (1997) Concept for an integrated ecological evaluation of running waters. Acta Hydrochimica et Hydrobiologica 25, 113-127.
Cooper C. M. (1993) Biological effects of agriculturally derived surface -water pollutants on aquatic systems - a review. J. Environ. Qual. 22, 402-408.
Friedrich G. (1990) Eine Revision des Saprobiensystems. Z. Wasser. Abwasser. Forsch. 23, 141-152.
Liess M. and Schulz R. (1999) Linking insecticide contamination and population response in an agricultural stream. Environ. Toxicol. Chem. 18, 1948-1955.
Liess M. and Schulz R. (2000) Sampling methods in surface waters. In Handbook of water analysis, eds. L. M. L. Nollet, pp. 1-24. Marcel Dekker, New York.
Liess M., Schulz R., Liess M. H.-D., Rother B. and Kreuzig R. (1999) Determination of insecticide contamination in agricultural headwater streams. Water Res. 33, 239-247.
Liess M., Schulz R. and Neumann M. (1996) A method for monitoring pesticides bound to suspended particles in small streams. Chemosphere 32, 1963-1969.
Murtaugh P. A. (1996) The statistical Evaluation of ecological indicators. Ecol. Appl. 6, 132-139.
Neumann M. and Dudgeon D. (2002) The impact of agricultural runoff on stream benthos in Hong Kong, China. Wat. Res. 36 (12) 3093-3099

VIII Das Expertensystem LIMPACT 85
Neumann M. and Liess M. (1999) Abschätzung und Bewertung der Insektizidbelastung kleiner Fließgewässer durch ein regelbasiertes Expertensystem. In Ökosystemare Ansätze in der Ökotoxikologie, eds. J. Oehlmann and B. Markert, pp. 516-520. Ecomed Verlag, Landsberg.
Neumann M., Schulz R., Schäfer K., Müller W., Mannheller W. and Liess M. (2002) The significance of entry routes as point and non-point sources of pesticides in small streams. Water Res. 36 (4) 835-842
Peeters E. T. M. H., Gardeniers J. J. P. and Tolkamp H. H. (1994) New methods to assess the ecological status of surface waters in the Netherlands. Verh. Int. Ver. Limnol. 25, 1914-1916.
Puppe F. (1998) Knowledge Reuse among Diagnostic Problem Solving Methods in the Shell-Kit D3. International Journal of Human-Computer Studies 49, 627-649.
Puppe F. (2000) Knowledge formalization patterns. Proc. of PKAW in Sydney, Australia
Resh V. H., Norris R. N. and Barbour M. T. (1995) Design and implementation of rapid assessment approaches for water resource monitoring using benthic macroinvertebrates. Australian Journal of Ecology 20, 108-121.
Schulz R. and Liess M. (1995) Chronic effects of low insecticide concentrations on freshwater caddisfly larvae. Hydrobiologia 299, 103-113.
Schulz R. and Liess M. (1999) A field study of the effects of agriculturally derived insecticide input on stream macroinvertebrate dynamics. Aquat. Toxicol. 46, 155-176.
Wachs B. (1991) Ökobewertung der Schwermetallbelastung von Fließgewässern. Münchener Beitrag Abwasser-, Fischerei- und Flußbiologie 45, 295-335.
Wright J. F., Furse M. T. and Moss D. (1998) River classification using invertebrates: RIVPACS applications. Aquatic Conservation Marine and Freshwater 8, 617-631.

86
Curriculum vitae
Dipl.-Geoökol. Michael Neumann Schleinitzstr. 15 38106 Braunschweig
geboren am: 10. Januar 1970 in Marburg a.d. Lahn
Nationalität: deutsch
Familienstand: ledig, keine Kinder
Schulausbildung: 1976 bis 1980 Grundschule 1980 bis 1989 Gymnasium in Viersen (NRW) mit Abiturnote 1,8 1987 Highschool Diploma nach Aufenthalt in USA
Zivildienst: Juli 1989 bis Februar 1991 bei der Schutzstation Wattenmeer e.V. auf Hallig Hooge (Nordsee). (Vogelzählungen und Seehunderfassungen im Nationalpark, Leitung eines 20 Betten Umweltbildungshaus und Öffentlichkeitsarbeit mit Wattwanderungen und Informationsvorträge).
Hochschulstudium: Oktober 1991 bis Oktober 1997 Studium der Diplom Geoökologie an der Technische Universität Braunschweig mit Nebenfächern Umweltrecht und Ökologie. Abschlußnote „sehr gut“.
Beschäftigung: Oktober 1997 bis April 1999 freier Mitarbeiter und Wissenschaftlicher Angestellter am Zoologischen Institut der TU Braunschweig als Gutachter und verantwortlicher Bearbeiter des Projektes „Pestizidbelastung der Nette (NRW)“.
Promotion: seit Juni 1999 Promotionsstipendium durch die Deutsche Bundesstiftung Umwelt, Osnabrück.
Ausland: Februar 2000 für drei Monate Forschungsaufenthalt an der Hong Kong University bei Prof. D. Dudgeon. Weiter Forschungsreisen nach Indien und Nepal (7 Wochen), zweimal USA (12 und 4 Wochen) sowie Schottland und Polen.
Praktikum: September 2001 für drei Monate Unternehmenspraktikum bei der MYBAU AG in München im Marketing, Web-Design und Customer Relationship.
Braunschweig, den

87
Complete list of publications (July 2002)
Contributions in refereed journals Liess, Schulz & Neumann (1996) A method for monitoring pesticides bound to suspended particles
in small streams. Chemosphere 32, 1963-1969.
Neumann M. and Dudgeon D. (2002) The Impact of Agricultural Runoff on Stream Benthos in Hong Kong, China; Water Research: 36 (12) 3093-3099
Neumann M., Liess M., Schulz R. (2002) LIMPACT: An expert System to estimate the pesticide contamination of small streams with macroinvertebrate bioindicators, Part 1: The database; Ecological Indicators: in press
Neumann M., Baumeister J., Liess M., Schulz R. (2002) LIMPACT: An expert system to estimate the pesticide contamination of small streams with macroinvertebrate bioindicators, Part 2: The knowledge base; Ecological Indicators: in press
Neumann M., Baumeister J., Liess M., Schulz R. (2002) LIMPACT: Ein Expertensystem zur Abschätzung der Pflanzenschutzmittel-Belastung kleiner Fließgewässer mittels der Makroinvertebraten-Fauna; Umweltwissenschaften und Schadstoff-Forschung: in press
Neumann M., Schulz R., Schäfer K., Müller W., Mannheller W., Liess M. (2002) The significance of entry routes as point and non-point sources of pesticides in small streams. Water Research: 36 (4) 835-842
Neumann M., Liess M., Schulz R. (2002) A sampling method for monitoring water-quality in temporary channels or sewers with pesticide contamination as example; Chemosphere: under revision
Neumann, M. & Baumeister, J. (under revision) A rule-based vs. a model-based implementation of the knowledge system LIMPACT and its significance for maintenance and discovery of ecological knowledge; Proceedings of the 3rd Conference of the International Society for Ecological Informatics (ISEI3), Rome, Italy,
Contributions in books or proceedings Neumann & Liess (1996b) Abschätzung der Insektizidbelastung in Agrarfließgewässer - Aufbau
eines regelbasierten Expertensystems. Erweiterte Zusammenfassungen der Jahrestagung der Deutschen Gesellschaft für Limnologie (DGL) Schwedt/O. 1996 Band 2, 612-616.
Neumann & Liess (1999) Abschätzung und Bewertung der Insektizidbelastung kleiner Fließgewässer durch ein regelbasiertes Expertensystem. In Ökosystemare Ansätze in der Ökotoxikologie, eds. J. Oehlmann and B. Markert, pp. 516-520. Ecomed Verlag, Landsberg.
Neumann M., Schulz R., Liess M. (1999) Diffuse und punktuelle Eintragspfade für Pflanzenschutz-mittel und ihre Bedeutung für zwei kleine Fließgewässer. Erweiterte Zusammenfassung der Jahrestagung der Deutschen Gesellschaft für Limnologie (DGL) Rostock 1999 Band 1, 503-508.
Conferences Neumann & Liess (1996a) Abschätzung der Insektizidbelastung in Agrarfließgewässer - Aufbau
eines regelbasierten Systems. Vortrag auf der Jahrestagung der Deutschen Gesells chaft für Limnologie (DGL) Schwedt/O. 1996
Neumann M. and Liess M. (1997) Vergleich der durch Feststoffe veränderten Toxizität zweier Insektizide und ihrer Formulierung in dem Gammarus pulex-Biotest. Vortrag auf der zweiten deutschsprachigen SETAC-Tagung; 24.-25.02.1997 Aachen
Neumann & Liess (1998) Abschätzung und Bewertung der Insektizidbelastung kleiner Fließgewässer durch ein regelbasiertes Expertensystem. Poster SETAC-GLB Tagung, Zittau 1998
Neumann M., Schulz R., Liess M. (1999). "Konzentrationen von Pflanzenschutzmitteln in kleinen Fließgewässern.” Vortrag SETAC-GLB Tagung 13.09. bis 14.09. in Weihenstephan.

88
Neumann M., Schulz R., Liess M. (1999). "Diffuse und punktuelle Eintragspfade für Pflanzen-schutzmittel und ihre Bedeutung für zwei kleine Fließgewässer.” Vortrag auf der Tagung der Deutschen Gesellschaft für Limnologie (DGL) 27.09. bis 01.10. 1999 in Rostock
Neumann M., Baumeister J., Liess M., Schulz R. (2001) LIMPACT: Ein Expertensystem zur Abschätzung der Pflanzenschutzmittelbelastung kleiner Fließgewässer mittels der Makroin-vertebraten Fauna. Vortrag auf der SETAC-GLB Tagung 10.09. bis 11.09. 2001 in Berlin
Neumann, M., et al. (2002). " LIMPACT: An expert system to estimate the pesticide contamination of small streams using benthic macroinvertebrates as bioindicators.” Vortrag auf der 3rd Conference of the International Society for Ecological Informatics (ISEI3), 26.-30. August 2002, Rome, Italy
Survey Neumann et al. (1999c) Untersuchung der diffusen und punktuellen Pflanzenschutzmittel-Einträge
im Einzugsgebiet der Nette. Unveröffentlichtes Gutachten im Auftr. des Niersverbandes, der Stadtwerke und des Kreises Viersen, 78 Seiten.
Internet http://www.limpact.de

89