from laboratory to road: a 2015 update of official and “real-world
TRANSCRIPT

FROM LABORATORY TO ROAD
A 2015 updAte of officiAl And “reAl-world”
fuel consumption And co2 vAlues for pAssenger
cArs in europe
uwe tietge, nikiforos Zacharof, peter mock, vicente franco,
John german, Anup Bandivadekar (icct)
norbert ligterink (tno)
udo lambrecht (ifeu)
september 2015white paper
BeiJing | Berlin | Brussels | sAn frAncisco | wAshington
www.theicct.org

Acknowledgements
the authors thank the internal and external reviewers of this report for their guidance and constructive comments, with special thanks to peter de haan, Athanasios dimaratos, Alessandro marotta, and dimitris tsokolis. the authors are grateful to the following individuals and organizations for contributing data and background information for our original 2013 report, as well as the 2014 and 2015 updates: matthias gall, christof gauss, reinhard Kolke, sonja schmidt (AdAc); stefan novitski (AUTO BILD); mikael Johnsson, erik söderholm, Alrik söderlind (auto motor sport sweden); Koenraad Backers and participating organizations (cleaner car contracts); hartmut Kuhfeld, uwe Kunert (diw); nick molden (emissions Analytics); gerd preuss (fiA); dan harrison, dan powell (honestjohn.co.uk); mario Keller (infrAs); mario chuliá, Alfonso herrero, Andrés pedrera (km77.com); maciej czarnecki (leaseplan deutschland); thomas fischl (spritmonitor.de); sascha grunder (tcs); travelcard nederlands; stefan hausberger (tu graz); lars mönch (uBA); chas hallett (WhatCar?); Jörg Kühlwein and iddo riemersma.
for additional information:
international council on clean transportation europe neue promenade 6, 10178 Berlin +49 (30) 847129-102 [email protected] www.theicct.org
© 2015 international council on clean transportation
funding for this work was generously provided by the climateworks foundation and stiftung mercator.

i
FROM LABORATORY TO ROAD : 2015 UpDATe
executive summAry
official average carbon dioxide (co2) emissions of new passenger cars in the european union declined from 170 grams per kilometer (g/km) in 2001 to 123 g/km in 2014. during the period 2001–2014, the rate of reduction in co2 emissions per kilometer increased from approximately one percent per year to approximately four percent per year. A direct cause of that improvement was the introduction of mandatory co2 fleet targets, in place of voluntary commitments, in 2009. despite concerns expressed then about the feasibility of the mandate, europe’s automakers met the 2015 target of 130 g/km two years ahead of schedule. today, in 2015, manufacturers are on track to meet the 2020/21 target of 95 g/km. however, that simple summary of vital progress in transportation and climate policy, while accurate, leaves out some crucial details.
As our series From Laboratory to Road has made clear over the past three years, in reality, co2 emissions from passenger cars in everyday operation have not declined as much as these official statistics would seem to indicate, which has become a subject of rising concern. this study, which updates the from laboratory to road series for 2015, demonstrates that the trend has not improved — on the contrary, the gap between real-world and official values continues to increase.
the eu vehicle efficiency regulations rely on results obtained from certification tests, also called type-approval tests, conducted in vehicle testing laboratories and not on the road. for fleet co2 emission targets to be effective, laboratory test results should translate accurately into real-world performance. increasingly, evidence shows that they do not.
A technical definition of real-world driving is elusive because of variations in vehicle types, driving behavior, and driving conditions. nonetheless, in aggregating data on almost 600,000 vehicles from eleven data sources and six countries, this study reveals a clear trend over time: the divergence (or “gap”) between real-world and official CO2 emissions increased from approximately 8 percent in 2001 to 40 percent in 2014 (see figure 1). each data source used for the study includes a unique set of vehicles and drivers, so estimates of the divergence of real-world from official values vary among them. however, the increase in the gap cannot be explained based on driving behavior or differences between the data sources, but is instead a result of increasingly unrealistic type-approval values.

ii
ICCT white paper
0%
10%
20%
30%
40%
50%
60%
2001 2002 2003 2004 2005 2006 2007 2008 2009 2010 2011 2012 2013 2014
Div
erg
ence
of
‘rea
l-w
orl
d’ f
rom
man
ufac
ture
rs’ t
ype-
app
rova
l CO
2
Build year / Fleet year / Model year / Test year
n = approx. 0.6 million vehicles
40% (all data sources)
45% (company cars)
36% (private cars)
8%
auto motor und sport (D)
Travelcard (NL)km77.com (E)
auto motor & sport (S)
honestjohn.co.uk (GB)AUTO BILD (D)
Touring Club Schweiz (CH)
Figure 1. divergence between real-world and manufacturers’ type-approval co2 emissions for various real-world data sources, including average estimates for private cars, company cars, and all data sources.
this 2015 update investigates the reasons why certification testing is returning unrealistic type-approval values. four key factors were identified (see also figure 2):
road load determination. in setting up vehicle certification tests in the laboratory, coefficients for road load are used to characterize the forces (mainly aerodynamic drag and rolling resistance) that a car needs to overcome as it is driven on the road. these coefficients are determined through a series of coast-down tests on an outside track. there are a number of aspects of this road load determination procedure that offer vehicle manufacturers potential for exploiting tolerances and flexibilities. these include tire selection and preparation, selection of the test track, ambient test conditions, and pre-conditioning of the vehicle, among others. it is estimated that about one-quarter of the overall gap observed in 2014 is explained by exploitation of tolerances and flexibili-ties in the methods required by the eu regulation for determining road load.
Chassis dynamometer testing. the chassis dynamometer permits a vehicle to be “driven” while remaining stationary (by placing the vehicle on rollers) and simulates road load. under the eu regulation, there are a number of “loopholes” that can potentially be exploited by vehicle manufacturers during chassis dynamometer testing. these include break-in periods for the test vehicle, tolerances regarding laboratory instruments, the state of charge of the vehicle’s battery, special test driving techniques, and use of pre-series parts that are not representative of production vehicles. the analysis indicates that vehicle manufacturers have found ways to optimize chassis dynamometer type-approval testing over time, which at the same time made it less representative of average real-world driving conditions. As a result, the impact of chassis dynamometer testing flex-ibilities on the divergence between type-approval and real-world co2 emissions today is estimated to explain more than half of the overall divergence observed.
technology deployment. certain technologies, such as stop-start systems and hybrid powertrains, have a different effect on co2 emissions in the type-approval procedure

iii
FROM LABORATORY TO ROAD : 2015 UpDATe
than they do during real-world driving, because of specific characteristics of the driving cycle used in type-approval testing that differ from typical everyday vehicle operation. it is estimated that about one-tenth of the gap in 2014 is explained by an increasing market share of those technologies.
Other parameters. operating equipment such as air conditioning systems and entertain-ment systems increases fuel consumption during real-world driving. nonetheless, these devices are either switched off or are not fully taken into account during the type-approval emissions test, leading to unrealistically low co2 emission values. this factor is estimated to explain about another one-tenth of the gap in 2014.
~10%
~24%
~35%
~49%
future scenario historical development
~23%
~31%
Road load determinationChassis dynamometer testingTechnology deploymentOther parameters
2002NEDC
2010NEDC
2014NEDC
2020NEDC
2020WLTP
2025WLTP
Div
erg
ence
‘rea
l-w
orl
d’ v
s. o
ffici
al C
O2
50%
40%
30%
20%
10%
0%
Figure 2: estimate of the reasons for the divergence between type-approval and real-world co2 emission levels for new passenger cars in the past as well as in the future, with and without introduction of the wltp (for details, see stewart, hope-morley, mock, & tietge, 2015).
the growing divergence between real-world and official co2 values is important for all stakeholders:
» For an average consumer, the divergence translates into increased fuel costs on the order of €450 per year.1
» For society as a whole, the divergence weakens efforts to mitigate climate change and reduce fossil fuel imports into the eu. it is estimated that less than half of the on-paper co2 emission reductions in recent years translate into real-world reductions.
» For governments, the divergence compromises the tax system, undermines incentive schemes intended to promote clean vehicles, and may lead to a misallocation of public funds. for example, in the netherlands, the loss in tax revenues may amount to as much as €3.4 billion per year.
1 Because co2 emissions and fuel consumption are directly proportional, any discrepancy between type-approval and real-world co2 emissions translates into an equivalent discrepancy in nominal and real-world fuel consumption.
iv
ICCT white paper
» For car manufacturers, the divergence puts those that want to report realistic co2 emission values at a competitive disadvantage. unrealistic type-approval values also have the potential to damage manufacturers’ credibility and may erode consumer and regulator trust in the entire industry.
the driving cycle currently used in type-approval testing in europe, the new european driving cycle (nedc), was not developed to measure fuel consumption or co2 emis-sions, and it is not well-suited to determining those values. changes to the type-approval procedure are needed to ensure that more realistic results are reported. the european commission plans to implement the new worldwide harmonized light vehicles test procedure (wltp) in 2017. with its dynamic test cycle and more rigorous test procedure, it is expected to reduce the divergence from a projected 49 percent in a 2020 business-as-usual scenario (i.e., continued type-approval testing using the nedc) to about 23 percent (figure 2).
But the wltp is not a silver bullet, and a substantial gap between type-approval and real-world co2 emissions is expected to remain for a number of reasons. for one, the wltp fails to address some of the shortcomings of the nedc, such as the way auxiliary vehicle equipment is handled during tests. furthermore, the wltp is expected to introduce new “loopholes”, which will not be fully understood until its deployment. despite the fact that these future developments are difficult to quantify, even with introduction of the wltp, the divergence level is estimated to increase to about 31 percent in 2025 (figure 2).
care should also be exercised in converting nedc-based targets, such as the 95 g/km target for 2020/21, into wltp targets. the 2020/21 target of 95 g/km co2 in nedc equals about 100–102 g/km co2 in the wltp. Allowing for a higher conversion factor would essentially reward the exploitation of unintended flexibilities in the nedc and would thereby risk undermining the efficacy of introducing the wltp.
looking ahead, it is recommended to introduce in-use conformity testing of co2 emis-sions from vehicles as a necessary complement to the type-approval laboratory test. for conformity testing to be effective, it will be important to test randomly selected produc-tion vehicles, with testing conducted by independent bodies. in addition, new vehicles should also be tested on-road during real-world driving, making use of portable emission measurement systems. the european commission has recently moved in this direction on air pollutant emissions with the real-driving emissions (rde) test procedure — an approach that in the future should be extended to co2 emissions from passenger cars.

v
FROM LABORATORY TO ROAD : 2015 UpDATe
tAble of contents
executive summary .................................................................................................................... i
abbreviations ............................................................................................................................ vi
1. introduction ...........................................................................................................................1
2. Data analysis .........................................................................................................................4
2.1. spritmonitor.de (germany) .......................................................................................................4
2.2. travelcard (netherlands) ...........................................................................................................14
2.3. leaseplan (germany) .................................................................................................................17
2.4. honestjohn.co.uk (united Kingdom) .................................................................................. 20
2.5. cleaner car contracts (netherlands) ..................................................................................22
2.6. Auto Bild (germany) ..............................................................................................................24
2.7. whatcar?/emissions Analytics (united Kingdom) ........................................................26
2.8. auto motor und sport (germany) .........................................................................................28
2.9. auto motor & sport (sweden) ............................................................................................... 30
2.10. km77.com (spain) .......................................................................................................................32
2.11. tcs (switzerland) .......................................................................................................................34
3. Data comparison ................................................................................................................35
4. Discussion of results ..........................................................................................................38
5. policy implications .............................................................................................................42
references ............................................................................................................................... 46

vi
ICCT white paper
AbbreviAtions
cm centimeter
co2 carbon dioxide
eeA european environment Agency
epA environmental protection Agency
eu european union
g/km grams per kilometer
ghg greenhouse gas
gps global positioning system
hev hybrid electric vehicle
icct international council on clean transportation
ifeu institute for energy and environmental research heidelberg
km Kilometer
km/h Kilometers per hour
mpg miles per imperial gallon
nedc new european driving cycle
noX nitrogen oxides
pems portable emissions measurement system
phev plug-in hybrid electric vehicle
rde real driving emissions
tcs touring club switzerland
tno netherlands organisation for Applied scientific research
u.K. united Kingdom
usA united states of America
wltp worldwide harmonized light vehicles test procedure
1
FROM LABORATORY TO ROAD : 2015 UpDATe
1. introduction
the european union (eu) was one of the first regions in the world to introduce manda-tory limits on carbon dioxide (co2) emissions from new passenger cars. these limits were set in the context of an overarching eu policy to reduce total greenhouse gas (ghg) emissions by 80 to 90 percent from 1990 levels by 2050 (european commission, 2011). when the 2015 new car fleet target of 130 grams per kilometer (g/km) of co2 was adopted in 2009, there was considerable controversy as to whether it could be met in time. As it turned out, the annual co2 emission reduction rate increased from 1 percent before the introduction of co2 standards to 4 percent after the introduction of the regu-lation and the 2015 target of 130 g/km was met two years in advance (Zacharof, mock, & tietge, 2015). vehicle manufacturers are now on their way to meeting the 2020/21 co2 emission target of 95 g/km.
co2 emission standards are a key contribution to the eu-wide efforts to mitigate climate change and provide multiple benefits to vehicle owners and the general public. since carbon dioxide emissions and fuel consumption are directly proportional, co2 reductions also mean significant fuel cost savings for consumers as well as reduced oil imports into the eu. in addition, the continuous research and implementation of new, clean technolo-gies creates and sustains jobs in the eu (summerton et al., 2013).
official vehicle co2 emission values are determined in a chassis dynamometer laboratory through an emissions type-approval test. the framework conditions for emissions type-approval testing are specified by the new european driving cycle (nedc). this approach should in principle ensure that manufacturers certify their vehicles in a reproducible manner and that all vehicles are held to the same standard. however, to achieve real co2 emission improvements, reductions in the level of emissions measured in the laboratory through type-approval testing must translate into reductions under “real-world” driving conditions. the terms “real-world” and “on-road” are used here to describe the everyday experience of vehicle owners. driving styles and conditions vary widely, rendering elusive a precise technical definition of real-world driving. nevertheless, aggregating large datasets reveals clear trends in the real-world performance of cars.
the international council on clean transportation (icct) began to investigate the divergence (or “gap”) between real-world and official co2 values in 2012 (mock, german, Bandivadekar, & riemersma, 2012). in collaboration with other institutes and organiza-tions, the report series From Laboratory to Road was continued in 2013 and 2014 (mock et al., 2013; mock, tietge, et al., 2014).
the 2012 report analyzed real-world data on 28,000 vehicles and found that the diver-gence had grown from about 7 percent in 2001 to 21 percent in 2010, with a significant increase observed since 2007.
the 2013 report, prepared by the icct, the netherlands organization for Applied scientific research (tno), and the institute for energy and environmental research heidelberg (ifeu), included more data sources, with data for almost 500,000 vehicles. the results echoed the findings of the 2012 report, noting the significant increase in the gap since 2007 for various vehicle segments and the dataset as a whole. the report also presented results for individual manufacturers and investigated the differences among them.
in 2014, the icct continued to collaborate with tno and ifeu and added new data sources, including car magazines and leasing companies. the report provided further insights into the development of the gap by analyzing data trends for individual vehicle models, where the introduction of new model redesigns was found to be associated with sharp increases in the divergence.
2
ICCT white paper
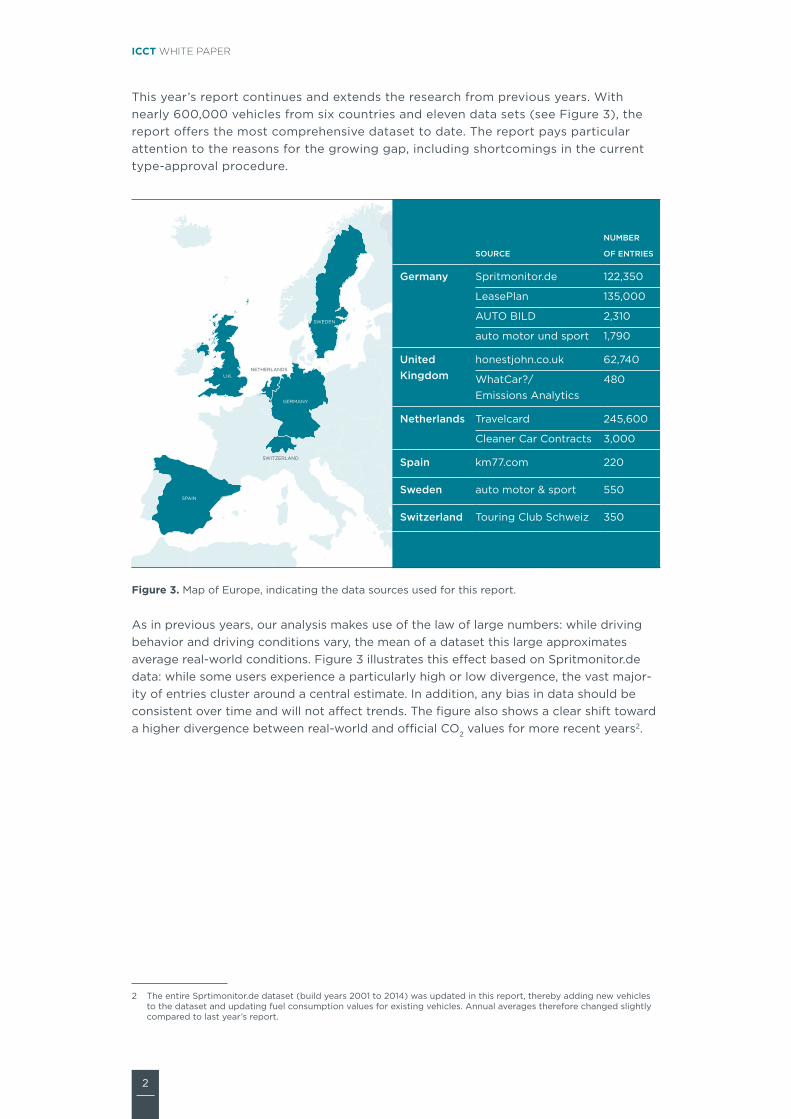
this year’s report continues and extends the research from previous years. with nearly 600,000 vehicles from six countries and eleven data sets (see figure 3), the report offers the most comprehensive dataset to date. the report pays particular attention to the reasons for the growing gap, including shortcomings in the current type-approval procedure.
NETHERLANDS
GERMANY
SWEDEN
U.K.
SPAIN
SWITZERLAND
Figure 3. map of europe, indicating the data sources used for this report.
As in previous years, our analysis makes use of the law of large numbers: while driving behavior and driving conditions vary, the mean of a dataset this large approximates average real-world conditions. figure 3 illustrates this effect based on spritmonitor.de data: while some users experience a particularly high or low divergence, the vast major-ity of entries cluster around a central estimate. in addition, any bias in data should be consistent over time and will not affect trends. the figure also shows a clear shift toward a higher divergence between real-world and official co2 values for more recent years2.
2 the entire sprtimonitor.de dataset (build years 2001 to 2014) was updated in this report, thereby adding new vehicles to the dataset and updating fuel consumption values for existing vehicles. Annual averages therefore changed slightly compared to last year’s report.
SOURCE
NUMBER
OF ENTRIES
Germany spritmonitor.de 122,350
leaseplan 135,000
Auto Bild 2,310
auto motor und sport 1,790
United Kingdom
honestjohn.co.uk 62,740
whatcar?/ emissions Analytics
480
Netherlands travelcard 245,600
cleaner car contracts 3,000
Spain km77.com 220
Sweden auto motor & sport 550
Switzerland touring club schweiz 350

3
FROM LABORATORY TO ROAD : 2015 UpDATe
-40% -20% 0% 20% 40% 60% 80% 100%
Estimated gap between real-world and official type-approval CO2 emissions
20018%
201124%
201437%
‘REAL-WORLD’ < TYPE-APPROVAL ‘REAL-WORLD’ > TYPE-APPROVAL
Figure 4: distribution of the divergence between spritmonitor.de and type-approval fuel consumption values, comparison for the years 2001, 2011 and 2014.
since fuel consumption and co2 are directly related (nearly all of the carbon present in the fuel is converted to co2 during combustion), the report uses fuel consumption and co2 interchangeably, while results and graphs are presented in co2. similarly, “official” and “type-approval” are used interchangeably to describe the nedc results. the divergence for different data sources was calculated as the difference between real-world and official values, expressed as a percentage of the official figure. while previous From Laboratory to Road reports employed sales-weighting for some data sources, fleet averages were consistently calculated as the unweighted arithmetic mean in this 2015 update.
the remainder of the document is organized in four parts. in section 2, we analyze the different data sources and calculate estimates of the divergence between real-world and type-approval co2 emission values. in section 3, we compare the results from different data sources and discuss trends, while section 4 takes a closer look at the underlying reasons for the growing divergence. lastly, section 5 summarizes the findings and provides policy recommendations.

4
ICCT white paper
2. dAtA AnAlysis
2.1. spritmOnitOr.De (Germany)
Data type On-road, user-submitted
Data availability 2001–2014, approximately 9,000 vehicles per build year
Data collection fuel consumption data, entered by vehicle drivers into a publicly available online database
Fleet structure, driving behavior
mostly private cars, urban and extra-urban driving, some information on driving style
Descriptionspritmonitor.de3 is a web service that allows users to track their fuel consumption. Anyone can register for free, select a vehicle model and configuration, and enter data on fuel consumption and distance travelled. the reported fuel consumption values are publicly accessible. more than 300,000 users are registered on spritmonitor.de.
As spritmonitor.de relies on user entries, consumer attitudes and driving behavior affect reported fuel consumption values. on the one hand, spritmonitor.de users may pay close attention to fuel consumption and may drive in a more fuel-conserving manner. spritmonitor.de data may thus provide a conservative estimate of real-world fuel consumption and underestimate the divergence of real-world and official fuel consumption figures. on the other hand, consumers who are particularly skeptical of manufacturers’ claims or frustrated with their vehicles’ performance may be more prone to use a service such as spritmonitor.de. this bias could lead to an overestima-tion of the divergence between real-world and official fuel consumption values. in any case, even if the data are biased in either direction, this bias should be consistent over time and should not affect the trends in the divergence between spritmonitor.de and official fuel consumption values.
information on the self-reported driving style of spritmonitor.de users provides some evidence that systemic biases in the user base are unlikely. in addition to fuel consump-tion data, users can provide additional information on their driving style, with options including economic, balanced, and speedy driving. users indicate that 77 percent of all distance covered is driven in a balanced manner, while economical and speedy driving account for 13 and 11 percent respectively. these proportions are fairly consistent over time, though with a slight increase in economical and speedy driving, and a correspond-ing decrease in balanced driving. while this data does not provide definitive evidence on the attitude and behavior of spritmonitor.de users, it points to a balanced driving style among spritmonitor.de users.
MethodologyAnonymized data on approximately 200,000 passenger cars manufactured between 2001 and 2014 was acquired by the icct from spritmonitor.de. for each vehicle, informa-tion on the vehicle manufacturer, model, build year, fuel, engine power, and transmission was given. data on total mileage and total fuel consumption was also provided, from which the real-world fuel consumption figures were calculated. in contrast to the previ-ous From Laboratory to Road report (mock, tietge et al., 2014), the dataset now includes all available spritmonitor.de entries and is not limited to select manufacturers4. only data
3 see http://www.spritmonitor.de. the complete data set used for this analysis was acquired in April 2015.4 in 2014, data was only collected for the following brands: Audi, Bmw, citroën, fiat, ford, mercedes-Benz, mini, nissan,
opel, peugeot, renault, Škoda, smart, toyota, volvo, and vw.
5
FROM LABORATORY TO ROAD : 2015 UpDATe
for passenger cars was included in the analysis, while data on car-derived vans (e.g., vw caddy) and non-car-derived vans (e.g., vw transporter) was excluded.
the analysis of spritmonitor.de data included rigorous outlier detection. After filtering data for missing values, each model variant5 with fewer than five spritmonitor.de entries was removed from the dataset. this removal of uncommon model variants allowed for outlier detection to be performed at the model variant level. the outlier detection process then involved removing entries outside of the thresholds defined by peirce’s criterion for each model variant with more than five entries6. After filtering for complete, valid passenger car entries and removing outliers, approximately 122,000 entries of the spritmonitor.de dataset remained. the model variants in this dataset represent more than 90 percent of passenger cars sold in the german market. As spritmonitor.de users continuously enter new fuel consumption data and new outlier detection methods were employed, results may differ slightly compared to previous reports.
spritmonitor.de data was used to estimate the divergence between real-world and official fuel consumption values by calculating the difference between the two figures, expressed as a percentage of the official fuel consumption value, for each entry. in con-trast to the previous From Laboratory to Road report, results were not sales-weighted to be consistent with the methodology for the other data sources7. A detailed discussion of the representativeness of spritmonitor.de data can be found in the 2013 From Labora-tory to Road report.
ResultsAs shown in figure 4, the average divergence between spritmonitor.de and official fuel consumption values increased from 8 percent in 2001 to 37 percent in 2014. in recent years, the divergence has been growing at an increasing rate.
upon closer inspection, spritmonitor.de data suggests that the divergence between real-world and official fuel consumption data varies among fuel and transmission types. diesel vehicles started exhibiting a higher divergence than gasoline vehicles after 2010 (see figure 4). since then, the difference between the two fuels increased from one to five percentage points. reliable data for hybrid electric vehicles (hevs) has been avail-able since 2010 and now includes approximately 1,800 entries from 2010 to 2014. with values ranging from 39 to 45 percent, hevs consistently exhibit a higher divergence than conventional internal combustion engines. the number of plug-in hybrid electric vehicles (phevs) registered on spritmonitor.de was too low (approximately 400 entries) to provide a reliable estimate of the performance of phevs.
5 A model variant is here defined as a unique combination of vehicle manufacturer, model, build year, fuel, engine power, and transmission.
6 for a description of peirce’s criterion and its application, see ross (2003).7 the difference between the sales-weighted and simple mean was less than 0.02 percent in 2014.

6
ICCT white paper
0%
5%
10%
15%
20%
25%
30%
35%
40%
45%
50%
2000 2002 2004 2006 2008 2010 2012 2014
Div
erg
ence
of
Spri
tmo
nito
r.de
fro
m
man
ufac
ture
rs’ t
ype-
app
rova
l CO
2
Vehicle build year
All vehiclesDiesel vehiclesGasoline vehiclesHybrid electric vehicles
8%
37%
Diesel49%
Gasoline44%
Hybrid 7%
Figure 5. divergence of spritmonitor.de from manufacturers’ type-approval co2 emissions by fuel type (pie chart indicates the share of vehicles per fuel type in the data set for 2014).
figure 5 shows the development of the divergence between real-world and official fuel consumption values for manual and automatic transmission vehicles. since 2007, automatic transmission vehicles exhibited a higher divergence than manual transmission vehicles. the disparity between the two transmission types has been increasing and reached 7 percentage points in 2014.
0%
5%
10%
15%
20%
25%
30%
35%
40%
45%
2000 2002 2004 2006 2008 2010 2012 2014
Div
erg
ence
of
Spri
tmo
nito
r.de
fro
m
man
ufac
ture
rs’ t
ype-
app
rova
l CO
2
Vehicle build year
All vehiclesAutomatic transmission vehiclesManual transmission vehicles
8%
37%
Automatic37%Manual
63%
Figure 6. divergence of spritmonitor.de from manufacturers’ type-approval co2 emissions by transmission type (pie chart indicates the share of vehicles per transmission type in the data set for 2014).
7
FROM LABORATORY TO ROAD : 2015 UpDATe
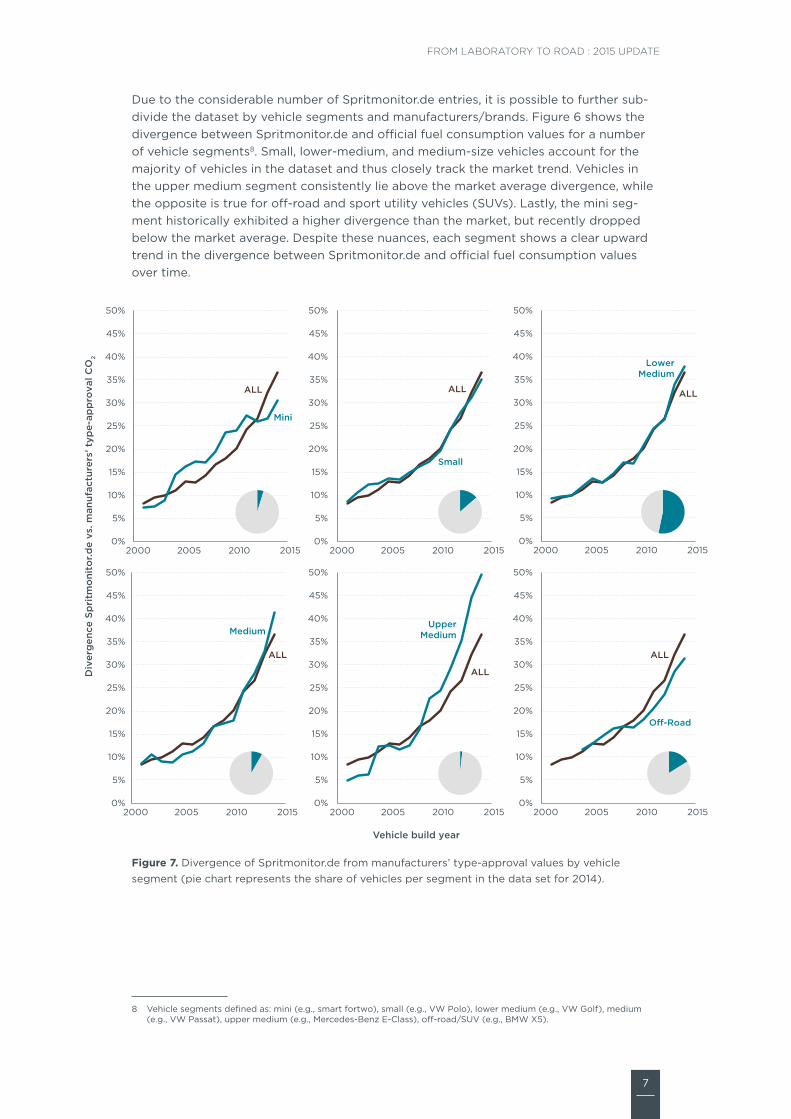
due to the considerable number of spritmonitor.de entries, it is possible to further sub-divide the dataset by vehicle segments and manufacturers/brands. figure 6 shows the divergence between spritmonitor.de and official fuel consumption values for a number of vehicle segments8. small, lower-medium, and medium-size vehicles account for the majority of vehicles in the dataset and thus closely track the market trend. vehicles in the upper medium segment consistently lie above the market average divergence, while the opposite is true for off-road and sport utility vehicles (suvs). lastly, the mini seg-ment historically exhibited a higher divergence than the market, but recently dropped below the market average. despite these nuances, each segment shows a clear upward trend in the divergence between spritmonitor.de and official fuel consumption values over time.
0%
5%
10%
15%
20%
25%
30%
35%
40%
45%
50%
2000 2005 2010 2015
Mini
ALL
0%
5%
10%
15%
20%
25%
30%
35%
40%
45%
50%
2000 2005 2010 2015
Small
ALL
0%
5%
10%
15%
20%
25%
30%
35%
40%
45%
50%
2000 2005 2010 2015
LowerMedium
ALL
Div
erg
ence
Sp
ritm
oni
tor.d
e vs
. man
ufac
ture
rs’ t
ype-
app
rova
l CO
2
0%
5%
10%
15%
20%
25%
30%
35%
40%
45%
50%
2000 2005 2010 2015
Medium
ALL
0%
5%
10%
15%
20%
25%
30%
35%
40%
45%
50%
2000 2005 2010 2015
Vehicle build year
UpperMedium
ALL
0%
5%
10%
15%
20%
25%
30%
35%
40%
45%
50%
2000 2005 2010 2015
O�-Road
ALL
Figure 7. divergence of spritmonitor.de from manufacturers’ type-approval values by vehicle segment (pie chart represents the share of vehicles per segment in the data set for 2014).
8 vehicle segments defined as: mini (e.g., smart fortwo), small (e.g., vw polo), lower medium (e.g., vw golf), medium (e.g., vw passat), upper medium (e.g., mercedes-Benz e-class), off-road/suv (e.g., Bmw X5).

8
ICCT white paper
figure 7 shows the development of the divergence between real-world and official fuel consumption values for different manufacturers and brands. As technical characteristics and driving behavior may vary across different vehicle segments, comparisons of brands that operate in similar markets generally prove most even-handed.
Bmw’s divergence in real-world co2 emissions strongly increased between 2006 to 2008, at the same time that EfficientDynamics technology packages were introduced in many of their new vehicles.9 these packages include fuel-saving technologies such as stop-start systems and aerodynamic improvements, among other features.10 however, in recent years, the growth in the divergence between official and real-world co2 emissions has slowed down for Bmw. while still above average (38 percent), the development for Bmw is now closely tied to the market growth rate in the divergence. the situation is different for the two other german premium manufacturers, daimler and Audi. in both cases, the growth in the divergence between official and real-world co2 emissions started later than for Bmw, but kept growing rapidly, to 48 percent for daimler and 45 percent for Audi in 2014.
french and franco-Japanese manufacturers psA and renault-nissan remained below the market-average divergence until 2012, but have caught up recently with a divergence of around 40 percent in 2014. similarly, the volkswagen group has exhibited a lower than average divergence due to the low divergence of Škoda, but was approaching the market average in 2014. other manufacturers and brands, including fiat, ford, and gm, have closely followed the market average throughout the years. for fiat, the slightly er-ratic movement of the divergence is due to the varying number of entries for each year.
leaving hevs aside, toyota had the lowest divergence of all manufacturers and brands depicted in figure 7. toyota’s divergence ranged from 6 percent in 2001 to 26 percent in 2014 — considerably lower than the market average of 37 percent. however, when taking into account hevs, the brand’s divergence increases from 26 percent to 41 percent in 2014. this reflects the high divergence observed for all hevs in the market (see figure 4) as well as the high share of hevs in toyota’s sales.
9 AdAc Autodatenbank, https://www.adac.de/infotestrat/autodatenbank/10 Bmw, efficientdynamics, http://www.bmw.com/com/en/insights/technology/efficientdynamics/2015/index.html

9
FROM LABORATORY TO ROAD : 2015 UpDATe
Div
erg
ence
Sp
ritm
oni
tor.d
e vs
. man
ufac
ture
rs’ t
ype-
app
rova
l CO
2
0%
5%
10%
15%
20%
25%
30%
35%
40%
45%
50%
2000 2005 2010 2015
BMW
ALL
0%
5%
10%
15%
20%
25%
30%
35%
40%
45%
50%
2000 2005 2010 2015
Daimler
ALL
0%
5%
10%
15%
20%
25%
30%
35%
40%
45%
50%
2000 2005 2010 2015
ALL
Fiat
0%
5%
10%
15%
20%
25%
30%
35%
40%
45%
50%
2000 2005 2010 2015
ALL
Ford
0%
5%
10%
15%
20%
25%
30%
35%
40%
45%
50%
2000 2005 2010 2015
ALL
GM
0%
5%
10%
15%
20%
25%
30%
35%
40%
45%
50%
2000 2005 2010 2015
ALL
PSA
0%
5%
10%
15%
20%
25%
30%
35%
40%
45%
50%
2000 2005 2010 2015
ALL
Renault-Nissan
0%
5%
10%
15%
20%
25%
30%
35%
40%
45%
50%
2000 2005 2010 2015
Vehicle build year
ALL
Toyota
(excl. hybrids)
(hybrids only)
0%
5%
10%
15%
20%
25%
30%
35%
40%
45%
50%
2000 2005 2010 2015
Volkswagen(incl. Audi)
ALL
Audi
Figure 8. divergence of spritmonitor.de from manufacturers’ type-approval co2 emissions by brands/manufacturers (pie chart represents the share of vehicles per manufacturer in the data set for 2014) 11.
11 manufacturers (brands) included are: Bmw (Bmw, mini). daimler (mercedes-Benz, smart), fiat (fiat), ford (ford), gm = general motors (opel), psA (peugeot, citroën), renault-nissan (renault, nissan), toyota, and volkswagen (Audi, Škoda, vw).

10
ICCT white paper
the spritmonitor.de data was also used to estimate the divergence between real-world and official fuel consumption values for popular vehicle models. figure 8 shows the divergence for the three top-selling models manufactured by Bmw, mercedes-Benz, peugeot, toyota, and vw. the respective brand’s average divergence is also depicted for comparison. each model’s contribution to its brand’s 2014 sales in germany is presented in the top left, while the minimum and maximum number of spritmonitor.de entries per model and year is presented in the bottom right. lastly, arrowheads in the graph mark the year before the introduction of a new model generation or major facelift, which implies new emissions type-approval tests.
figure 8 demonstrates that the introduction of a new model generation or facelift is generally followed by an increase in the divergence. this increase tends to last a number of years and plateaus as the new model generation has fully penetrated the market. the increase after such technical overhauls is particularly pronounced in more recent years.
while the gap for some models follows a more erratic path due to low numbers of spritmonitor.de entries, this general pattern in the divergence is clearly visible for a number of popular models. for example, the divergence of the vw passat surged after the seventh generation of the model was introduced in 201012. the same is true for other popular models, such as the mercedes A-class after the introduction of the third genera-tion in 2012 and the renault clio after the introduction of the fourth generation in the same year13. A notable exception is the renault twingo, which was completely renewed in 2014 after a long period of few technical overhauls. however, the model has not shown an increase in the divergence, most likely as the new model was released quite recently and has not been captured yet in the spritmonitor.de data.
lastly, the general tendency of hevs to exhibit a higher divergence is reflected in toyota’s figures, where the hybrid versions of the Auris and Yaris show significantly higher values than their combustion engine counterparts.
12 Katalog der Automobile revue 2014, http://katalog.automobilrevue.ch13 Katalog der Automobile revue 2014, http://katalog.automobilrevue.ch

11
FROM LABORATORY TO ROAD : 2015 UpDATe
0%
10%
20%
30%
40%
50%
2000 2002 2004 2006 2008 2010 2012 2014
BMWBMW: all models1-series (2014 market share: 21%)3-series (2014 market share: 19%)5-series (2014 market share: 16%)
2007: Introduction ofEfficientDynamics
0%
10%
20%
30%
40%
50%
2000 2002 2004 2006 2008 2010 2012 2014
Mercedes-BenzMercedes-Benz: all modelsC-Class (2014 market share: 22%)E-series (2014 market share: 16%)A-Class (2014 market share: 13%)
Div
erg
ence
Sp
ritm
oni
tor.
de
vs. m
anuf
actu
rers
' typ
e-ap
pro
val C
O2
0%
10%
20%
30%
40%
50%
2000 2002 2004 2006 2008 2010 2012 2014
PeugeotPeugeot: all models206, 207, 208 (2014 market share: 24%)306, 307, 308 (2014 market share: 22%)
0%
10%
20%
30%
40%
50%
2000 2002 2004 2006 2008 2010 2012 2014
low amount of Spritmonitor.de entries for Twingo, 2004-2006
RenaultRenault: all modelsClio (2014 market share: 23%)Twingo (2014 market share: 20%)Mégane (2014 market share: 17%)
Vehicle build year
0%
10%
20%
30%
40%
50%
2000 2002 2004 2006 2008 2010 2012 2014
Yaris hybrid
Auris hybridToyotaToyota: all modelsYaris (2014 market share: 18%, hybrid: 10%)Auris (2014 market share: 13%, hybrid: 13%)Aygo (2014 market share: 15%)
0%
10%
20%
30%
40%
50%
2000 2002 2004 2006 2008 2010 2012 2014
VWVW: all modelsGolf (2014 market share: 32%)Polo (2014 market share: 10%)Passat (2014 market share: 10%)
Nmin = 55Nmax = 592
Nmin = 39Nmax = 270
Nmin = 14Nmax = 192
Nmin = 3Nmax = 160
Nmin = 11Nmax = 379
Nmin = 146Nmax = 1,051
Figure 9. divergence of spritmonitor.de data from manufacturers’ type-approval co2 emissions by brand and by top-selling models14.
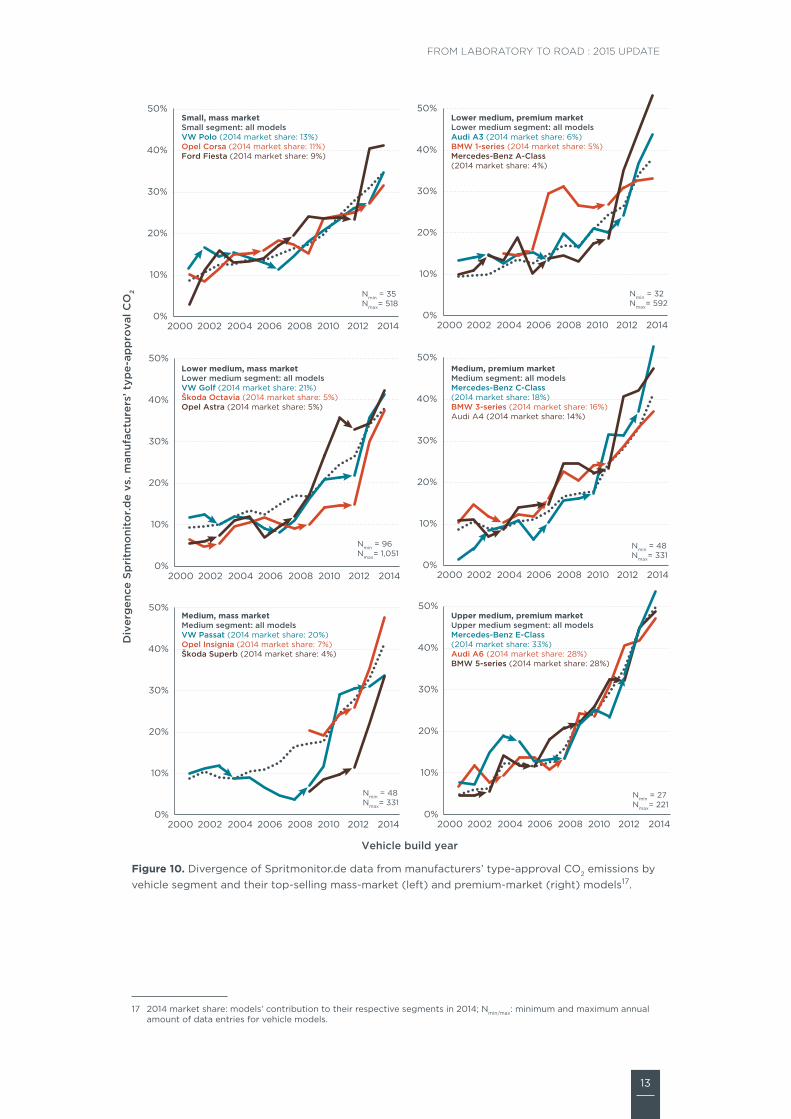
figure 9 presents the divergence of top-selling models in different market segments. the graphs compare different vehicle segments (small, lower medium, medium, and upper medium) and target markets (mass market or premium market). each model’s market
14 2014 market share: models’ contribution to their respective brands in 2014; nmin/max: minimum and maximum annual amount of data entries for vehicle models..

12
ICCT white paper
share in its vehicle segment is printed in the top left of each graph, while the minimum and maximum number of spritmonitor.de entries per model and year are provided in the bottom right. As in figure 8, arrowheads mark the year before the introduction of a new model generation or major technological facelift.
the increase over time in the divergence between spritmonitor.de and official fuel consumption values is consistent across all segments. however, some segments show a homogeneous move toward higher levels of divergence while other segments have first-movers and laggards. the small, mass market and the upper medium, premium market segments show relatively uniform developments. in contrast, the volkswagen group models vw passat and Škoda superb lagged behind the medium segment, mass market average up until the introduction of the release of the seventh generation of the passat in 2010 and the facelift of the superb in 2013.15 similarly, the Škoda octavia lay significantly below the average divergence of the lower medium, mass market segment, but caught up to the average in 2014 after the third generation of the octavia was released in 2013.16 in the same segment, the opel Astra exemplifies the typical pattern of a rapid increase in the divergence, in this case after a facelift in 2009, and the plateauing of the trend after the new model generation fully penetrated the market after 2010.
overall, virtually all models in figure 8 and figure 9 show an increase in the divergence between spritmonitor.de and official fuel consumption values over time. the increase in divergence typically follows the introduction of a new model generation or a facelift. this observation offers an explanation for how the divergence of the entire spritmonitor.de dataset increases over time: many step-wise increases in individual models’ divergence values following technical overhauls add up to a global increase in the divergence over time. the stepwise pattern indicates that unrealistically low official fuel consumption values, rather than driver behavior, are the likely culprit for the increasing divergence. unrealistic official fuel consumption values may result from the increased exploitation of “flexibilities” in the test procedure as well as the introduction of technologies that prove more effective in the laboratory than on the road (e.g., stop-start systems). for details, please refer to section 4 of this report.
15 Katalog der Automobile revue 2014, http://katalog.automobilrevue.ch16 Katalog der Automobile revue 2014, http://katalog.automobilrevue.ch
13
FROM LABORATORY TO ROAD : 2015 UpDATe
Div
erg
ence
Sp
ritm
oni
tor.
de
vs. m
anuf
actu
rers
’ typ
e-ap
pro
val C
O2
Vehicle build year
Nmin = 35Nmax= 518
0%
10%
20%
30%
40%
50%
2000 2002 2004 2006 2008 2010 2012 2014
Small, mass marketSmall segment: all modelsVW Polo (2014 market share: 13%)Opel Corsa (2014 market share: 11%)Ford Fiesta (2014 market share: 9%)
Nmin = 96Nmax= 1,051
0%
10%
20%
30%
40%
50%
2000 2002 2004 2006 2008 2010 2012 2014
Lower medium, mass marketLower medium segment: all modelsVW Golf (2014 market share: 21%)Škoda Octavia (2014 market share: 5%)Opel Astra (2014 market share: 5%)
Nmin = 32Nmax= 592
0%
10%
20%
30%
40%
50%
2000 2002 2004 2006 2008 2010 2012 2014
Lower medium, premium marketLower medium segment: all modelsAudi A3 (2014 market share: 6%)BMW 1-series (2014 market share: 5%)Mercedes-Benz A-Class (2014 market share: 4%)
Nmin = 48Nmax= 331
0%
10%
20%
30%
40%
50%
2000 2002 2004 2006 2008 2010 2012 2014
Medium, mass marketMedium segment: all modelsVW Passat (2014 market share: 20%)Opel Insignia (2014 market share: 7%)Škoda Superb (2014 market share: 4%)
Nmin = 48Nmax= 331
0%
10%
20%
30%
40%
50%
2000 2002 2004 2006 2008 2010 2012 2014
Medium, premium marketMedium segment: all modelsMercedes-Benz C-Class (2014 market share: 18%)BMW 3-series (2014 market share: 16%)Audi A4 (2014 market share: 14%)
Nmin = 27Nmax= 221
0%
10%
20%
30%
40%
50%
2000 2002 2004 2006 2008 2010 2012 2014
Upper medium, premium marketUpper medium segment: all modelsMercedes-Benz E-Class (2014 market share: 33%)Audi A6 (2014 market share: 28%)BMW 5-series (2014 market share: 28%)
Figure 10. divergence of spritmonitor.de data from manufacturers’ type-approval co2 emissions by vehicle segment and their top-selling mass-market (left) and premium-market (right) models17.
17 2014 market share: models’ contribution to their respective segments in 2014; nmin/max: minimum and maximum annual amount of data entries for vehicle models.
14
ICCT white paper
2.2. travelCarD (netherlanDs)
Data type On-road, automatically recorded
Data availability 2004–2014, approximately 25,000 vehicles per year
Data collection fuel-consumption data, recorded using a tank card when refueling at gas stations
Fleet structure, driving behavior
company cars, urban and extra-urban driving; fuel is usually paid for by the employer
Descriptiontravelcard18 is a dutch fuel-card system that can be used at any gas station in the netherlands and more than 35,000 filling stations in europe. roughly 200,000 vehicles registered in the netherlands are regularly fueled using this system. As part of leaseplan corporation n.v., travelcard caters to dutch company fleets. fuel expenses of travelcard users are typically borne by employers since company cars are a common job benefit of-fered to dutch employees. travelcard users may thus have a lower incentive to conserve fuel than private car owners.
for this study, detailed fuel consumption data for approximately 250,000 travelcard vehicles from 2005 to 2014 were analyzed by tno. As with spritmonitor.de and all other data sources in this report, fuel consumption reported by travelcard is based on real-world measurements. since the dataset covers a considerable number of vehicles, estimates from the travelcard data are considered representative of real-world co2 emissions from dutch company cars. for a more detailed discussion of the representa-tiveness of travelcard data, see our 2013 report (mock et al., 2013).
Methodologytravelcard data includes information on real-world and type-approval co2 emissions. tno estimated real-world co2 emissions based on pairs of consecutive fueling events using driving distance, as recorded by the driver, and the quantity of fuel added during each refueling event, as recorded by the travelcard system.
As hybrid electric vehicles are quite common in the netherlands,19 the analysis does not differentiate between hevs and conventional combustion engine vehicles. however, in contrast to last year’s report, results for phevs are presented separately. Another difference from last year’s report is that the entire travelcard dataset, including vehicles built between 2005 and 2014, was updated in 2015. this renewal of the data lowered the estimate of the divergence by three to five percentage points for the build years 2005 to 2009, but had little effect on newer vehicles.
Resultsfigure 10 shows an increase in the divergence between travelcard and official co2 emission values from 8 percent in 2005 to 50 percent in 2014. A rapid increase in this divergence occurred after passenger car co2 emission regulations were introduced in the eu in 2009. At the same time, the dutch government increased the co2-based taxation of vehicles and introduced financial incentives for low-carbon vehicles, which lead to an increase in the share of hybrid vehicles in dutch fleets.
in contrast to the 2014 From Laboratory to Road report, the fleet average excludes plug-in hybrid electric vehicles. results for phevs are instead reported separately (see
18 http://www.travelcard.nl/ 19 in 2014, hybrid electric vehicles accounted for 3.7 percent of the dutch new vehicle market (Zacharof et al., 2015).

15
FROM LABORATORY TO ROAD : 2015 UpDATe
figure 11). this exclusion has a number of consequences for the results. for example, the estimate of the divergence decreased for recent years: in last year’s report, the estimate for vehicles built in 2013 was 51 percent while the exclusion of phevs now yields an estimate of 43 percent. this reduction illustrates the high divergence of phevs (see figure 11) and the considerable impact of phevs on dutch company fleets.
the exclusion of phevs from the fleet estimate also reverses the relationship between gasoline and diesel vehicles. in last year’s report, gasoline vehicles were observed to exhibit a higher divergence than diesel vehicles, which conflicted with most other data sources. since current phevs typically employ gasoline engines and exhibit a consider-ably higher gap than conventional combustion engine vehicles and hevs, excluding phevs yields a consistently higher gap for diesel cars than for gasoline vehicles. for vehicles built in 2014, the divergence for diesel and gasoline vehicles was estimated at 54 and 43 percent respectively, while plug-in hybrid vehicles had an average divergence of 215 percent.
0%
10%
20%
30%
40%
50%
2000 2002 2004 2006 2008 2010 2012 2014
Div
erg
ence
of
Trav
elca
rd f
rom
man
ufac
ture
rs’ t
ype-
app
rova
l CO
2
Vehicle build year
All vehicles (excl. plug-in hybrid electric vehicles)
Diesel vehicles (incl. hybrid electric vehicles)
Gasoline vehicles (incl. hybrid electric vehicles)
8%
50%
Diesel67%
Gasoline 33%
Figure 11. divergence of travelcard data from manufacturers’ type-approval co2 emissions by fuel type (pie chart indicates share of vehicles per fuel type in the data set for 2014).

16
ICCT white paper
0%
50%
100%
150%
200%
250%
Gasoline(incl. hybrid
electric vehicles)
Diesel(incl. hybrid
electric vehicles)
Plug-in hybridelectric vehicles
Div
erg
ence
of
Trav
elca
rd f
rom
m
anuf
actu
rers
’ typ
e-ap
pro
val C
O2
12,5636,108 2,505
Figure 12. divergence of travelcard data from manufacturers’ type-approval co2 emissions for 2014 comparing gasoline and diesel vehicles to plug-in hybrid electric vehicles. number of travelcard vehicles per category presented at the base of each bar.

17
FROM LABORATORY TO ROAD : 2015 UpDATe
2.3. leaseplan (Germany)
Data type On-road, automatically recorded
Data availability 2006–2014, more than 15,000 new vehicles per year
Data collection fuel-consumption data, automatically recorded using a fuel card when refueling at gas stations
Fleet structure, driving behavior
company cars, mostly extra-urban and highway driving; fuel is usually paid for by the employer
Descriptionleaseplan20 is a leasing and fleet management company of dutch origin. founded more than 50 years ago, the company manages over 1.4 million vehicles and provides opera-tional fleet and vehicle management services in 32 countries. leaseplan is owned by the global mobility holding B.v., in which volkswagen group and fleet investments B.v. each hold a 50 percent stake.
for the analysis of the divergence between real-world and official fuel consumption values, passenger car data from leaseplan germany21 was analyzed. leaseplan germany is a wholly-owned subsidiary of leaseplan corporation operating more than 92,000 vehicles. the fleet predominantly consists of company cars. in the aggregation of leaseplan data, the following manufacturer grouping (by brands) was used: Bmw (Bmw, mini), daimler (mercedes-Benz, smart), fiat (Alfa-romeo, chrysler, dodge, fiat, Jeep, maserati), ford, general motors (chevrolet, opel), psA (peugeot, citroën), renault-nissan (dacia, nissan, renault), toyota (lexus, toyota), volkswagen (Audi, porsche, seat, Škoda, vw). leaseplan fuel consumption data is reported every year for the whole leaseplan fleet. with an average holding period of approximately three years, the results can be viewed as the three-year rolling average of new company cars.
like all other data sources in this report, fuel consumption figures reported by leaseplan are real-world values rather than laboratory measurements. while the data covers a substantial customer base, possible sources of biases in these values should be acknowl-edged. similar to travelcard data, the cars managed by leaseplan are company cars, which differ from private cars in a number of ways. notable differences include a high share of diesel vehicles (97 percent in 2014) and a higher share of medium and upper medium segment cars than typical for private vehicles. moreover, Bmw, daimler, ford, and volkswagen account for the vast majority (88 percent) of the data. A more detailed comparison of leaseplan data and german vehicle market characteristics was presented in the 2013 From Laboratory to Road report (mock et al., 2013).
driving behavior of leaseplan customers is also likely to differ from private car own-ers, as fuel expenses are generally covered by employers. leaseplan customers may therefore have a weaker incentive to drive in a fuel-conserving manner. According to leaseplan, customers cover long distances on the Autobahn, often at speeds exceeding 130 km/h, at which point co2 emissions increase drastically. while this may constitute atypical driving behavior, these biases are expected to be consistent over time.
Methodologythe leaseplan dataset includes official fuel consumption values as well as real-world fuel consumption measurements determined by summing up fuel quantity and mileage for each vehicle. for 2014, the fleet average was based on more than 45,000 vehicles. for
20 http://www.leaseplan.com 21 http://www.leaseplan.de

18
ICCT white paper
2006 to 2010, data was provided in aggregated form and can thus not be disaggregated by vehicle segment or manufacturer.22 values for 2012 were not available to the icct.
Resultsthe divergence between leaseplan and official fuel consumption values increased from 21 percent in 2006 to 39 percent in 2014 (see figure 12). while the rate of growth increased from 2006 to 2011, the growth slowed down in more recent years. one possible explanation for this slowdown relates to the timing of the introduction of new model generations. A handful of models, including the vw passat, the ford focus, and the Audi A4, account for approximately one third of the leaseplan dataset. As shown in figure 8 and figure 9 for spritmonitor.de data, these models underwent facelifts around 2010, followed by a rapid increase and a subsequent plateauing of their divergence. A similar development can be observed for these models in the leaseplan data: as the new model generations began penetrating the fleet after 2009, the divergence continued to increase sharply until 2011, but stagnated in more recent years when the new model gen-erations had fully penetrated the fleet. Another potential explanation for the slowdown is the comparatively low share of hybrid vehicles (less than one percent) in the leaseplan data, whereas hybrid vehicles contributed to the increasing gap in other datasets.
0%
5%
10%
15%
20%
25%
30%
35%
40%
2000 2002 2004 2006 2008 2010 2012 2014
Div
erg
ence
of
Leas
ePla
n fr
om
man
ufac
ture
rs’ t
ype-
app
rova
l CO
2
Fleet year
21%
39%
Figure 13. Annual divergence of leaseplan data from manufacturers’ type-approval co2 emissions23.
figure 13 shows the divergence between leaseplan and official fuel consumption values for fleet years 2011, 2013, and 2014 for different vehicle segments. the divergence increased over time for virtually all segments. vehicles in the small to upper-medium segment stand out with particularly high levels of divergence in 2014, while luxury, off-road, and multi-purpose vehicles exhibit lower levels.
22 since this data was provided directly by leaseplan, it could not be verified by the icct.23 the data point for 2012 was linearly interpolated from the 2011 and 2013 data points.

19
FROM LABORATORY TO ROAD : 2015 UpDATe
0%
5%
10%
15%
20%
25%
30%
35%
40%
45%
Mini
Small
Lower
Med
ium
Medium
Upper M
edium
Luxu
ry
Sport
O�-Road
Multi-P
urpose
Div
erg
ence
of
Leas
ePla
n fr
om
man
ufac
ture
rs’
typ
e-ap
pro
val C
O2 in
20
11, 2
013
, and
20
14
2011 Average
2013 Average 2014 Average
2011
2013
2014
Figure 14. divergence of leaseplan data from manufacturers’ type-approval co2 emissions by segments for 2011, 2013, and 2014.
figure 14 presents the divergence between leaseplan and official fuel consumption values in 2011, 2013, and 2014. similar to the development in vehicle segments, virtually all manufacturers had a year-to-year increase in the divergence. while fiat and psA stand out with low divergence levels relative to other manufacturers, daimler, ford, general motors, and volvo consistently exceeded the fleet average. toyota also stands out with the highest increase between 2011 and 2014, mostly due to the increasing share of hevs in their fleet.
0%
5%
10%
15%
20%
25%
30%
35%
40%
45%
BMW
Daimler Fiat
FordGen
eral
Motors
PSARen
ault-
Nissan
Toyo
ta
Volkswag
en in
cl. A
udi
Volvo
Div
erg
ence
of
Leas
ePla
n fr
om
man
ufac
ture
rs’
typ
e-ap
pro
val C
O2 in
20
11, 2
013
, and
20
14
2011 Average
2013 Average
2011
2013
2014
2014 Average
Figure 15. divergence of leaseplan data from manufacturers’ type-approval co2 emissions by manufacturer/brand for 2011, 2013, and 2014.24
24 manufacturers (brands) included are: Bmw (Bmw, mini), daimler (mercedes-Benz, smart), fiat (Alfa romeo, chrysler, dodge, fiat, Jeep, maserati), ford (ford), gm (chevrolet, opel), psA (citroën, peugeot), renault-nissan (dacia, infiniti, nissan, renault), toyota (lexus, toyota), volvo (volvo), volkswagen (Audi, porsche, seAt, Škoda, vw).

20
ICCT white paper
2.4. hOnestjOhn.CO.uk (uniteD kinGDOm)
Data type On-road, user-submitted
Data availability 2001–2014, approximately 4,500 vehicles per year
Data collection fuel consumption data, entered by vehicle drivers into a publicly available online database
Fleet structure, driving behavior
mostly private cars, urban and extra-urban driving, no details on driving style
Descriptionhonestjohn.co.uk25 is a British consumer website that allows anyone to submit real-world fuel consumption data. users select their vehicle model as well as engine configuration and enter fuel consumption based on their everyday experience. fuel consumption is entered in imperial miles per gallon (mpg), contrary to spritmonitor.de where fuel consumption is calculated based on the data provided by the user (amount of fuel purchased and odometer readings). it should also be noted that honestjohn.co.uk uses model year (the year the model was introduced to the market) while spritmonitor.de uses build year (the year the vehicle was manufactured).
since 2001, more than 60,000 readings have been submitted to the site. the available data did not provide any information on the driving style of the users, but any biases are considered to be consistent over time and should not affect the observed trend. the honestjohn.co.uk database contains more diesel vehicles than the uK average and slightly lower average type-approval co2 emission levels than are typical for the u.K. market; see our 2013 report (mock et al., 2013). since the honestjohn.co.uk database is continuously updated with new user input, the results for all model years may differ slightly from previous From Laboratory to Road reports.
Methodologyfuel consumption values from honestjohn.co.uk, including real-world and official values, where converted from miles per gallon to co2 emission values. results were calculated as the average divergence between honestjohn.co.uk and official co2 emission values.
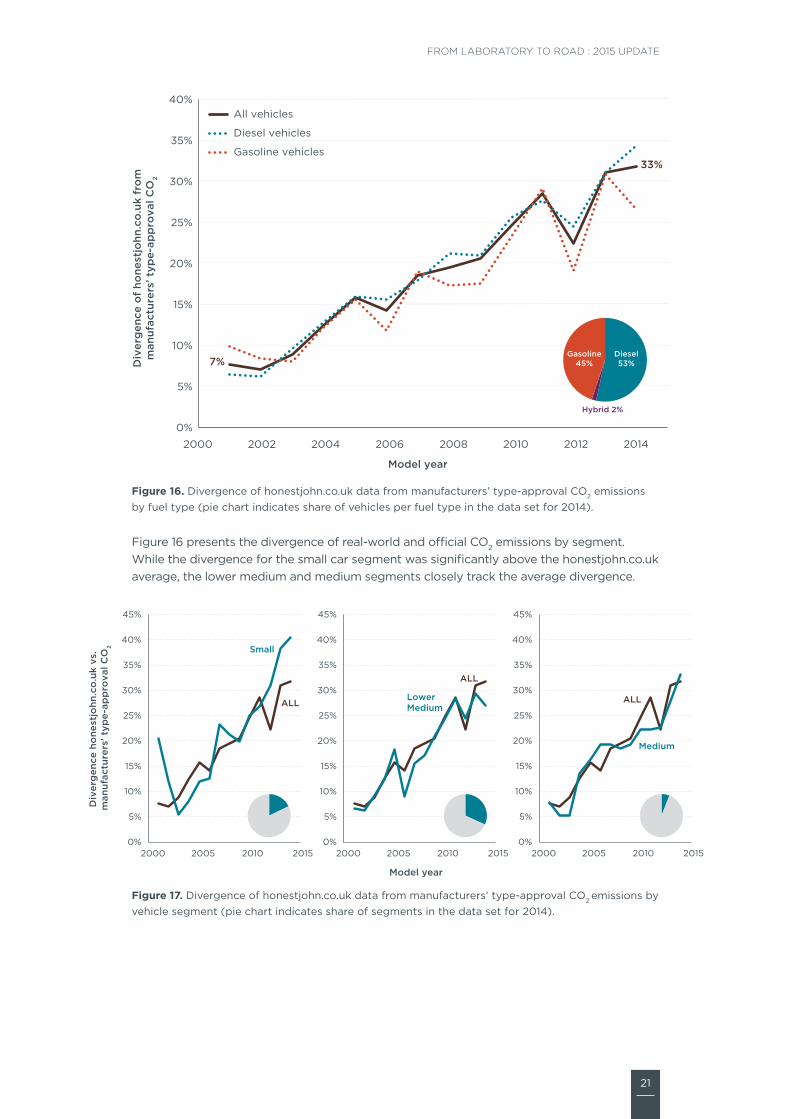
Resultsfigure 15 shows that the discrepancy between real-world and type-approval values increased from 7 percent in 2001 to 33 percent in 2014. the somewhat erratic movement of the trend in the divergence follows from a smaller sample size compared to other data sources (e.g., spritmonitor.de) and a less uniform distribution of entries across years. no persistent difference between diesel and gasoline vehicles can be observed, although there was a sudden branching in 2014 when the divergence for diesel vehicles increased while the divergence for gasoline vehicles decreased.
25 http://www.honestjohn.co.uk
21
FROM LABORATORY TO ROAD : 2015 UpDATe
0%
5%
10%
15%
20%
25%
30%
35%
40%
2000 2002 2004 2006 2008 2010 2012 2014
Div
erg
ence
of
hone
stjo
hn.c
o.u
k fr
om
m
anuf
actu
rers
’ typ
e-ap
pro
val C
O2
Model year
All vehicles
Diesel vehicles
Gasoline vehicles
7%
33%
Diesel53%
Hybrid 2%
Gasoline45%
Figure 16. divergence of honestjohn.co.uk data from manufacturers’ type-approval co2 emissions by fuel type (pie chart indicates share of vehicles per fuel type in the data set for 2014).
figure 16 presents the divergence of real-world and official co2 emissions by segment. while the divergence for the small car segment was significantly above the honestjohn.co.uk average, the lower medium and medium segments closely track the average divergence.
Div
erg
ence
ho
nest
john
.co
.uk
vs.
man
ufac
ture
rs’ t
ype-
app
rova
l CO
2
0%
5%
10%
15%
20%
25%
30%
35%
40%
45%
2000 2005 2010 2015
Small
ALL
Model year
0%
5%
10%
15%
20%
25%
30%
35%
40%
45%
2000 2005 2010 2015
LowerMedium
ALL
0%
5%
10%
15%
20%
25%
30%
35%
40%
45%
2000 2005 2010 2015
Medium
ALL
Figure 17. divergence of honestjohn.co.uk data from manufacturers’ type-approval co2 emissions by vehicle segment (pie chart indicates share of segments in the data set for 2014).
22
ICCT white paper
2.5. Cleaner Car COntraCts (netherlanDs)
Data type On-road
Data availability varies between data sources, typically 2010-2014, approximately 3,000 vehicles in total
Data collection on-road driving, typically more than 25,000 km annual mileage
Fleet structure, driving behavior company cars from three organizations
Descriptioncleaner car contracts is a collaboration of a number of european fleet owners and leasing companies aiming to introduce more fuel-efficient cars into the european vehicle fleet. the initiative was established in 2010 and now brings together 60 companies work-ing on fuel-efficient car fleets. natuur & milieu,26 a dutch environmental organization, and Bond Beter leefmilieu,27 a federation of more than 140 environmental associations in flanders, Belgium, coordinate the initiative.
Methodologyon-road and official fuel consumption data was provided by three organizations:
» Qnh consulting B.v.,28 a dutch it consultancy, with data provided by Alphabet,29 an international company offering fleet management and mobility services for more than 500,000 vehicles
» schneider electric,30 a multinational company specializing in energy management and automation
» wagenplan B.v.,31 a dutch leasing company actively working on reducing co2 emissions of its fleet
for each dataset, the divergence between real-world and official fuel consumption values was calculated as the simple arithmetic mean of the divergence for all vehicles. these values represent the fleet averages for 2014/15. in total, the three datasets cover 3,000 company vehicles.
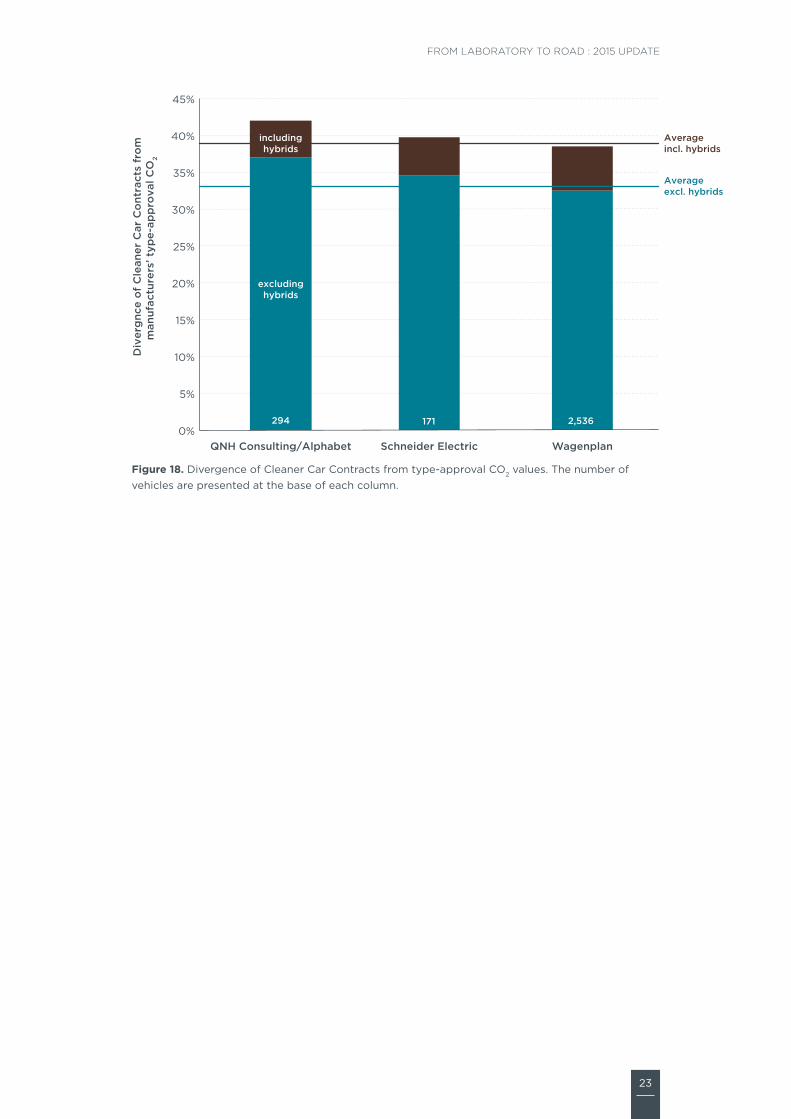
Resultsfigure 24 shows the average divergence between cleaner car contracts data and official fuel consumption figures for the 2014/15 fleet. the estimates for conventional combus-tion engine vehicles range from 32 to 37 percent for individual companies with an average of 33 percent for the entire cleaner car contracts dataset. including hevs and phevs, which account for 9 percent of the company fleets, adds 6 percentage points to the divergence of the cleaner car contracts dataset to 39 percent in total.
26 http://www.natuurenmilieu.nl27 http://www.bondbeterleefmilieu.be/28 www.qnh.nl29 http://www.alphabet.com30 http://www.schneider-electric.com/31 http://www.wagenplan.nl/
23
FROM LABORATORY TO ROAD : 2015 UpDATe
0%
5%
10%
15%
20%
25%
30%
35%
40%
45%
QNH Consulting/Alphabet Schneider Electric Wagenplan
Div
erg
nce
of
Cle
aner
Car
Co
ntra
cts
fro
mm
anuf
actu
rers
’ typ
e-ap
pro
val C
O2
294 171 2,536
excludinghybrids
includinghybrids
Averageincl. hybrids
Averageexcl. hybrids
Figure 18. divergence of cleaner car contracts from type-approval co2 values. the number of vehicles are presented at the base of each column.

24
ICCT white paper
2.6. autO bilD (Germany)
Data type On-road, test route
Data availability 2008–2014, approximately 280 vehicles per year
Data collection fuel consumption data, measured before and after a 155 km test drive
Feet structure, driving behavior
vehicles selected for testing by AUTO BILD; urban, extra-urban, and highway driving; professional drivers; strict adherence to speed limits and normal engine speed
DescriptionAUTO BILD32 is a german automobile magazine first published in 1986. the magazine frequently conducts road tests during which it also measures fuel consumption. the on-road test comprises a 155 km test route that includes 61 km of extra-urban, 54 km of highway (20 km without speed limit), and 40 km of urban driving. According to the magazine, drivers strictly adhere to the speed limits while maintaining normal engine speeds. fuel consumption is estimated by filling up the fuel tank to its capacity before and after the test.
MethodologyAUTO BILD provided data from test-drives from 2008 to 2014. the data included both official and test fuel consumption values. Annual estimates of the divergence were calculated as the simple arithmetic mean.
Resultsfigure 18 presents the annual divergence between real-world and official co2 values. from 2008 to 2014, the divergence increased from 14 to 24 percent (excluding hybrid vehicles) and reached 28 percent in 2014 (including hevs and phevs). hybrids thus introduce such a high divergence (at times 100 percent or more) that they had a signifi-cant effect on the average divergence despite their low numbers (two to five hybrids tested per year). the annual divergence excluding hybrid vehicles is also presented in figure 18 for comparison.
32 http://www.autobild.de/

25
FROM LABORATORY TO ROAD : 2015 UpDATe
0%
5%
10%
15%
20%
25%
30%
2000 2002 2004 2006 2008 2010 2012 2014Div
erg
ence
of
AU
TO B
ILD
fro
m m
anuf
actu
rers
’ typ
e-ap
pro
val C
O2
Test year
All vehicles
All vehicles (excl. hybrids)
Diesel vehicles
Gasoline vehicles
14%
28%
Diesel50%
Gasoline49%
Hybrid 1%
Figure 19. divergence of AUTO BILD data from manufacturers’ type-approval co2 emissions by fuel type (pie chart indicates the share of vehicles per fuel type in the data set for 2014).

26
ICCT white paper
2.7. whatCar?/emissiOns analytiCs (uniteD kinGDOm)
Data type On-road, test route
Data availability 2012–2014, approximately 200 vehicles per year
Data collection portable emissions measurement system (pems) testing on urban and extra-urban roads
Fleet structure, driving behavior mixed vehicle fleet; professional drivers always using the same test route
DescriptionWhatCar?33 is an automobile magazine based in the united Kingdom that is targeted at consumers intending to purchase a vehicle. the magazine conducts thorough vehicle reviews and started to publish fuel consumption figures from their True MPG tests in 2012. these figures are based on a series of on-road tests of new vehicles (usually tested around launch), using portable emission measurement system (pems), which is generally considered a very accurate method of measuring tailpipe emissions and fuel consumption. emissions Analytics,34 an independent company specialized in vehicle emissions testing, is responsible for carrying out the True MPG test on behalf of the magazine.
vehicles are tested on a route that involves both urban and extra-urban portions and attempts to be as close as possible to average British driving conditions. the driver tries to maintain a steady speed, while avoiding unnecessary acceleration and braking, at average urban driving speeds of 24 km/h (15 mph) and extra-urban speeds of 97 km/h (60 mph). the vehicle’s engine is warmed up before the test and all non-essential auxiliaries like the air conditioning are switched off. vehicles are tested in the default state as delivered by the manufacturer rather than using alternative driving settings such as “eco” modes.
on board, pems equipment measures co2 emissions. Based on the measurements, the average fuel consumption is calculated at the end of the test. throughout the test, various sensors provide data on the vehicle’s speed, exhaust manifold pressure, and throttle position. since fuel consumption can be affected by several parameters, other sensors record environmental data such as altitude, humidity, and air pressure. this data is used to adjust the True MPG test data, ensuring that the final co2 emission figures are as consistent as possible when comparing the results from different test drives35.
Methodologythe dataset received from WhatCar?/emissions Analytics contains measurements from 2012 to 2014, with the indicated year referring to the test year. data includes test and official co2 values that were used to calculate the annual divergence.
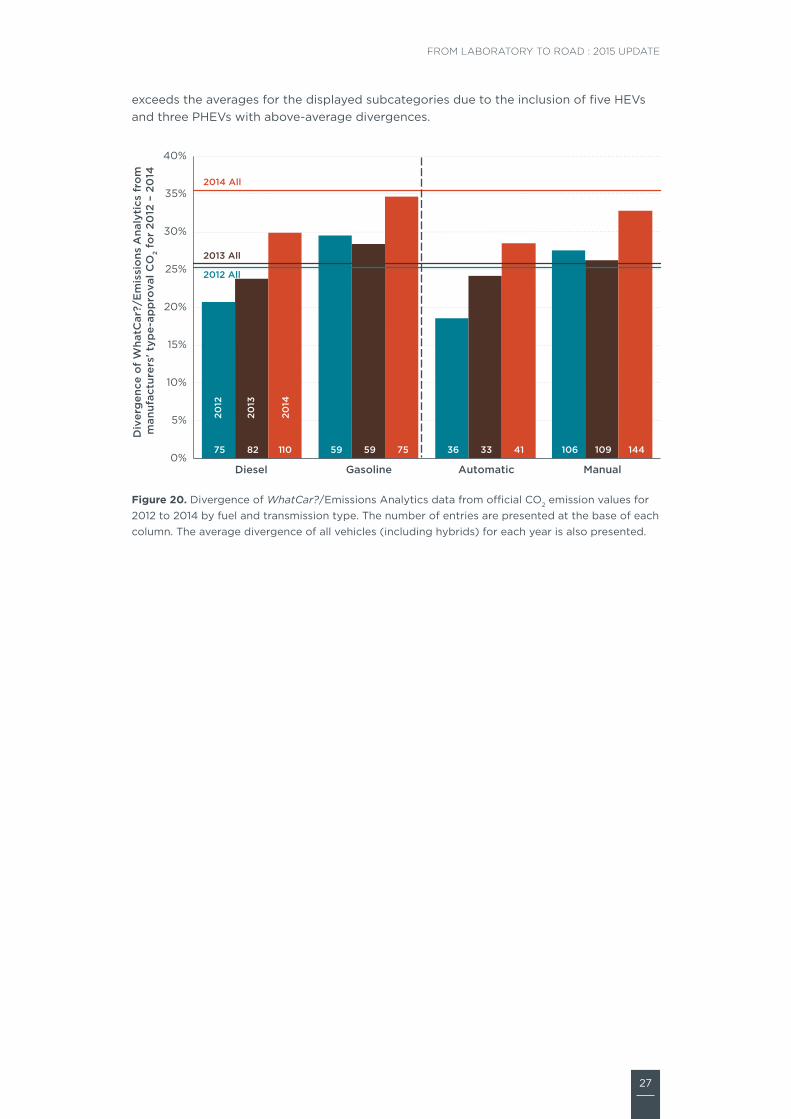
Resultsfigure 19 presents the annual divergence between 2012 and 2014, delineated by fuel and transmission type. the divergence between real-world and official co2 emissions in-creased from 25 percent in 2012 to 35 percent in 2014. more specifically, the divergence is higher for gasoline vehicles (35 percent in 2014) than for diesel vehicles (30 percent in 2014). Automatic transmission vehicles had a lower divergence at 28 percent compared to manual transmission vehicles with 33 percent. the 2014 average for all vehicles
33 http://www.whatcar.com/ 34 http://emissionsanalytics.com/ 35 whatcar?, true mpg—how we do it, http://www.whatcar.com/truempg/how-we-did-it
27
FROM LABORATORY TO ROAD : 2015 UpDATe
exceeds the averages for the displayed subcategories due to the inclusion of five hevs and three phevs with above-average divergences.
75 59 36 10682 59 33 109110 75 41 1440%
5%
10%
15%
20%
25%
30%
35%
40%
Diesel Gasoline Automatic Manual
Div
erg
ence
of
Wha
tCar
?/E
mis
sio
ns A
naly
tics
fro
m
man
ufac
ture
rs' t
ype-
app
rova
l CO
2 fo
r 20
12 –
20
14
2012 All
2013 All
2012
2013
2014
2014 All
Figure 20. divergence of WhatCar?/emissions Analytics data from official co2 emission values for 2012 to 2014 by fuel and transmission type. the number of entries are presented at the base of each column. the average divergence of all vehicles (including hybrids) for each year is also presented.
28
ICCT white paper
2.8. autO mOtOr unD spOrt (Germany)
Data type On-road, test route
Data availability 2003–2014, approximately 150 vehicles per year
Data collection fuel-consumption data, measured before and after test drives
Fleet structure, driving behavior
vehicles selected for testing by auto motor und sport; urban, extra-urban, and highway driving; professional drivers; adherence to speed limits, low engine speeds
Descriptionauto motor und sport36 is a german automobile magazine first published in 1946. the magazine publishes extensive car reviews and model comparisons including fuel con-sumption figures from on-road vehicle testing.
the driving pattern and test conditions are described as “representative of real-world driving but not extreme”37 and include driving on the german Autobahn, strong ac-celeration when overtaking other vehicles, uphill driving, rush-hour driving, use of the air conditioning, as well as driving with additional payload. the test results are published along with the official figures in the magazine’s vehicle tests.
Methodologydata on official and real-world fuel consumption were collected from the magazine’s vehicle tests. Annual estimates were calculated as the mean of the difference between auto motor und sport and type-approval values, expressed as a percentage of type-approval fuel consumption figures.
Resultsfigure 20 presents the annual divergence between auto motor und sport and official figures. the graph shows an increase from 21 percent in 2003 to 54 percent in 2014. diesel vehicles generally exhibit a larger divergence compared to gasoline vehicles. hybrid vehicles, including both hevs and phevs, only had a significant impact on the annual average in 2014, when a number of phevs were tested.
36 http://www.auto-motor-und-sport.de/ 37 http://www.auto-motor-und-sport.de/so-testet-auto-motor-und-sport-den-kraftstoffverbrauch-22-696942.html

29
FROM LABORATORY TO ROAD : 2015 UpDATe
0%
10%
20%
30%
40%
50%
60%
2000 2002 2004 2006 2008 2010 2012 2014
Div
erg
ence
of
auto
mo
tor
und
sp
ort
fro
m
man
ufac
ture
rs’ t
ype-
app
rova
l CO
2
Test year
All vehiclesAll vehicles (excl. hybrids)Diesel vehiclesGasoline vehicles
21%
54%
Diesel45%Gasoline
53%
Hybrid 2%
Figure 21. divergence of auto motor und sport data from manufacturers’ type-approval co2 emissions by fuel type (pie chart indicates the share of vehicles per fuel type in the data set for 2014).

30
ICCT white paper
2.9. autO mOtOr & spOrt (sweDen)
Data type On-road, test route
Data availability 2009–2014, approximately 90 vehicles per year
Data collection fuel consumption data, measured before and after test drives (250–350 km)
Fleet structure, driving behavior
vehicles selected for testing by auto motor & sport; speeds typically ranging from 30 to 120 km/h; vehicles driven in convoy during testing
Descriptionauto motor & sport38 is a swedish automobile magazine first published in 1995. As part of the magazine’s coverage of the vehicle market, auto motor & sport conducts vehicle tests that include measurements of on-road fuel consumption.
vehicles are tested on a number of different routes ranging from 250 to 350 km in distance and cover all typical speeds on swedish roads (30 to 120 km/h). when multiple vehicles are tested, cars are driven in a convoy so that the speed and acceleration profile is similar for all vehicles. in addition, drivers regularly switch vehicles to level out the impact of differences in driving styles. fuel consumption is estimated by filling up the fuel tank to its capacity before and after the test, ensuring that the vehicle is level during refueling. since auto motor & sport tests vehicles all year round, driving conditions and outdoor temperature vary between different tests.
Methodologyauto motor & sport provided real-world and official fuel consumption data for approxi-mately 600 vehicles tested between 2009 and 2014. the divergence was calculated as the difference between real-world and official values, expressed as a percentage of official fuel consumption figures.
Resultsfigure 21 shows the divergence between auto motor & sport and official fuel consump-tion figures. the divergence increased from 20 percent in 2009 to 38 percent in 2014, with hevs and phevs exhibiting significantly higher values than conventional combus-tion engine vehicles. gasoline vehicles typically had a higher divergence than diesel vehicles in the auto motor & sport dataset.
38 http://www.automotorsport.se/

31
FROM LABORATORY TO ROAD : 2015 UpDATe
0%
5%
10%
15%
20%
25%
30%
35%
40%
2000 2002 2004 2006 2008 2010 2012 2014 2016
Div
erg
ence
of
auto
mo
tor
& s
po
rt (
Swed
en)
fro
m m
anuf
actu
rers
’ typ
e-ap
pro
val C
O2
emis
sio
ns
Test year
All vehiclesAll vehicles (excl. hybrids)Gasoline vehiclesDiesel vehicles
38%
20%
Hybrid 5%
Diesel51%
Gasoline44%
Figure 22. divergence of auto motor & sport data from manufacturers’ type-approval co2 emissions by fuel type (the pie chart presents the share of vehicles per fuel type in the data set for 2014).

32
ICCT white paper
2.10. km77.COm (spain)
Data type On-road, test route
Data availability 2010–2014, approximately 45 vehicles per year
Data collection fuel consumption data, measured before and after a 500 km test drive
Fleet structure, driving behavior
vehicles with more than 52 kw of power and 170 km/h maximum speed; always the same driver
Descriptionkm77.com39 is a spanish website that offers car reviews and services targeted at consum-ers that are interested in purchasing a vehicle. km77.com has been publishing data about on-road fuel consumption and comparing vehicles for over 15 years. the data used in this report was collected from vehicle tests by Arturo de Andrés, a km77.com columnist and long-standing member of the car of the Year jury.
vehicles are tested on a route that covers approximately 500 km, which remained mostly unchanged over the years. the route mainly covers extra-urban driving comprised of motorways and high-speed country roads around the metropolitan area of madrid. the tests start and end at the same service area, where the vehicles’ tank is filled before and after each test to estimate total fuel consumption. the total distance traveled and the average speed is obtained by use of the global positioning system (gps). this data is used to estimate the average real-world fuel consumption.
All vehicles are driven by the same driver with a smooth driving pattern that promotes fuel efficiency. vehicles are driven at a specific average speed for each part of the route so that results are comparable for different vehicles. for this reason, the selected ve-hicles must have a minimum engine power of 52 kw and over 170 km/h maximum speed so that they can easily be driven at the same speeds. cars selected for testing typically have odometer readings between 2,000 and 10,000 km before testing commences. All non-essential onboard systems like air conditioning are switched off during testing.
Methodologythe available data from km77.com ranged from 2010 to 2014 and comprises gasoline and diesel combustion engine vehicles as well as hevs and phevs. data provided by km77.com included the test fuel consumption, while the official type-approval fuel consumption figures were retrieved from manufacturers’ websites and external data-bases. the annual divergence was calculated as the difference between real-world and official values, expressed as a percentage of official fuel consumption figures.
Resultsfigure 22 presents the development of the divergence between 2010 and 2014 classified by fuel. diesel vehicles comprise 67 percent of the analyzed data, which is representative of the spanish new vehicle market (Zacharof et al., 2015). the divergence increased from 37 percent in 2010 to 47 percent in 2014. this development is more pronounced for gasoline than for diesel cars. As evident from the effect of excluding hybrids from the annual average, hybrid vehicles exhibit a significantly higher divergence than conven-tional combustion engine cars.
39 http://www.km77.com/
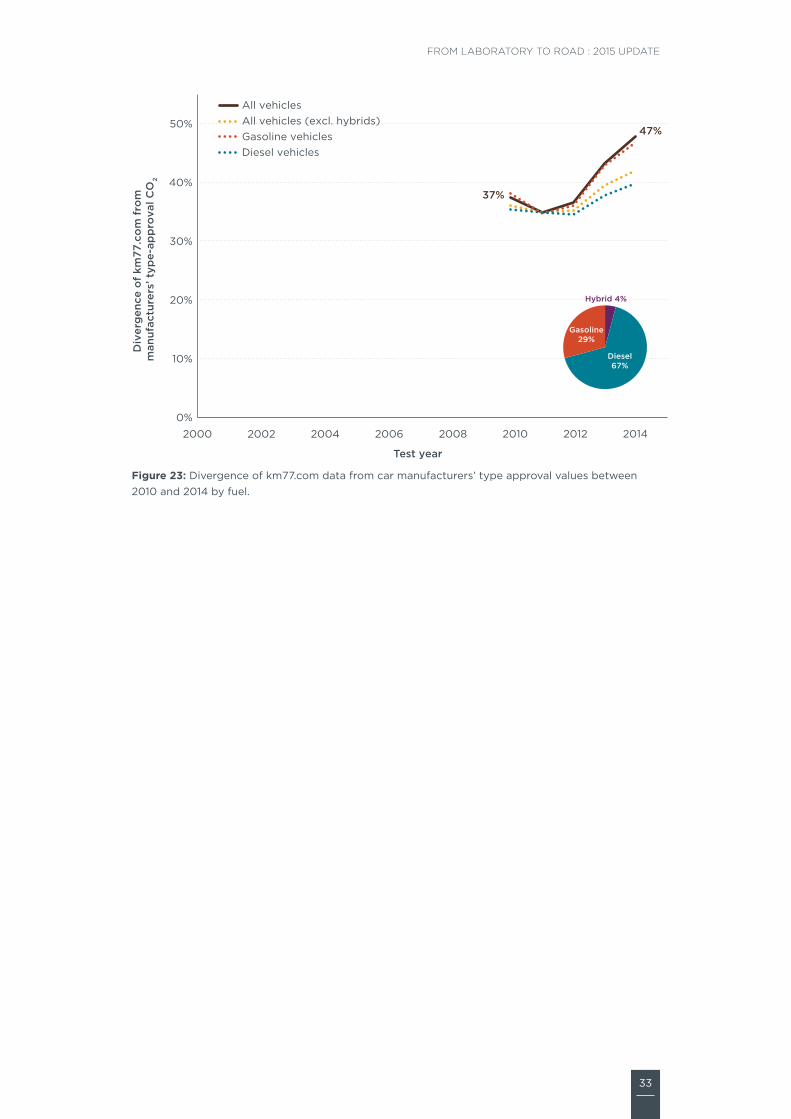
33
FROM LABORATORY TO ROAD : 2015 UpDATe
0%
10%
20%
30%
40%
50%
2000 2002 2004 2006 2008 2010 2012 2014
Div
erg
ence
of
km77
.co
m f
rom
m
anuf
actu
rers
’ typ
e-ap
pro
val C
O2
Test year
All vehiclesAll vehicles (excl. hybrids)Gasoline vehiclesDiesel vehicles
47%
37%
Hybrid 4%
Diesel67%
Gasoline29%
Figure 23: divergence of km77.com data from car manufacturers’ type approval values between 2010 and 2014 by fuel.
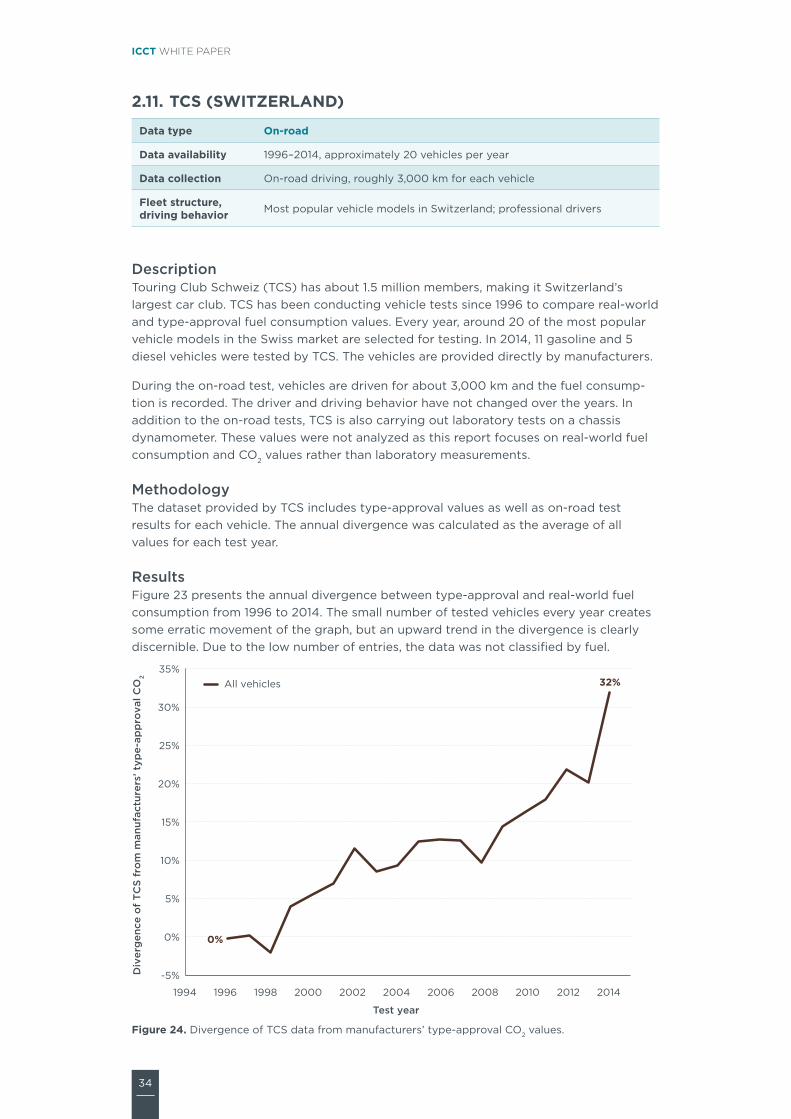
34
ICCT white paper
2.11. tCs (switzerlanD)
Data type On-road
Data availability 1996–2014, approximately 20 vehicles per year
Data collection on-road driving, roughly 3,000 km for each vehicle
Fleet structure, driving behavior most popular vehicle models in switzerland; professional drivers
Descriptiontouring club schweiz (tcs) has about 1.5 million members, making it switzerland’s largest car club. tcs has been conducting vehicle tests since 1996 to compare real-world and type-approval fuel consumption values. every year, around 20 of the most popular vehicle models in the swiss market are selected for testing. in 2014, 11 gasoline and 5 diesel vehicles were tested by tcs. the vehicles are provided directly by manufacturers.
during the on-road test, vehicles are driven for about 3,000 km and the fuel consump-tion is recorded. the driver and driving behavior have not changed over the years. in addition to the on-road tests, tcs is also carrying out laboratory tests on a chassis dynamometer. these values were not analyzed as this report focuses on real-world fuel consumption and co2 values rather than laboratory measurements.
Methodologythe dataset provided by tcs includes type-approval values as well as on-road test results for each vehicle. the annual divergence was calculated as the average of all values for each test year.
Resultsfigure 23 presents the annual divergence between type-approval and real-world fuel consumption from 1996 to 2014. the small number of tested vehicles every year creates some erratic movement of the graph, but an upward trend in the divergence is clearly discernible. due to the low number of entries, the data was not classified by fuel.
-5%
0%
5%
10%
15%
20%
25%
30%
35%
1994 1996 1998 2000 2002 2004 2006 2008 2010 2012 2014
Div
erg
ence
of
TC
S fr
om
man
ufac
ture
rs’ t
ype-
app
rova
l CO
2
Test year
All vehicles
0%
32%
Figure 24. divergence of tcs data from manufacturers’ type-approval co2 values.

35
FROM LABORATORY TO ROAD : 2015 UpDATe
3. dAtA compArison
table 1 summarizes the data sources used for the analyses in this report. in total, data for about 570,000 private and company vehicles from eleven data sources and six countries were included.
table 1. summary of data sources used for this report.
source Countrytotal
vehiclesvehicles per year
mostly company cars
Dating convention
spritmonitor.de germany 122,346 ~9,000 Build year
travelcard netherlands 245,594 ~25,000 X Build year
leaseplan germany ~135,000 ~15,000 X fleet year
honestjohn.co.uk u.K. 62,737 ~4,500 model year
Cleaner Car Contracts netherlands 3,001 ~600 X fleet year
autO bilD germany 2,312 ~280 test date
WhatCar?/emissions analytics
u.K. 477 ~200 test date
auto motor und sport germany 1,792 ~150 test date
auto motor & sport sweden 547 ~90 test date
km77.com spain 221 ~45 test date
tCs switzerland 348 ~20 test date
total — ~570,000 ~50,000 —
Annual average divergencefigure 24 shows the divergence between real-world and official co2 emission values for all data sources included in this report. All data sources show an unambiguous upward trend in the divergence over time: estimates of the divergence ranged from 6 to 8 percent in 2001, but increased to between 28 and 54 percent in 2014.
for private cars, the two data sources that rely on user input, spritmonitor.de and honestjohn.co.uk, show similar developments despite covering different countries. estimates of the divergence range from 8 percent in 2001 to between 32 and 37 percent in 2014. for data sources that rely on vehicle tests, the range of estimates is compara-tively large due to differing test procedures and smaller datasets. despite repeatable test procedures, the accuracy of vehicle tests may also vary due to fluctuations in traffic and weather conditions as well as imprecisions related to measuring fuel consumption based on filling the fuel tank to capacity. however, these inconsistencies were considered to be of minor import when comparing annual averages. while AUTO BILD and touring club schweiz generally provide more conservative estimates of the divergence, auto motor und sport (germany) and km77.com furnish higher estimates, most likely due to higher test speeds and more demanding driving. WhatCar? and auto motor & sport (sweden) provide more balanced estimates closer to spritmonitor.de and honestjohn.co.uk.
for company vehicles, the leaseplan and contracts for cleaner cars datasets deliver similar estimates for 2014, roughly 39 percent, despite focusing on different vehicle markets, namely germany and the netherlands. in contrast, travelcard exhibits a con-siderably higher divergence in recent years, which is most likely due to a higher share of hybrid electric vehicles, despite plug-in hybrid electric vehicles being excluded from the travelcard figures. on the whole, company cars showed a larger divergence than private cars, most likely due to a lower incentive to conserve fuel as employers generally cover fuel expenses as well as more demanding usage patterns.

36
ICCT white paper
0%
10%
20%
30%
40%
50%
60%
2001 2002 2003 2004 2005 2006 2007 2008 2009 2010 2011 2012 2013 2014Div
erg
ence
of
‘rea
l-w
orl
d’ f
rom
man
ufac
ture
rs’ t
ype-
app
rova
l CO
2
Build year / Fleet year / Model year / Test year
Travelcard (TC, NL)
auto motor und sport (D)
LeasePlan (LP, D)
honestjohn.co.uk (HJ, GB)
Spritmonitor.de (SM, D)
AUTO BILD (D)
WhatCar?/Emissions Analytics (WC, UK) Touring Club Schweiz (CH)
auto motor & sport (S)
km77.com (E)
Cleaner Car Contracts (CCC, NL)
Number of vehicles peryear perdata source:
SM
TCLP
HJ
CCC Vehicle tests
Figure 25. divergence of real-world from manufacturers’ type-approval co2 emissions for various on-road data sources.
Dating conventionsfour dating conventions were used in the different data sources (see table 1). while the test date was consistently used for data sources that rely on vehicle test drives, spritmoni-tor.de and travelcard employ the vehicle build year. for other company car sources, namely leaseplan and contracts for cleaner cars, data was generally provided for the entire fleet rather than individual build years. lastly, honestjohn.co.uk relies on the model year, i.e., the year a new model generation is introduced, to date vehicles. this method de-livers a less uniform distribution of entries compared to sources employing the build year, which accounts for some of the erratic movement of the honestjohn.co.uk estimate. while the use of differing dating conventions impedes like-for-like comparisons across individual years, the trends over time for each dataset are valid and the global trend of a growing divergence between real-world and official fuel consumption values is indisputable.
Central estimateA central estimate of the divergence between real-world and official co2 values was constructed by combining all data sources (see figure 25). this process involved calcu-lating the average divergence from all private car data sources, weighted by the number of entries in each data source. the same procedure was applied to company cars. phevs from the travelcard dataset were excluded in the central estimate, leading to a lower estimate for company cars compared to last year’s From Laboratory to Road report. the company and private car estimates were then combined with equal weights under the assumption that the european car market consists of both in equal parts. in view of the differing geographic coverage, dating conventions, and methods for determining real-world co2 emissions, the central estimate should be viewed as strong evidence of a growing divergence between real-world and official co2 emission values rather than a precise estimate thereof. it should also be noted that these estimates refer to newly registered vehicles — the average divergence of the fleet is lower due to the required time for fleet turnover.

37
FROM LABORATORY TO ROAD : 2015 UpDATe
0%
10%
20%
30%
40%
50%
60%
2001 2002 2003 2004 2005 2006 2007 2008 2009 2010 2011 2012 2013 2014
Div
erg
ence
of
‘rea
l-w
orl
d’ f
rom
man
ufac
ture
rs’ t
ype-
app
rova
l CO
2
Build year / Fleet year / Model year / Test year
n = approx. 0.6 million vehicles
40% (all data sources)
45% (company cars)
36% (private cars)
8%
auto motor und sport (D)
Travelcard (NL)km77.com (E)
auto motor & sport (S)
honestjohn.co.uk (GB)AUTO BILD (D)
Touring Club Schweiz (CH)
Figure 26. divergence between real-world and manufacturers’ type-approval co2 emissions for various real-world data sources, including average estimates for private cars, company cars, and all data sources.

38
ICCT white paper
4. discussion of results
this report brings together strong evidence that points to a growing divergence between real-world and type-approval co2 emissions values for new cars entering the european market. As the data sources differ in geographic coverage, fleet structure, timespan, dating convention, and method for measuring real-world co2 emissions, esti-mates of the divergence vary from source to source. however, the universal increase in the divergence estimates over time cannot be explained based on differences between the data sources. in fact, the variety of methods and data suggests that the upward trend is robust. while a precise definition of real-world driving is elusive, the sample of almost 600,000 cars from eleven sources and six countries indicates that the growing divergence is an eu-wide problem.
A common misconception is that the increase of the divergence is due to the reduction of type-approval co2 values over time, which makes any difference between real-world and type-approval values appear proportionally larger. to illustrate that this effect is small, figure 26 shows the development that would have occurred if the divergence had been a constant, absolute gap between real-world and type-approval emissions. the absolute difference was estimated by multiplying the spritmonitor.de average for 2001 with average type-approval emission values of new european cars in the same year, which yielded a difference of 15 g/km. if this absolute difference had remained constant while the type-approval co2 values were reduced from 178 g/km in 2001 to 123 g/km in 2014, the divergence would have increased from 8 to 12 percent. instead, the spritmonitor.de data indicates that the divergence increased to 37 percent. the reduc-tion in type-approval co2 emission values is thus not a main cause of the increase in the divergence between real-world and type-approval co2 emissions over time.
0%
5%
10%
15%
20%
25%
30%
35%
40%
2000 2002 2004 2006 2008 2010 2012 2014
Div
erg
ence
of
Spri
tmo
nito
r.de
fro
m
man
ufac
ture
rs’ t
ype-
app
rova
l CO
2
Build year
Spritmonitor.deobserved
Spritmonitor.deconstant gap of 15 g/km
8%
37%
12%
Figure 27. divergence observed in spritmonitor.de data compared with a hypothetical scenario where the divergence remained constant in absolute terms (15 g/km).
Another misconception is that the increase in the divergence over time is a result of driving behavior. figure 27 shows the divergence for different driving styles, including economical, balanced, and speedy driving based on self-reported user information
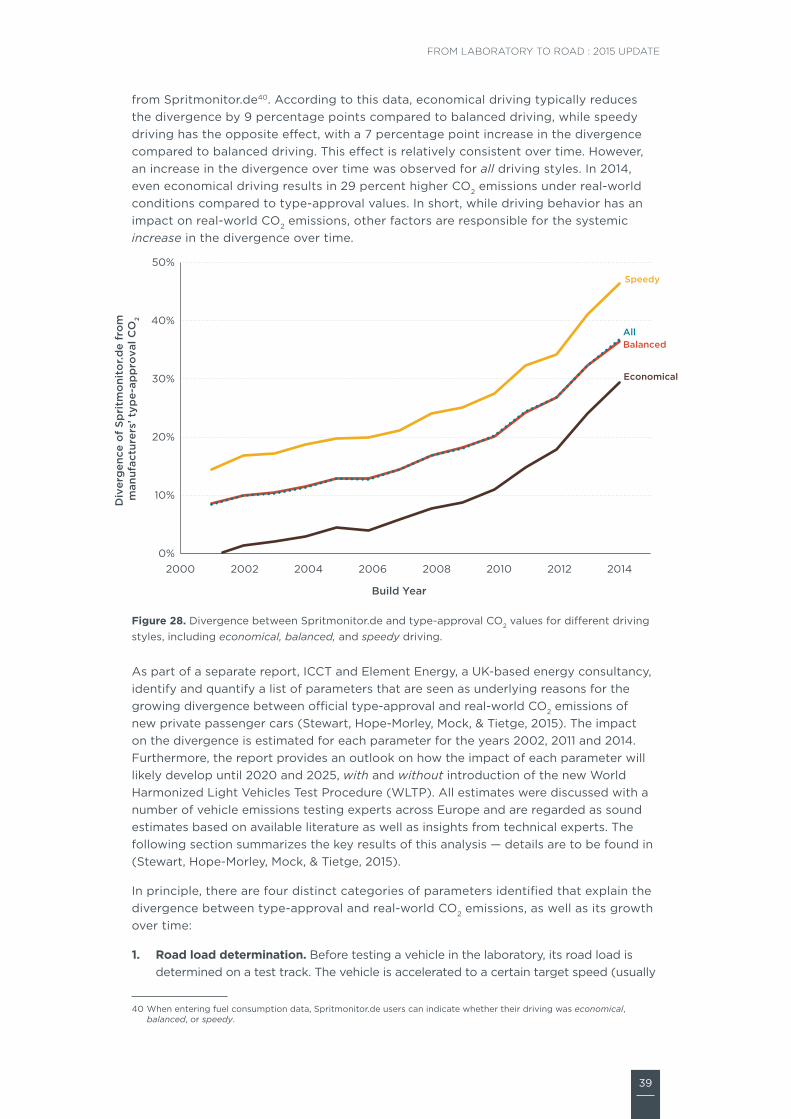
39
FROM LABORATORY TO ROAD : 2015 UpDATe
from spritmonitor.de40. According to this data, economical driving typically reduces the divergence by 9 percentage points compared to balanced driving, while speedy driving has the opposite effect, with a 7 percentage point increase in the divergence compared to balanced driving. this effect is relatively consistent over time. however, an increase in the divergence over time was observed for all driving styles. in 2014, even economical driving results in 29 percent higher co2 emissions under real-world conditions compared to type-approval values. in short, while driving behavior has an impact on real-world co2 emissions, other factors are responsible for the systemic increase in the divergence over time.
Balanced
Economical
Speedy
All
0%
10%
20%
30%
40%
50%
2000 2002 2004 2006 2008 2010 2012 2014
Div
erg
ence
of
Spri
tmo
nito
r.de
fro
m
man
ufac
ture
rs’ t
ype-
app
rova
l CO
2
Build Year
Figure 28. divergence between spritmonitor.de and type-approval co2 values for different driving styles, including economical, balanced, and speedy driving.
As part of a separate report, icct and element energy, a uK-based energy consultancy, identify and quantify a list of parameters that are seen as underlying reasons for the growing divergence between official type-approval and real-world co2 emissions of new private passenger cars (stewart, hope-morley, mock, & tietge, 2015). the impact on the divergence is estimated for each parameter for the years 2002, 2011 and 2014. furthermore, the report provides an outlook on how the impact of each parameter will likely develop until 2020 and 2025, with and without introduction of the new world harmonized light vehicles test procedure (wltp). All estimates were discussed with a number of vehicle emissions testing experts across europe and are regarded as sound estimates based on available literature as well as insights from technical experts. the following section summarizes the key results of this analysis — details are to be found in (stewart, hope-morley, mock, & tietge, 2015).
in principle, there are four distinct categories of parameters identified that explain the divergence between type-approval and real-world co2 emissions, as well as its growth over time:
1. road load determination. Before testing a vehicle in the laboratory, its road load is determined on a test track. the vehicle is accelerated to a certain target speed (usually
40 when entering fuel consumption data, spritmonitor.de users can indicate whether their driving was economical, balanced, or speedy.

40
ICCT white paper
around 120 km/h), then put into neutral and allowed to coast until its speed drops to another specified level, while measuring environmental conditions, performance, speed, etc. Based on these measurements, the vehicle’s aerodynamic resistance and rolling resistance are determined — the so-called road load coefficients. these coefficients are then used as input variables for emissions testing in the laboratory — where the wheels of the vehicle are spinning but the vehicle itself is stationary — to simulate the vehicle road load. there are a number of aspects of this road load determination procedure that offer vehicle manufacturers potential for exploiting tolerances and flexibilities. these include tire selection and preparation, selection of the test track, ambient test conditions, and pre-conditioning of the vehicle, among others. it appears likely that, as a result of the increasing pressure to achieve low co2 emission values during the type-approval test, vehicle manufacturers have been increasingly exploiting flexibilities in the road load determination procedure, so that by 2014 around one quarter of the divergence observed is explained by this aspect. for comparison, in 2002, flexibilities in the road load determination procedure were not yet exploited to a significant extent.
2. Chassis dynamometer testing. Both for the nedc and wltp, testing takes place in a controlled laboratory environment on a chassis dynamometer. there are a number of tolerances and flexibilities in the regulated procedures for chassis dynamometer testing that can potentially be exploited by vehicle manufacturers. these include break-in periods for the test vehicle, tolerances regarding laboratory instruments, the state of charge of the vehicle’s battery, special test driving techniques, and use of pre-series parts that are not representative of production vehicles. there has always been a difference between chassis dynamometer testing and real-world driving, also explaining part of the divergence in 2002. however, vehicle manufacturers have found ways to optimize chassis dynamometer type-approval testing over time, which at the same time made it less representative of average real-world driving conditions. As a result, the impact of chassis dynamometer testing flexibilities on the divergence between type-approval and real-world co2 emissions today explains more than half of the overall divergence observed.
3. technology deployment. there are a number of vehicle technologies that, on average, are more effective at reducing co2 emissions during laboratory type-ap-proval testing than under real-world driving conditions. examples include stop-start and hybrid technologies, automatic transmissions, and gasoline combustion engines that make use of direct injection and downsizing. in 2002, the market shares of these technologies were still very low, so their impact on the divergence between type-approval and real-world co2 emissions was negligible. now they explain about a tenth of the observed divergence.
4. Other factors. Auxiliary devices, such as air conditioning units and entertainment systems, increase fuel consumption during real-world driving. nonetheless, these de-vices are either switched off or not fully taken into account during the type-approval emissions test, leading to unrealistically low co2 emission values. Air conditioning had some impact on the divergence between type-approval and real-world co2 emission levels in 2002, and the impact is estimated to have remained relatively constant over time. other auxiliary devices in the vehicle are estimated to have an increasing impact on the observed divergence. finally, the driving behavior of consumers is different from the test cycle. however, the impact of driver’s behavior on the observed divergence is considered to be comparably minor and to be largely constant over time (see also figure 27).
figure 28 summarizes the estimated impact of each of the individual parameters, as well as the four above-mentioned categories (road load determination, chassis dynamometer testing, technology deployment, and other parameters). the left side of the graph shows

41
FROM LABORATORY TO ROAD : 2015 UpDATe
the estimated historical development from 2002 until 2014. As there are interaction effects between some parameters, the individual estimates are not summed up, but instead multi-plied in order to deliver an overall estimate. using this bottom-up approach, the divergence between type-approval and real-world co2 emission levels is found to have increased from around 10 percent in 2002 to about 35 percent by 2014. this closely matches the divergence levels observed from top-down, i.e. real-world, on-road data for private cars (see section 3).
~10%
~24%
~35%
~49%
future scenario historical development
~23%
~31%
Road load determinationChassis dynamometer testingTechnology deploymentOther parameters
2002NEDC
2010NEDC
2014NEDC
2020NEDC
2020WLTP
2025WLTP
Div
erg
ence
‘rea
l-w
orl
d’ v
s. o
ffici
al C
O2
50%
40%
30%
20%
10%
0%
~1~100% %
~24~24%%
~35~35%%
~2~233% %
~~331% 1%
Road load deChassis dynaTechnologyOther param
Figure 29: estimate of the reasons for the divergence between type-approval and real-world co2 emission levels for new passenger cars in the past as well as in the future, with and without introduction of the wltp (for details, see stewart, hope-morley, mock, & tietge, 2015).
for the future, the divergence is anticipated to grow further. By 2020, should the current nedc test procedure still be in use, real-world co2 emission levels of private new cars would be about 50 percent higher than suggested by type-approval results. some of this further increase is expected to be due to further exploitation of flexibilities in the road load determination and chassis dynamometer testing procedures. furthermore, an increasing market share of hybrid and especially plug-in hybrid vehicles will likely also contribute to a higher divergence41. with the introduction of wltp, it is estimated that the overall level of divergence would drop to about 23 percent by 2020. this would be considerably lower compared to keeping the nedc in place until 2020 (about 49 percent).
however, the wltp itself will probably introduce new “loopholes”, which will not be fully understood until its deployment. examples include new alternative methods for deter-mining road load factors and a potentially increasing use of eco-driving modes during type-approval testing under wltp. furthermore, the impact of phevs is anticipated to grow even more in the future. despite the fact that these future developments are dif-ficult to quantify, even with introduction of the wltp, the divergence level is estimated to increase to about 31 percent in 2025.
41 for the analysis, an eight percent market share of phevs for 2020 was provided as external input data by the client (the uK committee on climate change).
42
ICCT white paper
5. policy implicAtions
After the eu introduced a mandatory co2 regulation for passenger cars, type-approval co2 emission values decreased significantly: the rate of reduction increased from 1 percent per year before 2008 to 4 percent per year after 2008. in 2014, average co2 emission values of new cars reached 123 g/km (Zacharof et al., 2015), outperforming the 130 g/km target for 2015 by a considerable margin. however, this success story is tarnished by the growing divergence between these type-approval values and emission values observed in real-world driving. the growing divergence has implications for all key transport stakeholders:
from a government’s perspective, the growing divergence may undermine the efficacy of vehicle taxation schemes. most eu member states use type-approval co2 emission values to determine vehicle taxes. As the divergence grows over time, governments experience an increasing loss in tax revenues. similarly, vehicles that benefit from low-carbon vehicle incentives may not deliver the desired performance under real-world conditions, leading to a misallocation of public funds. in last year’s From Laboratory to Road report, the tax loss was estimated to amount to approximately €3.4 billion per year for the netherlands. other countries with lower vehicle taxes may still incur substantial tax deficits. for example, germany was expected to lose as much as €290 million per year in ownership tax revenues from new vehicles42. Actual tax losses are considerably higher, since ownership taxes are levied on all vehicles, not only new cars.
from a customer’s perspective, manufacturers’ proclaimed fuel savings and reductions in fuel expenses may not materialize under real-world conditions. the unexpected fuel expenses amount to approximately €450 per year for an average vehicle owner (mock, tietge et al., 2014). this additional fuel cost may also undermine consumer trust in fuel consumption values and fuel-saving technologies.
from a societal perspective, the growing divergence weakens efforts to mitigate climate change and to reduce oil imports to the eu. figure 29 and figure 30 show the development of real-world co2 emissions based on the spritmonitor.de estimates and contrast them with the development of type-approval values. while type-approval figures indicate that a significant reduction of co2 emission values has been achieved, from 170 g/km in 2001 to 123 g/km in 2014 (a 27 percent reduction), real-world adjust-ments yield a much smaller reduction, from 184 g/km in 2001 to 168 g/km in 2014 (an 8 percent reduction).
42 estimate based on the divergence observed in spritmonitor.de data in 2014, a tax rate of €2 for each gram of co2 above 95 g/km, and a new vehicle market size of approximately 3 million cars per year.
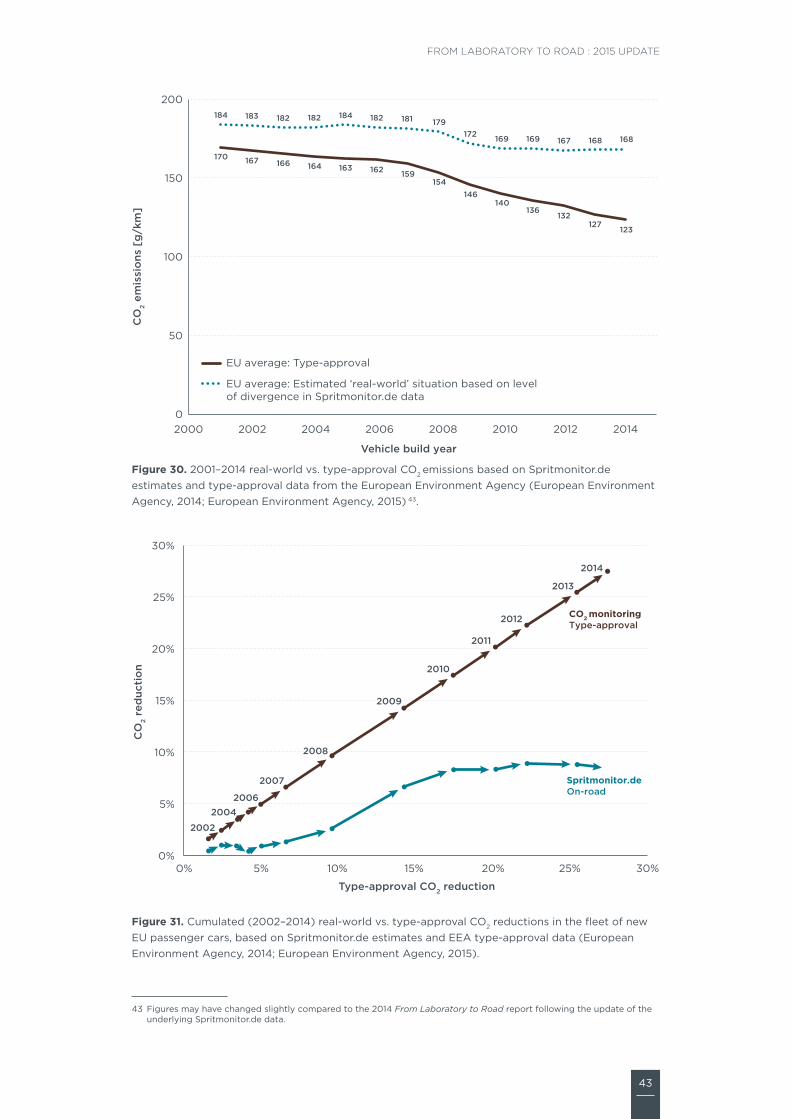
43
FROM LABORATORY TO ROAD : 2015 UpDATe
170 167 166 164 163 162 159154
146140
136132
127123
184 183 182 182 184 182 181 179172 169 169 167 168 168
0
50
100
150
200
2000 2002 2004 2006 2008 2010 2012 2014
CO
2 em
issi
ons
[g
/km
]
Vehicle build year
EU average: Type-approval
EU average: Estimated ‘real-world’ situation based on levelof divergence in Spritmonitor.de data
Figure 30. 2001–2014 real-world vs. type-approval co2 emissions based on spritmonitor.de estimates and type-approval data from the european environment Agency (european environment Agency, 2014; european environment Agency, 2015) 43.
0%
5%
10%
15%
20%
25%
30%
0% 5% 10% 15% 20% 25% 30%
CO
2 re
duc
tio
n
Type-approval CO2 reduction
Spritmonitor.deOn-road
CO2 monitoringType-approval
2012
2008
2006
2002
2009
2010
2007
2004
2013
2011
2014
Figure 31. cumulated (2002–2014) real-world vs. type-approval co2 reductions in the fleet of new eu passenger cars, based on spritmonitor.de estimates and eeA type-approval data (european environment Agency, 2014; european environment Agency, 2015).
43 figures may have changed slightly compared to the 2014 From Laboratory to Road report following the update of the underlying spritmonitor.de data.

44
ICCT white paper
from a manufacturer’s point of view, reducing co2 emissions on paper rather than in reality may constitute the most cost-effective pathway in the short term. however, the growing gap may undermine public confidence in the long run. similarly, regulators may question the accuracy and representativeness of type-approval co2 values. individual car manufacturers now face a dilemma: any car manufacturer reporting more representa-tive co2 values runs the risk of being penalized by the eu regulations and by reduced consumer demand, particularly if other car manufacturers continue to report increas-ingly unrealistic values (see figure 31 for a comparison of vehicle brands in terms of divergence and type-approval co2 emission values). improved vehicle emission testing schemes and more stringent enforcement of regulations will help to create a more level playing field for car manufacturers.
Audi
Audi
BMW
BMW
Citroën
Citroën
Fiat
Fiat
Ford
Ford
Mercedes-Benz
Mercedes-Benz
Opel
Opel
Peugeot
Peugeot
Renault
Renault
Toyota
Toyota
VW
VW
MARKET AVERAGE
MARKET AVERAGE
0%
5%
10%
15%
20%
25%
30%
35%
40%
45%
50%
55%
100 120 140 160 180 200 220
Div
erg
ence
of
Spri
tmo
nito
r.de
fro
m
man
ufac
ture
rs’ t
ype-
app
rova
l CO
2
Manufacturers’ type-approval CO2 emissions [g/km]
2014 situation
2001 situation
Figure 32. type-approval co2 emission values and the corresponding divergence from spritmonitor.de for selected brands/manufacturers in 2001 and 2014.
the nedc test procedure was not originally designed to measure fuel consumption or co2 emissions. in addition, it includes a number of tolerances and flexibilities that can be exploited to produce unrealistically low co2 emission values. the new wltp will help to reduce these tolerances and flexibilities and to align the test procedure more closely with the real-world experience of the average consumer. it is therefore in the interest of all stakeholders to introduce the wltp in the eu by 2017, as intended by the european commission (mock, 2013). in this context, it is also important to accurately convert current nedc-based co2 fleet targets into wltp targets. As a previous analysis shows, the 2020/21 target of 95 g/km co2 in nedc would equal 100–102 g/km co2 in the wltp (mock, Kühlwein et al., 2014). Allowing for a higher conversion factor would essentially reward the exploitation of unintended flexibilities in the nedc and would thereby risk undermining the efficacy of introducing the wltp.
while the wltp will be an improvement over current testing conditions, it will not resolve all known issues and will itself most likely introduce new loopholes that could be exploited over time (see section 4). consequently, further measures are needed to ensure that type-approval values provide a representative indication of real-world co2
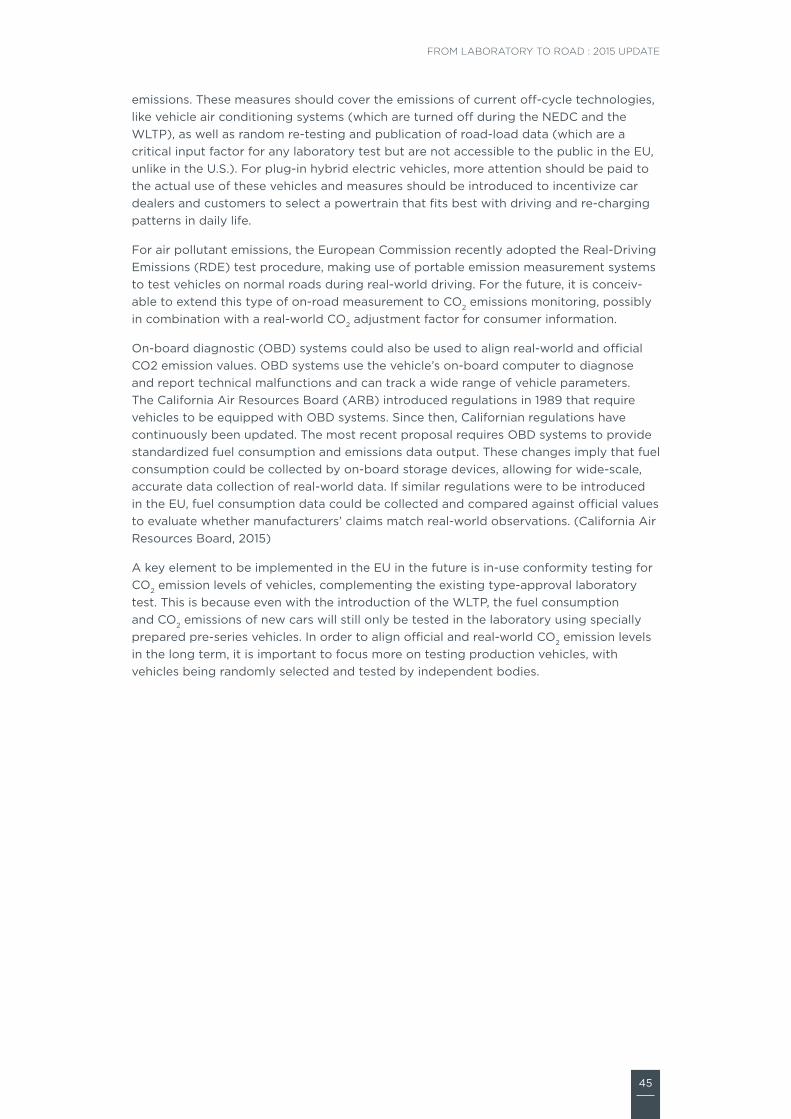
45
FROM LABORATORY TO ROAD : 2015 UpDATe
emissions. these measures should cover the emissions of current off-cycle technologies, like vehicle air conditioning systems (which are turned off during the nedc and the wltp), as well as random re-testing and publication of road-load data (which are a critical input factor for any laboratory test but are not accessible to the public in the eu, unlike in the u.s.). for plug-in hybrid electric vehicles, more attention should be paid to the actual use of these vehicles and measures should be introduced to incentivize car dealers and customers to select a powertrain that fits best with driving and re-charging patterns in daily life.
for air pollutant emissions, the european commission recently adopted the real-driving emissions (rde) test procedure, making use of portable emission measurement systems to test vehicles on normal roads during real-world driving. for the future, it is conceiv-able to extend this type of on-road measurement to co2 emissions monitoring, possibly in combination with a real-world co2 adjustment factor for consumer information.
on-board diagnostic (oBd) systems could also be used to align real-world and official co2 emission values. oBd systems use the vehicle’s on-board computer to diagnose and report technical malfunctions and can track a wide range of vehicle parameters. the california Air resources Board (ArB) introduced regulations in 1989 that require vehicles to be equipped with oBd systems. since then, californian regulations have continuously been updated. the most recent proposal requires oBd systems to provide standardized fuel consumption and emissions data output. these changes imply that fuel consumption could be collected by on-board storage devices, allowing for wide-scale, accurate data collection of real-world data. if similar regulations were to be introduced in the eu, fuel consumption data could be collected and compared against official values to evaluate whether manufacturers’ claims match real-world observations. (california Air resources Board, 2015)
A key element to be implemented in the eu in the future is in-use conformity testing for co2 emission levels of vehicles, complementing the existing type-approval laboratory test. this is because even with the introduction of the wltp, the fuel consumption and co2 emissions of new cars will still only be tested in the laboratory using specially prepared pre-series vehicles. in order to align official and real-world co2 emission levels in the long term, it is important to focus more on testing production vehicles, with vehicles being randomly selected and tested by independent bodies.

46
ICCT white paper
references
california Air resources Board. 2015. technical status and proposed revisions to on-board diagnostic system requirements and associated enforcement provisions for passenger cars, light-duty trucks, and medium-duty vehicles and engines (oBdii). http://www.arb.ca.gov/regact/2015/obdii2015/obdii2015isor.pdf
european environment Agency. (2014). monitoring co2 emissions from passenger cars and vans in 2013. http://www.eea.europa.eu/publications/monitoring-co2-emissions-from-passenger
european environment Agency. (2015). new cars’ co2 emissions well below europe’s 2015 target. http://www.eea.europa.eu/highlights/new-cars2019-co2-emissions-well
european commission. (2011). roadmap for moving to a competitive low carbon econ-omy in 2050. Brussels: european commission. http://eur-lex.europa.eu/legal-content/en/tXt/?uri=celeX:52011dc0112
mock, p. (2013). world-harmonized light-duty vehicles test procedure. washington, dc: international council on clean transportation. http://www.theicct.org/wltp-november2013-update
mock, p (ed.). (2014). european vehicle market statistics, 2014. http://www.theicct.org/european-vehicle-market-statistics-2014
mock, p., german, J., Bandivadekar, A., and riemersma, i. (2012). discrepancies between type-approval and “real-world” fuel consumption and co2 values: Assessment for 2001–2011 european passenger cars. washington, dc: international council on clean transportation. http://www.theicct.org/fuel-consumption-discrepancies
mock, p., german, J., Bandivadekar, A., riemersma, i., ligterink, n., & lambrecht, u. (2013). from laboratory to road: A comparison of official and “real-world” fuel con-sumption and co2 values for cars in europe and the united states. washington, dc: international council on clean transportation. http://www.theicct.org/laboratory-road
mock, p., tietge, u., franco, v., german, J., Bandivadekar, A., ligterink, n., lambrecht, u., Kühlwein, J., & riemersma, i. (2014). from laboratory to road: A 2014 update. http://www.theicct.org/laboratory-road-2014-update
mock, p., Kühlwein, J., tietge, u., franco, v., Bandivadekar, A., & german, J. (2014). the wltp: how a new test procedure for cars will affect fuel consumption values in the eu. http://www.theicct.org/wltp-how-new-test-procedure-cars-will-affect-fuel-consumption-values-eu
ross, s. m. (2003). peirce’s criterion for the elimination of suspect experimental data. Journal of Engineering Technology, 20(2), 38-41.
stewart, A., hope-morley, A., mock, p., tietge, u. (2015). Quantifying the impact of real-world driving on total co2 emissions from uK cars and vans. project report for the uK committee on climate change. https://www.theccc.org.uk/publication/impact-of-real-world-driving-emissions/
summerton, p., pollitt, h., Billington, s., ward, t., hill, n., Kollamthodi, s., et al. (2013). fueling europe’s future: how auto innovation leads to eu jobs. http://www.camecon.com/energyenvironment/energyenvironmenteurope/fuellingeuropesfuture.aspx
Zacharof, n., mock, p., tietge, u. (2015). co2 emissions from new passenger cars in the eu: car manufacturers’ performance in 2014. http://www.theicct.org/co2-new-cars-eu-manufacturer-performance-2014


BeiJing Berlin Brussels sAn frAncisco wAshington
www.theicct.org