from “made in china” to “innovated in china”: necessity ... · necessity, prospect, and...
TRANSCRIPT

NBER WORKING PAPER SERIES
FROM “MADE IN CHINA” TO “INNOVATED IN CHINA”:NECESSITY, PROSPECT, AND CHALLENGES
Shang-Jin WeiZhuan Xie
Xiaobo Zhang
Working Paper 22854http://www.nber.org/papers/w22854
NATIONAL BUREAU OF ECONOMIC RESEARCH1050 Massachusetts Avenue
Cambridge, MA 02138November 2016
We thank Journal of Economic Perspectives editors Gordon Hanson, Enrico Moretti, and especially Timothy Taylor for very helpful comments and suggestions. We are also grateful for comments received at seminars/conferences held in Hong Kong Baptist University, New York University, University of Michigan, and University of Western Australia, and support from the Natural Science Foundation of China (Approval number 71350002), National Science Foundation (Approval number 7675172) and the key research base of China Ministry of Education (14JJD790027). We thank Lea Sumulong and Joy Glazener for excellent editorial assistance and Lintong Lin for outstanding research assistance. The paper represents the personal views of the authors, and not necessarily those of the institutions with which they are affiliated, nor of the National Bureau of Economic Research.
NBER working papers are circulated for discussion and comment purposes. They have not been peer-reviewed or been subject to the review by the NBER Board of Directors that accompanies official NBER publications.
© 2016 by Shang-Jin Wei, Zhuan Xie, and Xiaobo Zhang. All rights reserved. Short sections of text, not to exceed two paragraphs, may be quoted without explicit permission provided that full credit, including © notice, is given to the source.

From “Made in China” to “Innovated in China”: Necessity, Prospect, and ChallengesShang-Jin Wei, Zhuan Xie, and Xiaobo ZhangNBER Working Paper No. 22854November 2016JEL No. O1,O3,O4,O53
ABSTRACT
After more than three decades of high growth that was based on an exploration of its low-wage advantage and a relatively favorable demographic pattern in combination with market-oriented reforms and openness to the world economy, China is at a crossroad with a much higher wage and a shrinking work force. Future growth by necessity would have to depend more on its ability to generate productivity increase, and domestic innovation will be an important part of it. In this paper, we assess the likelihood that China can make the necessary transition. Using data on expenditure on research and development, and patent applications, receipts, and citations, we show that the Chinese economy has become increasingly innovative. In terms of drivers of innovation growth, we find that embracing expanded market opportunities in the world economy and responding to rising labor costs are two leading contributing factors. On the other hand, we find evidence of resource misallocation in the innovation area: while state-owned firms receive more subsidies, private firms exhibit more innovation results. Innovation can presumably progress even faster if resource misallocation can be tackled.
Shang-Jin WeiGraduate School of BusinessColumbia UniversityUris Hall 6193022 BroadwayNew York, NY 10027-6902and [email protected]
Zhuan XieState Administration of Foreign Exchange (SAFE)P.R [email protected]
Xiaobo ZhangNational School of DevelopmentPeking UniversityandInternational Food Policy Research Institute2033 K Street, NWWashington, DC [email protected]
A data appendix is available at http://www.nber.org/data-appendix/w22854

2
1. Introduction
From 1980–2015, China’s economy grew at an average annual rate of 8.7 percent. During
these 35 years, real per capita income increased by a cumulative rate of 1759 percent, from $714
in 1980 to $13,277 in 2015 (based on the IMF’s World Economic Outlook data, expressed in
2011 international purchasing power parity dollars). Apart from Equatorial Guinea, a country of
less than a million people that literally struck oil, no other economy grew as much during the
same period. China’s growth performance is clearly spectacular and exceptional.
But China’s economy has reached a crossroad. The annual growth rate has slowed to
about 6–7 percent since 2013 and will likely moderate further. Part of the reason for the
slowdown could be cyclical, a result of a relatively weak world economy. But a major part of the
reason is structural and fundamental. China’s economic growth of the previous three and a half
decades was based on several key factors: a sequence of market-oriented institutional reforms,
including openness to international trade and direct investment, combined with low wages and a
favorable demographic structure. Chinese wages are now higher than a majority of non-OECD
economies. For example, China’s wages are almost three times as high as India, an economy
with almost the same-sized labor force. The Chinese working age cohort has been shrinking
since 2012.
The first section of this paper will review what factors have propelled China’s economic
growth in the past, and explain why they are unlikely to provide the same kind of boost going
forward.
Future growth in China has to come mostly from the growth of labor productivity. Since
China’s investment-to-GDP ratio was already a remarkable 43.3 percent in 2015, it is hard to
expect a high growth rate of productivity from continued physical investment. Indeed, Bai and
Zhang (2014) estimated that the returns to investment have shown signs of decline since 2008.
Some productivity increase could come from reducing resource misallocation (Hsieh and
Klenow 2009), which could be accomplished by further reforms in the factor and product
markets, including reforms of state-owned enterprises. However, the pace of reform in the future
is unlikely to be as aggressive as in the past, partly because interest groups across China now
have more means to block reforms than in the past and partly because the low-hanging fruit in
the area of institutional reforms has been picked. Thus, productivity growth from this source also
faces a limit.
Since the onset of the global financial crisis in 2008, the external demand for Chinese
products has weakened, and wages in Chinese have meanwhile increased faster than almost all
other major economies. A growth model based on exploiting the use of cheaper labor is no
longer viable. While a strict family planning policy implemented since the early 1980s once
produced an unnaturally low birth rate and therefore an unusually favorable dependence ratio for
China, the same force has now produced relatively few people entering the labor force today
relative to the new retirees, hence yielding an unusually unfavorable dependence ratio.
Facing rising labor costs and weak external demand, China’s firms have to make a tough
choice: in, out, up, or down. “In” is to move factories to inland areas where the wage is lower

3
than coastal China. Given the pace of convergence within the country and the cost of logistics
facing firms in the inland, this is at best a temporary strategy. “Out” means engaging in outbound
direct investment, combining Chinese know-how with low wages in other countries. “Up” means
innovation and upgrading, so that the firms no longer need to depend on low-paying unskilled
labor. “Down” means closing the business; it is an option for individual firms, but not for the
country as a whole. While a portfolio of these strategies will be employed by firms, a decisive
factor for China’s economic future is whether its firms can innovate and upgrade and how fast
they can do so. In the next section, we focus on innovation and quality upgrading, and ask the
question: is China investing enough and wisely in research and development, and can it
transition to a more innovative economy?
We study three questions in particular. First, how strong is China’s national investment in
research and development (R&D)? We do so by comparing the Chinese trajectory in recent years
with international experiences.
Second, what is the growth of innovation by Chinese firms? To answer this question, we
make use of data on patents from China State Intellectual Property Office (SIPO), the United
States Patent and Trademark Office (USPTO), and World Intellectual Property Office (WIPO).
We use the data on patents to compare China’s rate of innovation as compared to other BRICS
(that is, Brazil, Russia, India, and South Africa) economies and high-income economies (such as
the United States, Germany, Japan, and the Republic of Korea). We will use patent applications
and patents granted by firms both at home and in the United States as proxy for innovative
activities. China’s performance on innovative activities as measured by patent data has been
strong, especially in recent years, but China may well have some lessons to learn from India and
in particular from the Republic of Korea. We will argue that rising wages and expanding markets
are among the important drivers behind China’s patent explosion.
Third, because the Chinese economy continues to have a non-trivial share of state-owned
enterprises, we investigate possible resource misallocation in the innovation space. Although
state-owned enterprises have received more subsidies from the government, their performance in
innovation is lackluster compared to private enterprises. Furthermore, the elasticity of patent
filing or patents granted with respect to expenditures on research and development is
significantly higher for private sector firms than for state-owned enterprises. We interpret these
data patterns as existence of misallocations in public fiscal resources. Interestingly, we find that
China’s state-owned enterprises often face higher realized tax burdens (the sum of corporate
income tax and value added tax as a share of sales or value added). Leveling the playing fields
for firms across all ownership, with simultaneous reductions in discretionary subsidies and taxes,
would improve resource allocation.
2. Sources of China’s Growth since 1980 and the Moderation of Growth since 2012
China’s rapid growth in the past several decades has been driven by a combination of two
sets of factors: a) market-oriented policy reforms to let market-determined output prices and
4
factor prices replace administrative prices, to introduce and strengthen property rights, and to
reduce barriers to international trade and investment; and b) economic fundamentals, including
in particular a favorable demographic structure and a low initial level of labor cost. Here, we
offer an overview of these factors and how they have evolved in the last 36 years.
The Chinese growth miracle started with the rural sector reform known as the “rural
household responsibility system” in the early 1980s. Instead of collective farming and selling all
output to a national procurement plan at a price set by the plan (usually substantially below the
would-be market price), farmers were granted land user rights and allowed to sell what they
produced in excess of the official quota at a market price. Agricultural production and rural
incomes witnessed a dramatic increase in the ensuing years (Lin 1992). In a few years, hundreds
of millions of farmers were released from their land and many started to work in factories,
providing the nonfarm sector with a seemingly unlimited labor supply. In the 1980s, China’s
labor cost was among the lowest in developing countries, lower than in India and the Philippines
and indeed lower than 114 out of 138 non-OECD economies. The vast majority of these workers
were restricted to living in rural areas by the hukou system, with many working during the 1980s
for township and village-owned enterprises, which were manufacturing firms located in rural
areas. These enterprises provided a way for a reallocation of labor from low-productivity farm
activities to higher-productivity manufacturing activities, at a time before restrictions on internal
migrations were relaxed.
During the 1990s, the government launched reforms of township and village enterprises
and of the state-owned enterprise sector. Most of the township and village enterprises were
privatized, de jure or de facto. By 2011, the township and village enterprise sector had almost
disappeared, with employment plummeting from 129 million in 1995 to merely 6 million in 2011
(Xu and Zhang 2009). Among state-owned enterprises, which were overwhelmingly in urban
areas, employment fell by about half from 113 million in 1995 to 67 million in 2011. The
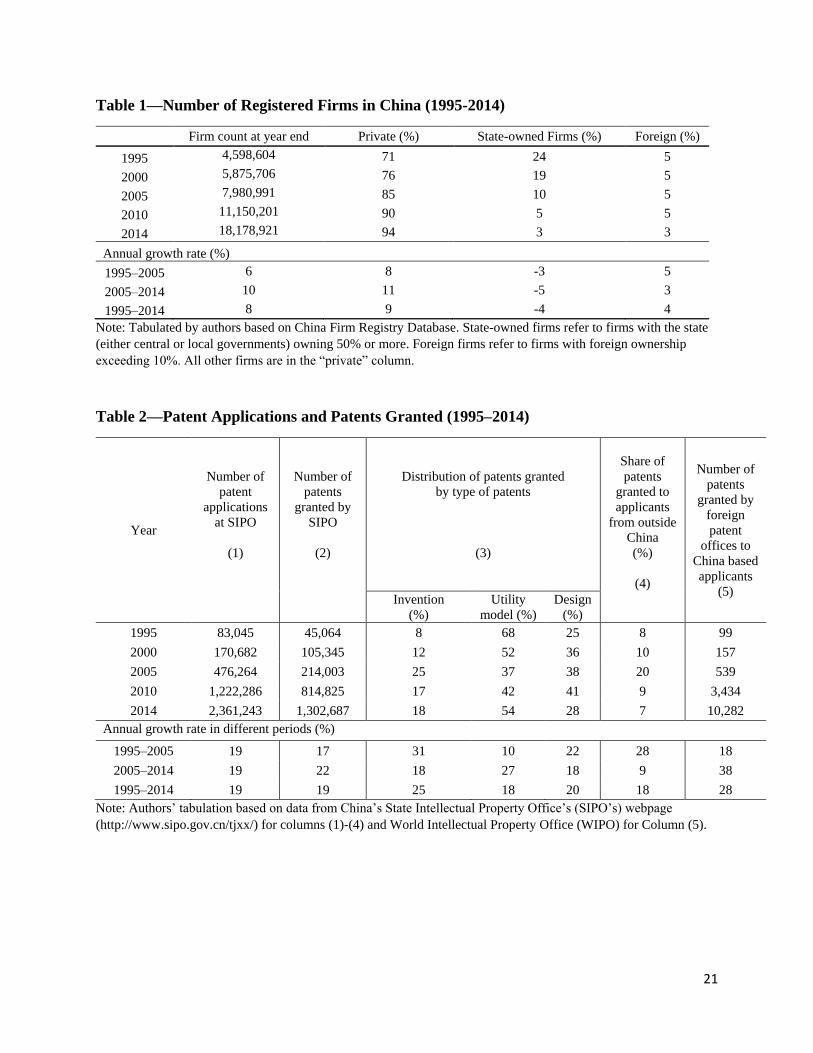
number of state-owned firms declined from 1,084,433 (or 24 percent of the total number of
firms) in 1995 to 521,503 (or 3 percent of the total) in 2014 (according to our tabulations based
on the China Firm Registry database in Table 1). The much larger drop in the number of state-
owned enterprises than in their employment was part of a deliberate policy of “grasping the large
and letting go of the small”—that is, privatizing small state-owned enterprises and consolidating
bigger ones (Hsieh and Song 2015).
The reform was painful in the short run, in that tens of millions of urban workers had to
leave their former state-owned employers. Remarkably, the country avoided a big spike in the
unemployment rate. The key is that the de facto privatization was accompanied by aggressive
reforms to lower entry barriers faced by private sector entrepreneurs. The inefficiency of the
previous centrally planned, state-dominated economic system, together with very high barriers to
entry, meant huge unexplored or under-explored profitable opportunities. As a result, almost all
of the lost jobs in township and village enterprises and state-owned enterprises were offset by
new job opportunities in the dynamic private sector. The number of private enterprises increased
by nearly five-fold to about 17 million in the period 1995–2014, as shown in Table 1. By 2011,
5
193 million people worked in private enterprises (including self-employed) (CNBS 2012). This
represents the largest de facto privatization program in the world history in terms of the number
of workers who move from state-sector to private sector employment, and one that was done
without massive unemployment.
Through this period, the growth in the Chinese economy has become driven
overwhelmingly by the growth in the private sector aided by an expansion in the number of
entrepreneurs. This pattern is especially true for the manufacturing sector, which has been
growing faster than either the agricultural or service sectors. Indeed, Wei and Zhang (2011b)
have documented two “70 percent rules” using manufacturing firm census data in 1994 and
2005: First, approximately 70 percent of the growth in industrial value-added came from private
sector firms between these two census years. Second, approximately 70 percent of private sector
growth in value-added came from growth in the count of new private sector firms (the extensive
margin), while the remaining 30 percent came from growth of existing firms (the intensive
margin).
China also carried out a number of other reforms intended to incentivize local
governments to pursue growth-friendly policies. For example, under the fiscal arrangement
introduced in the early 1980s, local governments and the central government follow a pre-
determined revenue formula (though varying across regions as a function of local bargaining
power), which stimulates the incentives of local officials to create a more business-friendly
environment. More generally, in spite of the political centralization by the Communist Party, the
country has implemented a system of fiscal and economic decentralization that grants local
governments sufficient decision-making power—and more importantly incentives— to compete
with each other. Local economic growth rate is used as a key performance indicator for the
career advancement of officials. The delegation of economic policy authority to local
governments, which have better knowledge of local information, and competition for investment
and tax base among local governments in the Chinese style of federalism have provided a useful
check on the temptation of local government officials to expropriate local firms. As a result,
firms acquire some de facto security of property rights, even if the formal property rights
institutions are problematic (Qian and Weingast 1997; Xu 2011).
China’s government also set up numerous special economic zones and special
development zones in the coastal provinces to attract foreign direct investment in the 1980s and
1990s. These zones help the government to meet two challenges. First, public funding for
infrastructure was limited, especially in the early days of the reform era. The government was
able to concentrate limited public funding to provide adequate roads, power supply, waste
treatment and other infrastructure to the firms within the zones, even when it was not able to
improve the infrastructure nationally at the same speed. Second, policy reforms within these
zones were politically easier than doing the same things on a national scale. The success in these
zones in terms of economic growth, employment, and tax revenues in turn facilitated similar
market-oriented reforms outside the zones. Foreign direct investment rose rapidly in China,
especially since 1992, and these zones played an important role in attracting international firms.

6
Foreign-invested firms were and continue to be an important channel for transfer of technology
and management ideas from advanced economies to China.
China’s integration with the global economy was accelerated after the country joined the
World Trade Organization in December 2001. Foreign-invested firms have often accounted for
half of the country’s total exports. China’s trade expanded fast: While China’s GDP
approximately doubled once every seven years, its export value in US dollar terms doubled once
every four years. By 2004, China had come to be known as the World Factory, a label describing
not only the sheer volume of its cross-border trade, but also the breadth of its sector coverage (as
discussed in Feenstra and Wei 2010). China’s growth in both imports and exports, along with
foreign investment coming to the country, is also an important channel for domestic firms to
acquire technological knowhow.
While the deep cause of growth and development is institutional changes engendered by
policy reforms and embrace of globalization, the proximate drivers of economic growth include
improvement in productivity as a crucial component. The increase in productivity stems from
innovations within sectors and the reallocation of resources (mainly workers) from lower-
productivity to higher-productivity sectors, such as from the state sector to the private sector and
from the agricultural sector to non-agricultural sectors (Zhu 2012). Sectoral productivity and
structural change accounted for 42 and 17 percent of economic growth during 1978–1995 (Fan et
al. 2003).
For three decades following the start of market-oriented reforms, China appeared to have
an inexhaustible amount of “surplus labor” (which can be thought of as conceptually the same as
low productivity labor in rural areas). But signs of labor shortage started to emerge in the first
decade of the 2000s. According to Cai and Du (2011) and Zhang et al. (2011), wages for
unskilled workers showed double digit growth starting in 2003-2004. The exact timing of a sharp
increase in the wage rate of unskilled workers is subject to debate. Wang et al. (2011) report a
turning point as early as 2000. On the other hand, Knight et al. (2011) and Golley and Meng
(2011), for example, point out that barriers to internal migration, especially a rigid household
registration system that prevents rural households from moving freely to urban areas, imply
additional scope for rural-to-urban migration if and when the remaining barriers can be
dismantled. In any case, China is a low-wage country no more.
Two features of demographic transition have also been a powerful driver of China’s
growth in the past three and a half decades. The first feature is a favorable dependence ratio.
China’s sharp decline in fertility rate has meant fewer young dependents to support for a given
size of the working cohort. The fraction of prime-age population in total population rose steadily
for three decades, creating an unusually large demographic dividend, which in turn contributed
to economic growth (Cai and Wang 2008; Wei 2015).
The second feature of demography that affects growth is the gender ratio imbalance of
the pre-marital cohort. This less-studied factor may have a quantitatively significant effect as
well. The one-child policy has yielded an unintended consequence in distorting the sex ratio in
7
favor of boys. As the one-child generation enters the marriageable age, young men face a very
competitive marriage market. In order to attract potential brides, families with sons choose to
work harder, save more, and take on more risks, including exhibiting a higher propensity to be
entrepreneurs (Wei and Zhang 2011a and 2011b; Chang and Zhang 2015; Wei, Zhang, and Liu
2016). It is estimated that increasing marriage market competition due to sex ratio imbalances
has contributed to about two percentage points of economic growth per year (Wei and Zhang
2011b).
It is important to point out that the additional growth due to an unbalanced sex ratio is of
an immiserizing type: social welfare is likely to have become lower even though the GDP
growth accelerated. The logic is explained in Wei and Zhang (2011b): the extra work effort and
extra risk-taking that produce a higher GDP growth rate are motivated by a desire to improve
one’s chance (or one’s children’s chance) of success in the marriage market. Yet the fraction of
young men who will not get married in the aggregate is determined by the sex ratio, and not by
the economy-wide work effort, risk-taking, or GDP growth rate. In this sense, the extra work
effort and risk-taking are futile; households collectively would have been willing to give up this
part of income growth in exchange for no sex ratio imbalance.
Thus, from 1980 to 2011, China was experiencing a relatively low wage, a large work
force with a favorable dependency ratio, and an increasingly unbalanced sex ratio in the pre-
marital cohort. But starting in 2011, China’s age cohort of 15–60 started to shrink in absolute
size. Policy changes to postpone the official retirement age or to encourage more female labor
force participation will at best moderate the resulting decline in the work force. Because the
female labor force participation was very high under the central planning regime before the
1980s, higher than most non-Communist countries in the world, such as the United States, Japan,
Germany, India, and Indonesia, the participation rate of women in the labor force has in fact
come down over time. The recent relaxation of the family planning policy in November 2015
from the limit of one child per couple to two children per couple, while motivated to improve the
demographic pattern for the economy, will make the dependency ratio worse for the next decade-
and-a-half rather than better by adding to the number of children, without altering the size of the
work force. After all, no couple can produce a 16-year old right away (Wei 2015). The sex ratio
at birth has started to become less unbalanced in 2009, and the contribution to growth from an
unbalanced sex ratio will become weaker over time.1
3. Evolution of the Aggregate Productivity
To see how the growth of physical capital, human capital (work force adjusted for
average years of schooling), and total factor productivity each contributes to China’s GDP
growth, we perform a simple decomposition based on an aggregate production function
1 Beside a moderation of growth since 2012, China has to deal with challenges associated with income inequality, regional disparity, environmental degradation, and corruption. For perspectives on these challenges, see Fan, Kanbur, Wei, and Zhang, 2014.
8
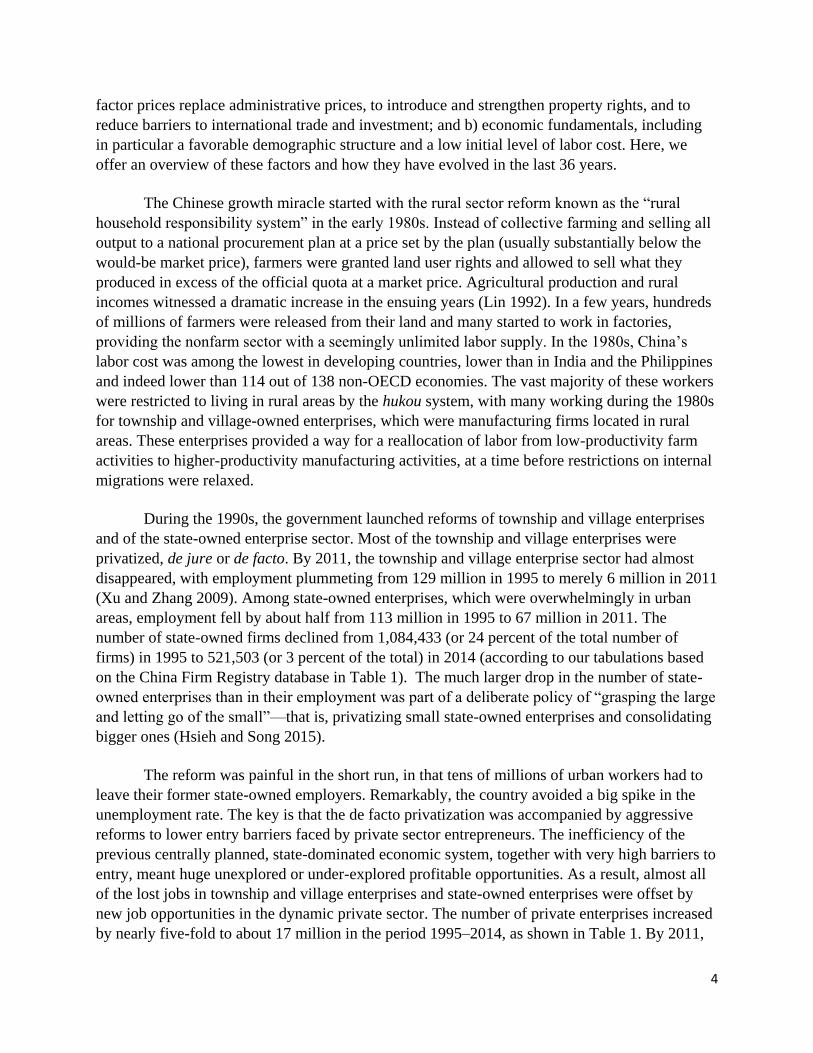
approach.2 Figure 1 summarizes the result. A few features are worth noting. First, investment in
physical capital has always been important for China’s growth, accounting for 67.9 percent on
average throughout this period. The relative share of contribution from physical investment
increased to 107 percent after 2009, which resulted from the government stimulus package in
response to the global financial crisis. Second, the contribution from the growth of human capital
has been positive, at 12.5 percent during 1999-2008 and 16 percent during 2009-2015. Because
of the outsized role of physical investment in the Chinese economy, the contribution of human
capital is smaller than what one typically finds from growth decomposition for an OECD
economy. Third, the growth of total factor productivity was a major contributor to GDP growth
before 2008, often accounting for 20 percent or more to the total growth. (An exception was the
period of 1989-1991, a time of domestic political turbulence and international sanctions).
Strikingly, the contributions from the growth of total factor productivity have turned
persistently negative since 2009.3 Upon reflection, this is perhaps not overly surprising. The
Chinese government’s response to the global financial crisis that started in 2008 was to
encourage physical investment through an aggressive fiscal (and bank lending) program, but
there were no ambitious structural reforms pursued during this period that could have raised
aggregate efficiency, and yet GDP growth started to moderate after 2012—and this combination
is a recipe for negative growth in total factor productivity.
The Chinese economy is at a crossroads. Structural factors in the form of less favorable
demographics and a higher cost of labor imply a lower potential growth rate. To achieve robust
future growth, raising the growth of total factor productivity is a must.
One way to raise future productivity growth is to pursue more structural reforms. These
include removing barriers to labor mobility from rural to urban areas (the hukou system) and
leveling uneven access to bank loans by firms of different ownership. Another way to raise
productivity growth is via innovation. Innovation can take the form of creating new products,
new ways of using existing products, new designs, new processes for producing existing
products that are more efficient and cost-effective, new ways of organizing business, and new
ways of branding and marketing the products or services.
Can China transition from a world assembly line to an innovation powerhouse? It’s easy
to list reasons to be skeptical. There is no shortage of news stories of intellectual property rights
violations by Chinese companies4. There is criticism that the Chinese school system puts too
much weight on rote learning and not enough on creative and critical thinking. On the other
2 The computation method and data sources are explained in online Appendix A, available with this paper at http://e-jep.org. 3 The baseline calculation assumes a capital income share of 0.50. We vary the share from 0.4 and 0.55 and find that the broad pattern of the evolution of total factor productivity stays the same. Our finding is broadly consistent with Wu (2014). For example, he reported negative total factor productivity from 2007 to 2012, while our estimate indicates such a decline from 2009 to 2014. One difference between Wu and our growth decomposition is that he obtains a larger contribution from human capital, which may be related to the way the schooling adjustment is made. 4 Fang, Lerner, and Wu (2016) provide evidence that regional variations in the strength of intellectual property rights protection in China are correlated with propensity to innovate for privatized formally state-owned firms.
9
hand, more optimistic examples are available, too. Tencent, the company that provides the
popular communication tool, WeChat, which combines group chat, voice calls, video sharing,
and financial exchanges, is generally regarded as among the most innovative internet companies
in the world. Huawei, the telecom equipment producer, is said to take out more patents a year
than either Apple or Cisco. The world’s first quantum satellite was launched by China in August
2016. To address whether such examples of innovation are exceptions or the norm, we offer a
systematic look at the data in the next section.
It is hard to quantify with precision the relative contributions to total factor productivity
growth from different sources. From the China Statistical Yearbook on Science and Technology,
we compute and compare investment made by firms in the survey in (a) importing and digesting
foreign technologies, (b) buying and digesting technologies from other domestic firms, and (c)
developing their own in-house technological improvement. In 2000, the survey firms collectively
spent nearly 20 percent of their technology improvement budget on importing and digesting
foreign technology, about 2 percent on buying technologies from other domestic sources, and 78
percent on developing their own in-house technological improvement. Over time, the share of
the first item declines, whereas the last two items expand. By 2014, the survey firms collectively
spent 11 percent of their technological improvement budget on importing and digesting
international technologies, about 5 percent on buying technologies from domestic sources, and
the remaining 84 percent on developing their own in-house technological advancement, both
reflecting a significant increase over the shares in 2000 (see Appendix Figure A1). These
numbers indicate in an indirect way the improvement in the domestic innovation capacity in
China’s manufacturing sector.
4. Research and Development: Investment and People
Innovative leaders at both the corporate and national levels tend to invest heavily in
research and development. The United States, Japan and Germany, the largest three rich
economies, invested more than 2.7 percent of their GDP in research and development in 2014,
which is almost 50 percent more than an average OECD country (about 1.9 percent in 2014), and
about three times as much as most developing countries. If China makes the transition to a more
innovative economy, it needs to make a commitment to research and investment spending as
well.
In 1991, when systematic data on this subject started to be collected, China invested 0.7
percent of GDP in research and development. This was much lower than technological leaders
like the United States, Japan, and Germany, but not out of line with big developing economies
such as India, Brazil or South Africa. Indeed, because China’s competitiveness at this time was
based on exploiting its vast cheap labor and making use of technologies developed elsewhere,
domestic research and development and innovation were not an imperative at this time.
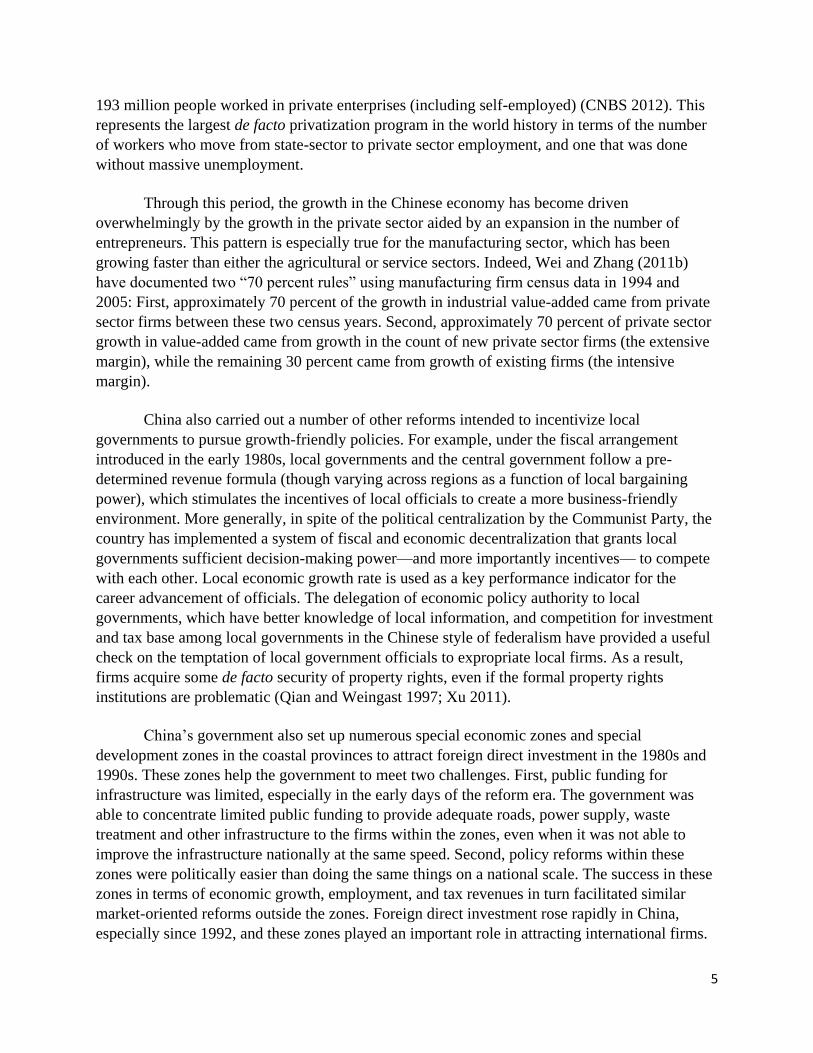
A comparison of research and development spending between China and other
economies is provided in Figure 2. For all countries in the world other than China, we plot
research and development expenditure as a share of GDP in the latest possible year (which is

10
2014 for most countries). Clearly, higher-income countries tend to have a higher ratio of research
and development spending to GDP. For China, we plot the same ratio using corresponding data
for China from 1995 to 2014. By 2010, China has reached the median value of research and
development as a share of GDP. By 2012, its spending had caught up with the OECD average (at
1.88 percent of GDP in that year) even though China’s income level was still less than one fifth
of the OECD average. By 2014, China’s research and development spending had reached 2.05
percent of GDP. From an aggregate spending viewpoint, China is an overachiever.
Another indicator of innovation effort is the share of researchers in the population. In
1996, China had 443 researchers per million people. In comparison, the shares for the United
States, Japan, and Korea were 3,122, 4,947, and 2,211 per million, respectively. The Chinese
ratio in 1996 was comparable to Brazil (420 per million in 2000) and better than India (153 per
million in 1996), though much lower than Russia (3,796 per million in 1996). By 2014, the
share in China had grown to 1,113 researchers per million population.5 Because China’s research
and development expenditure has grown faster than the number of researchers, research and
development expenditure per researcher has grown over time as well.
5. The Pace of Innovation as Measured by Growth in Patents
Not all dimensions of innovation are equally well measured. The output of innovation can
take the form of patents, commercial secrets, improvement in business processes or business
models and others. Innovation can also take place in areas outside the commercial space, such as
culture. Since innovation in the form of patents is relatively well measured, we will pay special
attention to patents by firms.. Our conjecture is that innovation across all dimensions is
positively correlated.6
The number of Chinese patents has exploded: Table 2 presents some summary statistics.
The number of patent applications filed in China’s State Intellectual Property Office (SIPO)
rocketed from 83,045 in 1995 to more than 2.3 million in 2014, at an annual growth rate of 19
percent (column 1). In 2011, China overtook the United States as the country with the most
patent filings in the world that year (based on data from WIPO).
What explains the explosion of Chinese patents? Could it be easy approval or low-quality
of patents in China? Some straightforward comparisons across countries suggest that neither is a
likely explanation.
5 For more cross-country comparisons, see Appendix Figure A2, available with this paper at http://e-
jep.org.
6 A simple regression of firm level total factor productivity, estimated using the Olley-Pakes method
based on data from the Annual Survey of Manufacturing Firms, on the cumulative number of patents
yields a positive slope coefficient. In other words, firm-level total factor productivity and the stock of
patents are positively correlated. Fang, He, and Li (2016) also show a positive association between firm
level total factor productivity and patent count. They interpret it as patent innovation raising productivity;
such an interpretation would need an instrumental variable approach to back it up.

11
One simple metric for judging ease of patent approval is the ratio of the number of
patents granted in year t to the number of patent applications in year t-1, which we will call the
patent approval rate. Based on data from the World Intellectual Property Organization, the patent
approval rate in China in recent years is 30-40 percent, which is essentially in the middle of the
approval rates across countries. For example, the Chinese approval rate is higher than those in
India and Brazil, which are close to 20 percent, but lower than those in the United States and
Korea, which are in the range of 50-60 percent. Therefore, the Chinese patent approval ratio
does not seem to be unusually high.
Among the three types of patents (invention, utility model, and design), the fraction of
approved invention patents, arguably the most technically intensive category, rose from 8 percent
in 1995 to 18 percent in 2014 (Column 2 of Table 2). In 2005, patents granted to foreign
applicants accounted for more than 20 percent of China’s total approved patents, but dropped to
7 percent in 2014, suggesting an increasing role of indigenous innovations in the Chinese
economy since 2005. As Table 2 shows, both total Chinese patents filing and approvals show a
rapid growth.7
One way to consider the quality of Chinese patents is to examine patents applied by and
granted to Chinese firms in other countries. As noted earlier, the rate of patents approved by
China’s patent office grew at an annual rate of 19 percent from 1995 to 2014. During that period,
the number of patents granted to Chinese applicants by patent offices in developed countries was
rising even faster at 28 percent per year (see last column in Table 2).
Of particular interest is a comparison of the number of patents granted by the US Patent
and Trademark Office (USPTO) to Chinese firms with those to firms from other countries. As
shown in Table 3, the number of patents granted by the USPTO to Chinese corporate applicants
rose from 62 in 1995 to 7,236 in 2014. The annual growth rate was 21 percent in the first half of
the period (1995-2005) but accelerated to 38 percent a year during the latter half of the period
(2005-2014). Of the comparison countries—Brazil, Russia, India, South Africa, German, Japan,
and Korea—only India had a similar rate of growth in corporate patents in the United States.
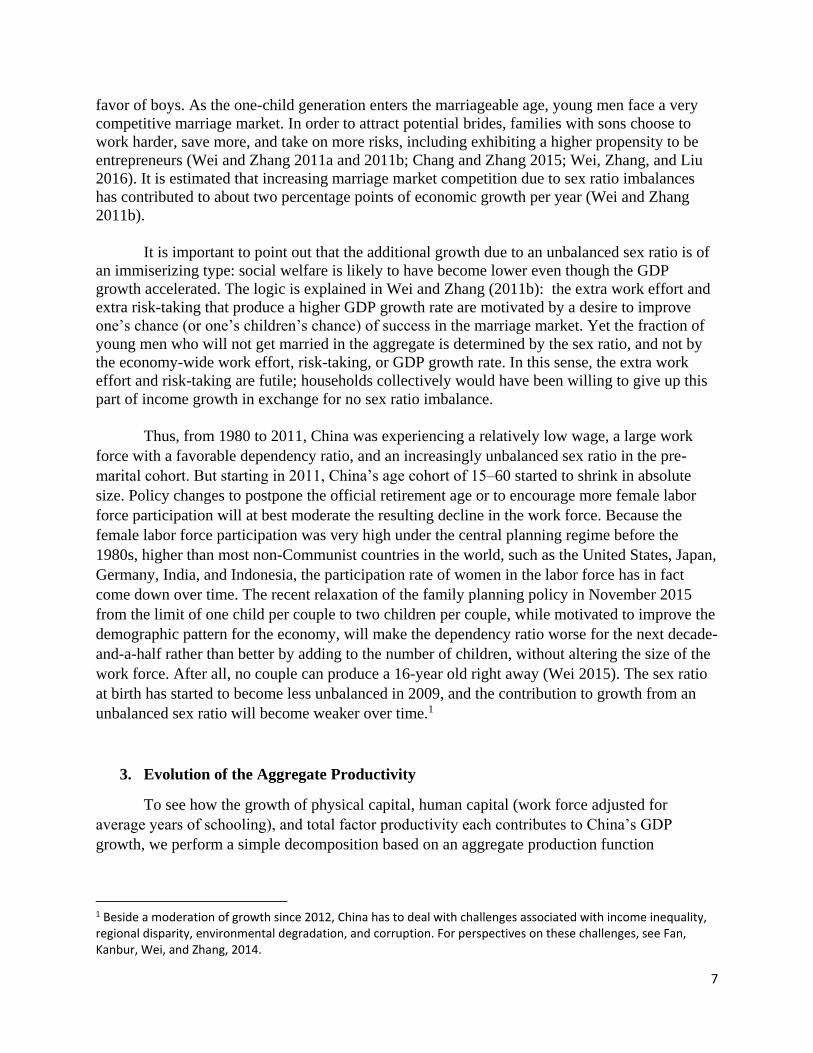
Two natural adjustments are to consider a country’s population size and income level. To
this end, we run cross-country regressions with log number of patents granted to applicants from
various comparison countries by the US Patent and Trademark Office as the dependent variable.
As explanatory variables, we use the log of population, squared log of population, and country x
year fixed effects. Figure 3 plots the estimated coefficients for the interaction term between
county and year fixed effects for selected counties. These coefficients can be interpreted as how
a given country does relative to the average international experience based on its population size.
China shows steady gains in patents even with these adjustments. Of the comparison countries,
7 The online appendix available with this paper at http://e-jep.org includes more detail on patent
data. For example, Appendix tables A2 and A3 provide more detail on Chinese patent filings and
approvals, while Appendix Figure 3 provides more details on cross-country comparisons of
patent approval rates.

12
India also shows gains over time after these adjustments, but Japan, Germany, the Republic of
Korea, Brazil, Russia, and South Africa do not. Overall, Chinese firms collectively do better in
their patent count than what the country’s population size and income level would have
suggested.8
One can also look at foreign citations of Chinese patents (granted by China’s State
Intellectual Property Office). The count of foreign citations of Chinese invention patents grew at
the rate of 33 percent a year during 1995-2005, but accelerated to 51 percent a year from 2005 to
2014. The growth of citations of Chinese utility model patents is similar, at 36 percent per year
during 1995-2014. After adjusting for population size and income, Chinese firms perform well.9
This pattern is consistent with international recognition of rising scientific and innovative ideas
out of China.
Overall, not only has the number of Chinese patents exploded, but a variety of
comparisons suggest that Chinese patent quality also exhibits a real and robust improvement
over time that is quite favorable relative to international experience. There is no reason to be
pessimistic about the intrinsic ability for Chinese firms to innovate.
6. Patterns of Innovation Growth
By looking at patterns of patents across different categories of industries, we can gain
insight into some of the factors as potential drivers of innovation, including the rise in relevant
market size, industrial competition, market size, and change in relative prices (such as rising
wages). We merge the Chinese patent database with the Annual Survey of Industrial Enterprises
in China (ASIEC). The ASIEC database covers all the state-owned enterprises and private firms
with sales exceeding 5 million yuan from 1998 to 2009, including ownership information.10 The
patent database contains all patents granted by China’s State Intellectual Property Office between
1985 and 2012. One pattern that emerges is that state-owned enterprises in general perform
worse than private firms in generating patents. During the period 1998–2009, the number of
patents granted to private firms in China grew by 35 percent per year, overtaking the number of
patents given to state-owned and foreign firms by a comfortable margin. The drop in the share of
patents by state-owned enterprises is partly due to the shrinkage of that sector, as described
8Details of the regressions are available in an online appendix available with this paper at http://e-jep.org. See
Appendix Table A5.
9 We perform cross country regressions similar to those described in Figure 3 with the forward citation of
Chinese firms’ patents by all patent applicants in the United States as the dependent variable. The
appendix table A5 provides more detail on the extent of forward citation across countries regression
analysis, and appendix Figure A4 shows the coefficients on the interaction term between country and year
fixed effects against log income. Overall, relative to a country’s population size and income level, the
Chinese firms do well in terms of forward citations of their patents. See also Xie and Zhang (2015) for an
analysis of the growth of patents in China.
10 While ASIEC data for 2010–2014 seem to be available on the gray market, the quality appears suspect. To be
conservative, we do not use these data in this paper.

13
earlier. In 1998, state-owned enterprises accounted for 30 percent of total firms in the ASIEC
database, while they dropped to 2 percent by 2009. Clearly, private firms have become the
engine of innovation in China.
Market size has been regarded as a key driver of innovation in the literature (Acemoglu
and Linn 2004). In other words, firms aiming at larger global markets should be more innovative.
In past decades, the Chinese economy has become increasingly integrated with the world
economy, in particular since China joined the World Trade Organization in 2001. In this data,
exporting firms in China are indeed more innovative than non-exporting firms.
Since 2003, real wages in China have grown by more than 10 percent a year. Some
reckon that China has passed the so-called “Lewis turning point,” which means that an era of
ultra-low-wage production is over (for example, Zhang et al. 2011). While patents are rising for
both capital- and labor-intensive firms, the fraction of patents granted to labor-intensive firms
increased from 55 percent in 1998 to 66 percent in 2009. Rising labor costs may have induced
labor-intensive sectors to come up with more innovations to substitute for labor.11
We can connect the discussions on total factor productivity and on innovation. We
separate all firms in the ASIEC sample into those with no patents during 1998-2007, those with a
cumulative patent count of 1-4 patents during the same period, and those with a cumulative count
of more than 4 patents. We compute the growth of total factor productivity for each individual
firm. We find that firm-level productivity tends to grow faster in the group that engages in more
innovation. This suggests that to reverse China’s negative levels of total factor productivity, it
would be helpful for China to facilitate conditions that expand both the number of firms that
engage in innovative activities and the intensity of innovation per innovating firm.
7. Misallocation of Innovation Resources
The innovation gap between China and leading advanced economies such as the United
States, Japan, and even Korea is still wide. On the list of 2015 Thomson Reuters’ Top 100
Global Innovators, Japanese and US firms lead the way, while no single Chinese firm makes the
list. More systematic data confirms the continued gap in innovation (Shen, Wang, and Whalley
2015). The numbers of US patents received by either Japanese, German, or Korean firms are still
more than twice as many as those obtained by Chinese firms in spite of their smaller population
size (as shown earlier in Table 3). Part of the gap reflects different stages of development: as we
have shown, both investment in R&D and innovation measured by patent count are strongly
11 The descriptions in these paragraphs are based on bivariate correlations, and as such, are of course only
suggestive. In order to evaluate the relative importance of these factors’ contributions to firm innovations in a more
rigorous manner, we run multivariate regressions using a hybrid binomial estimation method proposed by Allison
(2005). The details are available in the online Appendix B available with this paper at http://e-jep.org (see
Appendix Tables A7-A11). Overall, the findings confirm the importance of rising labor cost.
14
positively related to GDP per capita. However, another contributor to the gap could be resource
misallocation in the innovation space. We turn to this topic next.
Following China’s reforms in the late 1990s, the share of state-owned enterprises in total
firms dropped significantly from 24 percent 1995 to 3 percent in 2014, as discussed earlier.
However, most of the surviving state-owned enterprises are relatively big, and are in upstream
industries or strategically important sectors (Hsieh and Song 2015). They are typically subject to
less competition than private enterprises. Thus, China’s state-owned firms both absorb non-
trivial resources, including government subsidies, and still command non-trivial political
weights. Part of China’s move to becoming an innovative economy must be to improve the
efficiency of resource allocation between state-owned and private firms. China’s state-owned
firms continue to receive considerable financial support from the government, including access
to low-cost bank loans and research and development subsidies. In the aftermath of both the
1997 Asian financial crisis and the 2008 global financial crisis, the Chinese government
launched stimulus packages which often involved credit expansion and which disproportionately
went to state-owned enterprises. The more favorable policies and injection of massive stimulus
funds have reduced the returns to capital of state-owned enterprises since 2008 (Bai and Zhang
2014), caused a decline in their total factor productivity (Wu 2013), and provided a lifeline for
inefficient zombie firms (Tan et al. 2016). The returns to capital of state-owned enterprises are
much lower than their private counterparts (Hsieh and Song 2015). Moreover, state-owned
enterprises lagged behind private firms in total factor productivity (Brandt 2015). These patterns
suggest a misallocation of government support between state-owned and private enterprises.
Government subsidies for research and development can promote firm innovations in China (as
reviewed in Boeing 2016 and confirmed by our own firm-level regressions). Government
subsides can be defended on the ground that research and development by firms generate
positive externalities. Indeed, most advanced countries subsidize research and development as
well. The question is not whether subsidies can be justified at all, but rather whether China’s
allocation of such subsidies is consistent with economic efficiency.
Based on simple averages, it would appear that a greater fraction of state-controlled firms
are innovative (that is, they have patents) than domestic private sector firms. Indeed, some state-
controlled firms receive many patents in a year. But the simple averages are misleading both
because state-controlled firms are much larger on average (and larger firms tend to invest more
in research and development), and because they tend to receive more subsidies from various
levels of the government. Subsidies from local governments to local government-controlled
firms are especially noteworthy.
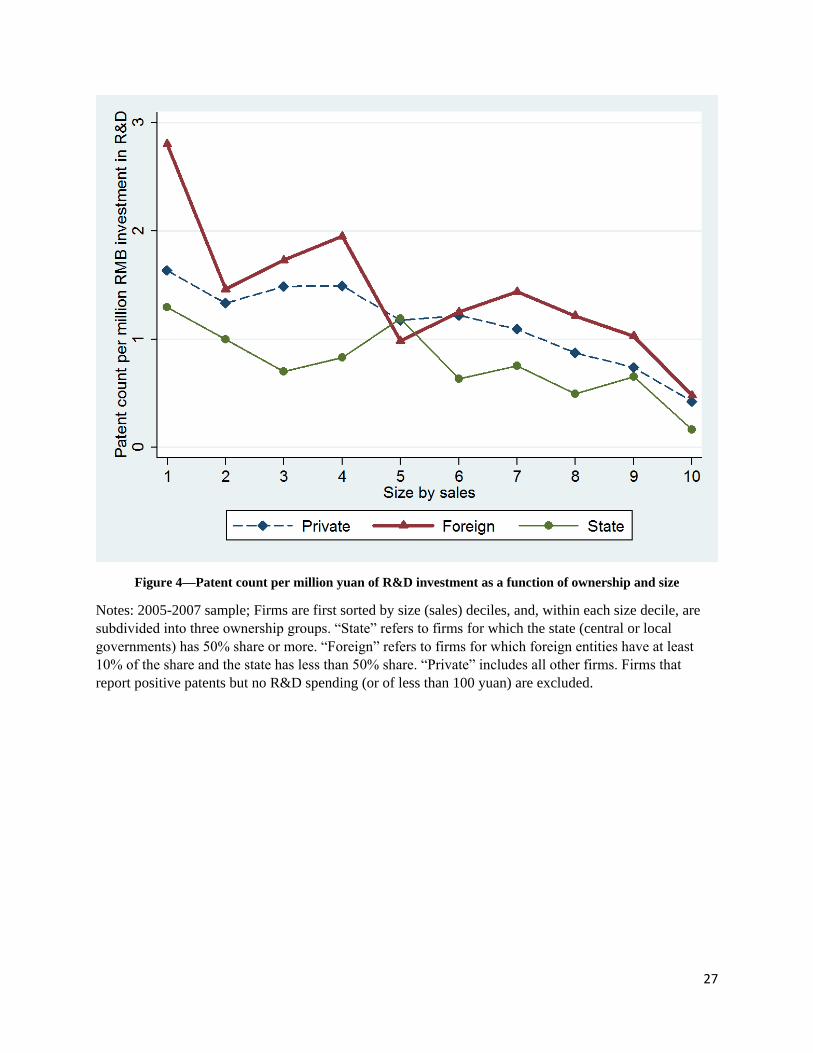
We examine firm-level data for evidence of effectiveness of research and development
spending in generating innovations. Based on firms in the ASIEC sample during 2005-2007, for
every 10 million yuan of firm-level investment in research and development, domestic private-
sector firms and foreign-invested firms generate 6.5 and 7.6 patents, respectively. In comparison,
the same investment by state-owned firms yields a more meager 2.2 patents. We may obtain a
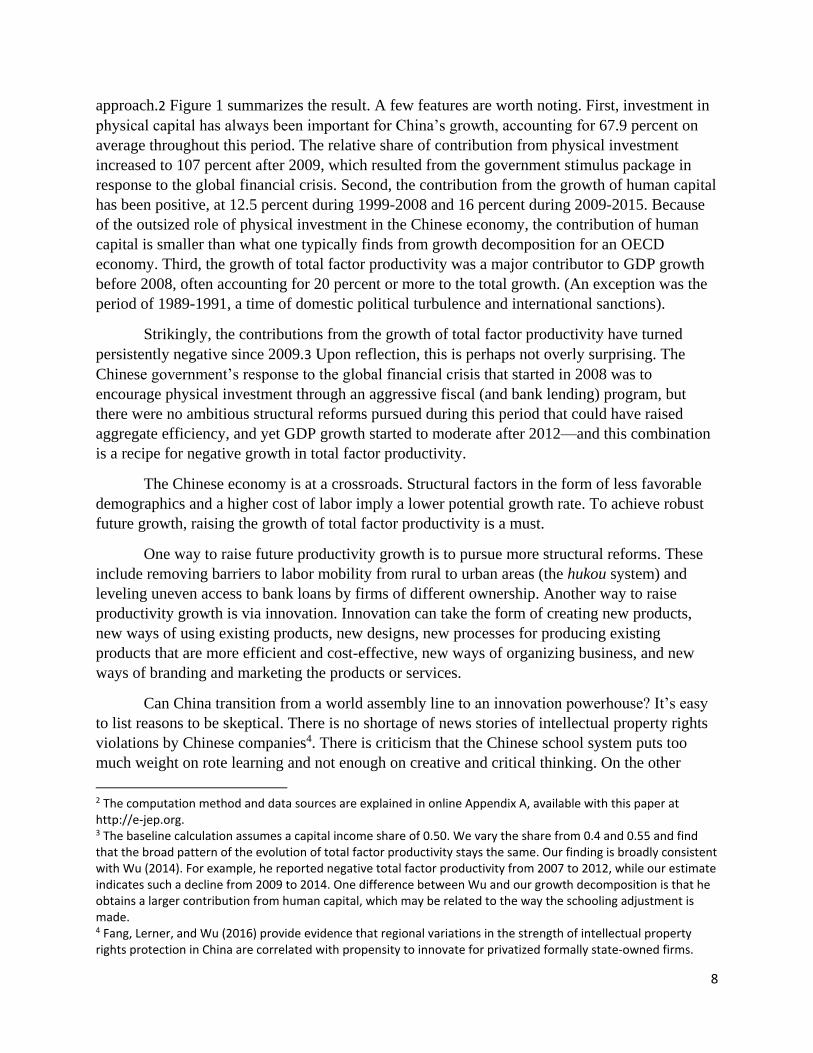
more informative picture by sorting firms by size and ownership. In Figure 4, on the horizontal
axis, all Chinese firms are sorted into ten size deciles based on the sum of the sales during the

15
period, with the first decile being the smallest and the 10th being the largest. Within each size
decile, firms are then sorted by ownership. “State” refers to all firms in which the state (either the
central or the local governments) have controlling shares (50 percent or more); “foreign” refers
to all firms in which foreign entities, including investors from Taiwan, Hong Kong, or Macao,
have a 10 percent share or more but the state has no more than 50 percent of the shares. All other
firms are in the “private” category.
Table 4 presents statistics on domestically granted patents by firm ownership and size
during 2005-2007 when all relevant data are available. In most of the size categories, domestic
private sector firms and foreign invested firms invest more in research and development and
generate more patents than their state-owned counterparts.
Inspecting Figure 4 and Table 4, several patterns are especially noteworthy. First, the
returns to research and development spending—as measured by the number of patents per
million yuan of research and development spending on the vertical axis—tend to decline with
firm size. Because large firms tend to spend more on research and development, this pattern is
consistent with the idea that diminishing returns apply to investment in innovation. Second,
across most size deciles, we see that foreign-invested firms and domestic private sector firms
tend to have higher returns to investment in research and development. Third, we do not observe
a connection between firm subsidies (relative to sales) and effectiveness at converting research
and spending into innovative outcome as measured by patents. Instead, we see that state
controlled firms tend to have much higher subsidies (relative to sales) than either domestic
private firms or foreign invested firms. Interestingly, because small and medium state owned
firms are mostly owned by local governments, they receive more subsidies from the local
governments than large state owned firms.
Konig et al. (2016) argue that, in theory, the most productive firms should pursue
innovation and less productive firms should just imitate. Against this theoretical benchmark and
also compared to the data patterns in Taiwan, they find that less productive firms in China
engage in too much research and development spending—and the more productive firms may
not do enough). Based on their calibrations, if the R&D misallocation can be reduced (so that the
association between productivity and R&D spending resembles that in Taiwan), the aggregate
productivity growth in Chinese manufacturing during 2001-2007 could have grown by about
one-third to one-half.
In sum, there is prima facie evidence that the pattern of subsidies across China’s firms
represents resource misallocation. China’s economy-wide innovative outcomes would have been
higher if the subsidies were more evenly spread across firm ownership.12 Providing subsidies
12 The appendix available online with this paper at http://e-jep.org offers some exploratory regressions that tend to
confirm the intuition in the text. In particular, we regress patent count on firm R&D expenditure by controlling for
firm sales, firm fixed effects, and year fixed effects. In order to evaluate whether private firms and state-owned
enterprises have different elasticity regarding R&D expenditure, we interact firm ownership with R&D expenditure
in the regressions. The interaction term between the state-owned enterprise dummy and R&D variable is statistically
negative, indicating that the elasticity of patents granted with respect to R&D expenditures is significantly higher for
private firms than for SOEs. This finding is consistent with the view that state-owned enterprises have not spent
R&D resources as efficiently as private firms.

16
only in cases where the social returns exceed private returns (such as certain innovative
activities) without regard to firm ownership would improve efficiency.
8. Conclusions
China’s past success in economic growth means that its real manufacturing wage has
increased by about 14-fold from 1980 to 2015. In addition, China’s shrinking work force since
2011 has added to the wage pressure. By necessity, China has to move to a growth model that is
based more on innovation and productivity increase than in the past.
Can China rise to the challenge? One sometimes hears an argument for the “middle-
income trap hypothesis,” which claims that only in exceptional cases can a middle-income
country ever manage to become an innovative high income economy. Indeed, the challenges
facing China have often been expressed in the context of a possible middle income trap by both
the government of the country and some scholars (for example, OECD 2013; Ma 2016). Han and
Wei (2015) do not find support for an unconditional notion of the middle-income trap
hypothesis, using both a transition matrix analysis and a non-parametric analysis (by regression
trees). Nonetheless, they identify certain conditions under which growth in a middle-income
country could stagnate or even regress.
We have argued that Chinese firms have demonstrated a capacity to become more
innovative in response to wage pressure and global opportunities. The data on Chinese patents,
both from a quantity and a quality perspective, appear encouraging enough that there is no reason
to be overly pessimistic about China’s prospects for a successful transition to a more innovation-
based growth model.
If China finds effective ways to embrace a shift to a more innovative economy, it can
realize its dream faster of moving into the high-income club. The government subsidies tend to
favor state-owned firms, and yet both domestic private sector firms and foreign invested firms
are more effective in converting investment in R&D to innovation outcomes as measured by
patents. Leveling the playing field for firms of all ownership type, limiting the government’s
discretion in subsidies for research and development, and assuring that private sector firms have
a fair chance at receiving those subsidies would reduce resource misallocation and improve
efficiency. This will complement the reforms in stronger protection of intellectual property rights
and education reforms that place more emphasis on developing critical and creative thinking.
17
References
Acemoglu, Daron, and Joshua Linn, 2004. “Market Size in Innovation: Theory and Evidence
from the Pharmaceutical Industry,” Quarterly Journal of Economics, 119 (3): 1049–1090.
Allison, Paul D., 2005. Fixed Effects Regression Methods for Longitudinal Data Using SAS.
Cary, North Carolina: SAS Institute.
Autor, David H., Frank Levy, and Richard J. Murnane, 2003. “The Skill Content of Recent
Technological Change: An Empirical Exploration,” Quarterly Journal of Economics, 118 (4):
1279–1333.
Bai, Chong-en, and Qiong Zhang, 2014. “Returns to Capital and Their Determinants in China,”
(in Chinese language), World Economy, 10: 2–30.
Boeing, Philipp, 2016. “The Allocation and Effectiveness of China’s R&D Subsidies: Evidence
from Listed Firms.” Research Policy 45(9): 1774–89.
Brandt, Loren, 2015. “Policy Perspectives from the Bottom Up: What Do Firm Level Data Tell
Us China Needs to Do?,” Paper presented at the Asia Economic Policy Conference on Policy
Challenges in a Diverging Global Economy, Federal Reserve Bank of San Francisco, 19–20
November.
Brandt, Loren, Trevor Tombe, and Xiaodong Zhu. 2013. “Factor Market Distortions across
Time, Space and Sectors in China,” Review of Economic Dynamics, 16 (1): 39–58.
Cai, Fang, and Yang Du, 2011. “Wage Increases, Wage Convergence, and the Lewis Turning
Point in China,” China Economic Review, 22 (4): 601–610.
Cai, Fang, and Meiyan Wang, 2008. “A Counterfactual Analysis on Unlimited Surplus Labor in
Rural China,” China & World Economy, 16 (1): 51–65.
Chang, Simon, and Xiaobo Zhang, 2015. “Mating Competition and Entrepreneurship,” Journal
of Economic Behavior & Organization, 116 (C): 292–309.
China National Bureau of Statistics (CNBS), 2012. China Statistical Yearbook. Beijing: China
Statistical Press.
Dang, Jianwei, and Kazuyuki Motohashi, 2015. “Patent Statistics: A Good Indicator for
Innovation in China? Patent Subsidy Program Impacts on Patent Quality,” China Economic
Review, 35 (C): 137–155.
Jing Fang, Hui He, and Nan Li, 2016, “China’s Rising IQ (Innovation Quotient) and Growth:
Firm-level Evidence,” unpublished IMF working paper.
Fang, Lily, Josh Lerner, and Chaopeng Wu, 2016, “Intellectual Property Rights Protection,
Ownership, and Innovation: Evidence from China,” unpublished working paper, INSEAD,
Harvard University, and Xiamen University.
18
Feng, Shiliang, 2014. “Factor Allocation and Economic Growth in China: Analysis across
Regions and Sectors from 1978 to 2012.” Dissertation, Peking University. In Chinese.
Fan, Shenggen, Xiaobo Zhang, and Sherman Robinson, 2003. “Structural Change and Economic
Growth in China,” Review of Development Economics, 7 (3): 360–377.
Fan, Shenggen, Ravi Kanbur, Shang-Jin Wei, and Xiaobo Zhang, 2014. The Oxford Companion
to the Economics of China. Oxford: Oxford University Press.
Feenstra, Robert, and Shang-Jin Wei, 2010, China’s Growing Role in World Trade. Chicago:
University of Chicago Press.
Golley, Jane, and Xin Meng, 2011. “Has China Run Out of Surplus Labour?” China Economic
Review, 22 (4): 555–572.
Han, Xuehui, and Shang-Jin Wei, 2015, “Re-examining the Middle Income Trap Hypothesis
(MITH): What to Reject and What to Revive?” CEPR Discussion Paper 10989.
Hsieh, Chang-Tai, and Peter J. Klenow, 2009. “Misallocation and Manufacturing TFP in China
and India,” Quarterly Journal of Economics, 124 (4): 1403–1448.
Hsieh, Chang-Tai, and Zheng (Michael) Song, 2015 “Grasp the Large, Let Go of the Small: The
Transformation of the State Sector in China,” Brookings Papers on Economic Activity, 50 (1):
295–366.
Knight John, Quheng Deng, and Shi Li, 2011. “The Puzzle of Migrant Labour Shortage and
Rural Labour Surplus in China,” China Economic Review, 22 (4): 585–600.
König, Michael, Zheng M. Song, Kjetil Storesletten, Fabrizio Zilibotti, 2016, “From imitation to
innovation: Where is all that Chinese R&D going?” (paper not yet completed; the authors
provide an abstract).
Li, Bin, 2011. "Comparative Analysis of Estimates on Capital Stock of China." Journal of
Quantitative & Technical Economics (12): 21-36. In Chinese.
Lin, Justin, 1992. “Rural Reforms and Agricultural Growth in China,” American Economic
Review, 82 (1): 34–51.
Ma, Damien, 2016, “Can China Avoid the Middle Income Trap?” Foreign Policy, March.
OECD, 2013, “The People’s Republic of China - Avoiding the Middle-Income Trap: Policies for
Sustained and Inclusive Growth,” September. Paris: OECD.
Qian, Yingyi, and Barry Weingast, 1997, “Federalism as a Commitment to Preserving Market
Incentives,” Journal of Economic Perspectives, 11(4): 83-92.
Qu, Yue, Fang Cai, and Xiaobo Zhang, 2013. “Has the Flying Geese Paradigm Occurred in
China?” China Economist, 8 (6): 18–31.

19
Shen, Keting, Jing Wang, and John Whalley, 2015. “Measuring Changes in the Bilateral
Technology Gaps between China, India and the U.S. 1979-2008.” National Bureau of Economic
Research Working Paper No. 21657.
Tan, Yuyan, Yiping Huang, and Wing Thye Woo, 2016. “Zombie Firms and the Crowding-Out
of Private Investment in China,” Asian Economic Papers,15(3).
Wang, Xiaobing, Jikun Huang, Linxiu Zhang, and Scott Rozelle, 2011. “The Rise of Migration
and the Fall of Self-employment in Rural China’s Labor Market,” China Economic Review, 22
(4): 573–584.
Wei, Shang-Jin, 2015, “Freer Choice, Lower Growth, and Higher Welfare: Recent Changes in
China's Population Control Policy and the Impact on Its Economy." Keynote (Dinner) Address at
the Asia Economic Policy Conference, Policy Challenges in a Diverging Global Economy,
organized by the Federal Reserve Bank of San Francisco on November 19–20.
Wei, Shang-Jin, and Xiaobo Zhang, 2011a. “The Competitive Saving Motive: Evidence from
Rising Sex Ratios and Savings in China,” Journal of Political Economy, 119 (3): 511–564.
Wei, Shang-Jin, and Xiaobo Zhang, 2011b. “Sex Ratios, Entrepreneurship and Economic
Growth in the People’s Republic of China,” NBER Working Paper No. 16800, National Bureau
of Economic Research, Cambridge, Massachusetts.
Wei, Shang-Jin, Xiaobo Zhang, and Yin Liu, 2016. Home Ownership as Status Competition:
Some Theory and Evidence,” Journal of Development Economics, forthcoming.
World Intellectual Property Organization (WIPO), 2012. World Intellectual Property Indicators.
Geneva: WIPO.
Wu, Harry X. 2013. “Measuring and Interpreting Total Factor Productivity in Chinese Industry,”
Comparative Studies, 69. Available: http://magazine.caixin.com/2013/cs_69/.
Wu, Harry X. 2014. “China’s Growth and Productivity Performance Debate Revisited:
Accounting for China’s Sources of Growth with a New Data Set.” Economics Program Working
Paper Series No. #04-01, Conference Board. Available from https://www.conference-
board.org/pdf_free/workingpapers/EPWP1401.pdf.
Xie, Zhuan, and Xiaobo Zhang, 2015. “The Patterns of Patents in China,” China Economic
Journal, 8 (2): 122–142.
Xu, Chenggang, 2011, “The Fundamental Institutions of China’s Reforms and Development,”
Journal of Economic Literature, 49(4): 1076-1151.
Xu, Chenggang, and Xiaobo Zhang, 2009. “The Evolution of Chinese Entrepreneurial Firms:
Township-Village Enterprises Revisited,” International Food Policy Research Institute
Discussion Paper # 0854, Washington, DC.
Zhang, Xiaobo, Jin Yang, and Shenglin Wang, 2011. “China Has Reached the Lewis Turning
Point,” China Economic Review, 22 (4): 542–554.

20
Zhu, Xiaodong, 2012. “Understanding China’s Growth: Past, Present, and Future,” Journal of
Economic Perspectives, 26 (4): 103–124.
21
Table 1—Number of Registered Firms in China (1995-2014)
Firm count at year end Private (%) State-owned Firms (%) Foreign (%)
1995 4,598,604 71 24 5
2000 5,875,706 76 19 5
2005 7,980,991 85 10 5
2010 11,150,201 90 5 5
2014 18,178,921 94 3 3
Annual growth rate (%)
1995–2005 6 8 -3 5
2005–2014 10 11 -5 3
1995–2014 8 9 -4 4
Note: Tabulated by authors based on China Firm Registry Database. State-owned firms refer to firms with the state
(either central or local governments) owning 50% or more. Foreign firms refer to firms with foreign ownership
exceeding 10%. All other firms are in the “private” column.
Table 2—Patent Applications and Patents Granted (1995–2014)
Year
Number of
patent
applications
at SIPO
(1)
Number of
patents
granted by
SIPO
(2)
Distribution of patents granted
by type of patents
(3)
Share of
patents
granted to
applicants
from outside
China
(%)
(4)
Number of
patents
granted by
foreign
patent
offices to
China based
applicants
(5)
Invention
(%)
Utility
model (%)
Design
(%)
1995 83,045 45,064 8 68 25 8 99
2000 170,682 105,345 12 52 36 10 157
2005 476,264 214,003 25 37 38 20 539
2010 1,222,286 814,825 17 42 41 9 3,434
2014 2,361,243 1,302,687 18 54 28 7 10,282
Annual growth rate in different periods (%)
1995–2005 19 17 31 10 22 28 18
2005–2014 19 22 18 27 18 9 38
1995–2014 19 19 25 18 20 18 28
Note: Authors’ tabulation based on data from China’s State Intellectual Property Office’s (SIPO’s) webpage
(http://www.sipo.gov.cn/tjxx/) for columns (1)-(4) and World Intellectual Property Office (WIPO) for Column (5).

22
Table 3—Number of patents granted by USPTO to international corporate applicants
Year China Brazil India Russia South Africa Germany Japan Rep. of Korea
1995 62 63 37 98 123 6,600 21,764 1,161
2000 119 98 131 183 111 10,234 31,296 3,314
2005 402 77 384 148 87 9,011 30,341 4,352
2010 2,657 175 1,098 272 116 12,363 44,814 11,671
2014 7,236 334 2,987 445 152 16,550 53,849 16,469
Annual growth rate in different periods (%)
1995–2005 21 2 26 4 -3 3 3 14
2005–2014 38 18 26 13 6 7 7 16
1995–2014 28 9 26 8 1 5 5 15
Note: Computed by authors based on data from US PTO.

23
Table 4—Patents, Research and Development Expenditure, and Subsidies by Firm Type and Size
Firm type Size by sales quantile
0-20% 20-40% 40-60% 60-80% 80-100%
Number of patents
Private 1107 2630 4003 7585 64586
Foreign 226 579 876 3031 44178
State 46 87 177 351 9116
R&D expenditure
(million RMBs)
Private 769 1763 3335 7933 143848
Foreign 122 312 760 2333 86946
State 41 112 210 595 51172
(Subsidies/sales) x100
Private 0.22 0.25 0.25 0.24 0.31
Foreign 0.13 0.11 0.11 0.11 0.11
State 0.84 0.86 0.71 0.74 0.27
Note: 2005-2007 sample; divide into 5 groups by sales; drop observations that invest less than 100 Yuan but have
positive patents.

24
Figure 1: Contributions to GDP Growth of Physical Capital, Human Capital, and Total Factor Productivity,
1979-2015
Note: See Appendix for details of the estimation.

25
Figure 2—R&D Spending as a Share of GDP: International Comparisons
Note: Data for China are from 1995 to 2014, and data for all other countries are for 2014 or the latest year available.
Source: World Bank, OECD database (https://data.oecd.org/rd/gross-domestic-spending-on-r-d.htm)

26
Figure 3—Patents Granted in USPTO to Different Countries
Note: Conditional plot by controlling for population, population squared, and country and year fixed effects, based
on data from World Intellectual Property Office (WIPO).
27
Figure 4—Patent count per million yuan of R&D investment as a function of ownership and size
Notes: 2005-2007 sample; Firms are first sorted by size (sales) deciles, and, within each size decile, are
subdivided into three ownership groups. “State” refers to firms for which the state (central or local
governments) has 50% share or more. “Foreign” refers to firms for which foreign entities have at least
10% of the share and the state has less than 50% share. “Private” includes all other firms. Firms that
report positive patents but no R&D spending (or of less than 100 yuan) are excluded.

28
Online Appendix A: Decomposition of GDP Growth
To decompose GDP growth and to compute total factor productivity, we need data on
physical capital, human capital, and output.
For physical capital, we refer to Li (2011) for a summary and comparison of different
estimates in the existing literature. We use the investment data for 1953-2009 from Li (2011) and
extend it to 2015 by using data on fixed capital formation from the National Bureau of Statistics,
and employ a perpetual inventory method to estimate capital stock. For the discount rate, we use
the data from Li (2011) before 1992, and 6% after 1992.13 For price index, we use the “price
index of fixed asset investment” provided by the National Bureau of Statistics, which is also Li’s
source for data before 1991.
Human capital is the product of the size of the labor force and average years of schooling.
The size of labor force is from the National Bureau of Statistics. For average years of schooling,
we use the estimates for 1978-2012 from Feng (2014) and extend it to 2015.
We need information on the share of labor income in national income. The share is
computed by Li (2011) as 47% between 1993 and 2009. Based on data from National Bureau of
Statistics, we compute the share to be about 50% between 2000 and 2015. We assume the share
to be 50% in our baseline calculations.
Denoting the growth rates of physical capital, human capital and output by , and
, respectively, the growth of total factor productivity is computed as: TFP= -0.5* -0.5*
.
Out of concern that the estimated labor share in national income may be biased
downward, we also use a share of 55%, 60% and 65% as sensitivity checks. We find that the new
shares have only negligible effects on the TFP growth patterns.
We can do straightforward decomposition of GDP growth into contributions from various
factors. The contributions from physical and human capital are 0.5* / , and 0.5* / ,
respectively, and that from TFP growth is 1 minus the contributions from the other two. The
decomposition results are presented in Figure 1.
13 As sensitivity checks, we have also used 5%, 8% and 10%. This makes some difference on the level of TFP but not much on the growth rate, which is the key interest of the paper.

29
Online Appendix B: Investigating the Underlying Causes of Innovation with Patent Data
Because many firms do not have patents and patent count does not follow a log-normal
distribution, we cannot use ordinary least square regressions by taking the log on patent count. A
common approach is to use a negative binomial model. However, all the observations with zero
patents will be dropped when including firm fixed effects. Here we use a hybrid binomial
estimation method proposed by Allison (2005): First, we compute the mean values of all the
explanatory variables X. Second, we create a set of new variables by deducting the mean values
from the original values of X—that is, X – mean of X. Third, we run a random negative
binomial model on patent count using these newly created variables as independent variables.
This method is a hybrid of the fixed effect and random effect models, largely overcoming the
shortcomings of the conditional estimated fixed effect negative binomial model, which
automatically drops observations with zero values for the outcome variable for all the years. The
equation can be written as:
𝑃𝑖𝑗𝑡 = 𝐹(𝑆𝑎𝑙𝑒𝑠𝑖𝑡 , 𝑊𝑎𝑔𝑒𝑗𝑡 , 𝑆𝑢𝑏𝑠𝑖𝑑𝑦𝑗𝑡 , 𝑇𝑎𝑥𝑟𝑎𝑡𝑒𝑗𝑡 , 𝐼𝑛𝑡𝑒𝑟𝑒𝑠𝑡 𝑟𝑎𝑡𝑒𝑗𝑡 , 𝑇𝑎𝑟𝑖𝑓𝑓𝑗𝑡 , 𝐸𝑥𝑝𝑜𝑟𝑡𝑖𝑡, 𝐻𝐻𝑗𝑡,
industry or firm fixed effects, and year fixed effects),
where P = the number of approved patents for firm i in year t, Sales = firm i’s annual sales in
year t, Wage = average wage at the city-industry-year-firm ownership level (excluding the firm
itself) in the cell where the firm is located, Subsidy = the ratio of subsidies received from the
government to total sales at the firm level, Tax rate = the sum of the income tax payment and
value added tax payment relative to total sales at the firm level in year t, Interest rate = the ratio
of total interest paid to the average liability this year and last year at the firm level, Tariff =
weighted average of trade partners’ tariff rates, based on matching product-level tariff data from
the COMTRADE database with firm i’s SIC-2 code (computed at the industry-year level, which
we use mainly to improve the matching rate); Export is a dummy variable indicating whether a
firm has positive exports in year t, and finally HH is the Herfindahl-Hirschman (HH) index at the
industry-year level. The HH index is calculated via the following steps: (1) for every four-digit
industry and year t, compute every firm’s market share, (2) for every four-digit industry and year
t, sum the square of every firm’s market share. The higher the HH index, the lower the degree of
competition.
Many of the regressors are undoubtedly endogenous. In the spirit of an instrumental
variable approach, we replace the wage rate, subsidy rate, tax rate, and interest rate from firm-
year specific values with the average values of all other firms in the same cell of city-industry-
ownership type-year. The idea (or the maintained assumption) is that the average values of all
other firms in the same cell more likely reflect local labor market conditions (in the case of
wage) or local policy designs (in the case of the other three variables). To do this exercise, we
also drop all cells with fewer than five observations. Note that we regard the tariff variable as
exogenous since it is the average of trading partners’ tariff rates, which are unlikely to be
systematically manipulated by individual firms in China.

30
Table A7 reports the hybrid negative binomial regression estimates. Several findings are
apparent. First, firm size, measured by sales, is positively associated with the number of
approved patents. Unsurprisingly, larger firms tend to have more patents approved. Second,
export firms are more innovative. We refrain from assigning a causal interpretation to these two
coefficients – the positive correlations between firm size and innovativeness and between export
status and innovativeness could reflect causal effects in either direction (and probably in both
directions). We simply treat these regressors as control variables.
Third, lower import tariff is good for firm innovations through the expansion of
international markets for Chinese products. Because foreign tariffs are (largely) exogenous, we
interpret this coefficient as reflecting a causal effect – expansion of international markets or
export opportunities induces firms to do more innovations.
Fourth, in terms of the effects of fiscal subsidies, there is some evidence that invention
patents respond positively to subsidies, but utility and design patents do not show statistically
significant responses. Since invention patents are often regarded as “more innovative,” one
cannot rule out the possibility that firms’ innovative activities respond to fiscal incentives.
Similarly, a higher tax rate appears to discourage innovation – the coefficients on the tax
rate are negative in all four columns, though they are statistically significant for all patents, and
invention and utility patents only.
Fifth, a higher cost of capital as measured by a higher implied interest rate also appears to
discourage many types of innovative activities – the coefficients on log interest rate are negative
and statistically significant for all patents, and utility and design patents.
Finally, there is a robust positive relationship between wage level and firm innovations. If
our strategy of using the average wages of all other firms in the same cell to replace an individual
firm’s own wage succeeds in removing endogeneity, one might interpret the coefficient as saying
that firms, on average, rise to the challenge of higher labor costs by engaging in more
innovations.
Of course, innovative industries tend to hire more skilled workers than less innovative
industries. In general, skilled workers earn more than unskilled workers, and thereby could
produce a positive correlation between average wage and firm innovativeness at the industry
level. Note that our regressions in Table A7 include separate firm and year fixed effects (and
therefore subsuming separate industry fixed effects). So endogeneity has to come at the level of
industry-city-ownership-year. Nonetheless, to further remove endogeneity, we replace current
average wage by those of others firms in the same cell by its lagged value, and find qualitatively
the same results. (The results are in Appendix Table A8.)
As robustness checks, we have implemented other specifications as well, such as fixed
effect negative binomial model, random effect negative binomial model, and fixed effect ordinal
linear probability model. The coefficients for most variables are qualitatively similar. We use
minimum wage at the city-year level to replace the average wage of other firms in the same cell,
and again find the same qualitative results (see Appendix Table A9).
31
The same wage increase means a different magnitude of cost shock to firms in labor-
intensive industries and firms in other industries. To explore this feature, we now add an
interaction term between the average wage of other firms in the same cell and a dummy
indicating that the industry in which the firm operates has a labor intensity (labor cost as a share
of total cost) above the median at the beginning of the sample. Appendix Table A10 displays the
estimation results. The coefficient for the interaction term is positive and statistically significant
among three out of four regressions (for total patents, and invention and design patents).
Consistent with the induced innovation theory, rising labor costs have induced labor-intensive
firms to become more innovative to survive. The results in Table A10 are again robust to the use
of alternative wage variables (either lagged wages or legal minimum wages). To save space, the
estimates using lagged wages or minimum wages are not reported here.
Studies like Autor et al. (2003) have shown that computer technology has reduced the
demand for jobs involving routine tasks. Following Autor et al. (2003), we create a dummy
variable “routine” indicating whether an industry involves more routine tasks (1) or not (0).
Facing rising labor cost, we expect to see firms heavily involved in routine tasks, which are often
done by low-skilled workers, to innovate more to substitute labor. Similar to Table A7, we use a
differences-in-difference approach to examine the impact of rising wages on routine task-
intensive industries by including an interaction term between wages and a “routine” dummy. As
shown in Panel A of Table A11, the coefficient for the interaction term is statistically significant
in all four regressions. In response to rising wages, in industries involving routine tasks, those
firms that survive (i.e., continue to produce) tend to become more innovative, possibly by taking
advantage of computer technologies.
When facing rising labor costs, there are two possible routes for labor-intensive
industries. In industries where innovation is possible, firms have to innovate to survive. In
industries in which international experience suggests that innovation is difficult (sunset
industries), exit or closure is the likely outcome. In the sunset industries, with the dwindling
market share, firms may be reluctant to make R&D investment for fear of failure to recoup the
cost.
We define the sunset industries as follows: First, we select top 40 economies according to
GDP in 2000 excluding China. Next we further narrow down the list by keeping countries with
GDP per capita 1.5 times larger than that of China and lower than 12,000 USD (constant in
2005). The list ends up with Argentina, Brazil, Czech Republic, Mexico, Yemen, Poland, Russia,
Turkey, Venezuela, and Zambia. Third, we calculate the annual growth rate of each industry by
country and obtain the aggregate growth rate for all countries in the list using GDP as weights.
An industry is defined as a sunset industry if its average growth rate during the period 1998–
2007 is below the median growth rate among all the industries.
Panel B of Table A11 shows the estimates for the interaction term between wages and
“sunset” industry dummy. The coefficient is only statistically negative in the regression on
invention patents. Invention patents normally involve more R&D input than utility model and
design patents. The results are robust when using lagged values of minimum wages in the
interaction term. When market prospects loom large, the surviving firms in the sunset industries

32
are less likely to make large R&D investment, thereby yielding a lower number of invention
patents than in other industries. Like other economies which are slightly richer than China, the
firms in the sunset industries in China will likely experience slower growth and are eventually
replaced by sunrise industries.

33
Appendix Table A1—Number of Chinese Firms
Year Firm count
at year end Private (%) SOE (%) Foreign (%)
1995 4,598,604 71 24 5
1996 4,997,932 72 23 5
1997 5,293,125 72 22 5
1998 5,526,172 73 21 5
1999 5,712,997 74 21 5
2000 5,875,706 76 19 5
2001 6,032,059 77 18 5
2002 6,356,801 79 16 5
2003 6,831,363 81 14 5
2004 7,400,172 83 12 5
2005 7,980,991 85 10 5
2006 8,572,472 86 9 5
2007 8,962,246 87 8 5
2008 9,405,281 88 7 5
2009 10,130,705 89 6 5
2010 11,150,201 90 5 5
2011 12,352,627 91 5 4
2012 13,433,213 92 4 4
2013 15,184,602 93 3 4
2014 18,178,921 94 3 3
Annual growth rate in different periods (%)
1995–2005 6 8 -3 5
2005–2014 10 11 -5 3
1995–2014 8 9 -4 4
Note: Tabulated by authors based on China Firm Registry Database.

34
Appendix Table A2—Number of Chinese patent applications (1995–2014)
Year
Number of patent
applications in
SIPO of China
Number of patent applications in SIPO
of China Share of patent
application in
SIPO of China by
foreign applicants
(%)
Number of
applications
in foreign
patent offices
by Chinese
applicants
Invention
(%)
Utility model
(%)
Design
(%)
1995 83,045 26 53 21 17 205
1996 102,735 28 48 24 20 201
1997 114,208 29 44 27 21 178
1998 121,989 29 42 28 21 259
1999 134,239 27 43 30 18 383
2000 170,682 30 40 29 18 652
2001 203,573 31 39 30 19 846
2002 252,631 32 37 31 19 1,138
2003 308,487 34 35 30 19 1,368
2004 353,807 37 32 31 21 2,365
2005 476,264 36 29 34 20 3,258
2006 573,178 37 28 35 18 5,293
2007 693,917 35 26 39 15 6,041
2008 828,328 35 27 38 13 7,099
2009 976,686 32 32 36 10 9,766
2010 1,222,286 32 34 34 9 11,703
2011 1,633,347 32 36 32 8 14,937
2012 2,050,649 32 36 32 7 19,627
2013 2,377,061 35 37 38 6 22,008
2014 2,361,243 39 37 24 6 26,356
Annual growth rate in total number of patents in different periods (%)
1995–2005 19 23 12 25 21 32
2005–2014 19 21 23 15 5 26
1995–2014 19 22 17 20 13 29
Note: Tabulated by authors based on aggregate data downloaded from China’s State Intellectual Property Office’s
(SIPO’s) webpage (http://www.sipo.gov.cn/tjxx/) and World Intellectual Property Office (WIPO).
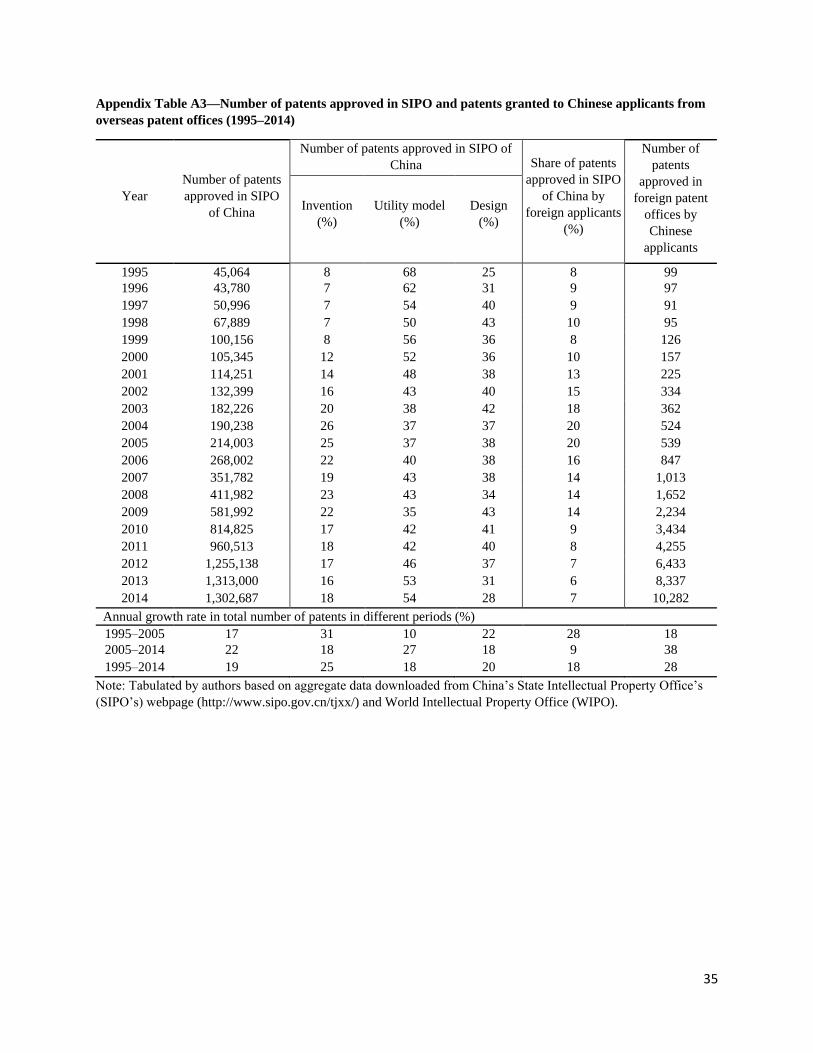
35
Appendix Table A3—Number of patents approved in SIPO and patents granted to Chinese applicants from
overseas patent offices (1995–2014)
Year
Number of patents
approved in SIPO
of China
Number of patents approved in SIPO of
China Share of patents
approved in SIPO
of China by
foreign applicants
(%)
Number of
patents
approved in
foreign patent
offices by
Chinese
applicants
Invention
(%)
Utility model
(%)
Design
(%)
1995 45,064 8 68 25 8 99
1996 43,780 7 62 31 9 97
1997 50,996 7 54 40 9 91
1998 67,889 7 50 43 10 95
1999 100,156 8 56 36 8 126
2000 105,345 12 52 36 10 157
2001 114,251 14 48 38 13 225
2002 132,399 16 43 40 15 334
2003 182,226 20 38 42 18 362
2004 190,238 26 37 37 20 524
2005 214,003 25 37 38 20 539
2006 268,002 22 40 38 16 847
2007 351,782 19 43 38 14 1,013
2008 411,982 23 43 34 14 1,652
2009 581,992 22 35 43 14 2,234
2010 814,825 17 42 41 9 3,434
2011 960,513 18 42 40 8 4,255
2012 1,255,138 17 46 37 7 6,433
2013 1,313,000 16 53 31 6 8,337
2014 1,302,687 18 54 28 7 10,282
Annual growth rate in total number of patents in different periods (%)
1995–2005 17 31 10 22 28 18
2005–2014 22 18 27 18 9 38
1995–2014 19 25 18 20 18 28
Note: Tabulated by authors based on aggregate data downloaded from China’s State Intellectual Property Office’s
(SIPO’s) webpage (http://www.sipo.gov.cn/tjxx/) and World Intellectual Property Office (WIPO).

36
Appendix Table A4—Total number of patents granted in the United States by USPTO to (corporate)
applicants from BRICS, Germany, Japan, and the Republic of Korea
Year China Brazil India Russia South Africa Germany Japan Rep. of Korea
1995 62 63 37 98 123 6,600 21,764 1,161
1996 46 63 35 116 111 6,818 23,053 1,493
1997 62 62 47 111 101 7,008 23,179 1,891
1998 72 74 85 189 115 9,095 30,841 3,259
1999 90 91 112 181 110 9,337 31,104 3,562
2000 119 98 131 183 111 10,234 31,296 3,314
2001 195 110 177 234 120 11,260 33,223 3,538
2002 289 33 249 200 114 11,278 34,859 3,786
2003 297 130 341 202 112 11,444 35,517 3,944
2004 404 106 363 169 100 10,779 35,348 4,428
2005 402 77 384 148 87 9,011 30,341 4,352
2006 661 121 481 172 109 10,005 36,807 5,908
2007 772 90 546 188 82 9,051 33,354 6,295
2008 1,225 101 634 176 91 8,915 33,682 7,549
2009 1,655 103 679 196 93 9,000 35,501 8,762
2010 2,657 175 1,098 272 116 12,363 44,814 11,671
2011 3,174 215 1,234 298 123 11,920 46,139 12,262
2012 4,637 196 1,691 331 142 13,835 50,677 13,233
2013 5,928 254 2,424 417 161 15,498 51,919 14,548
2014 7,236 334 2,987 445 152 16,550 53,849 16,469
Annual growth rate in different periods (%)
1995–2005 21 2 26 4 -3 3 3 14
2005–2014 38 18 26 13 6 7 7 16
1995–2014 28 9 26 8 1 5 5 15
Note: The figures stand for total number of patents granted to applicants from these countries by the U.S. Patent and
Trademark Office (USPTO). Computed by authors based on data from World Intellectual Property Office (WIPO).

37
Appendix Table A5: Cross country comparison of number of patents, number of citations.
(coefficients on the interaction term between China and years are reported below)
Note: the second column shows the coefficients of China dummy * year from 1996 to 2014. The dependent
variable for second column is number of patents approved in USPTO for each country in each year from WIPO
(sample is 1995 to 2014), the independent variables includes country* year fixed effect for Germany, Japan, Korea
and BRICS, log population, log population square, year fixed effect, and country fixed effect for other countries.
The third column shows the coefficients of China dummy * year from 1999 to 2010. The dependent variable for
third column is number of citations received of patents approved in USPTO for each country in each year based on
US micro patent database (sample is 1998 to 2010), the independent variables are the same as those for second
column.
Variables Number of patents Number of citations
China dummy* year of 1996 -0.404
China dummy* year of 1997 -0.311
China dummy* year of 1998 -0.295
China dummy* year of 1999 -0.207 0.0607
China dummy* year of 2000 0.0323 0.0652
China dummy* year of 2001 0.404 0.901
China dummy* year of 2002 0.976* 1.508
China dummy* year of 2003 0.634 1.553
China dummy* year of 2004 1.053* 1.917*
China dummy* year of 2005 1.218** 2.193**
China dummy* year of 2006 1.497** 2.333**
China dummy* year of 2007 1.725*** 2.981***
China dummy* year of 2008 2.084*** 3.536***
China dummy* year of 2009 2.241*** 3.327***
China dummy* year of 2010 2.391*** 3.506***
China dummy* year of 2011 2.486***
China dummy* year of 2012 2.727***
China dummy* year of 2013 2.806***
China dummy* year of 2014 2.876***

38
Appendix Table A6— Citations by foreign patents on patents approved in SIPO by China’s applicants (1995–
2014)
Year Invention patents Utility patents
1995 100 65
1996 114 62
1997 174 100
1998 201 98
1999 244 125
2000 303 198
2001 522 357
2002 667 440
2003 1,019 681
2004 1,358 851
2005 1,765 1,089
2006 2,984 1,830
2007 5,087 2,721
2008 9,183 4,084
2009 13,347 5,097
2010 20,781 7,752
2011 30,706 11,241
2012 45,364 16,132
2013 55,649 21,072
2014 71,383 23,544
Annual growth rate in different periods (%)
1995–2004 34 33
2004–2014 49 39
1995–2014 41 36
Note: Tabulated by authors based on citations from Google Patent System.

39
Appendix Table A7—Hybrid negative binomial regressions on patent count: Baseline
(1) (2) (3) (4)
VARIABLES Total Invention Utility Design
Sales (log) 0.437*** 0.491*** 0.435*** 0.424***
(0.012) (0.024) (0.015) (0.019)
Export 0.115*** 0.181*** 0.071** 0.157***
(0.022) (0.045) (0.028) (0.036)
Wage (log) 0.082*** 0.224*** 0.137*** 0.072*
(0.027) (0.050) (0.034) (0.042)
Subsidy rate (log) 0.003 0.045*** 0.003 0.010
(0.006) (0.011) (0.007) (0.009)
Tax rate (log) -0.073*** -0.066** -0.085*** -0.036
(0.017) (0.032) (0.021) (0.027)
Interest rate (log) -0.025** 0.010 -0.042*** -0.036**
(0.010) (0.020) (0.013) (0.016)
Partner tariff -1.048*** -0.843*** -1.123*** -0.482***
(0.078) (0.146) (0.115) (0.118)
HH index 0.143 -0.087 0.541** 0.358
(0.224) (0.425) (0.267) (0.328)
Observations 1,187,140 1,187,140 1,187,140 1,187,140
Firm FE YES YES YES YES
Year FE YES YES YES YES
AIC 438522 114137 270400 213959
Note: Wage (log), Subsidy rate (log), Tax rate (log), Interest rate (log) are averages at the city-industry-firm
ownership type-year level (except for the firm itself). Cells with fewer than six observations are dropped. Sales (log)
and Export are still firm-year level.

40
Appendix Table A8—Hybrid negative binomial regression on patent count: Using lagged wages
(1) (2) (3) (4)
VARIABLES Total Invention Utility Design
Sales (log) 0.419*** 0.454*** 0.418*** 0.416***
(0.013) (0.026) (0.016) (0.021)
Export 0.119*** 0.172*** 0.065** 0.161***
(0.025) (0.049) (0.031) (0.041)
Lag wage (log) 0.510*** 0.890*** 0.790*** 0.541***
(0.058) (0.113) (0.074) (0.090)
Subsidy rate (log) -0.007 0.033*** -0.009 -0.003
(0.006) (0.012) (0.008) (0.010)
Tax rate (log) -0.067*** -0.057 -0.080*** -0.036
(0.020) (0.036) (0.025) (0.032)
Interest rate (log) -0.018 0.017 -0.034** -0.031*
(0.011) (0.021) (0.014) (0.019)
Partner tariff -0.850*** -0.314* -0.666*** -0.454***
(0.091) (0.171) (0.131) (0.140)
HH index 0.238 -0.092 0.622** 0.337
(0.240) (0.429) (0.279) (0.361)
Observations 984,517 984,517 984,517 984,517
Firm FE YES YES YES YES
Year FE YES YES YES YES
AIC 368333 99218 229716 173836
Note: See Table A2. The value of wage variable is lagged by one year.

41
Appendix Table A9— Hybrid negative binomial regression on patent count: Using minimum wages
(1) (2) (3) (4)
VARIABLES Total Invention Utility Design
Sales (log) 0.430*** 0.441*** 0.434*** 0.435***
(1.126) (2.186) (1.424) (1.793)
Export 0.104*** 0.172*** 0.065** 0.148***
(2.208) (4.351) (2.772) (3.559)
Minimum wage (log) 0.318*** 0.484*** 0.607*** 0.371***
(4.890) (9.569) (6.354) (7.597)
Subsidy rate (log) -0.003 0.017* -0.005 -0.013
(0.526) (0.978) (0.664) (0.859)
Tax rate (log) 0.050** 0.115*** 0.026 0.053*
(1.994) (3.774) (2.523) (3.130)
Interest rate (log) -0.012 -0.006 -0.040*** 0.014
(1.140) (2.277) (1.407) (1.829)
Partner tariff -9.156*** -6.279** -8.354*** -4.772***
(112.564) (258.170) (184.781) (127.120)
HH index 0.358 0.085 0.486* 0.517
(21.901) (38.670) (26.178) (33.429)
Observations 1,305,376 1,305,376 1,305,376 1,305,376
Firm FE YES YES YES YES
Year FE YES YES YES YES
AIC 461094 124633 283566 217422
Note: See Table A2. Minimum wages are at the city and year level.

42
Appendix Table A10—Impact of wage on innovations of labor intensive firms
(1) (2) (3) (4)
VARIABLES Total Invention Utility Design
Wage (log)*Labor intensive dummy 0.163*** 0.695*** -0.042 0.174***
(0.038) (0.073) (0.052) (0.059)
Sales (log) 0.436*** 0.483*** 0.433*** 0.425***
(0.012) (0.024) (0.015) (0.019)
Export 0.108*** 0.162*** 0.064** 0.153***
(0.022) (0.045) (0.028) (0.036)
Wage (log) 0.010 -0.101* 0.184*** 0.007
(0.034) (0.061) (0.050) (0.051)
Subsidy rate (log) 0.006 0.044*** 0.008 0.012
(0.006) (0.011) (0.007) (0.009)
Tax rate (log) -0.068*** -0.032 -0.082*** -0.031
(0.017) (0.033) (0.021) (0.027)
Interest rate (log) -0.022** 0.021 -0.040*** -0.035**
(0.011) (0.020) (0.013) (0.017)
Partner tariff -1.138*** -1.091*** -1.141*** -0.475***
(0.082) (0.148) (0.120) (0.122)
HH index 0.260 -0.090 0.597** 0.456
(0.223) (0.423) (0.265) (0.327)
Observations 1,187,140 1,187,140 1,187,140 1,187,140
Firm FE YES YES YES YES
Year FE YES YES YES YES
AIC 436557 114023 266115 213652
Note: The dependent variable is patent count. Hybrid negative binomial regression is used. See Qu et al. (2013) for
the definition of labor-intensive industries.
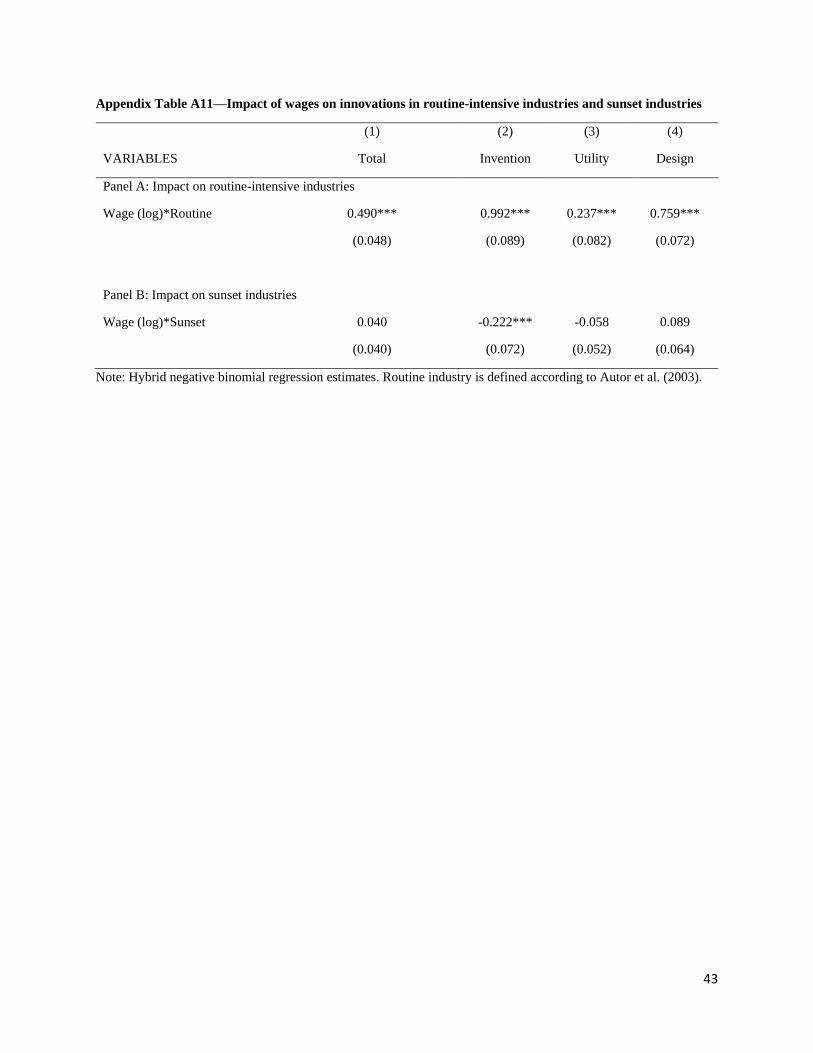
43
Appendix Table A11—Impact of wages on innovations in routine-intensive industries and sunset industries
(1) (2) (3) (4)
VARIABLES Total Invention Utility Design
Panel A: Impact on routine-intensive industries
Wage (log)*Routine 0.490*** 0.992*** 0.237*** 0.759***
(0.048) (0.089) (0.082) (0.072)
Panel B: Impact on sunset industries
Wage (log)*Sunset 0.040 -0.222*** -0.058 0.089
(0.040) (0.072) (0.052) (0.064)
Note: Hybrid negative binomial regression estimates. Routine industry is defined according to Autor et al. (2003).
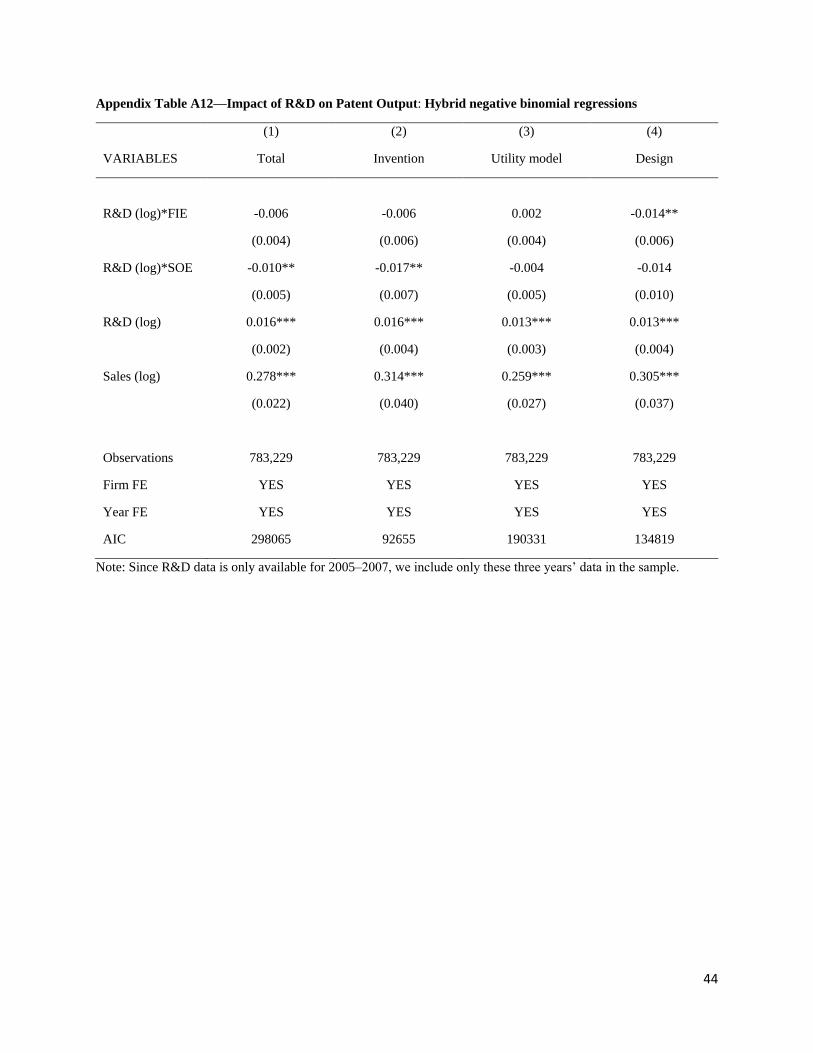
44
Appendix Table A12—Impact of R&D on Patent Output: Hybrid negative binomial regressions
(1) (2) (3) (4)
VARIABLES Total Invention Utility model Design
R&D (log)*FIE -0.006 -0.006 0.002 -0.014**
(0.004) (0.006) (0.004) (0.006)
R&D (log)*SOE -0.010** -0.017** -0.004 -0.014
(0.005) (0.007) (0.005) (0.010)
R&D (log) 0.016*** 0.016*** 0.013*** 0.013***
(0.002) (0.004) (0.003) (0.004)
Sales (log) 0.278*** 0.314*** 0.259*** 0.305***
(0.022) (0.040) (0.027) (0.037)
Observations 783,229 783,229 783,229 783,229
Firm FE YES YES YES YES
Year FE YES YES YES YES
AIC 298065 92655 190331 134819
Note: Since R&D data is only available for 2005–2007, we include only these three years’ data in the sample.

45
Appendix Figure A1—Declining Contribution of Imported Foreign technology: Evidence from Above-scale
Manufacturing Firms
Source: China Statistical Yearbook on Science and Technology (China National Bureau of Statistics, various years).

46
Appendix Figure A2—Researcher Intensity Comparison
Note: Chinese data is from 1996 to 2014. For all other countries, the sample is for 2014 or the latest year available
(not later than 2010). China adjusted the statistical coverage since 2009, so we see a sudden drop for China (red
points in graph).
Source: World Bank.

47
Appendix Figure A3—Patent Approval Rate in BRIC Countries, the Republic of Korea, and the U.S.
Source: WIPO. The approval rate is defined as # patents granted in year t / # applications in year t-1.

48
Appendix Figure 4—Forward Citations of Patents Granted by USPTO: Cross-country Comparison
Note: Conditional plot by controlling for population, population squared, and country and year fixed effects, based
on data of USPTO (1998-2010).