from n=1 to n=100: what i have learned from quantifying my superorganism body
TRANSCRIPT

“From N=1 to N=100:What I Have Learned
From Quantifying My Superorganism Body”
Institute for Systems Biology
Seattle, WA
March 20, 2014
Dr. Larry Smarr
Director, California Institute for Telecommunications and Information Technology
Harry E. Gruber Professor,
Dept. of Computer Science and Engineering
Jacobs School of Engineering, UCSD
http://lsmarr.calit2.net 1
Where I Believe We are Headed: Predictive, Personalized, Preventive, & Participatory Medicine
www.newsweek.com/2009/06/26/a-doctor-s-vision-of-the-future-of-medicine.html
I am Lee Hood’s Lab Rat!

By Measuring the State of My Body and “Tuning” ItUsing Nutrition and Exercise, I Became Healthier
2000
Age 41
2010
Age 61
1999
1989
Age 51
1999
I Arrived in La Jolla in 2000 After 20 Years in the Midwestand Decided to Move Against the Obesity Trend
I Reversed My Body’s Decline By Quantifying and Altering Nutrition and Exercise
http://lsmarr.calit2.net/repository/LS_reading_recommendations_FiRe_2011.pdf
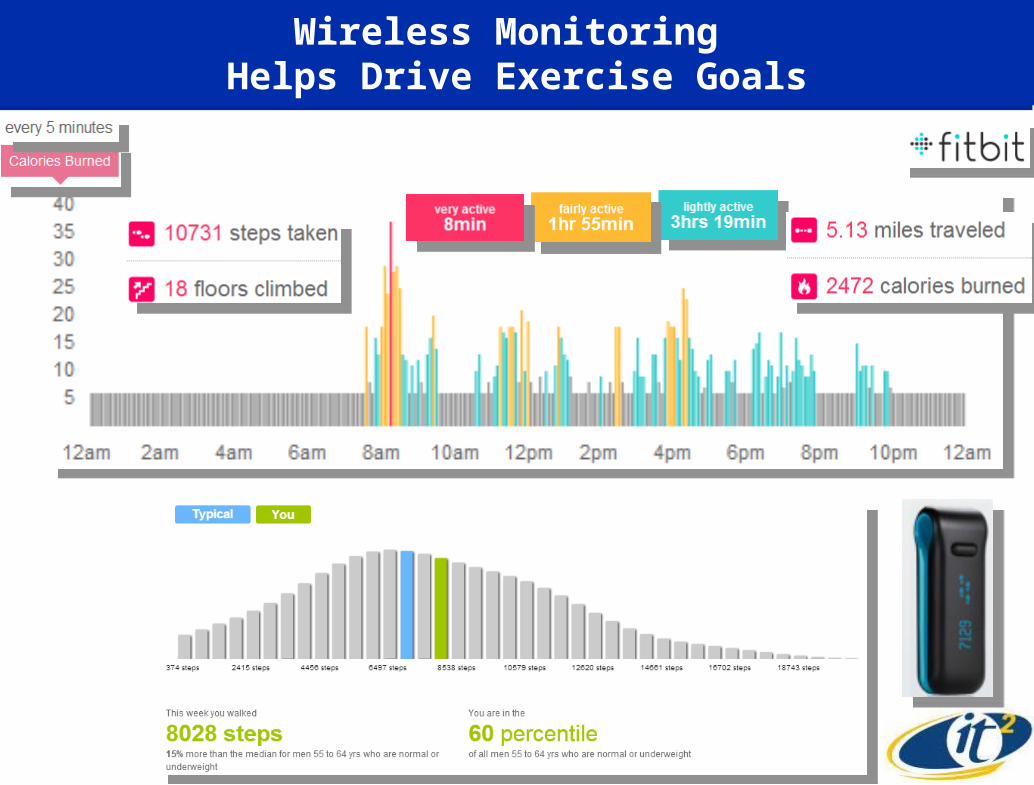
Wireless Monitoring Helps Drive Exercise Goals
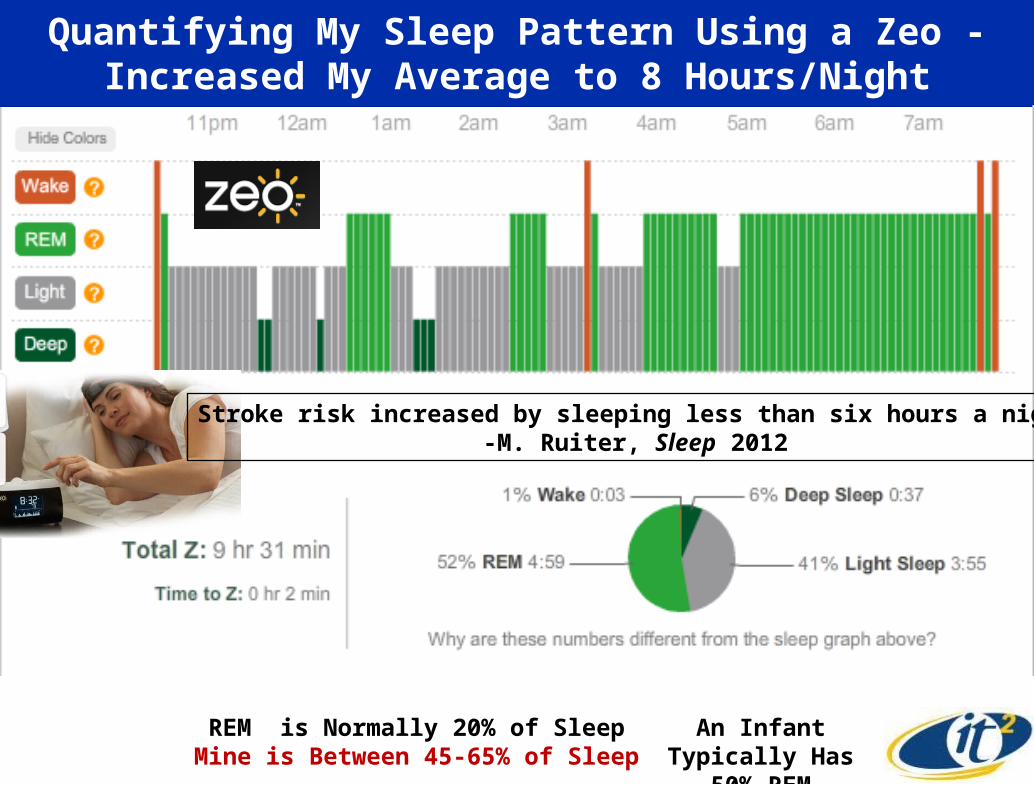
Quantifying My Sleep Pattern Using a Zeo -Increased My Average to 8 Hours/Night
REM is Normally 20% of SleepMine is Between 45-65% of Sleep
An Infant Typically Has 50% REM
Stroke risk increased by sleeping less than six hours a night-M. Ruiter, Sleep 2012

Source: Samir Damani, MD Revolution
MDRevolution’s RevUp! Integrates a Variety of Sensors & Then Completes the Behavior Feedback Loop

MDRevolution’s RevUp! Also Integrates Blood Variables and Genetics
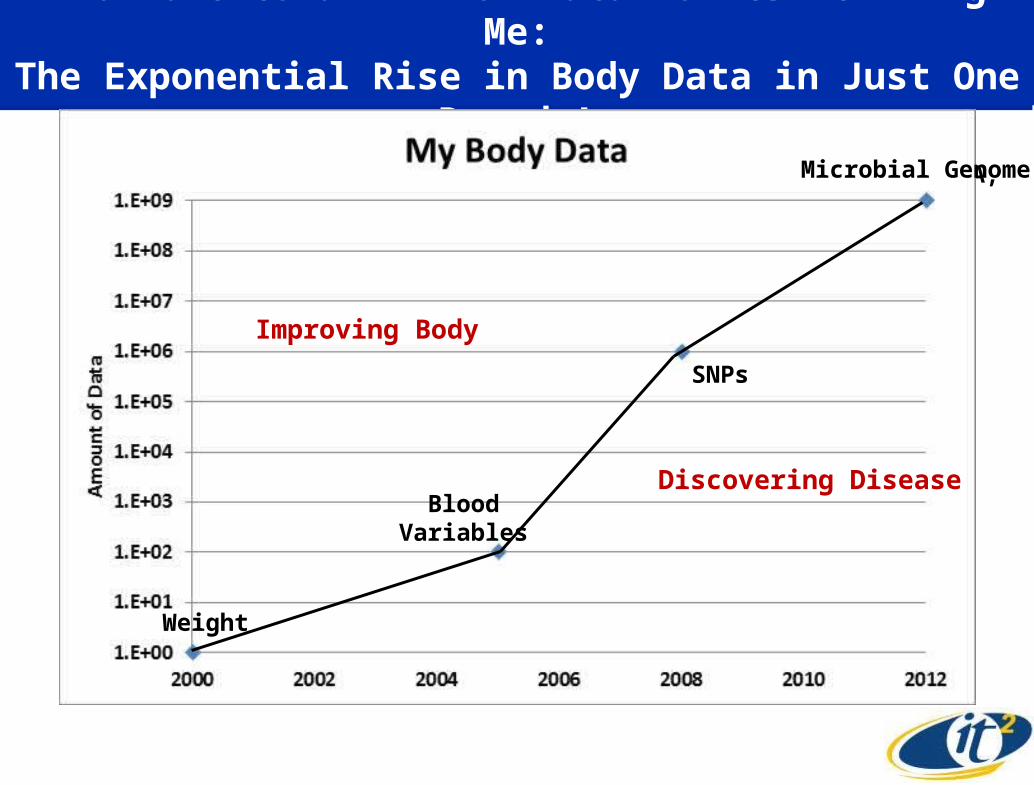
From One to a Billion Data Points Defining Me:The Exponential Rise in Body Data in Just One Decade!
Billion: My Full DNA,MRI/CT Images
Million: My DNA SNPs,Zeo, FitBit
Hundred: My Blood VariablesOne: My WeightWeight
BloodVariables
SNPs
Microbial Genome
Improving Body
Discovering Disease
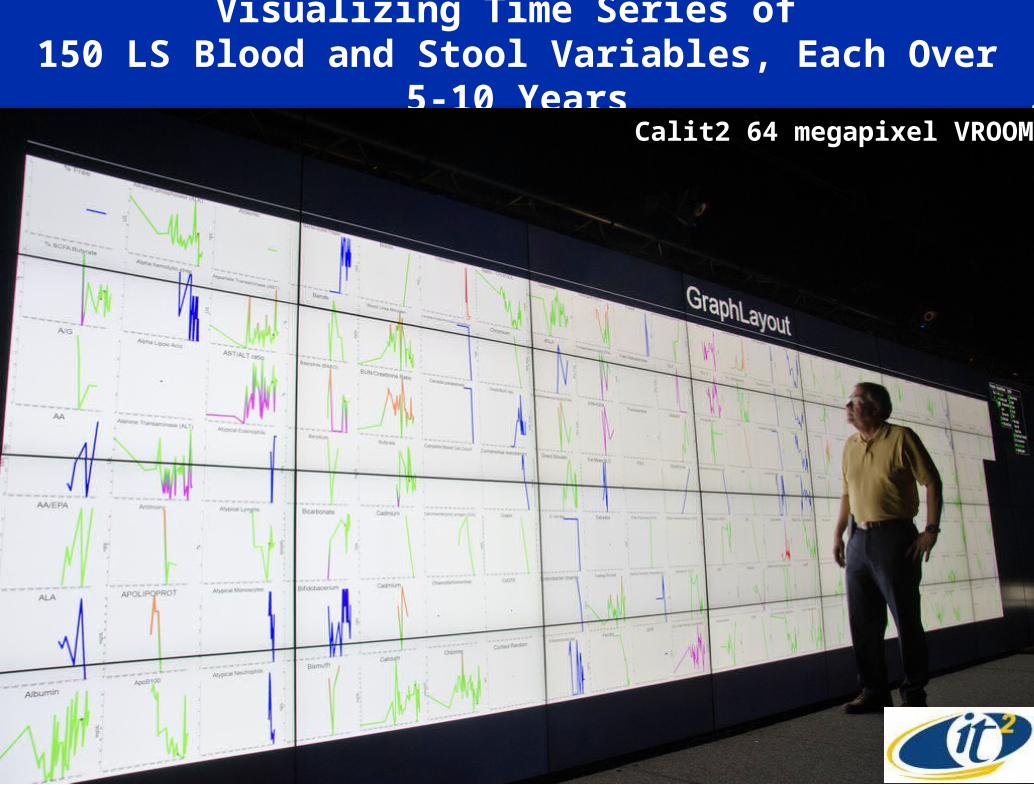
Visualizing Time Series of 150 LS Blood and Stool Variables, Each Over 5-10 Years
Calit2 64 megapixel VROOM
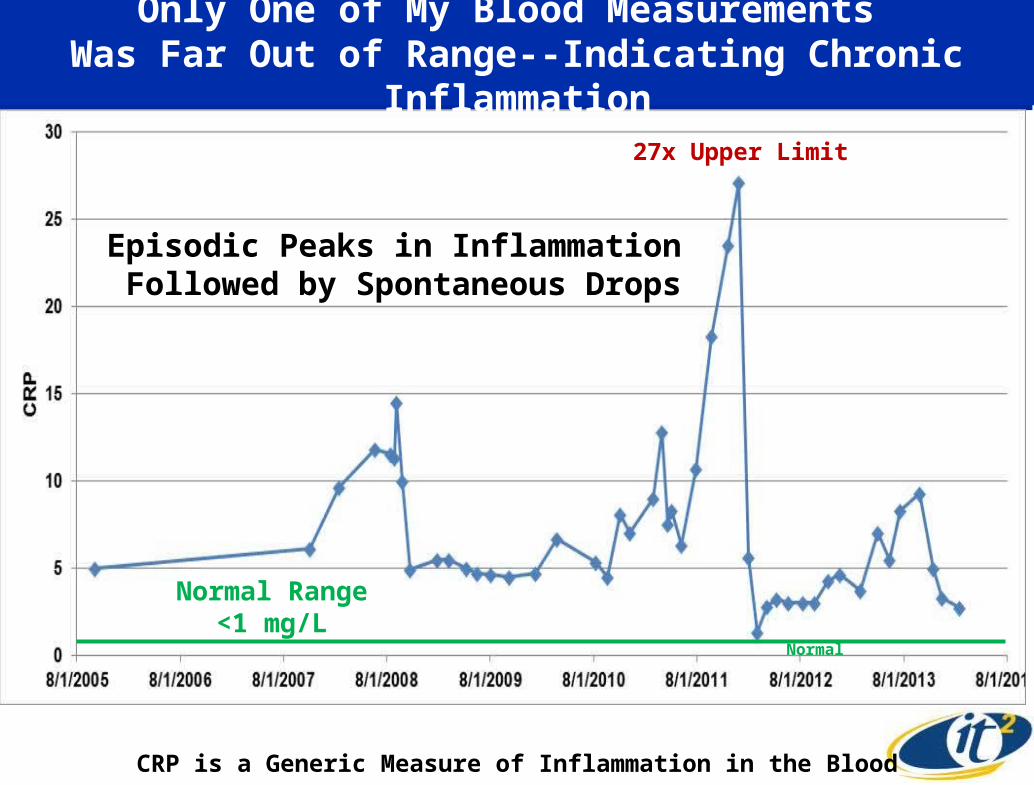
Only One of My Blood Measurements Was Far Out of Range--Indicating Chronic Inflammation
Normal Range<1 mg/L
Normal
27x Upper Limit
CRP is a Generic Measure of Inflammation in the Blood
Episodic Peaks in Inflammation Followed by Spontaneous Drops

White Blood Cell CountIs Near Low End of Healthy Range
Normal Range4-10,000 cells/µL
Normal
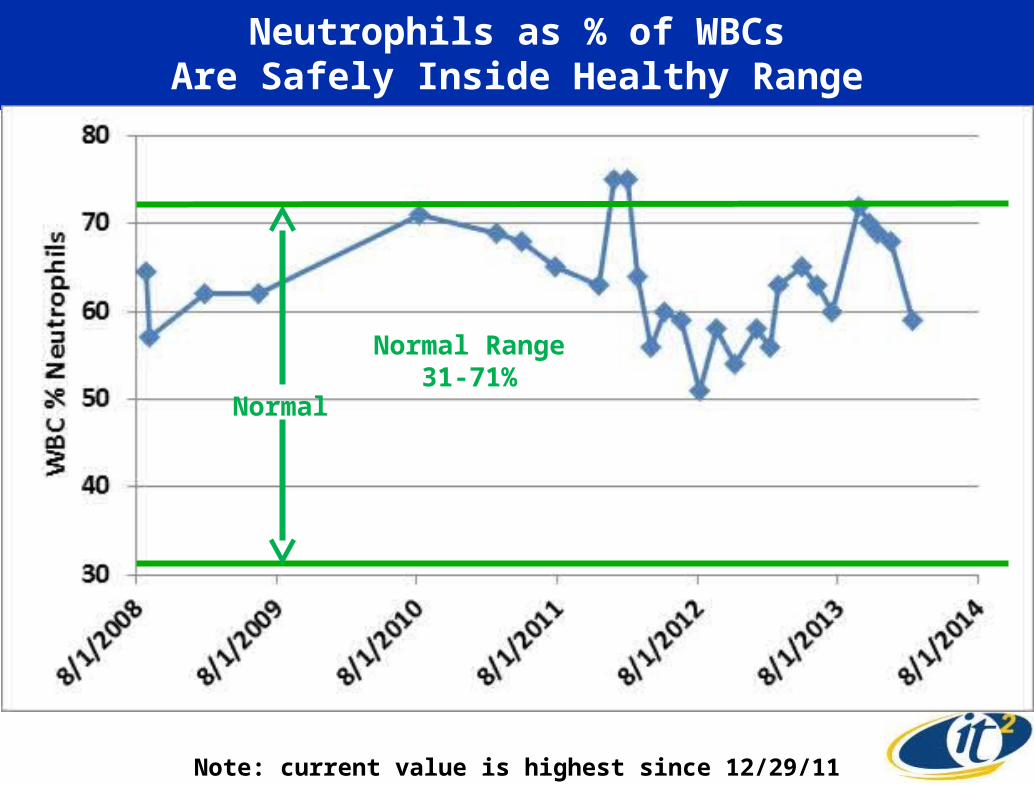
Neutrophils as % of WBCsAre Safely Inside Healthy Range
Normal
Normal Range31-71%
Note: current value is highest since 12/29/11
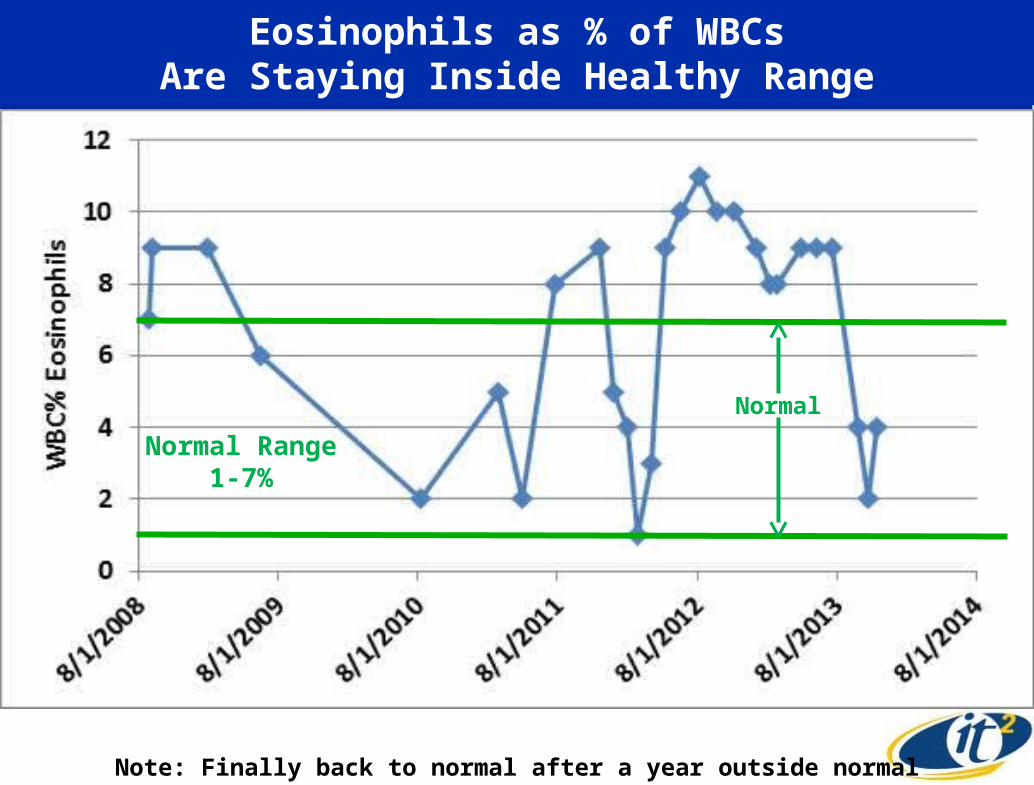
Eosinophils as % of WBCsAre Staying Inside Healthy Range
Normal
Normal Range1-7%
Note: Finally back to normal after a year outside normal
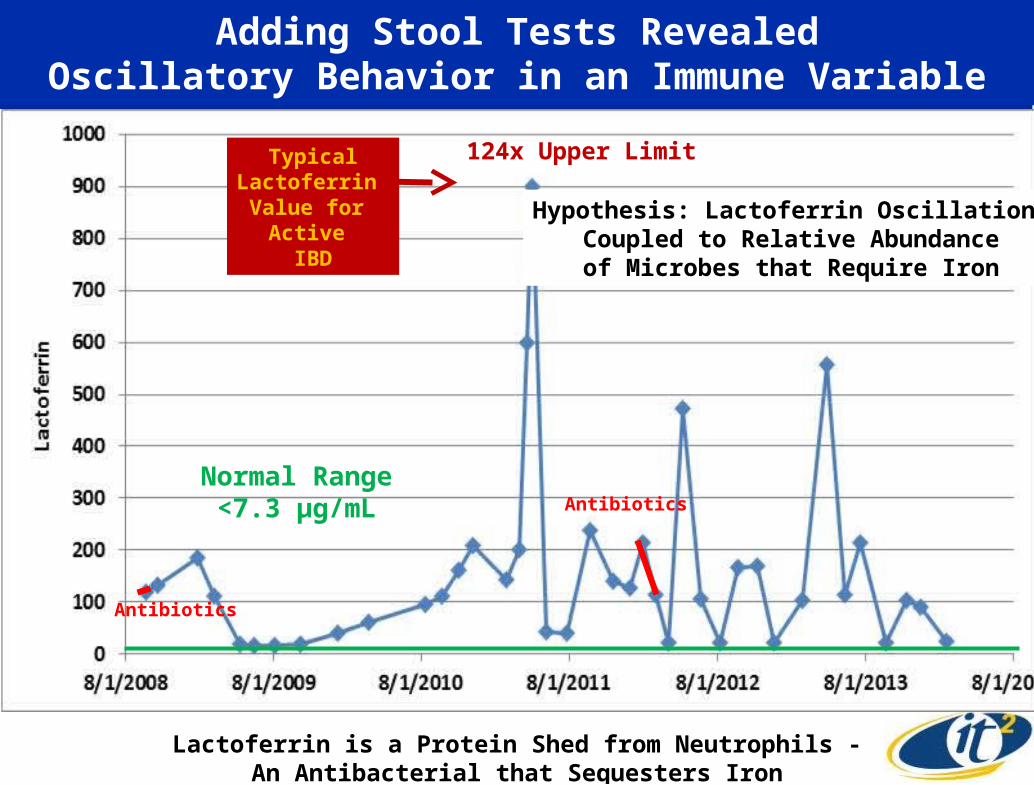
Adding Stool Tests RevealedOscillatory Behavior in an Immune Variable
Normal Range<7.3 µg/mL
124x Upper Limit
Antibiotics
Antibiotics
Lactoferrin is a Protein Shed from Neutrophils -An Antibacterial that Sequesters Iron
TypicalLactoferrin Value for
Active IBD
Hypothesis: Lactoferrin Oscillations Coupled to Relative Abundance
of Microbes that Require Iron
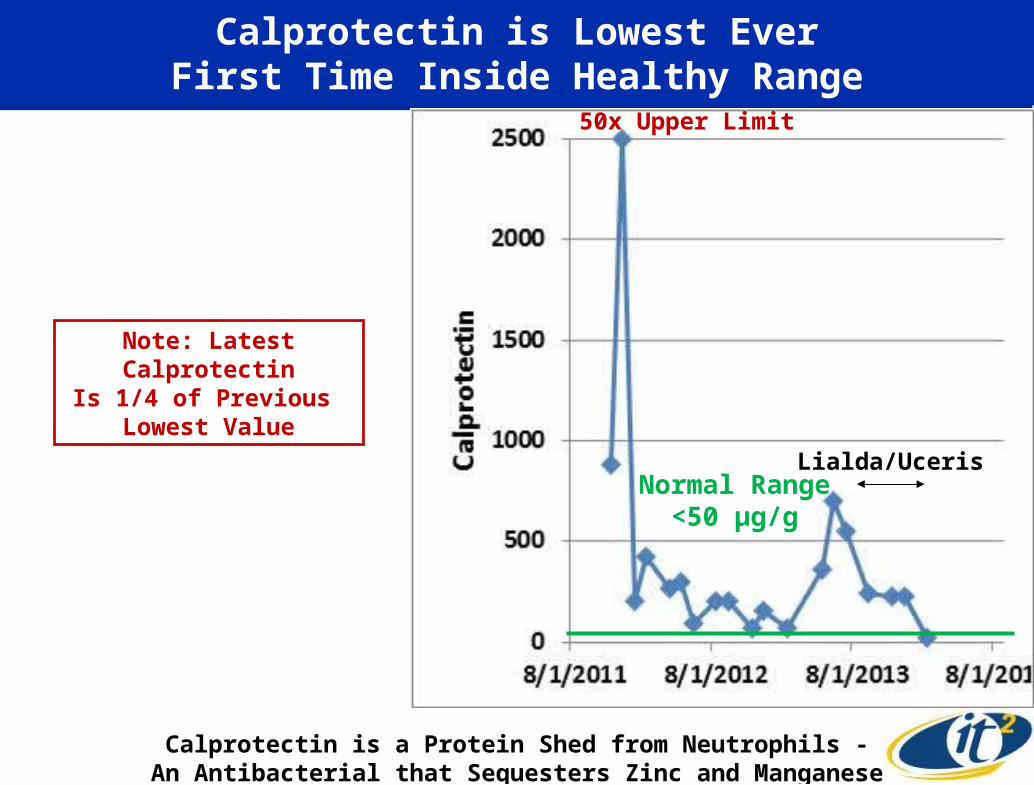
Calprotectin is Lowest EverFirst Time Inside Healthy Range
50x Upper Limit
Calprotectin is a Protein Shed from Neutrophils -An Antibacterial that Sequesters Zinc and Manganese
Normal Range<50 µg/g
Note: Latest CalprotectinIs 1/4 of Previous
Lowest Value
Lialda/Uceris

Putting Multiple Immunological Biomarker Time Series Together, Reveals Major Immune Dysfunction
Green : Inside RangeOrange: 1-10x OverRed: 10-100x OverPurple: >100x Over
Source: Calit2 Future Health Expedition Team
What If Intervention
Had Happened
Here?

Four Immune Biomarkers Over TimeCompared with Four Signs/Symptoms
Here Immune biomarkers are normalized 0 to 1, with 1 being the highest value in five years
Source: Photo of Calit2 64-megapixel VROOM
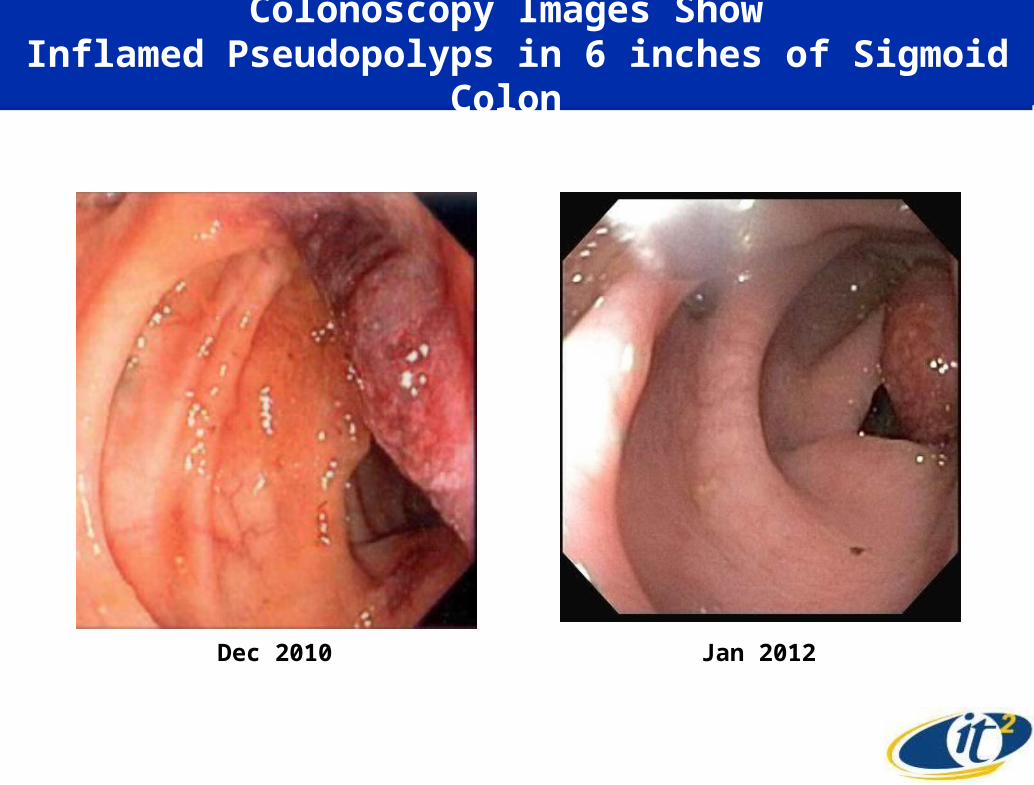
Colonoscopy Images Show Inflamed Pseudopolyps in 6 inches of Sigmoid Colon
Dec 2010 Jan 2012
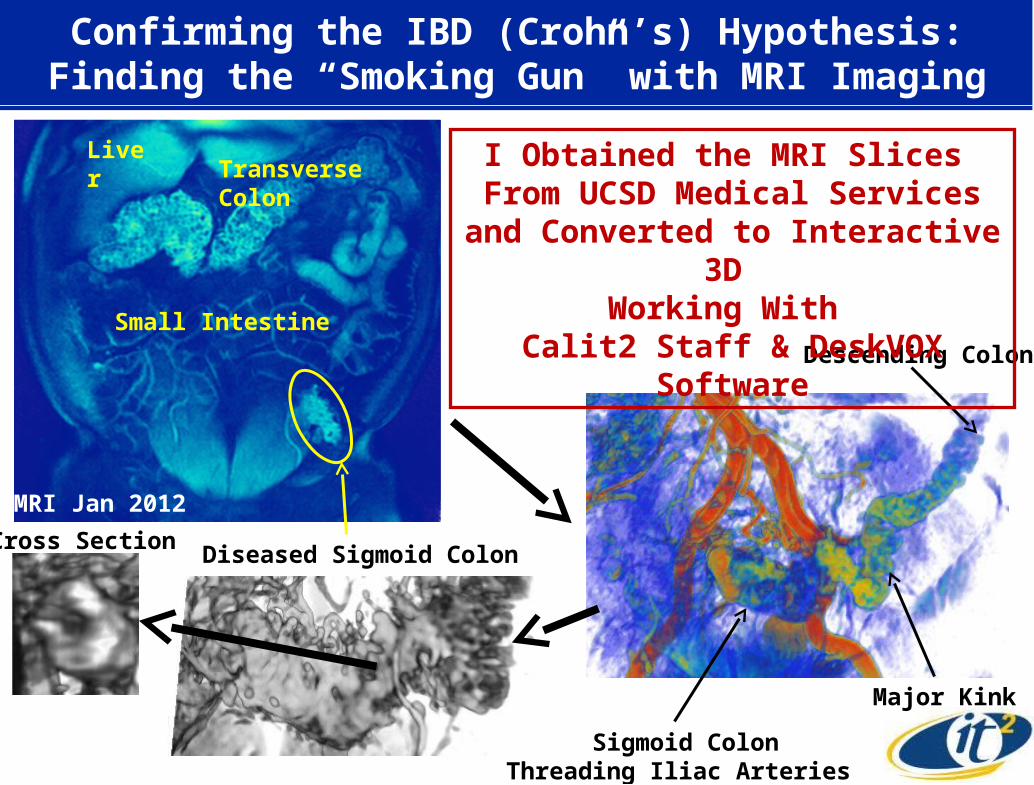
Descending Colon
Sigmoid ColonThreading Iliac Arteries
Major Kink
Confirming the IBD (Crohn’s) Hypothesis:Finding the “Smoking Gun” with MRI Imaging
I Obtained the MRI Slices From UCSD Medical Services
and Converted to Interactive 3D Working With
Calit2 Staff & DeskVOX Software
Transverse ColonLiver
Small Intestine
Diseased Sigmoid ColonCross Section
MRI Jan 2012
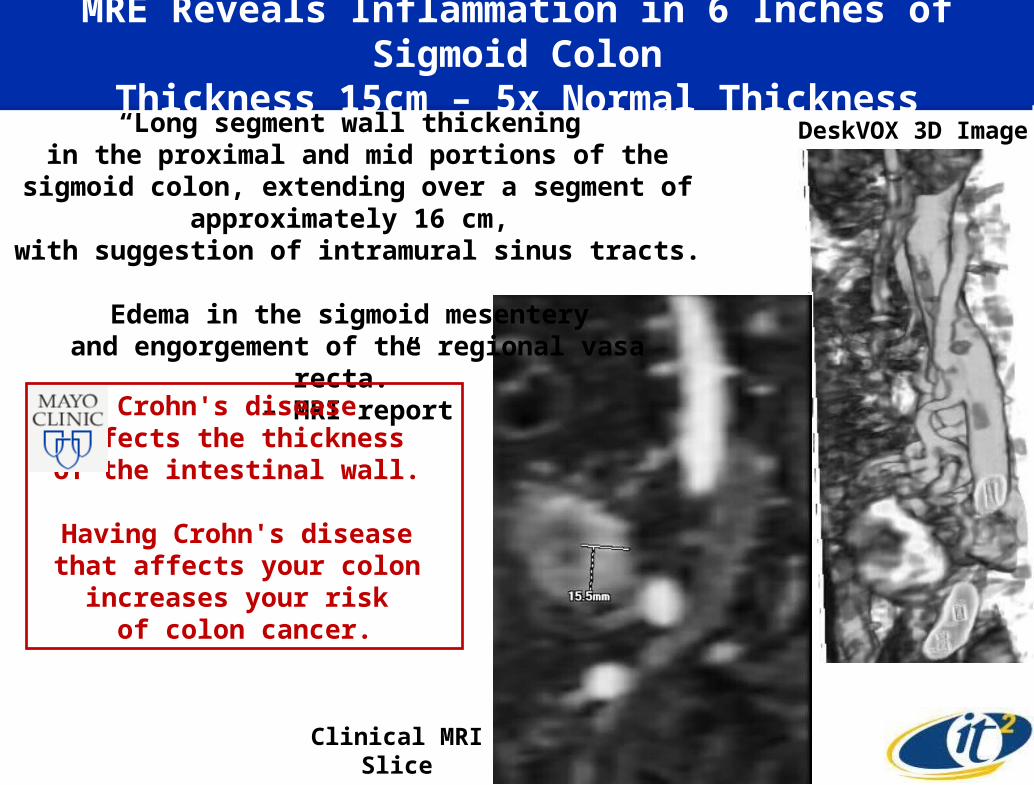
MRE Reveals Inflammation in 6 Inches of Sigmoid ColonThickness 15cm – 5x Normal Thickness
“Long segment wall thickening in the proximal and mid portions of the sigmoid colon,
extending over a segment of approximately 16 cm, with suggestion of intramural sinus tracts.
Edema in the sigmoid mesentery and engorgement of the regional vasa recta.”
– MRI report
Clinical MRI Slice Program
DeskVOX 3D Image
Crohn's disease affects the thickness of the intestinal wall.
Having Crohn's disease that affects your colon
increases your risk of colon cancer.
Why Did I Have an Autoimmune Disease like IBD?
Despite decades of research, the etiology of Crohn's disease
remains unknown. Its pathogenesis may involve a complex interplay between
host genetics, immune dysfunction,
and microbial or environmental factors.--The Role of Microbes in Crohn's Disease
Paul B. Eckburg & David A. RelmanClin Infect Dis. 44:256-262 (2007)
So I Set Out to Quantify All Three!

I Found I Had One of the Earliest Known SNPsAssociated with Crohn’s Disease
From www.23andme.com
SNPs Associated with CD
Polymorphism in Interleukin-23 Receptor Gene
— 80% Higher Risk of Pro-inflammatoryImmune Response
rs1004819
NOD2
IRGM
ATG16L1

There Is Likely a Correlation Between CD SNPsand Where and When the Disease Manifests
Me-MaleCD Onset
At 60-Years Old
Female CD Onset
At 20-Years Old
NOD2 (1)rs2066844
Il-23Rrs1004819
Subject withIleal Crohn’s
Subject withColon Crohn’s
Source: Larry Smarr and 23andme
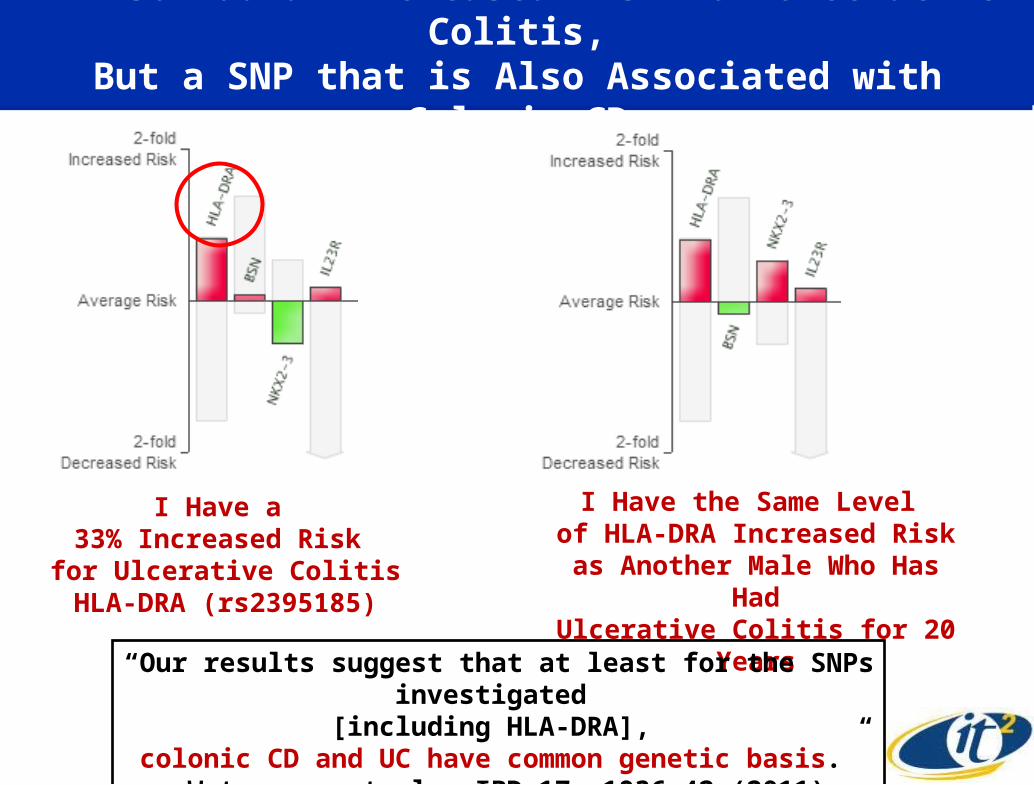
I Also Had an Increased Risk for Ulcerative Colitis,But a SNP that is Also Associated with Colonic CD
I Have a 33% Increased Risk for Ulcerative Colitis
HLA-DRA (rs2395185)
I Have the Same Level of HLA-DRA Increased Risk
as Another Male Who Has HadUlcerative Colitis for 20 Years
“Our results suggest that at least for the SNPs investigated [including HLA-DRA],
colonic CD and UC have common genetic basis.”-Waterman, et al., IBD 17, 1936-42 (2011)

I Compared my 23andme SNPs Withthe 163 Known SNPs Associated with IBD
• The width of the bar is proportional to the variance explained by that locus
• Bars are connected together if they are identified as being associated with both phenotypes
• Loci are labelled if they explain more than 1% of the total variance explained by all loci
“Host–microbe interactions have shaped the genetic architecture of inflammatory bowel disease,” Jostins, et al. Nature 491, 119-124 (2012)

Autoimmune Disease Overlap from SNP GWAS
Gut Lees, et al.60:1739-1753
(2011)
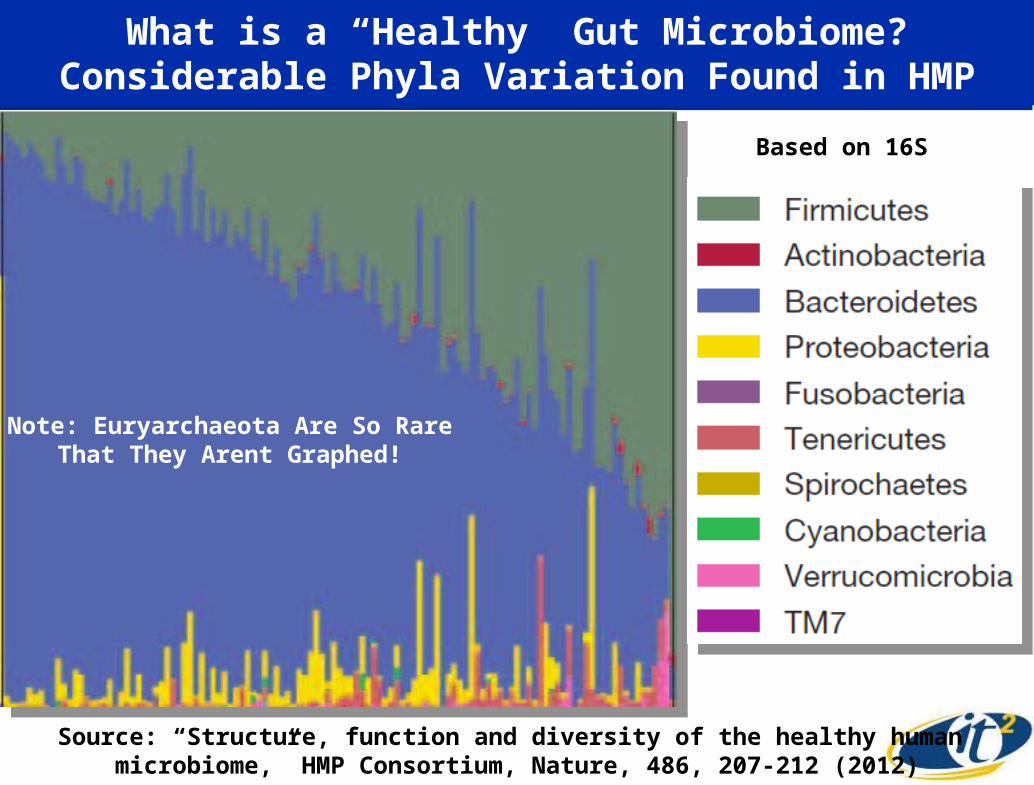
What is a “Healthy” Gut Microbiome?Considerable Phyla Variation Found in HMP
Source: “Structure, function and diversity of the healthy human microbiome,” HMP Consortium, Nature, 486, 207-212 (2012)
Note: Euryarchaeota Are So RareThat They Arent Graphed!
Based on 16S
We Used Dell’s Supercomputer (Sanger) to Analyze additional 219 HMP and 110 MetaHIT samples
• Dell’s Sanger cluster– 32 nodes, 512 cores,
– 48GB RAM per node
– 50GB SSD local drive, 390TB Lustre file system
• We used faster but less sensitive method with a smaller reference DB (duo to available 48GB RAM)
• Only processed to taxonomy mapping– ~35,000 Core-Hrs on Dell’s Sanger
– 30 TB data
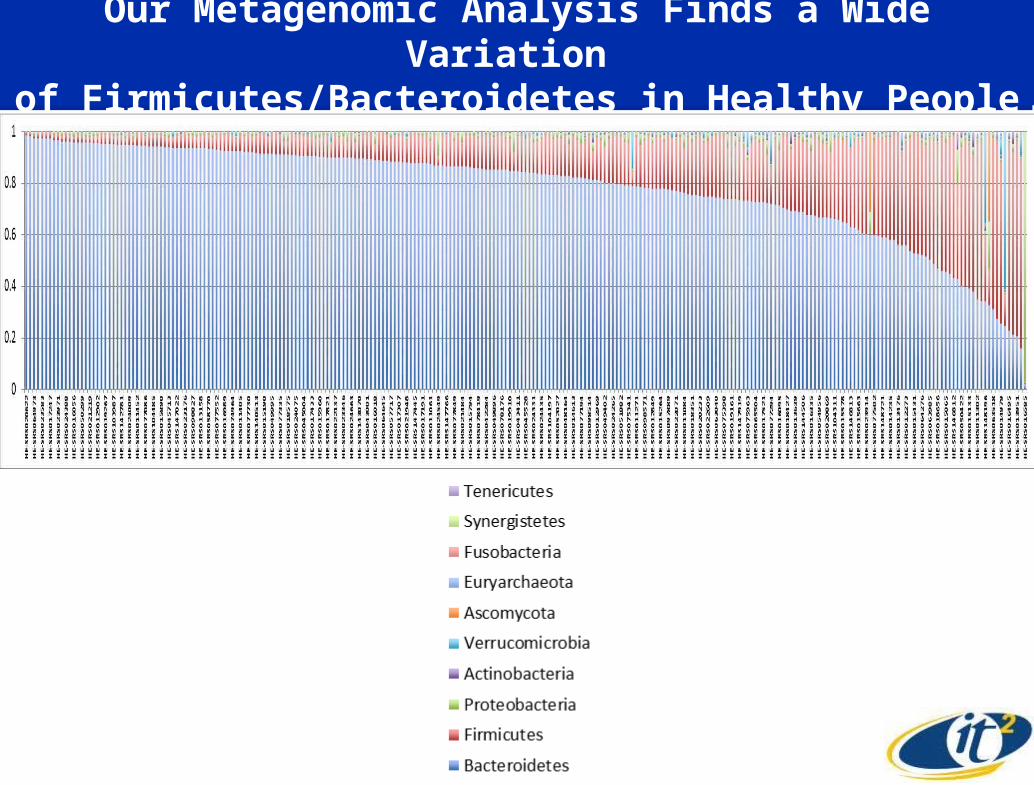
Our Metagenomic Analysis Finds a Wide Variation of Firmicutes/Bacteroidetes in Healthy People

Problem: You Can’t Assume 16S Will Agree in Detail With Metagenomics on Same DNA Extraction
Source: Weizhong Li, UCSD; Sequencing JCVI
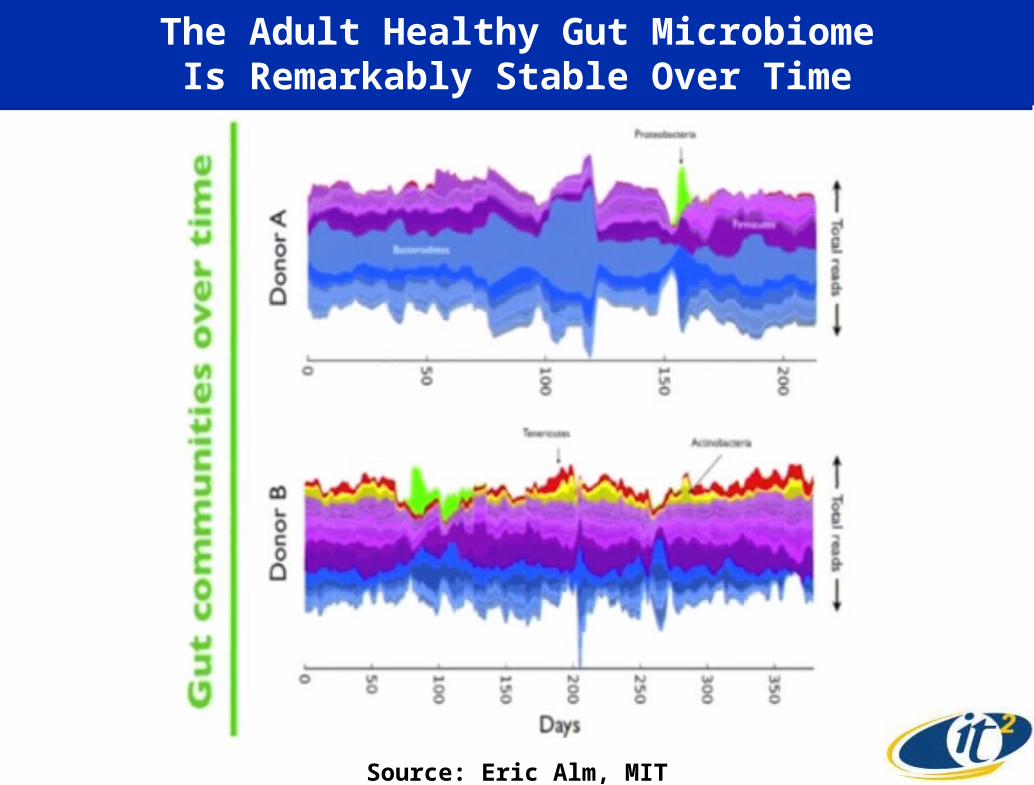
The Adult Healthy Gut MicrobiomeIs Remarkably Stable Over Time
Source: Eric Alm, MIT
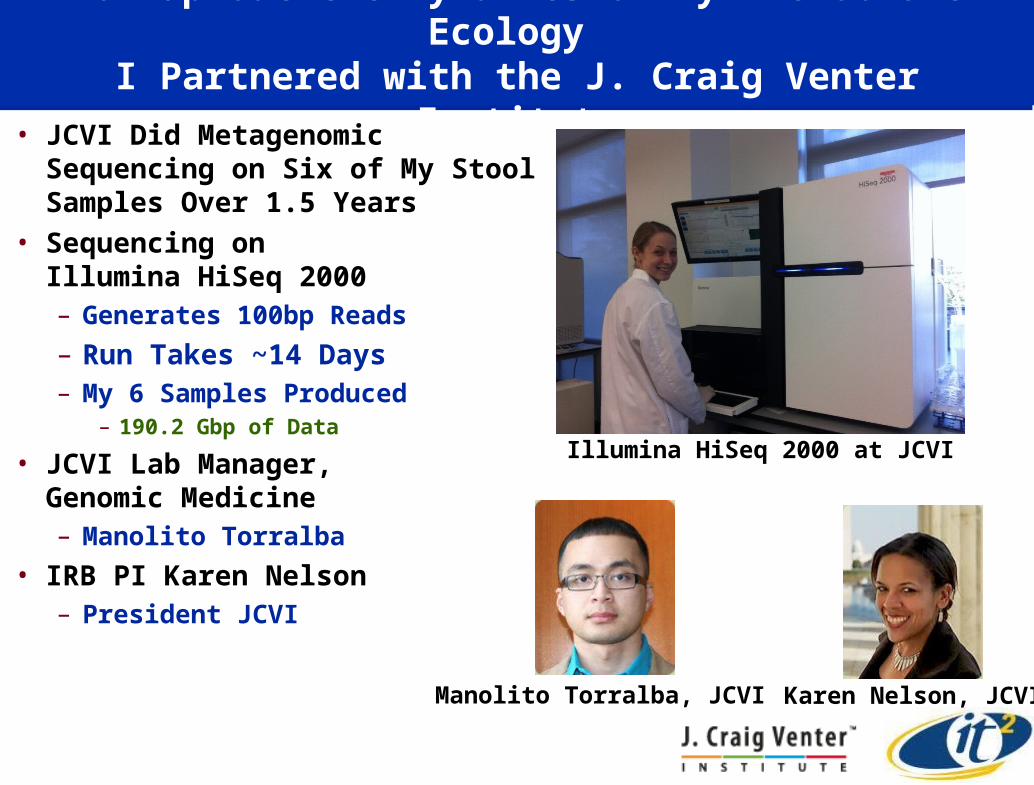
To Map Out the Dynamics of My Microbiome Ecology I Partnered with the J. Craig Venter Institute
• JCVI Did Metagenomic Sequencing on Six of My Stool Samples Over 1.5 Years
• Sequencing on Illumina HiSeq 2000 – Generates 100bp Reads
– Run Takes ~14 Days – My 6 Samples Produced
– 190.2 Gbp of Data
• JCVI Lab Manager, Genomic Medicine– Manolito Torralba
• IRB PI Karen Nelson– President JCVI
Illumina HiSeq 2000 at JCVI
Manolito Torralba, JCVI Karen Nelson, JCVI

We Downloaded Additional Phenotypes from NIH HMP For Comparative Analysis
5 Ileal Crohn’s Patients, 3 Points in Time
2 Ulcerative Colitis Patients, 6 Points in Time
“Healthy” Individuals
Download Raw Reads~100M Per Person
Source: Jerry Sheehan, Calit2Weizhong Li, Sitao Wu, CRBS, UCSD
Total of 5 Billion Reads
IBD Patients
35 Subjects1 Point in Time
Larry Smarr6 Points in Time
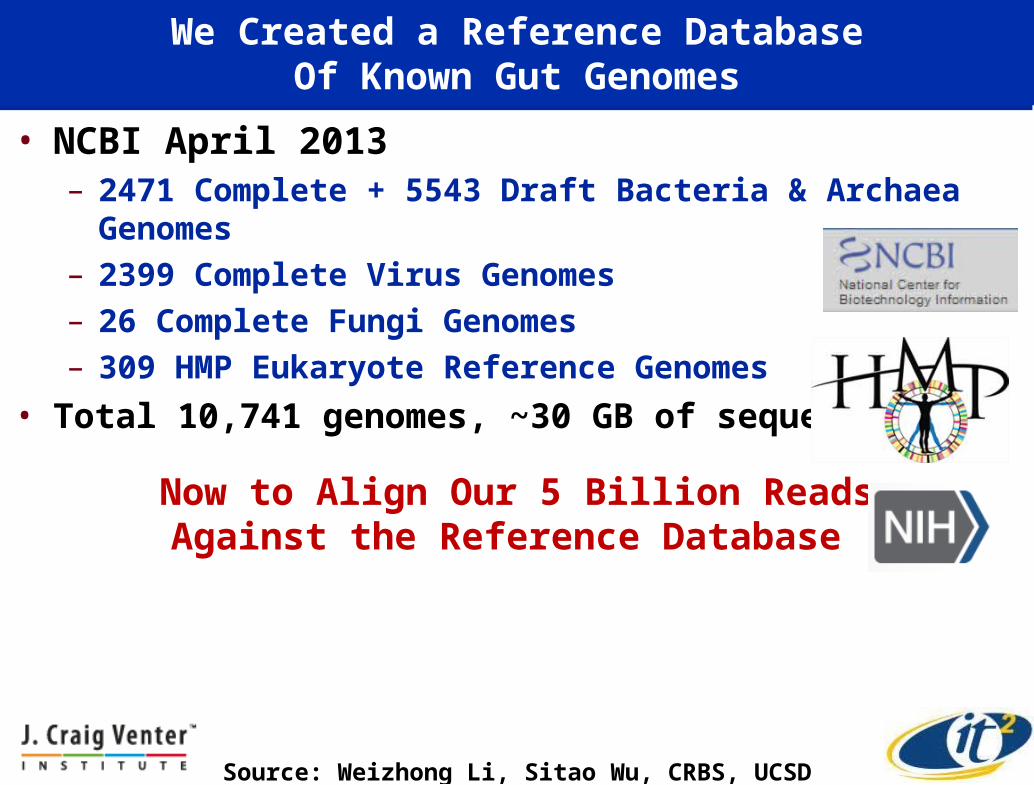
We Created a Reference DatabaseOf Known Gut Genomes
• NCBI April 2013– 2471 Complete + 5543 Draft Bacteria & Archaea Genomes– 2399 Complete Virus Genomes– 26 Complete Fungi Genomes– 309 HMP Eukaryote Reference Genomes
• Total 10,741 genomes, ~30 GB of sequences
Now to Align Our 5 Billion ReadsAgainst the Reference Database
Source: Weizhong Li, Sitao Wu, CRBS, UCSD

Computational NextGen Sequencing Pipeline:From “Big Equations” to “Big Data” Computing
PI: (Weizhong Li, CRBS, UCSD): NIH R01HG005978 (2010-2013, $1.1M)

We Used SDSC’s Gordon Data-Intensive Supercomputer to Analyze a Wide Range of Gut Microbiomes
• ~180,000 Core-Hrs on Gordon– KEGG function annotation: 90,000 hrs– Mapping: 36,000 hrs
– Used 16 Cores/Node and up to 50 nodes
– Duplicates removal: 18,000 hrs– Assembly: 18,000 hrs– Other: 18,000 hrs
• Gordon RAM Required– 64GB RAM for Reference DB– 192GB RAM for Assembly
• Gordon Disk Required– Ultra-Fast Disk Holds Ref DB for All Nodes– 8TB for All Subjects
Enabled by a Grant of Time
on Gordon from SDSC Director Mike Norman
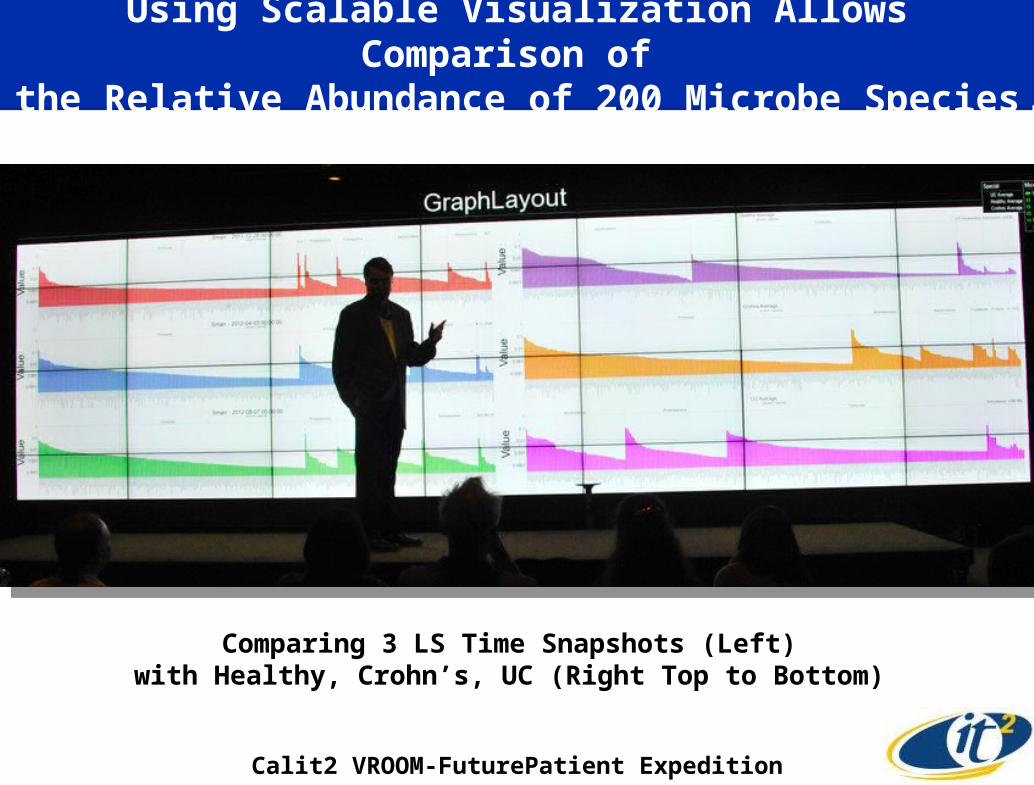
Using Scalable Visualization Allows Comparison of the Relative Abundance of 200 Microbe Species
Calit2 VROOM-FuturePatient Expedition
Comparing 3 LS Time Snapshots (Left) with Healthy, Crohn’s, UC (Right Top to Bottom)
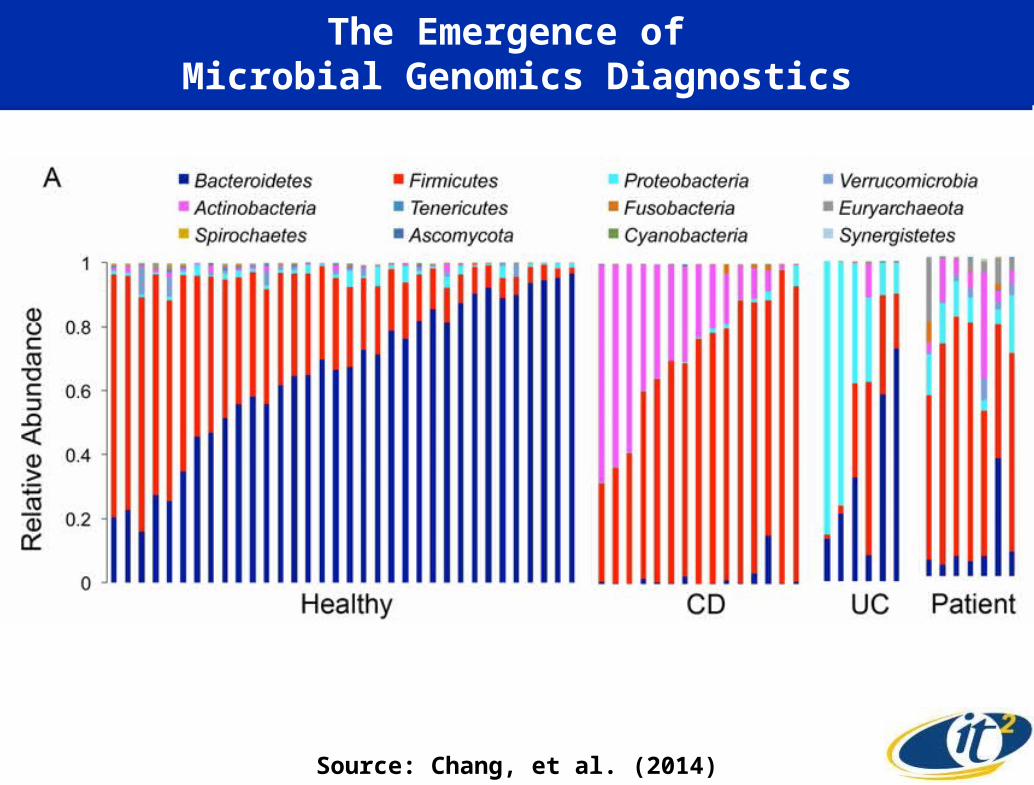
The Emergence of Microbial Genomics Diagnostics
Source: Chang, et al. (2014)
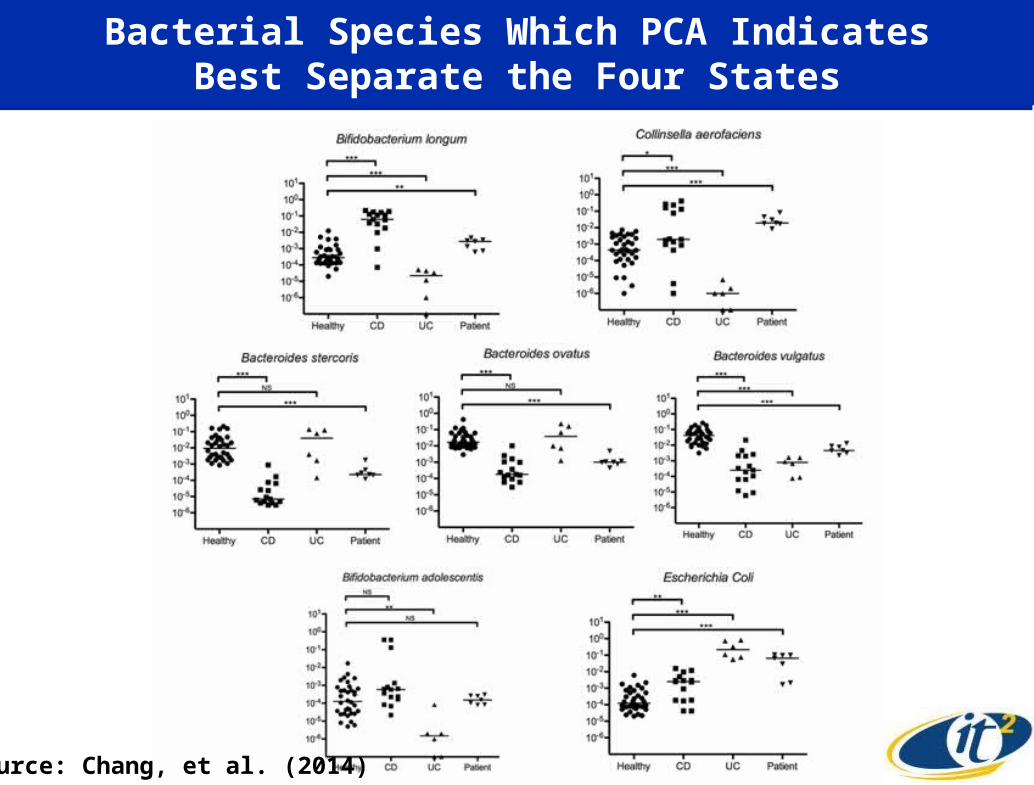
Bacterial Species Which PCA IndicatesBest Separate the Four States
Source: Chang, et al. (2014)

Lessons from Ecological Dynamics I: Gut Microbiome Has Multiple Relatively Stable Equilibria
“The Application of Ecological Theory Toward an Understanding of the Human Microbiome,” Elizabeth Costello, Keaton Stagaman, Les Dethlefsen, Brendan Bohannan, David RelmanScience 336, 1255-62 (2012)
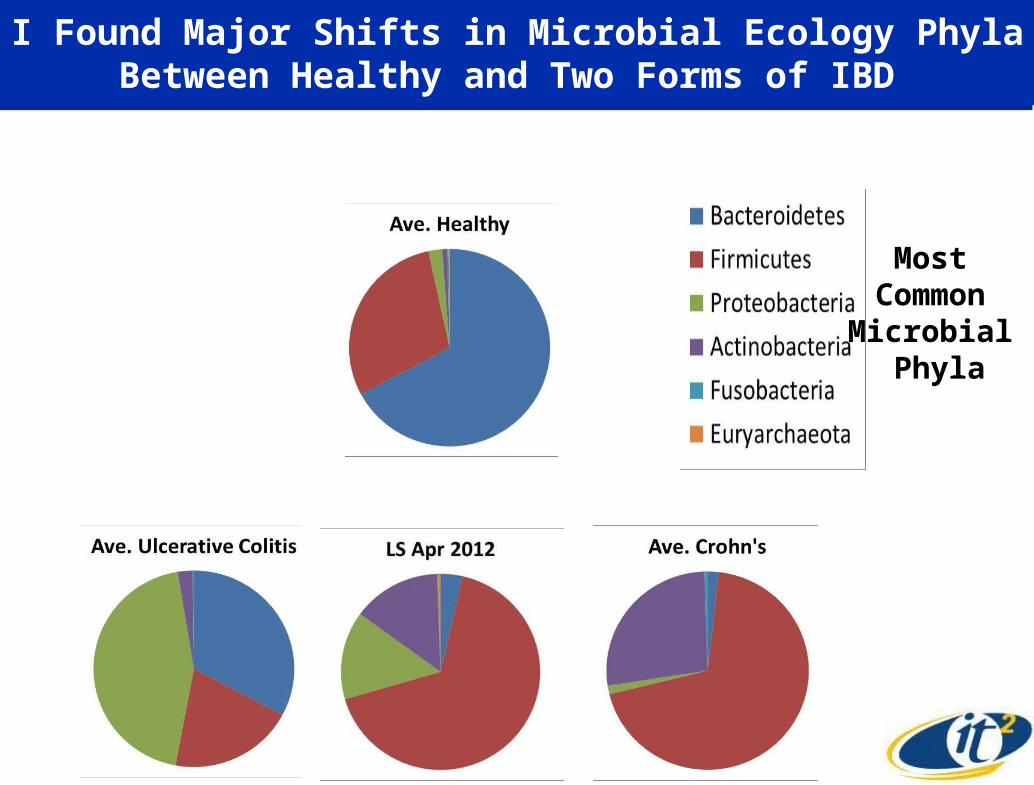
I Found Major Shifts in Microbial Ecology PhylaBetween Healthy and Two Forms of IBD
Most Common Microbial
Phyla

Lessons From Ecological Dynamics II:Invasive Species Dominate After Major Species Destroyed
”In many areas following these burns invasive species are able to establish themselves,
crowding out native species.”
Source: Ponderosa Pine Fire Ecologyhttp://cpluhna.nau.edu/Biota/ponderosafire.htm

Almost All Abundant Species (≥1%) in Healthy SubjectsAre Severely Depleted in Larry’s Gut Microbiome
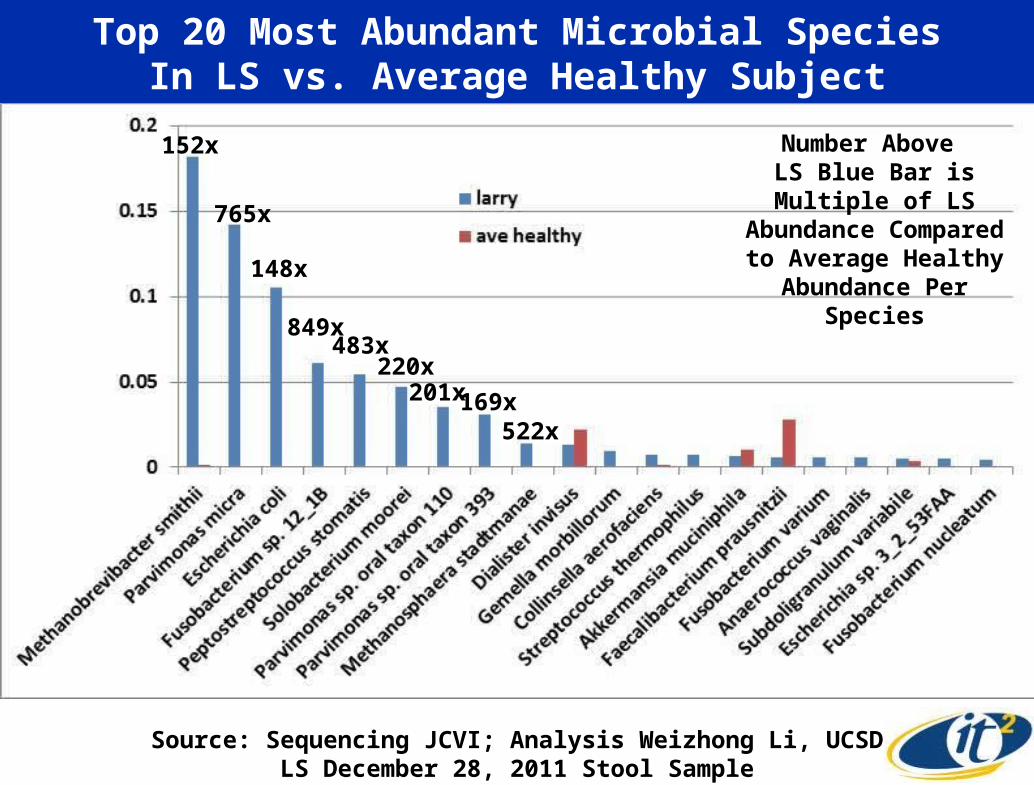
Top 20 Most Abundant Microbial SpeciesIn LS vs. Average Healthy Subject
152x
765x
148x
849x483x
220x201x
522x169x
Number Above LS Blue Bar is Multiple
of LS Abundance Compared to Average Healthy Abundance
Per Species
Source: Sequencing JCVI; Analysis Weizhong Li, UCSDLS December 28, 2011 Stool Sample

Comparing Changes in Gut Microbiome Ecology with Oscillations of the Innate and Adaptive Immune System
Normal
Innate Immune System
Normal
Adaptive Immune System
Time Points of Metagenomic Sequencing
of LS Stool Samples
Therapy: 1 Month Antibiotics+2 Month Prednisone
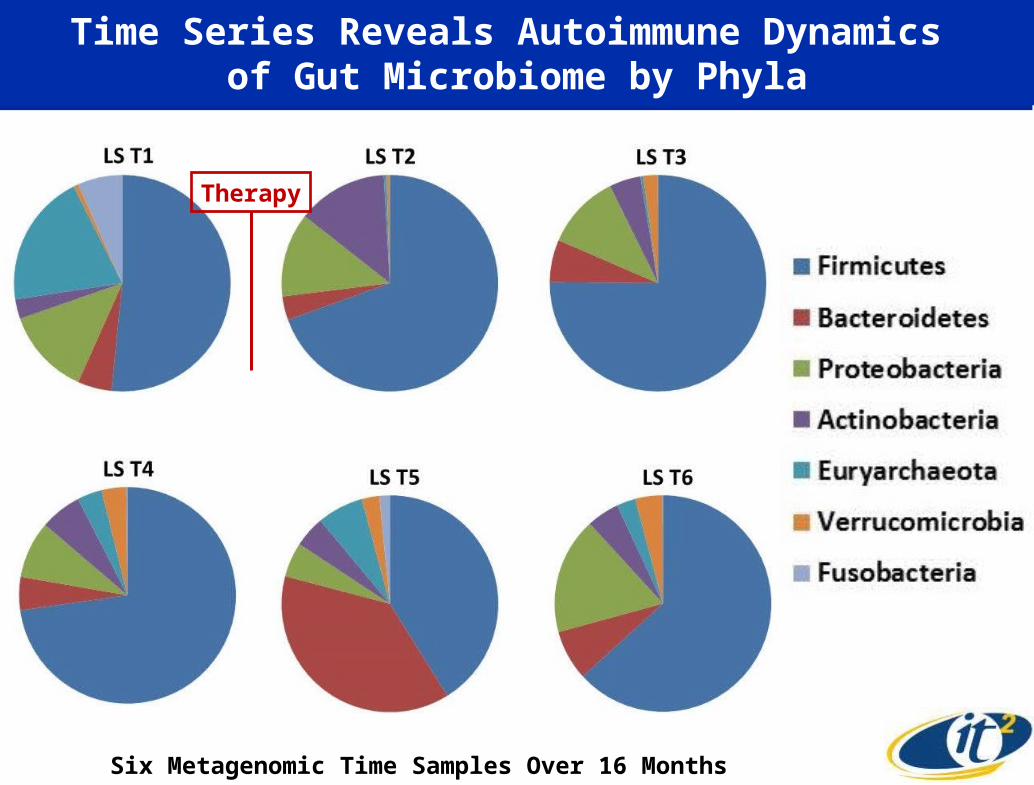
Time Series Reveals Autoimmune Dynamics of Gut Microbiome by Phyla
Therapy
Six Metagenomic Time Samples Over 16 Months
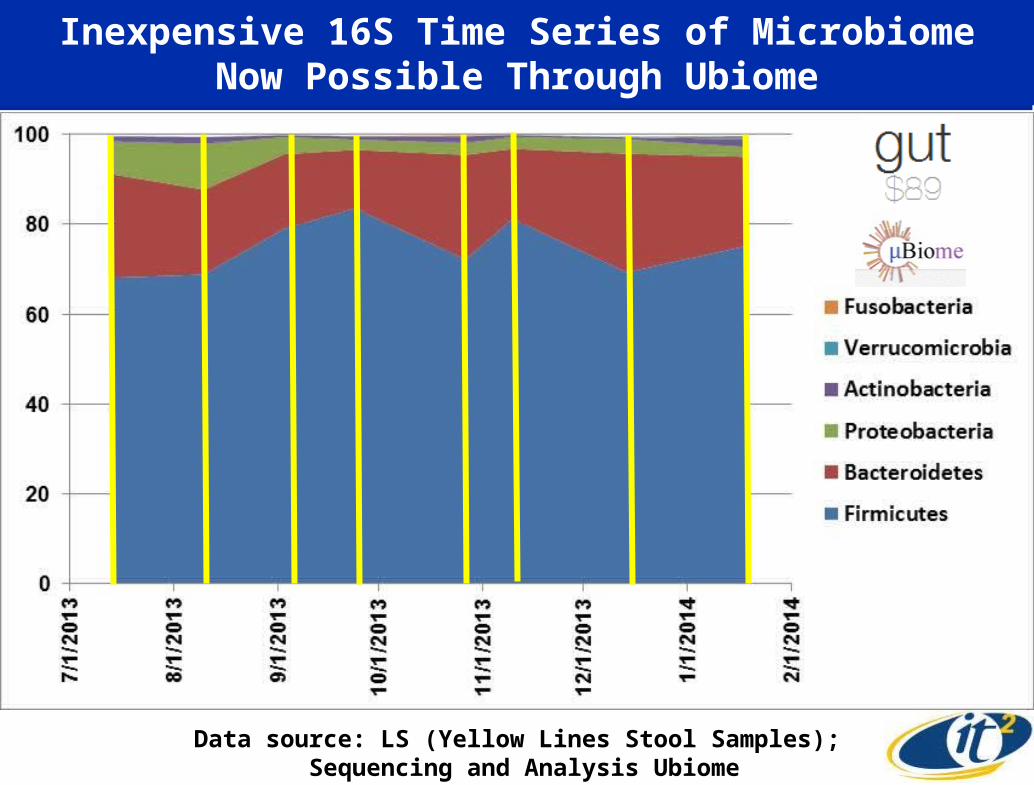
Inexpensive 16S Time Series of MicrobiomeNow Possible Through Ubiome
Data source: LS (Yellow Lines Stool Samples); Sequencing and Analysis Ubiome
Thanks to Our Great Team!
UCSD Metagenomics Team
Weizhong LiSitao Wu
Calit2@UCSD Future Patient Team
Jerry SheehanTom DeFantiKevin PatrickJurgen SchulzeAndrew PrudhommePhilip WeberFred RaabJoe KeefeErnesto Ramirez
JCVI Team
Karen NelsonShibu YoosephManolito Torralba
SDSC Team
Michael NormanMahidhar Tatineni Robert Sinkovits
UCSD Health Sciences Team
William J. SandbornElisabeth EvansJohn ChangBrigid BolandDavid Brenner