from numbers to graphs: the proper way to evaluate data ... · man-computer symbiosis j.c.r....
TRANSCRIPT
From Numbers to Graphs: The Proper Way to Evaluate Data Science Models
Vassilios S. Verykios
Professor, School of Sciences and Technology
Hellenic Open University

Artificial Intelligence
Herbert A. Simon
(1916-2001)
• An American economist and political scientist
• A pioneer in the field of AI
• Turing Award, Nobel Prize of Economics, National Medal of Science, …
“computer chess would surpass human chess abilities within ten years”, 1957
In reality, that transition took about forty years…
From Numbers to Graphs: The Proper Way to Evaluate Data Science Models

Man-Computer Symbiosis
J.C.R. Licklider
(1915-1990)
• An American psychologist and computer scientist
• A pioneer in the fields of AI, cybernetics and Internet
“Men will set the goals, formulate the hypotheses, determine the criteria, and perform the evaluations. Computing machines will do the routinizable work that must be done to prepare the way for insights and decisions in technical and scientific thinking”
From Numbers to Graphs: The Proper Way to Evaluate Data Science Models
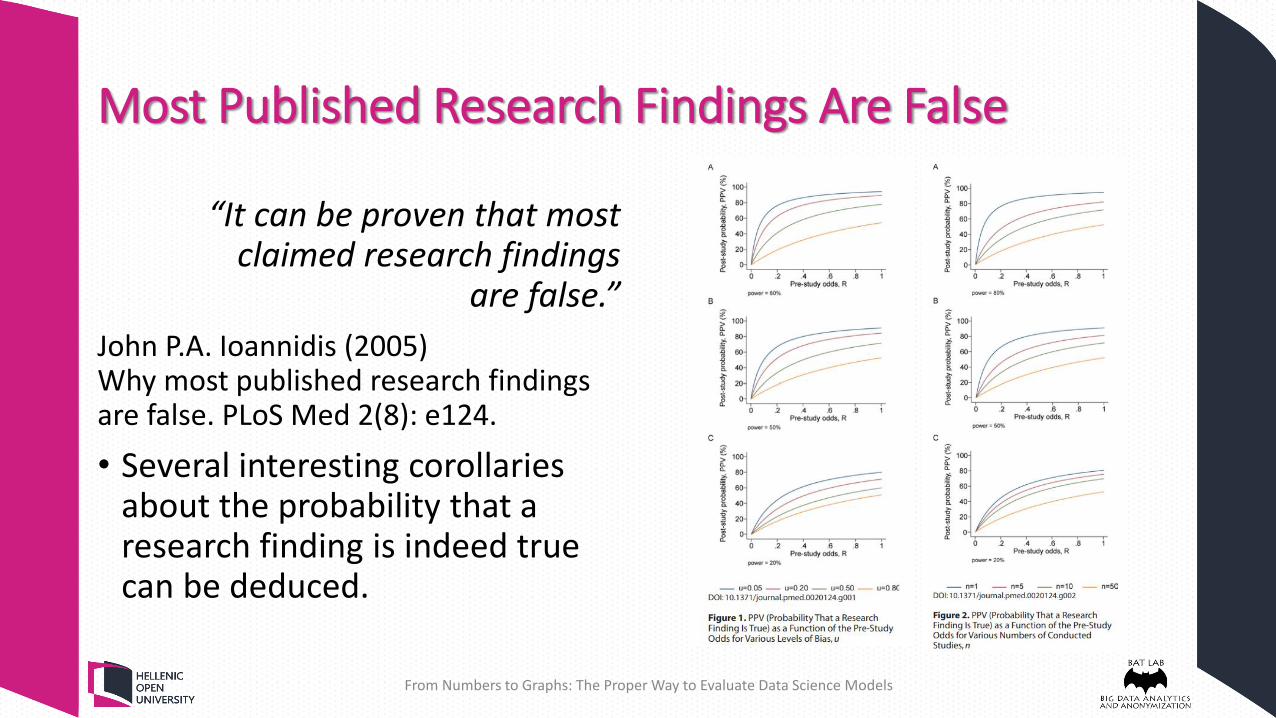
Most Published Research Findings Are False
“It can be proven that most claimed research findings
are false.”
John P.A. Ioannidis (2005) Why most published research findings are false. PLoS Med 2(8): e124.
• Several interesting corollaries about the probability that a research finding is indeed true can be deduced.
From Numbers to Graphs: The Proper Way to Evaluate Data Science Models

Doctors Do Not Think Statistically
• In an excerpt from his new book
• Lewis examines how Tversky and Kahneman influenced a Toronto doctor who helps trauma surgeons
• Avoid errors in judgment when life and death are on the line
From Numbers to Graphs: The Proper Way to Evaluate Data Science Models

The “Moneyball” effect
• Examines the unlikely success of the small-market Oakland A’s baseball team and their idiosyncratic general manager, Billy Beane
• Who build a team of undervalued talent by taking a sophisticated sabermetric approach towards scouting and analyzing players.
From Numbers to Graphs: The Proper Way to Evaluate Data Science Models

4th Industrial Revolution (Klaus Schwab)
From Numbers to Graphs: The Proper Way to Evaluate Data Science Models

Petabyte Age
• Rapidly developing technology
• Automatic collection of information
• Storing, indexing and retrieving data
From Numbers to Graphs: The Proper Way to Evaluate Data Science Models
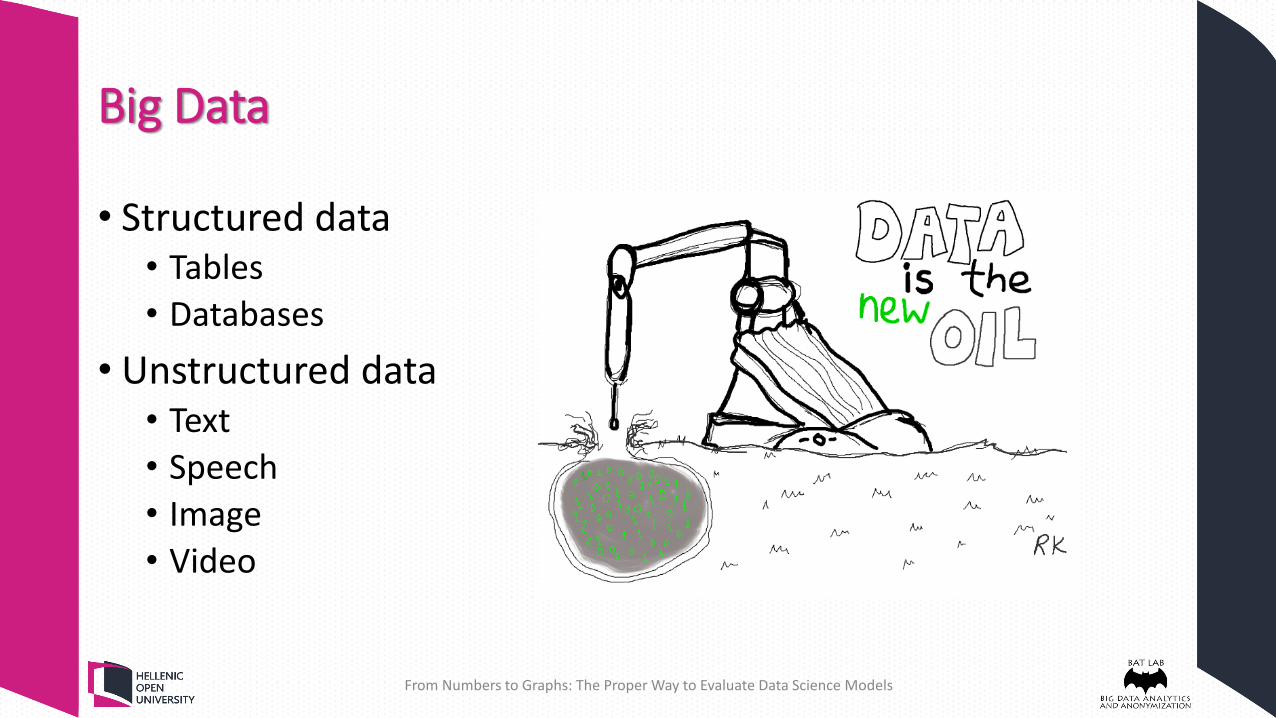
Big Data
• Structured data • Tables
• Databases
• Unstructured data • Text
• Speech
• Image
• Video
From Numbers to Graphs: The Proper Way to Evaluate Data Science Models

Data Mining Process
• Iterative process
• Problem understanding
• Model building
• Model evaluation
From Numbers to Graphs: The Proper Way to Evaluate Data Science Models

Decision Analytic Thinking: What Is a Good Model?
• It is important for data scientists and other stakeholders to be able to evaluate the mining results
• This is not always possible, because • the systems are inadequate
• gathering the right data is too costly
• it is difficult to assess causality
• There is no “single” evaluation metric, since every application is different (classification, regression, etc. )
• We concentrate on setting up frameworks and evaluation metrics for classification problems
• We describe a general framework using expected value
From Numbers to Graphs: The Proper Way to Evaluate Data Science Models

A Key Analytical Framework: Expected Value
• The expected value computation provides a framework that is extremely useful in organizing thinking
• It decomposes data-analytic thinking into • the structure of the problem
• the elements of the analysis that can be extracted from the data
• the elements of the analysis that need to be acquired from other sources
𝐸𝑉 = 𝑝 𝑜1 𝑣 𝑜1 + 𝑝 𝑜2 𝑣 𝑜2
+ 𝑝 𝑜3 𝑣 𝑜3 …
• 𝑜𝑖 is a possible decision outcome
• 𝑝(𝑜𝑖) is its probability
• 𝑣(𝑜𝑖) is its value
From Numbers to Graphs: The Proper Way to Evaluate Data Science Models
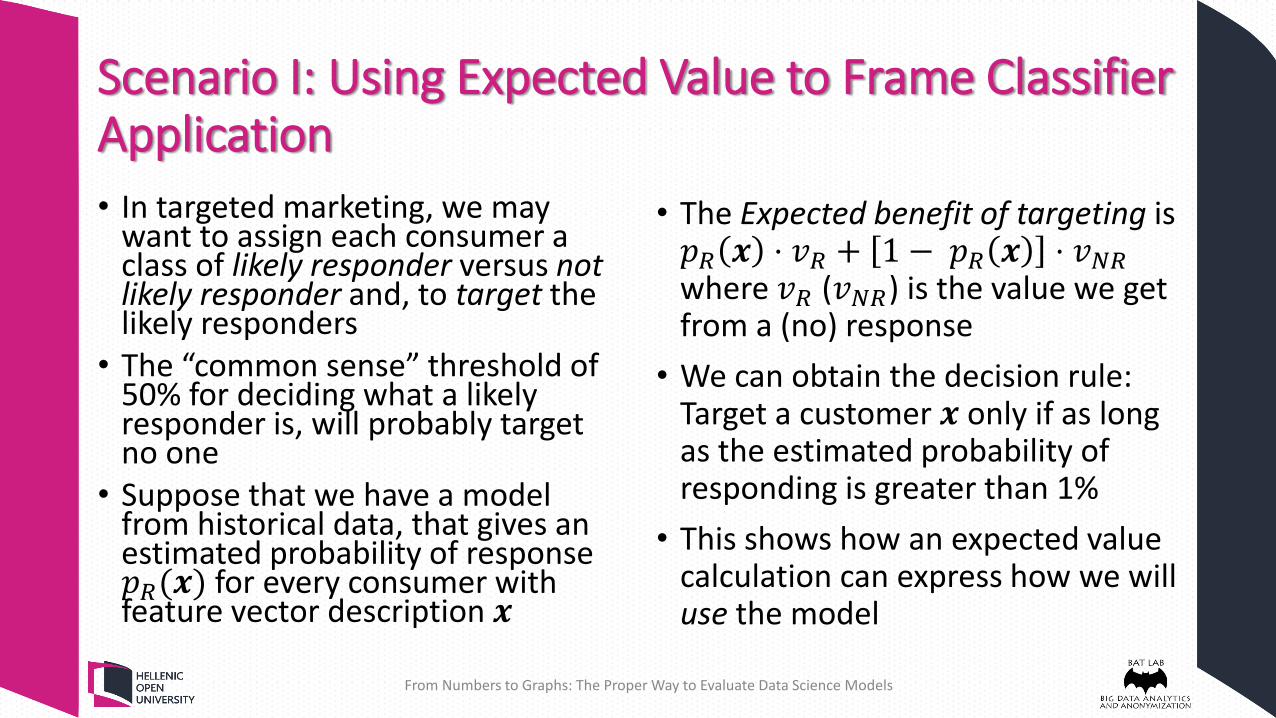
Scenario I: Using Expected Value to Frame Classifier Application
• In targeted marketing, we may want to assign each consumer a class of likely responder versus not likely responder and, to target the likely responders
• The “common sense” threshold of 50% for deciding what a likely responder is, will probably target no one
• Suppose that we have a model from historical data, that gives an estimated probability of response 𝑝𝑅(𝒙) for every consumer with feature vector description 𝒙
• The Expected benefit of targeting is 𝑝𝑅 𝒙 ⋅ 𝑣𝑅 + 1 − 𝑝𝑅 𝒙 ⋅ 𝑣𝑁𝑅 where 𝑣𝑅 (𝑣𝑁𝑅) is the value we get from a (no) response
• We can obtain the decision rule: Target a customer 𝒙 only if as long as the estimated probability of responding is greater than 1%
• This shows how an expected value calculation can express how we will use the model
From Numbers to Graphs: The Proper Way to Evaluate Data Science Models
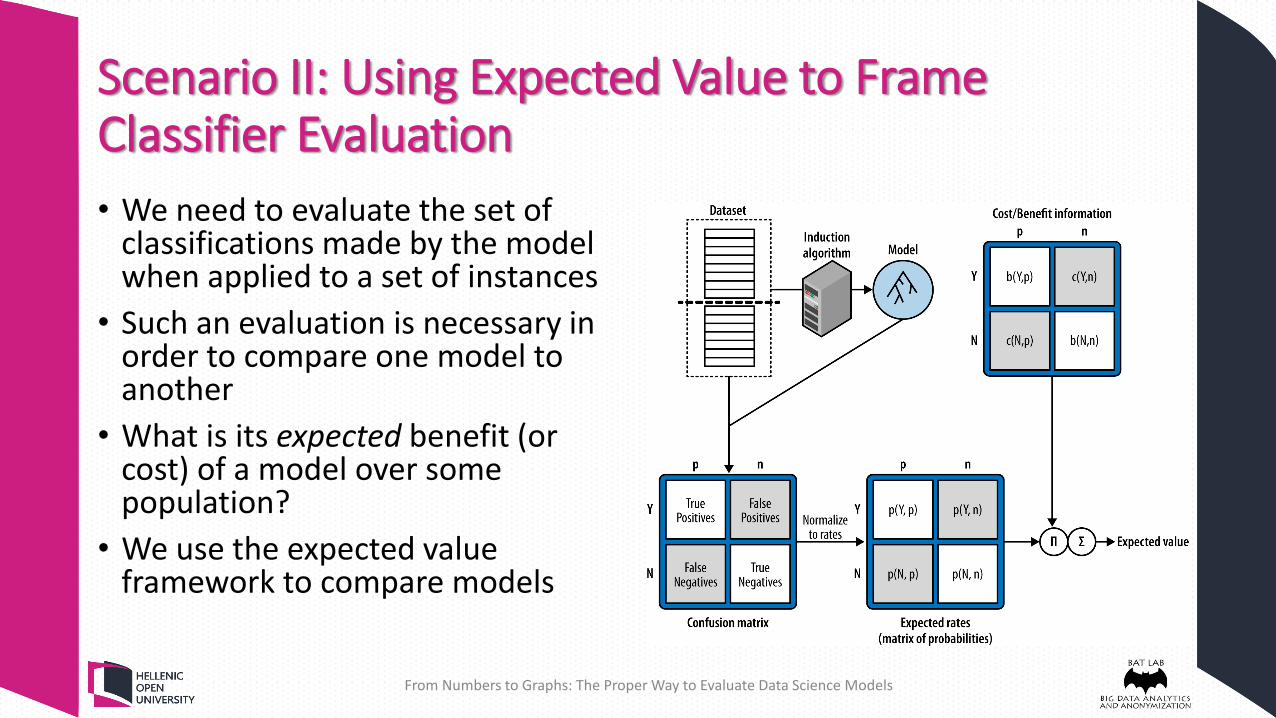
Scenario II: Using Expected Value to Frame Classifier Evaluation
• We need to evaluate the set of classifications made by the model when applied to a set of instances
• Such an evaluation is necessary in order to compare one model to another
• What is its expected benefit (or cost) of a model over some population?
• We use the expected value framework to compare models
From Numbers to Graphs: The Proper Way to Evaluate Data Science Models
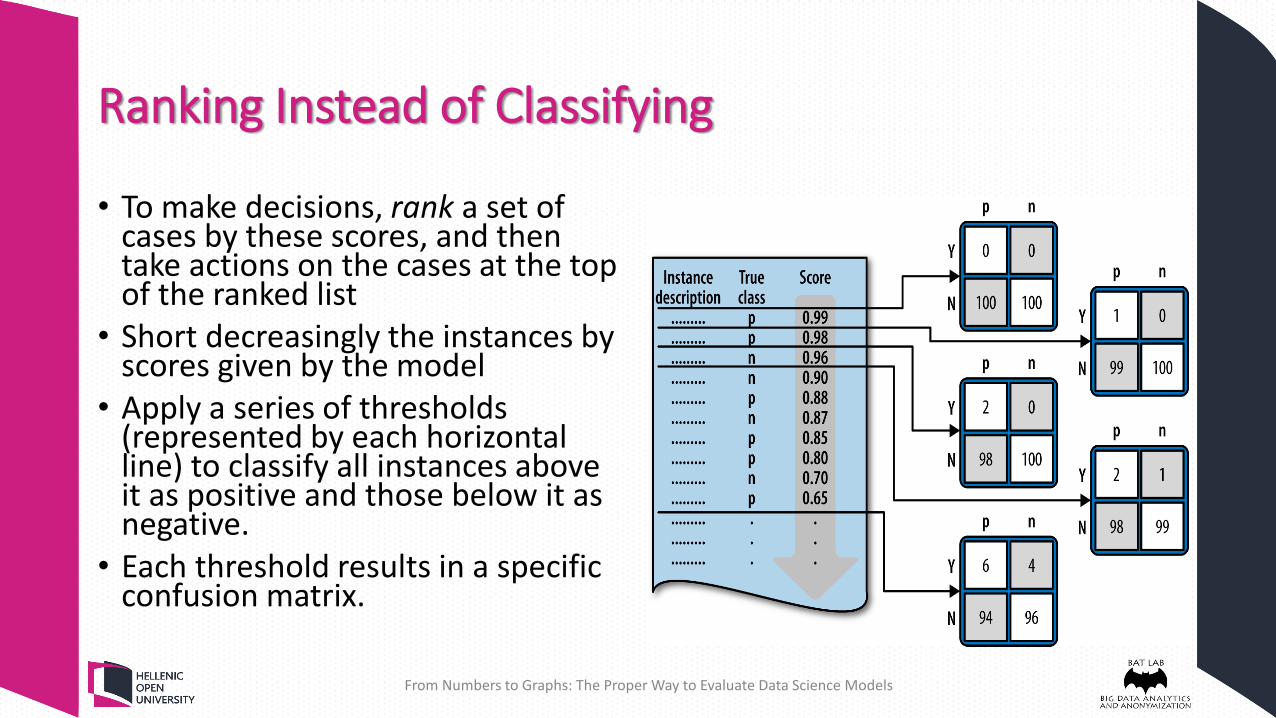
Ranking Instead of Classifying
• To make decisions, rank a set of cases by these scores, and then take actions on the cases at the top of the ranked list
• Short decreasingly the instances by scores given by the model
• Apply a series of thresholds (represented by each horizontal line) to classify all instances above it as positive and those below it as negative.
• Each threshold results in a specific confusion matrix.
From Numbers to Graphs: The Proper Way to Evaluate Data Science Models

Profit Curves
• Curves are based on the idea of examining the effect of thresholding the value of a scoring model at successive points, implicitly dividing the list of instances into many successive sets of predicted positive and negative instances
• Each curve shows the expected cumulative profit for that classifier as progressively larger proportions of the consumer base are targeted
From Numbers to Graphs: The Proper Way to Evaluate Data Science Models
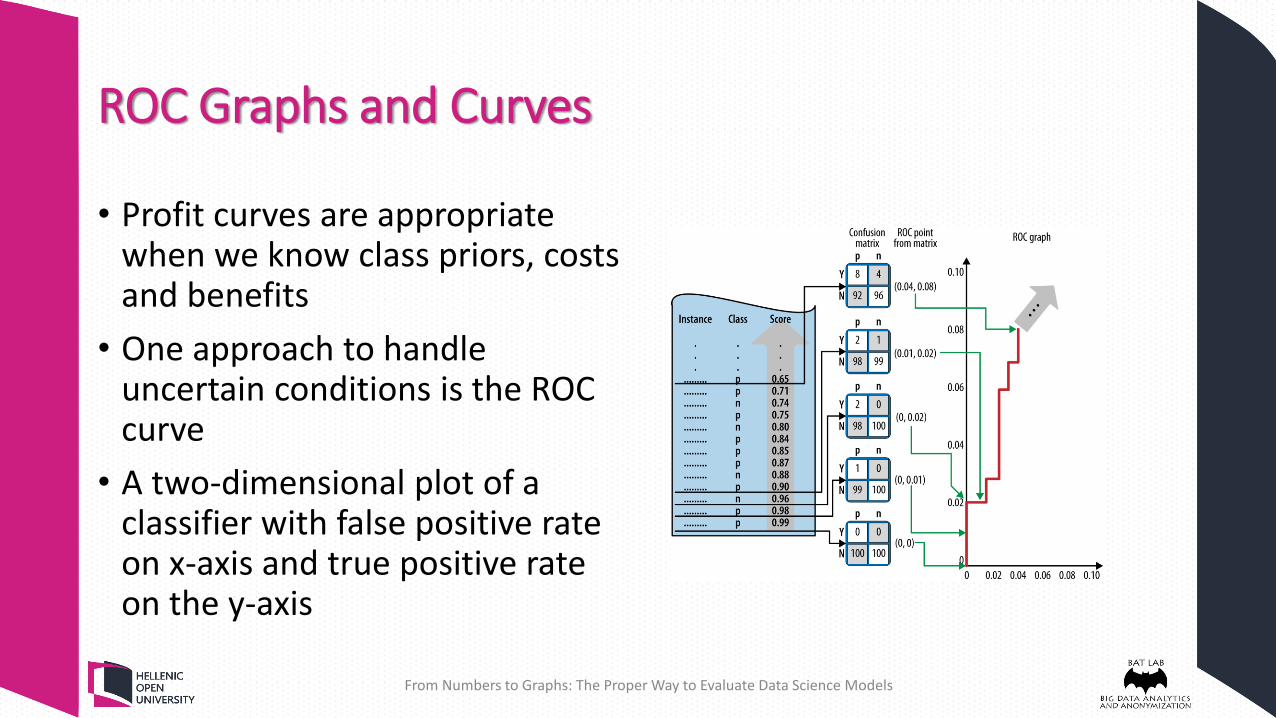
ROC Graphs and Curves
• Profit curves are appropriate when we know class priors, costs and benefits
• One approach to handle uncertain conditions is the ROC curve
• A two-dimensional plot of a classifier with false positive rate on x-axis and true positive rate on the y-axis
From Numbers to Graphs: The Proper Way to Evaluate Data Science Models

The Area Under the ROC Curve (AUC)
• An important summary statistic
• Important when a single number is needed to summarize performance
• When nothing is known about the operating conditions
• Probability that a randomly chosen positive instance will be ranked ahead of a randomly chosen negative instance
From Numbers to Graphs: The Proper Way to Evaluate Data Science Models

Cumulative Response and Lift Curves
• More intuitive visualization than ROC
• Plots hit rate as a function of the percentage of the population that is targeted
• As with ROC curves, the diagonal line represents random performance
From Numbers to Graphs: The Proper Way to Evaluate Data Science Models

Conclusions
• Proper evaluation of models
• Conveying information to the stakeholders
• Visualization is an important piece of the evaluation task
• Stratified sampling
• Operating conditions
• Separating performance from operating conditions
From Numbers to Graphs: The Proper Way to Evaluate Data Science Models