from red to gray - world banksiteresources.worldbank.org/ecaext/resources/publications/454763... ·...
TRANSCRIPT


FROM RED TO GRAY
chaw_fm_i-xxvi.qxd 6/1/07 10:34 AM Page i

FROM RED TO GRAY
The “Third Transition” of Aging Populations in Eastern Europe and
the former Soviet Union
Mukesh Chawla
Gordon Betcherman
Arup Banerji
with Anne M. Bakilana,
Csaba Feher,
Michael Mertaugh,
Maria Laura Sanchez Puerta,
Anita M. Schwartz,
Lars Sondergaard,
and Andrew Burns
Washington, D.C.
chaw_fm_i-xxvi.qxd 6/1/07 10:34 AM Page iii
©2007 The International Bank for Reconstruction and Development / The World Bank1818 H Street NWWashington DC 20433Telephone: 202-473-1000Internet: www.worldbank.orgE-mail: [email protected]
All rights reserved
1 2 3 4 10 09 08 07
This volume is a product of the staff of the International Bank for Reconstruction and Development /The World Bank. The findings, interpretations, and conclusions expressed in this volume do notnecessarily reflect the views of the Executive Directors of The World Bank or the governments theyrepresent.
The World Bank does not guarantee the accuracy of the data included in this work. The boundaries,colors, denominations, and other information shown on any map in this work do not imply any judge-ment on the part of The World Bank concerning the legal status of any territory or the endorsement oracceptance of such boundaries.
Rights and PermissionsThe material in this publication is copyrighted. Copying and / or transmitting portions or all of this workwithout permission may be a violation of applicable law. The International Bank for Reconstructionand Development / The World Bank encourages dissemination of its work and will normally grantpermission to reproduce portions of the work promptly.
For permission to photocopy or reprint any part of this work, please send a request with completeinformation to the Copyright Clearance Center Inc., 222 Rosewood Drive, Danvers, MA 01923, USA;telephone: 978-750-8400; fax: 978-750-4470; Internet: www.copyright.com.
All other queries on rights and licenses, including subsidiary rights, should be addressed to theOffice of the Publisher, The World Bank, 1818 H Street NW, Washington, DC 20433, USA; fax: 202-522-2422; e-mail: [email protected].
ISBN-10: 0-8213-7129-0ISBN-13: 978-0-8213-7129-9eISBN-10: 0-8213-7130-4eISBN-13: 978-0-8213-7130-5DOI: 10.1596/978-0-8213-7129-9
Cover photo: Tim Dirven/Panos Cover design: Naylor Design, Washington, D.C.
Library of Congress Cataloging-in-Publication DataChawla, Mukesh.
From red to gray : the third transition of aging populations in Eastern Europe and the former Soviet Union / by Mukesh Chawla, Gordon Betcherman, and Arup Banerji.
p. cm.Includes bibliographical references and index.ISBN 978-0-8213-7129-9 (alk. paper)—ISBN 978-0-8213-7130-51. Older people—Europe, Eastern—Economic conditions. 2. Older people—Soviet Union—
Economic conditions. 3. Population forecasting—Europe, Eastern. 4. Population forecasting—Soviet Union. I. Betcherman, Gordon. II. Banerji, Arup. III. Title.
HQ1064.E812C45 2007304.6'20947—dc22 2007014701
chaw_fm_i-xxvi.qxd 6/1/07 10:34 AM Page iv

v
Foreword xix
Acknowledgments xxiii
Abbreviations xxv
Overview 1
Introduction 1Red to Gray: A Unique Demographic Transition 4Red Light to Green Light: Growing Older Does
Not Have to Mean Growing Slower 13Red Ink to Black Ink: Waging Sensible Policies
Can Ease Aging’s Spending Impact 21Completing and Building on the Transitions:
The Different Paths Ahead 39Notes 43
1. The Demographic Transition in Eastern Europe and the Former Soviet Union 45
Introduction 45The Global Demographic Transition 46The Demographic Transition in Eastern Europe
and the Former Soviet Union, 1950–2000 49
Contents
chaw_fm_i-xxvi.qxd 6/1/07 10:34 AM Page v
vi Contents
Demographic Projections to 2025 55Population Change and Dependency Rates 65Two Distinct Demographic Profiles: Old Countries
and Young Countries 68Conclusion 70Notes 72
2. Demographic Change and Labor Markets 73
Introduction 73Labor Force Projections 74Implications of an Aging Labor Force for Labor
Market Outcomes 86Aging and Labor Productivity 95Policy Implications 102Annex 2.A: ILO Labor Force Projection
Methodologies 105Annex 2.B: Labor Force Participation Projections,
2005–20 107Annex 2.C: Changes in Working-Age Population 110Annex 2.D: Participation Rates in Countries
of the Region 111Notes 114
3. Aging, Savings, and Financial Markets 117
Introduction 117Aging and Saving Behavior 118Aging and Financial Markets 131Policy Implications 144Annex 3.A: Gross Domestic Savings in Eastern
European and Former Soviet Countries 146Annex 3.B: Selected Financial Sector Indicators 147Notes 149
4. Aging and Pension Expenditures 151
Introduction 151Current Pension Systems in Countries of
the Region 152Projected Impact of Aging on Pension Spending 157Prospects for Further Parametric Reform 163Reform Options 166Notes 175
chaw_fm_i-xxvi.qxd 6/1/07 10:34 AM Page vi

Contents vii
5. Aging, Long-Term Care, and Public Expenditures 177
Introduction 177Aging and Health Expenditures 179Projections of Public Expenditures on Health 182Long-Term Care 191Policy Implications 199Annex 5.A: Legislation on Long-Term Care
in Europe 207Annex 5.B: Gross Domestic Product
and Public Expenditures on Health 207Annex 5.C: Elderly Dependent Population 207Annex 5.D: Sensitivity of Projection Results
to Data Assumptions 210Notes 216
6. Aging and Education 217
Introduction 217How Education Systems Have Changed
Since Transition 220Impact of Projected Demographic Changes
on Enrollments 234Improved Productivity through Better
Education Systems 242Policy Implications 248Annex 6.A: Aging and Education: Data Tables 251Notes 259
References 263
Boxes
O.1 Demographic Projections 6O.2 Pronatalist Policies in Europe 91.1 Key Definitions in Demography 471.2 Fertility Declines and Improvement in
Longevity in Selected Countries, 1950–2000 50
1.3 Demographic Projections 562.1 How Does Productivity Change with Age
for Different Tasks? 972.2 What Do Wage Trends Tell Us about
How Productivity Changes with Age? 982.3 Computing Returns to Education 101
chaw_fm_i-xxvi.qxd 6/1/07 10:34 AM Page vii
viii Contents
3.1 Definitions of Saving Terms 1203.2 When Can Aging Lead to Greater Savings? 1213.3 What Role Does Cross-Border Capital
Mobility Have in Financial Markets? 1323.4 Key Pension Fund Concepts 1373.5 Aging and Asset Meltdown 1424.1 Glossary of Pension Terms 1536.1 How Are Education Systems Implicated
in the Process of Demographic Change? 2196.2 Reforms Needed in Education Systems 2276.3 Fundamental Problems with Current
Financing Formulas 230
FiguresO.1 The Region’s Different Mixes of Demographic
and Economic Transition 4O.2 Most Countries in the Region Will Have
Significant Population Decreases Between 2000 and 2025 7
O.3 The Proportion of Population Aged 651 Will be Much Higher by 2025 7
O.4 Countries Face Different Mixes of Demographic and Economic Transition 13
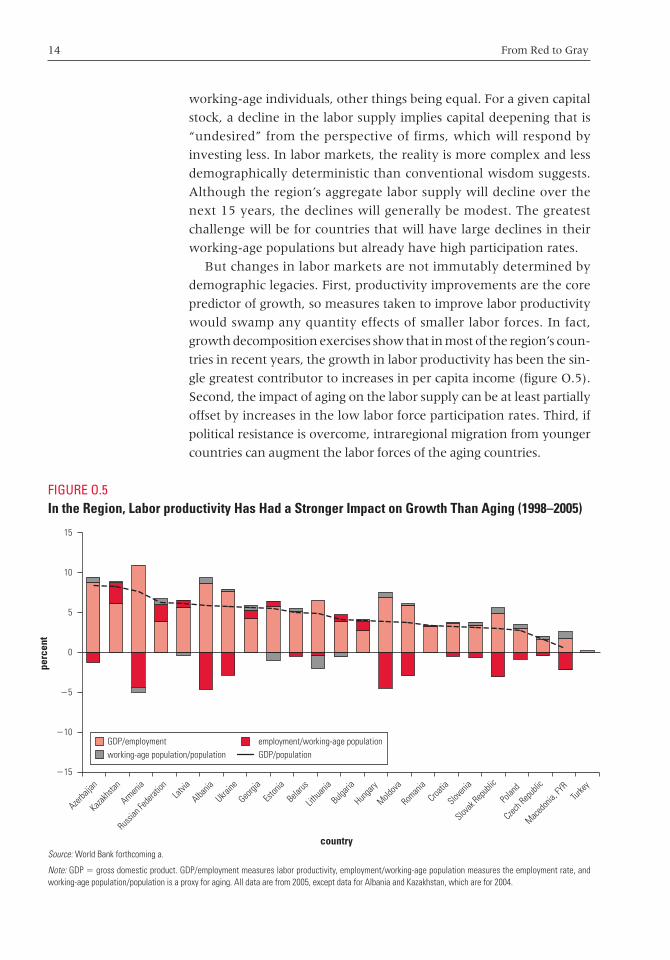
O.5 In the Region, Labor Productivity Has Had a Stronger Impact on Growth Than Aging (1998–2005) 14
O.6 Financial Markets in Even the More DevelopedEconomies of the Region are Shallower Than Those in Other OECD Countries 21
O.7 Pension Spending Would Rise Significantly Because of the Aging Effect, But Can Be Moderated by Reforms . . . 23
O.8 . . . Indeed, in Some Countries, Pension Reforms Already Undertaken Will Moderate the Impact of Aging 24
O.9 Retirement Ages Are Lower in the Region Than in Higher-Income Countries 26
O.10 Modest Social Pensions Would Generally be Affordable 29
O.11 Public Health Care Costs Are Likely to Rise Only Slightly in Most Aging Countries in the Region by 2020 31
O.12 School-Age Populations Will Shrink in All Countries Except Tajikistan . . . 35
chaw_fm_i-xxvi.qxd 6/1/07 10:34 AM Page viii
Contents ix
O.13 . . . But Improved Coverage Will Lead to Fast Growth in Secondary and Higher Enrollments in Many Countries 37
1.1 Global Total Fertility Rates, 1950–2050 481.2 Global Life Expectancy, 1950–2050 491.3 Total Fertility Rates in Eastern Europe
and the Former Soviet Union, 1950–2000 511.4 Male Life Expectancy at Birth in Eastern Europe
and the Former Soviet Union, 1950–2000 521.5 Female Life Expectancy at Birth in Eastern
Europe and the Former Soviet Union, 1950–2000 52
1.6 Absolute and Relative Change in Population Size in Selected European and Former Soviet Countries, 1950–2000 54
1.7 Proportion of Population 65 Years and Older in Eastern Europe and the Former Soviet Union, 1950–2000 54
1.8 Median Age in Eastern Europe and the Former Soviet Union, 1950–2000 55
1.9 Projected Fertility Rates in Selected Eastern European and Former Soviet Countries, 2000–25 57
1.10 Projected Trends in Life Expectancy at Birth for Males in Eastern Europe and the Former Soviet Union, 2000–25 59
1.11 Projected Trends in Life Expectancy at Birth for Females in Eastern Europe and the Former Soviet Union, 2000–25 59
1.12 Population Growth Rates in Selected Eastern European and Former Soviet Countries, 2000–25 60
1.13 Projected Change in Population Size in Eastern Europe and the Former Soviet Union,2000–25 61
1.14 Projected Change in the Population Share 65 Years and Older in Eastern Europe and the Former Soviet Union, 2000–25 62
1.15 Projected Change in the Population Share 0–14 Years in Eastern Europe and the Former Soviet Union, 2000–25 63
1.16 Projected Change in the Population Share 15–64 Years in Eastern Europe and the Former Soviet Union, 2000–25 64
chaw_fm_i-xxvi.qxd 6/1/07 10:34 AM Page ix
x Contents
1.17 Projected Increases in Median Ages in Eastern Europe and the Former Soviet Union,2000–25 65
1.18 Child Dependency Rates in Eastern Europe and the Former Soviet Union, 2000–25 66
1.19 Elderly Dependency Rates in Eastern Europe and the Former Soviet Union, 2000–25 67
1.20 Total Dependency Rates in Eastern Europe and the Former Soviet Union, 2000–25 67
1.21 Proportion of the Projected Population 65 Years and Older in 2025 and Percentage of Change inPopulation Size between 2000 and 2025 in Eastern Europe and the Former Soviet Union 69
1.22 Population Age Structure of Bulgaria, 2000 and 2025 70
1.23 Population Age Structure of Tajikistan, 2000 and 2025 71
2.1 Relative and Absolute Changes in Working-Age Population, 15–64 Years, Eastern Europeanand Former Soviet Countries, 2005–25 76
2.2 Immigration and Emigration Flows for Eastern European and Former Soviet Subregions, Western Europe, North America, and Israel,2000–03 83
2.3 Change in Male and Female Labor Force Participation Rates for Older-Age Categories, Eastern European and Former Soviet Countries,1980–2003 88
2.4 Participation Rates of Labor Force 50 to 64 Years by Educational Attainment in Selected Eastern European and Former Soviet Countries, Various Years 89
2.5 Marginal Effect of Age on Labor Force Participation of Females in Selected EasternEuropean and Former Soviet Countries, Various Years 89
2.6 Marginal Effect of Age on Labor Force Participation of Males in Selected Eastern European and Former Soviet Countries, Various Years 90
2.7 Marginal Effect of Age on Unemployment of Females in Selected Eastern European and Former Soviet Countries, Various Years 91
chaw_fm_i-xxvi.qxd 6/1/07 10:34 AM Page x

Contents xi
2.8 Marginal Effect of Age on Unemployment of Males in Selected Eastern European and Former Soviet Countries, Various Years 92
2.9 Informal Share of Wage Employment in Selected Eastern European and Former SovietCountries, Various Years 93
2.10 Marginal Effect of Age on Weekly Hours of Employment for Females in Selected Eastern European and Former Soviet Countries, Various Years 93
2.11 Marginal Effect of Age on Weekly Hours of Employment for Males in Selected Eastern European and Former Soviet Countries, Various Years 94
2.12 Marginal Effect of Age on Wages for Females in Selected Eastern European and Former Soviet Countries, Various Years 94
2.13 Marginal Effect of Age on Wages for Males in Selected Eastern European and Former SovietCountries, Various Years 95
2.14 Returns to Years of Education for Older andYounger Cohorts in Selected Countries 102
2.A.1 ILO Estimates and Projections of the Economically Active Population, 1980–2020 106
2.B.1 Labor Force Participation Projections under Different Scenarios, Kyrgyz Republic, 2005–20 107
2.B.2 Labor Force Participation Projections under Different Scenarios, Turkey, 2005–20 108
2.B.3 Labor Force Participation Projections under Different Scenarios, Bulgaria, 2005–20 108
2.B.4 Labor Force Participation Projections under Different Scenarios, Czech Republic, 2005–20 109
2.B.5 Labor Force Participation Projections under Different Scenarios, Poland, 2005–20 109
2.B.6 Labor Force Participation Projections under Different Scenarios, Russian, Federation, 2005–20 110
3.1 Conceptual View of the Possible Channels from Aging to Saving and from Saving to Investment and Growth 119
3.2 Age-Saving Profile Implied by the Life-Cycle Hypothesis 120
chaw_fm_i-xxvi.qxd 6/1/07 10:34 AM Page xi
xii Contents
3.3 Comparisons of Saving Rates by Age Group, Selected Industrial Countries, 1990s 122
3.4 Savings and Investment as a Percentage of Gross National Income, Selected Eastern European and Former Soviet Countries, 1990–2002 125
3.5 Stock Market Capitalization as a Percentage of GDP, Selected Eastern European and Former Soviet Countries and Selected OECD Countries, 2004 133
3.6 Financial Assets of Institutional Investors as a Percentage of GDP, Selected Eastern European and Former Soviet Countries and Selected OECD Countries, 2004 135
3.7 Pensions Funds as a Percentage of Total Financial Assets Held by Institutional Investors, Selected Eastern European and Former SovietCountries and Selected OECD Countries, 2004 139
4.1 Old-Age Population Dependency Rates vs. Pension System Dependency Rates in Eastern European and Former Soviet Countries, Most Recent Year Available 154
4.2 Old-Age Population Dependency Rates vs. Pension System Dependency Rates in SelectedNon–Eastern European and Former Soviet OECD Countries, Most Recent Year Available 155
4.3 Population Age 65 and Older and Per Capita Income, 157 Countries Worldwide, 2003 155
4.4 Population Age 65 and Older and Per Capita Income in Eastern European and Former Soviet Countries, 2003 156
4.5 Pension Spending as a Percentage of GDP in Selected Eastern European and Former SovietCountries, 2004 or Nearest Year 157
4.6 Pension Spending as a Percentage of GDP in Eastern European and Former Soviet Countries,2004, and Projections for 2025 Based on Demographic Trends Alone 158
4.7 Pension Spending as a Percentage of GDP in Eastern European and Former Soviet Countries,2004, and Projections for 2025 Based on Demographic Trends and Policy Reforms 159
chaw_fm_i-xxvi.qxd 6/1/07 10:34 AM Page xii
Contents xiii
4.8 Pension Spending as a Percentage of GDP, 2004, and 2025 Projections Derived from Selected Countries’ Own Estimates 160
4.9 Pension Expenditures in 2004 and PROST Projections for 2025 Based on Demographics and Existing Policy Reforms, Selected Eastern European and Former Soviet Countries 161
4.10 Labor Taxes as a Percentage of Gross Wages in Selected Eastern European and Former Soviet Countries 162
4.11 Labor Taxes as a Percentage of Gross Wages in Selected Non–Eastern European and Former Soviet OECD Countries 163
4.12 Fiscal Effects of Raising Retirement Age to 65 and Indexing Benefits to Inflation Only by 2025, Selected Eastern European and Former Soviet Countries 166
5.1 Projected Public Spending on Health as a Percentage of GDP under the Four Scenarios, Eastern European and Former Soviet Countries, 2050 190
5.2 Elderly Dependent Population as a Percentage of Total Population in Eastern European and Former Soviet Countries, 2005, and Projections for 2050 under the Pure Aging and Constant Disability Scenarios 201
6.1 Change in School-Age Population, 0 to 17 years, Eastern European and Former Soviet Benchmark Countries, 1989–2003 220
6.2 Evolution of Gross Enrollment Rates in Higher Education in Eastern European and Former Soviet Benchmark Countries, 1989–2004 221
6.3 Evolution of Gross Enrollment Rates in Preschool Education in Eastern European and Former Soviet Benchmark Countries,1989–2004 222
6.4 Evolution of Gross Enrollment Rates in Primary Education in Eastern European and Former Soviet Benchmark Countries, 1989–2004 223
6.5 Evolution of Gross Enrollment Rates in Secondary Education in Eastern European
chaw_fm_i-xxvi.qxd 6/1/07 10:34 AM Page xiii
xiv Contents
and Former Soviet Benchmark Countries,1989–2004 224
6.6 Learning Achievement and Fiscal Effort in Education for Selected Eastern European and Former Soviet Countries Participating in 2003 TIMSS Assessment 233
6.7 Public Expenditure on Education and Change in School-Age Population in Selected Eastern European and Former Soviet Countries,1989–2004 234
6.8 Change in Projected School-Age Population by Level of Education in Eastern European and Former Soviet Countries, 2005–25 235
6.9 Change in Projected Enrollments by Level of Education in Eastern European and Former Soviet Countries, 2005–25 237
6.10 Actual and Projected Trends in the School-Age Population in Uzbekistan, 2000–25 239
6.11 Participation of Adults in Education and Training in Selected EU Countries, 2005 246
Tables
O.1 By 2025, Many More Countries in the Region Will Have Their Population Shrink Rather Than Rise 5
O.2 Labor Force Participation 50–64 and Old-Age Dependency, 2005–20 17
O.3 Uses and Sources of Funds: Selected OECD Countries and Eastern European and Former Soviet Countries 19
1.1 Projected Population Gains and Losses in EasternEurope and the Former Soviet Union, 2000–25 61
1.2 Old and Young Countries in Eastern Europe and the Former Soviet Union 68
2.1 Classification of Eastern European and Former Soviet Countries by Old-Age Dependency Projections and Current Labor Force Participation of Older Workers 77
2.2 Projected Changes in Working-Age Population in Eastern European and Former Soviet Countries, 2005–20 78
2.3 Participation Rates by Age Groups in ProjectionCountries and the European Union, 2003 79
chaw_fm_i-xxvi.qxd 6/1/07 10:34 AM Page xiv
Contents xv
2.4 Labor Force Projections for Two Young Countriesunder Different Scenarios, 2005 and 2020 80
2.5 Labor Force Projections for Four Old Countries under Different Scenarios, 2005 and 2020 81
2.6 Results of Projection Exercise to Estimate Net Migration Needs by 2020 in Four Old Countries 85
2.7 Means (Standard Deviations) of Participation Rates for People 50 Years and Older, Eastern European and Former Soviet and Non–Eastern European and Former Soviet OECD Countries, 1980 and 2003 87
2.8 Mean Age of Labor Force Entry and Exit in Selected Eastern European and Former SovietCountries and Non–Eastern European and Former Soviet OECD Countries, 2000 87
2.9 Unemployment Rates by Age in Selected Eastern European and Former Soviet Countries 91
2.10 Labor Market Reform Agenda for Aging Countries by Country Grouping 103
2.C Changes in Working-Age Population, 15 to 64 Years, in Eastern Europe and the Former Soviet Union, 2005–20 110
2.D.1 Participation Rates for Females 50 Years and Older, 1980 and 2003 111
2.D.2 Participation Rates for Males 50 Years and Older, 1980 and 2003 112
2.D.3 Changes in Participation Rates for Population 50 Years and Older, 1980 and 2003 113
3.1 Estimates of Determinants of Household and Private Saving Rates: Panel Regression Results 127
3.2 Uses and Sources of Funds, Selected IndustrialCountries, Selected Years 129
3.3 Uses and Sources of Funds, Selected Eastern European and Former Soviet Countries, Selected Years 130
3.4 Benefit to Eastern European and Former Soviet Countries from Offsetting Factors 130
3.5 Classification of Eastern European and Former Soviet Countries According to the Relative and Absolute Significance of Their Financial Markets 133
3.6 Reform Agenda for Aging Countries by Country Grouping 146
chaw_fm_i-xxvi.qxd 6/1/07 10:34 AM Page xv
xvi Contents
3.A.1 Gross Domestic Saving in Eastern European and Former Soviet Countries 147
3.B.1 Selected Financial Sector Indicators for Eastern European and Former Soviet and SelectedNon–Eastern European and Former Soviet OECD Countries, 2004 148
4.1 Statutory Retirement Ages in Selected Eastern European and Former Soviet Countries 164
4.2 Statutory Retirement Ages in Selected Non–Eastern European and Former Soviet OECD Countries 165
4.3 Cost in 2005 and 2025 of a Social Pension Equivalent to 10 Percent of Per Capita GDP in Selected Eastern European and Former Soviet Countries 170
4.4 Status of Mandatory Funded Systems, Selected Eastern European and Former Soviet Countries 172
4.5 Pension Reform Agenda for Aging Countries by Country Grouping 174
5.1 Projected Health Expenditures under the Pure Aging Scenario in Eastern European and Former Soviet Countries, 2005–50 186
5.2 Projected Health Expenditures under the Constant Morbidity Scenario in EasternEuropean and Former Soviet Countries, 2005–50 187
5.3 Projected Health Expenditures under the Compressed Morbidity Scenario in Eastern European and Former Soviet Countries, 2005–50 188
5.4 Projected Health Expenditures under the Pure Aging Scenario, Adjusted for Death-Related Costs in Eastern European and Former SovietCountries, 2005–50 189
5.5 Funding for Elderly/Long-Term Care in Selected European Countries 194
5.6 Projections of Elderly Dependent Population under the Pure Aging Scenario in Eastern European and Former Soviet Countries, 2050 199
5.7 Projections of Elderly Dependent Population under the Constant Disability Scenario in Eastern European and Former Soviet Countries, 2050 200
chaw_fm_i-xxvi.qxd 6/1/07 10:34 AM Page xvi
Contents xvii
5.A.1 National Legislation on Long-Term Care in Selected European Countries 208
5.B.1 GDP and Public Expenditures on Health in Eastern European and Former Soviet Countries, 2004 210
5.C.1 Estimates of Elderly Dependent Population, 2005 211
5.C.2 Estimates of Elderly Dependent Population under the Pure Aging Scenario in Eastern European and Former Soviet Countries, 2025 212
5.C.3 Estimates of Elderly Dependent Population under the Constant Disability Scenario in Eastern European and Former Soviet Countries, 2025 213
5.D.1 Projection Results as Percentage of GDP under the Pure Aging Scenario in Selected Eastern European and Former Soviet Countries, 2010–50: Economic Policy Committee Report 215
5.D.2 Projection Results as Percentage of GDP under the Pure Aging Scenario in Selected Eastern European and Former Soviet Countries, 2010–50: from Table 5.2 215
5.D.3 Projected Annual Growth of GDP in Selected Eastern European and Former Soviet Countries, 2010–50 215
6.1 TIMSS Grade 8 Student Assessment Results for Math and Science for Participating Eastern European and Former Soviet Countries, 1995, 1999, and 2003 232
6.2 A Composite Formula for Education Finance 2406.3 The Role of Education in the Stages of
Economic Development 2436.4 Selected Population and Education Parameters
by Country Grouping 2506.5 Education Reform Agenda for Aging
Countries by Country Grouping 2516.A.1 Change in 0 to 17 Year Population,
1989–2004; Gross Enrollment Rates in 2004; and Change in Gross Enrollment Rates, 1989–2004, Eastern European and Former Soviet Countries 252
chaw_fm_i-xxvi.qxd 6/1/07 10:34 AM Page xvii

xviii Enhancing Job Opportunities: Eastern Europe and the Former Soviet Union
6.A.2 Change in Student-Teacher Ratios for Primary Education in Eastern European and Former Soviet Countries, 1989–2004 253
6.A.3 Change in GDP and Public Expenditures on Education in Eastern European and Former Soviet Countries, 1989–2004 254
6.A.4 Projected Change in School-Age Population by Level of Education in Eastern European and Former Soviet Countries, 2005–25 255
6.A.5 Gross Enrollment Rates for Eastern European and Former Soviet Countries, 2004 256
6.A.6 Shrinkage of School-Age Population, 1990–2000, and Change in Projected Enrollments by Level of Education, in Eastern European and Former Soviet Countries, 2005–25 257
6.A.7 Country Rankings in Mean Scores of 15-Year-Old Students in OECD PISA Assessment, 2000 and 2003 258
6.A.8 PISA 2000 Results: Mean Mathematical Literacy Scores and Score Gradient Attributable to Differences in Socioeconomic Status 259
chaw_fm_i-xxvi.qxd 6/1/07 10:34 AM Page xviii
xix
Foreword
After the historical political transitions in the early 1990s, and signif-
icant economic transitions over the 1990s until now, the countries of
Central, Southeastern, and Eastern Europe and the former Soviet
Union are experiencing a demographic transition—one that will
greatly impact their polities, economies, and societies over the next
two decades and beyond. This “third transition” is marked by rapid
aging and shrinking populations in 20 countries of the region and sig-
nificantly “graying” populations in all the transition countries and
Turkey. Over the next two decades, the share and number of elderly
will continue to rise; by 2025, one person in every five in most of the
region’s countries will be over the age of 65.
Recently, the region has seen great economic and political
achievement—such as the current economic resurgence that has
reduced the number of the poor by about 57 million between
1998–99 and 2005, and the integration of 10 Central, Southeastern,
and Baltic European transition countries with the European Union.
There is concern, however, that the impact of aging populations will
undermine this record of success, by putting at risk economic growth
and fiscal sustainability in the near future—because this demographic
transition in Eastern Europe and the former Soviet Union is different
chaw_fm_i-xxvi.qxd 6/1/07 10:34 AM Page xix

xx Foreword
from that being experienced by the wealthier aging countries of
Western Europe and East Asia.
The difference is the overlap with the yet incomplete economic
transition. All of the region’s countries (except Turkey) face the lin-
gering effects of the legacy of institutional disintegration that marked
the transition. And all the countries, while experiencing rapid aging,
remain immersed in the process of developing and strengthening the
institutions needed for sustaining a market economy and developing
the legitimacy of the state.
Will savings and investment in these economies decrease with
aging? Will smaller populations translate to fewer participants in the
labor force, thus lowering the rate of growth? Will the economies
become fiscally unsustainable as public expenditures on pensions and
health increase rapidly, and public revenues are constrained follow-
ing an economic slow-down?
This report, From Red to Gray: The “Third Transition” of Aging Popula-
tions in Eastern Europe and the Former Soviet Union, focuses on the chal-
lenges that the region’s aging countries will now face in having to
deal with these multiple transitions. It argues that their task ahead,
though uniquely daunting, is by no means impossible. Indeed, many
of the potential problems can be addressed through sensible and
thoughtful policies that can be enacted over the next few years. The
only danger likely lies in complacency, in not being proactive in addressing
the challenges.
This report finds, first, that some of the concerns about aging in
Eastern European and Former Soviet countries are probably mis-
placed. For example, growth is unlikely to be significantly lowered by
dwindling labor forces—if policies that promote greater labor force
participation and, especially, greater labor productivity are adopted.
The greatest positive impact can probably come from a combination
of three factors: creating a business environment conducive to enter-
prise restructuring and innovation, investing in measures such as life-
long learning to increase the productivity and employment of aging
workers in addition to bringing hitherto idle youth and adults into
the workplace, and allowing migration of workers from the “younger”
countries in and around the region.
Second, the analysis in the report validates concerns about future
fiscal strains in some of the region’s aging countries, but finds that
many of the drivers of higher future public expenditures are unre-
lated to aging. For example, high future public health care expendi-
tures projected for many of the European countries of the region are
more due to rising pharmaceutical and technological costs rather than
chaw_fm_i-xxvi.qxd 6/1/07 10:34 AM Page xx
Foreword xxi
just aging populations. But there is certainly going to be higher pub-
lic spending in many countries due to large pension obligations and
because of the imperative to provide long-term care to an increasing
number of aging disabled. Therefore, there is an immediate need to
create the space for increasing public expenditures in those areas,
both by reprioritizing within the existing fiscal envelope and by devis-
ing appropriate policy measures in some areas—such as enacting
parametric pension reforms to ensure sustainability in the face of
mounting pension spending, and designing appropriate policies to
assure effective and efficient long-term care for the elderly.
Aging populations loom large for the transition countries that have
recently acceded to the European Union. Latvia, for example, is
expected to lose 13 percent of its population between 2000 and 2025,
and Hungary about 8 percent. But these countries have also pro-
ceeded further along many dimensions of the economic transition,
and most have adopted significant reforms in financial markets,
enterprise restructuring, pension systems and health care. They are
thus well positioned to cope with their “grayer” futures, but only if
they continue and deepen their reforms in the decades ahead.
The largest challenges will be faced by many of the countries of
former Yugoslavia and of the Western and Southwestern parts of
the Commonwealth of Independent States (CIS). They are aging
rapidly—both Bosnia and Herzegovina and Azerbaijan, for instance,
could see the proportion of their populations over age 65 double
between 2000 and 2025, and Ukraine is projected to lose a quarter of
its population over the same period. These are also the countries that
have come late to reforms, and most are still in the midst of the eco-
nomic transition process. This group of countries will need rapid
reforms to both strengthen the institutions for sustained growth and
deal with the specific challenges posed by population aging.
Rapidly aging populations, of course, are not as great an issue in
some of the region’s countries—Tajikistan’s population is, for instance,
projected to grow by over 40 percent between 2000 and 2025, and
Turkey and Uzbekistan together will have gained an estimated 31 mil-
lion people, equal to the population losses in Romania, Russia, and
Ukraine combined over the same period. But even for these “younger”
countries such as Turkey and those in Central Asia, the increased pro-
portion of the elderly will still necessitate far-sighted reforms in pen-
sion systems, health care, and financial markets.
This report—a part of the World Bank’s Europe and Central Asia
Region series of regional studies—is intended as a contribution to the
World Bank’s goal to work more effectively with clients and partners
chaw_fm_i-xxvi.qxd 6/1/07 10:34 AM Page xxi

xxii Foreword
in the region to reduce poverty, foster economic growth, and support
social inclusion. It complements past reports on Enhancing Job Oppor-
tunities, which examines in greater detail the evolution of labor mar-
kets over the transition period, and Migration and Remittances, which
examines one of the possible antidotes to the labor shortages in some
countries. A forthcoming report, The Path to Prosperity, will delve
deeper into issues of productivity, which may be the other major way
for aging countries to continue sustaining their growth trajectories.
But this report is particularly focused on the future—a future in
the region that is critically dependent on actions that countries and
societies take now, and over the next few years. I hope that this
report, and the others in the series, will contribute to our under-
standing of the underlying dynamics of the economies of Eastern
Europe and the former Soviet Union, and help to provide the under-
pinnings for the actions needed for these countries to complete their
many transitions and to proceed on the path to prosperity.
Shigeo Katsu
Vice President
Europe and Central Asia Region
chaw_fm_i-xxvi.qxd 6/1/07 10:34 AM Page xxii

xxiii
Acknowledgments
This report was prepared by a team led by Mukesh Chawla, Gordon
Betcherman, and Arup Banerji, who were also the main authors,
and comprising Anne Bakilana, Csaba Feher, Michael Mertaugh,
Maria Laura Sanchez Puerta, Anita Schwarz, and Lars Sondergaard. It
also draws on inputs from Andrew Burns, Ramón Gómez-Salvador,
Gauresh Shailesh Rajadhyaksha, and Jan van Ours. Research assis-
tance was provided by Stefania Rodica Cnobloch, Nandini Krishnan,
Silvia Prina, Pietro Rizza, Elena Rydvalova, and Rezeda Zakirova.
Svetlana Raykova coordinated all administrative aspects of the
project.
This work was supported by Pradeep Mitra, Chief Economist of the
Europe and Central Asia Region of the World Bank, who provided
essential guidance throughout its implementation. The team also
would like to recognize suggestions and comments received from
Asad Alam, Tito Boeri, Barbara Bruns, Eduard Bos, Paloma Anos
Casero, Annette Dixon, Hans Dubois, Armin Fidler, Bernard Funck,
Charles Griffin, Robert Holzmann, Carlos Felipe Jaramillo, Sanjay
Kathuria, Lawrence Kotlikoff, Arvo Kuddo, Ali Mansoor, Kate
McCollom, Fernando Montes-Negret, Roberto Rocha, Halsey Rogers,
Richard Saltman, Willem van Eeghen, Milan Vodopivec, Hermann
von Gersdorff, Andrew Vorkink, and Ruslan Yemtsov. Very helpful
chaw_fm_i-xxvi.qxd 6/1/07 10:34 AM Page xxiii

xxiv Acknowledgments
comments were also provided by Giuseppe Carone, Declan Costello,
Gilles Mourre, Bartosz Przywara, and Aino Salomaki of the Direc-
torate General for Economic and Financial Affairs at the European
Commission.
The team also benefited from comments and suggestions received
from participants at workshops at the World Bank, Ankara, Turkey,
and Ljubljana, Slovenia.
The World Bank Office of the Publisher coordinated the book
design, editing, and production. Mary Fisk was the production editor;
Paola Scalabrin was the acquisitions editor, and Andrés Meneses was
responsible for printing. Bruce Ross-Larson provided editing services
for the overview manuscript as well as advice on key messages. Vesna
Kostic coordinated the launch and dissemination plans.
chaw_fm_i-xxvi.qxd 6/1/07 10:34 AM Page xxiv
xxv
Abbreviations
AADL advanced activities of daily living
ADL activities of daily living
AIDS acquired immune deficiency syndrome
BADL basic activities of daily living
CIS Commonwealth of Independent States
EAPEP Economically Active Population Estimates
and Projections (database)
EPC Economic Policy Committee
EU European Union
G7 Group of Seven
GDP gross domestic product
HBS Household Budget Survey
HIV human immunodeficiency virus
IADL instrumental activities of daily living
ILO International Labour Organization
IMF International Monetary Fund
KILM Key Indicators of the Labor Market (database)
LSMS Living Standards Measurement Survey
MTHS Multitopic Household Survey
NRR net reproduction rate
chaw_fm_i-xxvi.qxd 6/1/07 10:34 AM Page xxv

xxvi Abbreviations
OECD Organisation for Economic Co-operation
and Development
PAYG pay-as-you-go (system)
PISA Programme for International Student Assessment
PPP purchasing power parity
PROST Pension Reform Options Simulation Toolkit
RLMS Russian Living Measurement Survey
SHARE Survey of Health, Aging, and Retirement in Europe
TFR total fertility rate
TIMSS Trends in International Mathematics
and Science Study
UN United Nations
WHO World Health Organization
chaw_fm_i-xxvi.qxd 6/1/07 10:34 AM Page xxvi
1
Age is opportunity no less than youth itself.
—Henry Wadsworth Longfellow (1807–82)
Introduction
The countries of Eastern Europe and the former Soviet Union are
experiencing a third transition, a transition that overlaps with their
recent political and economic transitions. In 2025, more than one in
five Bulgarians will be more than 65 years old—up from just 13 per-
cent in 1990. Ukraine’s population will shrink by a fifth between the
years 2000 and 2025. And the average Slovene will be 47.4 years old
in 2025—among the oldest in the world.
This third transition—from red to gray—is unique. Populations
have been aging quite rapidly in many countries; by 2010, populations
will start decreasing in such industrial countries as France, Italy, and
Japan. Yet the unique conjunction of rapidly aging and relatively poor
populations exists only in this region. Indeed, between 2000 and 2005,
the only countries in the world with population declines of more than
5,000 people were 16 countries in Eastern Europe and the former
Soviet Union—led by the Russian Federation, Ukraine, Romania,
Overview
chaw_001-044_ch00.qxd 5/30/07 5:05 PM Page 1
2 From Red to Gray
Belarus, and Bulgaria. No aging country is as poor as Georgia—set to
lose 800,000 people over the next two decades and with a per capita
gross national income of just US$1,060 in 2004. And no other coun-
tries in the world face the dual challenges of a rapidly aging population
and an incomplete transition to mature market institutions to deal
with the adverse economic consequences of aging.
This report examines the possible impact of this third transition. It
analyzes projections and policy outlooks for a whole range of issues,
from labor markets to pension policies, from health care to savings
and capital markets. It concludes that although aging in the region is occur-
ring in the context of unprecedentedly weak institutional development, coun-
tries can avoid severe economic consequences if they accelerate their economic
transition and undertake longer-term policies to meet the aging challenge.
The report sends two central messages, which are analyzed against
the different patterns of aging across the region:
• Red light to green light: Growing older does not have tomean growing slower. Aging is not a stop sign for growth—if
countries enact policies that boost productivity and labor force
participation.
• Red ink to black ink: Waging sensible policies can easeaging’s spending impact. The policies needed to manage much
of the expected jump in public spending—especially the impacts
on pensions and on health care—are well known. They need only
to be enacted and implemented.
Red Light to Green Light: Growing Older Does Not Have
to Mean Growing Slower
Empirical evidence based on historical data from around the world
does suggest a strong and negative relationship between aging and
domestic saving rates. However, this evidence cannot be applied eas-
ily to aging Eastern European countries. For all but a few of the new
European Union (EU) members in Central Europe, demographic-
induced drops in savings will be offset by higher incomes from the
early years of rapid growth—and by the ability of firms to use inter-
national financial markets for their investment needs.
Nor is the threat of shrinking labor supplies as populations age a
given. Straightforward policy interventions can raise the relatively low
labor force participation in most of the region. However, two other fac-
tors are critical. Most important, quantity shortfalls can be more than
covered by increases in labor productivity—especially if education sys-
tems move to more flexible lifelong learning models, if investments in
new technology and other complementary factors of production are
chaw_001-044_ch00.qxd 5/30/07 5:05 PM Page 2
Overview 3
not constrained by low foreign or domestic savings, and if enterprise
restructuring allows for labor and capital to continue to shift to new
and more productive forms and sectors. And, if politics permit, short-
ages in the quantity of labor can easily be offset by migration within the
region—much as today’s migrants from Central European EU mem-
bers are providing skills needed in some Western European countries.
Red Ink to Black Ink: Waging Sensible Policies
Can Ease Aging’s Spending Impact
Many of the region’s countries are, indeed, likely to face significantly
higher expenditures in health care, elderly care, and public pension
payments. But this report argues that three factors can mitigate the
impact of aging. First, the direct impact of aging on total expenditures
in health is low, with many of the cost drivers in health coming from
technological factors that are independent of aging. Second, aging
also reduces demand for public expenditures on education, as cohorts
shrink and the large share of education in most national budgets cre-
ates the potential for offsetting fiscal savings. Third, most countries
have the time, over two decades, to institute proactive reforms that
rationalize the structure of and demand for health care, flexible poli-
cies to address long-term care for the infirm aged, and pension
reforms that provide sufficient income in retirement while making
pension systems sustainable.
The danger lies in complacency. The blow from aging will be
sharpest if policy makers are not proactive or far sighted enough to
implement the expenditure reforms whose general outlines are
known today.
The region has vastly different patterns of aging, but also vastly dif-
ferent paces of adjustment within the “second” (economic) transi-
tion. Top-heavy public hospitals and inherited pension systems that
pair generous coverage with small tax bases strain public expendi-
tures. Subsidized enterprises that hoard unproductive workers and
education systems that are unable to teach flexible, market-oriented
skills lack the nimbleness to boost worker productivity. And despite
the political openness brought about by the “first” (political) transi-
tion, institutions are not yet sufficiently mature in many countries to
make the hard choices for the longer run.
The speed of the aging and the breadth and depth of the institu-
tional transformation will determine how easily different economies
cope. This report outlines the complex challenges facing countries in
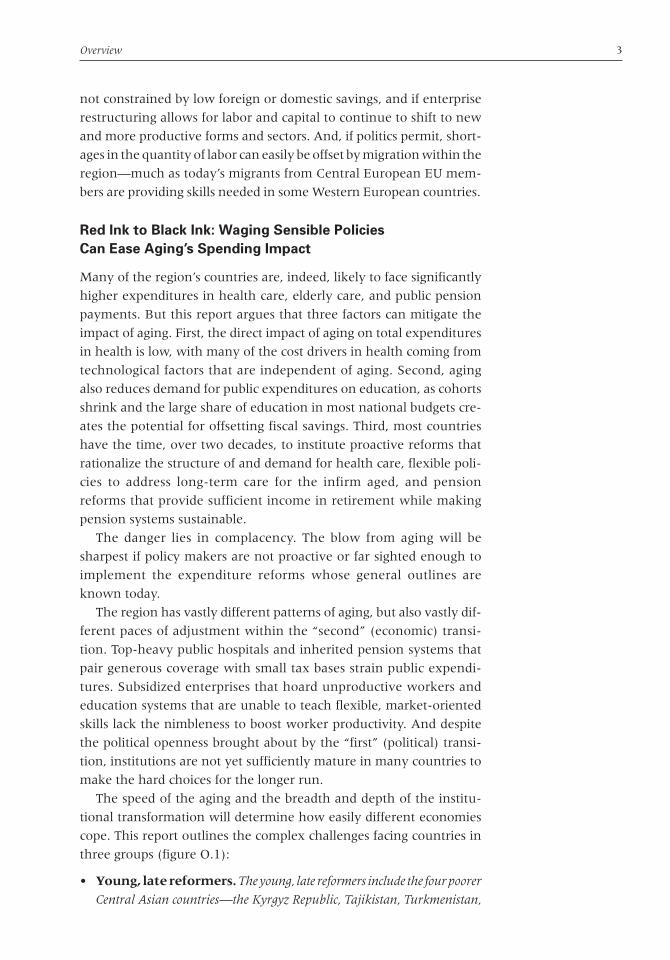
three groups (figure O.1):
• Young, late reformers. The young, late reformers include the four poorer
Central Asian countries—the Kyrgyz Republic, Tajikistan, Turkmenistan,
chaw_001-044_ch00.qxd 5/30/07 5:05 PM Page 3
4 From Red to Gray
and Uzbekistan. They will still have growing populations over the
next two decades. They face significant policy challenges, but they
have made a later transition to mature market institutions.
• Aging, early reformers. The aging, early reformers include the
10 transition countries that recently joined the European Union, as well as
Albania and Croatia. Aging rapidly, they are fairly advanced in
reforming their economic institutions. If they continue the pace of
their reforms, they are well placed to meet the emerging challenges.
• Aging, late reformers. The aging, late reformers are the remaining
former Soviet nations, as well as many countries in the western Balkans.
They face the greatest threat from aging—not just because of their
demographic shifts, but also because their reforms are not on pace
to help mitigate the effects of aging.
Red to Gray: A Unique Demographic Transition
The populations of all Eastern European and former Soviet countries
grew over the past 50 years, but most of them will shrink between
2000 and 2025 (table O.1). This demographic transition is part of the
global demographic trend toward longer life expectancy and lower
FIGURE O.1The Region’s Different Mixes of Demographic and Economic Transition
Sources: World Bank staff calculations, based on United Nations 2005 and EBRD 2006.
Note: Turkey, although part of the region, is excluded because of the absence of data on the transition index. EBRD �European Bank for Reconstruction and Development. The new EU members are Bulgaria, Czech Republic, Estonia, Hungary,Latvia, Lithuania, Poland, Romania, the Slovak Republic, and Slovenia.
At the time of publication, separate figures were often not available for Serbia and for Montenegro. In such cases,throughout the publication, the aggregated data are given.
EBRD � European Bank for Reconstruction and Development.
0
10
20
30
4321
EBRD transition index, 2006
Aging, late reformers: Armenia; Azerbaijan; Belarus;Bosnia and Herzegovina; Georgia; Kazakhstan; Macedonia, FYR;Moldova; Montenegro; the Russian Federation; Serbia; andUkraine
pro
ject
ed p
ropo
rtio
n of
pop
ulat
ion
65�
yea
rs, 2
025
(%)
Young, late reformers: The Kyrgyz Republic, Tajikistan,Turkmenistan, and Uzbekistan
Aging, early reformers: Albania, Croatia, andthe new EU members
chaw_001-044_ch00.qxd 5/30/07 5:05 PM Page 4
Overview 5
fertility—and the resulting shift toward population structures domi-
nated by old people rather than young. The pace of aging naturally
varies for countries and regions. The most dramatic aging worldwide
has already occurred, but aging is expected to continue in those coun-
tries that for decades have had fertility rates below replacement lev-
els, such as Japan and the countries of Western Europe. The median
age of populations in Europe will increase from 38 today to 49 in
2050, over 20 years more than the median age in Africa. Spain—with
half its population older than 55 by 2050—will be the oldest country
in the world, followed closely by Italy and Austria, where the median
age is projected to be 54 (box O.1).
But the fastest aging countries over the next two decades will be in
those of Eastern Europe and the former Soviet Union, the result of
unprecedented declines in fertility and rising life expectancies. This
region (not including Turkey) is projected to see its total population
shrink by about 23.5 million. The largest absolute declines will be in
Russia, followed by Ukraine and Romania. The Kyrgyz Republic,
Tajikistan, Turkmenistan, and Uzbekistan, as well as Albania and
Turkey, will still have growing populations. For most other countries
in the region, the projected changes in absolute population size are
expected to be less pronounced.
TABLE O.1By 2025, Many More Countries in the Region Will Have TheirPopulation Shrink Rather Than Rise
Population gained (millions) Population lost (millions)
Turkey 22.3 Russian Federation 17.3Uzbekistan 9.3 Ukraine 11.8Tajikistan 2.6 Romania 2.3Turkmenistan 1.6 Poland 1.6Azerbaijan 1.5 Bulgaria 1.5Kyrgyz Republic 1.3 Belarus 1.4Albania 0.4 Georgia 0.8Macedonia, FYR 0.1 Hungary 0.8
Czech Republic 0.5Lithuania 0.4Latvia 0.3Moldova 0.3Serbia and Montenegro 0.3Kazakhstan 0.3Croatia 0.2Armenia 0.2Estonia 0.1Slovak Republic 0.1Bosnia and Herzegovina 0.1Slovenia 0.1
Source: World Bank staff calculations, based on United Nations 2005.
chaw_001-044_ch00.qxd 5/30/07 5:05 PM Page 5

6 From Red to Gray
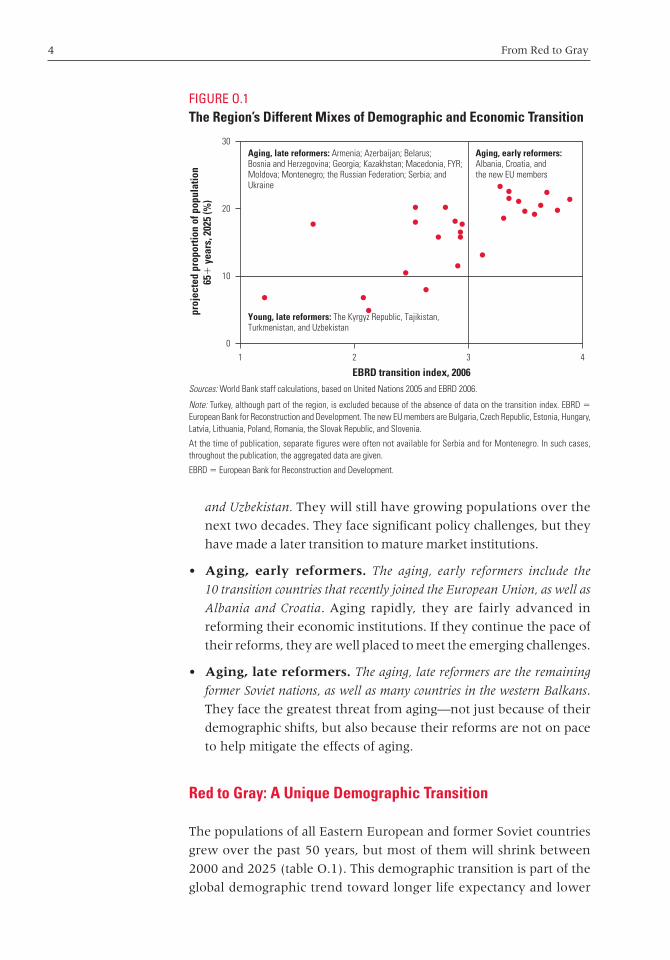
The impact of the population decline will be much larger in some
of the smaller countries, which will lose a significant share of their
populations over the next two decades (figure O.2). Latvia (2.3 mil-
lion people) and Lithuania (3.4 million) will lose more than a tenth
of their populations. Poland will lose 1.6 million, or about 4 percent
of its 38 million people.
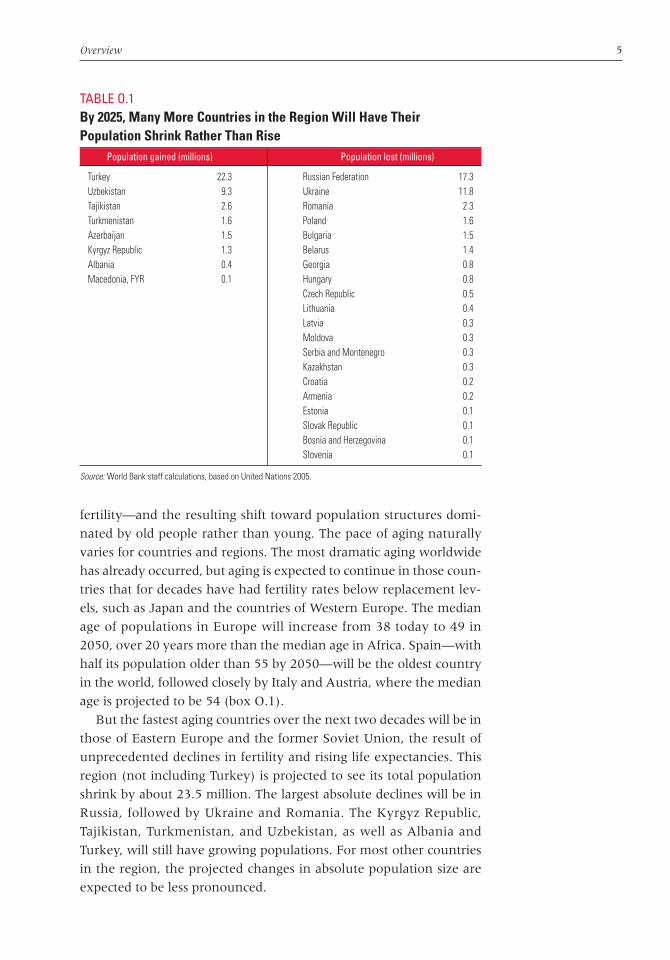
The economic impact of these changes will be felt most through
the rising proportion of the elderly—those age 65 and older. Most
countries had old-age shares (which we define here as the percentage
of the population older than 65) of less than 15 percent in 2000; the
exceptions were Bulgaria, Croatia, and Estonia. But this mark will be
exceeded by 2025 in all but seven transition economies and Turkey
(figure O.3). The largest increases (8 percent or more) are expected to
occur in countries that already have older populations, such as the
Czech Republic, Poland, and Slovenia. Bosnia and Herzegovina will
see the fastest increase, with its elderly dependency ratio almost dou-
bling. For nine countries, between one fifth and one quarter of the
population will be 65 and older by 2025—comparable to the situation
in Italy, where the proportion is projected to be about 26 percent.
As populations become dominated by older people, median ages
are projected to continue to rise, even for countries (mostly in Central
Asia and in Turkey) that still have fertility rates above replacement
levels. Between 2000 and 2025, countries that already have median
ages over 35 years (half the countries in the region) are projected to see
BOX O.1
Demographic Projections
Population projections used in this study are drawn from the World Population Prospects: The
2004 Revision, produced by the Population Division of the United Nations Department of
Economic and Social Affairs. The 2004 revisions were the latest projections available while this
report was being prepared. In March 2007, the United Nations released an updated 2006 revision.
All population projections begin with an existing population structure and apply to it fertility and
survival rates determined according to assumptions about future trends in fertility and mortality.
In this sense, therefore, demographic projections are conditional statements about the future,
given a set of assumptions about the key population flow variables (fertility, mortality, and, to a
lesser extent, migration). The United Nations projections deal with the uncertainty of population
projections by producing four projections (variants) that are based on different scenarios of
low, medium, high, or constant fertility. For this report, the medium variant projections have
been used.
chaw_001-044_ch00.qxd 5/30/07 5:05 PM Page 6
Overview 7
FIGURE O.2Most Countries in the Region Will Have Significant Population Decreases Between 2000 and 2025
Source: World Bank staff calculations, based on United Nations 2005.
–30
–20
–25 –24
–18 –17–14 –13 –12 –11 –10 –9 –8 –7 –6 –5 –5 –4 –4 –3 –3 –2 –2
2
1418
27
3335
3842
–15
–10
–5
0
�������
10
5
15
20
30
25
40
35
45
Ukraine
Bulgari
a
Georgi
a
Belarus
Latvia
Russian
Fede
ration
Lithu
ania
Roman
ia
Eston
ia
Hunga
ry
Moldova
Armen
ia
Croatia
Czech R
epub
lic
Sloven
ia
Polan
d
Serbia
and M
onten
egro
Bosnia
and H
erzeg
ovina
Slovak
Repub
lic
Kazakhs
tan
Macedo
nia, FY
RAlba
nia
Azerba
ijan
Kyrgyz
Repub
licTur
key
Turkm
enist
an
Uzbekis
tan
Tajikis
tan
��������
�����������
�������
FIGURE O.3The Proportion of Population Aged 65� Will be Much Higher by 2025
Source: World Bank staff calculations, based on United Nations 2005.
0
10
5
15
20
25
Tajikis
tan
Uzbekis
tan
Turkm
enist
an
Kyrgyz
Repub
licTur
key
Azerba
ijan
Kazakhs
tan
Albania
Moldova
Armen
ia
Macedo
nia, FY
R
Russian
Fede
ration
Belarus
Serbia
and M
onten
egro
Georgi
a
Roman
ia
Slovak
Repub
lic
Lithu
ania
Eston
ia
Ukraine
Bosnia
and H
erzeg
ovina
Polan
dLat
via
Hunga
ry
Bulgari
a
Czech R
epub
lic
Croatia
Sloven
ia
perc
enta
ge o
f pop
ulat
ion
country
2000 2025
chaw_001-044_ch00.qxd 5/30/07 5:05 PM Page 7
8 From Red to Gray
even further increases, to as high as 47 years in the Czech Republic and
Slovenia, approaching Italy’s median of 50 years. Even Tajikistan—
with a low median age of 18—will see its median age rise to about 26
because of slowly declining fertility rates and improvements in
longevity.
Several of the countries are aging in ways similar to Western
Europe and Eastern Asia. Fertility rates have been below replacement
levels since the mid-1970s for most of the industrial world, and the
same trend is expected for the region’s eastern neighbors, including
China (but excluding Afghanistan). Life expectancies in the region
are also increasing—though today’s industrial countries have longer
life expectancies. For instance, Japan will have a life expectancy for
women of about age 82 by 2025, about 6 years more than the highest
projected for Eastern Europe and the former Soviet countries (in
Croatia, the Czech Republic, and Slovenia). Old-age shares are
also comparable for some countries in the region and their richer
neighbors: Slovenia, for example, will see its over-65 population
grow from 14 percent in 2000 to about 23 percent in 2025, falling
between projections for the United Kingdom (20 percent) and for
Italy (26 percent).
At the other end of the spectrum, Kazakhstan, the Kyrgyz Republic,
Tajikistan, Turkmenistan, and Uzbekistan will look more like India,
where about 8 percent of the population is projected to be 65 and older
by 2025. The projected median ages for Bulgaria, the Czech Republic,
and Slovenia will be closest to projections for Japan and Italy, which
may have the world’s oldest populations. For most of the region, the
projected median ages (between 40 and 45) are comparable with those
in Ireland and the United Kingdom (42).
Governments in a number of countries in the region have
attempted to mitigate these aging trajectories by introducing various
“pronatalist” incentives. Some examples are shown in box O.2, along
with a wider range of initiatives that have been implemented in
Western European countries.
The economic impact of the demographic transition will be quali-
tatively different—and felt more strongly—in the Eastern European
and former Soviet countries than in aging countries elsewhere in the
world. The region’s aging process is proceeding at a pace not seen
before for such a diverse group of countries. The population share
over 65 years of age will almost double in Bosnia and Herzegovina
between 2000 and 2025 and will grow by more than 60 percent in
such diverse countries as Albania, Azerbaijan, the Czech Republic,
Kazakhstan, the former Yugoslav Republic of Macedonia, Moldova,
Poland, the Slovak Republic, and Slovenia (see figure O.3). Strikingly,
chaw_001-044_ch00.qxd 5/30/07 5:05 PM Page 8

Overview 9
BOX O.2
Pronatalist Policies in Europe
In many countries that have reached low levels of fertility, governments have initiated pronatal-
ist policies to encourage higher birth rates. Their success depends, of course, on whether they
counteract the actual factors that contributed to the significant declines in fertility in the first
place. The number of children a woman or a couple decides to have is a result of a complex mix
of factors, including cost of bringing up children, opportunities for women’s participation in higher
education and employment, household economic status, marital status (including divorce and
cohabitation), and degree of compatibility of work with child care.
Examples of pronatalist incentives in Europe are shown in the table below.
Examples of Incentives that Could Encourage Child Bearing
Total fertility Country Incentives that could encourage childbearing rate, 2005
France Mothers receive 16 weeks unpaid leave for the first and second children and 26 weeks for the third. Subsidies are provided for families with 3 or more children. 1.90
Germany Mothers receive 14 weeks leave, with parental leave up to 36 months. Limited child care centers are available. 1.37
Ireland Mothers get 26 weeks of leave. Fathers get 14 weeks of leave. 1.99Italy A one-off payment of €1,000 is available for the second child. 1.33Norway Mothers receive 12 months off work with 80 percent pay or 10 months off
work with 100 percent pay. Fathers must take 4 weeks of leave 1.81Poland Legislation is in process that would pay women for each new birth (€258, and
poor women receive double). The government plans to increase housing stock. 1.78Russian Federation Maternity hospitals are free, and pregnant women get free vitamins and
iron supplements. 1.30Sweden The government pays for 18 months of paid maternity leave. Subsidized day care
and flexible and reduced work hours are also available. 1.75United Kingdom Mothers receive 6 months of paid leave and optional 6 months’ unpaid leave
after that. Free early education centers are available. 1.74
France is an interesting case for considering the effect of pronatalist policies, both because of
its long history of interventions in this area and because of recent increases in the birth rate. In-
deed, France has encouraged couples to have larger families for a long time, partly because
some regions were among the earliest in Europe to experience fertility transition. The first paid
maternity leave was introduced in 1913, and the Family Code was drafted in the late 1930s. The
pronatalist interventions that France has offered include maternity leave, benefits for children,
family allowances, a single-parent allowance, an adoption allowance, and larger housing for larger
families. Couples enjoy some of the most generous maternity and paternity leaves in Europe:
all women workers are entitled to a paid, job-protected maternity leave of 6 weeks before and
10 weeks after birth for the first two children. In addition, after maternity leave expires, parents
(continued)
chaw_001-044_ch00.qxd 5/30/07 5:05 PM Page 9

10 From Red to Gray
in the Czech Republic, Poland, the Slovak Republic, and Slovenia, this
rapid growth will be from old-age shares that are already high—above
10 percent in 2000.
The other major difference from the more industrial aging coun-
tries is in the unprecedented interaction of the demographic transi-
tion with the comprehensive economic and (to an extent) political
transitions still under way in most of the region. It is the interaction
of the three transitions that makes the region unique.
Most social and economic implications of aging are universal, but
Eastern European and former Soviet countries have only just started
to come to grips with the political and economic transitions of the past
two decades. They now face yet another structural transformation as
their demographics change. The dissolution of the Soviet Union in
1991 was punctuated by a political transition from communism to
democracy and by an economic transition from centrally planned to
market economies. Although almost all the countries have completed
BOX O.2
(continued)
can take leave until the child reaches age three with entitlement to reintegration into the work-
place. France has one of the largest networks of public child care facilities, providing full day care
beginning at age two or three. A third-child policy pays more than for the first two children. During
1995 to 1998, France spent about 2.3 percent of its gross domestic product on family benefits.
Nonetheless, projections suggest that cohort fertility in France continues on a downward trend
and that the 1970 cohort (which still has to complete fertility) will have completed fertility of 1.98
children per woman. This decline in cohort fertility is not unique, by any means, in Europe. Al-
though France does have comparatively higher period and cohort fertility than some other Euro-
pean countries, there is not sufficient evidence of the effect of family policies; even if these poli-
cies have had an effect on fertility, they have not been effective enough in raising fertility above
the replacement level of about 2.1 children per woman.
The conclusion is consistent with the weight of consensus among demographers that the effect
of transfer-based pronatalist policies is negligible. Some authors have commented that, for such
policies to be effective, countries will have to adopt a more comprehensive menu with a mix of
family and social policies that could be quite costly and complex to implement. This is because
the usual monetary transfers or tax breaks are too low to cover the full costs of having and rais-
ing children to adulthood and are usually seen as temporary measures by parents and potential
parents. For such policies to have a more significant impact on reproductive choices, they need
to combine financial options with work and family incentives (McDonald 2000).
chaw_001-044_ch00.qxd 5/30/07 5:05 PM Page 10
Overview 11
the political transition, if to different extents, much remains to be
done in several key dimensions of the economic transition.
Even after several years of economic growth since 2000, countries
in the region are still at very low levels of income and institutional
development. In Ukraine, which is likely to lose the largest share of
its population over the next two decades, incomes are barely above
US$6,000 per capita in terms of purchasing power parity (PPP), on
par with countries such as Algeria and the República Bolivariana de
Venezuela. Georgia, another country hit hard by the demographic
transition, has a PPP per capita income of just over US$1,000—in the
same league as Mozambique or Rwanda. Even the richest economies
in Central Europe substantially lag behind neighboring aging indus-
trial neighbors such as Austria and Italy in terms of income and insti-
tutional maturity.
Economic growth in the first decade of the transition was generally
stronger in countries that made more vigorous economic reforms:
• Following the initial economic collapse that affected the whole
region, the Central European and Baltic countries recovered rap-
idly, pursued deep and pervasive market reforms, and pushed
through integration with the European Union. Their challenge
now is to further improve the business climate; address corruption
and weaknesses in governance; maintain fiscal discipline and bal-
ance; and find solutions for their unsustainable health, social secu-
rity, and pension systems—the lack of which is exacerbated by
their aging populations.
• Countries of the western Balkans experienced a disintegration that
was significantly more violent and catastrophic than elsewhere in
the region, but they are recovering and are beginning to integrate
with the rest of Europe. They are still going through normaliza-
tion, even as they prepare for EU integration.
• Reform in the former Soviet countries has generally been slow.
Some—such as Belarus and Turkmenistan—have not implemented
meaningful economic reforms and are much further behind. Coun-
tries in the Caucasus have not fared well either, though recently
there have been positive signs. Russia and Kazakhstan recovered
rapidly from the initial disintegration and are looking to consoli-
date their positions, with mineral-led growth greatly helping their
fortunes.
• Turkey, though not a postcommunist state, has been going
through its own transition since the 2001 financial crisis, which
was preceded by uneven economic development through the
chaw_001-044_ch00.qxd 5/30/07 5:05 PM Page 11
12 From Red to Gray
1990s. Privatization, banking and public sector reforms, social
security reforms, and tight monetary and fiscal policies are at the
core of its bold economic reforms. These changes are accompanied
by a host of political and social reforms as the country progresses
toward closer integration with the European Union.
Even for the most advanced among the region’s countries, there are
wide variations in the degree of the structural transformation across
their economies, and accordingly, a significant agenda remains for
economic reforms. For example, Slovenia, acknowledged to be
among the most successful of the transition economies, is still hob-
bled by a relatively poor business environment, marked by a low-
quality investment law and an inefficient transactions law (EBRD
2006). Eight of the region’s countries—including the Czech Republic,
Kazakhstan, FYR Macedonia, and Russia—maintain some form of
control on the inflow of direct investment. And 15 countries limit
land tradability.
Broader institutional development is also progressing slowly. The
quality of insolvency laws is poor in such aging countries as Georgia,
Hungary, Latvia, Lithuania, Slovenia, and Ukraine. Enterprise restruc-
turing is a major item remaining on the agenda—by 2006, only the
eight Central European members of the EU (excluding Bulgaria
and Romania) had progressed significantly on this front. Large
restructuring agendas remain in aging countries such as Bosnia and
Herzegovina, Georgia, Moldova, Kazakhstan, Russia, Serbia, and
Ukraine.
Most of the countries, except the four Central Asian republics, will
have significant old-age shares (over 10 percent) by 2025 (figure O.4).
In Belarus, Bulgaria, and Estonia, this ratio will not change greatly in
the next two decades: much of the aging has already happened there.
In other countries, however, the relative growth in the elderly popu-
lation will be significant.
The policy challenge is that only a dozen countries—the 10 new
EU countries, Croatia, and (marginally) Albania, all with potentially
significant old-age shares—have achieved significant progress in eco-
nomic transition (indicated in figure O.4 by a score 3 or above on a
scale of 1 to 4+ on a European Bank for Reconstruction and Develop-
ment index). At the other extreme are the four Central Asian
republics—the Kyrgyz Republic, Tajikistan, Turkmenistan, and
Uzbekistan. Although they have not made significant progress toward
market institutions, they have less demographic pressure because of
the relative youthfulness of their populations over the next two
decades. The countries facing the greatest challenge are those in the
top left quadrant of figure O.4, primarily those from the former Soviet
chaw_001-044_ch00.qxd 5/30/07 5:05 PM Page 12
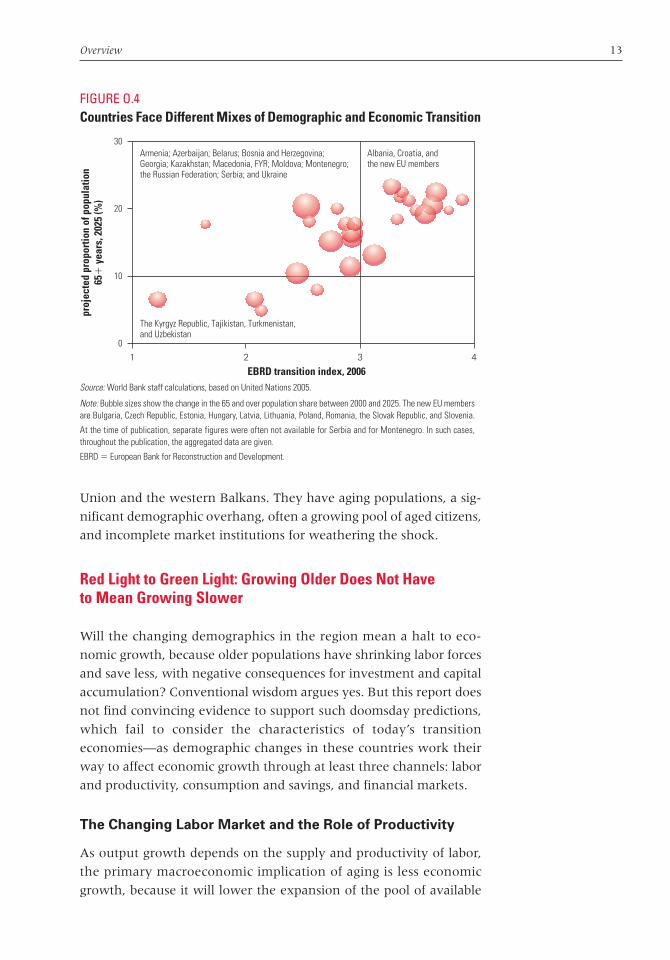
Overview 13
Union and the western Balkans. They have aging populations, a sig-
nificant demographic overhang, often a growing pool of aged citizens,
and incomplete market institutions for weathering the shock.
Red Light to Green Light: Growing Older Does Not Have to Mean Growing Slower
Will the changing demographics in the region mean a halt to eco-
nomic growth, because older populations have shrinking labor forces
and save less, with negative consequences for investment and capital
accumulation? Conventional wisdom argues yes. But this report does
not find convincing evidence to support such doomsday predictions,
which fail to consider the characteristics of today’s transition
economies—as demographic changes in these countries work their
way to affect economic growth through at least three channels: labor
and productivity, consumption and savings, and financial markets.
The Changing Labor Market and the Role of Productivity
As output growth depends on the supply and productivity of labor,
the primary macroeconomic implication of aging is less economic
growth, because it will lower the expansion of the pool of available
FIGURE O.4Countries Face Different Mixes of Demographic and Economic Transition
Source: World Bank staff calculations, based on United Nations 2005.
Note: Bubble sizes show the change in the 65 and over population share between 2000 and 2025. The new EU membersare Bulgaria, Czech Republic, Estonia, Hungary, Latvia, Lithuania, Poland, Romania, the Slovak Republic, and Slovenia.
At the time of publication, separate figures were often not available for Serbia and for Montenegro. In such cases,throughout the publication, the aggregated data are given.
EBRD � European Bank for Reconstruction and Development.
0
10
20
30
4321
EBRD transition index, 2006
Armenia; Azerbaijan; Belarus; Bosnia and Herzegovina;Georgia; Kazakhstan; Macedonia, FYR; Moldova; Montenegro;the Russian Federation; Serbia; and Ukraine
proj
ecte
d pr
opor
tion
of p
opul
atio
n65
� y
ears
, 202
5 (%
)
The Kyrgyz Republic, Tajikistan, Turkmenistan,and Uzbekistan
Albania, Croatia, andthe new EU members
chaw_001-044_ch00.qxd 5/30/07 5:05 PM Page 13
14 From Red to Gray
working-age individuals, other things being equal. For a given capital
stock, a decline in the labor supply implies capital deepening that is
“undesired” from the perspective of firms, which will respond by
investing less. In labor markets, the reality is more complex and less
demographically deterministic than conventional wisdom suggests.
Although the region’s aggregate labor supply will decline over the
next 15 years, the declines will generally be modest. The greatest
challenge will be for countries that will have large declines in their
working-age populations but already have high participation rates.
But changes in labor markets are not immutably determined by
demographic legacies. First, productivity improvements are the core
predictor of growth, so measures taken to improve labor productivity
would swamp any quantity effects of smaller labor forces. In fact,
growth decomposition exercises show that in most of the region’s coun-
tries in recent years, the growth in labor productivity has been the sin-
gle greatest contributor to increases in per capita income (figure O.5).
Second, the impact of aging on the labor supply can be at least partially
offset by increases in the low labor force participation rates. Third, if
political resistance is overcome, intraregional migration from younger
countries can augment the labor forces of the aging countries.
FIGURE O.5In the Region, Labor productivity Has Had a Stronger Impact on Growth Than Aging (1998–2005)
Source: World Bank forthcoming a.
Note: GDP � gross domestic product. GDP/employment measures labor productivity, employment/working-age population measures the employment rate, andworking-age population/population is a proxy for aging. All data are from 2005, except data for Albania and Kazakhstan, which are for 2004.
�15
0
�5
�10
5
10
15
Turkey
Azerba
ijan
Kazakhs
tan
Albania
Moldova
Russian
Fede
ration
Armen
ia
Belarus
Czech R
epub
lic
Georgi
a
Roman
ia
Slovak
Repub
lic
Lithu
ania
Eston
ia
Ukraine
Polan
dLat
via
Hunga
ry
Bulgari
a
Macedo
nia, FY
RCroa
tia
Sloven
ia
perc
ent
country
GDP/employment employment/working-age populationworking-age population/population GDP/population
chaw_001-044_ch00.qxd 5/30/07 5:05 PM Page 14
Overview 15
Despite good reasons to believe that demographic trends in the
region do not inevitably mean problems for the labor market, policy
makers need to carefully monitor and manage the situation over the
next couple of decades, enacting appropriate policies to counter the
effects of aging. Managing the situation will require labor market,
pension, and education and training reforms, as well as better man-
agement of migration.
According to the 2004 United Nations population projections
(medium variant), the region will lose only 458,000 persons age 15
to 64 (the conventional age range of the working-age population)
between 2005 and 2020. True, this loss could be a source of concern
for those who think that labor supply growth is essential for aggre-
gate economic growth. But these overall numbers mask big dif-
ferences within the region. The younger countries (the Kyrgyz
Republic, Turkey, Turkmenistan, and Uzbekistan, as well as Albania
and Azerbaijan, which are “aging” in our classification) will have
gains in their working-age populations. Other countries (such as
Belarus, Georgia, Russia, and Ukraine) will have losses, ranging from
modest to very large. Clearly, this situation will create incentives for
migration within the region.
For the whole region, but particularly for those countries with
shrinking populations, labor productivity increases will be a major
factor in maintaining and improving labor’s contribution to growth.
There is good scope for major productivity increases, if proactive and
sensible policies are adopted—especially outside the labor market
(World Bank forthcoming b). Given the relatively low productivity
as economies adjusted during the early years of transition, this
increase can come both through a shift in resources from less to more
productive industries and from productivity improvements within
industries.
Much of the early drop in labor productivity, especially in the for-
mer Soviet countries, came from an economywide shift from higher-
productivity manufacturing to subsistence farming and low-end
services. Romania saw the share of employment in agriculture shoot
from about 30 percent in 1990 to almost 43 percent in 2000, while
employment in industry plummeted from 40 percent to just over
25 percent. As the economic transition progressed, however, this
trend reversed, and average labor productivity in the economy
improved. In Romania, agricultural employment fell back to less than
37 percent by 2002, while employment in industry returned to almost
30 percent.
In the new EU member states, labor productivity has generally
been increasing more because of improvements within industries—as
chaw_001-044_ch00.qxd 5/30/07 5:05 PM Page 15
16 From Red to Gray
in the countries of the Organisation for Economic Co-operation and
Development (OECD)—with average annual labor productivity
growth ranging from around 4 percent in the Czech Republic and the
Slovak Republic between 1999 and 2005 to more than 5 percent in
Hungary between 2000 and 2005 (Eurostat database). But shifts from
less to more productive industries were not as large as in the OECD
countries in previous decades, because enterprise restructuring is still
incomplete in many countries. Industries with above-average pro-
ductivity growth have been exactly the ones that shed relatively more
labor during the earlier years of transition—so that productivity
growth was initially driven more by defensive restructuring than
by strategic restructuring, which allocates factors to their most pro-
ductive uses. The good news is that the productivity gains expected
from strategic restructuring are large. If enterprises are restructured
and investment climates improved, large productivity gains can be
expected.
Two other factors could add to future productivity increases. First,
the region’s economies are more integrated with the rest of the world
in trade and capital flows—even though there is evidence of two poles
of trade integration, with the European Union as one and Russia the
other (World Bank 2005b). Both the demand for products for com-
petitive external markets and the inflows of foreign direct investment
in manufacturing and high-end services (especially in the European
Union and neighboring countries) will drive innovation and techno-
logical change in the region, potentially adding to productivity
growth. Second, as the region moves slowly to lifelong learning and
flexible retraining modes, as is suggested later in this report, individ-
ual productivity will also increase.
In addition to productivity improvements, output in aging countries
can receive a boost from increases in labor force participation, which
can be a major compensating mechanism for a shrinking working-age
population. Although patterns vary considerably across the region,
many countries in Eastern Europe and the former Soviet Union have
fairly low participation rates—particularly in older age groups. Men
exit the labor force on average almost four years earlier, and women
five years earlier, than in OECD countries. The early exits are driven
in part by restructuring, with laid-off workers often withdrawing
from the labor force because of scarce prospects for reemployment.
Participation rates for older men have been falling while those for
older women have been more stable.
Countries such as Hungary, FYR Macedonia, Poland, and Slovenia
all face large increases to already high old-age dependency ratios
(table O.2). Although this clearly poses challenges for labor supply,
chaw_001-044_ch00.qxd 5/30/07 5:05 PM Page 16
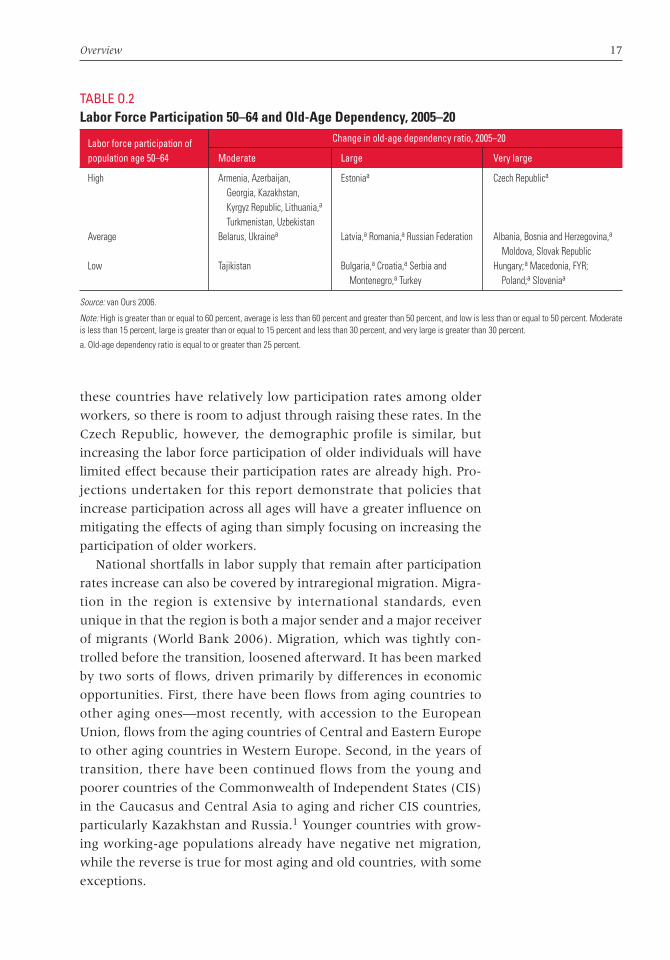
Overview 17
these countries have relatively low participation rates among older
workers, so there is room to adjust through raising these rates. In the
Czech Republic, however, the demographic profile is similar, but
increasing the labor force participation of older individuals will have
limited effect because their participation rates are already high. Pro-
jections undertaken for this report demonstrate that policies that
increase participation across all ages will have a greater influence on
mitigating the effects of aging than simply focusing on increasing the
participation of older workers.
National shortfalls in labor supply that remain after participation
rates increase can also be covered by intraregional migration. Migra-
tion in the region is extensive by international standards, even
unique in that the region is both a major sender and a major receiver
of migrants (World Bank 2006). Migration, which was tightly con-
trolled before the transition, loosened afterward. It has been marked
by two sorts of flows, driven primarily by differences in economic
opportunities. First, there have been flows from aging countries to
other aging ones—most recently, with accession to the European
Union, flows from the aging countries of Central and Eastern Europe
to other aging countries in Western Europe. Second, in the years of
transition, there have been continued flows from the young and
poorer countries of the Commonwealth of Independent States (CIS)
in the Caucasus and Central Asia to aging and richer CIS countries,
particularly Kazakhstan and Russia.1 Younger countries with grow-
ing working-age populations already have negative net migration,
while the reverse is true for most aging and old countries, with some
exceptions.
TABLE O.2Labor Force Participation 50–64 and Old-Age Dependency, 2005–20
Labor force participation of Change in old-age dependency ratio, 2005–20
population age 50–64 Moderate Large Very large
High Armenia, Azerbaijan, Estoniaa Czech Republica
Georgia, Kazakhstan, Kyrgyz Republic, Lithuania,a
Turkmenistan, UzbekistanAverage Belarus, Ukrainea Latvia,a Romania,a Russian Federation Albania, Bosnia and Herzegovina,a
Moldova, Slovak RepublicLow Tajikistan Bulgaria,a Croatia,a Serbia and Hungary;a Macedonia, FYR;
Montenegro,a Turkey Poland;a Sloveniaa
Source: van Ours 2006.
Note: High is greater than or equal to 60 percent, average is less than 60 percent and greater than 50 percent, and low is less than or equal to 50 percent. Moderateis less than 15 percent, large is greater than or equal to 15 percent and less than 30 percent, and very large is greater than 30 percent.
a. Old-age dependency ratio is equal to or greater than 25 percent.
chaw_001-044_ch00.qxd 5/30/07 5:05 PM Page 17
18 From Red to Gray
Savings and Financial Markets
The growth of output in any economy also depends on capital
accumulation—which requires investment, which, in turn, requires
an equivalent amount of matching savings—and on the productivity
of investment. Because individuals can invest only what they have
saved or borrowed from others who have saved, savings is essentially
the same as investment. Saving is thus the key ingredient in creating
capital and a key determinant of growth. The concern about saving
levels in aging populations is driven by life-cycle hypotheses, which
suggest that aggregate saving is likely to decline because people save
less as they grow older. However, there are various reasons to believe
that this concern may be mitigated in the case of the aging countries
of Eastern Europe and the former Soviet Union.
The available data provide some support for the argument that
households and firms may currently be saving less than they desire
and eventually will want to increase their savings beyond what would
otherwise be predicted.
• First, the average saving rate for a number of Eastern European
and former Soviet countries declined in the late 1990s and early
2000s, averaging only 15 percent for the region as a whole—down
from 18 percent in the period before 1990. Contrast that with
the average saving rate during the same period for the Western
European countries, which was 24 percent. Looking ahead, one
finds that convergence toward Western European levels would
imply that future saving in Eastern European and former Soviet
countries should be more than what would be expected otherwise.
• Second, saving in Eastern European and former Soviet countries
has an unusually low share of both household and corporate sav-
ings compared with OECD countries outside the region (table O.3).
Although differences exist both within the region’s countries and
within industrial countries, two additional features of saving in the
former are particularly distinctive. First, foreign savings are crucial
as a source of funds in most of the region’s countries, whereas they
are largely unimportant in industrial countries. The oil-producing
countries in the region are the exception to the rule. Second,
household savings play a much bigger role as a source of funds in
most industrial countries than in the region’s countries. Moreover,
in some of the region’s countries—Bulgaria being the starkest
example—household savings have been negative for the past cou-
ple of years, suggesting that households are consuming by deplet-
ing their stock of assets. Most likely, this unusual composition of
savings in the region reflects an incomplete economic transition.
chaw_001-044_ch00.qxd 5/30/07 5:05 PM Page 18

Overview 19
Eventually, households and firms can be expected to stop running
down assets and will want to replenish their savings to provide for
retirement and to build precautionary cushions.
The roots of this low saving rate lie in history. In socialist times,
strictly controlled earnings and access to credit meant that any avail-
able savings financed the consumption of durables and the purchase of
property, where allowed. Additional savings could be accumulated in
bank deposits (or pillowcases). Hyperinflation in the early years of the
transition devalued monetized savings, while the early 1990s saw real
wages drop in most countries, if only temporarily. Following privatiza-
tion, corporate restructuring, and the inflow of new technologies,
unemployment increased, and workers older than age 40 had diffi-
culty finding new jobs. These developments meant that cohorts older
than 40 in the 1990s and now approaching retirement—including the
TABLE O.3Uses and Sources of Funds: Selected OECD Countries and Eastern European and Former Soviet Countries percentages
France Germany Japan
1980–1989 1990–1999 2000–2002 1980–1989 1991–1999 2000–2002 1980–1989 1990–1999 2000–2002
UsesInvestment 100 91 93 — 97 89 92 94 93Current account surplus 0 7 7 — 3 10 6 5 4Government deficits 0 2 0 — 0 1 0 0 2Others 0 0 0 — 0 0 1 1 1
SourcesHousehold saving 43 45 48 — 49 50 43 38 33 Nonfinancial saving 34 42 37 — 36 36 38 40 54 Government surplus 7 3 7 — 3 3 16 15 0Foreign saving 6 1 0 — 0 0 0 0 0Other 10 9 9 — 11 12 3 7 12
Czech Republic Poland Bulgaria Estonia Kazakhstan
1995–2001 1995–2001 1999–2002 1995–2002 1990–1999 2000–2002
UsesInvestment 100 96 59 97 73 86Current account surplus 0 1 0 0 2 9Government deficits 0 0 0 0 15 0Others 0 3 41 3 10 4
SourcesHousehold saving 18 40 0 13 3 0Nonfinancial saving 45 26 60 28 60 57Government surplus 15 8 18 22 4 23Foreign saving 11 — 20 24 17 1Other 12 9 3 — 16 18
Source: United Nations System of National Accounts.
Note: — � not available.
chaw_001-044_ch00.qxd 5/30/07 5:05 PM Page 19

20 From Red to Gray
baby boomers—mostly failed to accumulate significant savings. Even
in countries where reforms introduced defined-contribution pension
schemes, people older than age 40 were discouraged from joining them.
Thus, the forced savings of mandatory private pension schemes did
not affect the portfolios of the elderly. The most important—and often
only—asset of these cohorts is their owner-occupied real estate. Lim-
ited population mobility, shallow real estate markets, and lack of
financial instruments (such as reverse mortgages) that would help
liquidate such assets mean that aging-determined saving is unlikely
to lead to supply shocks in either financial or real estate markets in
the coming decade.2
Aging, of course, is not the only factor affecting household and pri-
vate saving. Furthermore, private saving is not the only source of
resources available for investment. A decline in low private savings
does not necessarily imply a decline in investments. Corporate and
foreign savings are other sources of investment, and they should
remain largely unaffected by aging. And though total savings and
total investment equal each other, the causality between the two is
unclear. In other words, it is entirely possible that investment will
remain high in the next decades as a result of still higher returns on
capital than in Western Europe. The resources to fund such invest-
ments could come either from abroad—if outsiders’ expectations
about future growth potential in Eastern Europe and the former
Soviet Union remain favorable—or from domestic savers, attracted
by returns that are still high.
The major intermediaries in many of these flows will be the
region’s financial markets. They channel resources among indi-
viduals, institutions, countries, and economic sectors, while financial
instruments shift consumption across different stages of the life cycle
and match risk-return profiles to the circumstances of time and
place. In the region’s countries, these financial markets are generally
underdeveloped—certainly when compared with those in the richer
aging countries in the non–Eastern European OECD. In fact, even
the more developed economies in the region are far behind OECD
countries (figure O.6).
Financial systems in most of the region are still heavily dominated
by banks, in that most financing is still channeled through them,
though in some countries the securities market is also quite well
developed. Bank deposits, the dominant saving instruments, still
amount to only a small percentage of gross domestic product (GDP) in
most countries. The exceptions are Croatia, the Czech Republic, and
the Slovak Republic, where bank deposits are more than 50 percent
but still far less than the over–100 percent rate typical of most indus-
trial countries. This situation is a combined effect of low savings and
chaw_001-044_ch00.qxd 5/30/07 5:05 PM Page 20

Overview 21
little trust in financial intermediaries (and financial products in gen-
eral). Because economies are small and foreign portfolio investment is
limited to a few blue-chip offerings, the underdeveloped financial
markets have negligible influence on global capital markets.
What does this imply for savings accumulation for productivity
and growth? First, as financial markets deepen and the number and
variety of savings instruments increases, there is likely to be greater
opportunity for formal savings as individuals and corporations are
better able to match their individual time horizons and risk profiles to
the available instruments. Second, financial deepening and increased
flexibility are also likely to boost overall productivity, as financial
markets are able to more efficiently channel capital to the most
productive uses. At the margin, therefore, the paradox is that the low
level of financial development in Eastern Europe and the former
Soviet Union poses an opportunity for more and better uses of sav-
ings for growth, and the challenge for the region’s countries is how
soon they can make this financial deepening happen through a better
regulatory environment.
Red Ink to Black Ink: Waging Sensible Policies Can EaseAging’s Spending Impact
There are widespread concerns that aging populations in Eastern
European and former Soviet countries will exert new pressures on
public spending, especially for pensions and health care. According to
FIGURE O.6Financial Markets in Even the More Developed Economies of theRegion are Shallower Than Those in Other OECD Countries
Source: World Bank, Financial Structure Dataset.
0
50
100
150
200
250
Turkey
Slovak
Repub
lic
Polan
d
Hunga
ry
Czech R
epub
lic
German
yIta
lyJa
pan
France
United
Kingdo
m
Netherl
ands
United
States
finan
cial
cap
ital o
f ins
titut
iona
l inv
esto
rs(%
of G
DP)
country
chaw_001-044_ch00.qxd 5/30/07 5:05 PM Page 21

22 From Red to Gray
this view, as the number of the elderly increases, both in absolute
terms and relative to the working population, higher pension payouts
will strain the already stretched social security budgets even further.
In addition, aging populations would have significantly higher health
needs, simply because the greatest demand for medical care occurs in
the later years of life.
Another critical issue is long-term care for the very old, which
either becomes costly as informal, family-based care declines or
imposes opportunity costs if younger people have to spend time on
care that they would otherwise spend working. As a result, medical
and health care costs will rise as populations age, though the size of
future health and disability expenditures depends crucially on
whether the longevity revolution is adding healthy years—or years of
illness and dependency—to the life span.
Aging will exert at least two different pressures on education, with
potentially opposite budgetary consequences. The shrinking school-
age population will make some cost savings possible. However, to
maintain productivity and to increase the employability of older
workers—which are essential to counteract the falling number of
total workers—aging labor forces will require improvements in edu-
cation and new forms of education throughout workers’ active lives.
Lifelong learning is almost nonexistent at present in the transition
countries.
Offsetting these concerns is this report’s finding that the blow to
public expenditures can be fairly small—if well-understood policy
measures are put in place for pensions, if proactive measures are
undertaken for financing long-term care, and if savings in public
education expenditures are reoriented toward initiatives that boost
productivity.
Reforming Pension Systems
With low and declining fertility rates and rising life expectancies
in the region’s aging countries, pension spending will have to rise
to accommodate the larger number of elderly at current levels of
benefits. This challenge is especially huge for countries that have
unfunded pay-as-you-go (PAYG) social security systems—and
already substantial pension spending.
Fortunately, this is only a potential scenario. A recent EU study
based on detailed projections from each member country found that,
on average, 47 percent of the projected demographic change could
be mitigated by changes in policy, primarily changes in retirement
ages and benefit rates (European Commission 2006). For this report,
the EU results have been extended to other countries in the region
chaw_001-044_ch00.qxd 5/30/07 5:05 PM Page 22
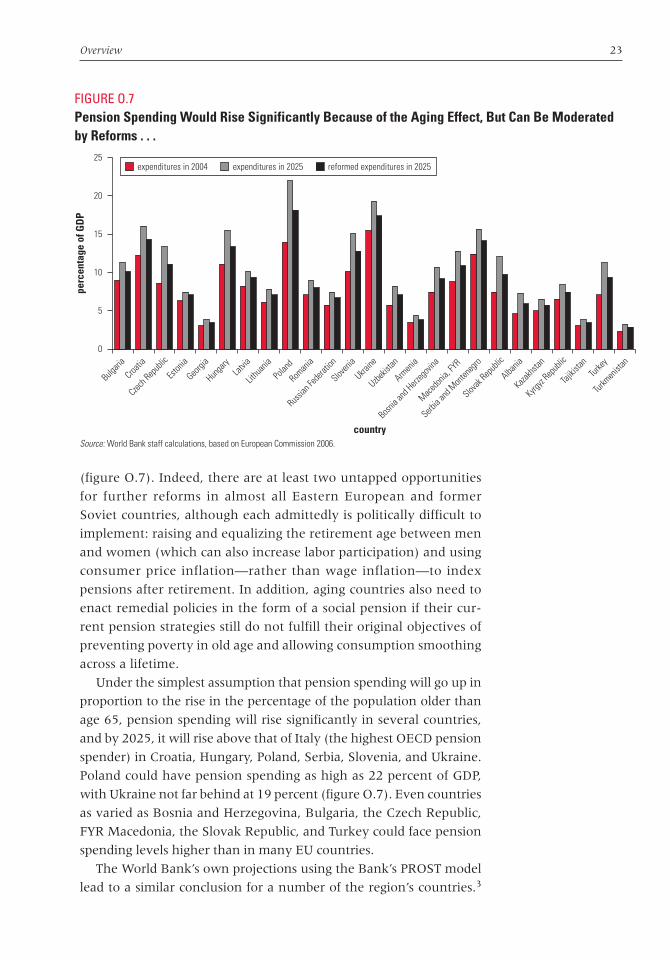
Overview 23
(figure O.7). Indeed, there are at least two untapped opportunities
for further reforms in almost all Eastern European and former
Soviet countries, although each admittedly is politically difficult to
implement: raising and equalizing the retirement age between men
and women (which can also increase labor participation) and using
consumer price inflation—rather than wage inflation—to index
pensions after retirement. In addition, aging countries also need to
enact remedial policies in the form of a social pension if their cur-
rent pension strategies still do not fulfill their original objectives of
preventing poverty in old age and allowing consumption smoothing
across a lifetime.
Under the simplest assumption that pension spending will go up in
proportion to the rise in the percentage of the population older than
age 65, pension spending will rise significantly in several countries,
and by 2025, it will rise above that of Italy (the highest OECD pension
spender) in Croatia, Hungary, Poland, Serbia, Slovenia, and Ukraine.
Poland could have pension spending as high as 22 percent of GDP,
with Ukraine not far behind at 19 percent (figure O.7). Even countries
as varied as Bosnia and Herzegovina, Bulgaria, the Czech Republic,
FYR Macedonia, the Slovak Republic, and Turkey could face pension
spending levels higher than in many EU countries.
The World Bank’s own projections using the Bank’s PROST model
lead to a similar conclusion for a number of the region’s countries.3
FIGURE O.7Pension Spending Would Rise Significantly Because of the Aging Effect, But Can Be Moderated by Reforms . . .
Source: World Bank staff calculations, based on European Commission 2006.
0
10
5
15
20
25
Tajikis
tan
Uzbekis
tan
Turkm
enist
an
Kyrgyz
Repub
lic
Turkey
Kazakhs
tan
Albania
Armen
ia
Macedo
nia, FY
R
Russian
Fede
ration
Serbia
and M
onten
egro
Georgi
a
Roman
ia
Slovak
Repub
lic
Lithu
ania
Eston
ia
Ukraine
Bosnia
and H
erzeg
ovina
Polan
dLat
via
Hunga
ry
Bulgari
a
Czech R
epub
lic
Croatia
Sloven
ia
perc
enta
ge o
f GD
P
country
expenditures in 2004 expenditures in 2025 reformed expenditures in 2025
chaw_001-044_ch00.qxd 5/30/07 5:05 PM Page 23
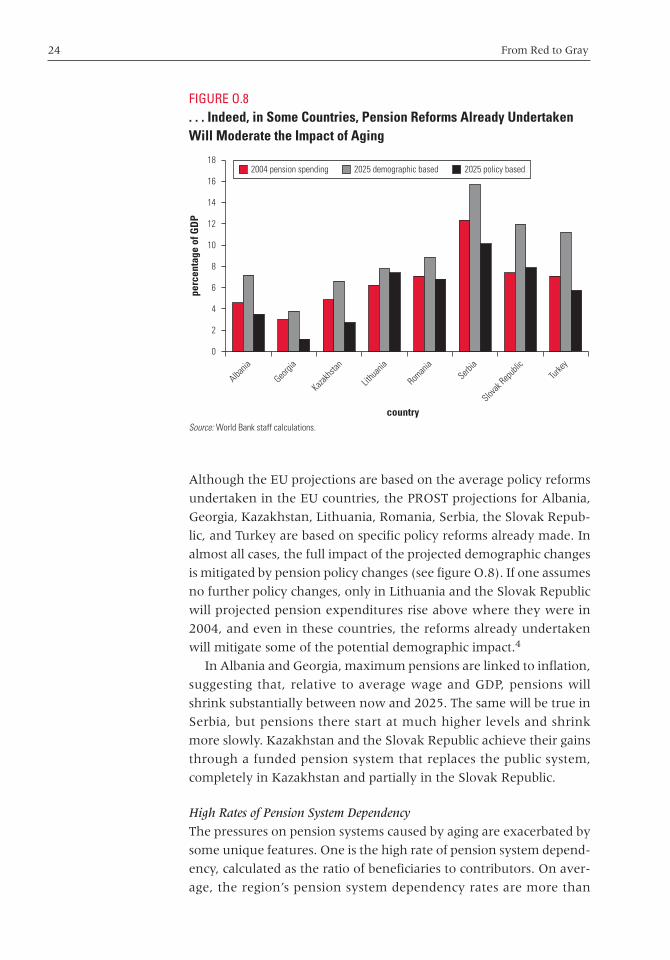
24 From Red to Gray
Although the EU projections are based on the average policy reforms
undertaken in the EU countries, the PROST projections for Albania,
Georgia, Kazakhstan, Lithuania, Romania, Serbia, the Slovak Repub-
lic, and Turkey are based on specific policy reforms already made. In
almost all cases, the full impact of the projected demographic changes
is mitigated by pension policy changes (see figure O.8). If one assumes
no further policy changes, only in Lithuania and the Slovak Republic
will projected pension expenditures rise above where they were in
2004, and even in these countries, the reforms already undertaken
will mitigate some of the potential demographic impact.4
In Albania and Georgia, maximum pensions are linked to inflation,
suggesting that, relative to average wage and GDP, pensions will
shrink substantially between now and 2025. The same will be true in
Serbia, but pensions there start at much higher levels and shrink
more slowly. Kazakhstan and the Slovak Republic achieve their gains
through a funded pension system that replaces the public system,
completely in Kazakhstan and partially in the Slovak Republic.
High Rates of Pension System Dependency
The pressures on pension systems caused by aging are exacerbated by
some unique features. One is the high rate of pension system depend-
ency, calculated as the ratio of beneficiaries to contributors. On aver-
age, the region’s pension system dependency rates are more than
FIGURE O.8. . . Indeed, in Some Countries, Pension Reforms Already UndertakenWill Moderate the Impact of Aging
Source: World Bank staff calculations.
0
2
6
4
10
14
12
16
8
18
Albania
Georgi
a
Kazakhs
tan
Lithu
ania
Roman
iaSerb
ia
Slovak
Repub
licTur
key
perc
enta
ge o
f GD
P
country
2004 pension spending 2025 demographic based 2025 policy based
chaw_001-044_ch00.qxd 5/30/07 5:05 PM Page 24

Overview 25
three times its population dependency rates. As the pension system
dependency rate rises, pension expenditures rise relative to revenues,
causing substantial fiscal problems. Even in Albania, Azerbaijan, and
the Kyrgyz Republic, which are all younger than the new EU mem-
bers, the pension system dependency rates are more than six times
the population dependency rates. By contrast, the pension system
dependency rate in OECD countries is, on average, less than twice the
population dependency rate.5
Partly reflecting population aging, these high dependency rates
also reflect the labor market transitions that are still under way.
Although the vast majority of the elderly are collecting pensions, the
majority of working-age people are not contributing to the pension
system. This situation results from the high unemployment among
some age groups and from the lower retirement ages and early retire-
ment provisions still prevalent—but even more from the informaliza-
tion of the labor market.
Dependency rates are also affected by the low retirement ages,
which are lower in Eastern European and former Soviet countries
than in their OECD counterparts outside the region. This is particu-
larly the case for women (figure O.9). Although women traditionally
have retired younger than men, given their longer life expectancy
there is no logical reason for maintaining the differences other than
precedent. Countries also allow many people to retire early, both
generally and in specific occupations. Many had pronatalist policies
that allow women with more children to retire substantially earlier
(see box O.2). Also, most countries used the disability system to
allow employers to shed surplus or unnecessary labor in the chang-
ing labor market. Many continue to do so.
Indexing Pensions after Retirement
The second feature is the indexation of pensions after retirement.
OECD countries have typically moved to inflation adjustment of
pensions after retirement to minimize fiscal costs and maintain the
pension’s purchasing power. But many countries in Eastern Europe
and Central Asia still adjust pensions to some mix of inflation and
wage growth. Moving to inflation indexation would bring them in
line with international standards and provide savings to counter the
impact of aging.
Effects of Raising Retirement Ages and Adjusting Pensions for Inflation
The impact of raising the retirement age to 65 and adjusting pensions
by inflation varies considerably, depending on initial policies.6 In
some countries, such as Lithuania and the Slovak Republic, both
chaw_001-044_ch00.qxd 5/30/07 5:05 PM Page 25
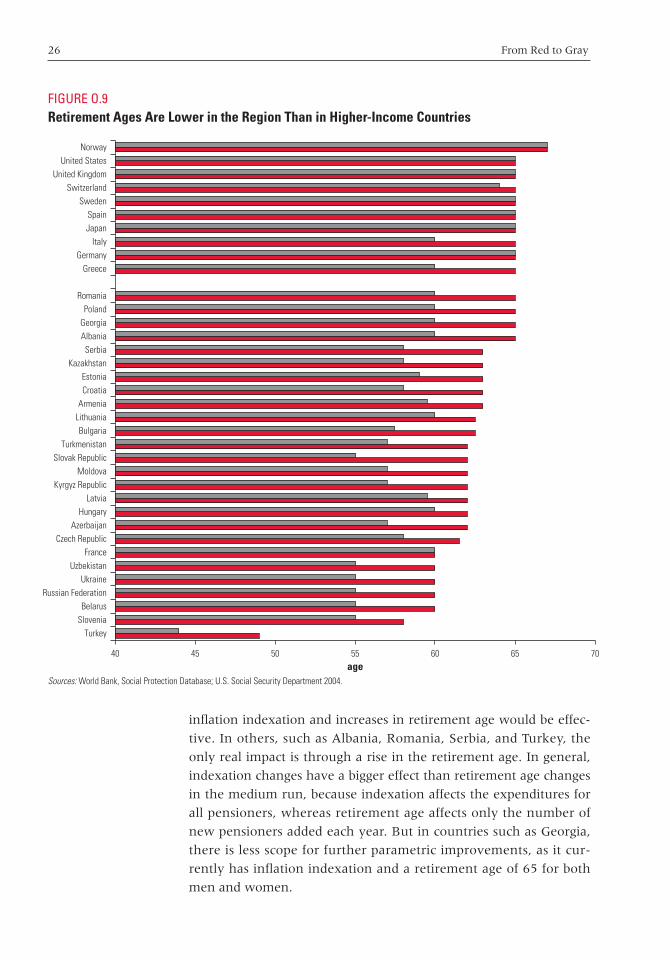
26 From Red to Gray
inflation indexation and increases in retirement age would be effec-
tive. In others, such as Albania, Romania, Serbia, and Turkey, the
only real impact is through a rise in the retirement age. In general,
indexation changes have a bigger effect than retirement age changes
in the medium run, because indexation affects the expenditures for
all pensioners, whereas retirement age affects only the number of
new pensioners added each year. But in countries such as Georgia,
there is less scope for further parametric improvements, as it cur-
rently has inflation indexation and a retirement age of 65 for both
men and women.
FIGURE O.9Retirement Ages Are Lower in the Region Than in Higher-Income Countries
Sources: World Bank, Social Protection Database; U.S. Social Security Department 2004.
Turkey
40 45 50 55age
60 65 70
SloveniaBelarus
Russian FederationUkraine
UzbekistanFrance
Czech RepublicAzerbaijan
HungaryLatvia
Kyrgyz RepublicMoldova
Slovak RepublicTurkmenistan
BulgariaLithuaniaArmenia
CroatiaEstonia
KazakhstanSerbia
AlbaniaGeorgiaPoland
Romania
GreeceGermany
ItalyJapanSpain
SwedenSwitzerland
United KingdomUnited States
Norway
chaw_001-044_ch00.qxd 5/30/07 6:00 PM Page 26
Overview 27
Prevention of Poverty and Smoothing of Consumption
In addition to equalizing the retirement age for men and women,
raising it to age 65, and indexing pensions after retirement to infla-
tion, countries need to take a closer look at their current pension
strategies to determine whether they still fulfill the original objectives
of preventing poverty in old age and allowing consumption smooth-
ing across a lifetime. Although not every country may need or be able
to adopt every element in a generic pension strategy, the key ele-
ments include adjusting the parameters of the contributory PAYG
pension systems to ensure fiscal sustainability (as already discussed),
providing noncontributory social pensions, and providing the legal
and institutional infrastructure for voluntary supplemental pension
systems that are reasonably secure.
With aging populations, the benefits paid to a growing elderly pop-
ulation from the contributions of a shrinking labor force—as a PAYG
system requires—will fall, no matter how well the system is designed,
unless the government makes transfers from the general budget into
the pension fund. At some point, contributions saved in financial
instruments may provide better returns for workers and a better vehi-
cle for consumption smoothing. A strong financial market infrastruc-
ture, including adequate supervision and regulation, would thus be
needed for private pensions to replace all or part of the public pension
system.
Option of Social Pensions in Poorly Performing Systems
The number of pension contributors has fallen considerably in most of
the region, and the recent upturns in some countries’ economic
growth has not reversed this trend. Today, most elderly people are col-
lecting some form of pension, but in the future, many will not be eli-
gible for benefits—and many countries do not have a poverty-targeted
social assistance system to protect the elderly from destitution. This
situation will pressure governments to consider some type of flat non-
contributory social pension to the elderly in addition to the contribu-
tory pension benefits being paid now, a change that will have both
fiscal and structural implications.
Indeed, the first objective of an old-age pension system is to pre-
vent poverty among the elderly. But many of the region’s elderly
could face the inability of their pensions to pay for retirement. The
potential insolvency of PAYG systems, which is a concern in some
OECD countries, is exacerbated by two features particular to the tran-
sition from a socialist structure.
First, the region’s pension systems are supporting more elderly,
with fewer contributors financing these pensions—so government
chaw_001-044_ch00.qxd 5/30/07 5:05 PM Page 27

28 From Red to Gray
transfers to the pension systems, from general government revenue
rather than contributions, are necessarily becoming a major source of
financing. Although the overall framework for paying in is the con-
tributory PAYG system, there is a disconnect between individual con-
tributions and the general government revenue paid by all.
Second, some countries require long durations of contributions for
pension eligibility. Since coverage has fallen markedly, it is certain
that in the future, when the contribution histories of the pretransi-
tion period are no longer relevant, large numbers of individuals will
reach retirement age without being eligible for pensions.
In countries that lack alternative forms of social assistance, it will
be politically and socially difficult to deny transfers to those indi-
viduals. For many, it could make sense to move away from the quasi-
contributory systems of the present, with their higher administrative
costs, toward noncontributory social pensions. Such pensions could
be provided at an appropriately advanced age to all individuals,
financed through government revenue (just as, today, government
revenue is already financing a portion of the pensions).
This option could be particularly relevant for many transition
economies, because past contributions were made solely by public
enterprises, unconstrained by the need to make profits or provide
returns to shareholders. The contributions were somewhat arbitrary,
coming from a nonmarket economy, so linking benefits to wages
makes less sense than in an economy with market-based wages. Fur-
thermore, wage records in many countries are either nonexistent or
incomplete.
Social pensions also have an important political difference. They
would no longer constitute acquired rights. This change would give
the government more freedom to adjust the level of benefits and the
age of provision—and the administrative costs of maintaining a col-
lection and recordkeeping institution could be eliminated. The bene-
fits could also be financed by the least costly, most efficient tax
mechanism available.
These pensions would be most appropriate in the less reformed
countries with low coverage, limited revenue collections, and weak
links between contributions and benefits. But even in the more
advanced transition economies, some social pension may be needed,
given the decline in coverage. Most of these countries have such pro-
visions in place, but the cost will rise as more people without contri-
bution histories use them.
What would be the cost of a social pension? If all individuals
in Eastern European and former Soviet countries age 65 and older
chaw_001-044_ch00.qxd 5/30/07 5:05 PM Page 28
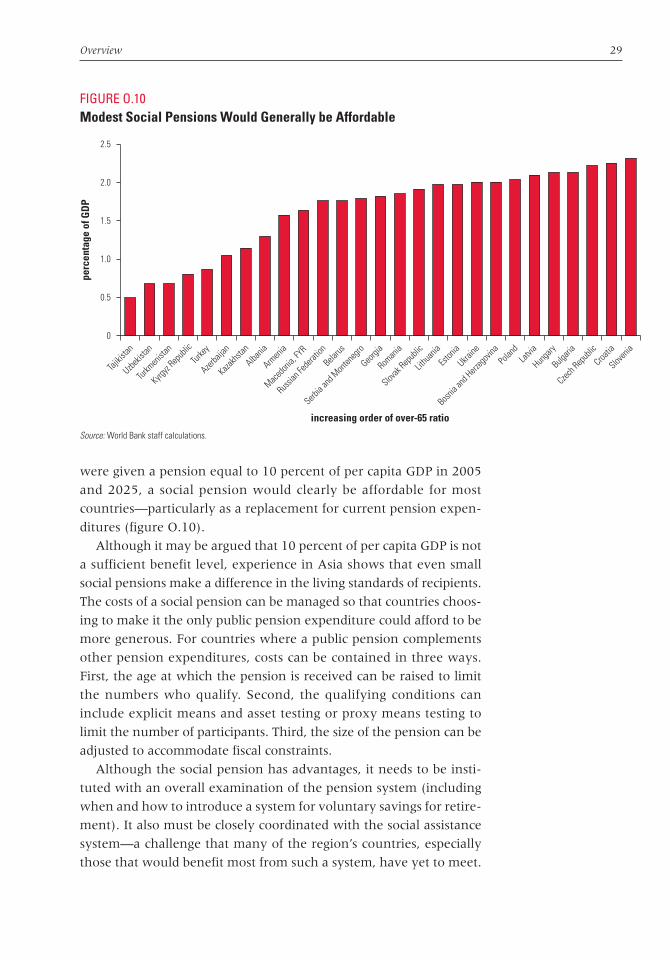
Overview 29
were given a pension equal to 10 percent of per capita GDP in 2005
and 2025, a social pension would clearly be affordable for most
countries—particularly as a replacement for current pension expen-
ditures (figure O.10).
Although it may be argued that 10 percent of per capita GDP is not
a sufficient benefit level, experience in Asia shows that even small
social pensions make a difference in the living standards of recipients.
The costs of a social pension can be managed so that countries choos-
ing to make it the only public pension expenditure could afford to be
more generous. For countries where a public pension complements
other pension expenditures, costs can be contained in three ways.
First, the age at which the pension is received can be raised to limit
the numbers who qualify. Second, the qualifying conditions can
include explicit means and asset testing or proxy means testing to
limit the number of participants. Third, the size of the pension can be
adjusted to accommodate fiscal constraints.
Although the social pension has advantages, it needs to be insti-
tuted with an overall examination of the pension system (including
when and how to introduce a system for voluntary savings for retire-
ment). It also must be closely coordinated with the social assistance
system—a challenge that many of the region’s countries, especially
those that would benefit most from such a system, have yet to meet.
FIGURE O.10Modest Social Pensions Would Generally be Affordable
Source: World Bank staff calculations.
0
1.0
0.5
1.5
2.0
2.5
Tajikis
tan
Uzbekis
tan
Turkm
enist
an
Kyrgyz
Repub
lic
Turkey
Azerba
ijan
Kazakhs
tan
Albania
Armen
ia
Macedo
nia, FY
R
Russian
Fede
ration
Belarus
Serbia
and M
onten
egro
Georgi
a
Roman
ia
Slovak
Repub
lic
Lithu
ania
Eston
ia
Ukraine
Bosnia
and H
erzeg
ovina
Polan
dLat
via
Hunga
ry
Bulgari
a
Czech R
epub
lic
Croatia
Sloven
ia
perc
enta
ge o
f GD
P
increasing order of over-65 ratio
chaw_001-044_ch00.qxd 5/30/07 5:05 PM Page 29

30 From Red to Gray
Affordable Health Care and Long-Term Care
in Aging Societies
A rapidly aging population is expected to have significantly higher
health care requirements, simply because the elderly have a high
demand for ambulatory, inpatient, and chronic care in their later
years. Another critical issue is long-term care for the very old (dis-
cussed in detail on page 32). Such care becomes costly as informal,
family-based care declines, and it can have large opportunity costs if
younger people must spend time caring for the elderly that they would
otherwise spend in the labor force. There is thus real concern for rising
medical and health costs as populations age, especially where health
spending is already higher than available resources. The magnitude of
cost increases will depend on whether longer life spans add healthy
years or years of illness and dependency. Aging will also aggravate the
magnitude of mental health problems, because of the increasing life
expectancy of those with mental disorders and an ever-growing num-
ber of people reaching the age when the risk of such disorders is high.
This report finds that the use of health services will increase as pop-
ulations age but that the increase in health spending will, in most
countries, be largely due to factors unrelated to aging. Of particular
concern is the conclusion that aging populations will indeed put sub-
stantial new pressures on long-term care for the elderly. This is a
major cause for concern, because most Eastern European and former
Soviet countries are unprepared to absorb the expenditure shock of
long-term care—as distinct from clinical health care. Demand for
effective long-term care is inevitable as people live longer and have
less ability to carry out daily activities. Unless well-designed programs
are in place to help these elderly receive care, the risk of adverse con-
sequences is high. There could be a public expenditure shock from
using expensive hospital services for care that could be provided more
cheaply, or there could be an output shock from family members hav-
ing to sacrifice too much work time to care for elderly relatives.
Effects of Aging on Public Health Spending
Health spending patterns suggest that broader economic trends have
more influence on health care expenditures than does the aging of the
population; in fact, public health expenditures are largely explained
by a nation’s GDP per capita, changes in the level of service, techno-
logical innovation, quality of services, and productivity.7 At current
benefit levels, public spending on health will increase significantly by
2020 (compared with 2005) only in Tajikistan and Uzbekistan, both
young countries. The increases will be more modest, on the order of
2 percent of GDP, in countries such as Belarus, Bulgaria, Estonia,
chaw_001-044_ch00.qxd 5/30/07 5:05 PM Page 30
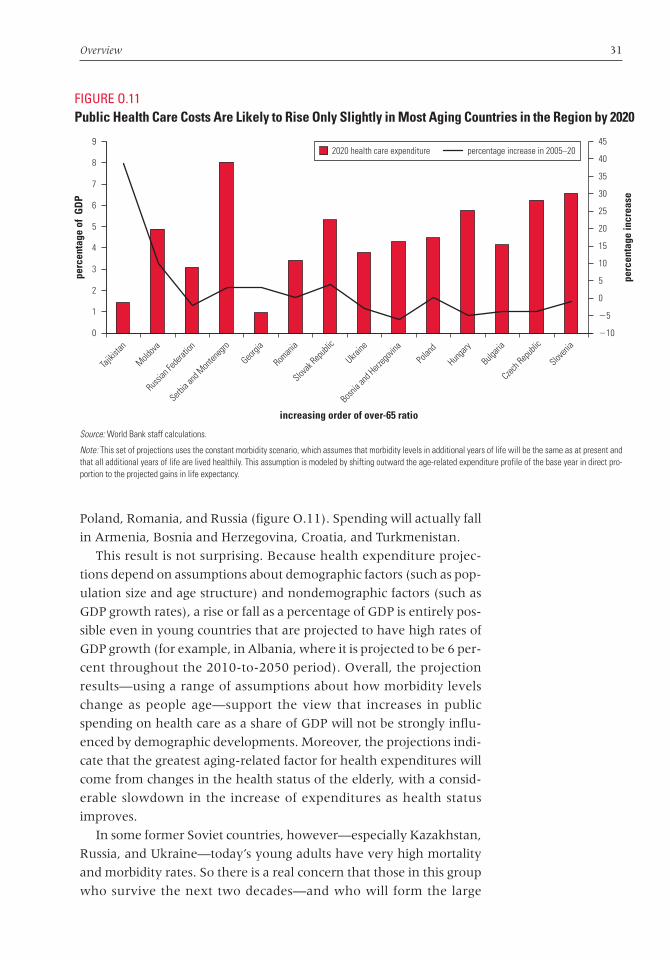
Overview 31
Poland, Romania, and Russia (figure O.11). Spending will actually fall
in Armenia, Bosnia and Herzegovina, Croatia, and Turkmenistan.
This result is not surprising. Because health expenditure projec-
tions depend on assumptions about demographic factors (such as pop-
ulation size and age structure) and nondemographic factors (such as
GDP growth rates), a rise or fall as a percentage of GDP is entirely pos-
sible even in young countries that are projected to have high rates of
GDP growth (for example, in Albania, where it is projected to be 6 per-
cent throughout the 2010-to-2050 period). Overall, the projection
results—using a range of assumptions about how morbidity levels
change as people age—support the view that increases in public
spending on health care as a share of GDP will not be strongly influ-
enced by demographic developments. Moreover, the projections indi-
cate that the greatest aging-related factor for health expenditures will
come from changes in the health status of the elderly, with a consid-
erable slowdown in the increase of expenditures as health status
improves.
In some former Soviet countries, however—especially Kazakhstan,
Russia, and Ukraine—today’s young adults have very high mortality
and morbidity rates. So there is a real concern that those in this group
who survive the next two decades—and who will form the large
FIGURE O.11Public Health Care Costs Are Likely to Rise Only Slightly in Most Aging Countries in the Region by 2020
Source: World Bank staff calculations.
Note: This set of projections uses the constant morbidity scenario, which assumes that morbidity levels in additional years of life will be the same as at present andthat all additional years of life are lived healthily. This assumption is modeled by shifting outward the age-related expenditure profile of the base year in direct pro-portion to the projected gains in life expectancy.
0
3
2
1
5
7
6
4
9
8
�10
5
0
�5
15
25
20
10
45
35
40
30
Tajikis
tan
Moldova
Russian
Fede
ration
Serbia
and M
onten
egro
Georgi
a
Roman
ia
Slovak
Repub
lic
Ukraine
Bosnia
and H
erzeg
ovina
Polan
d
Hunga
ry
Bulgari
a
Czech R
epub
lic
Sloven
ia
perc
enta
ge o
f G
DP
perc
enta
ge in
crea
se
increasing order of over-65 ratio
2020 health care expenditure percentage increase in 2005–20
chaw_001-044_ch00.qxd 5/30/07 5:05 PM Page 31
32 From Red to Gray
majority of the elderly in 2025—will be more vulnerable to illnesses
at an old age. If the elderly cohorts in these countries indeed suffer
increasing disability with age, the health systems will face inordi-
nately high fiscal and capacity pressures—though not directly because
of aging. The biggest and most immediate challenge for these coun-
tries is thus to improve the health of the adult population, targeting
the causes of morbidity and mortality among those age 25 to 45. This
approach implies that a significant proportion of public expenditures
on health today needs to be directed toward prevention and promo-
tion of lifestyle changes that ensure better health.
Health care costs are likely to rise—and rise rapidly—because of
cost drivers unrelated to aging. Most of the region’s countries have
not completed the reforms to address deep-rooted structural faults in
the design of their healthcare systems. However, these faults, if allowed
to persist, could drastically increase overall healthcare costs.
Countries need to shift from expensive inpatient care to less
expensive outpatient care. A particularly thorny problem is the scope
of services to be covered by the public system, laid down in the con-
stitutions of most countries and generally interpreted to imply uni-
versal access to free health care services through compulsory health
insurance. Given the rising costs of medical technology and pharma-
ceutical medications, these guarantees, if unchecked, can impose a
significant fiscal burden on health systems. Most Eastern European
and former Soviet countries have not completed reforms to address
the deep-rooted structural faults in health systems, especially in
managing health expenditures, and this, rather than aging, poses the
greatest public expenditure risk.
Preparing for the Shock of Long-Term Care
Aging populations will put new pressures on the provision and use of
long-term care services. Long-term care incorporates a broad mix of
medical, social, and residential (housing) dimensions. Three general
types of service groups are home care, sheltered housing and old-age
houses, and nursing homes. In addition, there is a wide variety of day
programs outside the home but in support of home care—elder day
care centers, respite care centers, and education and support for infor-
mal caregivers.
Most long-term care in the region is provided in hospitals or infor-
mally by families of dependents. The availability and use of institu-
tional long-term care services are very limited in most countries.
Where such services exist, the responsibility for delivering long-term
care is vested in different agencies, including the local governments
generally responsible for community care. The long-term mentally ill
are typically cared for in regional psychiatric hospitals. Voluntary and
chaw_001-044_ch00.qxd 5/30/07 5:05 PM Page 32

Overview 33
nongovernmental organizations are doing more as providers of nurs-
ing homes, hospices, and rehabilitation services and as providers of
long-term residential care and care in the community. In some coun-
tries, such as Poland, voluntary organizations and domiciliary nursing
agencies have begun to develop community services, such as home
nursing and home help.
Even in Western Europe and Central Europe, the use of long-term
services is not very high, ranging from about 12 percent in Northern
Europe to about 3 percent in Italy and 1 percent in Greece. The cor-
responding figure in Poland is about 2 percent. In many countries,
the largest proportion of the elderly receiving services use informal
home care, as in Austria and Spain (about 80 percent) (OECD 2005).
Nursing homes, residential homes, and community arrangements are
very limited, even though some new EU member states have made
good progress in recent years.
How many elderly will need long-term care? A conservative
assumption is that only 5 percent of the elderly dependent population
with disabilities will receive formal institutionalized care, and 5 per-
cent will receive informal care (10 percent for new EU member
states). In this scenario, expenditures on long-term care (under the
increasing disability scenario) will double in almost all Eastern Euro-
pean and former Soviet countries, to account for between 0.5 percent
and 1 percent of GDP. If, however, institutionalized care extends to
20 percent of the elderly with disabilities, expenditures on long-term
care alone will consume between 2 percent and 4 percent of GDP.
Because public expenditures on formal and informal long-term care
depend on eligibility and benefits and on the way care is provided,
countries in the region must make very deliberate and careful policy
choices on entitlement, provision, and financing.
How, then, should policy makers respond? Many policy implica-
tions of the analysis here apply across the region, irrespective of
health system organization. First, promoting healthier elderly popu-
lations will perhaps be the most effective way to ensure better health
and lower expenditures. This is also the longest-term strategy—
adopting preventive medical and social approaches at earlier ages to
forestall the needs of the elderly for clinical or long-term care. These
measures include changes in lifestyle, especially promotion of regular
exercise and control of diet and weight.
Second, making sensible policy decisions on financing and deliv-
ering long-term care is fundamental to containing expenditures. The
key to containing expenditures is to design delivery arrangements
and to configure services and their accessibility for elderly clients in
ways that are substantially less expensive for public sector budgets.
Examples are the neighborhood and community-based arrangements
chaw_001-044_ch00.qxd 5/30/07 5:05 PM Page 33

34 From Red to Gray
that are called “care-friendly districts” in the Netherlands and “open
care centers” in Greece. These arrangements introduce a category of
care—part medical and part social, between home care and primary
care—that meets elderly needs and is more readily accessible than
normal primary care services.
Third, informal caregivers, who are the core of a cost-efficient long-
term care system, need to be recognized and supported. This proposal
reflects two major policy concerns. The first is that the predominant
source of supply for informal caregivers—women who do not hold
full-time regular employment—either has shrunk or is projected to
shrink. The second is the capacity and willingness of informal care-
givers to continue providing care. There is a real danger of unpaid
informal caregivers becoming overloaded and feeling compelled to
move their elderly family members to an institution.
Fourth, as a means of maintaining an adequate supply of care-
givers, cash and service benefits could be incorporated in the care
of elderly clients, making it possible to provide some financial return
to informal caregivers. In countries with social health insurance
(Austria and Germany) and in several Nordic tax-based systems,
informal caregivers receive pension credits. In the Netherlands, since
2003, both paid care and informal care can be combined for certain
patients through an individual budget, which allows informal care-
givers to obtain professional assistance with more difficult tasks.
Countries in the region must formulate long-term care strategies to
rely primarily on home care and informal caregivers rather than insti-
tutionalized provision. This is mostly driven by the needs that will
emerge as the aging population increases its disabilities, but it will also
be partially spurred by peer pressure from the older EU member states
to provide for the long-term needs of the elderly.
Shifting Education Expenditures and Providing
for Lifelong Learning
Potential exists for public expenditures on education to fall in aging
countries because of rapidly shrinking school-age populations. This
report, however, shows that the expected decline in expenditures
could be counteracted by two factors that policy makers will need to
address to capture the potential fiscal benefits of aging. First is the
need to restore and improve enrollment rates, which have dropped
significantly in much of the region. Second is the imperative to invest
in lifelong learning practices to better meet the needs of dynamic and
flexible economies in the years ahead.
If current trends continue, all the region’s transition countries
except Tajikistan will have smaller school-age cohorts by 2025
chaw_001-044_ch00.qxd 5/30/07 5:05 PM Page 34
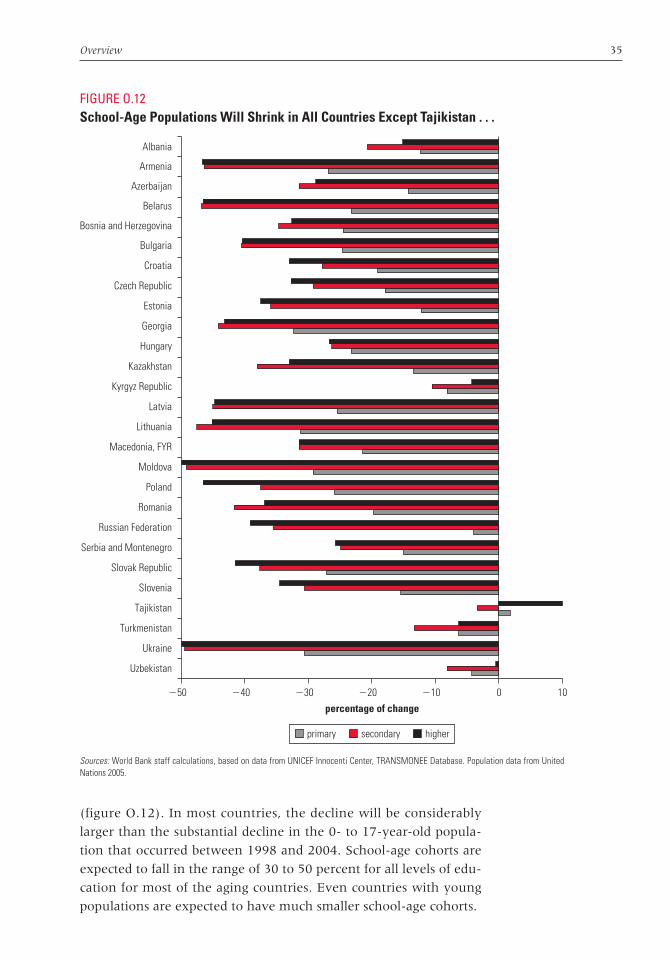
Overview 35
(figure O.12). In most countries, the decline will be considerably
larger than the substantial decline in the 0- to 17-year-old popula-
tion that occurred between 1998 and 2004. School-age cohorts are
expected to fall in the range of 30 to 50 percent for all levels of edu-
cation for most of the aging countries. Even countries with young
populations are expected to have much smaller school-age cohorts.
FIGURE O.12School-Age Populations Will Shrink in All Countries Except Tajikistan . . .
Sources: World Bank staff calculations, based on data from UNICEF Innocenti Center, TRANSMONEE Database. Population data from UnitedNations 2005.
Albania
Azerbaijan
Kyrgyz Republic
Tajikistan
Turkmenistan
Uzbekistan
Armenia
Bosnia and Herzegovina
Croatia
Czech Republic
Hungary
Kazakhstan
Macedonia, FYR
Moldova
Poland
Romania
Serbia and Montenegro
Slovak Republic
Slovenia
Belarus
Bulgaria
Estonia
Georgia
Latvia
Lithuania
Russian Federation
Ukraine
primary secondary higher
0 10�10�20�30�40�50
percentage of change
chaw_001-044_ch00.qxd 5/30/07 6:00 PM Page 35
36 From Red to Gray
These population dynamics will generally imply downsizing staff
and facilities in many primary and secondary schools, with associated
savings in public expenditures. A closer look, though, reveals that the
savings may not be as large or universal as anticipated, because current
coverage in education leaves significant room for improvement. For
example, the large declines in primary school coverage in Armenia,
Bosnia and Herzegovina, and Turkmenistan during the transition
have pulled gross enrollment rates in primary education well below
90 percent. Russia had a smaller decline, but its starting point was
also low, again leaving coverage below 90 percent.
The larger declines in secondary coverage leave rates below 50 per-
cent in Armenia, Azerbaijan, Bosnia and Herzegovina, Georgia, the
Kyrgyz Republic, Moldova, Tajikistan, and Turkmenistan. Secondary
coverage is below 80 percent in all countries except Bulgaria, Croatia,
the Czech Republic, Hungary, Poland, and Slovenia. Despite large
increases in higher education coverage in all transition countries
except Turkmenistan and Uzbekistan, coverage remains low, particu-
larly in the poorest transition countries (which also have the youngest
populations).
If enrollment converges to full coverage in primary and secondary
education by 2025 and to the current OECD mean for higher educa-
tion (55 percent),8 the picture changes (figure O.13). So, although
school-age cohorts in most transition countries are shrinking,
improving coverage will lead to very fast growth in secondary and
higher education enrollments in the countries with young popula-
tions, as well as in Bosnia and Herzegovina, Montenegro, Serbia, and
(for higher education) FYR Macedonia. Georgia and Lithuania are
projected to have modest growth in secondary enrollments. All other
countries are expected to have shrinking enrollments, even in higher
education, where shrinking cohorts probably will more than offset
improved coverage.
One implication of these changes is the need to increase the capac-
ity of education programs—especially the capacity of infrastructure
and staff—to respond to the sizable changes in enrollments over the
next two decades. For most countries, this means progressively shed-
ding teachers and consolidating school infrastructure, but for others,
it means being flexible: expanding and contracting programs to
respond to oscillations in enrollments at particular levels.
A second implication is the need to reform education finance and
management to provide the means and the incentives to carry out
changes in education staffing and infrastructure. The continuing use
of input-based financing formulas for primary and secondary educa-
tion is the main reason that the contraction of school-age cohorts has
chaw_001-044_ch00.qxd 5/30/07 5:05 PM Page 36
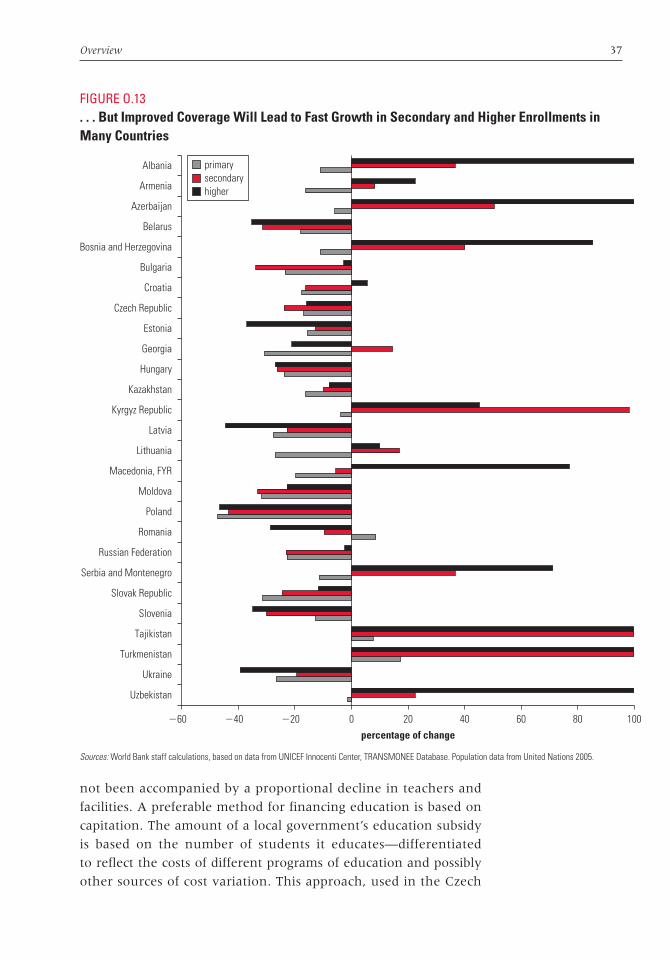
Overview 37
not been accompanied by a proportional decline in teachers and
facilities. A preferable method for financing education is based on
capitation. The amount of a local government’s education subsidy
is based on the number of students it educates—differentiated
to reflect the costs of different programs of education and possibly
other sources of cost variation. This approach, used in the Czech
FIGURE O.13. . . But Improved Coverage Will Lead to Fast Growth in Secondary and Higher Enrollments inMany Countries
Sources: World Bank staff calculations, based on data from UNICEF Innocenti Center, TRANSMONEE Database. Population data from United Nations 2005.
Albania
Azerbaijan
Kyrgyz Republic
Tajikistan
Turkmenistan
Uzbekistan
Armenia
Bosnia and Herzegovina
Croatia
Czech Republic
Hungary
Kazakhstan
Macedonia, FYR
Moldova
Poland
Romania
Serbia and Montenegro
Slovak Republic
Slovenia
Belarus
Bulgaria
Estonia
Georgia
Latvia
Lithuania
Russian Federation
Ukraine
primarysecondaryhigher
80 100604020�20 0�40�60
percentage of change
chaw_001-044_ch00.qxd 5/30/07 5:05 PM Page 37
38 From Red to Gray
Republic and Lithuania, is preferable for two reasons. First, the basis
of financing—enrolled students—is much closer to the educational
objective than are school inputs such as numbers of classrooms and
teachers. Second, there is an incentive for providers to rearrange
inputs to provide education more efficiently.
The third implication of the enrollment projections (and the analy-
sis of enrollment constraints over the past 15 years) is that effective
strategies to achieve full coverage of primary and secondary educa-
tion will need to address the constraints that are responsible for
incomplete enrollment coverage. Improved quality and relevance of
education programs should help inspire higher attendance. However,
raising enrollment rates among the groups at greatest risk is likely to
require additional efforts—including both targeted initiatives, such as
counseling and tutoring for students with learning difficulties, and
economic initiatives, such as subsidies aimed at poor students to
defray the cost of transportation, textbooks, and supplies.
As discussed earlier, a key to addressing the possible growth con-
straints caused by aging is higher productivity. Human capital growth
and technology change are the main sources of higher productivity,
and education—broadly construed to include vocational training and
lifelong learning—is key to both. A lesson is that educational attain-
ment must increase to the levels of the high-performing countries
and that education must be matched to skill needs in the labor mar-
ket. This message is particularly relevant for the transition countries
for two reasons. First, the transition led to a serious disconnect
between the skills provided by education systems and the skills
needed by the market economy. Second, education systems have
only begun to respond to the new skill needs.
For education content and structure, the challenge is more com-
plex. Results of the Programme for International Student Assessment
(PISA) test—which assesses mastery of such higher-order skills as
synthesizing knowledge across disciplinary boundaries, integrating
uncertainty into analysis, and monitoring one’s own learning
progress—suggest that the transition countries generally perform
poorly compared with OECD countries. Because these skills are pre-
cisely the ones needed for most of the fastest-growing jobs in the
global economy, the PISA results indicate how well education systems
are doing in teaching skills that are relevant in the global economy.
These findings from the PISA assessment show that Eastern European
and former Soviet countries have a long way to go before they teach
the skills most needed for improved economic performance.
Raising learning achievement (as measured by the PISA approach)
to the average in the OECD countries would require a deliberate and
chaw_001-044_ch00.qxd 5/30/07 5:05 PM Page 38

Overview 39
sustained effort. Matching the performance of the high-growth Asian
countries would require a far greater effort. Moreover, these findings
relate to the performance of students at the compulsory education
level, where the transition countries have essentially the same cover-
age as the OECD countries. The needs for secondary and higher edu-
cation are likely to be even greater, because coverage is much lower
than in the OECD countries and because quality and relevance are
likely to be lower as well.
Lifelong learning is almost nonexistent in the region, despite the
considerable progress in market reforms. In principle, enterprise pri-
vatization and other economic liberalization policies strengthen the
incentives for employers to provide training for their employees,
whereas productivity-related earnings dispersions strengthen
incentives for individuals to seek training. However, legal proscrip-
tions and onerous certification requirements—as well as the absence
of positive inducements such as tax benefits for employer-provided
training—inhibit the development of lifelong learning programs by
private providers. EU member states and other OECD countries have
developed more effective strategies for encouraging lifelong learning,
and these need to be carefully considered by the region’s countries.
Completing and Building on the Transitions: The Different Paths Ahead
The aging countries of Eastern Europe and the former Soviet Union
have very different needs for reform on the issues described in this
report—labor and capital markets, health and education, and pen-
sions. These differences are partly a function of their particular aging
profile and their economic transition, and they very much depend
on the reform paths and timing that they choose in the decades
ahead. In all the countries, however, the primary message of this
report holds: the reforms they need to undertake are reasonably well
understood (although less for long-term care and social pensions).
The challenge is to be proactive in undertaking the particular
reforms that are essential for meeting the shocks caused by aging
populations.
Across the region, the urgency and degree of reforms needed
broadly correspond to the country groups outlined in figure O.1. The
young, late reformers of Central Asia have the easiest paths in dealing
with aging: although they will need to face adjustments in education
and, to some extent, in pensions because of population aging, their
large pool of young residents will ease the pressure. Their major task
chaw_001-044_ch00.qxd 5/30/07 5:05 PM Page 39
40 From Red to Gray
is to complete the economic transition and further develop their
institutions. (Their case is not discussed in detail here.) The aging,
early reformers of the European Union and Albania and Croatia will,
for many of the issues, find that their reforms and better-developed
institutional capacity will help them deal proactively with the pres-
sures of aging populations. But much will still depend on whether
they have the political will to undertake difficult reforms in pensions
and long-term care. The greatest test is for the aging, late reformers of
the former Soviet Union and the western Balkans. They face the twin
problems of significantly aging populations and relatively underde-
veloped institutions, with action needed on both.
The reform agenda to deal with aging necessarily covers a number
of sectors of the economy. The report puts forward policy priorities for
financial markets, labor markets, education, pensions, and health.
However, while sector-specific reforms are needed to address the
challenges posed by demography, their effects will cut across sectors
because of the strong links between these aging-related challenges.
The reinforcing nature of the needed reforms in different sectors—
and their country-specific variations—can be illustrated by looking at
how the region will address one of the key challenges of population
aging—addressing the decreasing working-age population. If this
challenge is not handled effectively, economic growth will be con-
strained, and adequate resources will not be available to finance pen-
sions, health, and education systems.
Countries that are projected to experience declines in the working-
age population can compensate for this situation by implementing
reforms that support two crucial objectives—increasing the quantity
of labor supply and enhancing productivity. Although these are the
universal objectives, the specific formula will differ for the aging,
early reformers and aging, late reformers. And in some areas, such as
health, reforms could improve both labor supply and productivity.
Increasing the Quantity of Labor Supply
Increasing the quantity of labor supply in the context of shrinking
working-age populations will require reforms in pension parameters,
labor regulations, health and disability, and possibly migration:
• Increasing the retirement age. The aging, early reformers of Cen-
tral Europe, with the notable exception of Slovenia, have mostly
increased their retirement ages to close to OECD levels (above
60 years, at least for men). However, there is clear scope for
increasing the retirement ages of women, which would give them
more of an incentive to participate in the market. The aging, late
chaw_001-044_ch00.qxd 5/30/07 5:05 PM Page 40
Overview 41
reformers, most notably Belarus, Russia, and Ukraine, have more
room to increase their retirement ages.
• Improving the ability to do more flexible, part-time work.The aging, early reformers have generally reduced restrictions on
temporary employment. But there are exceptions, such as Croatia,
Latvia, and Romania. Restrictions on flexible work arrangements
do not allow easy participation in formal sector activity (World
Bank 2005a). This particularly affects workers who are interested
in participating in the labor force on a flexible basis—most notably,
older workers as well as groups such as youth and women. Among
the aging, late reformers, there is also wide variation, with Russia
and Serbia having more liberal temporary employment policies
and Azerbaijan, Bosnia and Herzegovina, and Ukraine having
more restrictive policies.
• Improving the health status of older workers. In the aging,
early reformers, improving (albeit expensive) health care and
improving lifestyles have meant that today’s younger people are
likely to suffer fewer health issues as they age. In the aging, late
reformers of the former Soviet Union, however, the high mortality
and morbidity among young adults means that the relatively
healthier surviving cohorts who will constitute the large majority
of the elderly in 2025 will be more vulnerable to illnesses in old
age. For these countries, improving health outcomes and the per-
formance of the health system will increase labor supply as well as
the productivity of workers.
• Attracting workers from other countries. Attracting immi-
grants to fill the jobs needed for growth as the country’s labor force
shifts is a deeply political issue (World Bank 2006). For the aging,
early reformers, legal immigration is going to be difficult, partly
because their neighboring countries in Southeastern Europe and
the Commonwealth of Independent States are also aging—and
partly because, at least in the next few years, they will lose
migrants to the older EU states. But for the aging, late reformers, if
economic growth accelerates and political barriers to immigration
decrease, managed immigration is possible from the younger coun-
tries of Central Asia.
Increasing Productivity
Increasing productivity to compensate for shrinking working-age
populations will require reforms in health and disability (already
chaw_001-044_ch00.qxd 5/30/07 5:05 PM Page 41

42 From Red to Gray
discussed), and education and lifelong learning, as well as continued
progress on the economic restructuring agenda:
• Investing in education and lifelong learning. The ability to
learn and retrain in new skills as the economy evolves is likely to
become more important as the world becomes more economically
complex and dynamic in the decades ahead. High-quality basic
education is the foundation for workers to build this new learn-
ing. Here countries across the region have a challenge—education
quality is not high. As measured by the OECD’s PISA assess-
ment, only some of the aging, early reformers—the Czech Republic,
Hungary, Latvia, and the Slovak Republic—have somewhat decent
rankings, whereas the aging, late reformers (Russia and Serbia have
participated) do less well. And lifelong learning is almost nonexist-
ent, despite considerable progress in market reforms. In principle,
enterprise privatization and other economic liberalization policies
strengthen the incentives for employers to train their employees,
while growing productivity-related earnings dispersions strengthen
the incentive for individuals to seek training. But legal proscrip-
tions and onerous certification requirements, as well as the absence
of positive inducements such as tax benefits for employer-provided
training, inhibit the development of lifelong learning programs by
private providers.
• Completing the restructuring agenda. Here, too, actions will
be needed across different spheres, and the degree of economic
reforms captured in the country typology plays a strong role. Aging,
early reformers such as Estonia, Hungary, Poland, and the Slovak
Republic, which have taken measures in enterprise restructuring,
will find it easier to move to “strategic restructuring” of their firms
and to foster innovation, helped by trade integration with the
European Union and associated flows of foreign direct invest-
ment and technology. But Romania, where restructuring is less
advanced, will find it more difficult to take full advantage of
trade and capital integration with the European Union. Among the
aging, late reformers, the biggest productivity challenges will be for
Bosnia and Herzegovina, Georgia, Montenegro, and Ukraine,
which will face significant aging but have yet to significantly
restructure their enterprises to provide incentives for productivity-
improving measures.
This consideration of the factors that may compensate for any neg-
ative consequences of a shrinking working-age population highlights
the interlinkages of different aspects of the reform agenda, as well as
chaw_001-044_ch00.qxd 5/30/07 5:05 PM Page 42

Overview 43
how reform priorities differ depending on the country’s current situ-
ation. Again, more details on how policy needs to respond to the
other challenges associated with the third transition are detailed in
subsequent chapters.
* * *
This report is not alarmist about the consequences of aging in
the region, but this absence of alarm is founded on a call for policy
makers to shed their complacency and to act—now. Consider per-
sonal decisions about aging. Each of us knows that old age is likely to
bring feebler bodies, lower incomes, and higher medical costs, but
only some of us take this realization to its natural end—that, to ease
aging’s travails, we need to exercise our bodies and minds, save
for retirement, and insure against catastrophic risk. Those who do
these things have a good chance of enjoying a happy and productive
old age.
The same holds for the region. The future is uncertain, but most of
the policies that need to be put in place today to ensure that the worst
does not happen are certain. All the countries have embarked on a
long and arduous transition. This report urges countries most affected
by aging to set priorities for the most important reforms—and to do so
today.
Notes
1. The early-stage emigration from the Baltic states has been mainly ethnicbased. The large-scale emigration in Southeastern Europe (Albania andBulgaria) was initially ethnic based and later market driven. Turkey hasexperienced a high inflow of Muslim migrants and market-driven tem-porary immigration from Bulgaria, Romania, and Ukraine, as well as areturn of earlier migrants from Western Europe.
2. The experience of Japan, the United States, and the countries ofWestern Europe also suggests that, though aging will indeed affectaggregate savings and the age-specific propensity to save, its effect onthe demand for and supply of financial investment instruments is notlikely to be significant. Other processes—business cycles, regulatorychanges, trade imbalances—appear to dominate aging in their influenceon the aggregate and class-specific demand for assets.
3. PROST (the Pension Reform Options Simulation Toolkit) is a WorldBank–produced pension model in use in more than 80 client countries.
4. This finding does not suggest, however, that all the policy changes under-taken are positive.
5. There is always a gap between population and pension system depend-ency rates, because the working-age population is calculated as the
chaw_001-044_ch00.qxd 5/30/07 5:05 PM Page 43
44 From Red to Gray
population from age 15 to age 64. Typically, in high-income OECD coun-tries, 15 year olds are neither working nor contributing to the pensionsystem. The pension system dependency rates rise even more because ofthe lower labor force participation of women, even in prime workingages, in some countries. These women, who did not participate in theworkforce, will nevertheless be eligible to collect widows’ pensions whenthey become widows, hence raising the number of beneficiaries in thebeneficiary age group relative to the number of contributors in the con-tributor age group.
6. The PROST sample is not a fair sample of the Eastern European andformer Soviet countries region in that it consists largely of countriesthat the World Bank engages in pension dialogue with and that havealready undertaken reforms. The results are also not comparable orreadily adaptable from one country to another because the initial con-ditions differ—but the macroeconomic growth assumed in each casealso differs, because it is appropriate to each country.
7. Castles (2000) reports that OECD population and expenditure data for1965 to 1995 rarely demonstrate any statistically significant relationshipbetween aging and aggregate health care expenditure. On the basis of hisanalysis of this OECD datafile, Castles concludes that there is an almostcomplete lack of correspondence between cross-national variance inpopulation aging and levels of and changes in health care costs.
8. In the few countries where gross enrollment ratios in higher educationare already at or above the OECD mean, we assume a continuation ofcurrent gross enrollment ratios.
chaw_001-044_ch00.qxd 5/30/07 5:05 PM Page 44
45
Introduction
Most of the countries in Eastern Europe and the former Soviet Union
have populations that are aging rapidly. By 2025, the median age
will be more than 10 years greater than it is now in about half of
the countries in the region. In 18 of the 28 countries in the region, the
population will actually shrink by 2025. The most striking case is the
Russian Federation, where the population—which fell from 149 mil-
lion in 1990 to 143 million in 2005—is projected to fall to 111 million
by 2050. The number of elderly is already high in many countries and
will continue to rise during the next two decades. For example, in
Poland, the proportion of the population 65 years and older is pro-
jected to increase from 13 percent in 2005 to 21 percent in 2025, and
in Slovenia the increase is from 16 percent to 24 percent during this
same period.
This aging trend is the consequence of demographic transition, which
is when populations progress from premodern regimes, where both
mortality and fertility are high, to postmodern regimes, where
both mortality and fertility are low. The cause of the transition lies in
the control of epidemics and contagious diseases, which eventually
contribute to lower mortality, and in the processes of modernization,
The Demographic Transitionin Eastern Europe and the
Former Soviet Union
CHAPTER 1
chaw_045-072_ch01.qxd 5/23/07 7:41 PM Page 45
46 From Red to Gray
which leads to lower levels of fertility. The timing of the demographic
transition has varied in different regions of the world, but there is a
global trend toward higher life expectancy, lower fertility, and the
resulting aging of population distributions. As is the case for industrial
countries, most countries in Eastern Europe and the former Soviet
Union have either completed their demographic transition or are on
the path to completion.1 In fact, the most rapid aging during the next
two decades worldwide will be in Eastern Europe and the former
Soviet Union because of unprecedented declines in fertility and the
increasing life expectancies of the past decades.
This chapter presents an analysis of the dynamics of demographic
transition in the countries of Eastern Europe and the former Soviet
Union. The next section presents highlights of the global demographic
transition and provides a broad context for understanding the popula-
tion dynamics in the region’s countries. Those dynamics are examined
in the following section, which reviews the fertility, mortality, and
population changes in the region from 1950 to 2000. Then, popula-
tion projections to 2025 are presented for countries in Eastern Europe
and the former Soviet Union, and further declines in fertility and mor-
tality that are projected to occur during the upcoming two decades are
documented. Although aging is the dominant demographic pattern, it
does not characterize all the region’s countries. Some countries, in
fact, have young population profiles and will remain young through
the next two decades. The implications of aging for dependency rates
are considered next. A classification of the region’s countries is then
presented according to those different demographic profiles. Finally,
conclusions are drawn.
The Global Demographic Transition
The population of the world grew from 2.5 billion people in 1950 to
about 6.0 billion in 2000. According to the United Nation’s World
Population Prospects: The 2004 Revision (United Nations 2005), it is
expected to reach about 9 billion by 2050. Despite this huge increase,
the world has seen an unprecedented decline in population growth
rates. In the mid-1960s, the annual global population growth rate
was slightly higher than 2 percent. By the mid-1990s, that rate had
dropped to about 1.5 percent, with further declines expected to con-
tinue beyond 2050. The falling population growth rates have led to
rapid declines in the number of people added to total world popula-
tion after the peak from 1985 to 1990, when 80 million people were
added to the world’s population.
chaw_045-072_ch01.qxd 5/23/07 7:41 PM Page 46

The Demographic Transition in Eastern Europe and the Former Soviet Union 47
The main reason for the large decline in global population growth
rates after the mid-1960s has been the unprecedented drop in the
global total fertility rate (TFR). (Key demographic definitions are pre-
sented in box 1.1.) In the past 50 years, the world’s TFR has halved,
from around 5.0 children per woman to 2.7 children, and it is
BOX 1.1
Key Definitions in Demography
Life expectancy at birth: The average number of years that a newborn is expected to live if
mortality conditions at various ages at the time of birth persist throughout the individual’s life.
Total fertility rate (TFR): The average number of children a woman would bear if she survived to
the end of her reproductive life span and experienced in each year the age-specific fertility rates of
the given period. The TFR is obtained by adding the age-specific fertility rates from 15 to 49 years.
Net reproduction rate (NRR): The average number of daughters per woman that are expected
to survive to have children themselves. The NRR is a good measure of the rate of population
growth because it measures the size of the next generation relative to the size of the current one.
An NRR greater (or less) than 1.0 means that the next generation will be larger (or smaller) relative
to the current one.
Replacement fertility: The level of fertility at which the population is just replacing itself. At this
level of fertility (TFR = 2.1) and prevailing mortality rates, the rate of population growth is 0 and
NRR equals 1.0.
Population growth rate: The average exponential rate of growth of the population over a given
period. It is the balance between (a) births and (b) deaths and migration.
Population momentum: A phenomenon whereby a population continues to grow even after its
fertility has fallen because the number of children born is determined by both the fertility rate and
the number of women in their reproductive ages. A new phenomenon is that of negative popu-
lation momentum in which population size continues to decrease because previous and future
low levels of fertility produce successively smaller cohorts of women.
Child dependency rate: The number of people 0 to 14 years per 100 people 15 to 64 years.
Elderly dependency rate: The number of people 65 years and older per 100 people 15 to
64 years. The elderly dependency rate is also called the old-age dependency rate.
Total dependency rate: The number of people younger than 15 plus people 65 or older per
100 people 15 to 64 years.
Population aging: The process by which the balance of a country’s population shifts such that
the proportion of the population that is elderly constitutes a growing proportion when compared
with younger ages.
chaw_045-072_ch01.qxd 5/23/07 7:41 PM Page 47

48 From Red to Gray
FIGURE 1.1Global Total Fertility Rates, 1950–2050
Source: United Nations 2005.
0
1
2
3
4
5
6
1950
–55
1970
–75
2010
–15
1960
–65
1955
–60
1990
–95
2040
–45
1980
–1985
2015
–20
2030
–35
1995
–2000
1985
–90
1975
–80
2035
–40
1965
–70
2005
–10
2000
–05
2045
–50
2020
–25
2025
–30
perc
ent
years
expected to drop to 2.1 during the next 50 years (figure 1.1). All
regions of the world have experienced declines in fertility rates, which
have fallen in the developing countries from about 7.0 children per
woman in the early 1950s to about 5.5 children in 2000 and in the
industrial countries from about 3.5 children per woman to below
replacement levels by the early 1980s.2 At the same time, global life
expectancy rose by close to 20 years between 1950–55 and 2000–05.
It is expected to continue increasing through 2050, when it is pro-
jected to reach 75 years (figure 1.2).
Because of those major changes in fertility, together with signifi-
cant improvements in longevity, the world population structure has
shifted from one dominated by young people to one increasingly
dominated by older people. The proportion of the global population
less than 15 years of age declined from 34 percent in 1950 to almost
30 percent in 2000, and it is expected to drop to about 20 percent in
2050. The proportion of people age 65 and older grew from 5.2 per-
cent in 1950 to about 7 percent in 2000, and it is expected to increase
to about 16 percent by 2050. Globally, the number of people 60 years
and older is expected to increase to nearly 2 billion people by 2050,
compared with less than 400 million in 1975.
Those demographic trends—and the resulting pace of aging—are
expected to vary significantly across countries and regions. The most
dramatic aging has already occurred—and will continue to occur—in
chaw_045-072_ch01.qxd 5/23/07 7:41 PM Page 48
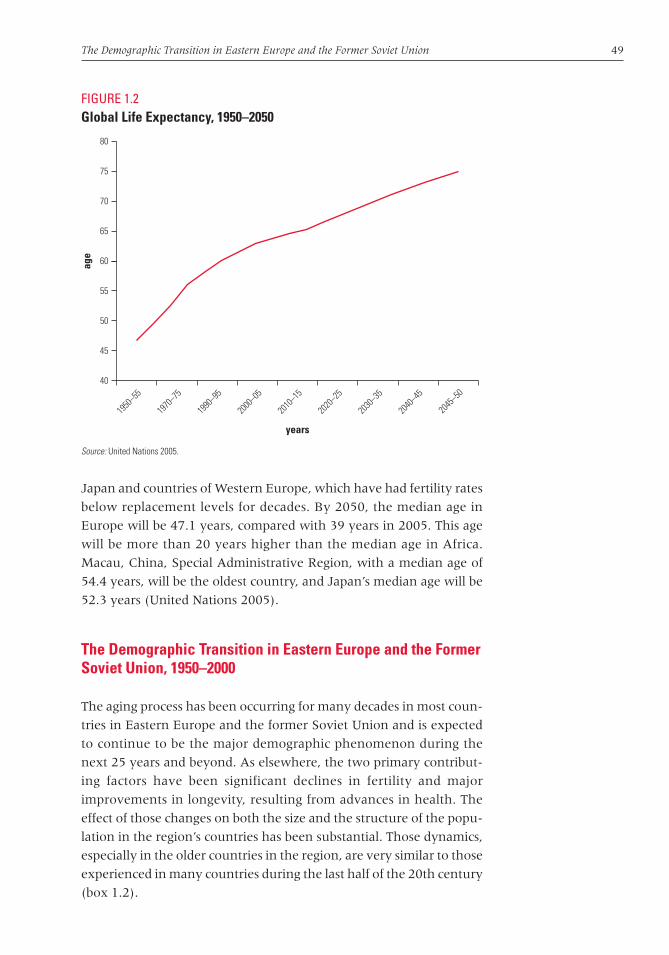
The Demographic Transition in Eastern Europe and the Former Soviet Union 49
FIGURE 1.2Global Life Expectancy, 1950–2050
Source: United Nations 2005.
40
45
50
55
60
65
70
75
80
1950
–55
1970
–75
1990
–95
2000
–05
2010
–15
2020
–25
2030
–35
2040
–45
2045
–50
years
age
Japan and countries of Western Europe, which have had fertility rates
below replacement levels for decades. By 2050, the median age in
Europe will be 47.1 years, compared with 39 years in 2005. This age
will be more than 20 years higher than the median age in Africa.
Macau, China, Special Administrative Region, with a median age of
54.4 years, will be the oldest country, and Japan’s median age will be
52.3 years (United Nations 2005).
The Demographic Transition in Eastern Europe and the FormerSoviet Union, 1950–2000
The aging process has been occurring for many decades in most coun-
tries in Eastern Europe and the former Soviet Union and is expected
to continue to be the major demographic phenomenon during the
next 25 years and beyond. As elsewhere, the two primary contribut-
ing factors have been significant declines in fertility and major
improvements in longevity, resulting from advances in health. The
effect of those changes on both the size and the structure of the popu-
lation in the region’s countries has been substantial. Those dynamics,
especially in the older countries in the region, are very similar to those
experienced in many countries during the last half of the 20th century
(box 1.2).
chaw_045-072_ch01.qxd 5/23/07 7:41 PM Page 49
50 From Red to Gray
Declining Fertility
Fertility throughout the region declined through the last half of the
20th century, even though there were wide variations across coun-
tries (figure 1.3). The declines have tended to be particularly large in
countries that had high fertility rates (for example, more than 3.0
children per woman) in 1950. For instance, Turkey saw its TFR fall
from almost 7.0 children per woman in 1950–55 to 2.6. This rate of
BOX 1.2
Fertility Declines and Improvement in Longevity in Selected Countries,
1950–2000
All regions of the world had declining fertility between 1950 and 2000, although in some
regions—most notably Africa—the declines were modest. Overall, Europe had achieved below
replacement levels of fertility by 2000, whereas Asia, Latin America, and Oceania are moving
toward lower levels of fertility. All countries in the Group of Seven (G7) saw very rapid fertility de-
clines from the 1950s to reach below replacement levels of fertility (that is, 2.1 children per
woman) by the mid-1970s. All countries in the G7 have had below-replacement levels of fertility
for the past 20 years or so (though some data for the United States show a level of fertility that
is above replacement level). Declining fertility is not just present in industrial countries. China
saw fertility drop from more than 6.0 children per woman between 1950 and 1955 to below
replacement levels by 1995. In the Islamic Republic of Iran, fertility also declined rapidly in the
last half of the 20th century, from about 7.0 to 2.5 children per woman. In comparison, Iraq and
Pakistan only saw modest declines, and Afghanistan experienced a slight increase in fertility.
The experience of longevity improvements in the more industrial countries of Eastern Europe
and the former Soviet Union is very similar to that of most industrial countries. Between 1950 and
2000, Canada, France, Germany, Ireland, Italy, the United Kingdom, and the United States added
an average of 8 years for men and 9 years for women. The exception is Japan, which added about
15 years for men and 18 years for women. The trend in life expectancy in Kazakhstan, the Kyrgyz
Republic, Tajikistan, Turkmenistan, and Uzbekistan has been very similar to that of other countries
in Asia that also started with relatively low life expectancy. For example, China added almost
three decades to the longevity of men and women between 1950 and 2000, and India and Iran
also saw major improvements during that period.
Because of those significant changes in fertility and mortality, the experiences of Japan and
Italy—probably the oldest countries in the world—are actually not too different from what is pro-
jected for the oldest countries in Eastern Europe and the former Soviet Union, such as Bulgaria,
Croatia, and Hungary. But for most countries in the region, the aging experience is more similar
to what is projected for Ireland and the United Kingdom. By 2025, 14 countries in Eastern
Europe and the former Soviet Union are projected to have median ages of between 40 and
45 years, which is comparable to what is projected for Ireland and the United Kingdom (42 years).
chaw_045-072_ch01.qxd 5/23/07 7:41 PM Page 50
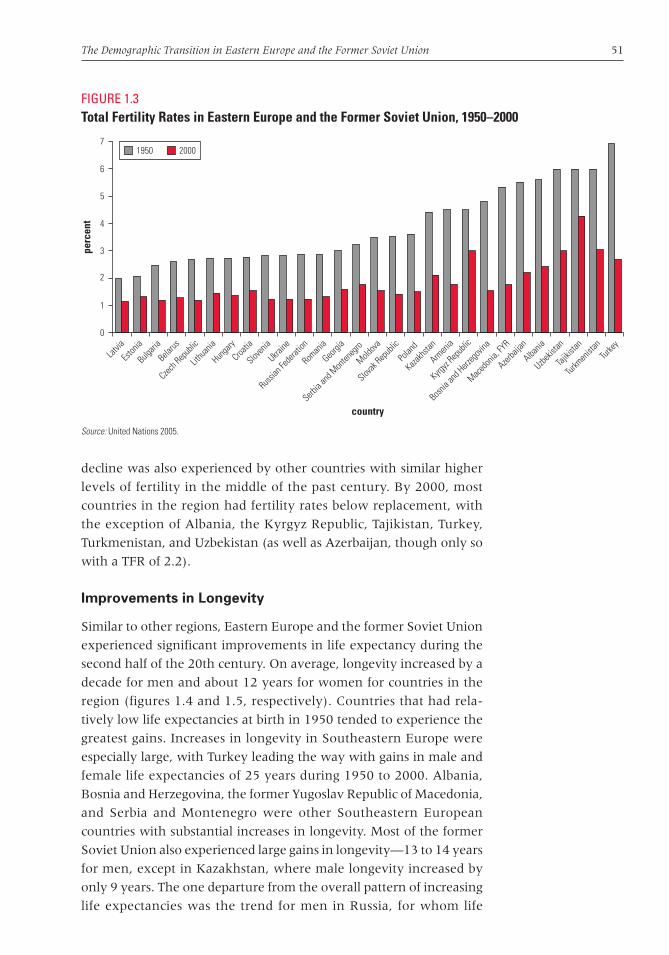
The Demographic Transition in Eastern Europe and the Former Soviet Union 51
decline was also experienced by other countries with similar higher
levels of fertility in the middle of the past century. By 2000, most
countries in the region had fertility rates below replacement, with
the exception of Albania, the Kyrgyz Republic, Tajikistan, Turkey,
Turkmenistan, and Uzbekistan (as well as Azerbaijan, though only so
with a TFR of 2.2).
Improvements in Longevity
Similar to other regions, Eastern Europe and the former Soviet Union
experienced significant improvements in life expectancy during the
second half of the 20th century. On average, longevity increased by a
decade for men and about 12 years for women for countries in the
region (figures 1.4 and 1.5, respectively). Countries that had rela-
tively low life expectancies at birth in 1950 tended to experience the
greatest gains. Increases in longevity in Southeastern Europe were
especially large, with Turkey leading the way with gains in male and
female life expectancies of 25 years during 1950 to 2000. Albania,
Bosnia and Herzegovina, the former Yugoslav Republic of Macedonia,
and Serbia and Montenegro were other Southeastern European
countries with substantial increases in longevity. Most of the former
Soviet Union also experienced large gains in longevity—13 to 14 years
for men, except in Kazakhstan, where male longevity increased by
only 9 years. The one departure from the overall pattern of increasing
life expectancies was the trend for men in Russia, for whom life
FIGURE 1.3Total Fertility Rates in Eastern Europe and the Former Soviet Union, 1950–2000
Source: United Nations 2005.
0
1
2
3
4
5
6
7
Latvia
Eston
ia
Bulgari
a
Belarus
Czech R
epub
lic
Lithu
ania
Hunga
ry
Croatia
Sloven
ia
Ukraine
Russian
Fede
ration
Roman
ia
Georgi
a
Serbia
and M
onten
egro
Moldova
Slovak
Repub
lic
Polan
d
Kazakhs
tan
Bosnia
and H
erzeg
ovina
Kyrgyz
Repub
lic
Armen
ia
Macedo
nia, FY
R
Azerba
ijan
Albania
Uzbekis
tan
Tajikis
tan
Turkm
enist
anTur
key
perc
ent
country
1950 2000
chaw_045-072_ch01.qxd 5/23/07 7:41 PM Page 51
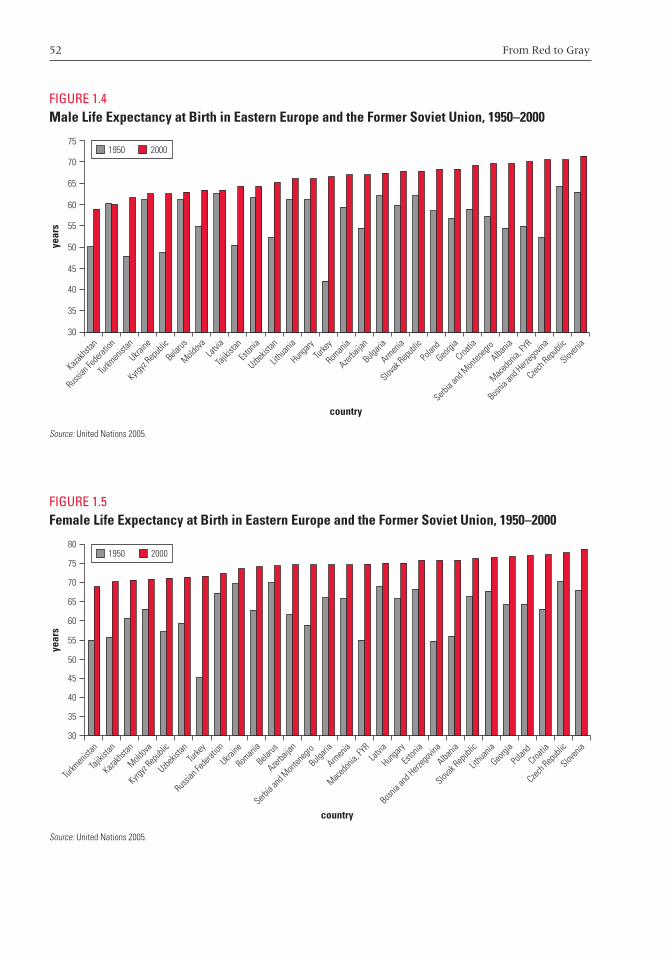
52 From Red to Gray
FIGURE 1.5Female Life Expectancy at Birth in Eastern Europe and the Former Soviet Union, 1950–2000
Source: United Nations 2005.
30
35
40
45
50
55
60
65
70
75
80
Belarus
Serbia
and M
onten
egro
Bulgari
a
Armen
ia
Macedo
nia, FY
RLat
via
Hunga
ry
Eston
ia
Bosnia
and H
erzeg
ovina
Albania
Slovak
Repub
lic
Lithu
ania
Georgi
a
Polan
dCroa
tia
Czech R
epub
lic
Sloven
ia
Azerba
ijan
year
s
country
1950 2000
Turkm
enist
an
Tajikis
tan
Kazakhs
tan
Moldova
Kyrgyz
Repub
lic
Uzbekis
tanTur
key
Russian
Fede
ration
Ukraine
Roman
ia
FIGURE 1.4Male Life Expectancy at Birth in Eastern Europe and the Former Soviet Union, 1950–2000
Source: United Nations 2005.
30
35
40
45
50
55
60
65
70
75
Kyrgyz
Repub
licLat
via
Ukraine
Tajikis
tan
Eston
ia
Uzbekis
tan
Lithu
ania
Hunga
ryTur
key
Roman
ia
Azerba
ijan
Bulgari
a
Armen
ia
Slovak
Repub
lic
Polan
dGeo
rgia
Croatia
Serbia
and M
onten
egro
Albania
Macedo
nia, FY
R
Bosnia
and H
erzeg
ovina
Czech R
epub
lic
Sloven
ia
Moldova
Belarus
Kazakhs
tan
Turkm
enist
an
Russian
Fede
ration
year
s
country
1950 2000
chaw_045-072_ch01.qxd 5/23/07 7:41 PM Page 52
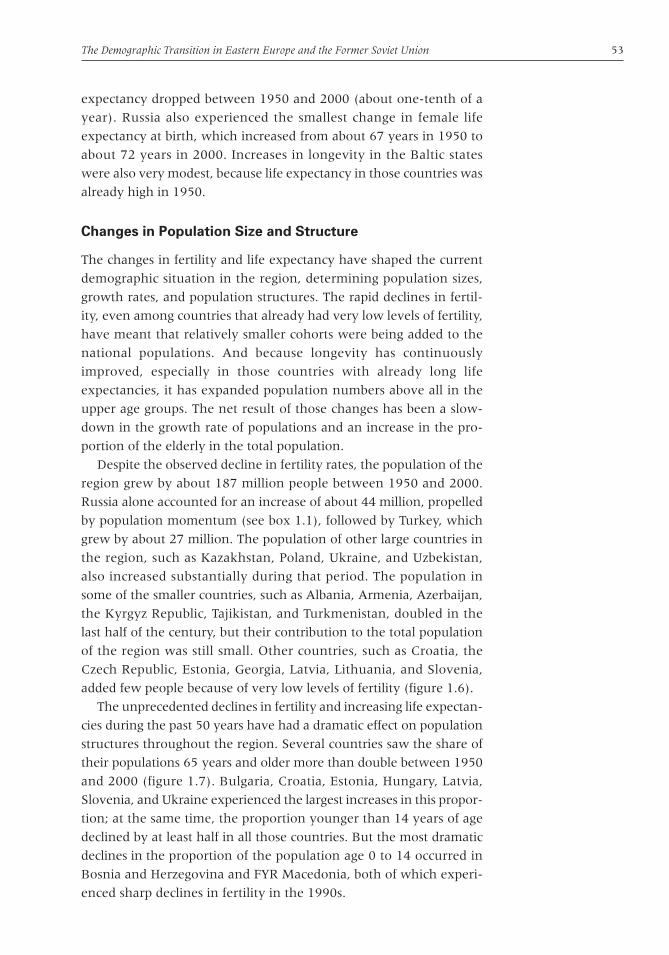
The Demographic Transition in Eastern Europe and the Former Soviet Union 53
expectancy dropped between 1950 and 2000 (about one-tenth of a
year). Russia also experienced the smallest change in female life
expectancy at birth, which increased from about 67 years in 1950 to
about 72 years in 2000. Increases in longevity in the Baltic states
were also very modest, because life expectancy in those countries was
already high in 1950.
Changes in Population Size and Structure
The changes in fertility and life expectancy have shaped the current
demographic situation in the region, determining population sizes,
growth rates, and population structures. The rapid declines in fertil-
ity, even among countries that already had very low levels of fertility,
have meant that relatively smaller cohorts were being added to the
national populations. And because longevity has continuously
improved, especially in those countries with already long life
expectancies, it has expanded population numbers above all in the
upper age groups. The net result of those changes has been a slow-
down in the growth rate of populations and an increase in the pro-
portion of the elderly in the total population.
Despite the observed decline in fertility rates, the population of the
region grew by about 187 million people between 1950 and 2000.
Russia alone accounted for an increase of about 44 million, propelled
by population momentum (see box 1.1), followed by Turkey, which
grew by about 27 million. The population of other large countries in
the region, such as Kazakhstan, Poland, Ukraine, and Uzbekistan,
also increased substantially during that period. The population in
some of the smaller countries, such as Albania, Armenia, Azerbaijan,
the Kyrgyz Republic, Tajikistan, and Turkmenistan, doubled in the
last half of the century, but their contribution to the total population
of the region was still small. Other countries, such as Croatia, the
Czech Republic, Estonia, Georgia, Latvia, Lithuania, and Slovenia,
added few people because of very low levels of fertility (figure 1.6).
The unprecedented declines in fertility and increasing life expectan-
cies during the past 50 years have had a dramatic effect on population
structures throughout the region. Several countries saw the share of
their populations 65 years and older more than double between 1950
and 2000 (figure 1.7). Bulgaria, Croatia, Estonia, Hungary, Latvia,
Slovenia, and Ukraine experienced the largest increases in this propor-
tion; at the same time, the proportion younger than 14 years of age
declined by at least half in all those countries. But the most dramatic
declines in the proportion of the population age 0 to 14 occurred in
Bosnia and Herzegovina and FYR Macedonia, both of which experi-
enced sharp declines in fertility in the 1990s.
chaw_045-072_ch01.qxd 5/23/07 7:41 PM Page 53
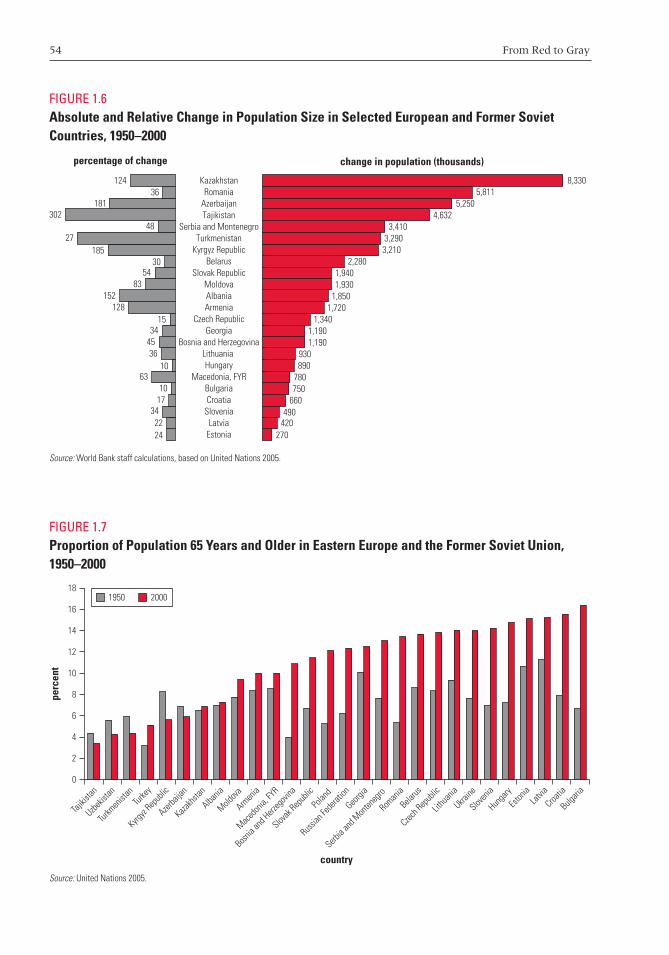
54 From Red to Gray
FIGURE 1.6Absolute and Relative Change in Population Size in Selected European and Former SovietCountries, 1950–2000
Source: World Bank staff calculations, based on United Nations 2005.
24 2234
17 10
6310
364534
15128
15283
54 30
18527
48302
181 36
124 KazakhstanRomania
AzerbaijanTajikistan
Serbia and MontenegroTurkmenistan
Kyrgyz RepublicBelarus
Slovak RepublicMoldovaAlbaniaArmenia
Czech RepublicGeorgia
Bosnia and HerzegovinaLithuania Hungary
Macedonia, FYRBulgariaCroatia
SloveniaLatvia
Estonia
8,3305,811
5,2504,632
3,4103,2903,210
2,2801,9401,930
1,8501,720
1,3401,1901,190
930890
780750
660490
420270
percentage of change change in population (thousands)
FIGURE 1.7Proportion of Population 65 Years and Older in Eastern Europe and the Former Soviet Union,1950–2000
Source: United Nations 2005.
0
2
4
6
8
10
12
14
16
18
Roman
iaLat
via
Croatia
Bulgari
a
Eston
ia
Belarus
Czech R
epub
lic
Ukraine
Russian
Fede
ration
Sloven
ia
Kyrgyz
Repub
lic
Slovak
Repub
lic
Polan
d
Hunga
ry
Macedo
nia, FY
RTur
key
Serbia
and M
onten
egro
Lithu
ania
Bosnia
and H
erzeg
ovina
Albania
Moldova
Armen
ia
Azerba
ijan
Kazakhs
tan
Tajikis
tan
Turkm
enist
an
Uzbekis
tan
Georgi
a
perc
ent
country
1950 2000
chaw_045-072_ch01.qxd 5/23/07 7:41 PM Page 54
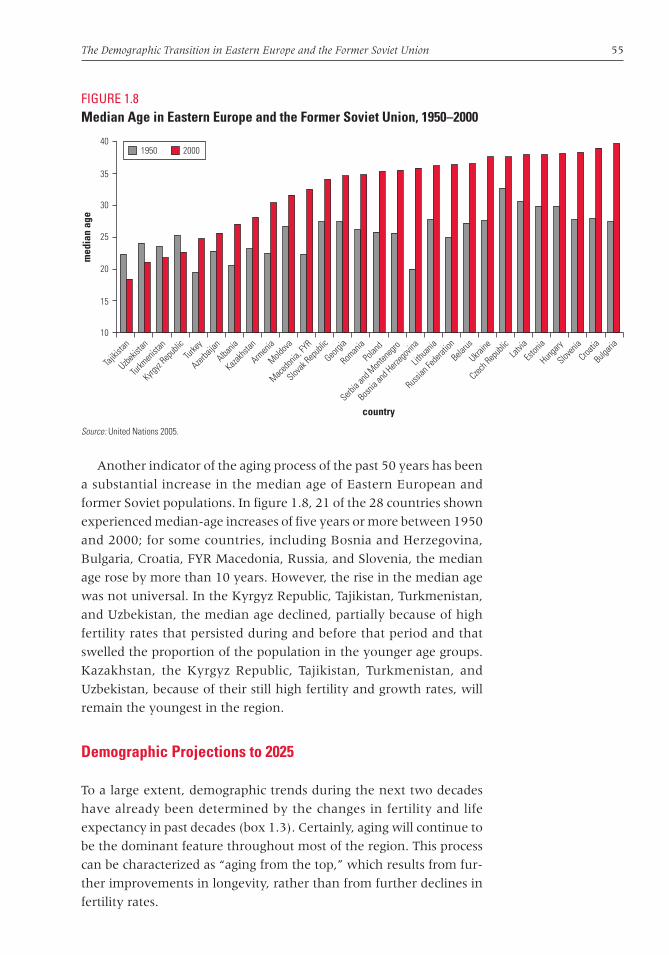
The Demographic Transition in Eastern Europe and the Former Soviet Union 55
Another indicator of the aging process of the past 50 years has been
a substantial increase in the median age of Eastern European and
former Soviet populations. In figure 1.8, 21 of the 28 countries shown
experienced median-age increases of five years or more between 1950
and 2000; for some countries, including Bosnia and Herzegovina,
Bulgaria, Croatia, FYR Macedonia, Russia, and Slovenia, the median
age rose by more than 10 years. However, the rise in the median age
was not universal. In the Kyrgyz Republic, Tajikistan, Turkmenistan,
and Uzbekistan, the median age declined, partially because of high
fertility rates that persisted during and before that period and that
swelled the proportion of the population in the younger age groups.
Kazakhstan, the Kyrgyz Republic, Tajikistan, Turkmenistan, and
Uzbekistan, because of their still high fertility and growth rates, will
remain the youngest in the region.
Demographic Projections to 2025
To a large extent, demographic trends during the next two decades
have already been determined by the changes in fertility and life
expectancy in past decades (box 1.3). Certainly, aging will continue to
be the dominant feature throughout most of the region. This process
can be characterized as “aging from the top,” which results from fur-
ther improvements in longevity, rather than from further declines in
fertility rates.
FIGURE 1.8Median Age in Eastern Europe and the Former Soviet Union, 1950–2000
Source: United Nations 2005.
10
15
20
25
30
35
40
Bosnia
and H
erzeg
ovina
Latvia
Croatia
Bulgari
a
Eston
ia
Russian
Fede
ration
Belarus
Ukraine
Czech R
epub
lic
Roman
ia
Sloven
ia
Kyrgyz
Repub
lic
Slovak
Repub
lic
Polan
d
Hunga
ry
Macedo
nia, FY
RTur
key
Serbia
and M
onten
egro
Lithu
ania
Georgi
a
Albania
Moldova
Armen
ia
Azerba
ijan
Kazakhs
tan
Tajikis
tan
Turkm
enist
an
Uzbekis
tan
med
ian
age
country
1950 2000
chaw_045-072_ch01.qxd 5/23/07 7:41 PM Page 55
56 From Red to Gray
BOX 1.3
Demographic Projections
Population projections used in this study are drawn from the World Population Prospects: The
2004 Revision, which was produced by the Population Division of the United Nations Depart-
ment of Economic and Social Affairs (United Nations 2005). The 2004 revisions were the latest
projections available while this report was being prepared. In March 2007, the United Nations re-
leased an updated 2006 revision. Other agencies that produce long-range population projections
include the World Bank, which produced a set of projections in 1994; the International Institute
for Applied Systems Analysis, which has been producing projections since 1996; and the U.S.
Census Bureau. Many government agencies also produce projections for their own populations.
All widely used population projections rely on the same basic cohort component approach. The
method starts with a population structure and applies fertility and survival rates determined
according to assumptions about future trends in fertility and mortality. Therefore, in this sense,
demographic projections are conditional statements about the future, given a set of assump-
tions about the key population flow variables (fertility, mortality, and, to a lesser extent, migra-
tion). By and large, past projections of world population size have been fairly accurate. At the
global level, projections of world population size made by the United Nations between 1957
and 1998 had an error of less than 3 percent. At the country level, errors have been larger,
especially for periods further into the future. Errors have been relatively greater for less devel-
oped and smaller countries.
Factors that affect the accuracy of projections include an imprecise assessment of the current
population structure, inexact assumptions about trends in fertility and mortality, and unexpected
events that might affect the major demographic flows (for example, epidemics, famines, or
wars). Analysis of past projections shows that there has been a general tendency to overesti-
mate fertility and underestimate mortality improvements (though not for Africa). Migration has
been difficult to project, because it depends on factors that are difficult to foresee.
The projections from the United Nations deal with the uncertainty of population projections by
producing several variants that are based on different scenarios of low, medium, high, or con-
stant fertility. All those variants are based on assumptions of future mortality patterns and in-
ternational migration. The different variants can lead to significant differences in the projected
populations. In the case of Russia, for instance, the medium variant projects a decline in the
population to 111.7 million by 2050, whereas according to the high-fertility scenario, the popu-
lation size could be as large as 134.5 million. The high-fertility variant for Turkey, where the pop-
ulation is expected to continue to grow, projects a population that is almost 19 million larger
than under the medium variant.
chaw_045-072_ch01.qxd 5/23/07 7:41 PM Page 56
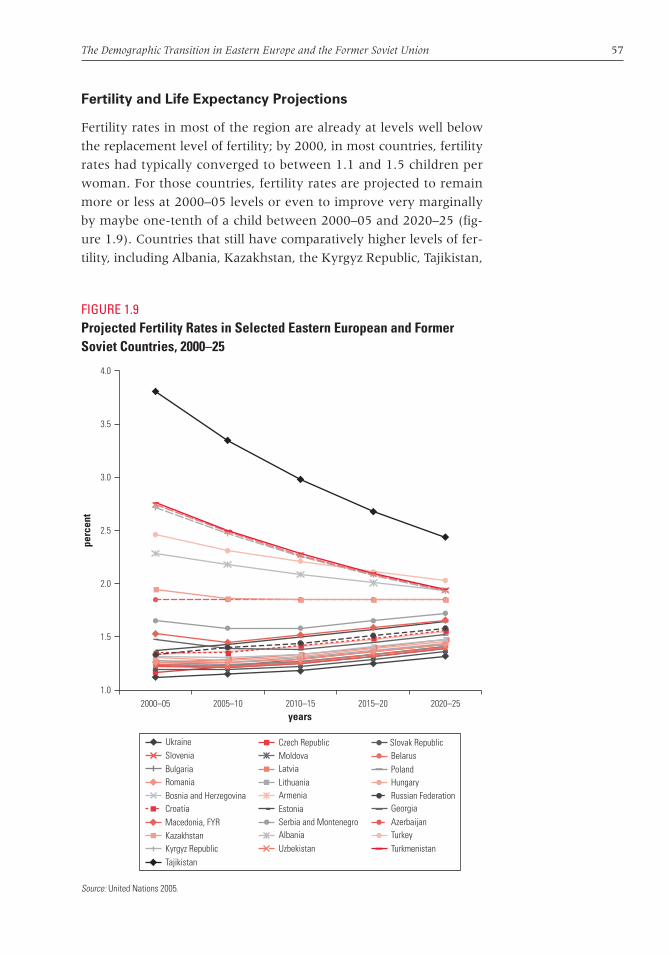
The Demographic Transition in Eastern Europe and the Former Soviet Union 57
Fertility and Life Expectancy Projections
Fertility rates in most of the region are already at levels well below
the replacement level of fertility; by 2000, in most countries, fertility
rates had typically converged to between 1.1 and 1.5 children per
woman. For those countries, fertility rates are projected to remain
more or less at 2000–05 levels or even to improve very marginally
by maybe one-tenth of a child between 2000–05 and 2020–25 (fig-
ure 1.9). Countries that still have comparatively higher levels of fer-
tility, including Albania, Kazakhstan, the Kyrgyz Republic, Tajikistan,
FIGURE 1.9Projected Fertility Rates in Selected Eastern European and FormerSoviet Countries, 2000–25
Source: United Nations 2005.
1.0
1.5
2.5
2.0
3.5
3.0
4.0
2000–05 2005–10 2010–15 2015–20 2020–25
Ukraine Czech Republic Slovak RepublicSlovenia Moldova BelarusBulgaria Latvia PolandRomania Lithuania HungaryBosnia and Herzegovina Armenia Russian FederationCroatia Estonia GeorgiaMacedonia, FYR Serbia and Montenegro AzerbaijanKazakhstan Albania TurkeyKyrgyz Republic Uzbekistan TurkmenistanTajikistan
perc
ent
years
chaw_045-072_ch01.qxd 5/23/07 7:41 PM Page 57

58 From Red to Gray
Turkey, Turkmenistan, and Uzbekistan, are projected to experience
falling fertility rates toward levels that are very similar to those of the
rest of the region and also below replacement. United Nations projec-
tions suggest that by 2025 only Tajikistan will still have fertility rates
that are just marginally above the replacement level.
Further improvements are expected in mortality rates. Gains in
life expectancy will be largest for countries that were at com-
paratively lower levels of longevity in 2000. For example, Estonia,
Kazakhstan, the Kyrgyz Republic, Latvia, Moldova, Tajikistan, Turkey,
Turkmenistan, Ukraine, and Uzbekistan all are projected to gain five
years or more in life expectancy at birth. Improvements in life
expectancy to 2025 are projected to be about 2 to 5 years for men for
most countries in the region, with gains for females projected to be 2
to 3 years for all countries except Russia (figures 1.10 and 1.11).
Projected Population Growth Rates and Sizes
By 2000, 18 of the 28 countries in figure 1.12 already had negative
population growth rates, with most experiencing annual declines
between 0 and �0.5 percent. Between now and 2025, very little
change is projected for countries with negative growth rates, which are
expected to remain negative and decrease only marginally. Armenia,
Georgia, and Kazakhstan are the three countries that currently have
negative growth rates but are projected to see some upward move-
ment in those rates.
Countries that still have positive growth rates are Albania,
Azerbaijan, Bosnia and Herzegovina, Croatia, the Kyrgyz Republic,
FYR Macedonia, Tajikistan, Turkey, Turkmenistan, and Uzbekistan.
Of those countries, Bosnia and Herzegovina, Croatia, and FYR
Macedonia are projected to have negative growth rates from 2015
onward, while six of the other seven will continue to have declining
but positive growth rates to 2025 and beyond. Tajikistan is the only
country in the region that started the period with a positive growth
rate and is projected to have an even higher growth rate in 2025.
Because of these negative growth trends, most countries in the
region will experience shrinking populations in the first quarter of
this century (figure 1.13). In contrast, from 1950 to 2000, all coun-
tries in the region experienced population growth. Despite the large
numbers of shrinking countries, the total population in the region is
projected to decrease by only 1.2 million people between 2000 and
2025. This projection is low because, amid the general trend of declin-
ing populations, some countries will continue to grow. Those coun-
tries include Albania, Azerbaijan, the Kyrgyz Republic, Tajikistan,
Turkey, Turkmenistan, Uzbekistan, and, to a smaller degree, FYR
chaw_045-072_ch01.qxd 5/23/07 7:41 PM Page 58
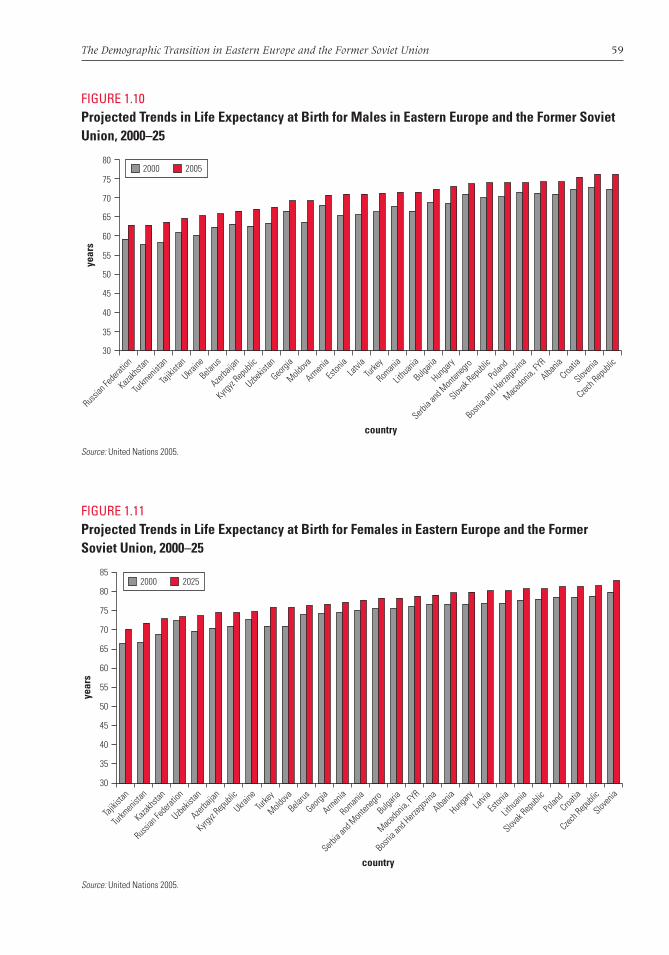
The Demographic Transition in Eastern Europe and the Former Soviet Union 59
FIGURE 1.10Projected Trends in Life Expectancy at Birth for Males in Eastern Europe and the Former SovietUnion, 2000–25
Source: United Nations 2005.
30
35
45
50
40
55
60
65
70
75
80
Bosnia
and H
erzeg
ovina
Latvia
Croatia
Bulgari
a
Eston
ia
Russian
Fede
ration
Belarus
Czech R
epub
lic
Roman
ia
Sloven
ia
Kyrgyz
Repub
lic
Slovak
Repub
lic
Polan
d
Hunga
ry
Macedo
nia, FY
RTur
key
Serbia
and M
onten
egro
Lithu
ania
Georgi
a
Albania
Moldova
Armen
ia
Azerba
ijan
Kazakhs
tan
Tajikis
tan
Turkm
enist
an
Uzbekis
tan
Ukraine
year
s
country
2000 2005
FIGURE 1.11Projected Trends in Life Expectancy at Birth for Females in Eastern Europe and the FormerSoviet Union, 2000–25
Source: United Nations 2005.
30
35
45
50
40
55
60
65
70
75
80
85
Bosnia
and H
erzeg
ovina
Latvia
Croatia
Bulgari
a
Eston
ia
Russian
Fede
ration
Belarus
Czech R
epub
lic
Roman
ia
Sloven
ia
Kyrgyz
Repub
lic
Slovak
Repub
lic
Polan
d
Hunga
ry
Macedo
nia, FY
RTur
key
Serbia
and M
onten
egro
Lithu
ania
Georgi
a
Albania
Moldova
Armen
ia
Azerba
ijan
Kazakhs
tan
Tajikis
tan
Turkm
enist
an
Uzbekis
tan
Ukraine
year
s
country
2000 2025
chaw_045-072_ch01.qxd 5/23/07 7:41 PM Page 59

60 From Red to Gray
Macedonia, all of which are projected to have positive population
growth rates.
For many shrinking countries in the region, the projected changes
in population growth rates and in population sizes are expected to be
relatively modest. There are, however, important exceptions. Some
countries, because of their large initial population and population
structures, which provide sizable momentum, will experience signif-
icant declines (table 1.1). Those countries include, most prominently,
Russia and Ukraine. Bulgaria, Belarus, Poland, and Romania each are
projected to lose more than a million people. The countries that expe-
rience population decline by 2025 will collectively be about 35 million
people smaller than they were in 2000. Among population gainers,
Turkey is projected to see the largest increase (more than 22 million),
FIGURE 1.12Population Growth Rates in Selected Eastern European and FormerSoviet Countries, 2000–25
Source: United Nations 2005.
�1.5
�1.0
�0.5
0
2000–05 2005–10
0.5
1.0
1.5
2.0
2020–25
perc
ent
Uzbekistan Turkmenistan Albania
Macedonia, FYR
Kazakhstan Serbia and MontenegroAzerbaijanSlovak Republic Armenia
Poland
Slovenia Czech Republic Estonia Hungary
MoldovaCroatia Bosnia and Herzegovina Romania Lithuania
Russian FederationLatvia
2010–15years
2015–20
chaw_045-072_ch01.qxd 5/23/07 7:41 PM Page 60
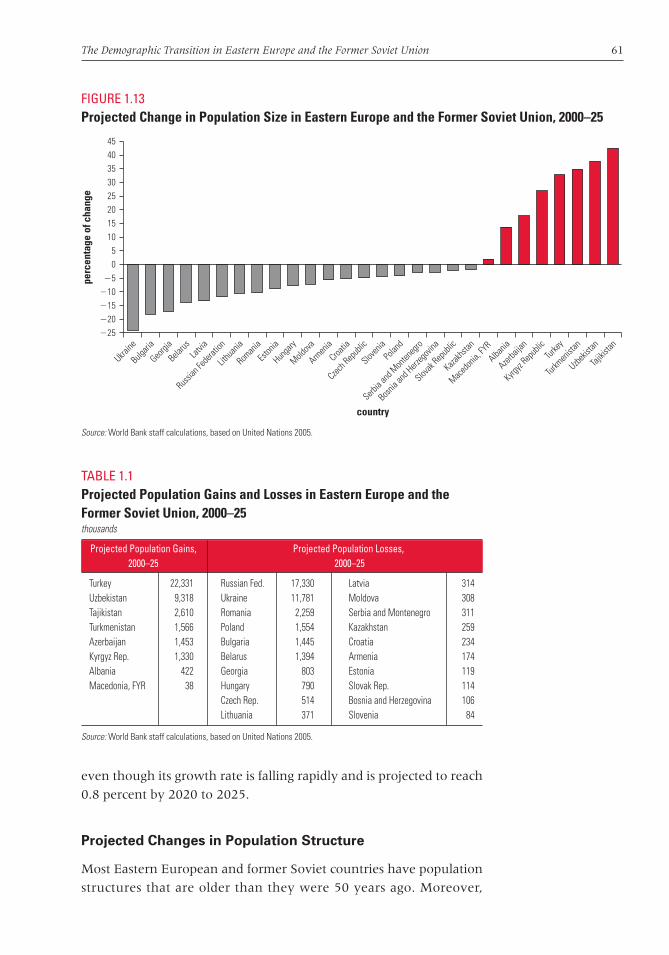
The Demographic Transition in Eastern Europe and the Former Soviet Union 61
even though its growth rate is falling rapidly and is projected to reach
0.8 percent by 2020 to 2025.
Projected Changes in Population Structure
Most Eastern European and former Soviet countries have population
structures that are older than they were 50 years ago. Moreover,
FIGURE 1.13Projected Change in Population Size in Eastern Europe and the Former Soviet Union, 2000–25
Source: World Bank staff calculations, based on United Nations 2005.
Bosnia
and H
erzeg
ovina
Latvia
Croatia
Bulgari
a
Eston
ia
Russian
Fede
ration
Belarus
Czech R
epub
lic
Roman
ia
Sloven
ia
Slovak
Repub
licPo
land
Hunga
ry
Macedo
nia, FY
RTur
key
Serbia
and M
onten
egro
Lithu
ania
Georgi
a
Albania
Moldova
Armen
ia
Azerba
ijan
Kazakhs
tan
Tajikis
tan
Turkm
enist
an
Uzbekis
tan
Ukraine
perc
enta
ge o
f cha
nge
�25�20�15�10�5
05
1015202530354045
Kyrgyz
Repub
lic
country
TABLE 1.1Projected Population Gains and Losses in Eastern Europe and theFormer Soviet Union, 2000–25thousands
Projected Population Gains, Projected Population Losses,2000–25 2000–25
Turkey 22,331 Russian Fed. 17,330 Latvia 314Uzbekistan 9,318 Ukraine 11,781 Moldova 308Tajikistan 2,610 Romania 2,259 Serbia and Montenegro 311Turkmenistan 1,566 Poland 1,554 Kazakhstan 259Azerbaijan 1,453 Bulgaria 1,445 Croatia 234Kyrgyz Rep. 1,330 Belarus 1,394 Armenia 174Albania 422 Georgia 803 Estonia 119Macedonia, FYR 38 Hungary 790 Slovak Rep. 114
Czech Rep. 514 Bosnia and Herzegovina 106Lithuania 371 Slovenia 84
Source: World Bank staff calculations, based on United Nations 2005.
chaw_045-072_ch01.qxd 5/23/07 7:41 PM Page 61
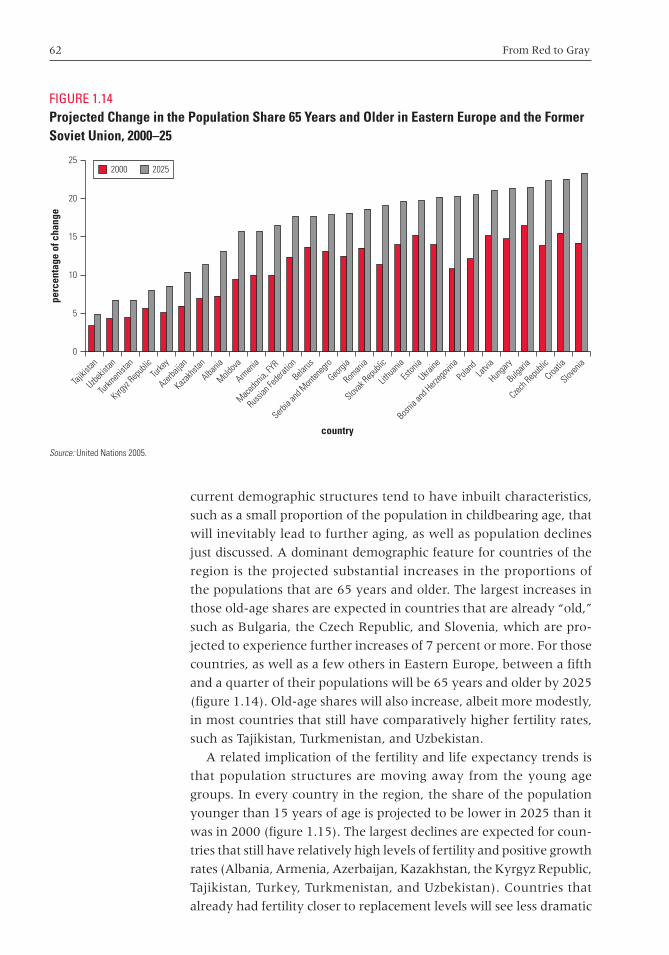
62 From Red to Gray
current demographic structures tend to have inbuilt characteristics,
such as a small proportion of the population in childbearing age, that
will inevitably lead to further aging, as well as population declines
just discussed. A dominant demographic feature for countries of the
region is the projected substantial increases in the proportions of
the populations that are 65 years and older. The largest increases in
those old-age shares are expected in countries that are already “old,”
such as Bulgaria, the Czech Republic, and Slovenia, which are pro-
jected to experience further increases of 7 percent or more. For those
countries, as well as a few others in Eastern Europe, between a fifth
and a quarter of their populations will be 65 years and older by 2025
(figure 1.14). Old-age shares will also increase, albeit more modestly,
in most countries that still have comparatively higher fertility rates,
such as Tajikistan, Turkmenistan, and Uzbekistan.
A related implication of the fertility and life expectancy trends is
that population structures are moving away from the young age
groups. In every country in the region, the share of the population
younger than 15 years of age is projected to be lower in 2025 than it
was in 2000 (figure 1.15). The largest declines are expected for coun-
tries that still have relatively high levels of fertility and positive growth
rates (Albania, Armenia, Azerbaijan, Kazakhstan, the Kyrgyz Republic,
Tajikistan, Turkey, Turkmenistan, and Uzbekistan). Countries that
already had fertility closer to replacement levels will see less dramatic
FIGURE 1.14Projected Change in the Population Share 65 Years and Older in Eastern Europe and the FormerSoviet Union, 2000–25
Source: United Nations 2005.
0
5
15
25
10
20
country
perc
enta
ge o
f cha
nge
2000 2025
Tajikis
tan
Uzbekis
tan
Turkm
enist
an
Kyrgyz
Repub
licTur
key
Azerba
ijan
Kazakhs
tan
Albania
Moldova
Armen
ia
Macedo
nia, FY
R
Russian
Fede
ration
Belarus
Serbia
and M
onten
egro
Georgi
a
Roman
ia
Slovak
Repub
lic
Lithu
ania
Eston
ia
Ukraine
Bosnia
and H
erzeg
ovina
Polan
dLat
via
Hunga
ry
Bulgari
a
Czech R
epub
lic
Croatia
Sloven
ia
chaw_045-072_ch01.qxd 5/23/07 7:41 PM Page 62
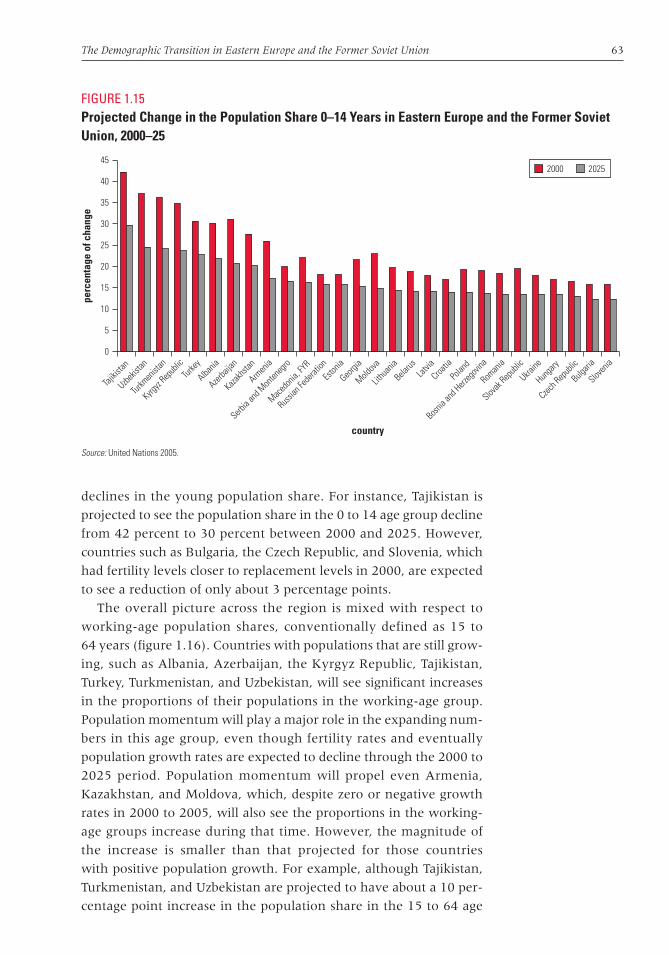
The Demographic Transition in Eastern Europe and the Former Soviet Union 63
declines in the young population share. For instance, Tajikistan is
projected to see the population share in the 0 to 14 age group decline
from 42 percent to 30 percent between 2000 and 2025. However,
countries such as Bulgaria, the Czech Republic, and Slovenia, which
had fertility levels closer to replacement levels in 2000, are expected
to see a reduction of only about 3 percentage points.
The overall picture across the region is mixed with respect to
working-age population shares, conventionally defined as 15 to
64 years (figure 1.16). Countries with populations that are still grow-
ing, such as Albania, Azerbaijan, the Kyrgyz Republic, Tajikistan,
Turkey, Turkmenistan, and Uzbekistan, will see significant increases
in the proportions of their populations in the working-age group.
Population momentum will play a major role in the expanding num-
bers in this age group, even though fertility rates and eventually
population growth rates are expected to decline through the 2000 to
2025 period. Population momentum will propel even Armenia,
Kazakhstan, and Moldova, which, despite zero or negative growth
rates in 2000 to 2005, will also see the proportions in the working-
age groups increase during that time. However, the magnitude of
the increase is smaller than that projected for those countries
with positive population growth. For example, although Tajikistan,
Turkmenistan, and Uzbekistan are projected to have about a 10 per-
centage point increase in the population share in the 15 to 64 age
FIGURE 1.15Projected Change in the Population Share 0–14 Years in Eastern Europe and the Former SovietUnion, 2000–25
Source: United Nations 2005.
0
10
5
15
30
25
20
45
40
35
Tajikis
tan
Uzbekis
tan
Turkm
enist
an
Kyrgyz
Repub
licTur
key
Kazakhs
tan
Albania
Armen
ia
Macedo
nia, FY
RBela
rus
Serbia
and M
onten
egro
Azerba
ijan
Roman
ia
Slovak
Repub
lic
Lithu
ania
Eston
ia
Ukraine
Moldova
Bosnia
and H
erzeg
ovina
Polan
d
Russian
Fede
ration
Latvia
Hunga
ry
Bulgari
a
Czech R
epub
licCroa
tia
Sloven
ia
Georgi
a
perc
enta
ge o
f cha
nge
country
2000 2025
chaw_045-072_ch01.qxd 5/23/07 7:41 PM Page 63

64 From Red to Gray
group by 2025, the corresponding increases in Armenia, Kazakhstan,
and Moldova will be between 1.7 and 3.0 percentage points. At the
other end of the spectrum, a number of countries will see a fall in the
working-age population share. The largest declines will be in Bosnia
and Herzegovina, Croatia, the Czech Republic, and Slovenia, which
will lose between 4.0 and 6.0 percentage points. More detail on the
implications of demographic trends for the region’s working-age
population will be provided in the next chapter.
As the region’s population structures increasingly shift to older
age structures, median ages will continue to rise (figure 1.17). This
finding is true even for those countries (mostly former Soviet coun-
tries and Turkey) that still have fertility rates above replacement lev-
els. About half of the countries in the region already had median
ages older than 35 years in 2000; those countries are projected to see
even further increases, as high as 47 years for the Czech Republic
and Slovenia. Even a country such as Tajikistan, with a median age
of 18 years in 2000, will see that figure rise to about 26 years by 2025
because of slowly declining fertility rates coupled with improve-
ments in longevity. Although all countries are projected to have ris-
ing median ages, former Soviet countries will have median ages that
are up to two decades younger than those projected for the oldest
countries.
FIGURE 1.16Projected Change in the Population Share 15–64 Years in Eastern Europe and the Former SovietUnion, 2000–25
Source: United Nations 2005.
45
55
50
60
70
65
75
Tajikis
tan
Uzbekis
tan
Turkm
enist
an
Kyrgyz
Repub
licTur
key
Kazakhs
tan
Albania
Armen
ia
Macedo
nia, FY
R
Belarus
Serbia
and
Monten
egro
Azerba
ijan
Roman
ia
Slovak
Repub
lic
Lithu
ania
Eston
ia
Ukraine
Moldova
Bosnia
and H
erzeg
ovina
Polan
d
Russian
Fede
ration
Latvia
Hunga
ry
Bulgari
a
Czech R
epub
lic
Croatia
Sloven
ia
Georgi
a
perc
enta
ge o
f cha
nge
country
2000 2025
chaw_045-072_ch01.qxd 5/23/07 7:41 PM Page 64
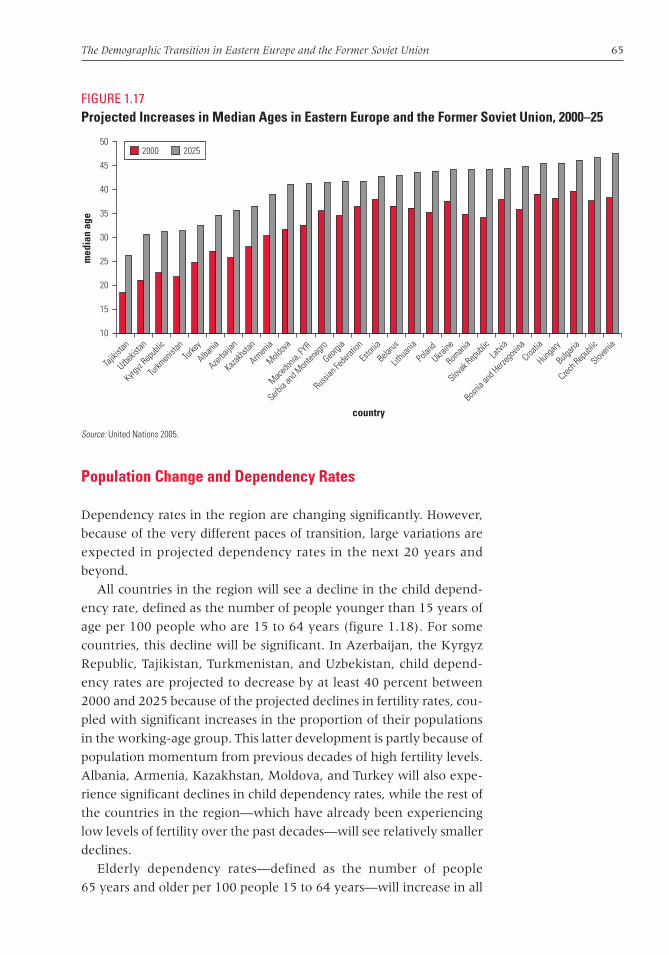
The Demographic Transition in Eastern Europe and the Former Soviet Union 65
Population Change and Dependency Rates
Dependency rates in the region are changing significantly. However,
because of the very different paces of transition, large variations are
expected in projected dependency rates in the next 20 years and
beyond.
All countries in the region will see a decline in the child depend-
ency rate, defined as the number of people younger than 15 years of
age per 100 people who are 15 to 64 years (figure 1.18). For some
countries, this decline will be significant. In Azerbaijan, the Kyrgyz
Republic, Tajikistan, Turkmenistan, and Uzbekistan, child depend-
ency rates are projected to decrease by at least 40 percent between
2000 and 2025 because of the projected declines in fertility rates, cou-
pled with significant increases in the proportion of their populations
in the working-age group. This latter development is partly because of
population momentum from previous decades of high fertility levels.
Albania, Armenia, Kazakhstan, Moldova, and Turkey will also expe-
rience significant declines in child dependency rates, while the rest of
the countries in the region—which have already been experiencing
low levels of fertility over the past decades—will see relatively smaller
declines.
Elderly dependency rates—defined as the number of people
65 years and older per 100 people 15 to 64 years—will increase in all
FIGURE 1.17Projected Increases in Median Ages in Eastern Europe and the Former Soviet Union, 2000–25
Source: United Nations 2005.
10
20
15
25
40
45
30
35
50
Tajikis
tan
Uzbekis
tan
Kyrgyz
Repub
lic
Turkm
enist
an
Albania
Kazakhs
tan
Armen
ia
Azerba
ijan
Eston
ia
Macedo
nia, FY
R
Belarus
Turkey
Russian
Fede
ration
Lithu
ania
Georgi
a
Slovak
Repub
lic
Polan
d
Moldova
Hunga
ry
Bosnia
and H
erzeg
ovina
Latvia
Roman
ia
Croatia
Ukraine
Czech R
epub
lic
Bulgari
a
Sloven
ia
Serbia
and M
onten
egro
med
ian
age
country
2000 2025
chaw_045-072_ch01.qxd 5/23/07 7:41 PM Page 65
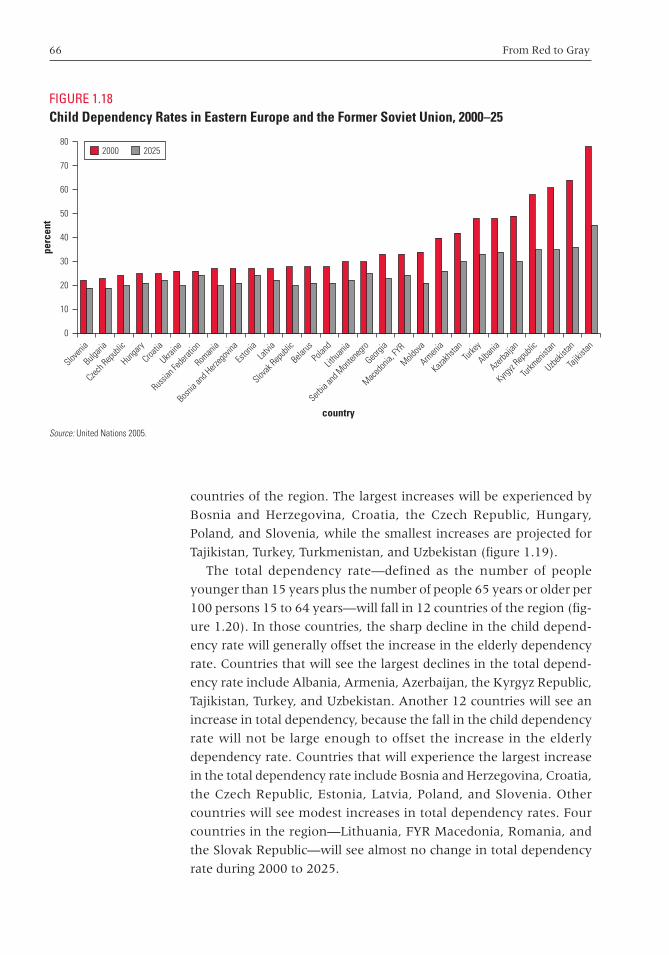
66 From Red to Gray
countries of the region. The largest increases will be experienced by
Bosnia and Herzegovina, Croatia, the Czech Republic, Hungary,
Poland, and Slovenia, while the smallest increases are projected for
Tajikistan, Turkey, Turkmenistan, and Uzbekistan (figure 1.19).
The total dependency rate—defined as the number of people
younger than 15 years plus the number of people 65 years or older per
100 persons 15 to 64 years—will fall in 12 countries of the region (fig-
ure 1.20). In those countries, the sharp decline in the child depend-
ency rate will generally offset the increase in the elderly dependency
rate. Countries that will see the largest declines in the total depend-
ency rate include Albania, Armenia, Azerbaijan, the Kyrgyz Republic,
Tajikistan, Turkey, and Uzbekistan. Another 12 countries will see an
increase in total dependency, because the fall in the child dependency
rate will not be large enough to offset the increase in the elderly
dependency rate. Countries that will experience the largest increase
in the total dependency rate include Bosnia and Herzegovina, Croatia,
the Czech Republic, Estonia, Latvia, Poland, and Slovenia. Other
countries will see modest increases in total dependency rates. Four
countries in the region—Lithuania, FYR Macedonia, Romania, and
the Slovak Republic—will see almost no change in total dependency
rate during 2000 to 2025.
FIGURE 1.18Child Dependency Rates in Eastern Europe and the Former Soviet Union, 2000–25
Source: United Nations 2005.
0
20
10
30
60
70
40
50
80
Sloven
ia
Bulgari
a
Czech R
epub
lic
Hunga
ry
Ukraine
Roman
ia
Bosnia
and H
erzeg
ovina
Russian
Fede
ration
Lithu
ania
Latvia
Serbia
and M
onten
egro
Croatia
Polan
d
Georgi
a
Belarus
Kazakhs
tan
Macedo
nia, FY
R
Eston
ia
Kyrgyz
Repub
lic
Albania
Turkey
Armen
ia
Azerba
ijan
Moldova
Uzbekis
tan
Turkm
enist
an
Tajikis
tan
Slovak
Repub
lic
country
perc
ent
2000 2025
chaw_045-072_ch01.qxd 5/23/07 7:41 PM Page 66
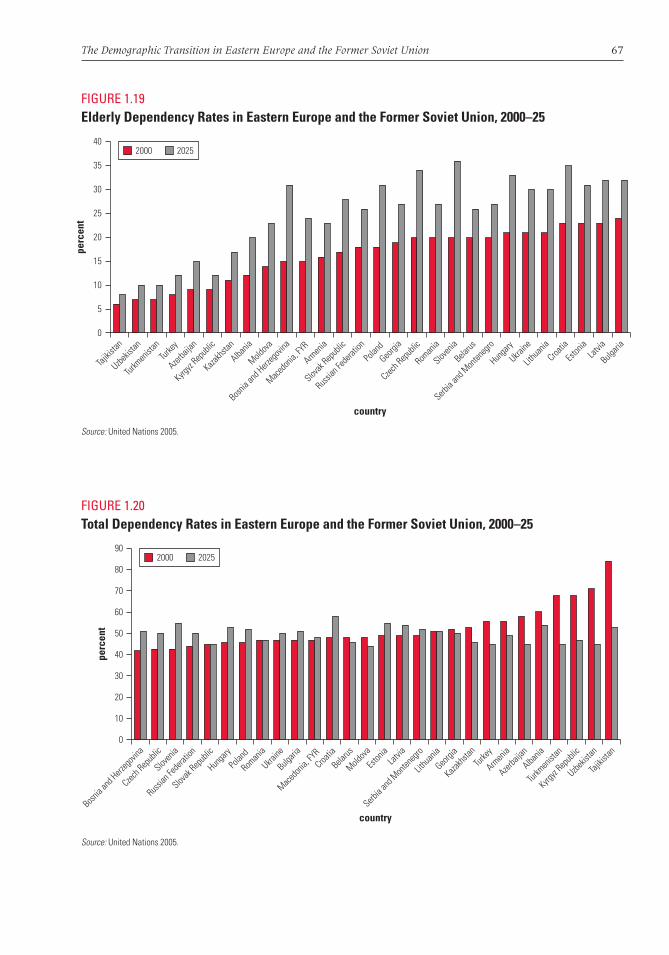
The Demographic Transition in Eastern Europe and the Former Soviet Union 67
FIGURE 1.20Total Dependency Rates in Eastern Europe and the Former Soviet Union, 2000–25
Source: United Nations 2005.
0
20
10
30
60
country
70
40
50
90
80
Bosnia
and H
erzeg
ovina
Czech R
epub
lic
Sloven
ia
Russian
Fede
ration
Hunga
ry
Roman
ia
Ukraine
Polan
dEst
onia
Macedo
nia, FY
RLat
via
Slovak
Repub
lic
Moldova
Serbia
and M
onten
egro
Belarus
Turkey
Lithu
ania
Bulgari
a
Turkm
enist
an
Azerba
ijan
Armen
ia
Kazakhs
tan
Albania
Georgi
a
Uzbekis
tan
Kyrgyz
Repub
lic
Tajikis
tan
Croatia
2000 2025
perc
ent
FIGURE 1.19Elderly Dependency Rates in Eastern Europe and the Former Soviet Union, 2000–25
Source: United Nations 2005.
0
10
5
15
35
20
25
30
40
Tajikis
tan
Uzbekis
tan
Turkm
enist
anTur
key
Kyrgyz
Repub
lic
Albania
Moldova
Kazakhs
tan
Polan
d
Macedo
nia, FY
RGeo
rgia
Azerba
ijan
Russian
Fede
ration
Czech R
epub
lic
Slovak
Repub
lic
Serbia
and M
onten
egro
Roman
ia
Bosnia
and H
erzeg
ovina
Croatia
Ukraine
Hunga
ry
Belarus
Lithu
ania
Sloven
iaLat
via
Eston
ia
Bulgari
a
Armen
ia
2000 2025
country
perc
ent
chaw_045-072_ch01.qxd 5/23/07 7:41 PM Page 67
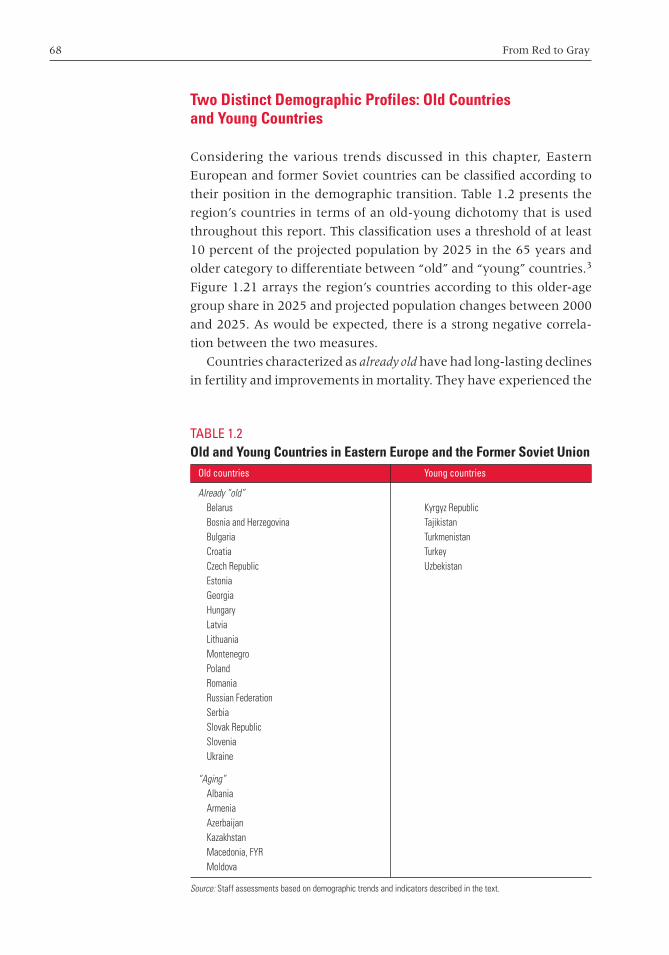
68 From Red to Gray
Two Distinct Demographic Profiles: Old Countries and Young Countries
Considering the various trends discussed in this chapter, Eastern
European and former Soviet countries can be classified according to
their position in the demographic transition. Table 1.2 presents the
region’s countries in terms of an old-young dichotomy that is used
throughout this report. This classification uses a threshold of at least
10 percent of the projected population by 2025 in the 65 years and
older category to differentiate between “old” and “young” countries.3
Figure 1.21 arrays the region’s countries according to this older-age
group share in 2025 and projected population changes between 2000
and 2025. As would be expected, there is a strong negative correla-
tion between the two measures.
Countries characterized as already old have had long-lasting declines
in fertility and improvements in mortality. They have experienced the
TABLE 1.2Old and Young Countries in Eastern Europe and the Former Soviet Union
Old countries Young countries
Already “old”Belarus Kyrgyz RepublicBosnia and Herzegovina TajikistanBulgaria TurkmenistanCroatia TurkeyCzech Republic UzbekistanEstoniaGeorgiaHungaryLatviaLithuaniaMontenegroPolandRomaniaRussian FederationSerbiaSlovak RepublicSloveniaUkraine
“Aging”AlbaniaArmeniaAzerbaijanKazakhstanMacedonia, FYRMoldova
Source: Staff assessments based on demographic trends and indicators described in the text.
chaw_045-072_ch01.qxd 5/23/07 7:41 PM Page 68
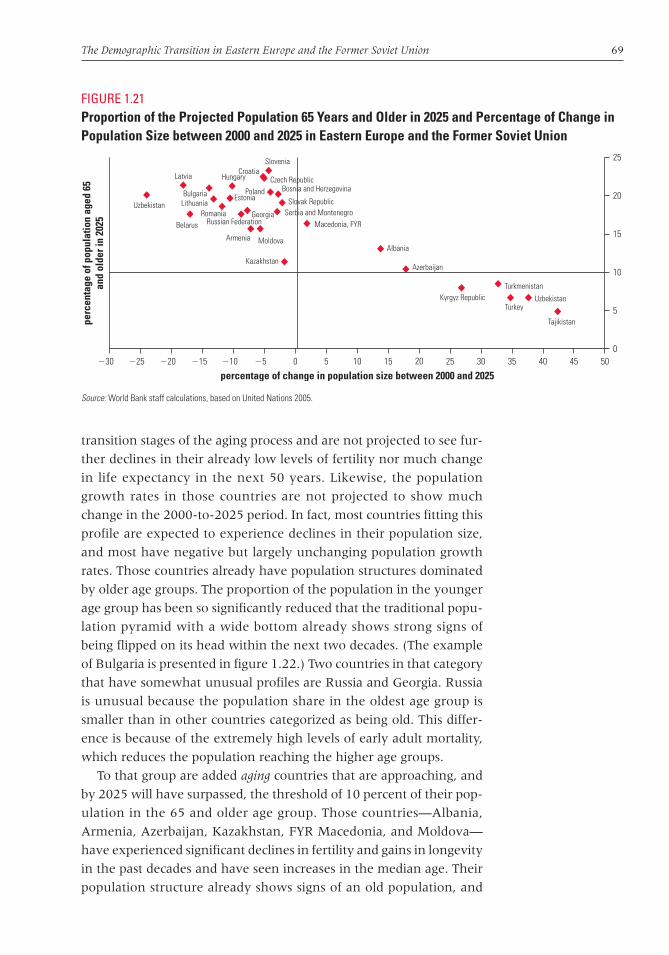
The Demographic Transition in Eastern Europe and the Former Soviet Union 69
transition stages of the aging process and are not projected to see fur-
ther declines in their already low levels of fertility nor much change
in life expectancy in the next 50 years. Likewise, the population
growth rates in those countries are not projected to show much
change in the 2000-to-2025 period. In fact, most countries fitting this
profile are expected to experience declines in their population size,
and most have negative but largely unchanging population growth
rates. Those countries already have population structures dominated
by older age groups. The proportion of the population in the younger
age group has been so significantly reduced that the traditional popu-
lation pyramid with a wide bottom already shows strong signs of
being flipped on its head within the next two decades. (The example
of Bulgaria is presented in figure 1.22.) Two countries in that category
that have somewhat unusual profiles are Russia and Georgia. Russia
is unusual because the population share in the oldest age group is
smaller than in other countries categorized as being old. This differ-
ence is because of the extremely high levels of early adult mortality,
which reduces the population reaching the higher age groups.
To that group are added aging countries that are approaching, and
by 2025 will have surpassed, the threshold of 10 percent of their pop-
ulation in the 65 and older age group. Those countries—Albania,
Armenia, Azerbaijan, Kazakhstan, FYR Macedonia, and Moldova—
have experienced significant declines in fertility and gains in longevity
in the past decades and have seen increases in the median age. Their
population structure already shows signs of an old population, and
FIGURE 1.21Proportion of the Projected Population 65 Years and Older in 2025 and Percentage of Change inPopulation Size between 2000 and 2025 in Eastern Europe and the Former Soviet Union
Source: World Bank staff calculations, based on United Nations 2005.
�30 �25 �20 �15 �10 �5 0 5 10 15 20 25 30 35 40 450
5
10
15
20
25
50
Georgia
percentage of change in population size between 2000 and 2025
perc
enta
ge o
f pop
ulat
ion
aged
65
and
olde
r in
2025
Bosnia and HerzegovinaPoland
Uzbekistan
Moldova
RomaniaSlovak Republic
Czech Republic
Slovenia
Albania
Bulgaria
Hungary
Azerbaijan
Belarus
Latvia
Estonia
Russian Federation
Armenia
Croatia
Turkey
Serbia and Montenegro
Kazakhstan
Macedonia, FYR
Kyrgyz Republic Uzbekistan
Turkmenistan
Tajikistan
Lithuania
chaw_045-072_ch01.qxd 5/23/07 7:41 PM Page 69
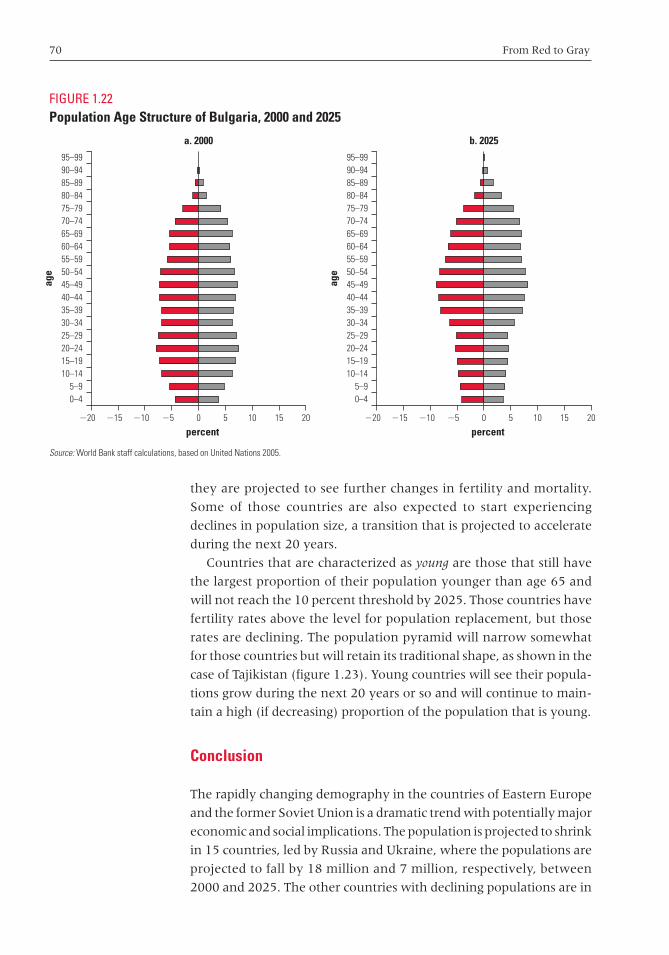
70 From Red to Gray
they are projected to see further changes in fertility and mortality.
Some of those countries are also expected to start experiencing
declines in population size, a transition that is projected to accelerate
during the next 20 years.
Countries that are characterized as young are those that still have
the largest proportion of their population younger than age 65 and
will not reach the 10 percent threshold by 2025. Those countries have
fertility rates above the level for population replacement, but those
rates are declining. The population pyramid will narrow somewhat
for those countries but will retain its traditional shape, as shown in the
case of Tajikistan (figure 1.23). Young countries will see their popula-
tions grow during the next 20 years or so and will continue to main-
tain a high (if decreasing) proportion of the population that is young.
Conclusion
The rapidly changing demography in the countries of Eastern Europe
and the former Soviet Union is a dramatic trend with potentially major
economic and social implications. The population is projected to shrink
in 15 countries, led by Russia and Ukraine, where the populations are
projected to fall by 18 million and 7 million, respectively, between
2000 and 2025. The other countries with declining populations are in
FIGURE 1.22Population Age Structure of Bulgaria, 2000 and 2025
Source: World Bank staff calculations, based on United Nations 2005.
�20 �15 �10 �5 0 5 10 15 20
0–45–9
10–1415–1920–2425–2930–3435–3940–4445–4950–5455–5960–6465–6970–7475–7980–8485–8990–9495–99
0–45–9
10–1415–1920–2425–2930–3435–3940–4445–4950–5455–5960–6465–6970–7475–7980–8485–8990–9495–99
�20 �15 �10 �5 0 5 10 15 20
a. 2000
age
b. 2025
percent percent
age
chaw_045-072_ch01.qxd 5/23/07 7:41 PM Page 70
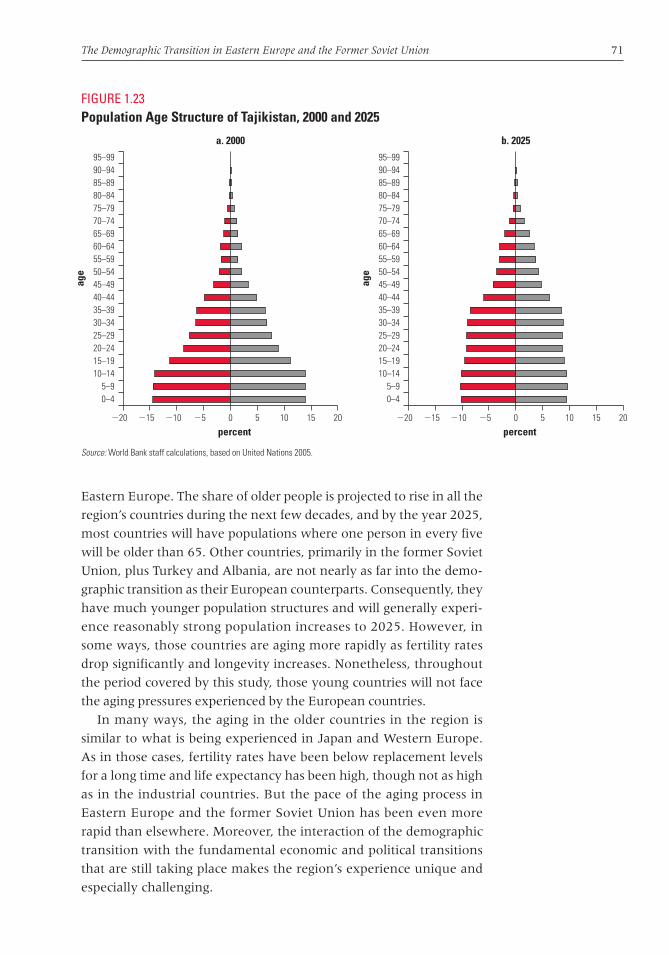
The Demographic Transition in Eastern Europe and the Former Soviet Union 71
Eastern Europe. The share of older people is projected to rise in all the
region’s countries during the next few decades, and by the year 2025,
most countries will have populations where one person in every five
will be older than 65. Other countries, primarily in the former Soviet
Union, plus Turkey and Albania, are not nearly as far into the demo-
graphic transition as their European counterparts. Consequently, they
have much younger population structures and will generally experi-
ence reasonably strong population increases to 2025. However, in
some ways, those countries are aging more rapidly as fertility rates
drop significantly and longevity increases. Nonetheless, throughout
the period covered by this study, those young countries will not face
the aging pressures experienced by the European countries.
In many ways, the aging in the older countries in the region is
similar to what is being experienced in Japan and Western Europe.
As in those cases, fertility rates have been below replacement levels
for a long time and life expectancy has been high, though not as high
as in the industrial countries. But the pace of the aging process in
Eastern Europe and the former Soviet Union has been even more
rapid than elsewhere. Moreover, the interaction of the demographic
transition with the fundamental economic and political transitions
that are still taking place makes the region’s experience unique and
especially challenging.
FIGURE 1.23Population Age Structure of Tajikistan, 2000 and 2025
Source: World Bank staff calculations, based on United Nations 2005.
�20 �15 �10 �5 0 5 10 15 20
a. 2000
percent
0–45–9
10–1415–1920–2425–2930–3435–3940–4445–4950–5455–5960–6465–6970–7475–7980–8485–8990–9495–99
�20 �15 �10 �5 0 5 10 15 20
b. 2025
percent
0–45–9
10–1415–1920–2425–2930–3435–3940–4445–4950–5455–5960–6465–6970–7475–7980–8485–8990–9495–99
age
age
chaw_045-072_ch01.qxd 5/23/07 7:41 PM Page 71

72 From Red to Gray
Notes
1. In this report, the countries in Eastern Europe and the Former SovietUnion include Albania, Armenia, Azerbaijan, Belarus, Bosnia and Herze-govina, Bulgaria, Croatia, the Czech Republic, Estonia, Georgia, Hun-gary, Kazakhstan, the Kyrgyz Republic, Latvia, Lithuania, the formerYugoslav Republic of Macedonia, Moldova, Montenegro, Poland, Roma-nia, the Russian Federation, Serbia, the Slovak Republic, Slovenia, Tajik-istan, Turkey, Turkmenistan, Ukraine, and Uzbekistan. Because theprojections used in this chapter are based on the 2004 revisions by theUnited Nations, Serbia and Montenegro are not separated. These coun-tries, plus Kosovo, constitute the administrative region of Eastern Europeand Central Asia in the World Bank’s delineation.
2. The replacement level of fertility is the level at which a populationreplaces itself from one generation to the next. For industrial countries,it is estimated at 2.1 children per woman; however, for developing coun-tries, a level of average fertility higher than 2.1 might be requiredbecause of higher infant and child mortality. A country might reach areplacement level of fertility and still continue to grow because of mor-tality, migration, and the momentum dictated by past and current demo-graphic trends.
3. United Nations publications and reports define aged populations as thosewith at least a 10 percent share of people 60 years and older. This crite-rion, set at the 1982 World Assembly on Ageing, has been debated morerecently, with arguments put forward that a more appropriate cutoff agefor an elderly person would be 65 years. This study adopts the 65 yearsand older criterion as the threshold for an old population.
chaw_045-072_ch01.qxd 5/23/07 7:41 PM Page 72

73
Introduction
The demographic changes discussed in chapter 1 have potentially
important implications for economic growth in Eastern Europe and
the former Soviet Union. They could affect the size of the workforce,
its productivity, and the financial capital available for investment. This
chapter addresses the links between aging and labor supply and the
productivity of the labor force; savings and financial markets are
the subject of the next chapter.
Demographic trends can have direct implications for labor markets
through three primary channels: labor supply, labor productivity, and
labor demand (because of shifts in the structure of aggregate demand).
This chapter focuses on the first two. The conventional wisdom is that
aging societies will face difficult economic and social challenges
because of what will inevitably happen in the labor market—that is,
output will be reduced because the labor force will shrink as large
numbers of workers retire and because older workforces cannot pro-
duce at the level of younger ones.
Population aging is seriously affecting other regions, including
Japan and Western Europe, but there are reasons to be particularly
concerned about the labor market consequences in Eastern Europe
Demographic Change and Labor Markets
CHAPTER 2
chaw_073-116_ch02.qxd 5/30/07 5:27 PM Page 73

74 From Red to Gray
and the former Soviet Union. First, the region already has low levels
of labor force participation, with earlier exits from the labor force
than other aging regions. In most countries, these low levels have
been caused partly by large-scale downsizing associated with restruc-
turing and weak labor markets that offer very limited reemployment
prospects. Labor force withdrawals have often been encouraged by
early retirement schemes that were intended to make room for
younger workers. Second, compared with other graying societies,
Eastern European and former Soviet countries have fewer financial
resources for mitigating any negative consequences on the labor mar-
ket of population aging—to the extent that such resources can help.
These are legitimate concerns; however, the story is more complex
and may be less demographically determined than conventional wis-
dom suggests. As chapter 1 showed, not all countries in Eastern
Europe and the former Soviet Union are aging—which suggests that
migration can play an important role in addressing labor shortages in
those countries that are. There is also some scope for increasing labor
supply through greater labor force participation. Moreover, negative
productivity predictions are not necessarily valid. The evidence is
actually somewhat mixed regarding whether workers become less
productive as they age.
However, this more positive scenario will only transpire if sound,
forward-looking policies are implemented to mitigate the real risks of
aging populations. Policy choices affecting migration, labor market
regulations and wage-setting practices, retirement and pension rules,
and training and education policies will be particularly critical for
ensuring increases in labor supply and labor productivity. Efforts to
remove discriminatory attitudes toward older workers would also help.
This chapter begins with projections to 2020 of labor forces for
Eastern European and former Soviet countries, including alterna-
tive scenarios that could increase the labor supply over that in the
base case. It then summarizes existing evidence on how workforce
age affects labor market outcomes. The following section looks at
what is known about how aging affects productivity. The chapter
concludes with a discussion of policy options for addressing aging-
related concerns in the labor market.
Labor Force Projections
Labor supply is significantly predetermined by demographics, but
there is room to maneuver through changes in participation and
through migration. This section begins with an analysis of projections
chaw_073-116_ch02.qxd 5/30/07 5:27 PM Page 74

Demographic Change and Labor Markets 75
of working-age population to 2020 for the region’s countries. The base
case projects the working-age population, conventionally defined
(age 15 to 64), with current labor force participation rates. Then alter-
native scenarios modify those rates in various ways to assess how dif-
ferent potential policy levers could increase future labor supply.
What the Region’s Labor Force Will Look Like in 2020
Demographic trends suggest that the region’s working-age popula-
tion will decline over the next 15 years. However, the magnitude of
the decline will be modest. According to the United Nations (UN)
population projections (2004 revision, medium variant), the region
will lose 458,000 working-age people between 2005 and 2020
(United Nations 2005).1 In relative terms (working-age population as
a proportion of population as a whole), this impact is virtually zero,
given that the entire population in the region is projected to increase
by only 1.2 million through 2020. However, this projection still gives
cause for concern, given that labor supply is a key determinant of
economic growth. It should be noted that these population projec-
tions do not incorporate any major shifts in migration.2
As chapter 1 showed, the overall regional demographic profile
masks big differences across countries. Trends in the working-age
population range from large increases, as in Uzbekistan and Tajikistan,
to large losses, in the Russian Federation and Ukraine. The 2005 to
2025 percentage changes in the shares of the working-age population
appear in figure 2.1 (for background numbers, see annex 2.C). Obvi-
ously, this situation will create incentives for migration within the
region, a prospect discussed later.3
The trends in the working-age population described in figure 2.1
correspond fairly closely with the country classification introduced in
chapter 1 (see table 1.2). In the five “young” countries—the Kyrgyz
Republic, Tajikistan, Turkey, Turkmenistan, and Uzbekistan—absolute
and relative working-age populations will increase uniformly over the
next 15 years. Virtually all the “old” countries will experience declines
in both absolute and relative terms. The exception is Georgia, where
the working-age population is projected to increase as a share of total
population, even though the total population will decline in absolute
numbers. Among those countries that are aging, the projections are
mixed. Armenia, Bosnia and Herzegovina, the former Yugoslav
Republic of Macedonia, and Moldova will have very little change in
either their absolute or their relative working-age population. Albania,
Azerbaijan, and Kazakhstan will have some growth in their working-
age population; however, as was noted in chapter 1, these countries
chaw_073-116_ch02.qxd 5/30/07 5:27 PM Page 75
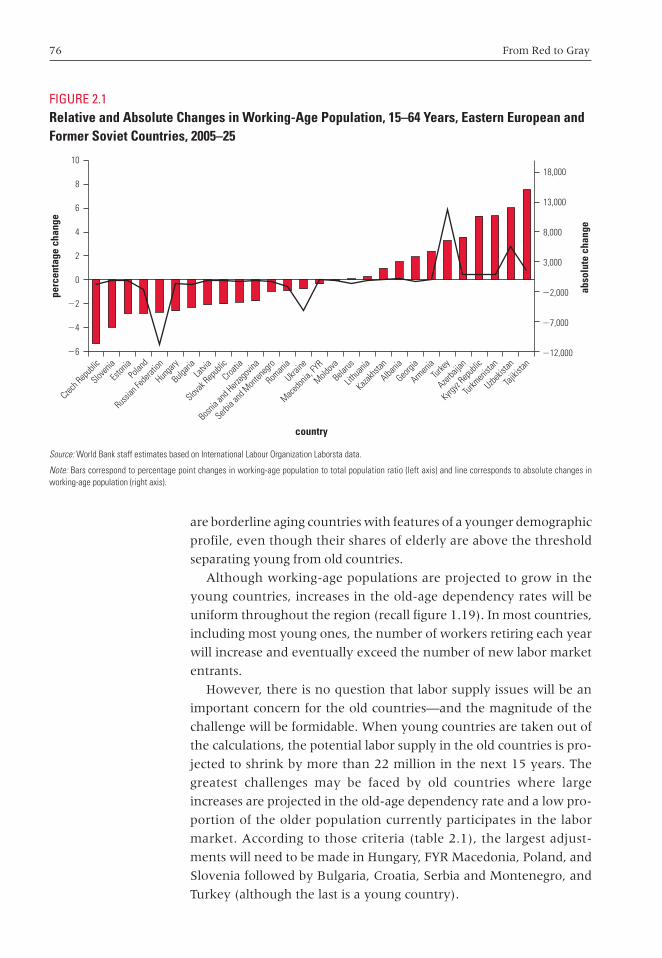
76 From Red to Gray
are borderline aging countries with features of a younger demographic
profile, even though their shares of elderly are above the threshold
separating young from old countries.
Although working-age populations are projected to grow in the
young countries, increases in the old-age dependency rates will be
uniform throughout the region (recall figure 1.19). In most countries,
including most young ones, the number of workers retiring each year
will increase and eventually exceed the number of new labor market
entrants.
However, there is no question that labor supply issues will be an
important concern for the old countries—and the magnitude of the
challenge will be formidable. When young countries are taken out of
the calculations, the potential labor supply in the old countries is pro-
jected to shrink by more than 22 million in the next 15 years. The
greatest challenges may be faced by old countries where large
increases are projected in the old-age dependency rate and a low pro-
portion of the older population currently participates in the labor
market. According to those criteria (table 2.1), the largest adjust-
ments will need to be made in Hungary, FYR Macedonia, Poland, and
Slovenia followed by Bulgaria, Croatia, Serbia and Montenegro, and
Turkey (although the last is a young country).
FIGURE 2.1Relative and Absolute Changes in Working-Age Population, 15–64 Years, Eastern European andFormer Soviet Countries, 2005–25
Source: World Bank staff estimates based on International Labour Organization Laborsta data.
Note: Bars correspond to percentage point changes in working-age population to total population ratio (left axis) and line corresponds to absolute changes in working-age population (right axis).
�6
�4
�2
6
4
2
0
8
1018,000
13,000
8,000
3,000
�2,000
�7,000
�12,000
perc
enta
ge c
hang
e
abso
lute
cha
nge
Czech R
epub
lic
Tajikis
tan
country
Sloven
ia
Eston
iaPo
land
Russian
Fede
ration
Hunga
ry
Bulgari
aLat
via
Slovak
Repub
lic
Croatia
Bosnia
and H
erzeg
ovina
Serbia
and M
onten
egro
Roman
ia
Ukraine
Macedo
nia, FY
R
Moldova
Belarus
Lithu
ania
Kazakhs
tan
Albania
Georgi
a
Armen
iaTur
key
Azerba
ijan
Kyrgyz
Repub
lic
Turkm
enist
an
Uzbekis
tan
chaw_073-116_ch02.qxd 5/30/07 5:27 PM Page 76
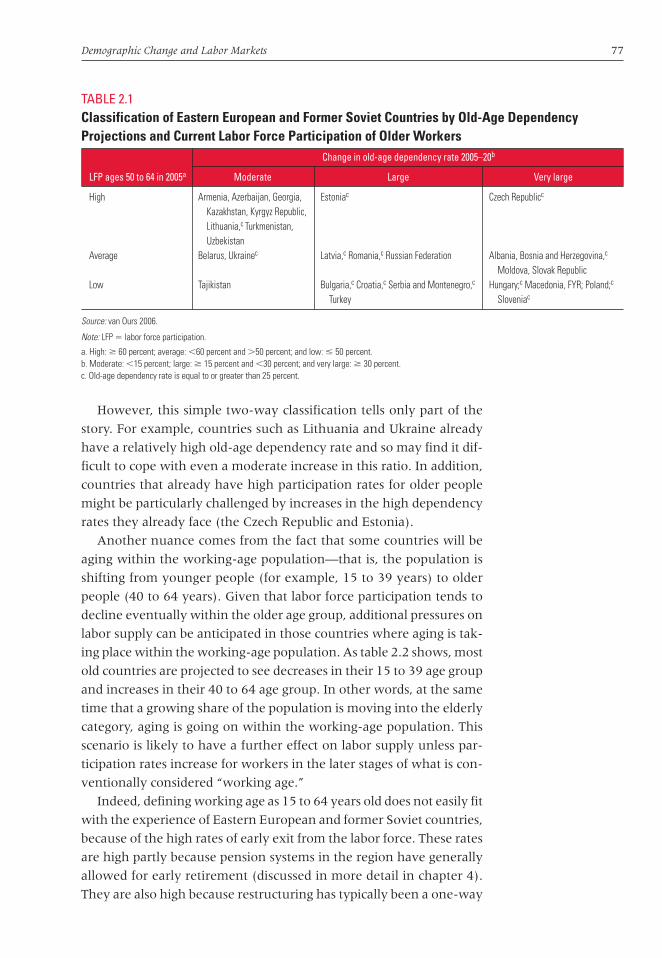
Demographic Change and Labor Markets 77
However, this simple two-way classification tells only part of the
story. For example, countries such as Lithuania and Ukraine already
have a relatively high old-age dependency rate and so may find it dif-
ficult to cope with even a moderate increase in this ratio. In addition,
countries that already have high participation rates for older people
might be particularly challenged by increases in the high dependency
rates they already face (the Czech Republic and Estonia).
Another nuance comes from the fact that some countries will be
aging within the working-age population—that is, the population is
shifting from younger people (for example, 15 to 39 years) to older
people (40 to 64 years). Given that labor force participation tends to
decline eventually within the older age group, additional pressures on
labor supply can be anticipated in those countries where aging is tak-
ing place within the working-age population. As table 2.2 shows, most
old countries are projected to see decreases in their 15 to 39 age group
and increases in their 40 to 64 age group. In other words, at the same
time that a growing share of the population is moving into the elderly
category, aging is going on within the working-age population. This
scenario is likely to have a further effect on labor supply unless par-
ticipation rates increase for workers in the later stages of what is con-
ventionally considered “working age.”
Indeed, defining working age as 15 to 64 years old does not easily fit
with the experience of Eastern European and former Soviet countries,
because of the high rates of early exit from the labor force. These rates
are high partly because pension systems in the region have generally
allowed for early retirement (discussed in more detail in chapter 4).
They are also high because restructuring has typically been a one-way
TABLE 2.1Classification of Eastern European and Former Soviet Countries by Old-Age DependencyProjections and Current Labor Force Participation of Older Workers
Change in old-age dependency rate 2005–20b
LFP ages 50 to 64 in 2005a Moderate Large Very large
High Armenia, Azerbaijan, Georgia, Estoniac Czech Republicc
Kazakhstan, Kyrgyz Republic, Lithuania,c Turkmenistan,Uzbekistan
Average Belarus, Ukrainec Latvia,c Romania,c Russian Federation Albania, Bosnia and Herzegovina,c
Moldova, Slovak RepublicLow Tajikistan Bulgaria,c Croatia,c Serbia and Montenegro,c Hungary;c Macedonia, FYR; Poland;c
Turkey Sloveniac
Source: van Ours 2006.
Note: LFP � labor force participation.
a. High: � 60 percent; average: �60 percent and �50 percent; and low: � 50 percent. b. Moderate: �15 percent; large: � 15 percent and �30 percent; and very large: � 30 percent.c. Old-age dependency rate is equal to or greater than 25 percent.
chaw_073-116_ch02.qxd 5/30/07 5:27 PM Page 77
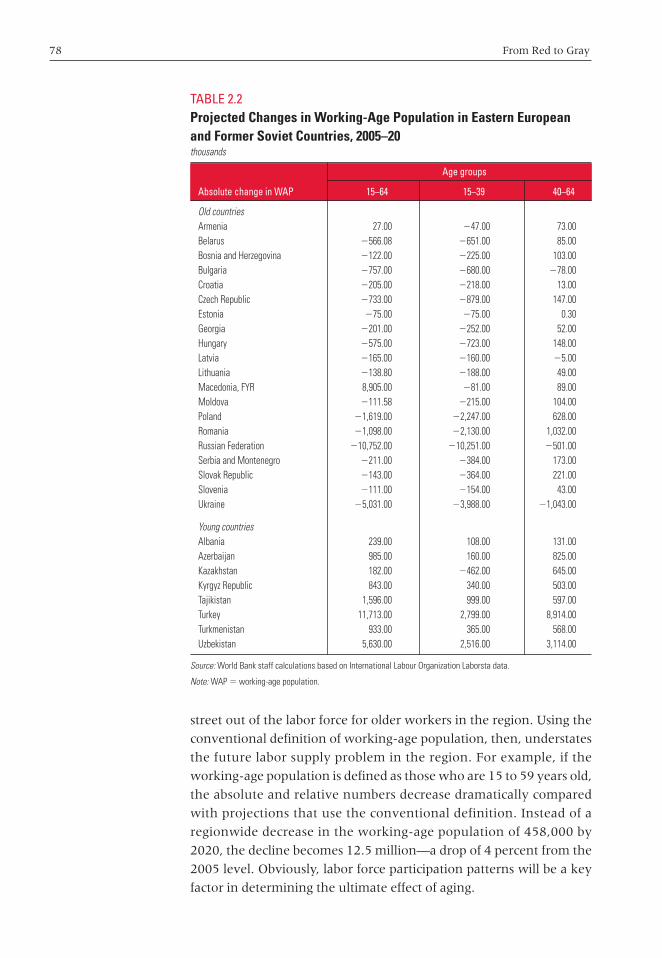
78 From Red to Gray
street out of the labor force for older workers in the region. Using the
conventional definition of working-age population, then, understates
the future labor supply problem in the region. For example, if the
working-age population is defined as those who are 15 to 59 years old,
the absolute and relative numbers decrease dramatically compared
with projections that use the conventional definition. Instead of a
regionwide decrease in the working-age population of 458,000 by
2020, the decline becomes 12.5 million—a drop of 4 percent from the
2005 level. Obviously, labor force participation patterns will be a key
factor in determining the ultimate effect of aging.
TABLE 2.2Projected Changes in Working-Age Population in Eastern Europeanand Former Soviet Countries, 2005–20 thousands
Age groups
Absolute change in WAP 15–64 15–39 40–64
Old countriesArmenia 27.00 �47.00 73.00Belarus �566.08 �651.00 85.00Bosnia and Herzegovina �122.00 �225.00 103.00Bulgaria �757.00 �680.00 �78.00Croatia �205.00 �218.00 13.00Czech Republic �733.00 �879.00 147.00Estonia �75.00 �75.00 0.30Georgia �201.00 �252.00 52.00Hungary �575.00 �723.00 148.00Latvia �165.00 �160.00 �5.00Lithuania �138.80 �188.00 49.00Macedonia, FYR 8,905.00 �81.00 89.00Moldova �111.58 �215.00 104.00Poland �1,619.00 �2,247.00 628.00Romania �1,098.00 �2,130.00 1,032.00Russian Federation �10,752.00 �10,251.00 �501.00Serbia and Montenegro �211.00 �384.00 173.00Slovak Republic �143.00 �364.00 221.00Slovenia �111.00 �154.00 43.00Ukraine �5,031.00 �3,988.00 �1,043.00
Young countriesAlbania 239.00 108.00 131.00Azerbaijan 985.00 160.00 825.00Kazakhstan 182.00 �462.00 645.00Kyrgyz Republic 843.00 340.00 503.00Tajikistan 1,596.00 999.00 597.00Turkey 11,713.00 2,799.00 8,914.00Turkmenistan 933.00 365.00 568.00Uzbekistan 5,630.00 2,516.00 3,114.00
Source: World Bank staff calculations based on International Labour Organization Laborsta data.
Note: WAP � working-age population.
chaw_073-116_ch02.qxd 5/30/07 5:27 PM Page 78

Demographic Change and Labor Markets 79
Labor Force Participation Projections
In an examination of the future labor supply and the role of partici-
pation rates, projections from 2005 to 2020 have been carried out for
six countries in the region: the Kyrgyz Republic and Turkey (young
countries) and Bulgaria, the Czech Republic, Poland, and Russia (old
countries). In addition to projections describing what would happen
if participation rates do not change (the base case), alternate scenar-
ios were run to see how changes in participation rates would com-
pensate for the aging-related declines in potential labor supply. The
selection of countries shows how participation can affect labor supply
for the different types of aging experiences in the region. In any event,
the results for the old countries are of greatest interest and show that
significant increases in labor supply are possible when participation
rates rise. However, to fully compensate for aging in the old countries,
gains in participation rates will have to be large. Where these rates are
already high, increasing participation is a less viable policy option.
The projection exercise included the following base case and
scenarios:
• Base case. This scenario leaves participation rates by age and gen-
der unchanged at their 2003 levels. These rates are presented in
table 2.3.
• ILO. This scenario follows projections of the International Labour
Organization (ILO), which are essentially an extrapolation of the
most recent estimates of participation rates by age-gender groups
within countries. The ILO methodology is described annex 2.A.
• EU25 convergence. These projections assume that participation
rates for all age-gender groups will move toward those of the
TABLE 2.3Participation Rates by Age Groups in Projection Countries and the European Union, 2003 percent
Age group EU25 Kyrgyz Republic Turkey Russian Federation Poland Bulgaria Czech Republic
15–19 25 32 28 15 9 7 920–24 61 67 51 61 57 51 6325–29 81 79 62 85 84 74 8030–34 84 83 63 86 87 79 8635–39 86 83 63 93 89 84 9240–44 86 85 61 92 87 84 9245–49 84 85 54 88 82 80 9350–54 77 77 45 80 65 73 8855–59 58 65 37 51 41 49 6060–64 26 41 30 30 20 17 22
Source: World Bank staff calculations based on International Labour Organization Laborsta data.
chaw_073-116_ch02.qxd 5/30/07 5:27 PM Page 79
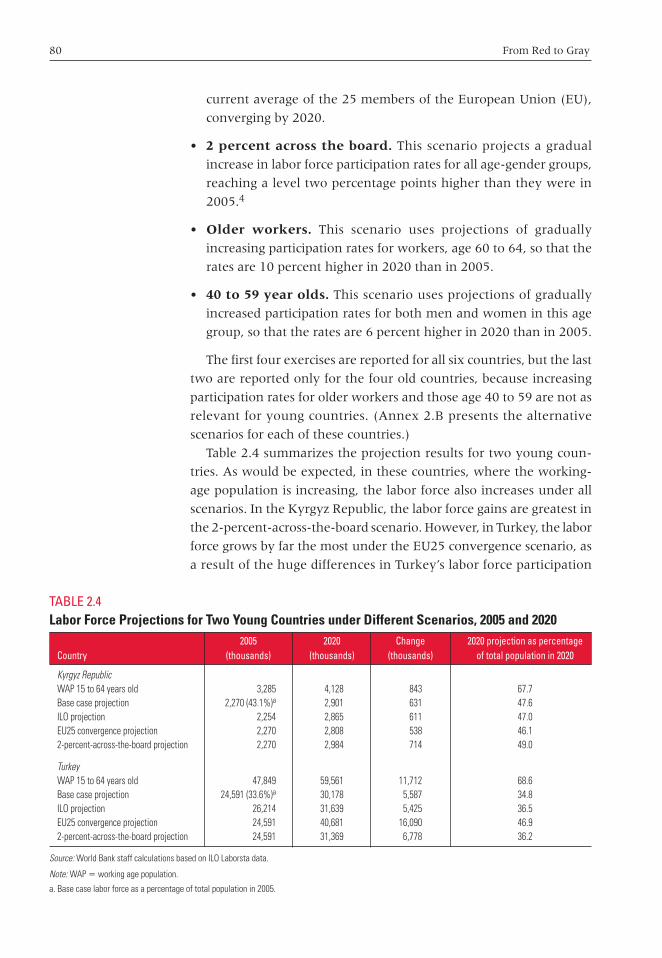
80 From Red to Gray
current average of the 25 members of the European Union (EU),
converging by 2020.
• 2 percent across the board. This scenario projects a gradual
increase in labor force participation rates for all age-gender groups,
reaching a level two percentage points higher than they were in
2005.4
• Older workers. This scenario uses projections of gradually
increasing participation rates for workers, age 60 to 64, so that the
rates are 10 percent higher in 2020 than in 2005.
• 40 to 59 year olds. This scenario uses projections of gradually
increased participation rates for both men and women in this age
group, so that the rates are 6 percent higher in 2020 than in 2005.
The first four exercises are reported for all six countries, but the last
two are reported only for the four old countries, because increasing
participation rates for older workers and those age 40 to 59 are not as
relevant for young countries. (Annex 2.B presents the alternative
scenarios for each of these countries.)
Table 2.4 summarizes the projection results for two young coun-
tries. As would be expected, in these countries, where the working-
age population is increasing, the labor force also increases under all
scenarios. In the Kyrgyz Republic, the labor force gains are greatest in
the 2-percent-across-the-board scenario. However, in Turkey, the labor
force grows by far the most under the EU25 convergence scenario, as
a result of the huge differences in Turkey’s labor force participation
TABLE 2.4Labor Force Projections for Two Young Countries under Different Scenarios, 2005 and 2020
2005 2020 Change 2020 projection as percentage Country (thousands) (thousands) (thousands) of total population in 2020
Kyrgyz RepublicWAP 15 to 64 years old 3,285 4,128 843 67.7Base case projection 2,270 (43.1%)a 2,901 631 47.6ILO projection 2,254 2,865 611 47.0EU25 convergence projection 2,270 2,808 538 46.12-percent-across-the-board projection 2,270 2,984 714 49.0
TurkeyWAP 15 to 64 years old 47,849 59,561 11,712 68.6Base case projection 24,591 (33.6%)a 30,178 5,587 34.8ILO projection 26,214 31,639 5,425 36.5EU25 convergence projection 24,591 40,681 16,090 46.92-percent-across-the-board projection 24,591 31,369 6,778 36.2
Source: World Bank staff calculations based on ILO Laborsta data.
Note: WAP � working age population.
a. Base case labor force as a percentage of total population in 2005.
chaw_073-116_ch02.qxd 5/30/07 5:27 PM Page 80
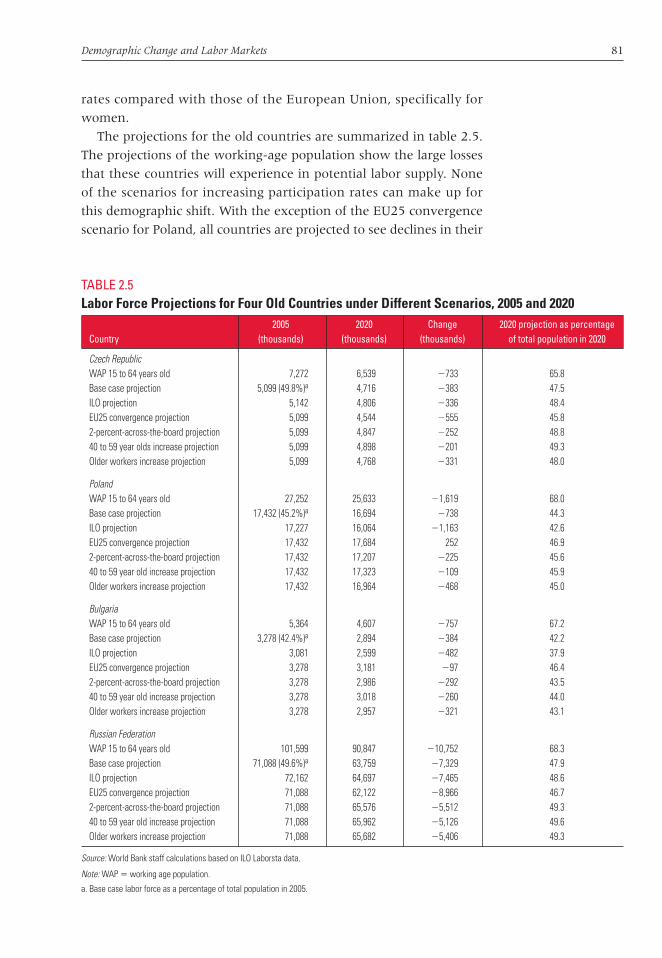
Demographic Change and Labor Markets 81
rates compared with those of the European Union, specifically for
women.
The projections for the old countries are summarized in table 2.5.
The projections of the working-age population show the large losses
that these countries will experience in potential labor supply. None
of the scenarios for increasing participation rates can make up for
this demographic shift. With the exception of the EU25 convergence
scenario for Poland, all countries are projected to see declines in their
TABLE 2.5Labor Force Projections for Four Old Countries under Different Scenarios, 2005 and 2020
2005 2020 Change 2020 projection as percentage Country (thousands) (thousands) (thousands) of total population in 2020
Czech RepublicWAP 15 to 64 years old 7,272 6,539 �733 65.8Base case projection 5,099 (49.8%)a 4,716 �383 47.5ILO projection 5,142 4,806 �336 48.4EU25 convergence projection 5,099 4,544 �555 45.82-percent-across-the-board projection 5,099 4,847 �252 48.840 to 59 year olds increase projection 5,099 4,898 �201 49.3Older workers increase projection 5,099 4,768 �331 48.0
PolandWAP 15 to 64 years old 27,252 25,633 �1,619 68.0Base case projection 17,432 (45.2%)a 16,694 �738 44.3ILO projection 17,227 16,064 �1,163 42.6EU25 convergence projection 17,432 17,684 252 46.92-percent-across-the-board projection 17,432 17,207 �225 45.640 to 59 year old increase projection 17,432 17,323 �109 45.9Older workers increase projection 17,432 16,964 �468 45.0
BulgariaWAP 15 to 64 years old 5,364 4,607 �757 67.2Base case projection 3,278 (42.4%)a 2,894 �384 42.2ILO projection 3,081 2,599 �482 37.9EU25 convergence projection 3,278 3,181 �97 46.42-percent-across-the-board projection 3,278 2,986 �292 43.540 to 59 year old increase projection 3,278 3,018 �260 44.0Older workers increase projection 3,278 2,957 �321 43.1
Russian FederationWAP 15 to 64 years old 101,599 90,847 �10,752 68.3Base case projection 71,088 (49.6%)a 63,759 �7,329 47.9ILO projection 72,162 64,697 �7,465 48.6EU25 convergence projection 71,088 62,122 �8,966 46.72-percent-across-the-board projection 71,088 65,576 �5,512 49.340 to 59 year old increase projection 71,088 65,962 �5,126 49.6Older workers increase projection 71,088 65,682 �5,406 49.3
Source: World Bank staff calculations based on ILO Laborsta data.
Note: WAP � working age population.
a. Base case labor force as a percentage of total population in 2005.
chaw_073-116_ch02.qxd 5/30/07 5:27 PM Page 81
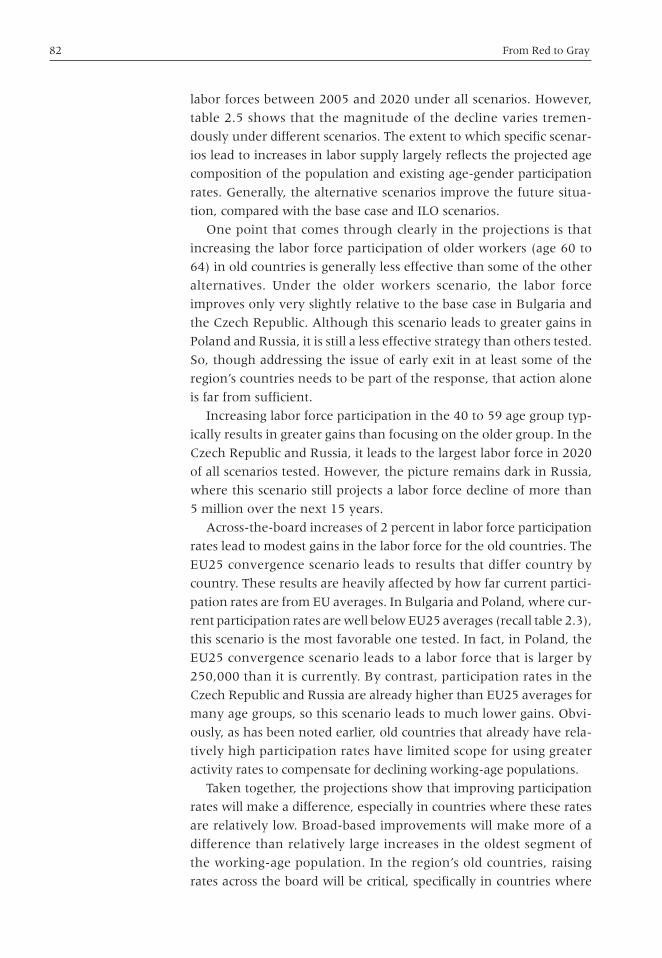
82 From Red to Gray
labor forces between 2005 and 2020 under all scenarios. However,
table 2.5 shows that the magnitude of the decline varies tremen-
dously under different scenarios. The extent to which specific scenar-
ios lead to increases in labor supply largely reflects the projected age
composition of the population and existing age-gender participation
rates. Generally, the alternative scenarios improve the future situa-
tion, compared with the base case and ILO scenarios.
One point that comes through clearly in the projections is that
increasing the labor force participation of older workers (age 60 to
64) in old countries is generally less effective than some of the other
alternatives. Under the older workers scenario, the labor force
improves only very slightly relative to the base case in Bulgaria and
the Czech Republic. Although this scenario leads to greater gains in
Poland and Russia, it is still a less effective strategy than others tested.
So, though addressing the issue of early exit in at least some of the
region’s countries needs to be part of the response, that action alone
is far from sufficient.
Increasing labor force participation in the 40 to 59 age group typ-
ically results in greater gains than focusing on the older group. In the
Czech Republic and Russia, it leads to the largest labor force in 2020
of all scenarios tested. However, the picture remains dark in Russia,
where this scenario still projects a labor force decline of more than
5 million over the next 15 years.
Across-the-board increases of 2 percent in labor force participation
rates lead to modest gains in the labor force for the old countries. The
EU25 convergence scenario leads to results that differ country by
country. These results are heavily affected by how far current partici-
pation rates are from EU averages. In Bulgaria and Poland, where cur-
rent participation rates are well below EU25 averages (recall table 2.3),
this scenario is the most favorable one tested. In fact, in Poland, the
EU25 convergence scenario leads to a labor force that is larger by
250,000 than it is currently. By contrast, participation rates in the
Czech Republic and Russia are already higher than EU25 averages for
many age groups, so this scenario leads to much lower gains. Obvi-
ously, as has been noted earlier, old countries that already have rela-
tively high participation rates have limited scope for using greater
activity rates to compensate for declining working-age populations.
Taken together, the projections show that improving participation
rates will make a difference, especially in countries where these rates
are relatively low. Broad-based improvements will make more of a
difference than relatively large increases in the oldest segment of
the working-age population. In the region’s old countries, raising
rates across the board will be critical, specifically in countries where
chaw_073-116_ch02.qxd 5/30/07 5:27 PM Page 82
Demographic Change and Labor Markets 83
participation is not high now. However, in countries that already have
relatively high participation rates (at least by European standards),
other strategies will be needed to make up for the substantial loss in
the working-age population. One response could be to use migration
to compensate.
Migration
Migration is important for countries in the region.5 Flows are large by
international standards, and the region is unique in that it is both a
major sender and a major receiver. Very tight controls on migration in
the communist era loosened after transition. Migration has been
marked by two distinct flows: from countries in Central and Eastern
Europe to those in Western Europe, and from poorer countries of the
former Soviet Union to richer ones, particularly Kazakhstan and
Russia. With some exceptions, young countries that have growing
working-age populations already are net senders of migrants, while
the reverse is true for most old countries. Figure 2.2 shows recent
FIGURE 2.2Immigration and Emigration Flows for Eastern European and FormerSoviet Subregions, Western Europe, North America, and Israel,2000–03
Source: Mansoor and Quillin 2006.
Note: CEEC � Central and Eastern European Country; CIS � Commonwealth of Independent States.
�5
�4
�1
Russian
Federa
tion
0
1
2
3
4
6
�3
�2
5
mill
ions
�2.0
�1.5
�1.0
�0.5
0
1.5
0.5
1.0
mill
ions
country
Other C
ISCEE
Cs
Western
Europ
e
United
States,
Canad
a, an
d Isra
el
emigration (left axis)
immigration (left axis)net gain (right axis)
chaw_073-116_ch02.qxd 5/30/07 5:27 PM Page 83
84 From Red to Gray
flows of immigration and emigration for subregions in Eastern Europe
and the former Soviet Union, as well as for Western Europe and North
America.
Migration patterns tend to reflect both push and pull factors.
Prospects of higher wages, the potential for improved standards of liv-
ing, and better opportunities for professional and personal develop-
ment are tested determinants of migration, as is geographical
proximity. Current and projected differences in human capital returns
and quality of life suggest that, within the region, the new EU mem-
bers are likely to experience continuing inflows of workers—most
likely from former Soviet countries but also from countries in Africa
and Asia. Given its size and young demographic profile, Turkey
remains a potential source of labor for the European Union. With
their growing populations, southern former Soviet countries are
likely to see continued flows into the shrinking and aging northern
former Soviet countries. Certainly, the eventual magnitude of all
these flows will also be affected by economic prospects in the poten-
tial sending countries. Political factors can also play a role.
Remittances are an important source of external financing for
many countries in the region—the largest source for some of the
poorest countries. In Moldova, remittances constitute more than
25 percent of gross domestic product (GDP). It is followed by Bosnia
and Herzegovina and Albania (both over 20 percent), Tajikistan and
Armenia (10 to 15 percent), and the Kyrgyz Republic and Georgia
(5 to 10 percent). The main sources are the European Union and the
resource-rich countries of Eastern Europe and the former Soviet
Union, accounting for 75 percent and 11 percent, respectively, of all
remittances. Remittances also represent an important source of
foreign exchange in a number of countries and, thus, can improve
creditworthiness and access to international capital markets. Remit-
tances have financed more than 70 percent of the deficit in Albania
since 1995, 75 percent of the deficit in Moldova in 2002 and 2003,
and virtually all the deficits in Tajikistan. In many high-migration
countries (for example, Albania, Bosnia and Herzegovina, Moldova,
Montenegro, Serbia, and Tajikistan), unrecorded remittances also
play an important role.
A projection exercise was carried out that analyzes how migration
might fit into the broader labor supply picture. The exercise looked
at how much migration would be needed to keep the ratio of labor
force to total population constant over time, compensating for the
declines in potential labor supply because of demographic trends.
This exercise was undertaken for Bulgaria, the Czech Republic,
Poland, and Russia through 2020 (table 2.6). The first step was to
chaw_073-116_ch02.qxd 5/30/07 5:27 PM Page 84
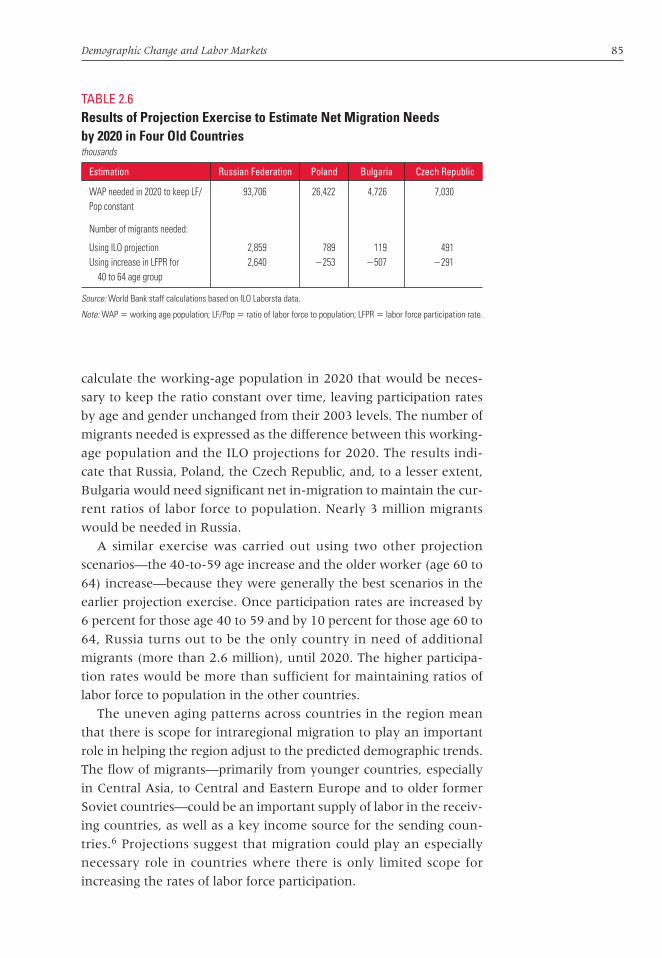
Demographic Change and Labor Markets 85
calculate the working-age population in 2020 that would be neces-
sary to keep the ratio constant over time, leaving participation rates
by age and gender unchanged from their 2003 levels. The number of
migrants needed is expressed as the difference between this working-
age population and the ILO projections for 2020. The results indi-
cate that Russia, Poland, the Czech Republic, and, to a lesser extent,
Bulgaria would need significant net in-migration to maintain the cur-
rent ratios of labor force to population. Nearly 3 million migrants
would be needed in Russia.
A similar exercise was carried out using two other projection
scenarios—the 40-to-59 age increase and the older worker (age 60 to
64) increase—because they were generally the best scenarios in the
earlier projection exercise. Once participation rates are increased by
6 percent for those age 40 to 59 and by 10 percent for those age 60 to
64, Russia turns out to be the only country in need of additional
migrants (more than 2.6 million), until 2020. The higher participa-
tion rates would be more than sufficient for maintaining ratios of
labor force to population in the other countries.
The uneven aging patterns across countries in the region mean
that there is scope for intraregional migration to play an important
role in helping the region adjust to the predicted demographic trends.
The flow of migrants—primarily from younger countries, especially
in Central Asia, to Central and Eastern Europe and to older former
Soviet countries—could be an important supply of labor in the receiv-
ing countries, as well as a key income source for the sending coun-
tries.6 Projections suggest that migration could play an especially
necessary role in countries where there is only limited scope for
increasing the rates of labor force participation.
TABLE 2.6Results of Projection Exercise to Estimate Net Migration Needsby 2020 in Four Old Countries thousands
Estimation Russian Federation Poland Bulgaria Czech Republic
WAP needed in 2020 to keep LF/ 93,706 26,422 4,726 7,030Pop constant
Number of migrants needed:
Using ILO projection 2,859 789 119 491Using increase in LFPR for 2,640 �253 �507 �291
40 to 64 age group
Source: World Bank staff calculations based on ILO Laborsta data.
Note: WAP � working age population; LF/Pop � ratio of labor force to population; LFPR � labor force participation rate.
chaw_073-116_ch02.qxd 5/30/07 5:27 PM Page 85
86 From Red to Gray
Implications of an Aging Labor Force for Labor Market Outcomes
This section deals with how labor market outcomes change with age.
New analysis uses household survey data from four countries, Albania
and Turkey (both with large youth population shares), and Bulgaria
and Russia (both old).7 The analysis here focuses on how labor mar-
ket outcomes change as individuals age, not on what happens as
populations age. It is not clear how relationships observed at the indi-
vidual level will change as national demographic profiles shift to older
age categories. That will depend on such factors as the substitutability
of older workers for younger ones, societal and employer attitudes
about the employability of older workers, and incentives created by
social security and labor market rules and institutions.
Labor Force Participation
Labor force participation patterns for older workers differ significantly
across countries. In the Organisation for Economic Co-operation and
Development (OECD), workers in some countries continue to partic-
ipate at very high rates into their 60s. For example, the participation
rate for men age 60 to 64 is greater than 60 percent in Iceland, Japan,
New Zealand, Switzerland, and Sweden; for women in the same age
group, rates are lower but still greater than 50 percent in Iceland,
Sweden, and Norway. From 1994 to 2004, participation rates for older
people rose in almost all OECD countries, largely because of increases
in the labor force activity of women in these age groups.
Labor force participation by older people in countries in the region
differs from participation patterns in nontransition OECD countries
in various ways (table 2.7). First, in Eastern European and former
Soviet countries, participation rates for age 50 to 64 are lower for
both men and women. This difference really emerges at age 60 for
men and age 55 for women. Second, while women’s participation
rates in the OECD have increased over the past quarter century, they
have declined in Eastern Europe and the former Soviet Union. Third,
divergence (as measured by the standard deviation of national partic-
ipation rates) has increased in the countries of Eastern Europe and
the former Soviet Union but not in those of the OECD.
The gap between these two groups of countries in the participation
of older workers is partly due to differences in the average age on
exit from the labor force. Although entry patterns are very similar,
workers in the Eastern European and former Soviet countries
for which data are available exit the labor force on average almost
chaw_073-116_ch02.qxd 5/30/07 5:27 PM Page 86
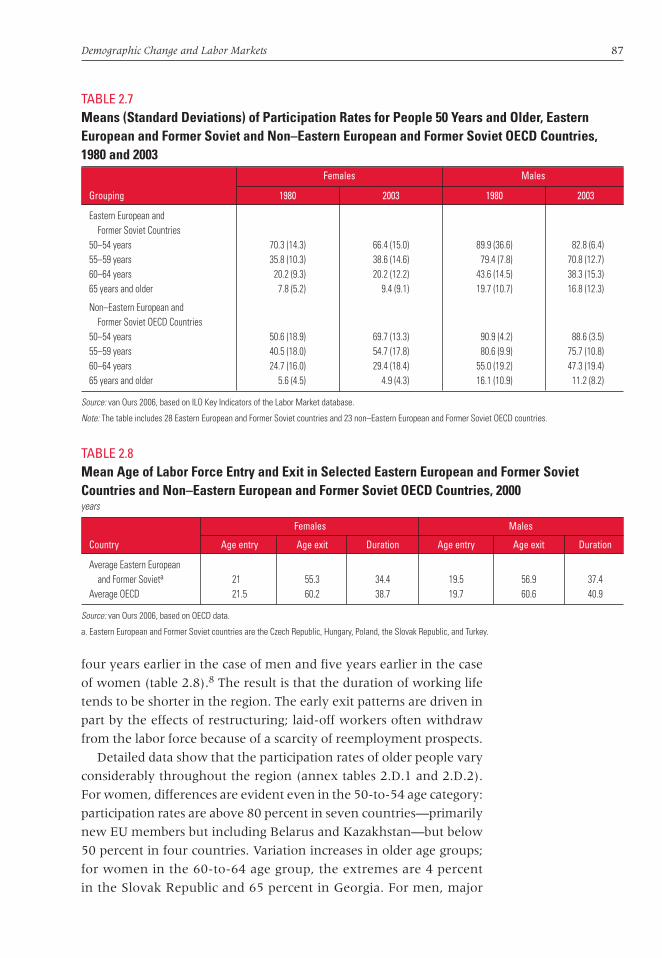
Demographic Change and Labor Markets 87
four years earlier in the case of men and five years earlier in the case
of women (table 2.8).8 The result is that the duration of working life
tends to be shorter in the region. The early exit patterns are driven in
part by the effects of restructuring; laid-off workers often withdraw
from the labor force because of a scarcity of reemployment prospects.
Detailed data show that the participation rates of older people vary
considerably throughout the region (annex tables 2.D.1 and 2.D.2).
For women, differences are evident even in the 50-to-54 age category:
participation rates are above 80 percent in seven countries—primarily
new EU members but including Belarus and Kazakhstan—but below
50 percent in four countries. Variation increases in older age groups;
for women in the 60-to-64 age group, the extremes are 4 percent
in the Slovak Republic and 65 percent in Georgia. For men, major
TABLE 2.7Means (Standard Deviations) of Participation Rates for People 50 Years and Older, EasternEuropean and Former Soviet and Non–Eastern European and Former Soviet OECD Countries, 1980 and 2003
Females Males
Grouping 1980 2003 1980 2003
Eastern European and Former Soviet Countries
50–54 years 70.3 (14.3) 66.4 (15.0) 89.9 (36.6) 82.8 (6.4)55–59 years 35.8 (10.3) 38.6 (14.6) 79.4 (7.8) 70.8 (12.7)60–64 years 20.2 (9.3) 20.2 (12.2) 43.6 (14.5) 38.3 (15.3)65 years and older 7.8 (5.2) 9.4 (9.1) 19.7 (10.7) 16.8 (12.3)
Non–Eastern European and Former Soviet OECD Countries
50–54 years 50.6 (18.9) 69.7 (13.3) 90.9 (4.2) 88.6 (3.5)55–59 years 40.5 (18.0) 54.7 (17.8) 80.6 (9.9) 75.7 (10.8)60–64 years 24.7 (16.0) 29.4 (18.4) 55.0 (19.2) 47.3 (19.4)65 years and older 5.6 (4.5) 4.9 (4.3) 16.1 (10.9) 11.2 (8.2)
Source: van Ours 2006, based on ILO Key Indicators of the Labor Market database.
Note: The table includes 28 Eastern European and Former Soviet countries and 23 non–Eastern European and Former Soviet OECD countries.
TABLE 2.8Mean Age of Labor Force Entry and Exit in Selected Eastern European and Former SovietCountries and Non–Eastern European and Former Soviet OECD Countries, 2000years
Females Males
Country Age entry Age exit Duration Age entry Age exit Duration
Average Eastern European and Former Sovieta 21 55.3 34.4 19.5 56.9 37.4
Average OECD 21.5 60.2 38.7 19.7 60.6 40.9
Source: van Ours 2006, based on OECD data.
a. Eastern European and Former Soviet countries are the Czech Republic, Hungary, Poland, the Slovak Republic, and Turkey.
chaw_073-116_ch02.qxd 5/30/07 5:27 PM Page 87
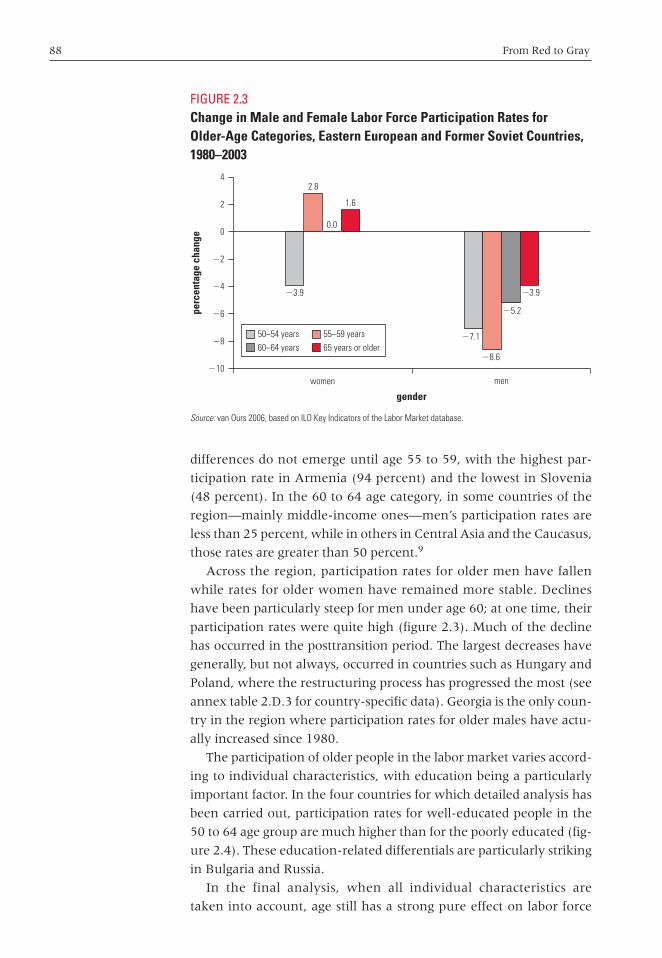
88 From Red to Gray
differences do not emerge until age 55 to 59, with the highest par-
ticipation rate in Armenia (94 percent) and the lowest in Slovenia
(48 percent). In the 60 to 64 age category, in some countries of the
region—mainly middle-income ones—men’s participation rates are
less than 25 percent, while in others in Central Asia and the Caucasus,
those rates are greater than 50 percent.9
Across the region, participation rates for older men have fallen
while rates for older women have remained more stable. Declines
have been particularly steep for men under age 60; at one time, their
participation rates were quite high (figure 2.3). Much of the decline
has occurred in the posttransition period. The largest decreases have
generally, but not always, occurred in countries such as Hungary and
Poland, where the restructuring process has progressed the most (see
annex table 2.D.3 for country-specific data). Georgia is the only coun-
try in the region where participation rates for older males have actu-
ally increased since 1980.
The participation of older people in the labor market varies accord-
ing to individual characteristics, with education being a particularly
important factor. In the four countries for which detailed analysis has
been carried out, participation rates for well-educated people in the
50 to 64 age group are much higher than for the poorly educated (fig-
ure 2.4). These education-related differentials are particularly striking
in Bulgaria and Russia.
In the final analysis, when all individual characteristics are
taken into account, age still has a strong pure effect on labor force
FIGURE 2.3Change in Male and Female Labor Force Participation Rates for Older-Age Categories, Eastern European and Former Soviet Countries,1980–2003
Source: van Ours 2006, based on ILO Key Indicators of the Labor Market database.
�10
�8
�6
�4
�2
0
2
4
perc
enta
ge c
hang
e
men
�7.1
�8.6
�5.2
�3.9
women
gender
0.0
�3.9
2.8
1.6
50–54 years 55–59 years60–64 years 65 years or older
chaw_073-116_ch02.qxd 5/30/07 5:27 PM Page 88

Demographic Change and Labor Markets 89
participation. To isolate the specific effects of age, van Ours (2006)
estimated probit functions to explain labor force participation rela-
tive to a set of potential determinants for the four countries where
we have undertaken micro-level analysis.10 The results are shown in
figures 2.5 and 2.6, which describe the marginal effects of age on
FIGURE 2.4Participation Rates of Labor Force 50 to 64 Years by EducationalAttainment in Selected Eastern European and Former Soviet Countries,Various Years
Source: World Bank staff calculations based on household survey data.
Note: See note 7 for the survey year of each country.
0
40
30
20
10
50
60
70
80
perc
enta
ge o
f par
ticip
atio
n
Special secondary TertiaryNone/primary Basic General secondary
educational attainment
Albania Bulgaria Russian Federation Turkey
FIGURE 2.5Marginal Effect of Age on Labor Force Participation of Females inSelected Eastern European and Former Soviet Countries, Various Years
Source: van Ours 2006, based on World Bank staff calculations.
Note: See note 7 for the survey year of each country.
�0.5
�0.4
�0.3
�0.2
�0.1
0
0.1
0.2
0.3
0.4
0.5
�25 25–29 30–34 35–39 40–44 45–49 50–54 55–59 60–64 �64
mar
gina
l effe
ct
age
Albania Bulgaria Russian Federation Turkey
chaw_073-116_ch02.qxd 5/30/07 5:27 PM Page 89
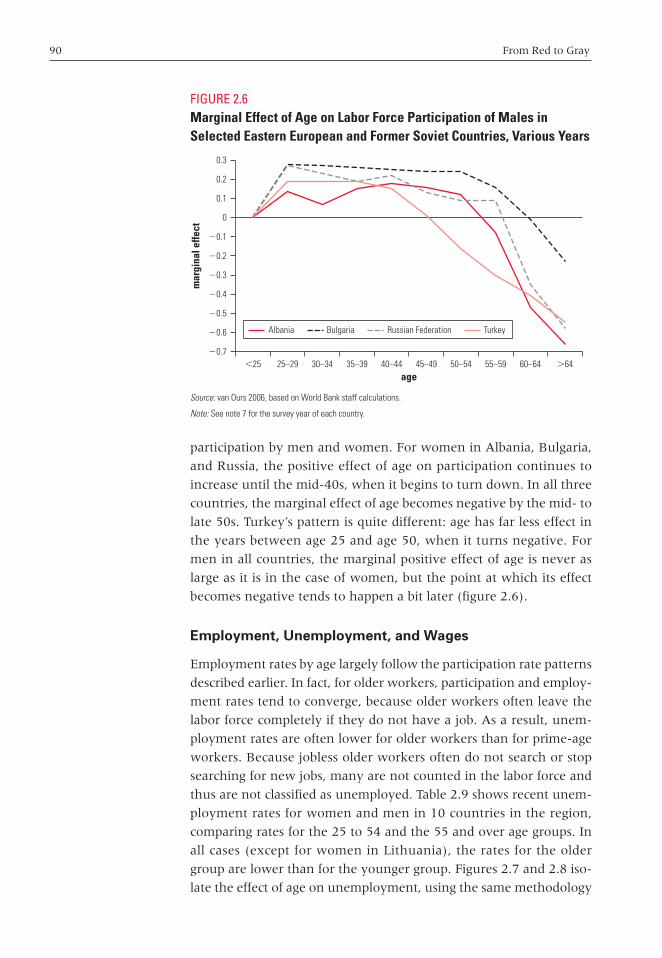
90 From Red to Gray
participation by men and women. For women in Albania, Bulgaria,
and Russia, the positive effect of age on participation continues to
increase until the mid-40s, when it begins to turn down. In all three
countries, the marginal effect of age becomes negative by the mid- to
late 50s. Turkey’s pattern is quite different: age has far less effect in
the years between age 25 and age 50, when it turns negative. For
men in all countries, the marginal positive effect of age is never as
large as it is in the case of women, but the point at which its effect
becomes negative tends to happen a bit later (figure 2.6).
Employment, Unemployment, and Wages
Employment rates by age largely follow the participation rate patterns
described earlier. In fact, for older workers, participation and employ-
ment rates tend to converge, because older workers often leave the
labor force completely if they do not have a job. As a result, unem-
ployment rates are often lower for older workers than for prime-age
workers. Because jobless older workers often do not search or stop
searching for new jobs, many are not counted in the labor force and
thus are not classified as unemployed. Table 2.9 shows recent unem-
ployment rates for women and men in 10 countries in the region,
comparing rates for the 25 to 54 and the 55 and over age groups. In
all cases (except for women in Lithuania), the rates for the older
group are lower than for the younger group. Figures 2.7 and 2.8 iso-
late the effect of age on unemployment, using the same methodology
FIGURE 2.6Marginal Effect of Age on Labor Force Participation of Males inSelected Eastern European and Former Soviet Countries, Various Years
Source: van Ours 2006, based on World Bank staff calculations.
Note: See note 7 for the survey year of each country.
age
�0.7
�0.6
�0.5
�0.4
�0.3
�0.2
�0.1
0
0.1
0.2
0.3
mar
gina
l effe
ct
�25 25–29 30–34 35–39 40–44 45–49 50–54 55–59 60–64 �64
Albania Bulgaria Russian Federation Turkey
chaw_073-116_ch02.qxd 5/30/07 5:27 PM Page 90
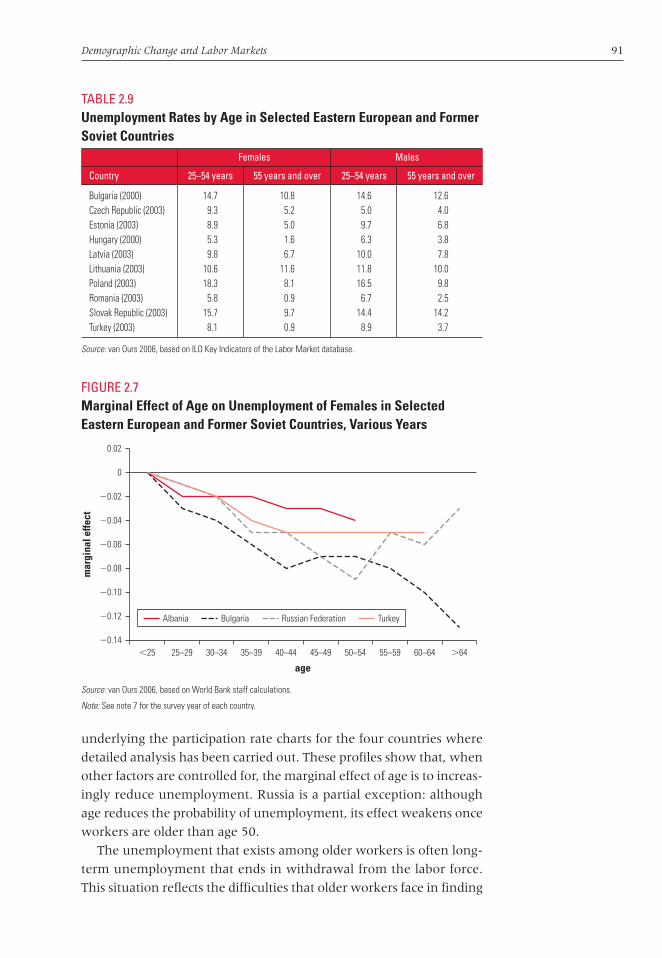
Demographic Change and Labor Markets 91
underlying the participation rate charts for the four countries where
detailed analysis has been carried out. These profiles show that, when
other factors are controlled for, the marginal effect of age is to increas-
ingly reduce unemployment. Russia is a partial exception: although
age reduces the probability of unemployment, its effect weakens once
workers are older than age 50.
The unemployment that exists among older workers is often long-
term unemployment that ends in withdrawal from the labor force.
This situation reflects the difficulties that older workers face in finding
FIGURE 2.7Marginal Effect of Age on Unemployment of Females in SelectedEastern European and Former Soviet Countries, Various Years
Source: van Ours 2006, based on World Bank staff calculations.
Note: See note 7 for the survey year of each country.
age
mar
gina
l effe
ct
�25 25–29 30–34 35–39 40–44 45–49 50–54 55–59 60–64 �64
Albania Bulgaria Russian Federation Turkey
�0.14
�0.12
�0.10
�0.08
�0.06
�0.04
�0.02
0
0.02
TABLE 2.9Unemployment Rates by Age in Selected Eastern European and FormerSoviet Countries
Females Males
Country 25–54 years 55 years and over 25–54 years 55 years and over
Bulgaria (2000) 14.7 10.8 14.6 12.6Czech Republic (2003) 9.3 5.2 5.0 4.0Estonia (2003) 8.9 5.0 9.7 6.8Hungary (2000) 5.3 1.6 6.3 3.8Latvia (2003) 9.8 6.7 10.0 7.8Lithuania (2003) 10.6 11.6 11.8 10.0Poland (2003) 18.3 8.1 16.5 9.8Romania (2003) 5.8 0.9 6.7 2.5Slovak Republic (2003) 15.7 9.7 14.4 14.2Turkey (2003) 8.1 0.9 8.9 3.7
Source: van Ours 2006, based on ILO Key Indicators of the Labor Market database.
chaw_073-116_ch02.qxd 5/30/07 5:27 PM Page 91
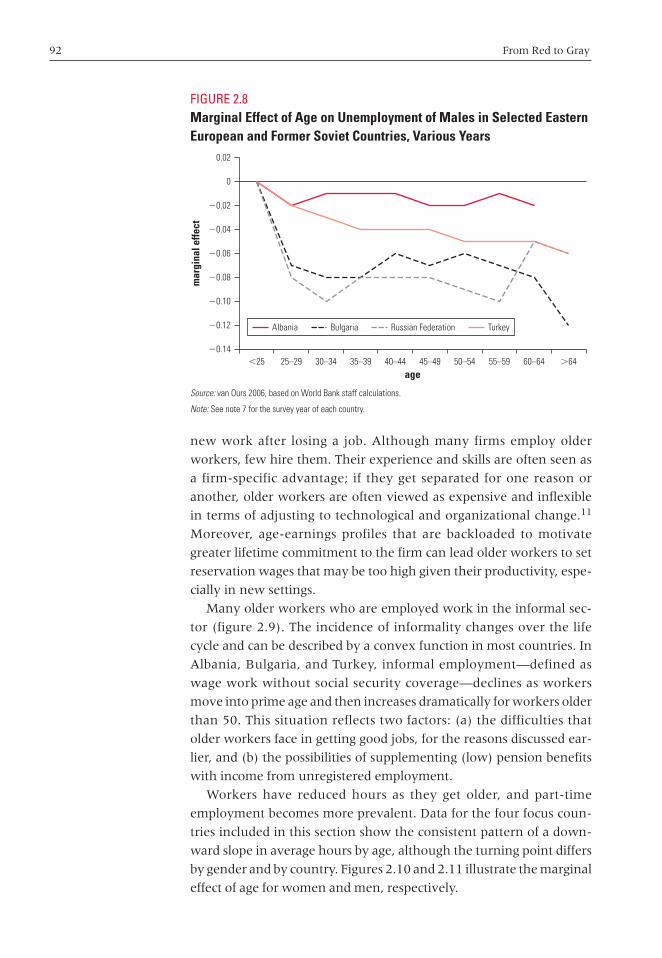
92 From Red to Gray
new work after losing a job. Although many firms employ older
workers, few hire them. Their experience and skills are often seen as
a firm-specific advantage; if they get separated for one reason or
another, older workers are often viewed as expensive and inflexible
in terms of adjusting to technological and organizational change.11
Moreover, age-earnings profiles that are backloaded to motivate
greater lifetime commitment to the firm can lead older workers to set
reservation wages that may be too high given their productivity, espe-
cially in new settings.
Many older workers who are employed work in the informal sec-
tor (figure 2.9). The incidence of informality changes over the life
cycle and can be described by a convex function in most countries. In
Albania, Bulgaria, and Turkey, informal employment—defined as
wage work without social security coverage—declines as workers
move into prime age and then increases dramatically for workers older
than 50. This situation reflects two factors: (a) the difficulties that
older workers face in getting good jobs, for the reasons discussed ear-
lier, and (b) the possibilities of supplementing (low) pension benefits
with income from unregistered employment.
Workers have reduced hours as they get older, and part-time
employment becomes more prevalent. Data for the four focus coun-
tries included in this section show the consistent pattern of a down-
ward slope in average hours by age, although the turning point differs
by gender and by country. Figures 2.10 and 2.11 illustrate the marginal
effect of age for women and men, respectively.
FIGURE 2.8Marginal Effect of Age on Unemployment of Males in Selected EasternEuropean and Former Soviet Countries, Various Years
Source: van Ours 2006, based on World Bank staff calculations.
Note: See note 7 for the survey year of each country.
age
mar
gina
l effe
ct
�25 25–29 30–34 35–39 40–44 45–49 50–54 55–59 60–64 �64
Albania Bulgaria Russian Federation Turkey
�0.14
�0.12
�0.10
�0.08
�0.06
�0.04
�0.02
0
0.02
chaw_073-116_ch02.qxd 5/30/07 5:27 PM Page 92
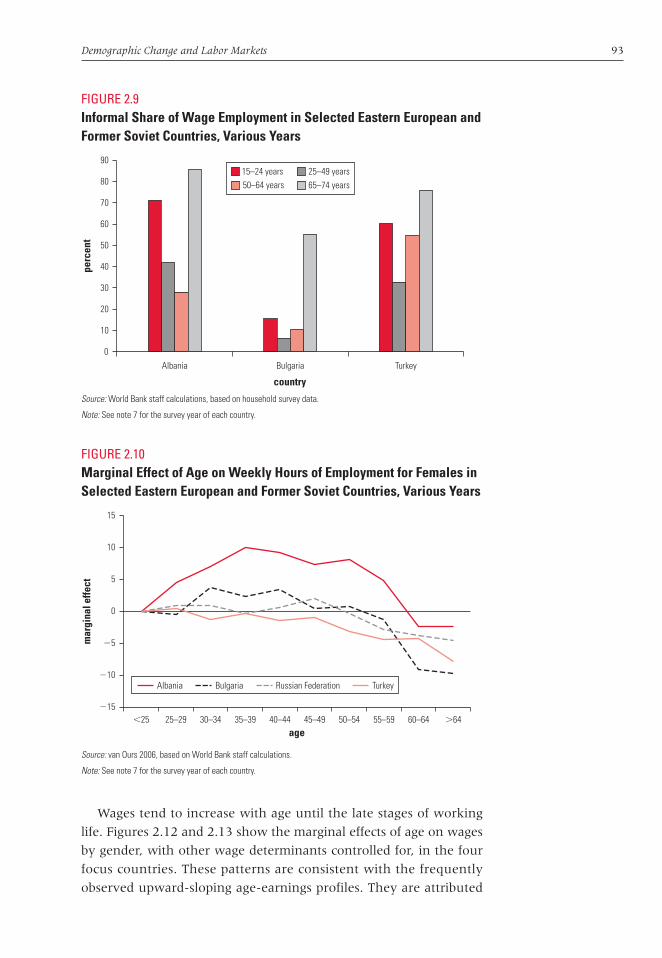
Demographic Change and Labor Markets 93
Wages tend to increase with age until the late stages of working
life. Figures 2.12 and 2.13 show the marginal effects of age on wages
by gender, with other wage determinants controlled for, in the four
focus countries. These patterns are consistent with the frequently
observed upward-sloping age-earnings profiles. They are attributed
FIGURE 2.10Marginal Effect of Age on Weekly Hours of Employment for Females inSelected Eastern European and Former Soviet Countries, Various Years
Source: van Ours 2006, based on World Bank staff calculations.
Note: See note 7 for the survey year of each country.
age
mar
gina
l effe
ct
�25 25–29 30–34 35–39 40–44 45–49 50–54 55–59 60–64 �64
Albania Bulgaria Russian Federation Turkey
�15
�10
�5
10
5
0
15
FIGURE 2.9Informal Share of Wage Employment in Selected Eastern European andFormer Soviet Countries, Various Years
Source: World Bank staff calculations, based on household survey data.
Note: See note 7 for the survey year of each country.
country
perc
ent
Albania Bulgaria Turkey
0
10
20
30
40
50
60
70
80
9015–24 years 25–49 years50–64 years 65–74 years
chaw_073-116_ch02.qxd 5/30/07 5:27 PM Page 93

94 From Red to Gray
FIGURE 2.11Marginal Effect of Age on Weekly Hours of Employment for Males inSelected Eastern European and Former Soviet Countries, Various Years
Source: van Ours 2006, based on World Bank staff calculations.
Note: See note 7 for the survey year of each country.
�15
�10
�5
0
5
�25 25–29 30–34 35–39 40–44 45–49 50–54 55–59 60–64 �64
mar
gina
l effe
ct
age
Albania Bulgaria Russian Federation Turkey
FIGURE 2.12Marginal Effect of Age on Wages for Females in Selected EasternEuropean and Former Soviet Countries, Various Years
Source: van Ours 2006, based on World Bank staff calculations.
Note: See note 7 for the survey year of each country.
�0.2
0
0.2
0.4
0.6
�25 25–29 30–34 40–4435–39 45–49 50–54 55–59 60–64 �64
mar
gina
l effe
ct
age
Albania Bulgaria Russian Federation Turkey
primarily to the long-term relationships between workers and firms
noted earlier, in which workers are initially underpaid (below the
value of their marginal productivity) but are eventually overpaid. It
also reflects selective attrition from the labor force, as less productive
workers exit earlier.
chaw_073-116_ch02.qxd 5/30/07 5:27 PM Page 94
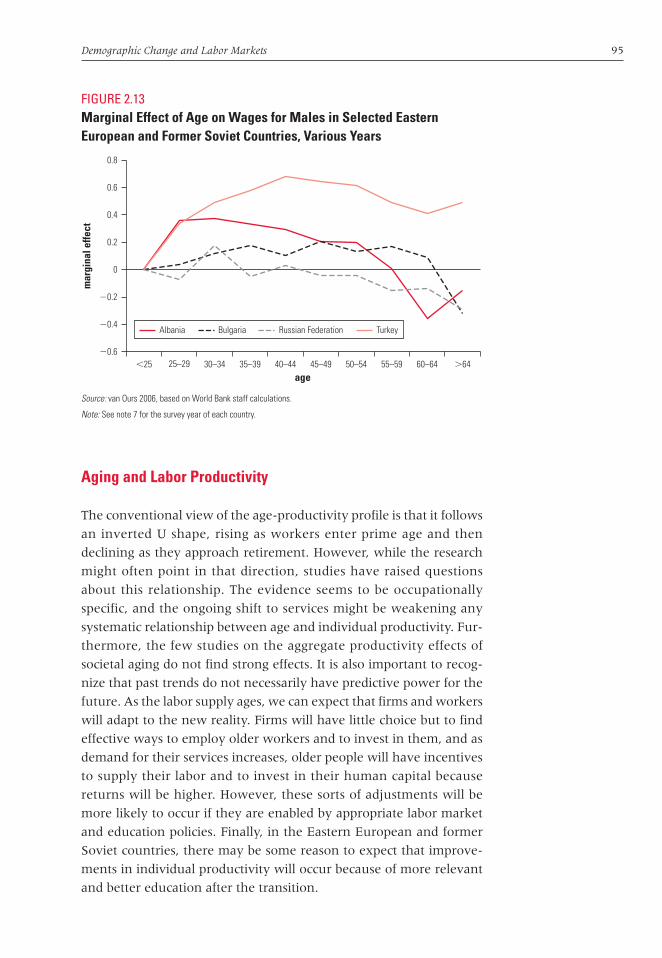
Demographic Change and Labor Markets 95
Aging and Labor Productivity
The conventional view of the age-productivity profile is that it follows
an inverted U shape, rising as workers enter prime age and then
declining as they approach retirement. However, while the research
might often point in that direction, studies have raised questions
about this relationship. The evidence seems to be occupationally
specific, and the ongoing shift to services might be weakening any
systematic relationship between age and individual productivity. Fur-
thermore, the few studies on the aggregate productivity effects of
societal aging do not find strong effects. It is also important to recog-
nize that past trends do not necessarily have predictive power for the
future. As the labor supply ages, we can expect that firms and workers
will adapt to the new reality. Firms will have little choice but to find
effective ways to employ older workers and to invest in them, and as
demand for their services increases, older people will have incentives
to supply their labor and to invest in their human capital because
returns will be higher. However, these sorts of adjustments will be
more likely to occur if they are enabled by appropriate labor market
and education policies. Finally, in the Eastern European and former
Soviet countries, there may be some reason to expect that improve-
ments in individual productivity will occur because of more relevant
and better education after the transition.
FIGURE 2.13Marginal Effect of Age on Wages for Males in Selected EasternEuropean and Former Soviet Countries, Various Years
Source: van Ours 2006, based on World Bank staff calculations.
Note: See note 7 for the survey year of each country.
�0.6
�0.4
�0.2
0
0.4
0.6
0.2
0.8
�25 25–29 30–34 35–39 40–44 45–49 50–54 55–59 60–64 �64
mar
gina
l effe
ct
age
Albania Bulgaria Russian Federation Turkey
chaw_073-116_ch02.qxd 5/30/07 5:27 PM Page 95

96 From Red to Gray
How Productivity Changes as Workers Age
The concave relationship between age and individual productivity is
not as indisputable as some studies claim. A number of gerontological
and psychological studies present direct measures of job performance
and conclude that there is no significant overall difference in the
job performance of older and younger workers (OECD 1998). Most
studies have found that variations within an age group far exceed
the average differences between age groups. In fact, it is difficult to
generalize about the relationship between aging and productivity,
because skill requirements and individual capacities are so diverse
(boxes 2.1 and 2.2). The exact relationship depends very much on the
nature of the work—the education level, the complexity of the work,
and physical demands. Productivity declines at older ages seem to be
particularly strong for work tasks where problem solving, learning,
and speed are needed, but in jobs where experience and verbal abili-
ties are important, older individuals maintain a relatively high pro-
ductivity level.
Ongoing economic changes raise additional considerations. Tech-
nological and organizational innovation and the economic shift from
manufacturing to services are causing job requirements to change.
As a result, the weight of the different factors determining individual
productivity—physical abilities, mental abilities, education, and job
experience—are changing as well. How these changes will affect the
relative productivity of different age groups is uncertain. On the one
hand, older workers might be better off because physical abilities
are becoming less important. On the other hand, continuously chang-
ing types of work can mean that being able to absorb new informa-
tion is becoming increasingly important relative to having long
experience.
Innovative management practices, tailored to maximize the contri-
butions of a diverse workforce, will be important in determining the
future productivity of older employees. A critical element will be how
well training practices are adapted to help older workers realize their
potential. Even if aging typically does not reduce the ability of workers
to perform familiar job tasks, a declining ability to adapt to changing
skill requirements will tend to lower their productive contribution
over time. A number of studies suggest that training for older workers
may need to take place at a slower pace, be more closely tied to the
work context, and involve self-directed learning rather than formal
classroom training (OECD 2006).
The limited evidence available suggests that older workers who
have adequate educational attainment and a history of participation
in on-the-job training are good training prospects. Targeted training
chaw_073-116_ch02.qxd 5/30/07 5:27 PM Page 96
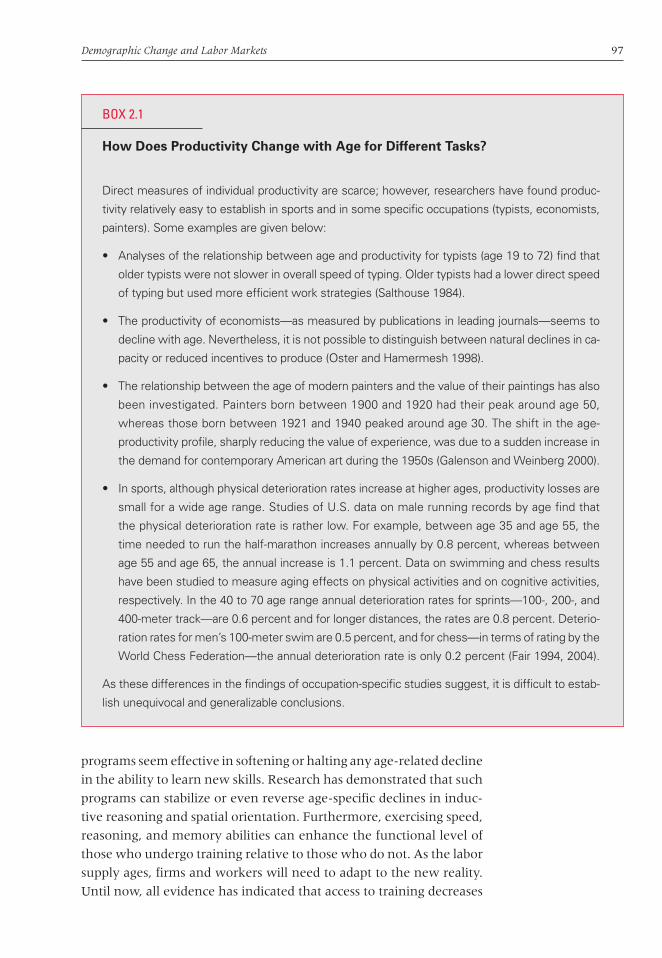
Demographic Change and Labor Markets 97
programs seem effective in softening or halting any age-related decline
in the ability to learn new skills. Research has demonstrated that such
programs can stabilize or even reverse age-specific declines in induc-
tive reasoning and spatial orientation. Furthermore, exercising speed,
reasoning, and memory abilities can enhance the functional level of
those who undergo training relative to those who do not. As the labor
supply ages, firms and workers will need to adapt to the new reality.
Until now, all evidence has indicated that access to training decreases
BOX 2.1
How Does Productivity Change with Age for Different Tasks?
Direct measures of individual productivity are scarce; however, researchers have found produc-
tivity relatively easy to establish in sports and in some specific occupations (typists, economists,
painters). Some examples are given below:
• Analyses of the relationship between age and productivity for typists (age 19 to 72) find that
older typists were not slower in overall speed of typing. Older typists had a lower direct speed
of typing but used more efficient work strategies (Salthouse 1984).
• The productivity of economists—as measured by publications in leading journals—seems to
decline with age. Nevertheless, it is not possible to distinguish between natural declines in ca-
pacity or reduced incentives to produce (Oster and Hamermesh 1998).
• The relationship between the age of modern painters and the value of their paintings has also
been investigated. Painters born between 1900 and 1920 had their peak around age 50,
whereas those born between 1921 and 1940 peaked around age 30. The shift in the age-
productivity profile, sharply reducing the value of experience, was due to a sudden increase in
the demand for contemporary American art during the 1950s (Galenson and Weinberg 2000).
• In sports, although physical deterioration rates increase at higher ages, productivity losses are
small for a wide age range. Studies of U.S. data on male running records by age find that
the physical deterioration rate is rather low. For example, between age 35 and age 55, the
time needed to run the half-marathon increases annually by 0.8 percent, whereas between
age 55 and age 65, the annual increase is 1.1 percent. Data on swimming and chess results
have been studied to measure aging effects on physical activities and on cognitive activities,
respectively. In the 40 to 70 age range annual deterioration rates for sprints—100-, 200-, and
400-meter track—are 0.6 percent and for longer distances, the rates are 0.8 percent. Deterio-
ration rates for men’s 100-meter swim are 0.5 percent, and for chess—in terms of rating by the
World Chess Federation—the annual deterioration rate is only 0.2 percent (Fair 1994, 2004).
As these differences in the findings of occupation-specific studies suggest, it is difficult to estab-
lish unequivocal and generalizable conclusions.
chaw_073-116_ch02.qxd 5/30/07 5:27 PM Page 97

98 From Red to Gray
substantially through one’s working life. In the future, firms will have
no choice but to expand their training programs to invest more in
older employees and to reorient the programs to meet the needs of
those workers.
It needs to be acknowledged that employers do seem to have
strong opinions about the productivity of older workers even if the
objective relationship is not so clear. Remery and others (2003) find
that the higher the share of older workers in the firm, the less favor-
ably employers actually consider older workers. About 40 percent of
the employers surveyed indicated that they do not consider recruiting
older workers, even when facing staff shortages. However, any such
negative views held by employers in aging countries in the region will
have to be moderated because of the demographic reality.
BOX 2.2
What Do Wage Trends Tell Us about How Productivity Changes with Age?
To the extent that earnings reflect productivity, age-earnings profiles can provide some insights
into age-productivity effects. Unfortunately, this area is difficult to investigate empirically be-
cause of the lack of precise measures of individual productivity as well as wage determinants
that are unrelated to productivity.
Empirical research shows mixed results regarding the relationship between earnings, produc-
tivity, and aging. Some studies find that, for prime-age workers and older workers, productivity
and earnings rise at the same rate over the life cycle. This evidence is consistent with economic
models in which wages rise in accordance with productivity. However, other studies using
matched worker-firm data find opposite results—that is, that older workers are relatively over-
paid. Although the age profile of wages has a concave pattern, the age profile of productivity
stops rising (and even decreases) after some experience level. A third line of evidence suggests
that, even if there is such divergence, the effects are small, and aging of the labor force will not
lead to a dramatic increase in unit labor costs.
Ultimately, using age-earnings profiles to assess the effects of aging on productivity is of limited
use because many factors other than productivity come into play in determining how firms pay
workers over their working lives. In the common lifetime pattern, firms pay younger workers
below their productivity and then pay them above their productivity at older ages. They do so
both to protect against initial uncertainty about worker quality and to strengthen lifetime work
effort. Furthermore, this profile can encourage loyalty because younger workers know that their
lifetime compensation from the firm is backloaded.
chaw_073-116_ch02.qxd 5/30/07 5:27 PM Page 98
Demographic Change and Labor Markets 99
Several studies have looked at how individual productivity changes
with age; very few have investigated the effects of societal aging on
aggregate labor productivity. This may be an important question
because any conclusions about individual effects cannot be automat-
ically presumed to apply collectively. In fact, even if older workers do
have lower productivity, the aggregate productivity impact will also
be affected by what happens to proportions of young and prime-age
workers. In many aging countries, the share of prime-age (most pro-
ductive) workers will remain relatively constant, and changes will
occur in the shares of young and old workers, with little impact on
overall productivity. Indeed, the limited research on this issue con-
cludes that the impact of changing age distributions on productivity is
not very significant (Blanchet 1993; Börsch-Supan 2003; Klevmarken
1993).
An important factor in determining the aggregate productivity
effects of an aging population will be the substitutability of workers
of different ages. Until now, especially in Eastern Europe and the for-
mer Soviet Union, this debate has largely centered on the idea that
the old should make room for the young. An important new ques-
tion, then, is whether older workers induced to retire later are good
substitutes for younger workers. There are reasons to be concerned
about this substitutability. One is structural: older workers have been
concentrated in industrial occupations and in big firms, whereas
new jobs tend to be concentrated in service sector occupations and
smaller firms. However, it is difficult to draw firm conclusions
because not much is known about labor substitutability across age
groups.12
Human Capital Accumulation after the Transition:
Does It Matter for Productivity?
One issue unique to the region is whether any productivity concerns
raised by aging might be mitigated because of potential productivity
gains embodied in younger workers who accumulated their human
capital after the transition. Workers who received their education and
early labor force experience in a planned economy will largely have
moved out of the labor force by 2020. Labor forces throughout the
region then will be composed only of workers who accumulated their
human capital after the transition. This situation raises the question of
whether this shift will provide a productivity boost in itself, because of
the possibly lower returns to pretransition human capital in a market
economy.
chaw_073-116_ch02.qxd 5/30/07 5:27 PM Page 99
100 From Red to Gray
There is evidence of increasing returns to education in transition
countries. Under central planning, returns to schooling were tradition-
ally low, and differences in educational attainment had limited impact
on individual variations in earnings. Labor market liberalization,
decentralized wage setting, and the transition to a market economy
in general should thus lead to an increase in wage differ entials. The
empirical literature on returns to schooling in transition countries has
focused mostly on Bulgaria, the Czech Republic, Hungary, Poland, and
Russia (Flabbi, Paternostro, and Tiongson 2007; Kertesi and Kollo
2001; Yemtsov, Cnobloch, and Mete 2006). Indeed, both country-
specific and cross-country studies find that returns to education have
increased, albeit slightly, since the transition.
In transition countries, an additional question is whether the tim-
ing of human capital accumulation matters. To answer this question,
we looked at different cohorts to compare the returns to socialist and
posttransition skills and experience. We compared two cohorts: those
individuals born between 1955 and 1965, who would have completed
their education or started working before the transition, and those
born between 1975–1980, who would have either completed their
studies or entered the labor market after the transition. The hypothesis
that we tested is that skills and experience acquired under the planned-
economy system (by the older cohort) are less appropriate and less well
rewarded in the new market environment than human capital
acquired during and after the transition (by the young cohort). To test
this hypothesis, we calculated returns to education and experience for
different cohorts in Belarus, Bulgaria, Georgia, Hungary, Moldova,
Poland, Romania, and Russia (box 2.3 describes the methodology).
Estimation results show that rates of return to education are higher
for the younger cohort in five of the countries and lower in three. In
most cases, differences are relatively small (figure 2.14). However, cer-
tain methodological challenges arise in properly testing these cohort
effects. Overall, they likely lead to an underestimation of the true
returns to education for young workers and, accordingly, of the pre-
mium for posttransition human capital accumulation. Most obviously,
not enough time has passed since the transition to fully capture returns
for the posttransition group beyond their first years in the labor mar-
ket. Young people often start their careers in low-wage sectors; many
presumably move into higher-wage sectors as they accumulate expe-
rience. We have already seen that informal employment—defined as
wage workers who lack social security coverage—declines in Albania,
Bulgaria, and Turkey as workers move into prime age.13 Institutional
factors also affect the determination of wages by seniority and could
confound the analysis.
chaw_073-116_ch02.qxd 5/30/07 5:27 PM Page 100
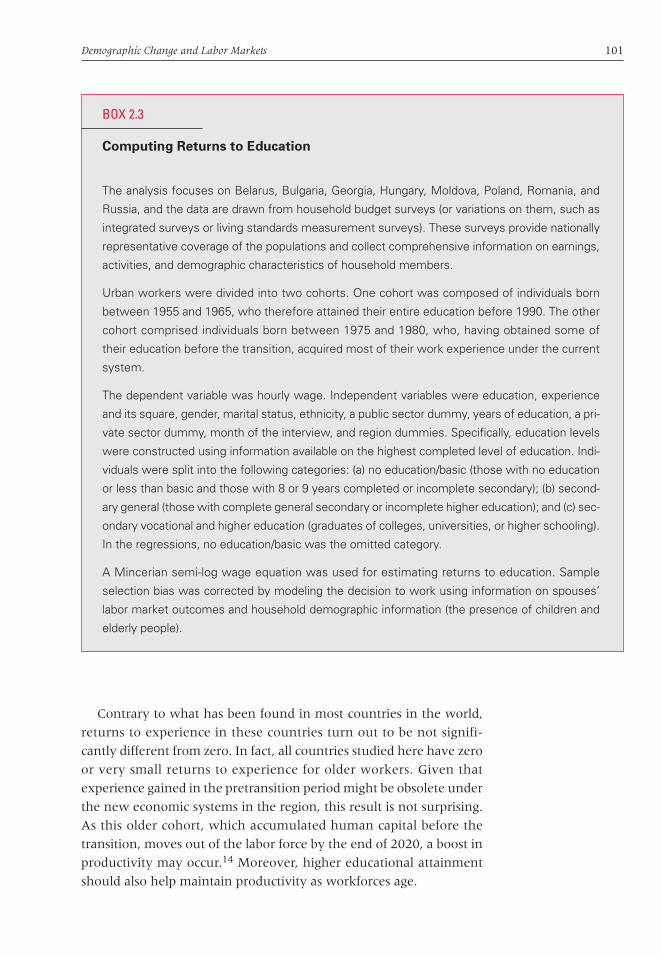
Demographic Change and Labor Markets 101
Contrary to what has been found in most countries in the world,
returns to experience in these countries turn out to be not signifi-
cantly different from zero. In fact, all countries studied here have zero
or very small returns to experience for older workers. Given that
experience gained in the pretransition period might be obsolete under
the new economic systems in the region, this result is not surprising.
As this older cohort, which accumulated human capital before the
transition, moves out of the labor force by the end of 2020, a boost in
productivity may occur.14 Moreover, higher educational attainment
should also help maintain productivity as workforces age.
BOX 2.3
Computing Returns to Education
The analysis focuses on Belarus, Bulgaria, Georgia, Hungary, Moldova, Poland, Romania, and
Russia, and the data are drawn from household budget surveys (or variations on them, such as
integrated surveys or living standards measurement surveys). These surveys provide nationally
representative coverage of the populations and collect comprehensive information on earnings,
activities, and demographic characteristics of household members.
Urban workers were divided into two cohorts. One cohort was composed of individuals born
between 1955 and 1965, who therefore attained their entire education before 1990. The other
cohort comprised individuals born between 1975 and 1980, who, having obtained some of
their education before the transition, acquired most of their work experience under the current
system.
The dependent variable was hourly wage. Independent variables were education, experience
and its square, gender, marital status, ethnicity, a public sector dummy, years of education, a pri-
vate sector dummy, month of the interview, and region dummies. Specifically, education levels
were constructed using information available on the highest completed level of education. Indi-
viduals were split into the following categories: (a) no education/basic (those with no education
or less than basic and those with 8 or 9 years completed or incomplete secondary); (b) second-
ary general (those with complete general secondary or incomplete higher education); and (c) sec-
ondary vocational and higher education (graduates of colleges, universities, or higher schooling).
In the regressions, no education/basic was the omitted category.
A Mincerian semi-log wage equation was used for estimating returns to education. Sample
selection bias was corrected by modeling the decision to work using information on spouses’
labor market outcomes and household demographic information (the presence of children and
elderly people).
chaw_073-116_ch02.qxd 5/30/07 5:27 PM Page 101

102 From Red to Gray
Policy Implications
The conventional wisdom is that aging societies will face difficult
challenges because labor supplies will shrink and labor productivity
will fall. In the Eastern European and former Soviet countries, these
concerns are heightened because the region already has low levels of
labor force participation and because aging countries in the region
have fewer financial resources than other graying societies for miti-
gating any negative consequences. However, the story is actually
more complex and less demographically deterministic than suggested
by the conventional wisdom. Current rates of labor force participa-
tion are low by international standards throughout much of the
region, in part because of early retirement but also because of rela-
tively low participation rates for other age groups. Thus, there is scope
for increasing the labor supply by bringing participation rates up.
Moreover, not all countries in the region are aging and there is scope
for increasing labor supply in older countries through intraregional
migration. Although concerns do exist about falling productivity with
aging, the evidence is far from conclusive.
There are valid reasons to conclude that demographic trends in
the region do not inevitably imply serious problems for the labor
market. Yet an unfavorable scenario may come true if policy makers
FIGURE 2.14Returns to Years of Education for Older and Younger Cohorts inSelected Countries
Source: World Bank staff calculations, based on household survey data.
older younger
0
0.08
0.10
0.06
0.04
0.02
0.12
Belarus
Bulgari
a
Georgi
a
Moldova
Roman
ia
Russian
Federa
tion
Polan
d
Hunga
ry
country
rate
of r
etur
n
chaw_073-116_ch02.qxd 5/30/07 5:27 PM Page 102
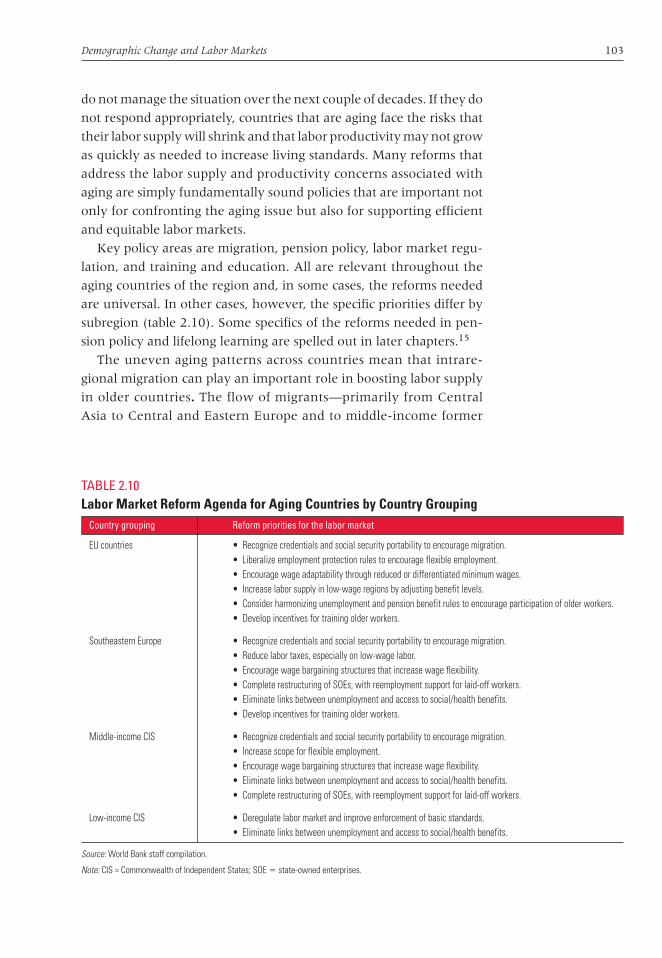
Demographic Change and Labor Markets 103
do not manage the situation over the next couple of decades. If they do
not respond appropriately, countries that are aging face the risks that
their labor supply will shrink and that labor productivity may not grow
as quickly as needed to increase living standards. Many reforms that
address the labor supply and productivity concerns associated with
aging are simply fundamentally sound policies that are important not
only for confronting the aging issue but also for supporting efficient
and equitable labor markets.
Key policy areas are migration, pension policy, labor market regu-
lation, and training and education. All are relevant throughout the
aging countries of the region and, in some cases, the reforms needed
are universal. In other cases, however, the specific priorities differ by
subregion (table 2.10). Some specifics of the reforms needed in pen-
sion policy and lifelong learning are spelled out in later chapters.15
The uneven aging patterns across countries mean that intrare-
gional migration can play an important role in boosting labor supply
in older countries. The flow of migrants—primarily from Central
Asia to Central and Eastern Europe and to middle-income former
TABLE 2.10Labor Market Reform Agenda for Aging Countries by Country Grouping
Country grouping Reform priorities for the labor market
EU countries • Recognize credentials and social security portability to encourage migration.• Liberalize employment protection rules to encourage flexible employment.• Encourage wage adaptability through reduced or differentiated minimum wages.• Increase labor supply in low-wage regions by adjusting benefit levels.• Consider harmonizing unemployment and pension benefit rules to encourage participation of older workers.• Develop incentives for training older workers.
Southeastern Europe • Recognize credentials and social security portability to encourage migration.• Reduce labor taxes, especially on low-wage labor.• Encourage wage bargaining structures that increase wage flexibility.• Complete restructuring of SOEs, with reemployment support for laid-off workers.• Eliminate links between unemployment and access to social/health benefits.• Develop incentives for training older workers.
Middle-income CIS • Recognize credentials and social security portability to encourage migration.• Increase scope for flexible employment.• Encourage wage bargaining structures that increase wage flexibility.• Eliminate links between unemployment and access to social/health benefits.• Complete restructuring of SOEs, with reemployment support for laid-off workers.
Low-income CIS • Deregulate labor market and improve enforcement of basic standards.• Eliminate links between unemployment and access to social/health benefits.
Source: World Bank staff compilation.
Note: CIS = Commonwealth of Independent States; SOE � state-owned enterprises.
chaw_073-116_ch02.qxd 5/30/07 5:27 PM Page 103
104 From Red to Gray
Soviet countries—could be an important source of income for the
sending countries while meeting the labor needs of the receiving
ones. An effective framework for regulating both temporary and
permanent migration will make this process more efficient and
equitable.
The other channel for increasing labor supply is through greater
labor force participation. The most obvious goal here is to increase
participation rates for older people, primarily by delaying their exit
from the labor force. Social security rules are critical here (see chap-
ter 4). Also, as the region’s huge restructuring endeavor nears com-
pletion, a major reason for early exit from the labor force will diminish
in importance. Older workers who lose their jobs because of privati-
zation and other forms of restructuring often withdraw from the labor
force because they lack reemployment prospects. In many cases, this
withdrawal has been encouraged through extended unemployment
benefits and early-retirement pensions. In the future, governments
will need to remove such incentives for early exit and use income
incentives as well as effective employment programs to encourage
these workers to seek reemployment.
Although increasing the participation of older workers is an obvi-
ous response to the aging of the region, the projections carried out in
this chapter show that, in many countries, greater labor supply gains
can be realized by achieving modest participation increases across the
adult population. One instrument for doing so is reform of labor mar-
ket regulations. Cross-country analysis by the World Bank, the OECD,
and others has consistently shown that more flexible employment
protection rules are associated with higher participation rates. By
reducing the costs of hiring (and firing) and encouraging flexible con-
tracting, these rules can draw more workers into the labor market.
These types of reforms have a particularly positive effect on the par-
ticipation of such groups as women, older people, and younger peo-
ple, who, in most countries, often face barriers to participating in the
labor market.
Policy makers can also address the productivity concerns associ-
ated with aging labor forces. The key instrument in this regard is a
training and education framework that supports lifelong learning.
Such a framework involves many elements. For example, a diversity
of training suppliers, including some from the private sector, must be
encouraged. Standards and information are needed so that workers
can make informed decisions about what investments to make.
Financing instruments, such as income-contingent loans, need to be
made available so that funding is not a binding constraint. Clearly, a
well-functioning labor market that rewards human capital and does
chaw_073-116_ch02.qxd 5/30/07 5:27 PM Page 104

Demographic Change and Labor Markets 105
not discriminate against certain types of workers is necessary for
ensuring adequate returns to investments in lifelong learning.
Annex 2.A: ILO Labor Force Projection Methodologies
Estimates and projections of the total population and its components
by gender and age group are produced by the United Nations popula-
tion Division and those of the economically active population by the
International Labour Organization (ILO).
The parametric form for the basic model is linear but fitted to the
logic of the proportion participating, scaled to fit between the values
ymin and ymax chosen for each age-gender group by the program. Typ-
ically, one value will be historical and one will represent the extreme
long-term assumption. This implies that the participation rate at time
t is then given by
yt � ymin �ymax � ymin
1 � ea�bt
where the parameters a and b are based on fitting the model to the
most recent estimates for an age-gender group within a country and
the projections come from extrapolating t beyond the end of the
estimates. Transparent adjustments (in the sense that they are easily
recorded) can then be made to the default values for ymin and ymax to
ensure a plausible profile across age groups and sensible relationships
between participation rates for men and women.
The program uses information from the most recent 10 windows
of estimates to choose default values for ymin and ymax, with the flex-
ibility for the user to make informed changes to those defaults. The
basic premise is that if the rates for men and women are converging
for a particular age group, this trend will continue. The alternative is
either nonconvergence, based on a constant difference between rates,
or divergence, based on the rate of divergence from the most recent
estimates.
For each age-gender group, the program fits a linear regression to
detect whether the most recent estimates are increasing or decreas-
ing. If the rates are decreasing, the program takes a maximum value
from the historical estimates. If the rates are increasing, the program
takes a minimum value from the historical estimates.
For each age group, a model is fitted to the difference in participa-
tion rates between men and women. This model can detect whether
• The rates are diverging.
• The rates are crossing just before the projection window.
chaw_073-116_ch02.qxd 5/30/07 5:27 PM Page 105

106 From Red to Gray
• The rates will converge quickly during the projection interval (that
is, predict the difference goes to zero within 10 years of the last
estimate).
• The rates will converge slowly during the projection interval.
• The rates are a constant distance apart (that is, the slope parameter
is not significant).
After one of the five scenarios has been selected for the rates for
men and women within each age group, it is then necessary to select
appropriate future values for either ymin or ymax (Vittorelli and others
2006).
The reference period for the estimates is 1980 to 2003; for the pro-
jections, it is 2003 to 2020 (figure 2.A.1). The basic data are single-
year rates of labor force participation by gender and 11 age groups in
FIGURE 2.A.1ILO Estimates and Projections of the Economically Active Population,1980–2020
Source: Vittorelli and others 2006.
Note: LFPR � Labor Force Participation Rate; UN � United Nations.
NationalLFPR data
ILO estimatesLFPR 1980–2003
ILO projectionsLFPR 2003–20
core model
Evaluation and adjustmentLFPR 2020
ILO finalLFPR estimatesand projections
UN populationdata 2004revision
ILOeconomically active population
estimates and projections1980–2020
chaw_073-116_ch02.qxd 5/30/07 5:27 PM Page 106
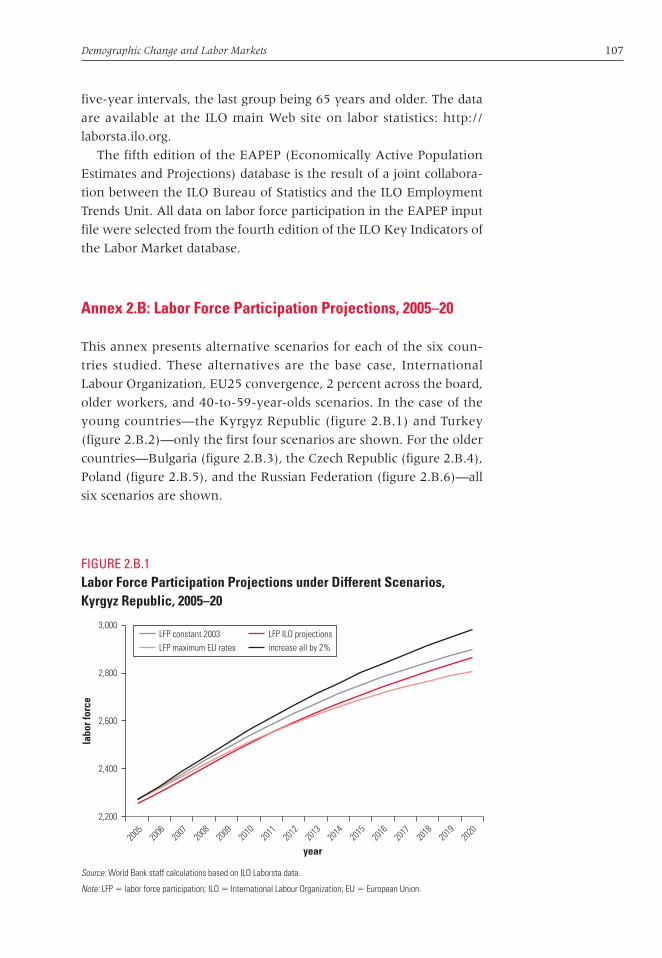
Demographic Change and Labor Markets 107
five-year intervals, the last group being 65 years and older. The data
are available at the ILO main Web site on labor statistics: http://
laborsta.ilo.org.
The fifth edition of the EAPEP (Economically Active Population
Estimates and Projections) database is the result of a joint collabora-
tion between the ILO Bureau of Statistics and the ILO Employment
Trends Unit. All data on labor force participation in the EAPEP input
file were selected from the fourth edition of the ILO Key Indicators of
the Labor Market database.
Annex 2.B: Labor Force Participation Projections, 2005–20
This annex presents alternative scenarios for each of the six coun-
tries studied. These alternatives are the base case, International
Labour Organization, EU25 convergence, 2 percent across the board,
older workers, and 40-to-59-year-olds scenarios. In the case of the
young countries—the Kyrgyz Republic (figure 2.B.1) and Turkey
(figure 2.B.2)—only the first four scenarios are shown. For the older
countries—Bulgaria (figure 2.B.3), the Czech Republic (figure 2.B.4),
Poland (figure 2.B.5), and the Russian Federation (figure 2.B.6)—all
six scenarios are shown.
FIGURE 2.B.1Labor Force Participation Projections under Different Scenarios,Kyrgyz Republic, 2005–20
Source: World Bank staff calculations based on ILO Laborsta data.
Note: LFP � labor force participation; ILO � International Labour Organization; EU � European Union.
LFP constant 2003 LFP ILO projectionsLFP maximum EU rates increase all by 2%
2,200
2,400
2,600
2,800
3,000
2005 20
0620
0720
0820
0920
1020
1120
1220
1320
1420
1520
1620
1720
1820
1920
20
year
labo
r for
ce
chaw_073-116_ch02.qxd 5/30/07 5:27 PM Page 107

108 From Red to Gray
FIGURE 2.B.3Labor Force Participation Projections under Different Scenarios,Bulgaria, 2005–20
Source: World Bank staff calculations based on ILO Laborsta data.
Note: LFP � labor force participation; ILO � International Labour Organization; EU � European Union.
year
2,500
2,700
2,900
3,100
3,300
3,500
2005
2006
2008
2009
2010
2011
2012
2013
2014
2015
2016
2017
2018
2019
2020
2007
LFP constant 2003 LFP ILO projections LFP maximum EU ratesincrease all by 2% increase LFP 40–60 increase LFP 60–64
labo
r for
ce
FIGURE 2.B.2Labor Force Participation Projections under Different Scenarios,Turkey, 2005–20
Source: World Bank staff calculations based on ILO Laborsta data.
Note: LFP � labor force participation; ILO � International Labour Organization; EU � European Union.
24,000
34,000
36,000
32,000
30,000
28,000
26,000
38,000
40,000
42,000
2005
year20
0620
0720
0820
0920
10 2011
2012
2013
2014
2015
2016
2017
2018
2019 20
20
LFP constant 2003 LFP ILO projectionsLFP maximum EU rates increase all by 2%
labo
r for
ce
chaw_073-116_ch02.qxd 5/30/07 5:27 PM Page 108
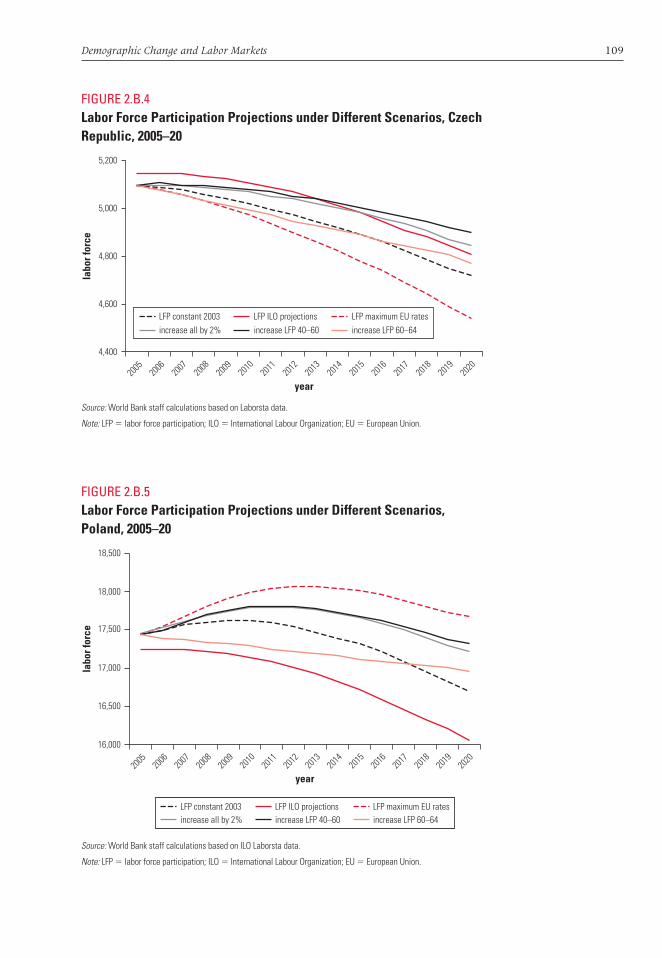
Demographic Change and Labor Markets 109
FIGURE 2.B.4Labor Force Participation Projections under Different Scenarios, CzechRepublic, 2005–20
Source: World Bank staff calculations based on Laborsta data.
Note: LFP � labor force participation; ILO � International Labour Organization; EU � European Union.
LFP constant 2003 LFP ILO projections LFP maximum EU ratesincrease all by 2% increase LFP 40–60 increase LFP 60–64
4,400
4,600
4,800
5,000
5,200
2005 20
0620
0720
0820
0920
1020
1120
1220
1320
1420
1520
1620
1720
1820
1920
20
year
labo
r for
ce
FIGURE 2.B.5Labor Force Participation Projections under Different Scenarios,Poland, 2005–20
Source: World Bank staff calculations based on ILO Laborsta data.
Note: LFP � labor force participation; ILO � International Labour Organization; EU � European Union.
LFP constant 2003 LFP ILO projections LFP maximum EU ratesincrease all by 2% increase LFP 40–60 increase LFP 60–64
16,500
16,000
17,000
17,500
18,000
18,500
2005 20
0620
0720
0820
0920
1020
1120
1220
1320
1420
1520
1620
1720
1820
1920
20
year
labo
r for
ce
chaw_073-116_ch02.qxd 5/30/07 5:27 PM Page 109

110 From Red to Gray
TABLE 2.CChanges in Working-Age Population, 15 to 64 Years, in Eastern Europeand the Former Soviet Union, 2005–20
Relative change (2020 working-age population to total population Absolute change (change in as a ratio of the 2005 working-age number of working-age
Country population to total population) individuals)
Old countriesCzech Republic 0.93 �732.8Slovenia 0.94 �110.9Estonia 0.96 �75.0Poland 0.96 �1,619.0Russian Federation 0.96 �10,751.8Hungary 0.96 �575.0Bulgaria 0.97 �757.5Latvia 0.97 �165.4Slovak Republic 0.97 �143.2Croatia 0.97 �204.5
FIGURE 2.B.6Labor Force Participation Projections under Different Scenarios,Russian, Federation, 2005–20
Source: World Bank staff calculations based on ILO Laborsta data.
Note: LFP � labor force participation; ILO � International Labour Organization; EU � European Union.
LFP constant 2003 LFP ILO projectionsLFP maximum EU ratesincrease LFP 40–60
increase all by 2%increase LFP 60–64
60,000
62,000
64,000
66,000
68,000
70,000
72,000
74,000
2005 20
0620
0720
0820
0920
1020
1120
1220
1320
1420
1520
1620
1720
1820
1920
20
year
labo
r for
ce
Annex 2.C: Changes in Working-Age Population
This annex presents background data (table 2.C) used in projecting
the changes in working-age populations in the Eastern European and
former Soviet Countries from 2005 to 2025.
(continued )
chaw_073-116_ch02.qxd 5/30/07 5:27 PM Page 110
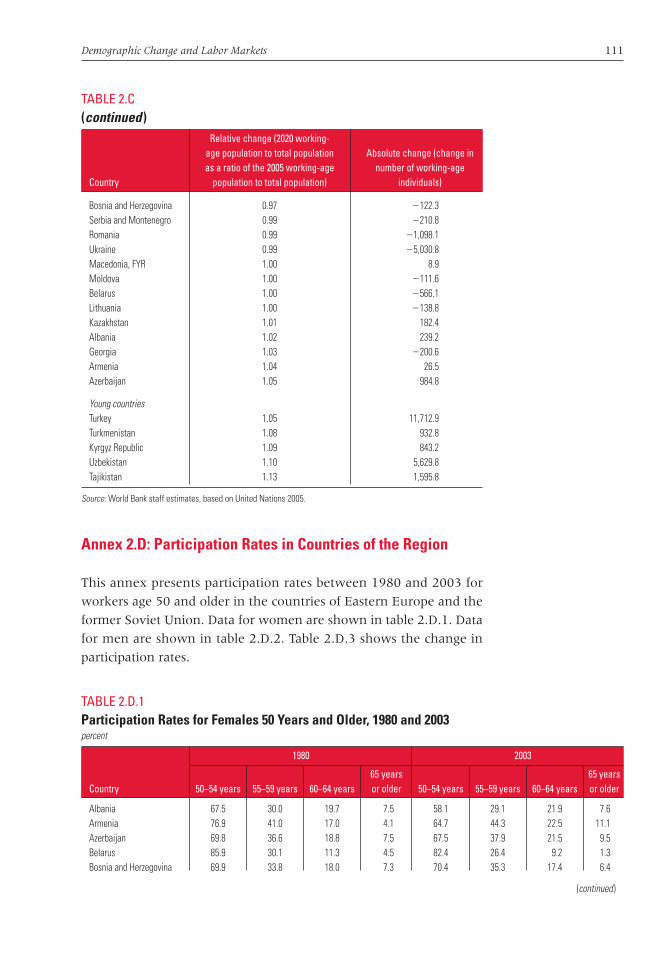
Demographic Change and Labor Markets 111
TABLE 2.C(continued)
Relative change (2020 working-age population to total population Absolute change (change in as a ratio of the 2005 working-age number of working-age
Country population to total population) individuals)
TABLE 2.D.1Participation Rates for Females 50 Years and Older, 1980 and 2003percent
1980 2003
65 years 65 years Country 50–54 years 55–59 years 60–64 years or older 50–54 years 55–59 years 60–64 years or older
Albania 67.5 30.0 19.7 7.5 58.1 29.1 21.9 7.6Armenia 76.9 41.0 17.0 4.1 64.7 44.3 22.5 11.1Azerbaijan 69.8 36.6 18.8 7.5 67.5 37.9 21.5 9.5Belarus 85.9 30.1 11.3 4.5 82.4 26.4 9.2 1.3Bosnia and Herzegovina 69.9 33.8 18.0 7.3 70.4 35.3 17.4 6.4
(continued )
Bosnia and Herzegovina 0.97 �122.3Serbia and Montenegro 0.99 �210.8Romania 0.99 �1,098.1Ukraine 0.99 �5,030.8Macedonia, FYR 1.00 8.9Moldova 1.00 �111.6Belarus 1.00 �566.1Lithuania 1.00 �138.8Kazakhstan 1.01 182.4Albania 1.02 239.2Georgia 1.03 �200.6Armenia 1.04 26.5Azerbaijan 1.05 984.8
Young countriesTurkey 1.05 11,712.9Turkmenistan 1.08 932.8Kyrgyz Republic 1.09 843.2Uzbekistan 1.10 5,629.8Tajikistan 1.13 1,595.8
Source: World Bank staff estimates, based on United Nations 2005.
Annex 2.D: Participation Rates in Countries of the Region
This annex presents participation rates between 1980 and 2003 for
workers age 50 and older in the countries of Eastern Europe and the
former Soviet Union. Data for women are shown in table 2.D.1. Data
for men are shown in table 2.D.2. Table 2.D.3 shows the change in
participation rates.
chaw_073-116_ch02.qxd 5/30/07 5:27 PM Page 111
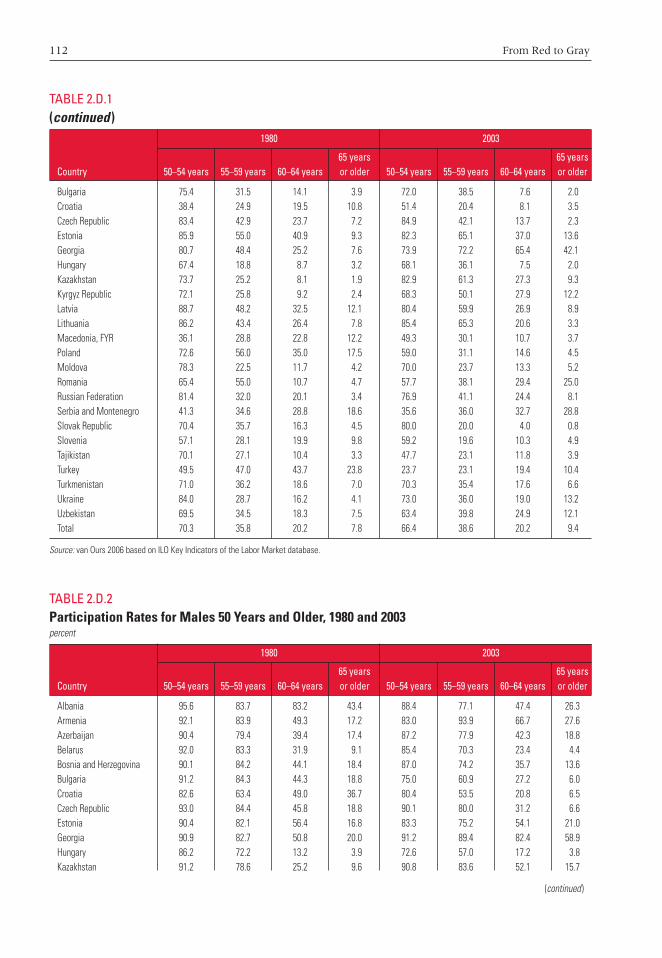
112 From Red to Gray
TABLE 2.D.2Participation Rates for Males 50 Years and Older, 1980 and 2003percent
1980 2003
65 years 65 yearsCountry 50–54 years 55–59 years 60–64 years or older 50–54 years 55–59 years 60–64 years or older
Albania 95.6 83.7 83.2 43.4 88.4 77.1 47.4 26.3Armenia 92.1 83.9 49.3 17.2 83.0 93.9 66.7 27.6Azerbaijan 90.4 79.4 39.4 17.4 87.2 77.9 42.3 18.8Belarus 92.0 83.3 31.9 9.1 85.4 70.3 23.4 4.4Bosnia and Herzegovina 90.1 84.2 44.1 18.4 87.0 74.2 35.7 13.6Bulgaria 91.2 84.3 44.3 18.8 75.0 60.9 27.2 6.0Croatia 82.6 63.4 49.0 36.7 80.4 53.5 20.8 6.5Czech Republic 93.0 84.4 45.8 18.8 90.1 80.0 31.2 6.6Estonia 90.4 82.1 56.4 16.8 83.3 75.2 54.1 21.0Georgia 90.9 82.7 50.8 20.0 91.2 89.4 82.4 58.9Hungary 86.2 72.2 13.2 3.9 72.6 57.0 17.2 3.8Kazakhstan 91.2 78.6 25.2 9.6 90.8 83.6 52.1 15.7
(continued )
TABLE 2.D.1(continued)
1980 2003
65 years 65 years Country 50–54 years 55–59 years 60–64 years or older 50–54 years 55–59 years 60–64 years or older
Bulgaria 75.4 31.5 14.1 3.9 72.0 38.5 7.6 2.0Croatia 38.4 24.9 19.5 10.8 51.4 20.4 8.1 3.5Czech Republic 83.4 42.9 23.7 7.2 84.9 42.1 13.7 2.3Estonia 85.9 55.0 40.9 9.3 82.3 65.1 37.0 13.6Georgia 80.7 48.4 25.2 7.6 73.9 72.2 65.4 42.1Hungary 67.4 18.8 8.7 3.2 68.1 36.1 7.5 2.0Kazakhstan 73.7 25.2 8.1 1.9 82.9 61.3 27.3 9.3Kyrgyz Republic 72.1 25.8 9.2 2.4 68.3 50.1 27.9 12.2Latvia 88.7 48.2 32.5 12.1 80.4 59.9 26.9 8.9Lithuania 86.2 43.4 26.4 7.8 85.4 65.3 20.6 3.3Macedonia, FYR 36.1 28.8 22.8 12.2 49.3 30.1 10.7 3.7Poland 72.6 56.0 35.0 17.5 59.0 31.1 14.6 4.5Moldova 78.3 22.5 11.7 4.2 70.0 23.7 13.3 5.2Romania 65.4 55.0 10.7 4.7 57.7 38.1 29.4 25.0Russian Federation 81.4 32.0 20.1 3.4 76.9 41.1 24.4 8.1Serbia and Montenegro 41.3 34.6 28.8 18.6 35.6 36.0 32.7 28.8Slovak Republic 70.4 35.7 16.3 4.5 80.0 20.0 4.0 0.8Slovenia 57.1 28.1 19.9 9.8 59.2 19.6 10.3 4.9Tajikistan 70.1 27.1 10.4 3.3 47.7 23.1 11.8 3.9Turkey 49.5 47.0 43.7 23.8 23.7 23.1 19.4 10.4Turkmenistan 71.0 36.2 18.6 7.0 70.3 35.4 17.6 6.6Ukraine 84.0 28.7 16.2 4.1 73.0 36.0 19.0 13.2Uzbekistan 69.5 34.5 18.3 7.5 63.4 39.8 24.9 12.1Total 70.3 35.8 20.2 7.8 66.4 38.6 20.2 9.4
Source: van Ours 2006 based on ILO Key Indicators of the Labor Market database.
chaw_073-116_ch02.qxd 5/30/07 5:27 PM Page 112

Demographic Change and Labor Markets 113
TABLE 2.D.3Changes in Participation Rates for Population 50 Years and Older, 1980 and 2003percent
1980 2003
65 years 65 yearsCountry 50–54 years 55–59 years 60–64 years or older 50–54 years 55–59 years 60–64 years or older
Albania �9.4 �0.9 2.2 0.1 �7.2 �6.6 �35.0 �17.1Armenia �12.2 3.3 5.5 7.0 �9.1 10.0 17.4 10.4Azerbaijan �2.3 1.3 2.7 2.0 �3.2 �1.5 2.9 1.4Belarus �3.5 �3.7 �2.1 �3.2 �6.6 �13.0 �8.5 �4.7Bosnia and Herzegovina 0.5 1.5 �0.6 �0.9 �3.1 �10.0 �8.4 �4.8Bulgaria �3.4 7.0 �6.5 �1.9 �16.2 �23.4 �17.1 �12.8Croatia 13.0 �4.5 �11.4 �7.3 �2.2 �9.9 �28.2 �30.2Czech Republic 1.5 �0.8 �10.0 �4.9 �2.9 �4.4 �14.6 �12.2Estonia �3.6 10.1 �3.9 4.3 �7.1 �6.9 �2.3 4.2Georgia �6.8 23.8 40.2 34.5 0.3 6.7 31.6 38.9Hungary 0.7 17.3 �1.2 �1.2 �13.6 �15.2 4.0 �0.1Kazakhstan 9.2 36.1 19.2 7.4 �0.4 5.0 26.9 6.1Kyrgyz Republic �3.8 24.3 18.7 9.8 �4.1 0.0 28.0 18.3Latvia �8.3 11.7 �5.6 �3.2 �8.8 �14.9 �11.3 �5.9Lithuania �0.8 21.9 �5.8 �4.5 �8.6 �9.6 �3.4 �11.4Macedonia, FYR 13.2 1.3 �12.1 �8.5 �8.0 �6.9 �24.4 �32.3Moldova �8.3 1.2 1.6 1.0 �4.5 �0.8 5.3 0.8
TABLE 2.D.2(continued)
1980 2003
65 years 65 yearsCountry 50–54 years 55–59 years 60–64 years or older 50–54 years 55–59 years 60–64 years or older
Kyrgyz Republic 90.6 80.9 27.2 7.2 86.5 80.9 55.2 25.5Latvia 92.6 86.6 53.5 22.3 83.8 71.7 42.2 16.4Lithuania 93.9 88.6 48.3 19.7 85.3 79.0 44.9 8.3Macedonia, FYR 88.8 73.9 59.8 39.5 80.8 67.0 35.4 7.2Moldova 93.3 87.5 31.0 12.2 88.8 86.7 36.3 13.0Poland 87.3 82.0 58.0 30.0 71.0 52.4 27.0 9.0Romania 86.7 71.2 22.4 5.5 75.5 54.4 34.9 31.5Russian Federation 90.6 78.0 38.9 15.1 84.6 64.0 37.9 14.5Serbia and Montenegro 82.5 60.1 38.9 28.9 77.1 54.0 42.6 36.8Slovak Republic 92.4 84.3 47.3 20.0 88.9 77.5 12.5 2.0Slovenia 81.4 59.2 31.4 19.3 80.5 48.1 18.0 9.7Tajikistan 95.2 88.2 36.2 9.7 83.5 78.9 29.1 7.5Turkey 86.0 78.8 69.1 44.3 65.5 50.8 42.6 25.3Turkmenistan 90.3 78.7 38.4 16.5 87.0 74.4 36.0 13.8Ukraine 88.9 78.9 43.3 14.0 79.2 67.3 29.9 18.3Uzbekistan 90.2 83.5 43.5 18.5 85.7 81.2 48.3 23.5Total 89.9 79.4 43.6 19.7 82.8 70.8 38.3 16.8
Source: van Ours 2006 based on ILO Key Indicators of the Labor Market database.
(continued )
chaw_073-116_ch02.qxd 5/30/07 5:27 PM Page 113
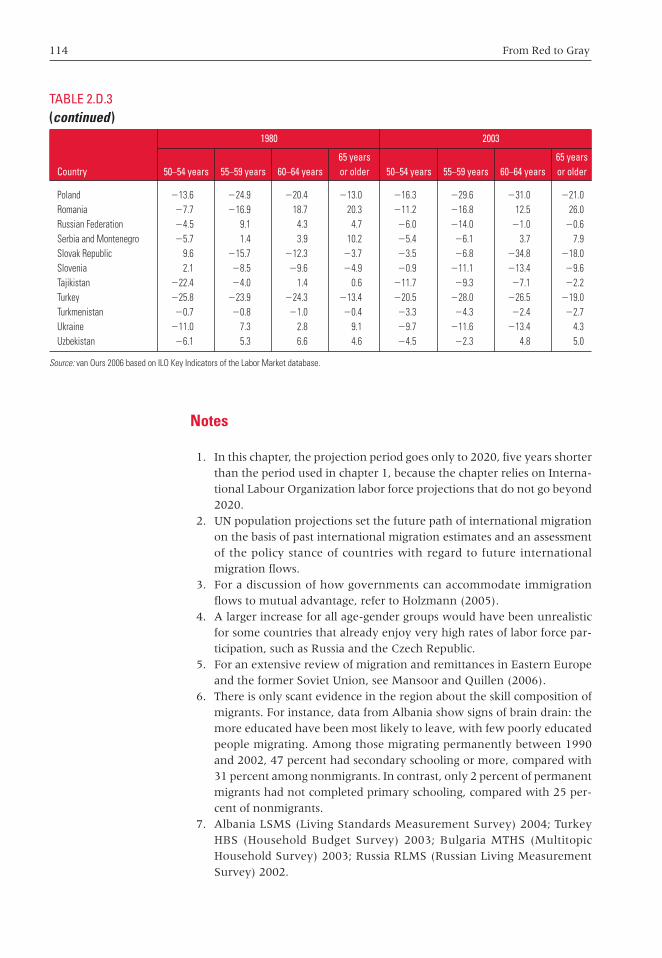
114 From Red to Gray
Notes
1. In this chapter, the projection period goes only to 2020, five years shorterthan the period used in chapter 1, because the chapter relies on Interna-tional Labour Organization labor force projections that do not go beyond2020.
2. UN population projections set the future path of international migrationon the basis of past international migration estimates and an assessmentof the policy stance of countries with regard to future internationalmigration flows.
3. For a discussion of how governments can accommodate immigrationflows to mutual advantage, refer to Holzmann (2005).
4. A larger increase for all age-gender groups would have been unrealisticfor some countries that already enjoy very high rates of labor force par-ticipation, such as Russia and the Czech Republic.
5. For an extensive review of migration and remittances in Eastern Europeand the former Soviet Union, see Mansoor and Quillen (2006).
6. There is only scant evidence in the region about the skill composition ofmigrants. For instance, data from Albania show signs of brain drain: themore educated have been most likely to leave, with few poorly educatedpeople migrating. Among those migrating permanently between 1990and 2002, 47 percent had secondary schooling or more, compared with31 percent among nonmigrants. In contrast, only 2 percent of permanentmigrants had not completed primary schooling, compared with 25 per-cent of nonmigrants.
7. Albania LSMS (Living Standards Measurement Survey) 2004; TurkeyHBS (Household Budget Survey) 2003; Bulgaria MTHS (MultitopicHousehold Survey) 2003; Russia RLMS (Russian Living MeasurementSurvey) 2002.
TABLE 2.D.3(continued)
1980 2003
65 years 65 yearsCountry 50–54 years 55–59 years 60–64 years or older 50–54 years 55–59 years 60–64 years or older
Poland �13.6 �24.9 �20.4 �13.0 �16.3 �29.6 �31.0 �21.0Romania �7.7 �16.9 18.7 20.3 �11.2 �16.8 12.5 26.0Russian Federation �4.5 9.1 4.3 4.7 �6.0 �14.0 �1.0 �0.6Serbia and Montenegro �5.7 1.4 3.9 10.2 �5.4 �6.1 3.7 7.9Slovak Republic 9.6 �15.7 �12.3 �3.7 �3.5 �6.8 �34.8 �18.0Slovenia 2.1 �8.5 �9.6 �4.9 �0.9 �11.1 �13.4 �9.6Tajikistan �22.4 �4.0 1.4 0.6 �11.7 �9.3 �7.1 �2.2Turkey �25.8 �23.9 �24.3 �13.4 �20.5 �28.0 �26.5 �19.0Turkmenistan �0.7 �0.8 �1.0 �0.4 �3.3 �4.3 �2.4 �2.7Ukraine �11.0 7.3 2.8 9.1 �9.7 �11.6 �13.4 4.3Uzbekistan �6.1 5.3 6.6 4.6 �4.5 �2.3 4.8 5.0
Source: van Ours 2006 based on ILO Key Indicators of the Labor Market database.
chaw_073-116_ch02.qxd 5/30/07 5:27 PM Page 114
Demographic Change and Labor Markets 115
8. The five countries included in these calculations are the Czech Republic,Hungary, Poland, the Slovak Republic, and Turkey. Note that, comparedwith the means in the region, these countries for the most part havebelow-average participation rates for older men but above-average ratesfor older women.
9. These data are shown in annex 2.D.10. The following explanatory variables are included: number of children,
marital status, years of education and years of education squared, num-ber of adults in the family, urban-rural location, and dummy variablesfor five-year age groups. For more details, see van Ours (2006).
11. The literature on this topic is summarized in van Ours (2006).12. Prskawetz, Fent, and Guest (2005) studied the sensitivity of the evolu-
tion of labor productivity with respect to projected labor force participa-tion rates, age-productivity profiles, and the degree of substitutability ofworkers at different ages. If substitutability is imperfect, there is an opti-mal age mix in the workforce. Average productivity per worker is influ-enced by demographic changes, which may bring the actual mix closerto or further from the optimum. To investigate the sensitivity of the evo-lution of labor productivity, Prskawetz, Fent, and Guest used a generalequilibrium model, with imperfect substitution between different agegroups. They also found that changes in age-specific productivity profileshave only a small impact on projected labor productivity.
13. There might be an alternative interpretation for this finding: youngworkers are more productive in the conditions of uncertainty generatedby the transition.
14. The only cases of significant positive experience coefficients are oldercohorts in Poland and Romania. However, the coefficients for thosecountries are only 2 percent and 3 percent, respectively.
15. Some of the suggested labor market reforms are drawn from a recentregional study on labor markets (Rutkowski and others 2005).
chaw_073-116_ch02.qxd 5/30/07 5:27 PM Page 115

chaw_073-116_ch02.qxd 5/30/07 5:27 PM Page 116

117
Introduction
A common view is that aging societies can expect reduced levels of
domestic savings because older people save less and that low savings
will lead to lower capital accumulation, which, in turn, will depress
investment and growth. When this concern is combined with the
concerns about labor supply and productivity discussed in chapter 2,
some observers—primarily in Western Europe and Japan—have
drawn very pessimistic conclusions about the growth potential of
aging societies (see, for example, de Serres and others 1998; Martins
and others 2005). It turns out that the labor market story is actually
quite complex and less demographically determined than is often
thought. But what about the saving side of the story? Where aging is
occurring in Eastern Europe and the former Soviet Union, will sav-
ings decline and thus constrain economic growth?
Different factors come into play in determining the specific finan-
cial consequences of aging in the region. Certainly, there are reasons
to question whether the impacts expected under pessimistic scenarios
in the older industrial countries will necessarily happen. In the first
place, it is not clear how well the age-saving profiles that have emerged
Aging, Savings, and Financial Markets
CHAPTER 3
chaw_117-150_ch03.qxd 5/30/07 3:14 PM Page 117
118 From Red to Gray
from research in those countries apply to transition countries. Not
only is there very little analysis of this relationship in the region, but
also it is far from clear whether the saving patterns of the past 15 years
can be extrapolated into the future. For instance, a desire on the part
of households to replenish depleted assets from the early years of tran-
sition could have an impact on saving behavior in countries of the
region that has not been seen in aging industrial countries of the
Organisation for Economic Co-operation and Development (OECD).
Similarly, improvements in income levels would encourage more sav-
ings. In contrast, saving levels could be a problem if productivity does
not continue to grow and expected income gains do not occur and if
households do not behave as anticipated.
Financial markets also play an important role. These markets are
still relatively undeveloped and incomplete in Eastern Europe and
the former Soviet Union, where few countries have financial systems
that extend beyond banking. In comparison to industrial countries,
where most of the analysis has taken place, countries in Eastern
Europe and especially those in the former Soviet Union have very
limited financial instruments. Institutional reforms to deepen finan-
cial markets will improve available saving instruments, thereby
encouraging savings as well as enhancing overall productivity and
growth through more efficient allocation of financial resources. So
policy choices will make a significant difference.
The next section discusses the theoretical and empirical links
between aging and savings and then presents empirical evidence on
the historical relationship between the two in countries of the region.
The chapter then turns to financial markets, looking at their defining
characteristics in these countries, as well as what the international
evidence suggests about how aging is likely to affect them. The chap-
ter concludes with a discussion of the policy implications for countries
in the region.
Aging and Saving Behavior
The relationships between aging, savings, investment, and growth
are depicted in figure 3.1. Although the figure helps structure the
discussion, it cannot properly convey that an economy is a general
equilibrium system in which households make saving decisions inter-
dependently at the same time as firms (domestic and foreign) and gov-
ernments are making saving and investment decisions. The general
equilibrium effects are not addressed in a formal way in this chapter;
rather, the focus is to describe the likely relationship between aging
and savings.
chaw_117-150_ch03.qxd 5/30/07 3:14 PM Page 118

Aging, Savings, and Financial Markets 119
In the rest of this section, the discussion focuses on the relation-
ship between aging and household savings (box 3.1). However, aging
is likely to have impacts on the other saving channels depicted in fig-
ure 3.1, including financial and government savings. The impacts of
aging on financial markets are discussed later in this chapter. The
effect of aging on government savings is addressed in the final three
chapters of this report, which cover pensions, health care, and edu-
cation, respectively. Although these aspects are discussed in various
places, it must be emphasized that saving is a cross-cutting theme. A
country’s particular circumstances can be understood only by look-
ing at all aspects together.
The Relationship between Aging and Savings
The life-cycle hypothesis provides a direct theoretical relationship
between aging and saving behavior (Modigliani and Brumberg 1954).
Based on the insight that individuals and households change their
mix of consumption and savings over their expected life span, the the-
ory implies that older people, who are closer to the end of their lives,
and younger people, who are educating themselves or earning low
levels of income, save less than middle-age individuals (figure 3.2).
FIGURE 3.1Conceptual View of the Possible Channels from Aging to Saving andfrom Saving to Investment and Growth
Source: World Bank staff.
Aging
ViaRicardian
equivalence
Factors influencing investment decisions
Domestic investment
Household savings ↓
In anticipation offuture taxes and inresponse to longerlongevity →Household savings ↑(but empiricalevidence suggestsweak impact)
Rising old-agedependency rate → (life-cyclehypothesis)Householdsavings ↓
Government savings ↓
Increased health andpension expendituresand lower revenue →Government savings ↓
Factors unrelated to aging
Corporate, financial, andforeign savings ↓↑
Fewer resources available for investment More or fewer resources available for investment
Interest rate clears marketfor investment and savings
Economic growth
chaw_117-150_ch03.qxd 5/30/07 3:14 PM Page 119
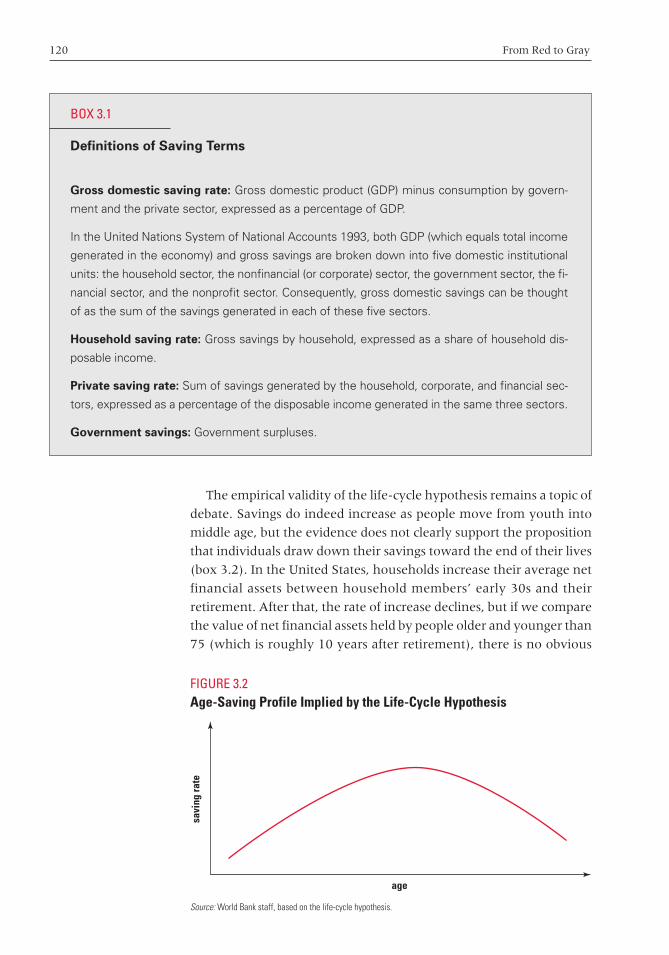
120 From Red to Gray
The empirical validity of the life-cycle hypothesis remains a topic of
debate. Savings do indeed increase as people move from youth into
middle age, but the evidence does not clearly support the proposition
that individuals draw down their savings toward the end of their lives
(box 3.2). In the United States, households increase their average net
financial assets between household members’ early 30s and their
retirement. After that, the rate of increase declines, but if we compare
the value of net financial assets held by people older and younger than
75 (which is roughly 10 years after retirement), there is no obvious
FIGURE 3.2Age-Saving Profile Implied by the Life-Cycle Hypothesis
Source: World Bank staff, based on the life-cycle hypothesis.
savi
ng ra
te
age
BOX 3.1
Definitions of Saving Terms
Gross domestic saving rate: Gross domestic product (GDP) minus consumption by govern-
ment and the private sector, expressed as a percentage of GDP.
In the United Nations System of National Accounts 1993, both GDP (which equals total income
generated in the economy) and gross savings are broken down into five domestic institutional
units: the household sector, the nonfinancial (or corporate) sector, the government sector, the fi-
nancial sector, and the nonprofit sector. Consequently, gross domestic savings can be thought
of as the sum of the savings generated in each of these five sectors.
Household saving rate: Gross savings by household, expressed as a share of household dis-
posable income.
Private saving rate: Sum of savings generated by the household, corporate, and financial sec-
tors, expressed as a percentage of the disposable income generated in the same three sectors.
Government savings: Government surpluses.
chaw_117-150_ch03.qxd 5/30/07 3:14 PM Page 120
Aging, Savings, and Financial Markets 121
decline. The same pattern was observed for Germany by Börsch-
Supan, Reil-Held, and Schnabel (2003), who found that Germans, in
fact, never stop saving.
Saving rates among the elderly may be higher than predicted
under the life-cycle hypothesis because of precautionary savings for
late-life events, including health care costs, and because of intended
bequests. It is also important to note that the distribution of wealth
has a profound effect. In the United States, according to the 2001 Sur-
vey of Consumer Finances, financial assets are heavily concentrated
in the top end of the distribution, with approximately 70 percent of
assets held by 10 percent of the population.1 The concentration of
financial assets suggests that decumulation (drawing down) of finan-
cial assets is not typical of all the elderly but may be more pronounced
in the lower strata of the wealth distribution, where people may need
to rely more on their savings to ensure adequate old-age income.
BOX 3.2
When Can Aging Lead to Greater Savings?
One implication of the life-cycle hypothesis is that a larger share of elderly people with lower
saving rates implies a smaller aggregate saving rate. However, this story does not consider the
fact that demographic shifts such as aging occur very slowly and last decades. Thus, for policy
makers, saving rates during the transition period are interesting in their own right, and they are
likely to differ from the saving rates observed at the end of the transition. Moreover, demo-
graphic transitions—in this case a shift to a population with a larger elderly population—can be
driven either by a rise in longevity or by a fall in fertility rates. If the main driver of the demo-
graphic shift is a decline in fertility rates, the share of middle-age (and high-saving) individuals in
the population will swell before the share of older people and will lead to an increase in aggre-
gate savings. This phenomenon is transitional, though. By contrast, longer life expectancy may
permanently increase savings, if middle-age individuals fundamentally change their behavior to
increase their saving rates in response to a higher life expectancy and offset the larger number
of old people with smaller saving rates. For a recent discussion, see Bloom and others (2006).
In all countries of the region, except the Russian Federation, the projected demographic shifts
occur as a result of an increase in longevity as well as a drop in fertility rates. Thus, household
saving may receive an upward boost—at least temporarily. In the long run, though, it is an em-
pirical question: can the behavioral change of middle-age individuals—raising their saving rates
in response to a realization that they are likely to live longer—offset the lower saving rates of
a rising share of older people? Evidence from Western Europe indicates that countries with
more old people also have lower saving rates, suggesting that behavioral changes do not offset
the decline in saving. No evidence exists to confirm whether this finding applies to countries in
Eastern Europe and the former Soviet Union.
chaw_117-150_ch03.qxd 5/30/07 3:14 PM Page 121

122 From Red to Gray
Hence, the overall effect of aging on savings may have more to do
with the relationship between aging and wealth distribution than
with aging alone.2
A snapshot of the saving profile across age groups for six industrial
countries shows the obvious increase in savings for middle-age groups
compared with younger ones (figure 3.3). The life-cycle pattern is not
nearly so clear when it comes to the middle-age and older relation-
ship. Still, for all countries in the figure except Italy, individuals age
60 or older do save at a lower rate than those in the immediately
younger age groups.3 However, these cross-sectional data are not a
valid test of the life-cycle hypothesis, because they can take into
account only the age effect—that is, relative position in the life span.
They cannot reflect the time effect—that is, the economic history of
the preceding few years and its effects on people’s behavior—or the
cohort effect—that is, the economic experiences that people born in
the same years have shared.4 Within the current context in the region,
time and cohort effects may be important in shifting age-saving pro-
files. For example, in the future, middle-age individuals may, in fact,
increase their savings in response to longer life expectancies. Larger
fiscal deficits provide another reason for individuals to change their
FIGURE 3.3Comparisons of Saving Rates by Age Group, Selected IndustrialCountries, 1990s
Source: Gregory, Mokhtari, and Schrettl 1999, figure 1.
�15
�10
5
�25 25–29 30–34 35–39 40–44 45–49 50–54 55–59 �60
10
15
20
25
30
35
�5
0
savi
ng ra
te
age group
Italy Germany CanadaUnited States United Kingdom Japan
chaw_117-150_ch03.qxd 5/30/07 3:14 PM Page 122
Aging, Savings, and Financial Markets 123
behavior and start saving more than earlier cohorts did at the same
age.5 Unfortunately, the picture is complicated further by the lack of
reliable estimates of age-saving profiles in countries poorer than those
included in figure 3.3.
The Relationship between Aging and Savings in the Region
Researchers have tried to quantify the impact of aging on savings in
two ways: an empirical approach, relying on econometric tools to esti-
mate the empirical relationship between dependency rates and sav-
ings, and a general equilibrium approach.6 In the general equilibrium
approach, the salient features of the economy are modeled, a demo-
graphic shock is introduced (such as a rise in longevity), and the impact
on, for instance, saving rates or growth in gross domestic product
(GDP) is estimated. One strength of this approach is that the transition
path from the current to the future state—which for demographic
shocks can take decades—is clearly mapped out and explained. There
are several drawbacks, though. It is assumed that the current state (to
which the shock is applied) is a steady state, which seems imprudent
given the socioeconomic turmoil over the past 15 years in Eastern
European and former Soviet countries. Another drawback is the
simplicity imposed on the economy, which is necessary in order to
model the economy in the first place. One example of this restrictive-
ness is that although corporate savings seem to account for the bulk of
domestic savings in the region, no attempt is made to model this fea-
ture separately. Moreover, the empirical literature suggests that factors
such as degrees of urbanization and convergence in GDP per capita
terms—factors that are changing drastically in the region—play a role
in determining private savings. However, these features have been dif-
ficult to incorporate into these models, leaving all the dynamics to be
explained by capital-output ratios, factor prices, and aging.
Although the empirical approach also has weaknesses, it does
allow consideration of a broader range of issues.7 Although the life-
cycle hypothesis suggests a relationship between an individual’s age
and savings, data constraints lead most researchers to use private
savings (the sum of household, corporate, and financial savings) as
their dependent variable. Most studies find that a rise in the young-
or old-age dependency rates tends to lower private saving rates.
Although the magnitude of the estimates vary considerably, Loayza,
Schmidt-Hebbel, and Servén (2000: 401–2) conclude that “a rise in
the young-age dependency ratio by, say, 3.5 percentage points leads
to a decline in the private saving rate of about 1 percentage point;
the negative impact on savings of an increase in the old-age depend-
ency ratio is more than twice as large.”
chaw_117-150_ch03.qxd 5/30/07 3:14 PM Page 123

124 From Red to Gray
Before turning to the relationship between dependency rates and
savings, one should note that the empirical literature shows that pri-
vate savings are determined by a wide range of factors that are not
easy to forecast. Of particular importance, both GDP growth and level
of income are found to be statistically significant determinants of pri-
vate savings, and Loayza, Schmidt-Hebbel, and Servén (2000) find
that the influence of the level of income is greater in developing coun-
tries than in industrial countries.8 The strong correlation between per
capita income and private saving rates—plus the low saving rates
observed in the poorest regions of the world—is a reminder that
many households are saving not out of choice but out of necessity. As
income levels rise, more households gets lifted out of the state where
they are producing only enough to sustain themselves, suggesting
that aggregate saving rates should rise.
Saving Data
One important constraint in estimating the empirical relationship
between aging and savings is the weak quality of saving data in the
region. In many countries, only a few years of data are available.
Also, gross domestic saving differs widely depending on whether data
are extracted from the International Financial Statistics database of
the International Monetary Fund (IMF), the World Bank’s World
Development Indicators database, or the United Nations (UN) System
of National Accounts database. Finally, the basic saving-investment
identity (that is, that foreign plus domestic savings should equal
investment) does not hold in most countries, often leaving wide mar-
gins of statistical discrepancy.9
Two consistency checks are imposed on the data to ensure a mini-
mum level of quality. First, the data include only countries that report
institution-based savings (that is, by households, government, and
others) to the UN System of National Accounts database. The ration-
ale is that the additional work of compiling more disaggregated
income and expenditure data is likely to have produced better-quality
data. Second, a statistical discrepancy between savings and invest-
ment greater than 5 percent of GDP is seen as indicative of incomplete
data, and these data are not accepted.10 Despite these consistency
checks, the quality of the household saving data remains question-
able. Therefore, the regression analysis estimates the standard deter-
minants of private savings as well as household savings. Moreover,
the empirical analysis focuses on data available since 1998, because
more countries have started to report savings by institution in recent
years and statistical discrepancies are less common. Graphs for a sam-
ple of the countries used in the regression are shown in figure 3.4.
chaw_117-150_ch03.qxd 5/30/07 3:14 PM Page 124

FIGURE 3.4Savings and Investment as a Percentage of Gross National Income, Selected Eastern Europeanand Former Soviet Countries, 1990–2002
Source: United Nations System of National Accounts database.
1990
1991
1992
1993
1994
1995
1996
1997
1998
1999
2000
2001
2002
a. Bulgaria
perc
enta
ge o
f inc
ome
year
45
35
25
15
5
0
�5
�15
1990
1991
1992
1993
1994
1995
1996
1997
1998
1999
2000
2001
2002
b. Romania
perc
enta
ge o
f inc
ome
year
45
35
25
15
5
0
�5
�15
1990
1991
1992
1993
1994
1995
1996
1997
1998
1999
2000
2001
2002
c. Poland
perc
enta
ge o
f inc
ome
year
40
30
20
0
10
�10
�20
40
30
20
0
10
�10
�20
1990
1991
1992
1993
1994
1995
1996
1997
1998
1999
2000
2001
2002
d. Czech Republicpe
rcen
tage
of i
ncom
e
year
1990
1991
1992
1993
1994
1995
1996
1997
1998
1999
2000
2001
2002
e. Kyrgyz Republic
perc
enta
ge o
f inc
ome
50
30
20
0
10
�10
�30
�20
40
50
30
20
0
10
�10
�30
�20
40
1990
1991
1992
1993
1994
1995
1996
1997
1998
1999
2000
2001
2002
f. Kazakhstan
perc
enta
ge o
f inc
ome
year year
foreign savingsstatistical discrepancy
investment financial savings government and nonprofit savingshousehold savings nonfinancial savings gross savings
125
chaw_117-150_ch03.qxd 5/30/07 3:14 PM Page 125
126 From Red to Gray
Domestic saving rates for all countries of the region, using data
from the World Development Indicators database, are presented in
annex 3.A; for the reasons already noted, the questionable reliability
of these data must be recognized.
Determinants of Private and Household Savings: A Regression Analysis
Two models are specified and estimated with country-level panel data
to test the relationship between savings and dependency rates. One
uses household saving rates as the dependent variable, and the other
uses private saving rates. The impact of aging is captured through
dependency rate variables. Earlier chapters have emphasized that
projected changes in dependency rates vary greatly across the region.
The total dependency rate, defined as the number of persons younger
than 15 years plus the number of persons 65 years or older per 100 per-
sons 15 to 64 years, will rise in 12 countries from 2000 to 2025 (recall
figure 1.20). Four countries will see almost no change over this period,
and the rate will actually decline in 12 countries, where the sharp
decline in the child dependency rate will generally offset the increase
in the elderly dependency rate. Those demographic patterns indicate
that, whatever the impact of aging on savings is, it will be a concern
over the next two decades for only about half the region’s countries. In
addition to the dependency rates, the model includes a set of standard
control variables (per capita income, growth, urbanization, foreign
and government savings, terms of trade, inflation, and the real interest
rate). Household and private saving data are taken from the UN data-
base; the source for data on control variables is the World Bank’s World
Development Indicators database.11
So that saving behavior can be compared, the sample includes
countries outside the region. From the complete sample of middle-
income OECD countries and Eastern European and former Soviet
countries in the UN database, only the countries that satisfied the qual-
ity consistency checks were selected. As a result, data on 23 countries
(11 regional and 12 nonregional countries) for 1998 to 2001 were
included in the estimation sample.12
The regression results are shown in table 3.1. Although the results
are broadly in line with previous empirical work, three findings seem
especially noteworthy. First, the regional dummy is statistically
insignificant, irrespective of whether private or household savings are
used as the dependent variable. This finding suggests that both pri-
vate and household savings respond to factors such as aging, income,
growth, and foreign savings in broadly the same way that they do in
other countries. This occurs even though household and private sav-
ings play less of a role in financing investment in regional countries
(discussed later). Second, the estimated impact of aging on household
chaw_117-150_ch03.qxd 5/30/07 3:14 PM Page 126
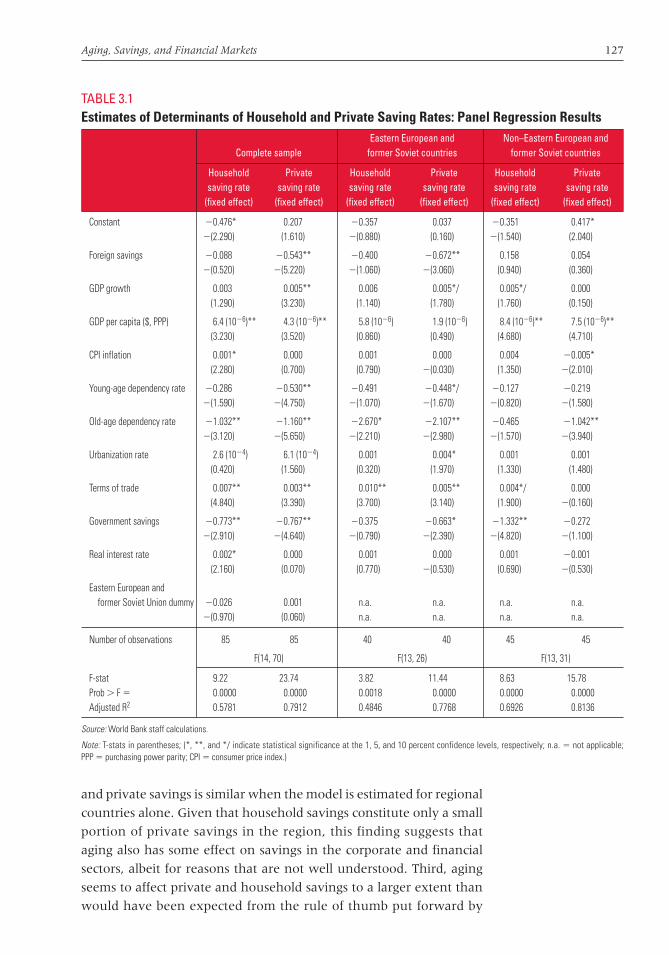
Aging, Savings, and Financial Markets 127
and private savings is similar when the model is estimated for regional
countries alone. Given that household savings constitute only a small
portion of private savings in the region, this finding suggests that
aging also has some effect on savings in the corporate and financial
sectors, albeit for reasons that are not well understood. Third, aging
seems to affect private and household savings to a larger extent than
would have been expected from the rule of thumb put forward by
TABLE 3.1Estimates of Determinants of Household and Private Saving Rates: Panel Regression Results
Eastern European and Non–Eastern European and Complete sample former Soviet countries former Soviet countries
Household Private Household Private Household Privatesaving rate saving rate saving rate saving rate saving rate saving rate
(fixed effect) (fixed effect) (fixed effect) (fixed effect) (fixed effect) (fixed effect)
Constant �0.476* 0.207 �0.357 0.037 �0.351 0.417*�(2.290) (1.610) �(0.880) (0.160) �(1.540) (2.040)
Foreign savings �0.088 �0.543** �0.400 �0.672** 0.158 0.054�(0.520) �(5.220) �(1.060) �(3.060) (0.940) (0.360)
GDP growth 0.003 0.005** 0.006 0.005*/ 0.005*/ 0.000(1.290) (3.230) (1.140) (1.780) (1.760) (0.150)
GDP per capita ($, PPP) 6.4 (10�6)** 4.3 (10�6)** 5.8 (10�6) 1.9 (10�6) 8.4 (10�6)** 7.5 (10�6)**(3.230) (3.520) (0.860) (0.490) (4.680) (4.710)
CPI inflation 0.001* 0.000 0.001 0.000 0.004 �0.005*(2.280) (0.700) (0.790) �(0.030) (1.350) �(2.010)
Young-age dependency rate �0.286 �0.530** �0.491 �0.448*/ �0.127 �0.219�(1.590) �(4.750) �(1.070) �(1.670) �(0.820) �(1.580)
Old-age dependency rate �1.032** �1.160** �2.670* �2.107** �0.465 �1.042**�(3.120) �(5.650) �(2.210) �(2.980) �(1.570) �(3.940)
Urbanization rate 2.6 (10�4) 6.1 (10�4) 0.001 0.004* 0.001 0.001(0.420) (1.560) (0.320) (1.970) (1.330) (1.480)
Terms of trade 0.007** 0.003** 0.010** 0.005** 0.004*/ 0.000(4.840) (3.390) (3.700) (3.140) (1.900) �(0.160)
Government savings �0.773** �0.767** �0.375 �0.663* �1.332** �0.272�(2.910) �(4.640) �(0.790) �(2.390) �(4.820) �(1.100)
Real interest rate 0.002* 0.000 0.001 0.000 0.001 �0.001(2.160) (0.070) (0.770) �(0.530) (0.690) �(0.530)
Eastern European and former Soviet Union dummy �0.026 0.001 n.a. n.a. n.a. n.a.
�(0.970) (0.060) n.a. n.a. n.a. n.a.
Number of observations 85 85 40 40 45 45
F(14, 70) F(13, 26) F(13, 31)
F-stat 9.22 23.74 3.82 11.44 8.63 15.78Prob � F � 0.0000 0.0000 0.0018 0.0000 0.0000 0.0000Adjusted R2 0.5781 0.7912 0.4846 0.7768 0.6926 0.8136
Source: World Bank staff calculations.
Note: T-stats in parentheses; (*, **, and */ indicate statistical significance at the 1, 5, and 10 percent confidence levels, respectively; n.a. � not applicable; PPP � purchasing power parity; CPI � consumer price index.)
chaw_117-150_ch03.qxd 5/30/07 3:14 PM Page 127

128 From Red to Gray
Loayza, Schmidt-Hebbel, and Servén (2000). In the full sample, a one
percentage point increase in the elderly dependency rate implies a
1.16 percent decline in private savings (compared with the estimate
proposed by Loayza, Schmidt-Hebbel, and Servén [2000] of at least
0.6 percent). Equally striking, when the regression is run on regional
countries only, the sensitivity of savings to aging is even greater, with
an estimated decline of 2.1 percent.
It is tempting to use the regression results to estimate the impact of
the projected demographic changes on household and private savings
in Eastern Europe and the former Soviet Union. Given the large pro-
jected increases in old-age dependency rates in a number of countries,
the analysis implies very large declines in private savings in those
countries—when holding the other regressors constant. In particular,
when assuming that the other variables do not change, the regression
results imply that private savings will decline substantially in coun-
tries where particularly large increases in old-age dependency rates
are projected (for example, the Czech Republic and Poland).
However, this type of analysis can be seriously misleading because
it rests on a number of assumptions that are clearly not appropriate for
all countries of the region. First, it assumes that relationships between
variables observed in the past (that is, the estimated coefficients) are
good predictors of future relationships between the same variables. All
regression analysis using time-series data is vulnerable to this critique,
but in the countries that have just gone through transition, the
assumption is particularly questionable. Second, and more important,
demographic change is only one determinant of savings. It makes little
sense to discuss the impact of a demographic change, holding the other
determinants constant, when it should be assumed that these variables
will change significantly. In the case of reasonably stable, industrial
countries that are functioning at close to their long-term potential
growth rate, an inconspicuous assumption usually is that the other
determinants remain unchanged. But the assumption makes little
sense for the countries in Eastern Europe and the former Soviet Union.
Third, the regression does not capture factors such as the desire of
households and firms to replenish depleted assets or the expected
reforms that will deepen capital markets. Although the importance is
difficult to quantify, these factors are likely to be important drivers of
savings in the region in the coming decades. Regarding the desire to
replenish depleted assets, it seems likely that current low saving rates
in the region are repressed because of the continuing economic tran-
sition. This suggests that saving rates will eventually increase (beyond
what standard determinants would suggest), as households and firms
try to replenish depleted household assets and firm capital stock,
chaw_117-150_ch03.qxd 5/30/07 3:14 PM Page 128
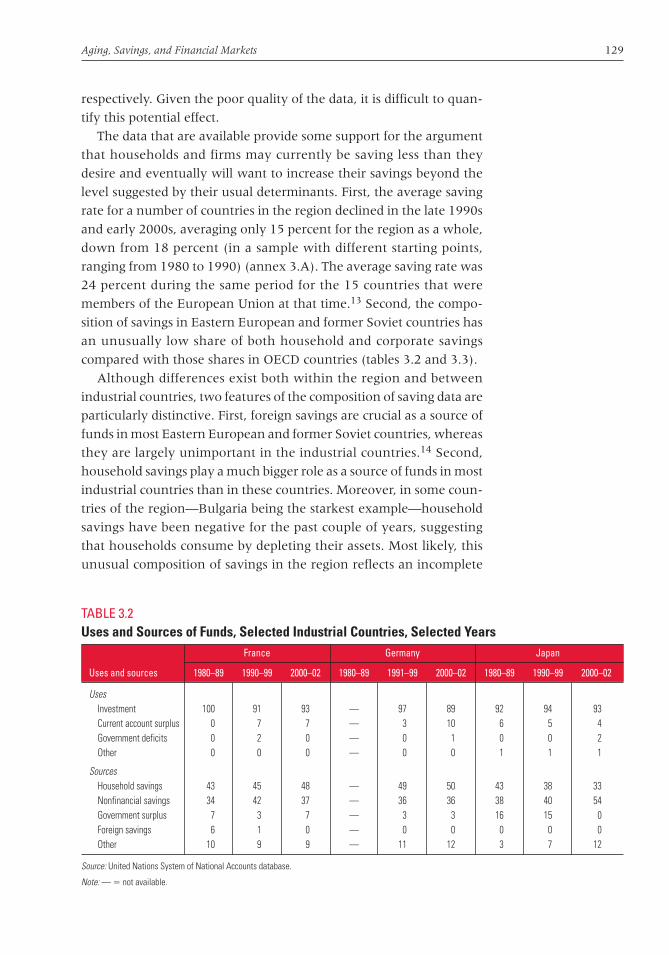
Aging, Savings, and Financial Markets 129
respectively. Given the poor quality of the data, it is difficult to quan-
tify this potential effect.
The data that are available provide some support for the argument
that households and firms may currently be saving less than they
desire and eventually will want to increase their savings beyond the
level suggested by their usual determinants. First, the average saving
rate for a number of countries in the region declined in the late 1990s
and early 2000s, averaging only 15 percent for the region as a whole,
down from 18 percent (in a sample with different starting points,
ranging from 1980 to 1990) (annex 3.A). The average saving rate was
24 percent during the same period for the 15 countries that were
members of the European Union at that time.13 Second, the compo-
sition of savings in Eastern European and former Soviet countries has
an unusually low share of both household and corporate savings
compared with those shares in OECD countries (tables 3.2 and 3.3).
Although differences exist both within the region and between
industrial countries, two features of the composition of saving data are
particularly distinctive. First, foreign savings are crucial as a source of
funds in most Eastern European and former Soviet countries, whereas
they are largely unimportant in the industrial countries.14 Second,
household savings play a much bigger role as a source of funds in most
industrial countries than in these countries. Moreover, in some coun-
tries of the region—Bulgaria being the starkest example—household
savings have been negative for the past couple of years, suggesting
that households consume by depleting their assets. Most likely, this
unusual composition of savings in the region reflects an incomplete
TABLE 3.2Uses and Sources of Funds, Selected Industrial Countries, Selected Years
France Germany Japan
Uses and sources 1980–89 1990–99 2000–02 1980–89 1991–99 2000–02 1980–89 1990–99 2000–02
Uses Investment 100 91 93 — 97 89 92 94 93Current account surplus 0 7 7 — 3 10 6 5 4Government deficits 0 2 0 — 0 1 0 0 2Other 0 0 0 — 0 0 1 1 1
SourcesHousehold savings 43 45 48 — 49 50 43 38 33Nonfinancial savings 34 42 37 — 36 36 38 40 54Government surplus 7 3 7 — 3 3 16 15 0Foreign savings 6 1 0 — 0 0 0 0 0Other 10 9 9 — 11 12 3 7 12
Source: United Nations System of National Accounts database.
Note: — � not available.
chaw_117-150_ch03.qxd 5/30/07 3:14 PM Page 129
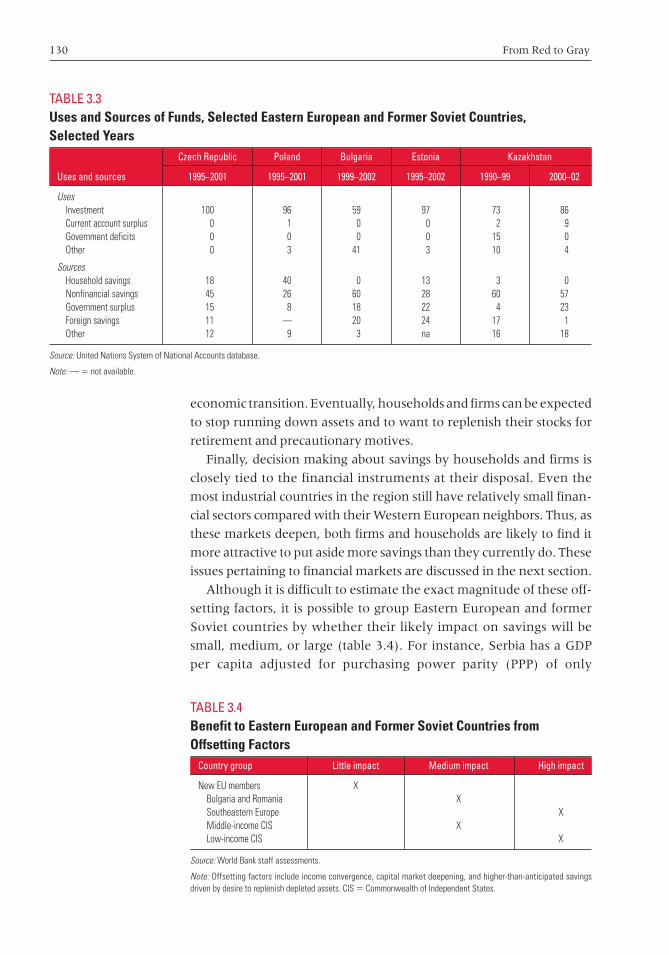
130 From Red to Gray
economic transition. Eventually, households and firms can be expected
to stop running down assets and to want to replenish their stocks for
retirement and precautionary motives.
Finally, decision making about savings by households and firms is
closely tied to the financial instruments at their disposal. Even the
most industrial countries in the region still have relatively small finan-
cial sectors compared with their Western European neighbors. Thus, as
these markets deepen, both firms and households are likely to find it
more attractive to put aside more savings than they currently do. These
issues pertaining to financial markets are discussed in the next section.
Although it is difficult to estimate the exact magnitude of these off-
setting factors, it is possible to group Eastern European and former
Soviet countries by whether their likely impact on savings will be
small, medium, or large (table 3.4). For instance, Serbia has a GDP
per capita adjusted for purchasing power parity (PPP) of only
TABLE 3.4Benefit to Eastern European and Former Soviet Countries fromOffsetting Factors
Country group Little impact Medium impact High impact
New EU members XBulgaria and Romania XSoutheastern Europe XMiddle-income CIS X Low-income CIS X
Source: World Bank staff assessments.
Note: Offsetting factors include income convergence, capital market deepening, and higher-than-anticipated savingsdriven by desire to replenish depleted assets. CIS � Commonwealth of Independent States.
TABLE 3.3Uses and Sources of Funds, Selected Eastern European and Former Soviet Countries, Selected Years
Czech Republic Poland Bulgaria Estonia Kazakhstan
Uses and sources 1995–2001 1995–2001 1999–2002 1995–2002 1990–99 2000–02
UsesInvestment 100 96 59 97 73 86Current account surplus 0 1 0 0 2 9Government deficits 0 0 0 0 15 0Other 0 3 41 3 10 4
SourcesHousehold savings 18 40 0 13 3 0Nonfinancial savings 45 26 60 28 60 57Government surplus 15 8 18 22 4 23Foreign savings 11 — 20 24 17 1Other 12 9 3 na 16 18
Source: United Nations System of National Accounts database.
Note: — � not available.
chaw_117-150_ch03.qxd 5/30/07 3:14 PM Page 130
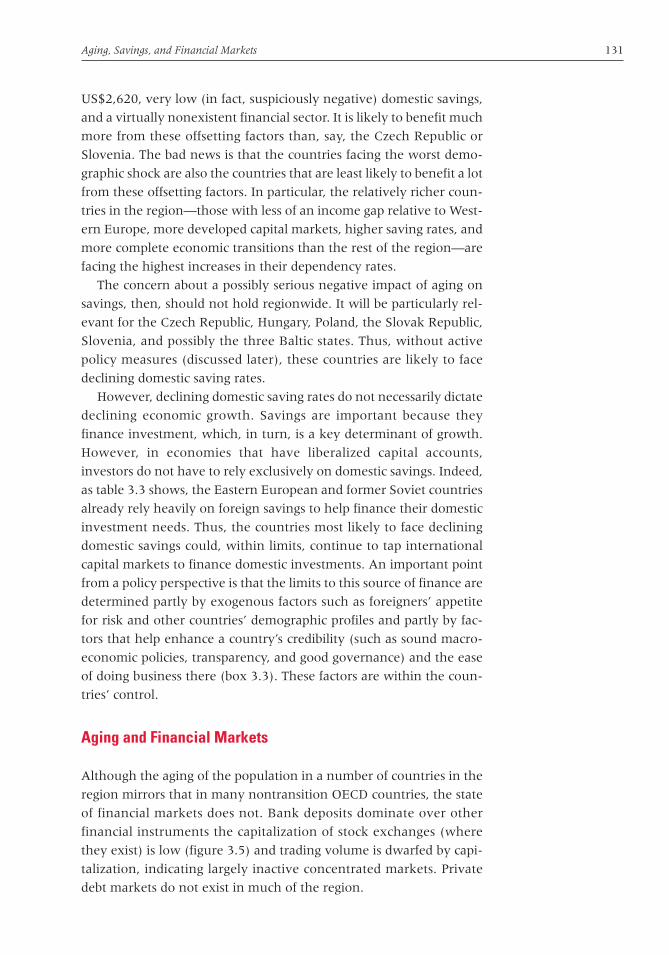
Aging, Savings, and Financial Markets 131
US$2,620, very low (in fact, suspiciously negative) domestic savings,
and a virtually nonexistent financial sector. It is likely to benefit much
more from these offsetting factors than, say, the Czech Republic or
Slovenia. The bad news is that the countries facing the worst demo-
graphic shock are also the countries that are least likely to benefit a lot
from these offsetting factors. In particular, the relatively richer coun-
tries in the region—those with less of an income gap relative to West-
ern Europe, more developed capital markets, higher saving rates, and
more complete economic transitions than the rest of the region—are
facing the highest increases in their dependency rates.
The concern about a possibly serious negative impact of aging on
savings, then, should not hold regionwide. It will be particularly rel-
evant for the Czech Republic, Hungary, Poland, the Slovak Republic,
Slovenia, and possibly the three Baltic states. Thus, without active
policy measures (discussed later), these countries are likely to face
declining domestic saving rates.
However, declining domestic saving rates do not necessarily dictate
declining economic growth. Savings are important because they
finance investment, which, in turn, is a key determinant of growth.
However, in economies that have liberalized capital accounts,
investors do not have to rely exclusively on domestic savings. Indeed,
as table 3.3 shows, the Eastern European and former Soviet countries
already rely heavily on foreign savings to help finance their domestic
investment needs. Thus, the countries most likely to face declining
domestic savings could, within limits, continue to tap international
capital markets to finance domestic investments. An important point
from a policy perspective is that the limits to this source of finance are
determined partly by exogenous factors such as foreigners’ appetite
for risk and other countries’ demographic profiles and partly by fac-
tors that help enhance a country’s credibility (such as sound macro-
economic policies, transparency, and good governance) and the ease
of doing business there (box 3.3). These factors are within the coun-
tries’ control.
Aging and Financial Markets
Although the aging of the population in a number of countries in the
region mirrors that in many nontransition OECD countries, the state
of financial markets does not. Bank deposits dominate over other
financial instruments the capitalization of stock exchanges (where
they exist) is low (figure 3.5) and trading volume is dwarfed by capi-
talization, indicating largely inactive concentrated markets. Private
debt markets do not exist in much of the region.
chaw_117-150_ch03.qxd 5/30/07 3:14 PM Page 131

132 From Red to Gray
The development and present significance of financial markets dif-
fers across the region. To illustrate this variation, table 3.5 organizes
regional countries according to equity, public and private debt capi-
talization, and total financial savings that could be placed in instru-
ments other than bank deposits. These indicators are expressed in
relative terms (as a percentage of GDP), which indicate how embed-
ded the domestic financial markets are in the national economy and,
in absolute dollar values, suggest the presence of the country in the
global financial system. The underlying data, shown in annex 3.B,
BOX 3.3
What Role Does Cross-Border Capital Mobility Have in Financial Markets?
Cross-border capital movement is influenced by both current demographic characteristics and
expected demographic changes (Lührmann 2003). Other things being equal, countries with high
youth and old-age dependency rates are expected to run current account deficits, while coun-
tries where the middle-age population is large should have surpluses. Interestingly, the models
based on this insight do not explain the large current account deficits accrued by industrial coun-
tries when their middle-age population was large, youth dependency was low, and old-age de-
pendency not yet very high. According to this logic, the current account deficit of the United
States should move toward a surplus or at least become smaller. In practice, however, the
deficit keeps growing, meaning that the models fail to capture some important factors of inter-
national capital flows.
International capital movement should also depend on the openness of the country in question:
the more open an economy is, the less closely domestic investments should track changes in
domestic saving rates. Interestingly, this proposition is not borne out by historic data—savings
and investments correlate closely in OECD countries, which are quite open, though the correla-
tion has been getting weaker over time (see Feldstein and Horioka 1980). Possible reasons for
imperfect capital mobility include transaction risks and costs, real and perceived information
asymmetry leading to “home bias,” explicit portfolio regulations, and implicit portfolio con-
straints imposed by exchange rate policies.
It is generally assumed that greater trade and openness will enhance the chances of older and
richer countries to invest in younger, emerging economies. But there are competing arguments
regarding the effectiveness of such capital flows as an instrument for managing demographic
risks. The countries that have the capacity to absorb an excess supply of capital are the ones
with younger populations. Yet increased flows of capital to young countries are problematic, be-
cause such countries are typically poorer, in great need of domestic investments, and hardly
have the surplus liquidity to absorb any excess supply of financial instruments. Furthermore,
capital mobility is not costless, and the increased political, economic, transaction, and other risks
may discourage rich countries’ investors.
chaw_117-150_ch03.qxd 5/30/07 3:14 PM Page 132
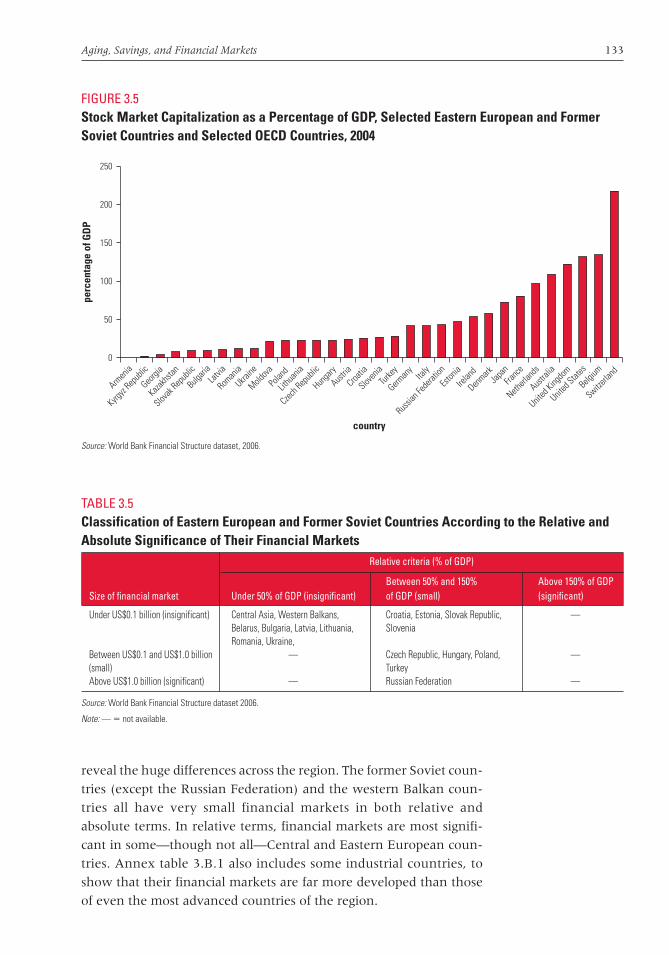
Aging, Savings, and Financial Markets 133
reveal the huge differences across the region. The former Soviet coun-
tries (except the Russian Federation) and the western Balkan coun-
tries all have very small financial markets in both relative and
absolute terms. In relative terms, financial markets are most signifi-
cant in some—though not all—Central and Eastern European coun-
tries. Annex table 3.B.1 also includes some industrial countries, to
show that their financial markets are far more developed than those
of even the most advanced countries of the region.
TABLE 3.5Classification of Eastern European and Former Soviet Countries According to the Relative andAbsolute Significance of Their Financial Markets
Relative criteria (% of GDP)
Between 50% and 150% Above 150% of GDP Size of financial market Under 50% of GDP (insignificant) of GDP (small) (significant)
Under US$0.1 billion (insignificant) Central Asia, Western Balkans, Croatia, Estonia, Slovak Republic, —Belarus, Bulgaria, Latvia, Lithuania, SloveniaRomania, Ukraine,
Between US$0.1 and US$1.0 billion — Czech Republic, Hungary, Poland, —(small) TurkeyAbove US$1.0 billion (significant) — Russian Federation —
Source: World Bank Financial Structure dataset 2006.
Note: — � not available.
FIGURE 3.5Stock Market Capitalization as a Percentage of GDP, Selected Eastern European and FormerSoviet Countries and Selected OECD Countries, 2004
Source: World Bank Financial Structure dataset, 2006.
0
100
50
150
200
250
Armen
ia
Kyrgyz
Repub
lic
Georgi
a
Kazakhs
tan
Slovak
Repub
lic
Bulgari
aLat
via
Roman
ia
Ukraine
Moldova
Polan
d
Lithu
ania
Czech R
epub
lic
Hunga
ry
Austria
Croatia
Sloven
iaTur
key
German
yIta
ly
Russian
Fede
ration
Eston
ia
Irelan
d
Denmark
Japa
nFra
nce
Netherl
ands
Austral
ia
United
Kingdo
m
United
States
Belgium
Switzerla
nd
perc
enta
ge o
f GD
P
country
chaw_117-150_ch03.qxd 5/30/07 3:14 PM Page 133
134 From Red to Gray
The Evolution of Financial Markets in the Region
Before the transition, strict control of earnings and access to credit
meant that what little savings there were financed the consumption
of durables and the purchase of property (where allowed). Additional
savings could be accumulated in bank deposits or in pillowcases.
Hyperinflationary periods during the early years of the transition
devalued monetized savings, and the early 1990s saw real wages drop
in most countries, if only temporarily. As a result of privatization, cor-
porate restructuring, and the inflow of new technologies, unemploy-
ment increased. For job losers older than age 40, layoffs typically led
to long-term unemployment and often exit from the labor market.
These developments contributed to a situation in which people
who were older than 40 in the 1990s and who are now approaching
retirement have, for the most part, not yet accumulated significant
financial savings or investments. This situation is genuinely different
from circumstances in other European countries, Japan, or the United
States. Even in transition countries where structural pension reforms
introduced defined-contribution pension schemes, people older than
age 40 were discouraged from joining the new systems. Thus, the
forced savings of mandatory private pension plans have not changed
their portfolios either. The most important—and often only—asset for
people older than age 40 is their owner-occupied real estate. Limited
population mobility, shallow real estate markets, and a lack of finan-
cial instruments (such as reverse mortgages) that would help liqui-
date these assets while maintaining the utility of occupation means
that aging is unlikely to lead to supply shocks on either financial or
real estate markets in the coming decade.
Bank deposits are the dominant saving instrument but still repre-
sent only a small percentage of GDP, exceeding 50 percent only in
Croatia, the Czech Republic, and the Slovak Republic. This situation is
attributable to the combined effect of low savings and lack of trust in
financial intermediaries and products in general. In a very few coun-
tries, such as Hungary or Poland, it is also attributable to the availabil-
ity of trustworthy alternatives to bank deposits. In most countries of
the region, however, the income effect (that is, very low savings)
dominates all other factors. Because the economies of Eastern Euro-
pean and former Soviet countries are small and foreign portfolio
investment is limited to a few blue-chip issues, their underdeveloped
financial markets mean that their influence on global capital markets
is negligible on the aggregate demand and supply sides.
According to financial sector assessments conducted in these coun-
tries by the World Bank and the IMF, the necessary regulatory frame-
work is usually in place, at least as far the legal norms are concerned.
chaw_117-150_ch03.qxd 5/30/07 3:14 PM Page 134

Aging, Savings, and Financial Markets 135
In terms of enforcement capacity, however, the picture is mixed. With
the exception of the new EU members of Central Europe, the develop-
ment of nonbank financial institutions in the region is slow and often
limited to microfinance agencies subsidized by the budget or by donors.
All these factors contribute to the reality that institutional investors are
much less important in Eastern European and former Soviet countries
than in countries that have developed capital markets (figure 3.6).
Admittedly, some changes are occurring. In the 1990s, the insur-
ance markets of Central European countries were opened up to for-
eigners through privatization and through the licensing of new
insurers. Life and other insurance markets in Bulgaria, Croatia, the
Czech Republic, Estonia, Hungary, Poland, Romania, the Slovak
Republic, and Slovenia are now dominated by large international
financial groups such as AIG, Allianz, and ING. But many other coun-
tries in Central Asia and the Caucasus still have state-owned insur-
ance monopolies. Where insurance markets have opened up, local
affiliates of the large international groups are registered as local
companies with separate capitalization, portfolio, risk provisioning,
accounting, and other rules. Risks are underwritten by the local
companies; the extent to which these companies are following inde-
pendent investment strategies dictated by their local liabilities is not
known. This issue is particularly important for life insurers that offer
annuity products in pension-reforming countries.
FIGURE 3.6Financial Assets of Institutional Investors as a Percentage of GDP, Selected Eastern European and Former Soviet Countries and SelectedOECD Countries, 2004
Source: World Bank Financial Structure data set, 2006.
0
50
100
150
200
250
Turkey
Slovak
Repub
lic
Polan
d
Hunga
ry
Czech R
epub
lic
German
yIta
lyJa
pan
France
United
Kingdo
m
Netherl
ands
United
States
perc
enta
ge o
f GD
P
country
chaw_117-150_ch03.qxd 5/30/07 3:14 PM Page 135
136 From Red to Gray
Integration with international capital markets is asymmetrical:
domestic investors do not invest in overseas instruments, but foreign
investors occasionally venture into portfolio investments in countries
of the region. Very few domestic investors have savings sufficiently
large and liquid to enable them to consider international diversifica-
tion, because of the fixed costs of investment intelligence and trans-
action and other fees. A further reason for little international
diversification is that high public debt and its systematic domestic
securitization has often made the least risky investment yield the
highest returns; thus, domestic public debt instruments have crowded
out all other asset classes, including foreign stocks and bonds. House-
holds rarely invest directly in capital markets; it is institutional
investors—primarily insurance companies and a few asset managers
servicing insurers and corporate treasuries—that are active.
Pension Funds
Quasi-forced savings—legally not mandated but politically strongly
encouraged—were a common phenomenon in Central and Eastern
Europe in the late 1940s and the 1950s, to dampen demand for con-
sumption goods and to help finance post–World War II reconstruction
and industrialization. Later, credit constraints required high down
payments or cash purchases of high-value durables for much the same
reason. These savings appeared as specialized, nontradable quasi-
securities and as bank deposits, but they lost their importance by the
1980s. Recently, however, pension reforms have introduced true
forced savings in the form of mandatory contributions to privately
managed, fully funded pension schemes.
Pension systems in Eastern Europe and the former Soviet Union
underwent repeated adjustments even before the transition or the
beginning of large-scale structural reforms. These changes, discussed
in detail in chapter 4, were implemented to improve fiscal sustain-
ability through better system dependency rates and to reduce the
average replacement rate over time. One of the consequences of the
economic shocks and the reforms to the public pension system has
been that younger cohorts attempt to opt out of the public scheme
and seek alternative solutions for providing their own old-age income
security. One of the very few positive effects of this attempt is that
these cohorts reach their saving-intensive years at a time when both
their income levels and the available instruments make it easier to
save and invest for old age. They should thus face better outcomes
than those facing the many people who are currently approaching
retirement without savings.
chaw_117-150_ch03.qxd 5/30/07 3:14 PM Page 136

Aging, Savings, and Financial Markets 137
In such countries as Estonia, Hungary, and Poland, private pension
schemes were introduced into an otherwise functioning market
of capital flows and financial intermediation (box 3.4). In other
countries—such as Bulgaria, Croatia, and the Slovak Republic—the
financial sector was mostly limited to banks and mandatory nonlife
insurance, so pension funds were the first major institutional
investors that sought to establish diversified financial portfolios. In
still other countries, the financial sector is genuinely underdeveloped
and cannot provide investment managers with even the most basic
services, such as custodianship, depository and settlement services,
BOX 3.4
Key Pension Fund Concepts
Defined-Benefit Plans
The most common version of these plans defines benefits as a percentage of the beneficiary’s
final salary or average salary over a legally defined period (typically including the highest-earning
period). Because benefits are determined and cannot be adjusted later in response to available
resources, the sponsor of a defined-benefit scheme who underwrites the pension promise has
to make sure that the plan’s revenues and accrued assets can finance its liabilities. Defined-
benefit pension schemes pool economic and demographic risks and therefore can function best
with large groups of insured individuals.
Defined-Contribution Plans
These schemes function as individual investment accounts. They do not pool risk unless spe-
cific regulations introduce risk-pooling elements. Benefit levels depend on the annuity that can
be purchased at the time of retirement from the accrued value of the individual account. If indi-
viduals are buying annuities or other defined-benefit products, both they and the annuity provider
are subject to the benefits and risks of insurance products. If individuals take out their pension
savings as a lump sum or a phased withdrawal, then the system is a pure defined-contribution
one. In that case, however, regulators must ensure that the longevity risks are covered by other
means.
Financing
Pension schemes can be fully funded or pay-as-you-go (PAYG). Defined-contribution schemes
are, by definition, fully funded because the asset value of the scheme’s fund defines its liabili-
ties toward the members. Defined-benefit schemes can be fully funded—hence the importance
(continued)
chaw_117-150_ch03.qxd 5/30/07 3:14 PM Page 137

138 From Red to Gray
and enforcement. Despite these conditions, Kosovo already has a
mandatory private pension scheme, and countries—such as Bosnia
and Herzegovina and the Kyrgyz Republic—are considering similar
reforms.
Can pension reform spur the development of financial markets?
Reforms introducing mandatory, privately managed, fully funded
pension schemes can change the financial sector landscape by creat-
ing a new type of institutional investor that will need the services of
other financial intermediaries. However, unless pension reform artifi-
cially creates an enclave, the Central Asian republics (with the excep-
tion of Kazakhstan), the countries of the Caucasus, and some of the
BOX 3.4
(continued)
of the funding ratio, which compares the net present value of accrued liabilities with that of avail-
able resources, including future revenues—or unfunded. An unfunded defined-benefit scheme
is unfunded by accident or by design. PAYG schemes are unfunded by design and have no ac-
crued assets, or if they do, the assets can serve only as demographic buffer funds and are
dwarfed by accrued liabilities.
Pension Funds in Financial Markets
Fully funded schemes invest most of their assets in securitized investments and therefore play
an important role as institutional investors. Public PAYG defined-benefit schemes do not play a
direct role in financial markets—although if they increase public debt (as a result of revenue
shortfalls) and the debt is financed through markets, then the increased supply of government
bonds affects asset prices and portfolio composition.
Management
Pension schemes can be publicly or privately managed, and there are defined-contribution and
defined-benefit schemes in both categories. Because PAYG financing requires enforcement
powers, such schemes function only under public (state) management.
Coverage
Pension schemes can have universal or partial coverage. If coverage is partial, participation may
depend on geographic, income, occupational, or other factors. It is important that a pension sys-
tem be universal even if particular pension schemes may provide only partial coverage (for ex-
ample, for employees, civil servants, or farmers). The regulator just has to make sure that every
person belongs to some pension scheme.
chaw_117-150_ch03.qxd 5/30/07 3:14 PM Page 138
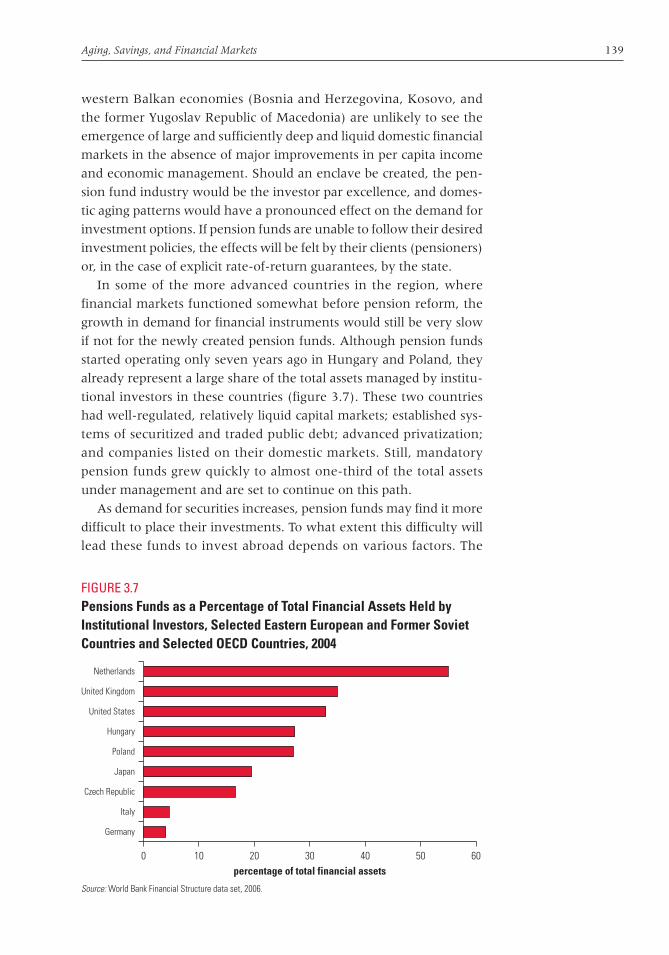
Aging, Savings, and Financial Markets 139
western Balkan economies (Bosnia and Herzegovina, Kosovo, and
the former Yugoslav Republic of Macedonia) are unlikely to see the
emergence of large and sufficiently deep and liquid domestic financial
markets in the absence of major improvements in per capita income
and economic management. Should an enclave be created, the pen-
sion fund industry would be the investor par excellence, and domes-
tic aging patterns would have a pronounced effect on the demand for
investment options. If pension funds are unable to follow their desired
investment policies, the effects will be felt by their clients (pensioners)
or, in the case of explicit rate-of-return guarantees, by the state.
In some of the more advanced countries in the region, where
financial markets functioned somewhat before pension reform, the
growth in demand for financial instruments would still be very slow
if not for the newly created pension funds. Although pension funds
started operating only seven years ago in Hungary and Poland, they
already represent a large share of the total assets managed by institu-
tional investors in these countries (figure 3.7). These two countries
had well-regulated, relatively liquid capital markets; established sys-
tems of securitized and traded public debt; advanced privatization;
and companies listed on their domestic markets. Still, mandatory
pension funds grew quickly to almost one-third of the total assets
under management and are set to continue on this path.
As demand for securities increases, pension funds may find it more
difficult to place their investments. To what extent this difficulty will
lead these funds to invest abroad depends on various factors. The
FIGURE 3.7Pensions Funds as a Percentage of Total Financial Assets Held byInstitutional Investors, Selected Eastern European and Former SovietCountries and Selected OECD Countries, 2004
Source: World Bank Financial Structure data set, 2006.
Japan
Czech Republic
Germany
Netherlands
United States
Hungary
Poland
United Kingdom
Italy
50 600 10 20 30 40percentage of total financial assets
chaw_117-150_ch03.qxd 5/30/07 3:14 PM Page 139
140 From Red to Gray
growing appetite of pension funds can cater to growing securitized
public debt, unless governments observe more restrictive fiscal policies.
High public debt already drives pension funds in Bulgaria, Hungary,
Latvia, and Poland to invest between two-thirds and three-fourths of
their portfolios in domestic government bonds. Given that new gov-
ernment debt can be placed easily with pension funds, it will be tempt-
ing both for governments to issue and for pension funds to buy these
instruments. It is easy to imagine a situation in which the presence of
private pension schemes delays the onset of fiscal prudence and limits
portfolio diversification. Another factor is whether corporations’
financing needs will give rise to private debt issues as opposed to cor-
porations relying solely on the banking sector.
To what extent could pension funds contribute to a diversified sup-
ply of domestic securities beyond government bonds? Portfolio com-
position is driven partly by regulations, but other factors also can
constrain funds.15 In such countries as Hungary, where government
bonds still represent a large majority of pension fund portfolios and
variations across funds are very small, it is unlikely that pension funds
would play a role in the short term in diversifying portfolio structure.
Although there is a very gradual shift away from public debt issues
throughout the region, pension portfolios will not be restructured
much before mandatory annuitization starts. It can be assumed that
future annuity providers will not invest heavily in equity and other
high-volatility instruments and that they would more likely con-
tribute to the continuing domination of debt over other instruments.
EU membership is not likely to change much in terms of institu-
tional investors’ portfolio strategy. The constraints on capital move-
ment are neither smaller nor greater than before, but converging
European regulations and growing portfolios in the region afford
investors significantly more overseas opportunities. Those Eastern
European and former Soviet countries that are now members of the
European Union and have demographic structures similar to those
in Western Europe will not provide a model for managing demo-
graphically driven financial market pressures. The reason these
countries—in particular, the ones that have reformed pension
systems—are likely to present surplus demand eventually is their
expected increases in incomes and savings.
Implications of Aging for Financial Markets
How can aging affect financial markets in the region? Clearly, that will
depend on whether there is a domestic financial market in the first
place. If no financial assets are traded, if local institutions do not invest
chaw_117-150_ch03.qxd 5/30/07 3:14 PM Page 140

Aging, Savings, and Financial Markets 141
overseas, and if public expenditures do not incur debt other than soft
loans provided by international financial institutions, then demo-
graphic trends will have no direct effect on financial market develop-
ment. The extent to which aging has an impact on financial markets
depends on various conditions. First, the country’s population must
have an income that allows for saving, beyond accumulating buffer
funds for unexpected short-term needs.16 Second, savings must
appear in the financial system as bank deposits, insurance policies, or
investment portfolios managed directly by the asset owners or by an
institutional investor on their behalf. Third, a financial market must
exist that is accessible to individual and institutional investors. Here,
the standard should be the presence of a legal and institutional frame-
work established by the state; both private and institutional investors;
and a sufficiently large volume of listings, issues, and trading in stan-
dardized contracts to render the market deep, liquid, and a reliable
source of information.
As this chapter has already emphasized, few countries in the region
fully meet those conditions. As a result, aging can be expected to have
very little impact on financial markets in most countries. However,
the countries with the most pronounced aging trends are, in most
cases, the ones where these conditions are closest to being met. To the
extent that aging can affect financial markets, its impact will occur
through three channels: on asset prices; on portfolio composition;
and on financial portfolios.
Aging and Asset Prices
The life-cycle hypothesis suggests that an increase in the old-age
dependency rate leads to a drop in asset prices.17 Although the life-
cycle framework is intellectually appealing, applying it to real-life
observations has proven difficult. The proposition that aging will lead
to falling asset prices relies on various assumptions—including a fixed
saving rate for young cohorts, a fixed capital supply, and a lack of cap-
ital mobility—that may not be realistic (box 3.5). For example,
younger workers are likely to adjust their saving rate as needed—for
instance, for the potential loss of pension income.
Studies have found that the effect of demographic trends on asset
prices varies depending on the assumptions made. For example, by
releasing the fixed capital supply constraint, Lim and Weil (2003)
show that demography has no impact on asset prices. A consequence
of this lack of impact is that the more it costs to adjust the capital
intensity of production, the greater the effect that aging will have on
these prices. Although the actual numbers depend on the specifica-
tions of the model, the research demonstrates that flexible capital
supply reduces the risk of demographically induced asset price shocks.
chaw_117-150_ch03.qxd 5/30/07 3:14 PM Page 141
142 From Red to Gray
International capital flows should also reduce the effect of local aging
patterns. Their importance in hedging against this effect depends on
how costly cross-country capital movements are and whether there
are information asymmetries and efficient portfolio size limitations.
Aging and Portfolio Composition
The portfolio restructuring hypothesis holds that people’s risk aver-
sion is a function of their age—that is, that the older they are, the less
risk they are willing to take. Consequently, as people age, they are
expected to shift away from risky assets, such as equity, and move
toward instruments of lower volatility. In the United States, stock
ownership is particularly high; according to the 2001 Survey of Con-
sumer Finances, the likelihood of equity ownership increases until
age 59 and then starts declining—but very slowly. At the same time,
liquidation of stock positions is much less pronounced than expected:
according to the survey, by age 75, consumers liquidated only 25 per-
cent of their stocks.
For the most part, however, empirical evidence does not support
the proposition that households shift markedly into cash and riskless
assets at retirement. The two most important asset classes here are
real estate and pension benefits from public or private schemes.18
Growing life expectancy at retirement is not reflected in longer work-
ing lives; therefore, young retirees’ risk aversion is not necessarily
BOX 3.5
Aging and Asset Meltdown
Asset meltdown has been raised as a possible concern in countries where the size of the co-
horts that tend to have positive net savings (typically between age 40 and retirement) is shrink-
ing over time. Thus, when these cohorts decide to divest in order to finance their consumption
in the years when they no longer have labor income, there is always a smaller cohort to pur-
chase the assets that the older generation is selling. This situation results in lower demand and
lower asset prices. If this process accelerates because of an unmanageable shock—such as the
retirement of the baby boom generation—asset prices may fall significantly. It is often argued
that the entry of this generation into their saving-intensive years fueled the lasting bull market of
the 1990s and that, when the baby boomers start to retire, a similarly pronounced downward
pressure on asset prices will lead to a crash. The literature mostly supports the possibility that
some relationship exists between the aging of the labor force, the proportion of the elderly
within the population, and asset prices. However, no model predicts a tectonic movement that
would qualify as asset meltdown and would be comparable to any of the historic crashes (for
example, those of 1929 and 1987).
chaw_117-150_ch03.qxd 5/30/07 3:14 PM Page 142

Aging, Savings, and Financial Markets 143
greater than that of working-age people. In fact, because annuities
underwritten by government, employers, or financial service
providers are stable and secure (unlike wages), young retirees may be
inclined to take more risk in terms of their financial portfolio than if
they were not retired. If housing markets are liquid and values are
relatively stable, real estate is also seen as a less risky and relatively
liquid component of household portfolios.
The manner in which households react to aging, shifting away
from risky assets long after retirement, if at all, crucially depends on
how well the institutions that provide a stable retirement income
flow—the state and private pension fund managers—meet their obli-
gations. According to a report prepared for the Group of 10, analysts
expect that, in the foreseeable future, the effect of aging on portfolio
composition will be dominated by regulatory changes (Visco 2005).
The share of stocks is still greater than 50 percent in the countries
with the largest pension fund assets: Japan, the Netherlands, the
United Kingdom, and the United States. If pension funds start shifting
from stocks to bonds, equity prices may go down, and bond yield
curves may also shift downward. The extent of such movements is
debated; estimates vary between 1 percent and 15 percent for equity
prices and from 10 to 150 points in terms of the yield curve (using U.S.
data) (Visco 2005). Large-scale portfolio rebalancing looks unlikely,
however, because pension fund managers need to make up for the
funding gap and therefore need large equity positions. Even if gradual
shifts are deemed desirable, it is more likely that adjustments will be
made at the margin, when newly collected premiums are invested.
Aging and Portfolio Structure
As a consequence of the shift toward defined-contribution schemes,
the share of fully funded defined-benefit obligations decreases. The
total amount of these liabilities keeps increasing, however—and so
does the expected maturity of these liabilities, as life expectancy at
retirement increases. As asset-liability matching becomes more diffi-
cult, the availability of instruments with very long maturities (30 years
and more) and inflation-linked issues (such as index bonds) is consid-
ered crucial. Today, the total supply of long-term bonds and index-
linked bonds is 30 percent and 35 percent, respectively, of total
pension fund assets (Visco 2005). Given that private issuers are reluc-
tant to issue bonds that have such long maturities, public issues
may need to be relied on if demand for these instruments is to be
met. Future portfolio shifts by financial institutions that underwrite
long-term defined-benefit obligations may be in the direction of
investing in these instruments.
chaw_117-150_ch03.qxd 5/30/07 3:14 PM Page 143

144 From Red to Gray
Other instruments—still in their experimental phase—include
longevity bonds and macro swaps. The first, championed by the Euro-
pean Investment Bank, links payments over the bond’s life span to
the number of surviving elderly in a given cohort; the issuer shares
the risk with commercial reinsurers. There are no experiences with
this type of security; it was to be issued for the first time in 2006.
Macro swaps are intended to make use of the complementary risks
inherent in pension and health insurance in a way that ensures that
unexpected increases in pension obligations are partially underwrit-
ten by health insurers, whose premiums increase in line with
increased longevity. Such macro swaps do not seem to have been
introduced as securitized instruments yet.
Policy Implications
The conventional wisdom is that aging economies will be constrained
by savings that dry up as older populations save less, reducing the
resources available for investment and growth. This fear has merits in
mature industrial countries in which growth rates fluctuate only mar-
ginally around a long-term trend. However, for Eastern European
and former Soviet countries, the relationship between aging and sav-
ing is more complicated. In the first place, aging is proceeding rapidly
in virtually all EU15 countries, whereas the countries in Eastern
Europe and the former Soviet Union are a more heterogeneous
group. For a number of these countries, dependency rates are not
projected to decline over the next two decades, so demographically
driven concerns about declining saving rates are not relevant.
For the countries that are experiencing rising dependency rates,
various factors could offset the pure demographic effect and help push
up savings. These factors include expected higher levels of income, a
likely desire on the part of households to replenish depleted assets,
and institutional reforms that deepen financial reforms and increase
the quality and availability of saving instruments. In most of the East-
ern European and former Soviet countries that are at risk because of
their dependency rates, these offsetting factors are likely to more than
compensate for the negative impact of dependency rates. However, for
the new EU member countries, which are more developed, these off-
setting factors may not be enough. Domestic savings could, indeed,
decline in these countries. In an open economy, these countries can
borrow (that is, run a current account deficit) in international markets
to finance domestic investments. Currently, none of the countries in
the region have financial markets that are significantly integrated into
international flows, so further opening up of domestic markets will be
chaw_117-150_ch03.qxd 5/30/07 3:14 PM Page 144
Aging, Savings, and Financial Markets 145
needed. However, all countries cannot be borrowers at the same time.
With most industrial countries experiencing similar demographic
trends, the scope for aging countries in the region to rely on interna-
tional borrowing to compensate for lower domestic savings may be
limited, even if their markets become more internationally integrated.
Although the effects of aging on saving are more complicated than
a demographically determined view suggests, aging can still present
potentially serious macroeconomic risks if policy makers do not
respond accordingly. If economic policies do not support productivity
gains and aggregate growth, the expected income effects on savings
will not materialize. The confidence of foreign investors will also suf-
fer. Moreover, a favorable saving scenario depends on financial mar-
kets developing further as well as the pension reform agenda being
completed (more on this in chapter 4).
The development of financial markets will be important. Currently,
these markets are small and, outside the more advanced parts of Cen-
tral and Eastern Europe, are limited essentially to bank deposits. In
much of the region, income levels and distributions do not allow a
sufficiently large demand for other financial products to develop. The
impact of aging on these markets is unlikely to be a major factor in
itself. Private pension schemes may subject pension-reforming coun-
tries with fledgling capital markets to price pressures caused by aging,
but it is unlikely that aging as a trend will have a pronounced effect
in the near future in Eastern Europe and the former Soviet Union.
The shock of aging manifested by the retirement of the baby boom
generation is not expected to bring about major upheavals in the
region’s more developed markets, and its effect is expected to be
hardly noticeable in much of the region. Not all countries had a baby
boom, and in those that did, the baby boom generation did not accu-
mulate investments sufficient to affect financial markets significantly.
Portfolio structures are unlikely to change significantly as a result
of aging because institutional investors and pension funds, which
dominate the market where they exist, are already heavily invested
in debt issues. Indeed, whereas governments in more developed mar-
kets need to support the emergence of long-term, specialized instru-
ments suitable for matching the long-term liabilities of pension
providers, governments in the Eastern European and former Soviet
countries have a more urgent concern in ensuring a reasonable sup-
ply of domestic equity and private debt.
The most pressing issue is mandatory annuitization of private pen-
sion savings in countries that have already committed themselves to it.
In this respect, very little has been done. Governments urgently need
to consider the level of mandatory annuitization, bearing in mind the
retirement income to be received from the remaining pay-as-you-go
chaw_117-150_ch03.qxd 5/30/07 3:14 PM Page 145
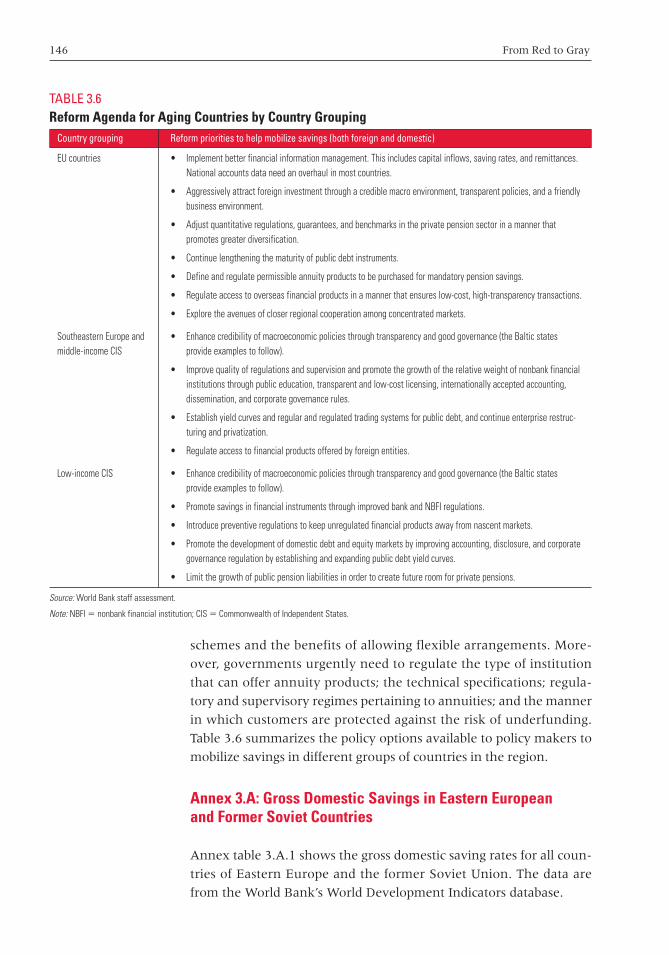
146 From Red to Gray
schemes and the benefits of allowing flexible arrangements. More-
over, governments urgently need to regulate the type of institution
that can offer annuity products; the technical specifications; regula-
tory and supervisory regimes pertaining to annuities; and the manner
in which customers are protected against the risk of underfunding.
Table 3.6 summarizes the policy options available to policy makers to
mobilize savings in different groups of countries in the region.
Annex 3.A: Gross Domestic Savings in Eastern European and Former Soviet Countries
Annex table 3.A.1 shows the gross domestic saving rates for all coun-
tries of Eastern Europe and the former Soviet Union. The data are
from the World Bank’s World Development Indicators database.
TABLE 3.6Reform Agenda for Aging Countries by Country Grouping
Country grouping Reform priorities to help mobilize savings (both foreign and domestic)
EU countries
Southeastern Europe andmiddle-income CIS
Low-income CIS
• Implement better financial information management. This includes capital inflows, saving rates, and remittances.National accounts data need an overhaul in most countries.
• Aggressively attract foreign investment through a credible macro environment, transparent policies, and a friendlybusiness environment.
• Adjust quantitative regulations, guarantees, and benchmarks in the private pension sector in a manner thatpromotes greater diversification.
• Continue lengthening the maturity of public debt instruments.
• Define and regulate permissible annuity products to be purchased for mandatory pension savings.
• Regulate access to overseas financial products in a manner that ensures low-cost, high-transparency transactions.
• Explore the avenues of closer regional cooperation among concentrated markets.
• Enhance credibility of macroeconomic policies through transparency and good governance (the Baltic statesprovide examples to follow).
• Improve quality of regulations and supervision and promote the growth of the relative weight of nonbank financialinstitutions through public education, transparent and low-cost licensing, internationally accepted accounting,dissemination, and corporate governance rules.
• Establish yield curves and regular and regulated trading systems for public debt, and continue enterprise restruc-turing and privatization.
• Regulate access to financial products offered by foreign entities.
• Enhance credibility of macroeconomic policies through transparency and good governance (the Baltic statesprovide examples to follow).
• Promote savings in financial instruments through improved bank and NBFI regulations.
• Introduce preventive regulations to keep unregulated financial products away from nascent markets.
• Promote the development of domestic debt and equity markets by improving accounting, disclosure, and corporategovernance regulation by establishing and expanding public debt yield curves.
• Limit the growth of public pension liabilities in order to create future room for private pensions.
Source: World Bank staff assessment.
Note: NBFI � nonbank financial institution; CIS � Commonwealth of Independent States.
chaw_117-150_ch03.qxd 5/30/07 3:14 PM Page 146

Aging, Savings, and Financial Markets 147
Annex 3.B: Selected Financial Sector Indicators
Annex table 3.B.1 compares financial indicators for the countries of
Eastern Europe and the former Soviet Union with those of selected
nontransition OECD member countries. Even the most advanced
countries of the region do not have financial markets as developed as
the industrial OECD countries.
TABLE 3.A.1Gross Domestic Saving in Eastern European and Former Soviet Countries
Sample length Average gross domestic saving
Country Start End Full sample Since 1995 GDP per capita ($, PPP)
Tajikistan 1985 2004 16.5 10.7 1,104Moldova 1980 2004 11.0 �0.2 1,613Uzbekistan 1987 2004 19.0 21.1 1,732Kyrgyz Republic 1986 2004 8.6 8.2 1,785Serbia and Montenegro 1993 2004 �2.5 �2.5 2,620Georgia 1970 2004 12.5 1.6 2,756Azerbaijan 1990 2004 15.6 16.2 3,864Armenia 1990 2004 �2.9 �6.6 3,907Albania 1980 2004 7.9 �0.8 4,579Simple average (GDP per capita <$5,000, PPP-adjusted) 9.5 5.3
Ukraine 1987 2004 25.6 22.1 5,847Macedonia, FYR 1990 2004 8.3 6.9 6,074Belarus 1990 2004 23.0 20.6 6,391Turkmenistan 1987 2004 26.7 24.4 6,498Bosnia and Herzegovina 1994 2004 n.a. n.a. 6,571Kazakhstan 1990 2004 22.0 22.6 6,936Turkey 1970 2004 16.6 19.1 7,135Bulgaria 1980 2004 22.1 13.4 7,410Romania 1980 2004 19.4 14.8 7,721Russian Federation 1989 2004 32.1 29.9 9,128Simple average (GDP per capita $5,000–$9,999, PPP-adjusted) 21.8 19.3
Latvia 1970 2004 27.7 16.5 11,148Croatia 1990 2004 12.4 15.5 11,250Poland 1990 2004 22.5 17.9 11,921Lithuania 1990 2004 16.1 14.2 12,051Estonia 1980 2004 23.0 21.7 12,773Slovak Republic 1984 2004 25.4 23.8 13,437Hungary 1970 2004 27.1 25.5 15,399Czech Republic 1990 2004 27.0 26.3 17,937Slovenia 1990 2004 23.7 23.7 19,251Simple average (GDP per capita >$9,999, PPP-adjusted) 22.8 20.6
Average 17.9 15.0
Source: World Development Indicators database.
Note: GDP � gross domestic product; PPP � purchasing power parity.
chaw_117-150_ch03.qxd 5/30/07 3:14 PM Page 147

TABL
E 3.
B.1
Sele
cted
Fin
anci
al S
ecto
r Ind
icat
ors
for E
aste
rn E
urop
ean
and
Form
er S
ovie
t and
Sel
ecte
d N
on–E
aste
rn E
urop
ean
and
Form
er S
ovie
t OEC
DCo
untr
ies,
200
4Pr
ivate
bon
d m
arke
t Pu
blic
bon
d m
arke
tFin
anci
al sy
stem
dep
osits
Stoc
k mar
ket c
apita
lizat
ion
capi
taliz
atio
nca
pita
lizat
ion
Tota
lGD
P
Coun
tryas
per
cent
age
as p
erce
ntag
e as
per
cent
age
as p
erce
ntag
e as
per
cent
age
of G
DPUS
$ (bi
llion)
of G
DPUS
$ (bi
llion)
of G
DPUS
$ (bi
llion)
of G
DPUS
$ (bi
llion)
of G
DPUS
$ (bi
llion)
US$ (
billio
n)Ky
rgyz
Rep
ublic
7.30.6
61.5
0.13
——
——
8.80.7
99
Arme
nia8.8
1.40
0.70.1
00.0
0.01
——
9.51.5
216
Geor
gia7.7
1.24
3.80.6
2—
——
—11
.61.8
516
Ukra
ine—
—12
.339
.35—
——
—12
.339
.3531
9Ka
zakh
stan
16.0
21.24
7.810
.43—
——
—23
.831
.6713
3M
aced
onia,
FYR
26.9
4.31
——
——
——
26.9
4.31
16Ro
mania
20.4
38.14
11.9
22.23
——
——
32.3
60.37
187
Latvi
a27
.58.2
510
.33.0
9—
——
—37
.811
.3430
Mold
ova
22.7
2.27
21.0
2.10
——
——
43.7
4.37
10Bu
lgaria
34.5
23.10
9.56.3
5—
——
—44
.029
.4567
Alba
nia44
.47.9
8—
——
——
—44
.47.9
818
Lithu
ania
23.9
11.94
22.5
11.23
——
——
46.3
23.16
50Ru
ssian
Fede
ratio
n24
.637
8.23
43.1
663.9
30.0
—3
40.82
70.4
1,082
.971,5
39Sl
oven
ia49
.820
.9326
.211
.02—
——
—76
.131
.9642
Esto
nia33
.37.3
246
.410
.21—
——
—79
.717
.5322
Croa
tia59
.532
.1325
.013
.52—
——
—84
.545
.6554
Slov
ak R
epub
lic53
.946
.348.8
7.55
0.0—
2723
.3689
.877
.2686
Polan
d34
.917
1.10
22.4
109.8
50.0
—34
164.4
290
.944
5.37
490
Hung
ary
39.8
64.12
22.9
36.80
4.77.5
543
69.58
110.6
178.0
516
1Tu
rkey
38.6
213.3
827
.715
3.29
0.0—
5228
5.61
118.0
652.2
855
3Cz
ech R
epub
lic60
.811
3.12
22.7
42.30
6.912
.8650
93.75
140.9
262.0
218
6Ire
land
80.7
110.6
254
.474
.4922
.230
.4021
29.36
178.7
244.8
713
7Au
stria
83.1
224.2
624
.365
.5839
.110
5.45
3695
.8718
1.949
1.16
270
Germ
any
96.7
2,371
.7942
.21,0
34.73
39.1
959.2
741
1,010
.1021
9.15,3
75.89
2,454
Italy
52.6
868.9
642
.369
8.29
48.0
793.0
186
1,417
.7422
8.83,7
78.00
1,651
Austr
alia
73.0
468.7
810
8.469
5.95
38.3
245.6
715
94.06
234.3
1,504
.4564
2Fra
nce
67.1
1,221
.7780
.91,4
73.92
44.5
811.3
555
1,011
.1924
8.04,5
18.22
1,822
Unite
d King
dom
115.0
2,149
.9312
3.02,2
98.11
16.1
300.1
028
519.9
428
1.95,2
68.07
1,869
Denm
ark
51.1
92.95
57.8
105.1
313
0.223
6.99
4683
.1828
4.851
8.25
182
Neth
erlan
ds10
5.552
9.64
96.8
485.9
762
.931
5.59
4824
0.32
313.1
1,571
.5250
2Un
ited S
tate
s58
.87,3
02.48
131.6
16,33
3.43
111.8
13,86
9.66
455,6
31.17
347.6
43,13
6.75
12,41
0Be
lgium
94.8
312.8
413
4.144
2.63
37.6
124.1
495
312.7
136
1.31,1
92.31
330
Japa
n12
0.54,6
99.04
73.2
2,853
.2543
.71,7
04.33
138
5,380
.1337
5.314
,636.7
53,9
00Sw
itzer
land
148.2
391.2
321
7.657
4.35
36.2
95.66
3182
.9143
3.41,1
44.15
264
Sour
ce:W
orld
Ban
k Fi
nanc
ial S
truct
ure
data
set 2
006.
Note
:GDP
�gr
oss
dom
estic
pro
duct
; — �
not
ava
ilabl
e.
148
chaw_117-150_ch03.qxd 5/30/07 3:14 PM Page 148

Aging, Savings, and Financial Markets 149
Notes
1. These figures are based on data from the 2001 Survey of ConsumerFinances, available at https://www.federalreserve.gov/pubs/oss/oss2/scfindex.html.
2. It is also important to note that longevity correlates positively with life-time income and wealth. Thus, the wealthy elderly will live longer onaverage and may consider decumulation later than the average elderly,if at all. If investment income is sufficient to cover expenses (includinghealth), and if no major investments in physical capital or cash transfersto younger generations are necessary, then aging provides no compellingreason to liquidate investments or particular asset holdings.
3. Unfortunately, the data cannot be shown for individuals age 65 orolder—a more appropriate threshold for these countries because it betterapproximates retirement age.
4. See Poterba (2004) for a discussion of these effects. 5. As will be discussed in later chapters, unless current policies change
aging will result in larger fiscal deficits (that is, negative government sav-ings). Although the extent to which households increase their savings inresponse to deteriorating fiscal situations (that is, whether Ricardianequivalence holds) is still hotly debated by economists, households willinevitably increase their savings in anticipation of future increases intaxes or greater uncertainty about their government’s ability to deliveron promises such as pensions and health care services. See Romer (1996)for a discussion.
6. Loayza, Schmidt-Hebbel, and Servén (2000) and Faruqee (2002), respec-tively, have done literature reviews of the two approaches.
7. Since Modigliani’s seminal work on the life-cycle hypothesis in the 1950s(Modigliani and Brumberg 1954), a large empirical literature hasexplored the impact of aging and, more generally, demographic changeson savings. See Loayza, Schmidt-Hebbel, and Servén (2000) for a review.
8. They find that in developing countries, other things being equal, a dou-bling of income per capita will raise the private saving rate by 10 per-centage points of disposable income.
9. As a result of those weaknesses, very little empirical work has been doneon saving behavior in Eastern European and former Soviet countries.
10. For instance, in the Kyrgyz Republic, even though data on savings byinstitution have been available since 1990, the sum of the institutions(that is, total savings) is not large enough to explain the high observedinvestment in the early 1990s (see figure 3.5). Therefore, the early yearsare dropped from the empirical analysis.
11. In the World Development Indicators database, the real interest rates forKazakhstan, Portugal, and Romania were missing for a number of years.Therefore, the real interest rates were constructed using nominal inter-est rates and inflation rates from the IMF’s International Financial Statis-tics database. For Kazakhstan, the discount/bank rate was used asthe nominal interest rate, and for Romania, the base rate was used. ForPortugal, Eurostat data on “loans to enterprises up to 1 year” were usedas the nominal interest rate. The real interest rate was calculated asthe nominal interest rate minus current-period inflation. Government
chaw_117-150_ch03.qxd 5/30/07 3:14 PM Page 149
150 From Red to Gray
savings do not constitute the budget balance, as is commonly used inprivate saving regression. Instead, the national accounts concept of gov-ernment savings from the UN database is used.
12. The region’s sample is unbalanced in the years covered: Belarus (2000,2001), Bulgaria (1998–2001), the Czech Republic (1998–2001), Estonia(1998–2001), Kazakhstan (1998, 2001), the Kyrgyz Republic(1998–2001), Latvia (1998–2001), Lithuania (1998–2001), Poland(1998–2001), Romania (1998–2001), and Ukraine (1998–2001). For allthe other countries, data are available from 1998 to 2001: Belgium,Colombia, Finland, France, Greece, Italy, Japan, Mexico, the Netherlands,Portugal, Spain, and Sweden.
13. If longer time-series data were available, it would have been possible toestimate more robust saving and consumption equations and examinewhether, indeed, current savings (consumption) are lower (higher) thanwhat is expected from the determinants. An implication of this hypoth-esis is that future savings (consumption) should be more (less) than theusual determinants.
14. The oil-producing countries in the region are the exception to the rule. 15. These factors include the availability of domestic securities other than
public debt; efficient portfolio-size limitations; performance benchmarksthat give more weight to domestic capital market indicators; high-yielddomestic public debt issues generated by the government’s financingneeds; home bias, driven by information asymmetry and other factors;and limited competition among pension funds, driven by insufficient dis-closure regulations and limits on fund members’ movement.
16. Corporate savings and investments are interesting from an aging aspectonly if the corporation’s financial position is directly affected by agingand if corporations channel their savings through financial markets.
17. In a two-period model, workers work for one period and retire in thesecond. If the saving rate of the working cohort is fixed and so is the sup-ply of capital goods, an increase in the young cohort’s population pushesasset prices up. If a large worker cohort retires and is followed by asmaller one, asset prices will drop. The decline will be smooth if drivenby the slowly moving trend of aging and can be disruptive if caused by atrough following a baby boom generation.
18. The Survey of Health, Aging, and Retirement in Europe (SHARE), avail-able at http://www.share-project.org, studied wealth in householdsheaded by people older than 50 in selected EU countries to establish theimportance of various asset categories in old-age wealth. The surveyfound that financial asset levels vary much more than net worth. Thisphenomenon is driven by the different weight of real estate in the port-folio of people close to retirement. The survey also found that in coun-tries where home ownership is high, financial savings are lower and viceversa. Although this finding may be intuitive, it has important implica-tions in terms of old-age income: real estate can contribute to old-ageincome security only if adequate financial instruments—such as reversemortgages—are developed. The same study also claims that financial lit-eracy and sophistication have an impact on portfolio composition: incountries where people spend more time managing their finances—taken as a proxy for financial sophistication—individuals tend to invest ahigher share of their financial assets in more risky financial assets.
chaw_117-150_ch03.qxd 5/30/07 3:14 PM Page 150
151
Introduction
An inevitable consequence of population aging in many Eastern Euro-
pean and former Soviet countries is that, at current benefit levels, pen-
sion spending will have to rise to accommodate the increased number
of elderly people. This is an especially huge challenge for countries
with unfunded pay-as-you-go (PAYG) social security systems, in many
of which pension spending is already substantial. The good news is
that a number of countries in the region have begun considering meas-
ures to mitigate the impact of imminent demographic changes and are
engaging in aggressive pension reform. Other countries have yet to
come to terms with the looming pressure of rising pension expendi-
tures as their populations age. Although most of these countries are
young, a few older countries have been slow to introduce much-
needed reforms, and unless they change their pace, pension spending
will come to pose a much heavier burden over time.
As pension expenditures have increased, the number of contribu-
tors across age groups has fallen considerably in most countries in the
region. Even as economic growth has picked up in some countries,
this decline has not reversed itself. As a result, the ratio of beneficiar-
ies to contributors and the resulting ratio of expenditures to revenues
Aging and Pension Expenditures
CHAPTER 4
chaw_151-176_ch04.qxd 5/30/07 3:15 PM Page 151
152 From Red to Gray
are much higher than even the aging population would suggest. In
the longer run, as today’s contributors begin to retire, many of them
will not be eligible for pension benefits—unlike the current situation,
in which most retirees collect some form of pension. This shift will put
pressures on governments to consider some type of flat social assis-
tance benefit for the elderly in addition to the contributory pension
benefits being paid now—pressures that have implications for the
financing requirements and appropriate design of old-age support.
This chapter analyzes the potential impact of aging on pension
expenditures. Current pension systems in the countries of the region
are described next. Then the projected impact of aging on those
expenditures is considered. Prospects for further parametric reform
are explored in the following section. The chapter concludes with a
discussion of reform options.
Current Pension Systems in Countries of the Region
Pension systems in Eastern European and former Soviet countries
have a number of unique features that lead to a unique set of prob-
lems. One is the high pension system dependency rates, defined as the
ratio of beneficiaries to contributors (box 4.1). Partly reflecting the
aging of the population, these high dependency rates also arise partly
from the labor market transitions still under way in the region.
Although the vast majority of the region’s elderly population collect
pensions, the majority of the working-age population does not con-
tribute to a pension system. This situation results from the high unem-
ployment rates among some age groups and the lower retirement ages
and early retirement provisions still prevalent in the region, but even
more from the growing informalization of the labor market.
Under the socialist regimes, all physically able working-age indi-
viduals worked, and their employers made contributions on their
behalf, which generated pension entitlements for the majority of the
population. Contribution rates were usually high and benefits gener-
ous, but neither of these points mattered, because employers typically
were not concerned about competitiveness or generating profits. In
the posttransition environment, public sector employers and large
enterprises continue to pay contributions, but even the large public
enterprises often accumulate arrears in the social security funds, the
resolution of which depends heavily on the solvency of the enter-
prise. The smaller and newer private enterprises often conclude that
it is not worth participating in the system. Contribution rates are
high; systems seem potentially insolvent, so that benefits provided
chaw_151-176_ch04.qxd 5/30/07 3:15 PM Page 152

Aging and Pension Expenditures 153
today may not be available for workers when they retire; and other
taxes and regulations that accompany formalization of the labor force
are all disincentives. Because enforcement is rarely strict, a large per-
centage of people who are working are not contributing.
Figure 4.1 shows the huge gap between the old-age dependency
rates as measured by population statistics and the dependency rates
derived from the pension systems. On average, pension system
BOX 4.1
Glossary of Pension Terms
Defined-benefit plan: A pension plan with a guarantee by the insurer or pension agency that a
benefit based on a prescribed formula will be paid. Such plans can be fully funded or unfunded.
Defined-contribution plan: A pension plan in which the periodic contribution is prescribed and
the benefit depends on the contribution plus the investment return on accumulated contribu-
tions. Typically, such plans are fully funded.
Full funding: The accumulation of pension reserves that total 100 percent of the present value
of all pension liabilities owed to current members.
Indexation: Increases in benefits by reference to an index, usually of growth in prices, although
in some cases growth in average earnings.
Legal retirement age: The normal retirement age written into pension statutes.
Means-tested benefit: A benefit that is paid only if the recipient’s income falls below a certain
level.
Notional accounts: A defined-benefit plan that mimics the structure of funded defined-
contribution plans but remains unfunded (except for a potential partial reserve fund).
Old-age dependency rate: The ratio of older persons to working-age individuals. The old-age
dependency rate is defined as the number of persons older than age 65 divided by the number
of persons age 15 to 64.
Pay-as-you-go system: A method of financing in which current outlays on pension benefits are
paid out of the current revenues from an earmarked payroll tax.
Pension system dependency rate: The ratio of persons receiving pensions from a certain pen-
sion scheme divided by the number of workers contributing to the same scheme in the same
period.
Social pension: A pension paid solely on the basis of age and citizenship, without regard to
work or contribution records.
chaw_151-176_ch04.qxd 5/30/07 3:15 PM Page 153
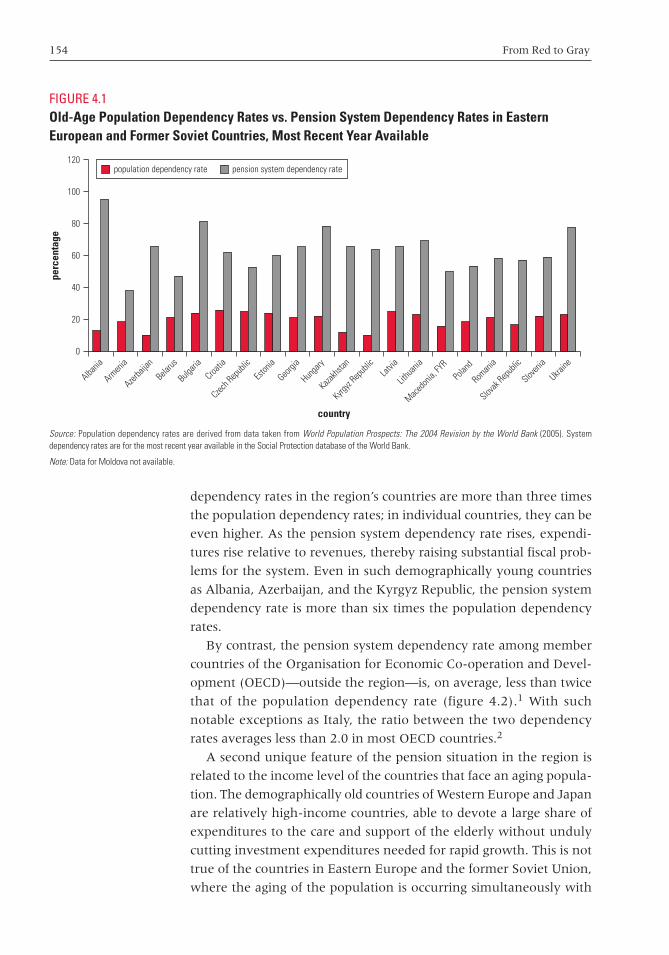
154 From Red to Gray
dependency rates in the region’s countries are more than three times
the population dependency rates; in individual countries, they can be
even higher. As the pension system dependency rate rises, expendi-
tures rise relative to revenues, thereby raising substantial fiscal prob-
lems for the system. Even in such demographically young countries
as Albania, Azerbaijan, and the Kyrgyz Republic, the pension system
dependency rate is more than six times the population dependency
rates.
By contrast, the pension system dependency rate among member
countries of the Organisation for Economic Co-operation and Devel-
opment (OECD)—outside the region—is, on average, less than twice
that of the population dependency rate (figure 4.2).1 With such
notable exceptions as Italy, the ratio between the two dependency
rates averages less than 2.0 in most OECD countries.2
A second unique feature of the pension situation in the region is
related to the income level of the countries that face an aging popula-
tion. The demographically old countries of Western Europe and Japan
are relatively high-income countries, able to devote a large share of
expenditures to the care and support of the elderly without unduly
cutting investment expenditures needed for rapid growth. This is not
true of the countries in Eastern Europe and the former Soviet Union,
where the aging of the population is occurring simultaneously with
FIGURE 4.1Old-Age Population Dependency Rates vs. Pension System Dependency Rates in EasternEuropean and Former Soviet Countries, Most Recent Year Available
Source: Population dependency rates are derived from data taken from World Population Prospects: The 2004 Revision by the World Bank (2005). Systemdependency rates are for the most recent year available in the Social Protection database of the World Bank.
Note: Data for Moldova not available.
0
60
40
20
80
100
120
country
perc
enta
ge
Albania
population dependency rate pension system dependency rate
Armen
ia
Azerba
ijan
Belarus
Bulgari
a
Croatia
Czech R
epub
lic
Eston
ia
Georgi
a
Hunga
ry
Kazakhs
tan
Kyrgyz
Repub
licLat
via
Lithu
ania
Macedo
nia, FY
RPo
land
Roman
ia
Slovak
Repub
lic
Sloven
ia
Ukraine
chaw_151-176_ch04.qxd 5/30/07 3:15 PM Page 154
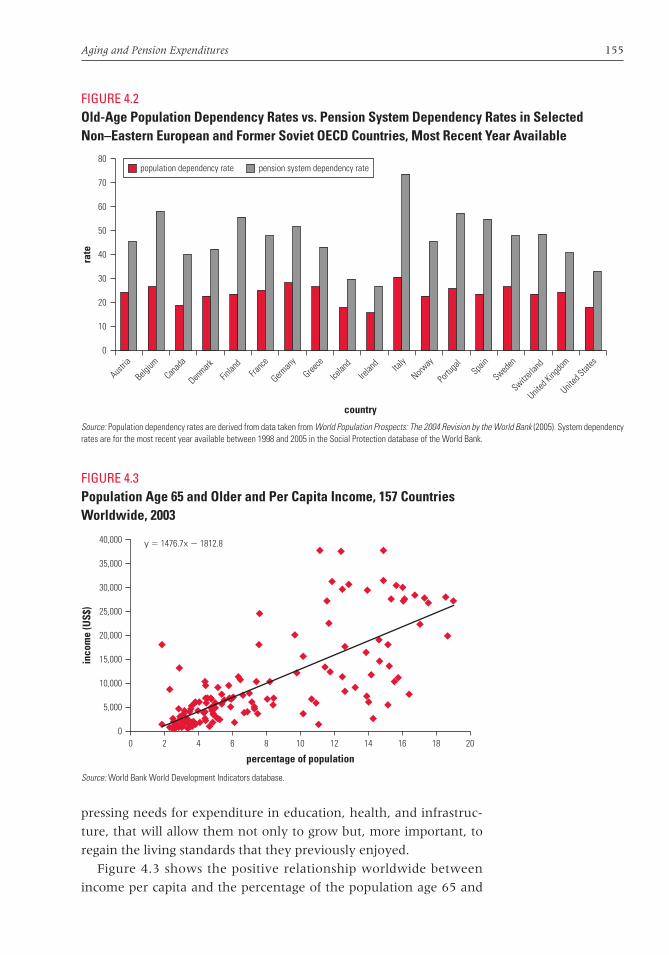
Aging and Pension Expenditures 155
pressing needs for expenditure in education, health, and infrastruc-
ture, that will allow them not only to grow but, more important, to
regain the living standards that they previously enjoyed.
Figure 4.3 shows the positive relationship worldwide between
income per capita and the percentage of the population age 65 and
FIGURE 4.2Old-Age Population Dependency Rates vs. Pension System Dependency Rates in SelectedNon–Eastern European and Former Soviet OECD Countries, Most Recent Year Available
Source: Population dependency rates are derived from data taken from World Population Prospects: The 2004 Revision by the World Bank (2005). System dependencyrates are for the most recent year available between 1998 and 2005 in the Social Protection database of the World Bank.
0
30
20
10
40
60
80
50
70
country
rate
population dependency rate pension system dependency rate
Austria
Belgium
Canad
a
Denmark
Finlan
dFra
nce
German
y
Greece
Icelan
dIre
land Ita
ly
Norway
Portu
gal
Spain
Sweden
Switzerla
nd
United
Kingdo
m
United
States
FIGURE 4.3Population Age 65 and Older and Per Capita Income, 157 Countries Worldwide, 2003
Source: World Bank World Development Indicators database.
00 2 4 6 8 10 12 14 16 18 20
15,000
10,000
5,000
20,000
30,000
40,000
25,000
35,000
percentage of population
inco
me
(US$
)
y � 1476.7x � 1812.8
chaw_151-176_ch04.qxd 5/30/07 3:15 PM Page 155
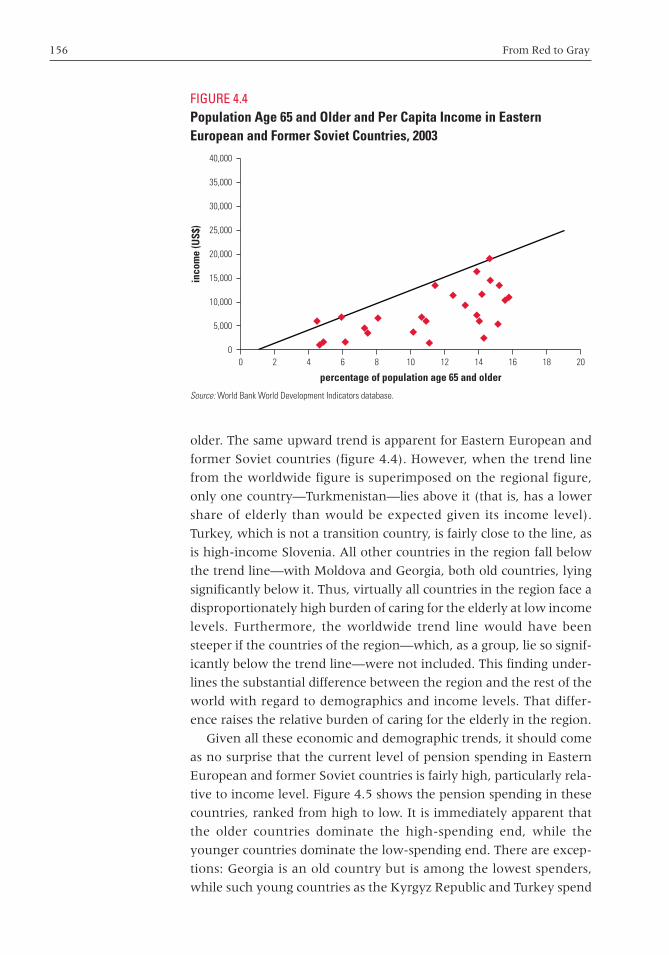
156 From Red to Gray
older. The same upward trend is apparent for Eastern European and
former Soviet countries (figure 4.4). However, when the trend line
from the worldwide figure is superimposed on the regional figure,
only one country—Turkmenistan—lies above it (that is, has a lower
share of elderly than would be expected given its income level).
Turkey, which is not a transition country, is fairly close to the line, as
is high-income Slovenia. All other countries in the region fall below
the trend line—with Moldova and Georgia, both old countries, lying
significantly below it. Thus, virtually all countries in the region face a
disproportionately high burden of caring for the elderly at low income
levels. Furthermore, the worldwide trend line would have been
steeper if the countries of the region—which, as a group, lie so signif-
icantly below the trend line—were not included. This finding under-
lines the substantial difference between the region and the rest of the
world with regard to demographics and income levels. That differ-
ence raises the relative burden of caring for the elderly in the region.
Given all these economic and demographic trends, it should come
as no surprise that the current level of pension spending in Eastern
European and former Soviet countries is fairly high, particularly rela-
tive to income level. Figure 4.5 shows the pension spending in these
countries, ranked from high to low. It is immediately apparent that
the older countries dominate the high-spending end, while the
younger countries dominate the low-spending end. There are excep-
tions: Georgia is an old country but is among the lowest spenders,
while such young countries as the Kyrgyz Republic and Turkey spend
FIGURE 4.4Population Age 65 and Older and Per Capita Income in EasternEuropean and Former Soviet Countries, 2003
Source: World Bank World Development Indicators database.
00 2 4 6 8 10 12 14 16 18 20
15,000
10,000
5,000
20,000
30,000
40,000
25,000
35,000
percentage of population age 65 and older
inco
me
(US$
)
chaw_151-176_ch04.qxd 5/30/07 3:15 PM Page 156
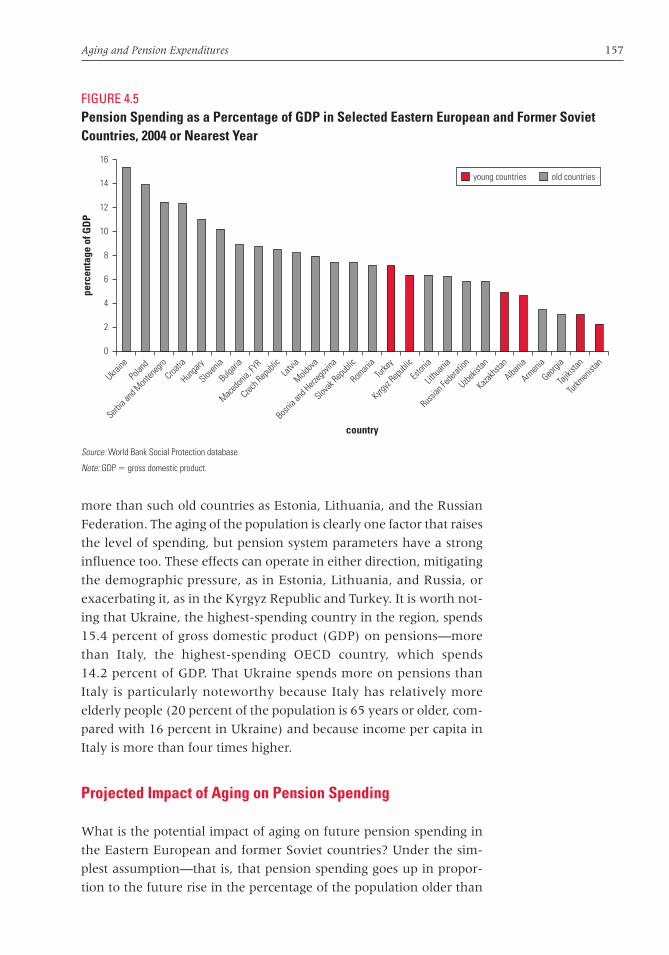
Aging and Pension Expenditures 157
more than such old countries as Estonia, Lithuania, and the Russian
Federation. The aging of the population is clearly one factor that raises
the level of spending, but pension system parameters have a strong
influence too. These effects can operate in either direction, mitigating
the demographic pressure, as in Estonia, Lithuania, and Russia, or
exacerbating it, as in the Kyrgyz Republic and Turkey. It is worth not-
ing that Ukraine, the highest-spending country in the region, spends
15.4 percent of gross domestic product (GDP) on pensions—more
than Italy, the highest-spending OECD country, which spends
14.2 percent of GDP. That Ukraine spends more on pensions than
Italy is particularly noteworthy because Italy has relatively more
elderly people (20 percent of the population is 65 years or older, com-
pared with 16 percent in Ukraine) and because income per capita in
Italy is more than four times higher.
Projected Impact of Aging on Pension Spending
What is the potential impact of aging on future pension spending in
the Eastern European and former Soviet countries? Under the sim-
plest assumption—that is, that pension spending goes up in propor-
tion to the future rise in the percentage of the population older than
FIGURE 4.5Pension Spending as a Percentage of GDP in Selected Eastern European and Former SovietCountries, 2004 or Nearest Year
Source: World Bank Social Protection database.
Note: GDP � gross domestic product.
Ukraine
Polan
d
Serbia
and M
onten
egro
Croatia
Hunga
ry
Sloven
ia
Bulgari
a
Macedo
nia, FY
R
Czech R
epub
licLat
via
Moldova
Bosnia
and H
erzeg
ovina
Slovak
Repub
lic
Roman
iaTur
key
Kyrgyz
Repub
lic
Eston
ia
Lithu
ania
Russian
Fede
ration
Uzbekis
tan
Kazakhs
tan
Albania
Armen
ia
Georgi
a
Tajikis
tan0
6
4
2
8
10
12
14
16
country
perc
enta
ge o
f GD
P
Turkm
enist
an
young countries old countries
chaw_151-176_ch04.qxd 5/30/07 3:15 PM Page 157
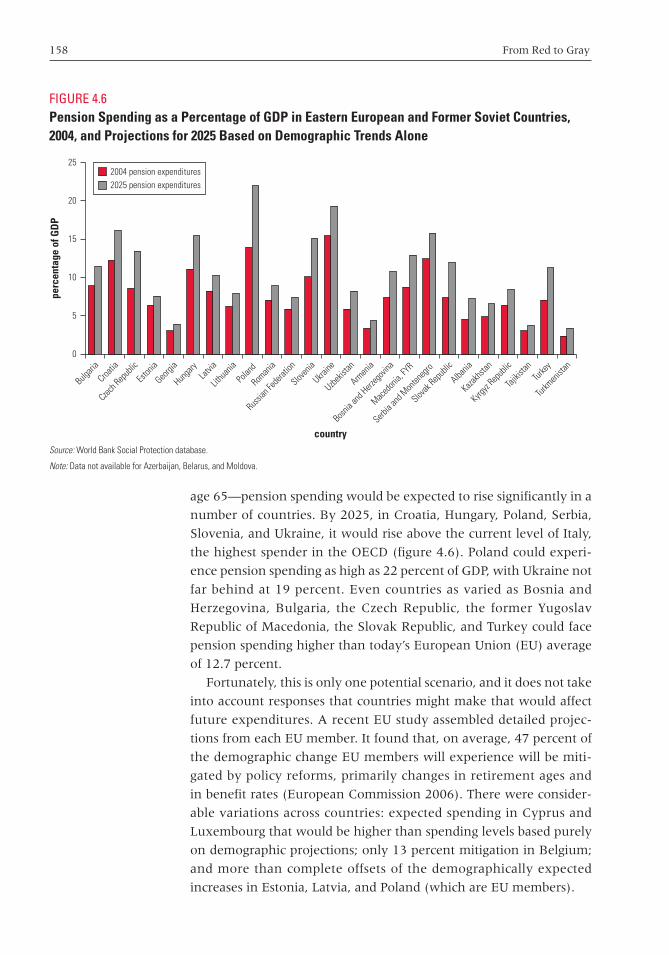
158 From Red to Gray
age 65—pension spending would be expected to rise significantly in a
number of countries. By 2025, in Croatia, Hungary, Poland, Serbia,
Slovenia, and Ukraine, it would rise above the current level of Italy,
the highest spender in the OECD (figure 4.6). Poland could experi-
ence pension spending as high as 22 percent of GDP, with Ukraine not
far behind at 19 percent. Even countries as varied as Bosnia and
Herzegovina, Bulgaria, the Czech Republic, the former Yugoslav
Republic of Macedonia, the Slovak Republic, and Turkey could face
pension spending higher than today’s European Union (EU) average
of 12.7 percent.
Fortunately, this is only one potential scenario, and it does not take
into account responses that countries might make that would affect
future expenditures. A recent EU study assembled detailed projec-
tions from each EU member. It found that, on average, 47 percent of
the demographic change EU members will experience will be miti-
gated by policy reforms, primarily changes in retirement ages and
in benefit rates (European Commission 2006). There were consider-
able variations across countries: expected spending in Cyprus and
Luxembourg that would be higher than spending levels based purely
on demographic projections; only 13 percent mitigation in Belgium;
and more than complete offsets of the demographically expected
increases in Estonia, Latvia, and Poland (which are EU members).
FIGURE 4.6Pension Spending as a Percentage of GDP in Eastern European and Former Soviet Countries,2004, and Projections for 2025 Based on Demographic Trends Alone
Source: World Bank Social Protection database.
Note: Data not available for Azerbaijan, Belarus, and Moldova.
0
15
10
5
20
25
country
perc
enta
ge o
f GD
P
2004 pension expenditures2025 pension expenditures
Bulgari
a
Croatia
Czech R
epub
lic
Eston
ia
Georgi
a
Hunga
ryLat
via
Lithu
ania
Polan
d
Roman
ia
Russian
Fede
ration
Sloven
ia
Ukraine
Uzbekis
tan
Armen
ia
Bosnia
and H
erzeg
ovina
Macedo
nia, FY
R
Serbia
and M
onten
egro
Slovak
Repub
lic
Albania
Kazakhs
tan
Kyrgyz
Repub
lic
Tajikis
tanTur
key
Turkm
enist
an
chaw_151-176_ch04.qxd 5/30/07 3:15 PM Page 158
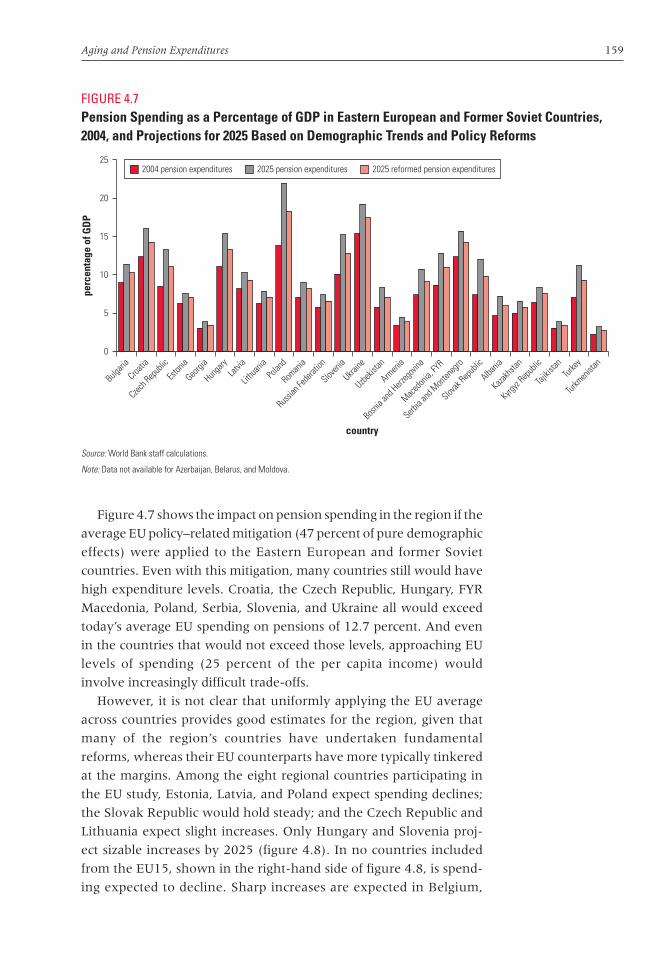
Aging and Pension Expenditures 159
Figure 4.7 shows the impact on pension spending in the region if the
average EU policy–related mitigation (47 percent of pure demographic
effects) were applied to the Eastern European and former Soviet
countries. Even with this mitigation, many countries still would have
high expenditure levels. Croatia, the Czech Republic, Hungary, FYR
Macedonia, Poland, Serbia, Slovenia, and Ukraine all would exceed
today’s average EU spending on pensions of 12.7 percent. And even
in the countries that would not exceed those levels, approaching EU
levels of spending (25 percent of the per capita income) would
involve increasingly difficult trade-offs.
However, it is not clear that uniformly applying the EU average
across countries provides good estimates for the region, given that
many of the region’s countries have undertaken fundamental
reforms, whereas their EU counterparts have more typically tinkered
at the margins. Among the eight regional countries participating in
the EU study, Estonia, Latvia, and Poland expect spending declines;
the Slovak Republic would hold steady; and the Czech Republic and
Lithuania expect slight increases. Only Hungary and Slovenia proj-
ect sizable increases by 2025 (figure 4.8). In no countries included
from the EU15, shown in the right-hand side of figure 4.8, is spend-
ing expected to decline. Sharp increases are expected in Belgium,
FIGURE 4.7Pension Spending as a Percentage of GDP in Eastern European and Former Soviet Countries,2004, and Projections for 2025 Based on Demographic Trends and Policy Reforms
Source: World Bank staff calculations.
Note: Data not available for Azerbaijan, Belarus, and Moldova.
0
15
10
5
20
25
perc
enta
ge o
f GD
P
country
2004 pension expenditures 2025 pension expenditures 2025 reformed pension expenditures
Bulgari
a
Croatia
Czech R
epub
lic
Eston
ia
Georgi
a
Hunga
ryLat
via
Lithu
ania
Polan
d
Roman
ia
Russian
Fede
ration
Sloven
ia
Ukraine
Uzbekis
tan
Armen
ia
Bosnia
and H
erzeg
ovina
Macedo
nia, FY
R
Serbia
and M
onten
egro
Slovak
Repub
lic
Albania
Kazakhs
tan
Kyrgyz
Repub
lic
Tajikis
tanTur
key
Turkm
enist
an
chaw_151-176_ch04.qxd 5/30/07 3:15 PM Page 159
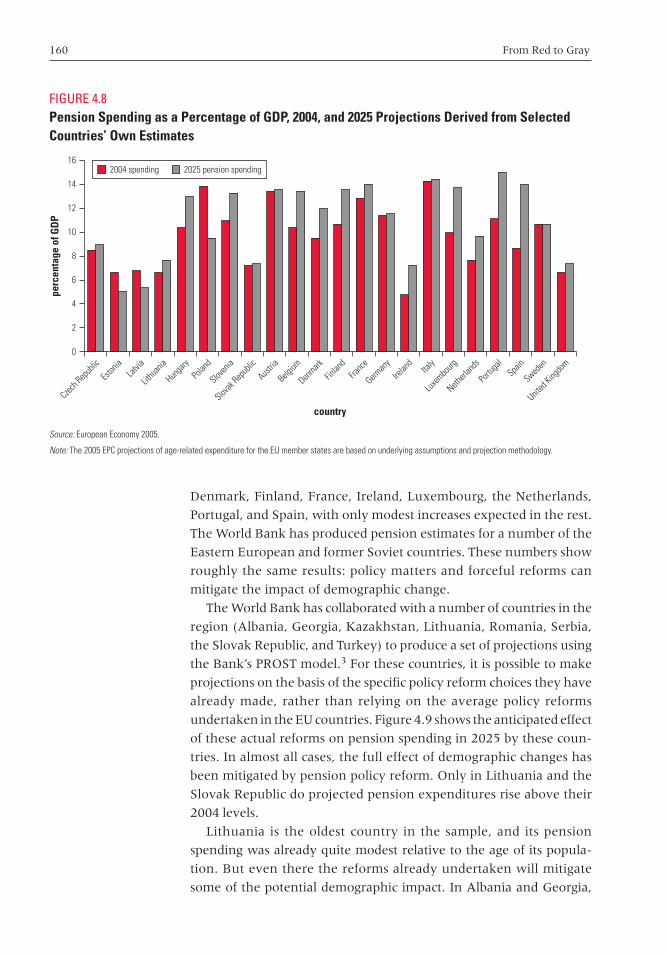
160 From Red to Gray
Denmark, Finland, France, Ireland, Luxembourg, the Netherlands,
Portugal, and Spain, with only modest increases expected in the rest.
The World Bank has produced pension estimates for a number of the
Eastern European and former Soviet countries. These numbers show
roughly the same results: policy matters and forceful reforms can
mitigate the impact of demographic change.
The World Bank has collaborated with a number of countries in the
region (Albania, Georgia, Kazakhstan, Lithuania, Romania, Serbia,
the Slovak Republic, and Turkey) to produce a set of projections using
the Bank’s PROST model.3 For these countries, it is possible to make
projections on the basis of the specific policy reform choices they have
already made, rather than relying on the average policy reforms
undertaken in the EU countries. Figure 4.9 shows the anticipated effect
of these actual reforms on pension spending in 2025 by these coun-
tries. In almost all cases, the full effect of demographic changes has
been mitigated by pension policy reform. Only in Lithuania and the
Slovak Republic do projected pension expenditures rise above their
2004 levels.
Lithuania is the oldest country in the sample, and its pension
spending was already quite modest relative to the age of its popula-
tion. But even there the reforms already undertaken will mitigate
some of the potential demographic impact. In Albania and Georgia,
FIGURE 4.8Pension Spending as a Percentage of GDP, 2004, and 2025 Projections Derived from SelectedCountries’ Own Estimates
Source: European Economy 2005.
Note: The 2005 EPC projections of age-related expenditure for the EU member states are based on underlying assumptions and projection methodology.
Czech R
epub
lic
Eston
iaLat
via
Lithu
ania
Hunga
ryPo
land
Sloven
ia
Slovak
Repub
lic
Austria
Belgium
Denmark
Finlan
dFra
nce
German
yIre
land
Italy
Luxem
bourg
Netherl
ands
Portu
gal
Spain
Sweden
United
Kingdo
m0
6
4
2
8
10
12
14
16
country
perc
enta
ge o
f GD
P
2004 spending 2025 pension spending
chaw_151-176_ch04.qxd 5/30/07 3:15 PM Page 160
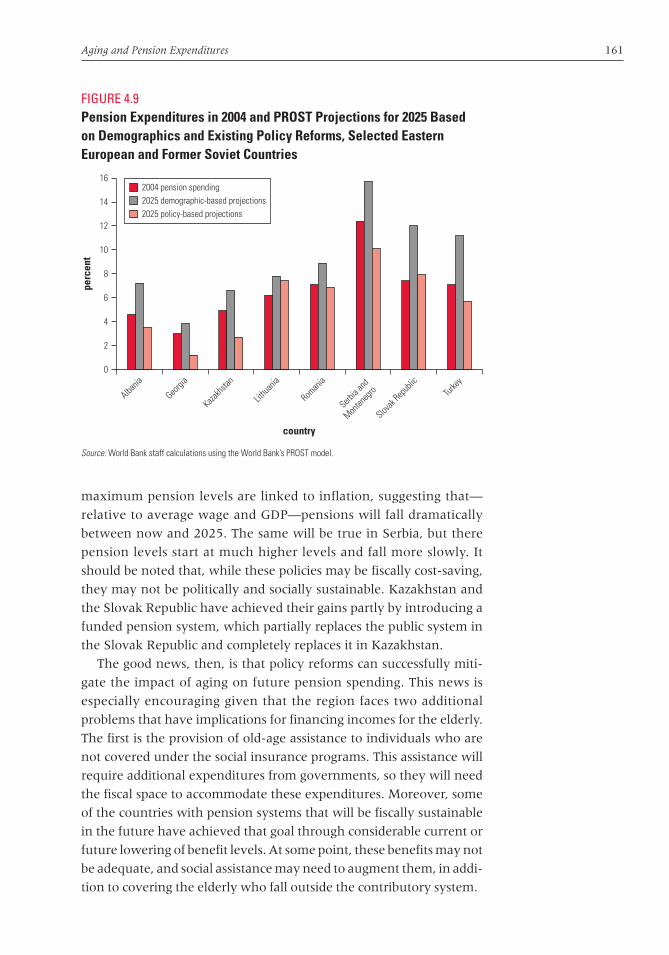
Aging and Pension Expenditures 161
maximum pension levels are linked to inflation, suggesting that—
relative to average wage and GDP—pensions will fall dramatically
between now and 2025. The same will be true in Serbia, but there
pension levels start at much higher levels and fall more slowly. It
should be noted that, while these policies may be fiscally cost-saving,
they may not be politically and socially sustainable. Kazakhstan and
the Slovak Republic have achieved their gains partly by introducing a
funded pension system, which partially replaces the public system in
the Slovak Republic and completely replaces it in Kazakhstan.
The good news, then, is that policy reforms can successfully miti-
gate the impact of aging on future pension spending. This news is
especially encouraging given that the region faces two additional
problems that have implications for financing incomes for the elderly.
The first is the provision of old-age assistance to individuals who are
not covered under the social insurance programs. This assistance will
require additional expenditures from governments, so they will need
the fiscal space to accommodate these expenditures. Moreover, some
of the countries with pension systems that will be fiscally sustainable
in the future have achieved that goal through considerable current or
future lowering of benefit levels. At some point, these benefits may not
be adequate, and social assistance may need to augment them, in addi-
tion to covering the elderly who fall outside the contributory system.
FIGURE 4.9Pension Expenditures in 2004 and PROST Projections for 2025 Basedon Demographics and Existing Policy Reforms, Selected EasternEuropean and Former Soviet Countries
Source: World Bank staff calculations using the World Bank’s PROST model.
2
0
16
14
12
10
8
6
4
country
Albania
perc
ent
2004 pension spending2025 demographic-based projections2025 policy-based projections
Georgi
a
Kazakhs
tan
Lithu
ania
Roman
ia
Serbia
and
Monten
egro
Slovak
Repub
licTur
key
chaw_151-176_ch04.qxd 5/30/07 3:15 PM Page 161

162 From Red to Gray
The second problem is payroll taxes, which are particularly high in
the Eastern European and former Soviet countries. Figure 4.10 shows
the current level of labor taxes, which include income taxes as well
as social contributions, for countries in the region. Although these
tax levels have negative consequences for growth in general and
employment in particular, it becomes extremely difficult to reduce
pension contributions when pension expenditures are high and the
pension system is running a large deficit. Attempts to encourage for-
malization and thus increase revenues by reducing payroll taxes have
not been very successful in Eastern European and former Soviet
countries or elsewhere. Unless the other impediments to formaliza-
tion are addressed simultaneously, reducing pension contributions
results merely in less revenue for the pension system without a
corresponding decrease in liabilities. Thus, the only way to success-
fully reduce payroll taxes and generate more growth and employ-
ment is to reduce pension expenditures.
The bottom part of each bar in figure 4.10 shows employer pension
contributions, the middle section shows employee pension contribu-
tions, and the top section shows all other social insurance taxes, irre-
spective of whether they are paid by the employer or the employee.
The average pension contribution (combining employer and employee
shares) in the region is 28 percent of gross wages, with an overall
social insurance contribution rate of 36 percent. By contrast, in the
FIGURE 4.10Labor Taxes as a Percentage of Gross Wages in Selected Eastern European and FormerSoviet Countries
Source: World Bank Social Protection database.
0
40
30
20
10
50
60
perc
enta
ge o
f gro
ss w
ages
employer pension employee pension other social insurance
Albania
Uzbekis
tan
country
Azerba
ijan
Czech R
epub
lic
Croatia
Eston
ia
Georgi
a
Hunga
ryLat
via
Lithu
ania
Kazakhs
tan
Kyrgyz
Repub
lic
Moldova
Polan
d
Roman
ia
Russian
Fede
ration
Serbia
and M
onten
egro
Slovak
Repub
lic
Sloven
ia
Turkm
enist
anTur
key
Ukraine
chaw_151-176_ch04.qxd 5/30/07 3:15 PM Page 162
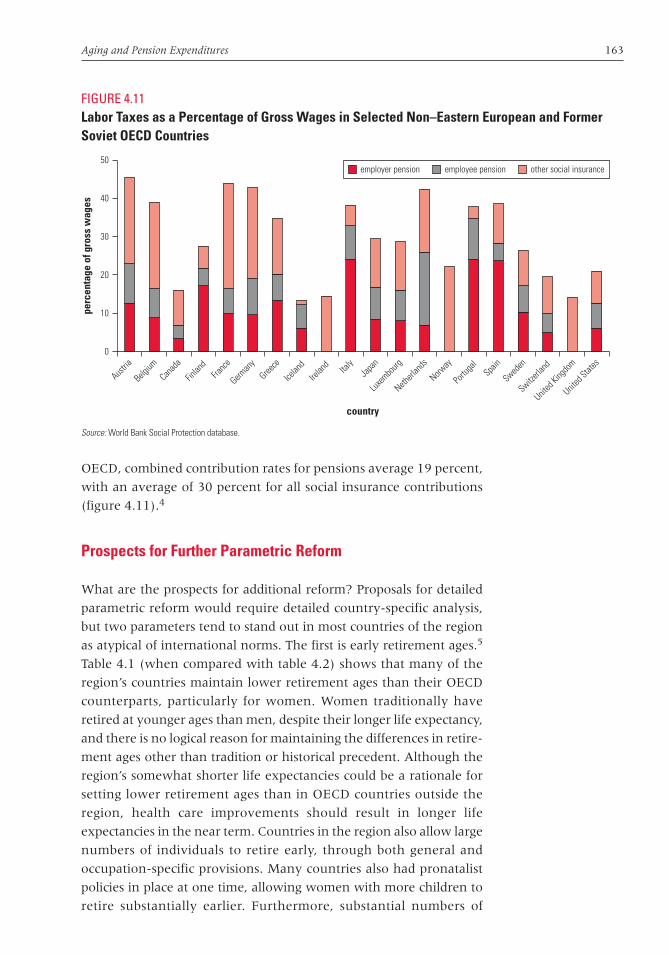
Aging and Pension Expenditures 163
OECD, combined contribution rates for pensions average 19 percent,
with an average of 30 percent for all social insurance contributions
(figure 4.11).4
Prospects for Further Parametric Reform
What are the prospects for additional reform? Proposals for detailed
parametric reform would require detailed country-specific analysis,
but two parameters tend to stand out in most countries of the region
as atypical of international norms. The first is early retirement ages.5
Table 4.1 (when compared with table 4.2) shows that many of the
region’s countries maintain lower retirement ages than their OECD
counterparts, particularly for women. Women traditionally have
retired at younger ages than men, despite their longer life expectancy,
and there is no logical reason for maintaining the differences in retire-
ment ages other than tradition or historical precedent. Although the
region’s somewhat shorter life expectancies could be a rationale for
setting lower retirement ages than in OECD countries outside the
region, health care improvements should result in longer life
expectancies in the near term. Countries in the region also allow large
numbers of individuals to retire early, through both general and
occupation-specific provisions. Many countries also had pronatalist
policies in place at one time, allowing women with more children to
retire substantially earlier. Furthermore, substantial numbers of
FIGURE 4.11Labor Taxes as a Percentage of Gross Wages in Selected Non–Eastern European and FormerSoviet OECD Countries
Source: World Bank Social Protection database.
0
40
30
20
10
50
perc
enta
ge o
f gro
ss w
ages
employer pension employee pension other social insurance
Austria
Belgium
Canad
a
Finlan
dFra
nce
German
yGree
ce
Icelan
dIre
land
Italy
Japa
n
Luxem
bourg
Netherl
ands
Norway
Portu
gal
Spain
Sweden
Switzerla
nd
United
Kingdo
m
United
States
country
chaw_151-176_ch04.qxd 5/30/07 3:15 PM Page 163

164 From Red to Gray
workers left the labor force early with disability benefits, a mecha-
nism that was used in the first decade of market transition—and con-
tinues to be used in some countries—to enable employers to shed
surplus or unnecessary labor in the changing labor market. By con-
trast, as table 4.2 shows, the retirement age for men in all OECD
countries outside the region, with the exception of France, is at least
65, with the same age for men and women in most countries.6
The second parameter that tends to be notably different in the
region is the indexation of pensions after retirement. OECD countries
have typically moved to inflation-based adjustment of pension bene-
fits, both to minimize fiscal costs in the face of an aging population
and to maintain the purchasing power of the pension during retire-
ment age. Many Eastern European and former Soviet countries still
adjust pensions after retirement by some mix of inflation and wage
growth. This practice leads to higher benefit increases than inflation
adjustment alone, because wages tend to increase more quickly than
TABLE 4.1Statutory Retirement Ages in Selected Eastern European and FormerSoviet Countries
Country Retirement age for men Retirement age for women
Albania 65.0 60.0Armenia 63.0 59.5Azerbaijan 62.0 57.0Belarus 60.0 55.0Bulgaria 62.5 57.5Croatia 63.0 58.0Czech Republic 61.5 56.0–60.0Estonia 63.0 59.0Georgia 65.0 60.0Hungary 62.0 60.0Kazakhstan 63.0 58.0Kyrgyz Republic 62.0 57.0Latvia 62.0 59.5Lithuania 62.5 60.0Moldova 62.0 57.0Montenegro 63.0 58.0Poland 65.0 60.0Romania 65.0 60.0Russian Federation 60.0 55.0Serbia 63.0 58.0Slovak Republic 62.0 53.0–57.0Slovenia 58.0 55.0Turkey 49.0 44.0Turkmenistan 62.0 57.0Ukraine 60.0 55.0Uzbekistan 60.0 55.0
Source: U.S. Social Security Department 2004.
chaw_151-176_ch04.qxd 5/30/07 3:15 PM Page 164

Aging and Pension Expenditures 165
prices. Moving to inflation indexation would bring countries in line
with international standards as well as provide savings that would
help counteract the impact of aging.
Figure 4.12 shows the fiscal effect of a move by 2015 to a retire-
ment age of 65 for men and women and a move by 2010 to inflation
indexation for the sample of countries for which we have sufficient
data on pension spending. The effect varies considerably across coun-
tries, depending on the initial policies in the country.7 In Albania, the
only effect is through a rise in women’s retirement age to 65 from the
current age of 60. Georgia currently legislates both inflation indexa-
tion and a retirement age of 65 for both men and women. Kazakhstan
would have a retirement age of 63 for men and 61 for women in
2015, so the proposed reforms involve an increase in retirement age
for both men and women, although pensions should already be
indexed to inflation. In Lithuania, both parametric changes have an
effect. Retirement age would rise from 62.5 for men and 60 for
women and indexation would change from wage growth to inflation.
In Romania and in Serbia, only retirement ages would change, rising
from the current age of 60. In the Slovak Republic, retirement age
TABLE 4.2Statutory Retirement Ages in Selected Non–Eastern European andFormer Soviet OECD Countries
Country Retirement age for men Retirement age for women
Australia 65 65Austria 65 60Belgium 65 65Canada 65 65Denmark 67 67Finland 65 65France 60 60Germany 65 65Greece 65 60Iceland 67 67Ireland 65 65Italy 65 60Japan 65 65Luxembourg 65 65Netherlands 65 65New Zealand 65 65Norway 67 67Portugal 65 65Spain 65 65Sweden 65 65Switzerland 65 64United Kingdom 65 65United States 65 65
Source: World Bank Social Protection database.
chaw_151-176_ch04.qxd 5/30/07 3:15 PM Page 165

166 From Red to Gray
would rise for both men and women from 62, which is the retirement
age under the current legislation; indexation would shift from its cur-
rent 50-50 mix of inflation and wage growth to pure inflation. Finally,
in Turkey, retirement ages would rise markedly from age 52 for men
and age 48 for women (which would be the ages under current legis-
lation); indexation would be unchanged from the inflation indexa-
tion passed in the 2006 pension law. In general, indexation changes
have a bigger effect than retirement age changes in the medium run,
because indexation affects the level of expenditure for all pensioners,
whereas retirement age changes affect only the number of new pen-
sioners added each year.
Reform Options
Aside from minor parametric reforms, Eastern European and former
Soviet governments may want to more fundamentally rethink their
pension system designs. Publicly mandated systems serve two func-
tions: (a) preventing poverty in old age and (b) allowing consumption
smoothing across a lifetime, with contributions or savings made when
young and benefits received when old or unable to work. Almost all
the countries in the region have a pension system design that requires
contributions from the working generations and provides benefits to
the older generations. In many cases, the link between contributions
FIGURE 4.12Fiscal Effects of Raising Retirement Age to 65 and Indexing Benefits to Inflation Only by 2025, Selected Eastern European and Former SovietCountries
Source: World Bank staff calculations.
0
2
16
14
12
10
8
6
4
country
Albania
perc
ent
2025 demographic-based changes2025 current policyfurther reforms
Georgi
a
Kazakhs
tan
Lithu
ania
Roman
ia
Serbia
and
Monten
egro
Slovak
Repub
licTur
key
chaw_151-176_ch04.qxd 5/30/07 3:15 PM Page 166

Aging and Pension Expenditures 167
and benefits is quite loose. Georgia records only whether five years of
contributions were paid by an individual in order to enable that indi-
vidual to receive a flat benefit. In Albania, the maximum benefits are
only twice the minimum benefits, whereas the maximum contribu-
tion is five times the minimum contribution. Other countries, such as
Poland and the Slovak Republic, have adopted a point system or
notional accounts that require each contribution to be recorded and
linked to the benefit received in the future.
In many cases, because of the sharp drop in the number of contrib-
utors, an inability to enforce collections, and a lack of incentives to
encourage contributions, governments are unable to collect social
insurance revenues. With the resulting shortfalls, governments have
focused their limited revenue on maintaining a reasonable minimum
pension that prevents old-age poverty and have worried less about the
consumption-smoothing objective of pension systems. Unfortunately,
such a focus in a contributory system reinforces the disincentives to
contribute. If individuals are going to receive a minimum pension (or
something close to that), what incentives are there to declare actual
earnings and pay high contribution rates on them? Turkey, for differ-
ent historical reasons, has followed this path, and more than half of
individuals are declaring a minimum wage and paying contributions
only on the basis of the minimum wage. In Turkey, as in the other
countries in the region, the government comes under enormous polit-
ical pressure to raise the minimum pension when pensions based on
these minimum wages are too low to prevent poverty.
The advanced transition economies have not gone down this path;
instead, they have adopted pension systems that are based on a point
system, on notional accounts, or on traditional defined benefits based
on lifetime wages. Under these designs, the pension is based on the
contributions actually made, with some mechanism to deal with past
wages, giving individuals a strong incentive to declare their full wages
in order to receive pensions based on those wages. In some countries,
as in Latvia, a moderately high minimum pension has been insti-
tuted, which loosens the link between benefits and contributions to
some extent, but the link still holds beyond that minimum level. In
the Slovak Republic, almost all redistribution has been eliminated
from the social insurance–based pension system with the removal of
the minimum pension. All individuals, including pensioners, are eli-
gible for a means-tested social assistance benefit, marking a complete
separation between social insurance and social assistance. In most
cases, these publicly managed systems have been complemented by a
move toward mandatory or voluntary privately managed funded
pension systems, which reinforce the concept of little redistribution
and remove the government’s ability to reimpose redistribution even
chaw_151-176_ch04.qxd 5/30/07 3:15 PM Page 167
168 From Red to Gray
if pressed. Some redistribution can exist in these systems if govern-
ments choose to make contributions (or additional contributions) on
behalf of some groups, but these policy choices are very explicit and
have defined limits, unlike the open-ended promises that occur in
many publicly managed systems.
In these advanced transition economies, significant investment has
taken place in administrative apparatus, to enable accurate collection
and recordkeeping. But even more important, these administrative
reforms have taken place in an environment where the economies
are growing, new jobs are being created, and unemployment rates
are beginning to fall. A whole slate of enabling reforms has accompa-
nied the pension reforms, including reforms in the labor market, in
public finance and tax structure, and in the financial markets. The
partial move to a funded system has been financed partly by privati-
zation revenues received when large public enterprises were sold—to
private investors, in many cases.
The less advanced transition economies confront more of a
dilemma. Many are faced with supporting large numbers of the eld-
erly through pensions financed by contributions from a markedly
smaller number of workers. As a result, regardless of whether these
countries are old or young, their pension systems require significant
support from the government budget.8 Raising contribution rates is
not really an option, given the high contribution rates inherited by
these countries and the likelihood that raising rates would only push
even more people into the informal sector. In fact, many governments
have lowered or are considering lowering contribution rates in a bid
to increase formal sector coverage. If coverage does not increase—as
it has not in other countries that have tried this approach—then the
pension system becomes financed only partially by contributions and
thus also partially by government revenue. Limiting expenses by rais-
ing retirement ages and indexing pensions to inflation may help, but
some of these countries have already moved in those directions.
Noncontributory Social Pensions
At some point, it might make sense to explicitly move away from a
contributory system that is actually only partially contributory, with
its higher administrative costs, toward a noncontributory social pen-
sion provided at an appropriately advanced age to all individuals and
financed through government revenue. Government revenue is
financing a portion of the contributory pensions anyway. This option
is particularly relevant for many transition economies, because the
contributions in the past were made solely by employers that were
chaw_151-176_ch04.qxd 5/30/07 3:15 PM Page 168

Aging and Pension Expenditures 169
public enterprises, unconstrained by the need to make profits or to
provide returns to shareholders. The wages on which these contribu-
tions were paid were somewhat arbitrary, in those nonmarket
economies, so linking benefits to those wages makes less sense than it
does in an economy where wages are market based. Furthermore, in
many countries wage records from those times are either nonexistent
or incomplete.
Moving everyone to a flat pension has essentially already hap-
pened in some countries, and it would fulfill the first objective of pen-
sion systems, which is to prevent old-age poverty. The benefit
provided could then be adjusted to what is affordable for the
economy, by adjusting both the level of the benefit and the age at
which it would be available. The benefit could be financed by the
least costly, most efficient tax mechanism available. In many coun-
tries, virtually the only workers paying contributions are civil servants
and employees of the remaining large public enterprises. In those
cases, the revenues of the pension system come mainly from general
government revenue anyway, so in that sense the change would
largely be a relabeling of the financing source. But there is an impor-
tant political difference. Because these pensions would no longer
constitute acquired rights, the government would have more free-
dom to adjust the level of benefits and the age at which they were
provided. Also, the additional administrative costs of maintaining a
collection and recordkeeping institution could be eliminated. Coun-
tries that have limited revenue collections and weak links between
contributions and benefits should definitely consider this approach.
The argument for a social pension provision becomes even more
compelling in light of the low contributory coverage. Some countries
require relatively long durations of contributions in order to be eligi-
ble to receive a pension. Since contribution coverage has fallen
markedly, in the future—when the full contribution histories of the
pretransition period are no longer relevant—large numbers of indi-
viduals will reach retirement age without achieving pension eligibil-
ity. Politically and socially, it will become unacceptable for a
government to allow large numbers of the elderly to live in penury or
even perish because they have no means to survive. Governments
will be forced to provide something to these people. The justification
becomes even stronger when the government has been subsidizing
contributory pensions for many years, partially financed by value
added tax revenues collected from individuals outside the system. It
may become difficult to support this practice, particularly as the per-
centage of pension expenditures financed through the budget in one
way or another becomes large.
chaw_151-176_ch04.qxd 5/30/07 3:15 PM Page 169
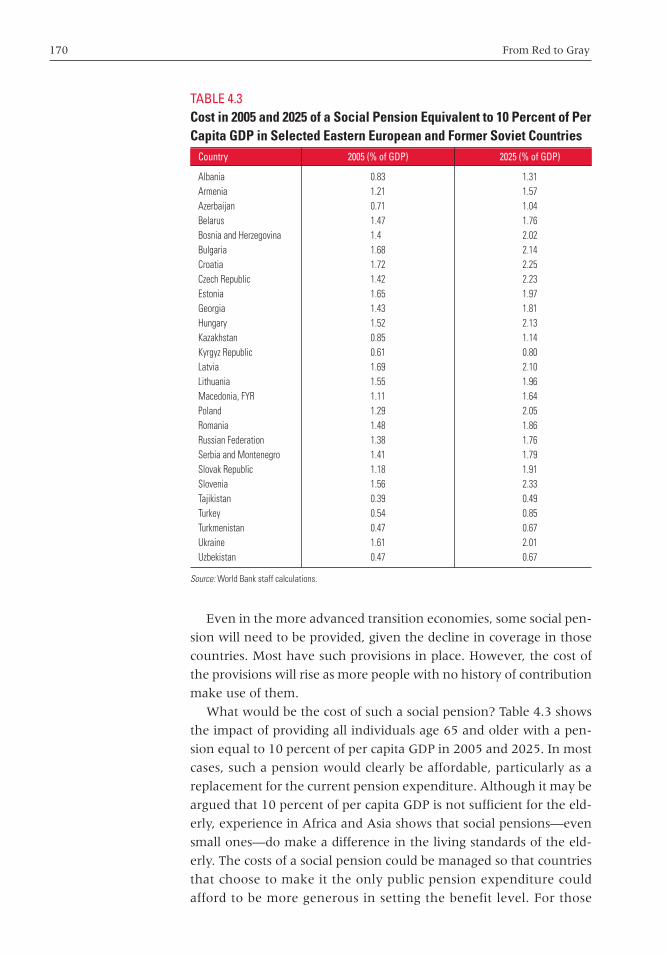
170 From Red to Gray
Even in the more advanced transition economies, some social pen-
sion will need to be provided, given the decline in coverage in those
countries. Most have such provisions in place. However, the cost of
the provisions will rise as more people with no history of contribution
make use of them.
What would be the cost of such a social pension? Table 4.3 shows
the impact of providing all individuals age 65 and older with a pen-
sion equal to 10 percent of per capita GDP in 2005 and 2025. In most
cases, such a pension would clearly be affordable, particularly as a
replacement for the current pension expenditure. Although it may be
argued that 10 percent of per capita GDP is not sufficient for the eld-
erly, experience in Africa and Asia shows that social pensions—even
small ones—do make a difference in the living standards of the eld-
erly. The costs of a social pension could be managed so that countries
that choose to make it the only public pension expenditure could
afford to be more generous in setting the benefit level. For those
TABLE 4.3Cost in 2005 and 2025 of a Social Pension Equivalent to 10 Percent of PerCapita GDP in Selected Eastern European and Former Soviet Countries
Country 2005 (% of GDP) 2025 (% of GDP)
Albania 0.83 1.31Armenia 1.21 1.57Azerbaijan 0.71 1.04Belarus 1.47 1.76Bosnia and Herzegovina 1.4 2.02Bulgaria 1.68 2.14Croatia 1.72 2.25Czech Republic 1.42 2.23Estonia 1.65 1.97Georgia 1.43 1.81Hungary 1.52 2.13Kazakhstan 0.85 1.14Kyrgyz Republic 0.61 0.80Latvia 1.69 2.10Lithuania 1.55 1.96Macedonia, FYR 1.11 1.64Poland 1.29 2.05Romania 1.48 1.86Russian Federation 1.38 1.76Serbia and Montenegro 1.41 1.79Slovak Republic 1.18 1.91Slovenia 1.56 2.33Tajikistan 0.39 0.49Turkey 0.54 0.85Turkmenistan 0.47 0.67Ukraine 1.61 2.01Uzbekistan 0.47 0.67
Source: World Bank staff calculations.
chaw_151-176_ch04.qxd 5/30/07 3:15 PM Page 170

Aging and Pension Expenditures 171
countries where a social pension is a complement to other pension
expenditures, the costs could be contained in multiple ways. First, the
age at which the pension is received could be raised to limit the num-
ber of individuals who qualify. Second, the qualifying conditions
could also include explicit means and asset testing or proxy means
testing, which also would limit the number of beneficiaries. Third, the
level of the pension could be adjusted to accommodate fiscal con-
straints. The advantage of a social pension is that, because it no longer
represents acquired rights, the decision of how much to spend is left
to society rather than being defined by acquired rights.
Voluntary Supplemental Pensions
Historically, countries in Eastern Europe and the former Soviet Union
had comprehensive pension systems, covering all individuals and
providing generous pensions that kept the living standards of the eld-
erly on par with the living standards of workers. This kind of policy is
not affordable in a market-oriented, aging economy. Although fiscal
constraints may limit what is provided through the public sector, indi-
viduals will often want a higher level of old-age provision than is
publicly affordable; they will need to be encouraged to save for these
higher benefits.
Regardless of whether they have a publicly administered, earnings-
related benefit or a flat social benefit, all countries in the region
should put in place a supervision mechanism for voluntary pensions.
In an environment of reduced public benefits, middle- and high-
income individuals will want to supplement their old-age income in
some manner, and financial institutions will begin offering products
to satisfy this need. Thus, whether or not it is regulated, a voluntary
pensions market will arise. Once such a market appears, it will be bet-
ter to regulate and supervise the products being marketed than to
leave individuals at risk. The regulation may be as basic as indicating
that pension products fall under the saving provisions of banking
products or that they will be regulated as insurance products. But
some regulation is required to prevent the pension products that will
be offered in the market from falling through regulatory cracks. Gov-
ernments can use the lure of tax-advantaged pensions to grant
licenses to providers that follow the regulations, where pension prod-
ucts already exist.
In countries that opt to follow the basic social pension approach, the
supplemental pension is even more necessary, because middle- and
high-income individuals will clearly want to receive higher benefits
than the basic benefit and will be willing to pay for them. Ideally, these
pensions should be provided by private pension fund managers on a
chaw_151-176_ch04.qxd 5/30/07 3:15 PM Page 171

172 From Red to Gray
defined-contribution basis, resulting in no government liability. How-
ever, the financial market structure in each country would need to be
evaluated to determine whether sufficient financial market instru-
ments exist to support a defined-contribution system and whether it
can be sufficiently regulated. The incomplete financial markets in the
region were discussed in chapter 3. In low-income and some middle-
income transition economies, it may be determined that the financial
market infrastructure is insufficient to support such a pension system,
even on a voluntary basis. Governments would then face three
choices: (a) allow such pension systems, but insist on overseas invest-
ment as a means of protecting the assets of workers; (b) begin a new
publicly managed pension system that explicitly excludes the use of
government subsidies; or (c) provide no tax-advantaged supplemental
pension at all.
Mandatory Funded Pension Systems
Most of the advanced transition economies have introduced manda-
tory funded pension systems as a mechanism both to transfer
responsibility for old-age provision to individuals and to increase
benefits with a given contribution rate. Table 4.4 shows the status of
TABLE 4.4Status of Mandatory Funded Systems, Selected Eastern European and Former Soviet Countries
Country and status Size of second pillar as Switching of strategy of system Starting date First pillar percentage of payroll to new system
Bulgaria, operating January 2002 PAYG defined benefit 2, growing to 5 Mandatory for age �42Croatia, operating January 2002 PAYG defined benefit 5 Mandatory for age �40; voluntary
for age 40–50Estonia, operating January 2002 PAYG defined benefit 6 Voluntary (opt-out � 2 percent)Hungary, operating January 1998 PAYG defined benefit 8 Mandatory for new entrants;
voluntary for othersKazakhstan, operating January 1998 Guaranteed minimum for existing 10 Mandatory
workers; social pensionKosovo, operating January 2002 Minimum pension 10 MandatoryLatvia, operating July 2001 PAYG notional accounts 2, growing to 9 Mandatory for age �30; voluntary
for age 30–50Lithuania, operating January 2004 PAYG defined benefit 2.5 Voluntary, but one-way switchMacedonia, FYR, operating January 2006 PAYG defined benefit 7 Mandatory for new entrantsRussian Federation, partially January 2002 PAYG notional accounts 2 (age �35) to Mandatory for age �50
legislated and operating 6 (age 36–50)Romania, partially legislated — PAYG defined benefit 8 Mandatory for �20 years from
retirementSlovak Republic, operating January 2005 PAYG defined benefit 9 Mandatory for new entrantsUkraine, partially legislated — PAYG defined benefit 2, growing to 7 Mandatory for new entrants
Source: Holzman and Hinz 2005.
Note: PAYG � pay-as-you-go; — � not get implemented.
chaw_151-176_ch04.qxd 5/30/07 3:15 PM Page 172
Aging and Pension Expenditures 173
mandatory funded systems in the region. Kazakhstan has replaced
its public system entirely with a mandatory funded system. A similar
arrangement also exists in Kosovo. In both cases, basic social pen-
sions are provided to the elderly population. Most of the countries
included in the table also undertook substantial reforms of their
inherited PAYG systems to rein in the costs of the inherited plans. A
move to a funded system usually involves transition costs: all or part
of the contribution of today’s workers is invested in their own funded
accounts, leaving less or no revenue to finance today’s pensioners.
Such a move can be financed only if the pension costs have been
reduced. Privatization revenues from the sale of former public enter-
prises have often been earmarked to help finance these pension
reforms.
As already noted, the financial market infrastructure in the middle-
to low-income transition countries is unlikely to be able to support
mandatory funded pensions, although it needs to be evaluated on a
case-by-case basis. In these countries, the financial imbalances in the
inherited pension systems tend to be greater, making it fiscally more
difficult to move to a funded pension system right away—especially
because many of the middle- to low-income transition countries have
not successfully privatized large public enterprises, ruling out this
additional source of revenue.
However, with the aging of the population, public PAYG systems
will either generate lower and lower benefits with time or will require
continuously rising retirement ages or higher contribution rates. The
popular notional accounts reforms are financed on a PAYG basis, with
contributions from current workers used to pay benefits for current
pensioners. Thus, they essentially lower benefits automatically as life
expectancy increases, with the hope that individuals will voluntarily
elect to delay retirement in order to get higher pensions. A partial
move to a funded system helps diversify old-age support and can
result in better pensions for the same contribution as the population
ages.
As the middle-income transition countries that opt to keep their
earnings-related schemes continue to reform them to make them
more financially sustainable, the benefits paid by these systems
are becoming more and more modest. As financial sustainability
improves, these countries may be able to add in a funded pillar or to
move some of the current contribution rate to a funded system, but
this phase may not be viable for another 10 to 20 years. The middle-
to low-income transition countries that choose to go with a flat
pension complemented by a voluntary system may opt to make the
voluntary system mandatory in the future. Doing so would provide a
chaw_151-176_ch04.qxd 5/30/07 3:15 PM Page 173

174 From Red to Gray
natural bridge to a pension system that both protects against old-age
poverty and furnishes a mechanism for smoothing consumption in a
fiscally sustainable manner. No transition costs would be involved if
the voluntary pension pillar became mandatory.
Policy Implications
High-income transition countries can reform their public pension sys-
tems by tightening the links between contributions and benefits. They
also have much of the financial market infrastructure to move toward
funded pensions. Many have already done so. Middle-income transi-
tion countries need to evaluate how much of the labor force is actu-
ally contributing to the pension system and whether to reform the
public pension system further or institute a social pension available at
a specified age instead. The social pension may be more attractive for
younger countries because the fiscal expenditures involved in provid-
ing for elderly people will be lower if there are fewer of them. In
either case, the pension system should be complemented with volun-
tary funded pensions. Low-income transition countries should prob-
ably opt for social pensions and may or may not be able to effectively
add a voluntary pillar. Recommendations by country group are sum-
marized in table 4.5.
TABLE 4.5Pension Reform Agenda for Aging Countries by Country Grouping
Country grouping Policy Recommendations
EU countries
Southeastern Europe and middle-income CIS
Low-income CIS
• Improve financial sustainability of public systems, largely through retirement age increases and reduced generosityof indexation.
• Enhance growth of funded system by encouraging growth in financial markets and by strengthening regulation andsupervision.
• Ensure that mechanisms are in place to provide some minimal means of support to those elderly who might not beeligible for pensions.
• Encourage growth of voluntary pensions to complement reduced public pensions.
• Evaluate current pension strategy to determine its long-run sustainability in terms of both fiscal and socialobjectives.
• Implement changes to public pension system that either guarantee sustainability with the public system alone ordownsize the public system in preparation for adding a funded system.
• Build the financial market infrastructure, including regulatory and supervisory capacity, to support voluntary pen-sions that will supplement the downsized public pension system and potentially a mandatory funded pillar.
• Provide a safety net for the increasing number of the elderly who will retire without access to a pension system.
• Focus on providing a noncontributory social pension for all the elderly regardless of contributory status.• Build the financial market infrastructure, including regulatory and supervisory capacity, to support voluntary
pensions that will supplement the social pension for those who are able and willing to make contributions.
Source: World Bank staff compilation.
Note: CIS � Commonwealth of Independent States.
chaw_151-176_ch04.qxd 5/30/07 3:15 PM Page 174
Aging and Pension Expenditures 175
Notes
1. There is always a gap between population and pension system depend-ency rates because the working-age population is calculated as thepopulation from 15 to 64 years. Typically, in high-income OECD coun-tries, 15 year olds are neither working nor contributing to the pensionsystem. The pension system dependency rates rise even further becauseof the lower labor force participation of women—even in prime work-ing ages—in some countries. These women, who did not participate inthe workforce, will nevertheless be eligible to collect widows’ pensionswhen their husbands die, raising the number of current beneficiariesrelative to the number of current contributors.
2. The figure does not include Australia and New Zealand, which do nothave contributory systems.
3. PROST (Pension Reform Options Simulation Toolkit) is a pension modelthat is produced by the World Bank and is in use in more than 80 clientcountries.
4. However, it should be noted that all of these rates are not strictly com-parable. Different countries include different components in their socialinsurance programs. For example, in the United States, employers dobear a large percentage of health costs, but these costs are not providedthrough a publicly mandated social insurance program and therefore arenot included here.
5. The early labor force exit that characterizes many countries in the regionwas discussed in chapter 2. According to available data, women in thesecountries leave the workforce, on average, about five years earlier thantheir counterparts in the OECD countries outside the region. The aver-age for men is four years earlier (table 2.8). This finding reflects the morelimited employment opportunities for older workers, as well as the statu-tory features of the pension systems described here.
6. Needless to say, in both groups of countries, there are early retirementpossibilities, particularly for some occupational groups, although theseare more prevalent in Eastern Europe and the former Soviet Union thanthey are in the OECD countries outside the region.
7. The sample itself is not representative of the region in that it consistslargely of countries that have been engaged in pension dialogue with theWorld Bank and that have already undertaken reforms. The results arealso not comparable or readily adaptable because not only are the initialconditions different but also the macroeconomic growth assumed ineach case is different, as appropriate to the particular country.
8. It should be noted that some subsystems in the advanced transitioneconomies find themselves in a similar state, such as the farmers’ systemin Poland.
chaw_151-176_ch04.qxd 5/30/07 3:15 PM Page 175

chaw_151-176_ch04.qxd 5/30/07 3:15 PM Page 176
177
Introduction
There are widespread concerns that rapidly aging populations in
many countries in Eastern Europe and the former Soviet Union will
have significantly higher health care requirements, simply because
the elderly have a high demand for ambulatory, inpatient, and
chronic care. Another critical issue is long-term care for the very old.
Such care becomes costly as the availability of informal (family-based)
care declines, and it can have large opportunity costs if younger peo-
ple spend time caring for the elderly that they would otherwise spend
in the labor force.
There is, therefore, a real potential for medical and health costs to
rise as populations age, especially in countries where levels of health
spending are already higher than available resources, though the
magnitude will depend crucially on whether longer life spans mean
more healthy years or added years of illness and dependency. Indeed,
there is increasing evidence that older people already are healthier
than their counterparts of a few decades ago and have healthier
lifestyles relative to previous generations, with the result that the
threshold for frailty and disability is being pushed later into old age.
However, prevention and postponement of disease and disability and
Aging, Long-Term Care, and Public Expenditures
CHAPTER 5
chaw_177-216_ch05.qxd 5/30/07 3:17 PM Page 177
178 From Red to Gray
maintenance of health, independence, and mobility in an aging pop-
ulation will continue to remain the major health-related challenges
of population aging. Population aging will also aggravate the magni-
tude of mental health problems, as the life expectancy of those with
mental disorders increases and as an ever-growing number of people
reach the age at which the risk of such disorders is high. In addition
to these health issues, living longer will also present individual and
societal challenges related to quality of life in old age, including inde-
pendence, social interaction, and community involvement.
A large number of studies—primarily concentrated in countries of
Western Europe and in Japan—document the impact of aging on
health and health expenditures and confirm the high level of use of
health services in old age, particularly ambulatory services, medica-
tion, hospital admissions, and surgery. The general finding in most
assessments is that health expenditure per episode is typically higher
for the elderly, though use levels off and even declines for the very
old. Large variations exist across countries: aging predicts health care
expenditures better in Japan than in Australia, Canada, or the United
Kingdom. Yet many studies also show that aging is not a significant
factor affecting health expenditures if proximity to death is taken into
account, because a large proportion of lifetime expenditures on
health take place in the two years preceding death, irrespective of the
individual’s age at that time. Further, broader economic trends and
technological innovation have a greater influence on total health care
expenditures over time than does aging. In sum, there is little doubt
that health expenditures will increase as populations get older. The
central issue is the extent to which this fact will lead to increased con-
sumption of health care services and higher rates of health care
expenditure, thereby placing existing sources of funding under
greater strain.
Reflecting this concern, a substantial literature has developed over
the past couple of decades that focuses on the characteristics, causes,
and likely future consequences of aging, especially for European
health care systems. Numerous national and multicountry studies
explore a wide range of topics associated with the past or likely future
impact of aging on health care expenditures. Others concentrate on
interpreting past data, and still others seek to extrapolate from past
trends to predict likely outcomes. Some studies explore the potential
range of policy options that might help mitigate undesirable out-
comes. As one would expect in such a diverse literature, views
diverge broadly on nearly every important aspect.
This chapter explores the impact of demographic changes on
health expenditures in countries in the region. The next section
chaw_177-216_ch05.qxd 5/30/07 3:17 PM Page 178
Aging, Long-Term Care, and Public Expenditures 179
reviews the major positions in the literature about the impact of aging
on known and potential health expenditures. Projections of public
expenditures on health are then presented and discussed. (The sensi-
tivity of the projection results on expenditures to data assumptions is
discussed in annex 5.D.) The chapter then presents a review of the
provision and use of long-term care services in countries in the
region, followed by projections of the elderly dependent populations
that will need long-term care. The chapter concludes with a brief con-
sideration of policy options for managing the impact of aging on
future health expenditures.
Aging and Health Expenditures
Many studies document the increased burden of disease and conse-
quent higher use of health care services by the elderly. A broad-
ranging data set for the Netherlands raises a variety of health care
and public health issues regarding past patterns of consumption of
health care services by the elderly (Van den Berg Jeths and others
2004). During 1983 to 1993, the incidence of cancer increased, espe-
cially prostate cancer among men and breast and lung cancer among
women, but after 1996 there was a decrease in incidence in men and
a stabilization in women, causing the trend over the entire 1983 to
1998 period to be nonsignificant (Van Dijck and others 2002). The
prevalence of diabetes mellitus also increased, although this increase
could also be due to improvements in the ability of general practi-
tioners to detect the disease (Van Oers 2002). The prevalence of
strokes and heart attacks increased in women, and the prevalence of
heart failure increased in men. The prevalence of arteriosclerosis
increased significantly across the population, as did problems associ-
ated with the neck and the back. At the same time, psychosocial
complaints by people age 65 and older decreased significantly, per-
haps because of improvements in socioeconomic status.
Salonen and Haverinen (2004) find that in Finland 90 percent of
people age 75 and older suffer from some chronic disease or disability.
Cardiovascular and musculoskeletal diseases, diabetes, and dementia
were the most prevalent diseases. A noteworthy aspect of this report
is the continued importance of cardiovascular disease in Finland some
30 years after the large-scale North Karelia Project sought to change
traditional Finnish dietary and exercise habits (Puska and others
1981). This finding highlights the long lag-time before even relatively
successful preventive strategies can be expected to reduce ongoing
expenditures on cardiovascular disease.
chaw_177-216_ch05.qxd 5/30/07 3:17 PM Page 179
180 From Red to Gray
The data do not provide conclusive evidence on the prevalence of
disability among the elderly. Nesti and others (2004) find that Italy
has almost 2 million elderly people with disabilities and that nearly
half of the people age 80 and older have disabilities. However, Howse
(2005) concludes, “The best available evidence on current trends in
disability in the USA and some other OECD countries supports the
view that overall prevalence of chronic disability is actually declining
in spite of population aging.”
Beyond documenting higher rates of health need and use of health
services by elderly populations, a number of studies have probed the
same databases for evidence of key characteristics and relationships
that can either help identify factors that generate these higher rates
or assess their policy implications. Five key conclusions emerge,
described in the following sections.
Conclusion 1: Aging Explains Only a Minor Portion
of Increased Health Expenditure
Howse (2005) concludes that technological innovation and produc-
tivity have made a substantially larger contribution to increases in
health care spending over the past few decades than population aging
has. Johansson (1997) reviews overall expenditure developments in
Sweden and shows that cost factors in the general economy play a
more important role in the increase of health expenditures than does
growth in the number of elderly people. The same conclusion is drawn
by Castles (2000), using data for the Organisation for Economic Co-
operation and Development (OECD) countries for the period from
1965 to 1995. This analysis finds no statistically significant relation-
ship between aging and aggregate health care expenditure and con-
cludes that total health expenditure in a country is almost entirely
explained by its level of real gross domestic product (GDP) per capita.
Similarly, Richardson and Robertson (1999) conclude from OECD
data for 1975, 1985, and 1995 that health expenditures per capita are
not driven mechanistically by demographic factors. Several additional
studies present evidence from specific health system subsectors that
support these more general assessments. For example, overall wage
levels in a country have been found to have an important effect on the
cost of long-term care services (Wittenberg and Comas-Herrera 2003).
Conclusion 2: Economic and Social Policies Are Important
Determinants of Health Expenditures
A number of studies suggest a direct link between health expendi-
tures for the elderly and a variety of economic and social policies that
chaw_177-216_ch05.qxd 5/30/07 3:17 PM Page 180

Aging, Long-Term Care, and Public Expenditures 181
are not primarily health related. These policy issues differ from previ-
ously noted economic influences on health expenditures (for exam-
ple, productivity, technological innovation, and GDP level) in that
they are less aggregate and are perceived to more directly reflect
intentional government decisions. Castles (2000) found a statistically
significant relationship between governing party preferences about
how to provide long-term care and health expenditures in this area.
In particular, this cross-national study concluded that the ideological
preference of leftist parties to favor service provision over transfer
expenditures accounted for the majority of the variance observed in
spending on services to the elderly.
Several studies suggest that employment policies can have a
noticeable effect on health expenditures for the elderly. Govern-
ments and companies can redesign workplaces and work schedules
to make them more suitable for elderly workers (Taylor 2003).
Employment levels and the overall condition of the labor market
also can affect the availability and cost of both formal and informal
home care workers (Wittenberg and Comas-Herrera 2003). A related
policy area concerns housing patterns for the elderly, particularly in
the provision of informal care. A European Commission study (Eco-
nomic Policy Committee 2001) suggests that countries should do
more to encourage the elderly to live with other family members,
and that fewer single-person elderly households could reduce the
need for formal care. In fact, Costa-Font and Patxot (2003, 2005)
describe Spain as moving in exactly the opposite direction, from the
traditional, family-based model of care to a modern, community-
based model. Their suggestion that the Spanish government should
consider establishing a publicly funded financing system similar to
the system in Germany demonstrates the potential effect that pro-
posals to change national policy can have—in this case on the level
of formal home care expenditures.
Conclusion 3: Service Use Falls after Age 80
The recent Survey of Health, Aging, and Retirement in Europe
(SHARE) study (Börsch-Supan and others 2005), which surveyed
20,000 continental Europeans older than 50, reports a strong corre-
lation between age and number of medical consultations.1 In gen-
eral, evidence on the use of health services indicates higher use
among older people for ambulatory medical consultations, medica-
tion, hospital admissions, and surgery. This effect of age levels off at
80 years, and the rates of use fall among the “oldest old” (that is,
older than 85). Arguably the most important finding in the SHARE
chaw_177-216_ch05.qxd 5/30/07 3:17 PM Page 181
182 From Red to Gray
study is that the use of health services peaks at ages 75 to 79 and
then drops off. These results suggest that projected rapid growth in
the proportion and also absolute number of very old people may not
be as great a cause for concern as some policy makers have thought.
However, this analysis also suggests that increased numbers in the
“young old” (65 to 79) category will require greater resources than
currently anticipated.
Conclusion 4: Proximity to Death Is Key
Several studies have demonstrated that the relationship observed
between health expenditure and age can be partly explained by the
concentration of health expenditures in the period immediately
before death. For example, Stooker and others (2001) report that
costs in a Dutch hospital rose by 170 percent when the elderly moved
from the second to the last year of life. McGrail and others (2000) find
that age is less important than proximity to death as a predictor of
costs, though this effect is less pronounced for social and nursing care
costs. These studies suggest that methodologies for calculating the
effect of aging on future health care expenditures should include the
“time-to-death” effect.
Conclusion 5: Large Variance Exists between Countries
Seshamani and Gray (2003) explore the relationship between health
care expenditures and aging in Australia, Canada, and Japan, as well
as in England and Wales. They find large variations across countries.
Demographic shifts and population growth predicted only 18 percent
of the increases observed in health care expenditures in England and
Wales, compared with 34 percent, 44 percent, and 68 percent for
Australia, Canada, and Japan, respectively. This finding necessarily
points policy makers away from the number of elderly alone as a key
or even central factor in explaining health care expenditures.
Projections of Public Expenditures on Health
Health spending is determined by a number of independent and
interacting factors, including health status of the population, eco-
nomic growth, technological innovations, level of defined benefits in
publicly funded systems, and productivity of human and capital
resources. In addition, estimates of health expenditures over time
will depend on changes in the size and age structure of the popula-
tion. Any projection of health expenditures thus must take into
chaw_177-216_ch05.qxd 5/30/07 3:17 PM Page 182

Aging, Long-Term Care, and Public Expenditures 183
account both demographic and nondemographic changes that affect
health spending.
Health expenditure projections were carried out for this report. To
the extent permitted by the availability of data, the projections fol-
lowed the approach used by the Economic Policy Committee (EPC) of
the European Commission Directorate General for Economic and
Financial Affairs (European Commission 2006). The EPC’s latest pro-
jections include the effect of changes in the size and age structure of
the population of the member countries, as well as age-related health
expenditure profiles related to patterns of morbidity and population
aging. The EPC’s work also links assumed expenditures to years of
remaining life and adjusts projections for the impact of nondemo-
graphic drivers of health spending.
Data and Methodology
Future health expenditures primarily will depend on the number of
projected users of health services, the intensity of use of health ser-
vices, the nature and type of health services used, and the costs asso-
ciated with these services. The number of projected users of health
services depends on projections of population size and age structures.
The intensity of use of health services is a function of the health sta-
tus of the elderly. The nature and type of health services used in the
future will depend on the availability of health goods and services,
which will be shaped by inventions and innovations in medical sci-
ence and technology. Health services that are publicly financed also
depend on the level of benefits supported by public funds. The future
costs of health goods and services are determined by a host of factors,
including inflation and technology.
The projection exercise involves a number of assumptions about
the intensity of use of health services among elderly cohorts, the
availability and use of health goods and services, and the costs of
health goods and services:
• Adjustments are made for death-related costs, on the basis of
empirical evidence that health care costs are highest in the last
years of life, irrespective of length of life. Thus, average health care
costs will fall for all age groups, with declines in the number of
people in a given age group who have few remaining years of life.
• The probability of seeking or receiving care and the level of bene-
fits are both held constant at 2004 levels.
• Technology effects are assumed to be neutral in the future, and the
future availability of health goods and services is assumed to
remain unchanged.
chaw_177-216_ch05.qxd 5/30/07 3:17 PM Page 183

184 From Red to Gray
• Consumption of health goods and services is assumed to be unaf-
fected by changes in living standards and income levels.
• Unit costs are assumed to evolve in line with GDP per capita.
• The ratio of health expenditures across age groups is assumed
to remain constant throughout the period of projections. In
other words, if in 2005 health expenditure on a 60 year old is
10 times the expenditure on a 25 year old, it will remain 10 times
in 2050.
The sensitivity of the projections to assumptions about the under-
lying data is discussed in annex 5.D. Four scenarios are estimated in
projecting health expenditures for countries of the region:
• Pure aging scenario. The number of years spent in good health is
kept constant, and all additional years of life are assumed to be
spent in bad health. Age-related health expenditures are assumed
to stay constant over time, and the only adjustment permitted is
the adjustment in the growth rate of GDP per capita. Health expen-
diture projections are computed in three simple steps. First, the
age-specific cost for each age group is calculated for each year of
the projection by adjusting the age-specific costs in 2004 for
changes in projected GDP per capita for the target year. Second,
this GDP per capita adjusted unit cost is multiplied by the projected
population of each year of age and summed to yield the total costs
for that year. Third, this total is divided by the projected GDP using
the assumed rates of growth of GDP in order to obtain the share of
health expenditure in GDP.
• Constant morbidity scenario. This scenario assumes that mor-
bidity levels in additional years of life in the future remain the
same as at present and that all additional years of life are lived
healthily. In this model, the age-related expenditure profile of the
base year is shifted outward in direct proportion to the projected
gains in life expectancy.
• Compressed morbidity scenario. This scenario assumes that
morbidity levels in additional years of life in future years are lower
than at present, which is the same as postulating that all additional
years of life are lived more healthily. In this model, the age-related
expenditure profile of the base year is shifted outward at twice the
rate as in the constant morbidity scenario.
• Pure aging scenario adjusted for death-related costs. The
unit costs for each year are differentiated between those who die
chaw_177-216_ch05.qxd 5/30/07 3:17 PM Page 184

Aging, Long-Term Care, and Public Expenditures 185
and those who survive. The computation of the unit costs of health
care is a bit more laborious. First, the population of each age group
is divided into a number of subgroups according to the number of
remaining years of life, using the mortality rate as a weighting
factor. For instance, the number of people age 40 who are expected
to die within five years of 2015 is computed as the population
age 40 in 2015 multiplied by the probability of dying by 2020,
which is the same as the probability of the 40 years olds surviving
2015 times the probability of the 41 year olds surviving 2016, and
so on, times the probability of dying in 2020 of people age 45. The
unit cost of each year is adjusted by the ratio of health expendi-
tures related to the dying to health expenditures of survivors. Total
costs are calculated by multiplying the size of each subgroup by its
modified cost per capita.
Population projections and life expectancy data are taken from
2004 revisions of the United Nations (UN) population projections
(United Nations 2005). Data on health expenditures for 2004 are
taken from various country records and the World Health Organiza-
tion (WHO) Health For All database. GDP projections come from the
World Economic Outlook (IMF 2006). The forecast rate of growth in
2010 is assumed to hold during 2010 to 2050.
Two data inputs used in the analysis deserve special mention.
First, data on age-related public expenditures on health are available
for very few countries in the region, mostly the new European
Union (EU) member states. This lack of data poses a serious chal-
lenge to projections of health expenditures into the future. For
countries where reliable data were not available, an average profile
was created on the basis of assumed ratios in expenditures across
age intervals as well as health expenditures expressed as a percent-
age of GDP per capita. In general, average nominal spending on
cohorts age 60 to 70 in the new EU member states is about four
times that of average nominal spending on cohorts age 20 to 30 years;
in comparison, average nominal spending on cohorts age 60 to 70 in
the non-EU member states is about three times that of average nom-
inal spending on cohorts age 20 to 30 years. Second, data needed to
allow for adjustments related to death costs—that is, the difference
in health care costs of those who die within a predefined short
period of time and those who survive—are not available for most
countries. They are imputed on the basis of the reported ratio of
expenditures for those dying within a two-year period at a specified
age to expenditures for those surviving in that period, as in Poland
in 2004.2
chaw_177-216_ch05.qxd 5/30/07 3:17 PM Page 185
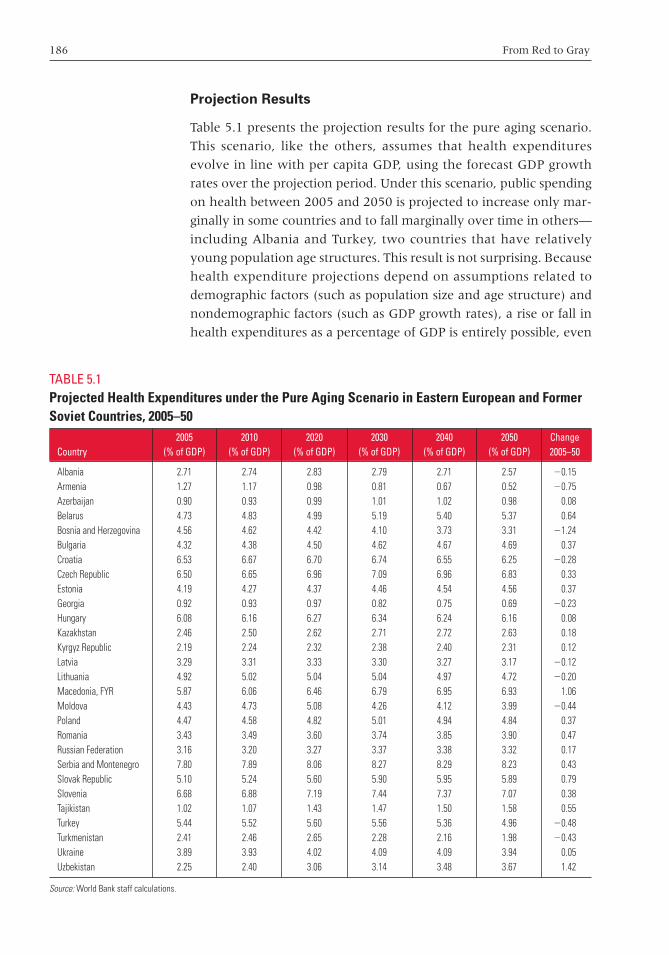
186 From Red to Gray
Projection Results
Table 5.1 presents the projection results for the pure aging scenario.
This scenario, like the others, assumes that health expenditures
evolve in line with per capita GDP, using the forecast GDP growth
rates over the projection period. Under this scenario, public spending
on health between 2005 and 2050 is projected to increase only mar-
ginally in some countries and to fall marginally over time in others—
including Albania and Turkey, two countries that have relatively
young population age structures. This result is not surprising. Because
health expenditure projections depend on assumptions related to
demographic factors (such as population size and age structure) and
nondemographic factors (such as GDP growth rates), a rise or fall in
health expenditures as a percentage of GDP is entirely possible, even
TABLE 5.1Projected Health Expenditures under the Pure Aging Scenario in Eastern European and FormerSoviet Countries, 2005–50
2005 2010 2020 2030 2040 2050 ChangeCountry (% of GDP) (% of GDP) (% of GDP) (% of GDP) (% of GDP) (% of GDP) 2005–50
Albania 2.71 2.74 2.83 2.79 2.71 2.57 �0.15Armenia 1.27 1.17 0.98 0.81 0.67 0.52 �0.75Azerbaijan 0.90 0.93 0.99 1.01 1.02 0.98 0.08Belarus 4.73 4.83 4.99 5.19 5.40 5.37 0.64Bosnia and Herzegovina 4.56 4.62 4.42 4.10 3.73 3.31 �1.24Bulgaria 4.32 4.38 4.50 4.62 4.67 4.69 0.37Croatia 6.53 6.67 6.70 6.74 6.55 6.25 �0.28Czech Republic 6.50 6.65 6.96 7.09 6.96 6.83 0.33Estonia 4.19 4.27 4.37 4.46 4.54 4.56 0.37Georgia 0.92 0.93 0.97 0.82 0.75 0.69 �0.23Hungary 6.08 6.16 6.27 6.34 6.24 6.16 0.08Kazakhstan 2.46 2.50 2.62 2.71 2.72 2.63 0.18Kyrgyz Republic 2.19 2.24 2.32 2.38 2.40 2.31 0.12Latvia 3.29 3.31 3.33 3.30 3.27 3.17 �0.12Lithuania 4.92 5.02 5.04 5.04 4.97 4.72 �0.20Macedonia, FYR 5.87 6.06 6.46 6.79 6.95 6.93 1.06Moldova 4.43 4.73 5.08 4.26 4.12 3.99 �0.44Poland 4.47 4.58 4.82 5.01 4.94 4.84 0.37Romania 3.43 3.49 3.60 3.74 3.85 3.90 0.47Russian Federation 3.16 3.20 3.27 3.37 3.38 3.32 0.17Serbia and Montenegro 7.80 7.89 8.06 8.27 8.29 8.23 0.43Slovak Republic 5.10 5.24 5.60 5.90 5.95 5.89 0.79Slovenia 6.68 6.88 7.19 7.44 7.37 7.07 0.38Tajikistan 1.02 1.07 1.43 1.47 1.50 1.58 0.55Turkey 5.44 5.52 5.60 5.56 5.36 4.96 �0.48Turkmenistan 2.41 2.46 2.65 2.28 2.16 1.98 �0.43Ukraine 3.89 3.93 4.02 4.09 4.09 3.94 0.05Uzbekistan 2.25 2.40 3.06 3.14 3.48 3.67 1.42
Source: World Bank staff calculations.
chaw_177-216_ch05.qxd 5/30/07 3:17 PM Page 186

Aging, Long-Term Care, and Public Expenditures 187
in countries with young population structures that are projected to
have high rates of GDP growth (projected to be 6 percent in Albania
and 5 percent in Turkey throughout the 2010 to 2050 period).
Table 5.2 presents the projection results under the constant mor-
bidity scenario. Public spending on health in 2050 is projected to be
lower than under the pure aging scenario. This result is expected,
because improved health status will ease pressures on future health
expenditures.
Table 5.3 presents the projection results under the compressed
morbidity scenario. Public spending on health in 2050 is projected
to be lower than projected spending under the constant morbidity
scenario.
TABLE 5.2Projected Health Expenditures under the Constant Morbidity Scenario in Eastern Europeanand Former Soviet Countries, 2005–50
Difference in 2050 compared
2005 2010 2020 2030 2040 2050 Change with pure agingCountry (% of GDP) (% of GDP) (% of GDP) (% of GDP) (% of GDP) (% of GDP) 2005–50 scenario
Albania 2.71 2.74 2.74 2.69 2.63 2.49 �0.22 �0.08Armenia 1.27 1.17 0.90 0.79 0.65 0.51 �0.77 �0.02Azerbaijan 0.90 0.93 0.97 0.99 1.00 0.96 0.06 �0.02Belarus 4.73 4.83 4.69 4.93 5.24 5.18 0.45 �0.19Bosnia and Herzegovina 4.56 4.62 4.30 3.97 3.63 3.21 �1.34 �0.10Bulgaria 4.32 4.38 4.16 4.27 4.39 4.38 0.06 �0.31Croatia 6.53 6.67 6.39 6.41 6.26 5.96 �0.57 �0.30Czech Republic 6.50 6.65 6.25 6.39 6.39 6.17 �0.33 �0.66Estonia 4.19 4.27 4.19 4.26 4.38 4.38 0.19 �0.17Georgia 0.92 0.93 0.95 0.80 0.74 0.67 �0.24 �0.01Hungary 6.08 6.16 5.76 5.83 5.96 5.88 �0.20 �0.28Kazakhstan 2.46 2.50 2.50 2.58 2.67 2.58 0.12 �0.06Kyrgyz Republic 2.19 2.24 2.24 2.29 2.36 2.27 0.08 �0.04Latvia 3.29 3.31 3.19 3.16 3.17 3.06 �0.23 �0.11Lithuania 4.92 5.02 4.72 4.68 4.76 4.51 �0.42 �0.22Macedonia, FYR 5.87 6.06 6.46 6.79 6.95 6.93 1.06 0.00Moldova 4.43 4.73 4.88 4.03 4.00 3.85 �0.58 �0.14Poland 4.47 4.58 4.48 4.66 4.73 4.58 0.11 �0.26Romania 3.43 3.49 3.43 3.56 3.71 3.75 0.32 �0.15Russian Federation 3.16 3.20 3.10 3.18 3.30 3.23 0.08 �0.09Serbia and Montenegro 7.80 7.89 8.06 8.27 8.29 8.23 0.43 0.00Slovak Republic 5.10 5.24 5.31 5.59 5.67 5.58 0.48 �0.31Slovenia 6.68 6.88 6.58 6.78 6.96 6.65 �0.03 �0.42Tajikistan 1.02 1.07 1.42 1.46 1.49 1.56 0.53 �0.02Turkey 5.44 5.52 5.54 5.49 5.27 4.87 �0.57 �0.09Turkmenistan 2.41 2.46 2.60 2.23 2.13 1.95 �0.46 �0.03Ukraine 3.89 3.93 3.79 3.84 3.99 3.83 �0.06 �0.11Uzbekistan 2.25 2.40 3.04 3.10 3.44 3.61 1.36 �0.06
Source: World Bank staff calculations.
chaw_177-216_ch05.qxd 5/30/07 3:17 PM Page 187

188 From Red to Gray
Table 5.4 presents the projection results for the pure aging scenario
adjusted for death-related costs. Accounting for these costs, health
expenditures are projected to be lower than under the pure aging sce-
nario. Overall, the projected health expenditures under the pure
aging scenario adjusted for death-related costs are closer to projected
health expenditures under the constant morbidity scenario.
Figure 5.1 presents a summary of the projection results reported in
tables 5.1 through 5.4. In general, the results suggest that health
spending will increase in many countries in the region. Improve-
ments in the health care status of the elderly will attenuate pressures
on spending, especially as healthy life expectancy evolves broadly in
line with age-specific life expectancy. Finally, the increase in health
TABLE 5.3Projected Health Expenditures under the Compressed Morbidity Scenario in Eastern Europeanand Former Soviet Countries, 2005–50
Difference in Difference in2050 compared 2050 compared
2005 2010 2020 2030 2040 2050 Change with pure aging with constantCountry (% of GDP) (% of GDP) (% of GDP) (% of GDP) (% of GDP) (% of GDP) 2005–50 scenario morbidity scenario
Albania 2.71 2.74 2.66 2.59 2.51 2.43 �0.28 �0.13 �0.06Armenia 1.27 1.17 0.97 0.81 0.62 0.49 �0.78 �0.03 �0.01Azerbaijan 0.90 0.93 0.96 0.96 0.96 0.94 0.04 �0.04 �0.02Belarus 4.73 4.83 4.69 4.75 4.96 5.04 0.32 �0.32 �0.14Bosnia and Herzegovina 4.56 4.62 4.10 3.85 3.45 3.13 �1.42 �0.18 �0.08Bulgaria 4.32 4.38 3.89 3.99 4.04 4.12 �0.19 �0.56 �0.26Croatia 6.53 6.67 5.98 6.00 5.88 5.70 �0.83 �0.56 �0.26Czech Republic 6.50 6.65 5.44 5.60 5.73 5.53 �0.96 �1.30 �0.64Estonia 4.19 4.27 3.94 4.01 4.17 4.23 0.04 �0.33 �0.15Georgia 0.92 0.93 0.92 0.77 0.71 0.66 �0.26 �0.03 �0.01Hungary 6.08 6.16 5.25 5.33 5.61 5.65 �0.44 �0.51 �0.23Kazakhstan 2.46 2.50 2.41 2.48 2.54 2.53 0.07 �0.10 �0.05Kyrgyz Republic 2.19 2.24 2.18 2.21 2.25 2.23 0.04 �0.08 �0.04Latvia 3.29 3.31 3.06 3.05 3.02 2.96 �0.33 �0.21 �0.10Lithuania 4.92 5.02 4.48 4.39 4.47 4.31 �0.61 �0.41 �0.20Macedonia, FYR 5.87 6.06 6.46 6.79 6.85 6.84 0.97 �0.09 �0.09Moldova 4.43 4.73 4.76 3.87 3.82 3.75 �0.68 �0.24 �0.10Poland 4.47 4.58 4.21 4.39 4.43 4.36 �0.11 �0.48 �0.22Romania 3.43 3.49 3.21 3.38 3.52 3.62 0.19 �0.28 �0.13Russian Federation 3.16 3.20 2.95 3.02 3.11 3.15 0.00 �0.17 �0.08Serbia and Montenegro 7.80 7.89 8.06 8.27 8.29 8.23 0.43 0.00 0.00Slovak Republic 5.10 5.24 4.94 5.19 5.31 5.31 0.22 �0.57 �0.26Slovenia 6.68 6.88 5.97 6.14 6.44 6.26 �0.42 �0.81 �0.39Tajikistan 1.02 1.07 1.41 1.44 1.46 1.55 0.52 �0.03 �0.01Turkey 5.44 5.52 5.34 5.26 5.04 4.79 �0.65 �0.18 �0.08Turkmenistan 2.41 2.46 2.61 2.23 2.08 1.92 �0.48 �0.06 �0.02Ukraine 3.89 3.93 3.59 3.63 3.76 3.74 �0.16 �0.21 �0.10Uzbekistan 2.25 2.40 2.99 3.06 3.36 3.56 1.32 �0.11 �0.05
Source: World Bank staff calculations.
chaw_177-216_ch05.qxd 5/30/07 3:17 PM Page 188
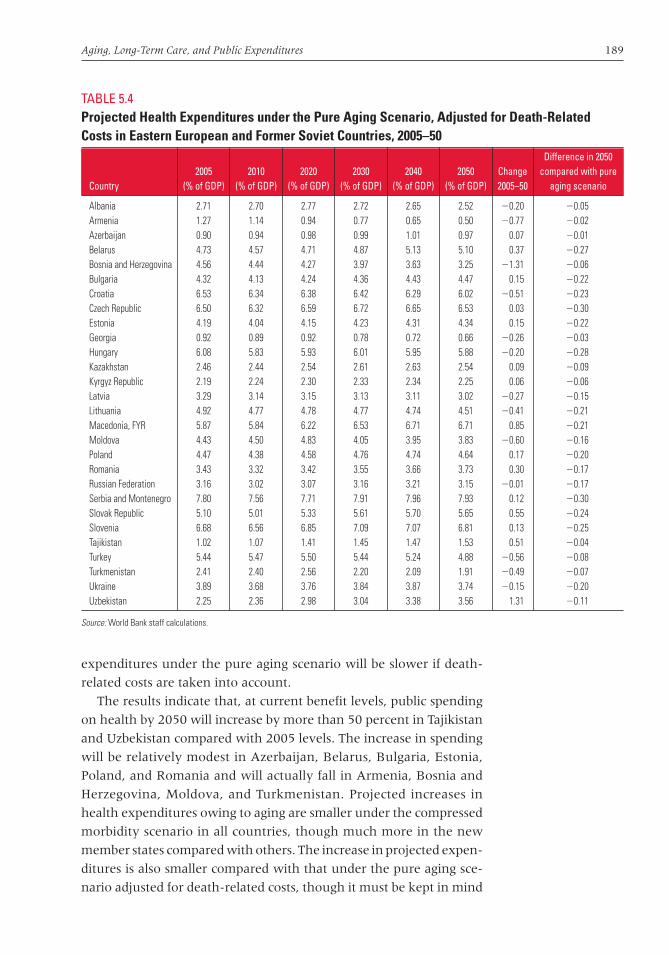
Aging, Long-Term Care, and Public Expenditures 189
expenditures under the pure aging scenario will be slower if death-
related costs are taken into account.
The results indicate that, at current benefit levels, public spending
on health by 2050 will increase by more than 50 percent in Tajikistan
and Uzbekistan compared with 2005 levels. The increase in spending
will be relatively modest in Azerbaijan, Belarus, Bulgaria, Estonia,
Poland, and Romania and will actually fall in Armenia, Bosnia and
Herzegovina, Moldova, and Turkmenistan. Projected increases in
health expenditures owing to aging are smaller under the compressed
morbidity scenario in all countries, though much more in the new
member states compared with others. The increase in projected expen-
ditures is also smaller compared with that under the pure aging sce-
nario adjusted for death-related costs, though it must be kept in mind
TABLE 5.4Projected Health Expenditures under the Pure Aging Scenario, Adjusted for Death-RelatedCosts in Eastern European and Former Soviet Countries, 2005–50
Difference in 20502005 2010 2020 2030 2040 2050 Change compared with pure
Country (% of GDP) (% of GDP) (% of GDP) (% of GDP) (% of GDP) (% of GDP) 2005–50 aging scenario
Albania 2.71 2.70 2.77 2.72 2.65 2.52 �0.20 �0.05Armenia 1.27 1.14 0.94 0.77 0.65 0.50 �0.77 �0.02Azerbaijan 0.90 0.94 0.98 0.99 1.01 0.97 0.07 �0.01Belarus 4.73 4.57 4.71 4.87 5.13 5.10 0.37 �0.27Bosnia and Herzegovina 4.56 4.44 4.27 3.97 3.63 3.25 �1.31 �0.06Bulgaria 4.32 4.13 4.24 4.36 4.43 4.47 0.15 �0.22Croatia 6.53 6.34 6.38 6.42 6.29 6.02 �0.51 �0.23Czech Republic 6.50 6.32 6.59 6.72 6.65 6.53 0.03 �0.30Estonia 4.19 4.04 4.15 4.23 4.31 4.34 0.15 �0.22Georgia 0.92 0.89 0.92 0.78 0.72 0.66 �0.26 �0.03Hungary 6.08 5.83 5.93 6.01 5.95 5.88 �0.20 �0.28Kazakhstan 2.46 2.44 2.54 2.61 2.63 2.54 0.09 �0.09Kyrgyz Republic 2.19 2.24 2.30 2.33 2.34 2.25 0.06 �0.06Latvia 3.29 3.14 3.15 3.13 3.11 3.02 �0.27 �0.15Lithuania 4.92 4.77 4.78 4.77 4.74 4.51 �0.41 �0.21Macedonia, FYR 5.87 5.84 6.22 6.53 6.71 6.71 0.85 �0.21Moldova 4.43 4.50 4.83 4.05 3.95 3.83 �0.60 �0.16Poland 4.47 4.38 4.58 4.76 4.74 4.64 0.17 �0.20Romania 3.43 3.32 3.42 3.55 3.66 3.73 0.30 �0.17Russian Federation 3.16 3.02 3.07 3.16 3.21 3.15 �0.01 �0.17Serbia and Montenegro 7.80 7.56 7.71 7.91 7.96 7.93 0.12 �0.30Slovak Republic 5.10 5.01 5.33 5.61 5.70 5.65 0.55 �0.24Slovenia 6.68 6.56 6.85 7.09 7.07 6.81 0.13 �0.25Tajikistan 1.02 1.07 1.41 1.45 1.47 1.53 0.51 �0.04Turkey 5.44 5.47 5.50 5.44 5.24 4.88 �0.56 �0.08Turkmenistan 2.41 2.40 2.56 2.20 2.09 1.91 �0.49 �0.07Ukraine 3.89 3.68 3.76 3.84 3.87 3.74 �0.15 �0.20Uzbekistan 2.25 2.36 2.98 3.04 3.38 3.56 1.31 �0.11
Source: World Bank staff calculations.
chaw_177-216_ch05.qxd 5/30/07 3:17 PM Page 189
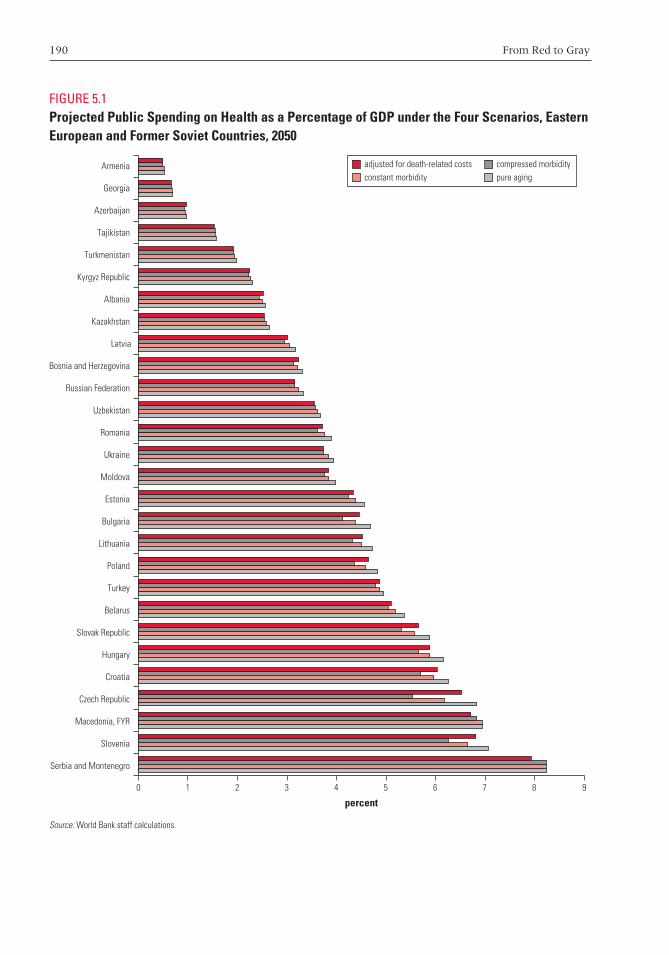
190 From Red to Gray
FIGURE 5.1Projected Public Spending on Health as a Percentage of GDP under the Four Scenarios, EasternEuropean and Former Soviet Countries, 2050
0 1 2 3
percent4 5 6 7 8 9
Serbia and Montenegro
Slovenia
Macedonia, FYR
Czech Republic
Croatia
Hungary
Slovak Republic
Belarus
Turkey
Poland
Lithuania
Bulgaria
Estonia
Moldova
Ukraine
Romania
Uzbekistan
Russian Federation
Bosnia and Herzegovina
Latvia
Kazakhstan
Albania
Kyrgyz Republic
Turkmenistan
Tajikistan
Azerbaijan
Georgia
Armenia adjusted for death-related costs compressed morbidityconstant morbidity pure aging
Source: World Bank staff calculations.
chaw_177-216_ch05.qxd 5/30/07 3:17 PM Page 190
Aging, Long-Term Care, and Public Expenditures 191
that the data on death-related costs are not very reliable. Overall, the
projection results indicate that changes in the health status of the eld-
erly will have a large effect on health expenditures, with a consider-
able slowdown in the increase of health expenditures as health status
improves. These results support the view that increases in spending
on health care as a share of GDP will not be deterministically driven
by demographic developments.
Long-Term Care
Long-term care is a complex subject that incorporates a broad mix of
medical, social, and residential (housing) dimensions. Three general
types of service groups can be distinguished: (a) home care, (b) shel-
tered housing and old-age homes, and (c) nursing homes. In addi-
tion, a wide variety of day programs may exist outside the home but
in support of home care, including elder day centers, respite care cen-
ters, and educational and support programs for informal caregivers.
Within each type of service is an additional range of distinctions.
Home care can be provided by informal (nonprofessional, usually
volunteer) or formal (professional) providers, and it can incorporate
a wide range of clinical activities (nursing, drug therapy, physical
therapy); social activities (food preparation, cleaning, shopping); and
even physical construction activities (installing hydraulic lifts, reno-
vating bathrooms and kitchens).
Sheltered housing and old-age homes are typically operated or
paid for by public municipal, not-for-profit voluntary, or for-profit
commercial organizations. Nursing homes vary by type and levels of
service, with levels 1, 2, and 3 providing increasingly intensive care.
Although it is reasonable to expect that the need for long-term care
services will grow substantially as populations age, it is not clear
what type or level of services will be most needed and what the likely
costs of providing those services will be. Many policy makers and
commentators logically believe that the need for these services—and
for the funds to finance their delivery—will be dramatically higher as
populations age. However, because long-term care consists of a broad
continuum of services, with widely varying resource requirements,
the impact of increased aging on long-term care costs will depend
on policy choices regarding the level, scope, and delivery of those
services.
Most long-term care in the region is provided in hospital settings or
informally by families of dependent people, and the availability and
use of institutional long-term care services is very limited in most
chaw_177-216_ch05.qxd 5/30/07 3:17 PM Page 191

192 From Red to Gray
countries. Where it exists, the responsibility for delivering long-term
care is vested in different agencies, including local governments,
which are generally responsible for community care services. The
long-term mentally ill are typically cared for in regional psychiatric
hospitals.
Voluntary and nongovernmental organizations are playing a
larger role as providers of nursing homes, hospices, and rehabilita-
tion services and as providers of long-term residential care and care
in the community. In some countries, such as Poland, voluntary
organizations and domiciliary nursing agencies have begun to
develop community services, such as home nursing and home help.
Even in Western and Central Europe, the use of long-term services is
not very high, ranging from about 12 percent of the elderly receiv-
ing institutional care in Northern European countries to about 3 per-
cent in Italy and 1 percent in Greece. The corresponding figure in
Poland is 1.8 percent (OECD 2005). In many countries, the largest
percentage of the elderly who receive services use informal home
care, as in Austria (80 percent) and Spain (82 percent) (OECD 2005).
Nursing or residential homes and community arrangements are very
limited, although this situation has been changing in some new EU
member states in recent years. In Romania, more than 19,000 adults
with disabilities were institutionalized in 150 long-term care centers
belonging to the National Agency for Persons with Disabilities in
2003. At the same time, 11,000 children with disabilities were living
in centers belonging to the National Authority for Child Protection
and Adoptions.
Hutten and Kerkstra (1996) classify home care services (and, by
extension, long-term care services generally) in Europe into the pub-
lic service and social health insurance models. In the public service
model, formal care (including institutional care) is provided largely by
local municipal governments. It is typically funded by a mix of
national and local tax revenues, along with a varying but relatively
low level of copayments (often also means tested). This model is
closely identified with the Nordic countries but is also found in Italy,
Spain, and the United Kingdom, as well as in the Czech Republic,
Hungary, and Poland. In the social health insurance model, funding
comes from a publicly sponsored and regulated, private, not-for-profit,
managed pool, into which salaried workers and their employers con-
tribute on a mandatory basis (see Saltman, Busse, and Figueras 2004).
Social insurance funds also cover informal and formal care, but the
level of copayments tends to be larger than in the public service model.
Countries have various legislative arrangements governing long-
term care. Annex 5.A summarizes the national legislation that
chaw_177-216_ch05.qxd 5/30/07 3:17 PM Page 192

Aging, Long-Term Care, and Public Expenditures 193
defines the provision and financing of long-term care in several
European countries. Official programs for coverage of formal long-
term care services—both in homes and in institutions—have been
put in place in most countries. Belgium and Switzerland are two
notable exceptions.
Funding for Long-Term Care
A variety of mechanisms are used to mobilize resources for the pro-
vision of long-term care services (table 5.5). They can be grouped
under four different models: special long-term care insurance (as in
Germany), general taxes (as in Austria), a combination of insurance
and general taxes (as in Japan), and special programs (as in the
Netherlands).
In Germany, public long-term insurance, which was introduced in
1994, is financed largely through contributions from employers and
employees and administered by funds that are formally independent
of, but closely tied to, the sickness funds. Both employers and employ-
ees currently pay 1.7 percent of gross earnings, up to an income ceil-
ing of €3,375 per month. Retired people contribute to the insurance
by paying half of the contribution; the other half is financed by
pension funds. Contributions for the unemployed are completely
financed by unemployment insurance. Civil servants are not part of
the social health insurance program and are therefore obliged to take
up private insurance, which is partly paid by their employer.
It takes five years to qualify for benefits from the insurance system.
Apart from that, the only qualifying requirement is the need for care.
The critical factors are the person’s inability to perform activities of
daily living combined with the frequency and duration of the need
for assistance. If selected, beneficiaries receive benefits in the form of
in-kind services, cash, or a combination of both. The aim of benefits in
cash is to support private, family-based arrangements. Because all
insurance benefits are capped, private copayment and means-tested
social assistance still play a vital role, particularly in nursing home
care. The benefits, in general, are not sufficient to cover the costs of
professional care at home or at a nursing home. Although entitlement
generally is independent of age, about 78 percent of all beneficiaries
are age 65 or older, and more than 50 percent are at least age 80
(Comas-Herrera and Wittenberg 2003). At the end of 2003, 70 mil-
lion people were covered by the public long-term care insurance and
9 million (2002 data) by private long-term care insurance. Thus, about
90 percent of Germany’s population is part of the mandatory scheme.
About 1.9 million persons received benefits from public long-term
chaw_177-216_ch05.qxd 5/30/07 3:17 PM Page 193
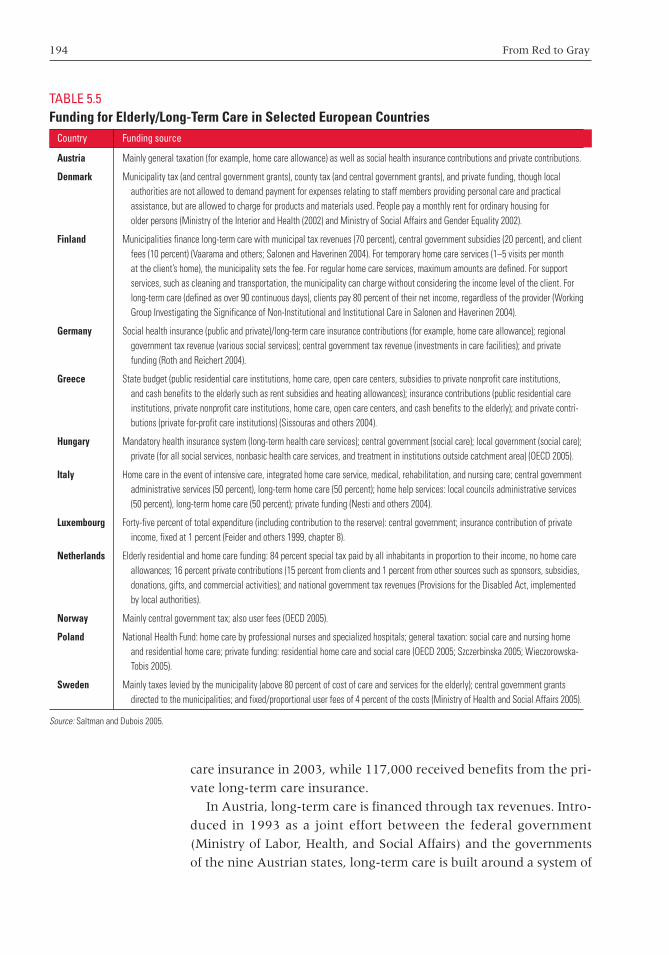
194 From Red to Gray
care insurance in 2003, while 117,000 received benefits from the pri-
vate long-term care insurance.
In Austria, long-term care is financed through tax revenues. Intro-
duced in 1993 as a joint effort between the federal government
(Ministry of Labor, Health, and Social Affairs) and the governments
of the nine Austrian states, long-term care is built around a system of
TABLE 5.5Funding for Elderly/Long-Term Care in Selected European Countries
Country Funding source
Austria Mainly general taxation (for example, home care allowance) as well as social health insurance contributions and private contributions.
Denmark Municipality tax (and central government grants), county tax (and central government grants), and private funding, though local authorities are not allowed to demand payment for expenses relating to staff members providing personal care and practical assistance, but are allowed to charge for products and materials used. People pay a monthly rent for ordinary housing for older persons (Ministry of the Interior and Health (2002) and Ministry of Social Affairs and Gender Equality 2002).
Finland Municipalities finance long-term care with municipal tax revenues (70 percent), central government subsidies (20 percent), and client fees (10 percent) (Vaarama and others; Salonen and Haverinen 2004). For temporary home care services (1–5 visits per month at the client’s home), the municipality sets the fee. For regular home care services, maximum amounts are defined. For support services, such as cleaning and transportation, the municipality can charge without considering the income level of the client. For long-term care (defined as over 90 continuous days), clients pay 80 percent of their net income, regardless of the provider (Working Group Investigating the Significance of Non-Institutional and Institutional Care in Salonen and Haverinen 2004).
Germany Social health insurance (public and private)/long-term care insurance contributions (for example, home care allowance); regional government tax revenue (various social services); central government tax revenue (investments in care facilities); and private funding (Roth and Reichert 2004).
Greece State budget (public residential care institutions, home care, open care centers, subsidies to private nonprofit care institutions, and cash benefits to the elderly such as rent subsidies and heating allowances); insurance contributions (public residential care institutions, private nonprofit care institutions, home care, open care centers, and cash benefits to the elderly); and private contri-butions (private for-profit care institutions) (Sissouras and others 2004).
Hungary Mandatory health insurance system (long-term health care services); central government (social care); local government (social care); private (for all social services, nonbasic health care services, and treatment in institutions outside catchment area) (OECD 2005).
Italy Home care in the event of intensive care, integrated home care service, medical, rehabilitation, and nursing care; central government administrative services (50 percent), long-term home care (50 percent); home help services: local councils administrative services (50 percent), long-term home care (50 percent); private funding (Nesti and others 2004).
Luxembourg Forty-five percent of total expenditure (including contribution to the reserve): central government; insurance contribution of private income, fixed at 1 percent (Feider and others 1999, chapter 8).
Netherlands Elderly residential and home care funding: 84 percent special tax paid by all inhabitants in proportion to their income, no home care allowances; 16 percent private contributions (15 percent from clients and 1 percent from other sources such as sponsors, subsidies, donations, gifts, and commercial activities); and national government tax revenues (Provisions for the Disabled Act, implemented by local authorities).
Norway Mainly central government tax; also user fees (OECD 2005).
Poland National Health Fund: home care by professional nurses and specialized hospitals; general taxation: social care and nursing home and residential home care; private funding: residential home care and social care (OECD 2005; Szczerbinska 2005; Wieczorowska-Tobis 2005).
Sweden Mainly taxes levied by the municipality (above 80 percent of cost of care and services for the elderly); central government grants directed to the municipalities; and fixed/proportional user fees of 4 percent of the costs (Ministry of Health and Social Affairs 2005).
Source: Saltman and Dubois 2005.
chaw_177-216_ch05.qxd 5/30/07 3:17 PM Page 194
Aging, Long-Term Care, and Public Expenditures 195
allowances payable to beneficiaries. The cost of the federal long-term
care insurance was €1.4 billion in 2000. An additional €0.25 billion
was contributed by the states and funds allowances for approximately
15 percent of the beneficiaries. Allowances based on the Federal
Long-Term Care Allowance Act are administered and paid for by the
Pension Insurance Fund, while regional authorities or municipalities
are responsible for state allowances. To qualify for a long-term care
allowance, a beneficiary must have a permanent need for personal
services and assistance owing to a physical, mental, or psychic dis-
ability that is expected to last at least six months. Since 2005, the
long-term care allowance has been determined on the basis of a
seven-point scale, reflecting the severity of need. The monthly
allowance ranges from €148.30 for the minimum need of care to
€1,562.10 for the highest need of care. In 2002, 357,000 people
received long-term care allowances, which accounts for roughly
3.5 percent of the total population.
In Japan, the mandatory long-term care insurance system (enacted
in 1997 and effective since 2000) is financed equally by taxes and
insurance premiums (50 percent each). Premiums of up to 0.6 per-
cent of income are collected only from people age 40 or older and are
shared equally between employer and employee. Family members
are automatically covered. Half of the tax revenues are collected from
national taxes, while local and regional taxes contribute 25 percent
each. The premiums are collected at the national level and allocated
to the approximately 3,200 municipalities that administer the long-
term care insurance. In addition, all long-term services carry a copay-
ment equivalent to 10 percent of costs of care. The long-term care
insurance covers both institutional and home-based care. No cash
benefits are provided. Eligibility for benefits is based solely on need
and does not take into account the financial position or the family
structure of the careseeker. The total turnover of the long-term care
market in Japan was estimated to be about €60 billion in 2000, which
corresponds to about 1.5 percent of GDP (Karlsson and others 2004).
In the Netherlands, long-term care insurance is provided under
the Exceptional Medical Expenses Act of 1967, which covers all costs
associated with long-term care or high-cost treatment that cannot be
borne by individuals or adequately covered by private insurance. Eli-
gibility is universal and includes all ages. Long-term care insurance
does not set clear limits on the total budget for benefits per benefici-
ary, although it limits the amount of specific services (such as home
nursing). Services are generally provided in kind for both home and
institutional care. As part of an experimental program of “personal
chaw_177-216_ch05.qxd 5/30/07 3:17 PM Page 195
196 From Red to Gray
budgets,” limited cash benefits are provided to people who are eligi-
ble for home care to enable them to pay both formal and informal
providers.
Informal Care
A central policy issue in both tax-funded and social health insurance
systems is the provision of long-term care in nonformal settings, or
simply informal care. Informal care is the least expensive method of
providing care to elderly citizens in need of support—less expensive
than formal, professional home care and (even if paid) substantially
less expensive than nursing home care. Like recipients of all home
care, the recipient of informal care is able to stay at home, thus avoid-
ing the need for any financing for housing. Moreover, payments
made to providers of informal care are typically less than payments
made for professional in-home care. An additional benefit of informal
care is that it reinforces the form of care that the elderly themselves
most prefer—that is, remaining in their home. However, manage-
ment and administration of informal care is organizationally difficult,
reflecting the lack of coordination in care patterns and protocols and
the absence of integration of informal caregivers into the broader
health care system (Leichsenring 2004). Informal caregivers also typ-
ically lack training in how to deliver services appropriately and do not
usually have respite care facilities when they need to take a break or
if they themselves become temporarily ill.
Those problems notwithstanding, a number of governments rec-
ognize the advantages of informal care and have put in place specific
programs to provide various types of support to informal caregivers.
Some Nordic countries began making payments in the 1980s to infor-
mal caregivers, with Denmark and Norway even allowing relatives
and neighbors who were providing regular home care to claim reim-
bursement for services provided. In Finland, informal caregivers
receive a fixed fee from municipalities as well as from pension pay-
ments. In the 1990s, a number of other countries, including Austria,
Germany, and Luxembourg, began providing a cash payment to
recipients, who could then use those funds to pay informal caregivers.
In Denmark, municipalities installed alarm systems in the homes of
the elderly in the 1980s. Moreover, municipal nurses visit those older
than 75 twice a year to assess potential risks—for example, from falls.
In Sweden, the national insurance agency provides employees with
up to 30 days per year of paid absence from work to take care of a
seriously ill elderly family member. In the Netherlands, home care
providers offer psychosocial guidance, advice, and instructional and
chaw_177-216_ch05.qxd 5/30/07 3:17 PM Page 196
Aging, Long-Term Care, and Public Expenditures 197
informational support to informal caregivers in instances when
the individual provides both informal and formal care. Reinforcing
these initiatives, the Dutch government created in 2001 a €10 million
fund to support informal caregivers. Many similar initiatives can be
found in the Czech Republic, Hungary, and Poland, though services
are typically more restricted in number or funding.
Projections of Elderly Dependent Populations Needing
Long-Term Care
Aging populations and the growing number of the elderly will put
new pressures on the provision and use of long-term care services.
The EPC also has projected future health expenditures for long-term
care in the EU countries, with the latest projections done in 2006
(European Commission 2006). The basic exercise involves applying
profiles of average long-term care expenditures by age and gender to
a population projection. Future numbers of dependent elderly were
computed under two different assumptions of the progression of dis-
ability with population aging—disability held constant at 2004 levels
and disability rates evolving with changes in age-specific mortality
rates. The dependent elderly population was split into three categories,
depending on the type of long-term care they receive—informal
care, formal care at home, or formal care in institutions. In one of
the scenarios presented, the percentage of people receiving informal
care was allowed to fall while the percentage of those receiving for-
mal care was allowed to increase. Public spending on long-term care
was estimated for the three settings, and average per user expendi-
ture was assumed to increase with the age of the user. Total public
spending on long-term care was estimated as the sum of the three
different expenditures (informal care, formal care at home, and for-
mal care in institutions).
Unfortunately, data limitations do not permit the replication of this
exercise for most countries in the region. Indeed, even in the EPC
study, age-related expenditure profiles for long-term care were avail-
able for only 15 countries—including the Czech Republic, Latvia,
Lithuania, Poland, the Slovak Republic, and Slovenia. Even among
those countries, very few provided all the data required. Instead of
projecting future expenditures on long-term care, therefore, this
exercise is restricted to providing estimates of the numbers of elderly
who are likely to need long-term care in the future.
Country-specific, age-specific disability rates (defined in terms
of the number of persons with two or more activities of daily living,
or ADL)3 are not available for all countries. Therefore, the reported
chaw_177-216_ch05.qxd 5/30/07 3:17 PM Page 197
198 From Red to Gray
averages for the 65 to 70, 70 to 74, 75 to 79, and 80 and older age
groups for the new EU member states are used for all countries. The
probability of receiving care is held constant at the 2004 level; that is, it
is assumed that there is no policy change from 2005 to 2050 that would
affect the use of long-term services. Two scenarios are presented:
• Pure aging scenario. In this scenario, the proportion of the older
population with disabilities who receive informal care, formal in-
home care, or institutional care is held constant at 2004 levels, and
this rate is applied to the projected dependent population. The
prevalence of ADL dependency is assumed to remain unchanged
over the projection period, implying that all gains in life
expectancy are spent in bad health or with a disability.
• Constant disability scenario. In this scenario, inspired by the
dynamic equilibrium hypothesis, age-specific disability rates are
allowed to evolve in line with changes in age-specific mortality
rates. Projected increases are smaller if age-specific disability rates
evolve in line with changes in age-specific mortality rates than if
they are held constant at 2004 levels.
Annex table 5.C.1 presents estimates of the elderly dependent pop-
ulations for all the countries of the region for 2005.
The projected elderly dependent population in 2050 in Eastern
European and former Soviet countries under the pure aging scenario
is shown in table 5.6.4 These results indicate that the number of
dependent people will increase in all countries of the region. Table 5.7
shows projections for 2050 under the constant disability scenario.5
Figure 5.2 presents the projections of the elderly dependent popu-
lation reported in tables 5.6 and 5.7 as a percentage of the country’s
total projected population in 2050. As the figure shows, Slovenia will
have the largest relative share of dependent elderly by 2050, followed
by the Czech Republic, Latvia, Lithuania, and the Slovak Republic.
These projections underscore the challenge that the region faces in
the future with the care of the dependent elderly. Under the conser-
vative assumption that only 5 percent of the elderly dependent pop-
ulation with disabilities will receive formal institutionalized care and
that 5 percent will receive informal care (10 percent for new EU
member states), expenditures on long-term care under the pure aging
scenario will double in almost all countries of the region, accounting
for between 0.5 and 1.0 percent of GDP. However, if institutionalized
care is provided to 20 percent of elderly people with disabilities,
expenditures on long-term care alone will consume between 2 per-
cent and 4 percent of GDP. Because public expenditures on formal
and informal long-term care depend on policies that govern eligibility
chaw_177-216_ch05.qxd 5/30/07 3:17 PM Page 198
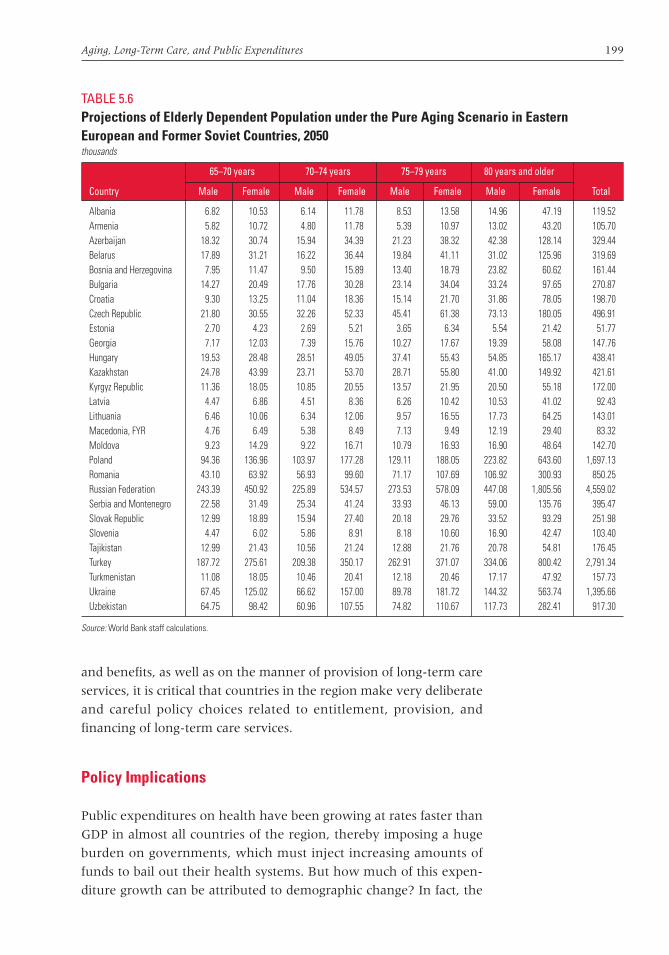
Aging, Long-Term Care, and Public Expenditures 199
and benefits, as well as on the manner of provision of long-term care
services, it is critical that countries in the region make very deliberate
and careful policy choices related to entitlement, provision, and
financing of long-term care services.
Policy Implications
Public expenditures on health have been growing at rates faster than
GDP in almost all countries of the region, thereby imposing a huge
burden on governments, which must inject increasing amounts of
funds to bail out their health systems. But how much of this expen-
diture growth can be attributed to demographic change? In fact, the
TABLE 5.6Projections of Elderly Dependent Population under the Pure Aging Scenario in EasternEuropean and Former Soviet Countries, 2050thousands
65–70 years 70–74 years 75–79 years 80 years and older
Country Male Female Male Female Male Female Male Female Total
Albania 6.82 10.53 6.14 11.78 8.53 13.58 14.96 47.19 119.52Armenia 5.82 10.72 4.80 11.78 5.39 10.97 13.02 43.20 105.70Azerbaijan 18.32 30.74 15.94 34.39 21.23 38.32 42.38 128.14 329.44Belarus 17.89 31.21 16.22 36.44 19.84 41.11 31.02 125.96 319.69Bosnia and Herzegovina 7.95 11.47 9.50 15.89 13.40 18.79 23.82 60.62 161.44Bulgaria 14.27 20.49 17.76 30.28 23.14 34.04 33.24 97.65 270.87Croatia 9.30 13.25 11.04 18.36 15.14 21.70 31.86 78.05 198.70Czech Republic 21.80 30.55 32.26 52.33 45.41 61.38 73.13 180.05 496.91Estonia 2.70 4.23 2.69 5.21 3.65 6.34 5.54 21.42 51.77Georgia 7.17 12.03 7.39 15.76 10.27 17.67 19.39 58.08 147.76Hungary 19.53 28.48 28.51 49.05 37.41 55.43 54.85 165.17 438.41Kazakhstan 24.78 43.99 23.71 53.70 28.71 55.80 41.00 149.92 421.61Kyrgyz Republic 11.36 18.05 10.85 20.55 13.57 21.95 20.50 55.18 172.00Latvia 4.47 6.86 4.51 8.36 6.26 10.42 10.53 41.02 92.43Lithuania 6.46 10.06 6.34 12.06 9.57 16.55 17.73 64.25 143.01Macedonia, FYR 4.76 6.49 5.38 8.49 7.13 9.49 12.19 29.40 83.32Moldova 9.23 14.29 9.22 16.71 10.79 16.93 16.90 48.64 142.70Poland 94.36 136.96 103.97 177.28 129.11 188.05 223.82 643.60 1,697.13Romania 43.10 63.92 56.93 99.60 71.17 107.69 106.92 300.93 850.25Russian Federation 243.39 450.92 225.89 534.57 273.53 578.09 447.08 1,805.56 4,559.02Serbia and Montenegro 22.58 31.49 25.34 41.24 33.93 46.13 59.00 135.76 395.47Slovak Republic 12.99 18.89 15.94 27.40 20.18 29.76 33.52 93.29 251.98Slovenia 4.47 6.02 5.86 8.91 8.18 10.60 16.90 42.47 103.40Tajikistan 12.99 21.43 10.56 21.24 12.88 21.76 20.78 54.81 176.45Turkey 187.72 275.61 209.38 350.17 262.91 371.07 334.06 800.42 2,791.34Turkmenistan 11.08 18.05 10.46 20.41 12.18 20.46 17.17 47.92 157.73Ukraine 67.45 125.02 66.62 157.00 89.78 181.72 144.32 563.74 1,395.66Uzbekistan 64.75 98.42 60.96 107.55 74.82 110.67 117.73 282.41 917.30
Source: World Bank staff calculations.
chaw_177-216_ch05.qxd 5/30/07 3:17 PM Page 199
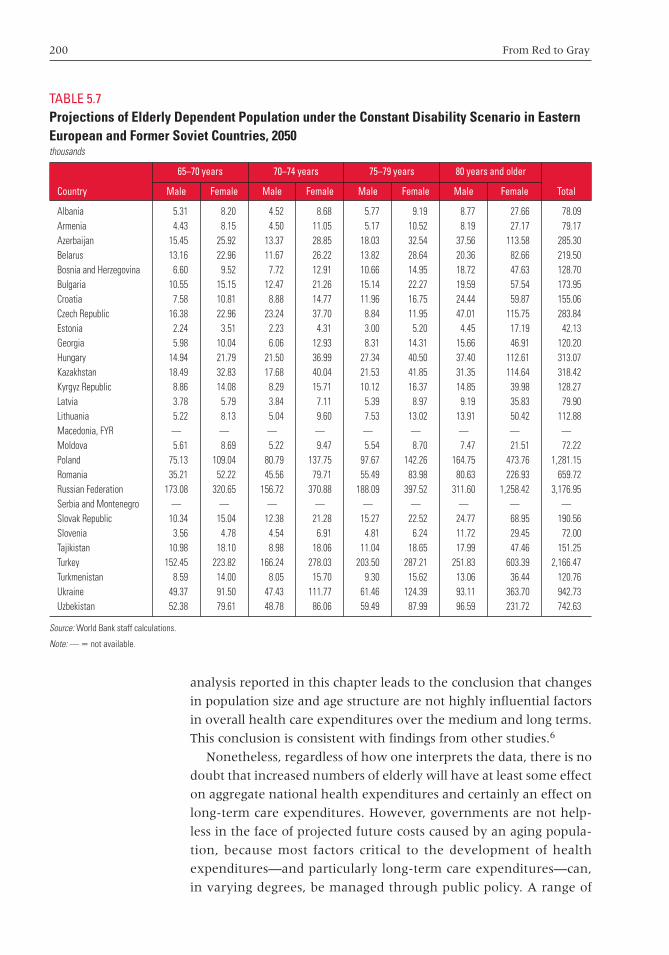
200 From Red to Gray
analysis reported in this chapter leads to the conclusion that changes
in population size and age structure are not highly influential factors
in overall health care expenditures over the medium and long terms.
This conclusion is consistent with findings from other studies.6
Nonetheless, regardless of how one interprets the data, there is no
doubt that increased numbers of elderly will have at least some effect
on aggregate national health expenditures and certainly an effect on
long-term care expenditures. However, governments are not help-
less in the face of projected future costs caused by an aging popula-
tion, because most factors critical to the development of health
expenditures—and particularly long-term care expenditures—can,
in varying degrees, be managed through public policy. A range of
TABLE 5.7Projections of Elderly Dependent Population under the Constant Disability Scenario in EasternEuropean and Former Soviet Countries, 2050thousands
65–70 years 70–74 years 75–79 years 80 years and older
Country Male Female Male Female Male Female Male Female Total
Albania 5.31 8.20 4.52 8.68 5.77 9.19 8.77 27.66 78.09Armenia 4.43 8.15 4.50 11.05 5.17 10.52 8.19 27.17 79.17Azerbaijan 15.45 25.92 13.37 28.85 18.03 32.54 37.56 113.58 285.30Belarus 13.16 22.96 11.67 26.22 13.82 28.64 20.36 82.66 219.50Bosnia and Herzegovina 6.60 9.52 7.72 12.91 10.66 14.95 18.72 47.63 128.70Bulgaria 10.55 15.15 12.47 21.26 15.14 22.27 19.59 57.54 173.95Croatia 7.58 10.81 8.88 14.77 11.96 16.75 24.44 59.87 155.06Czech Republic 16.38 22.96 23.24 37.70 8.84 11.95 47.01 115.75 283.84Estonia 2.24 3.51 2.23 4.31 3.00 5.20 4.45 17.19 42.13Georgia 5.98 10.04 6.06 12.93 8.31 14.31 15.66 46.91 120.20Hungary 14.94 21.79 21.50 36.99 27.34 40.50 37.40 112.61 313.07Kazakhstan 18.49 32.83 17.68 40.04 21.53 41.85 31.35 114.64 318.42Kyrgyz Republic 8.86 14.08 8.29 15.71 10.12 16.37 14.85 39.98 128.27Latvia 3.78 5.79 3.84 7.11 5.39 8.97 9.19 35.83 79.90Lithuania 5.22 8.13 5.04 9.60 7.53 13.02 13.91 50.42 112.88Macedonia, FYR — — — — — — — — —Moldova 5.61 8.69 5.22 9.47 5.54 8.70 7.47 21.51 72.22Poland 75.13 109.04 80.79 137.75 97.67 142.26 164.75 473.76 1,281.15Romania 35.21 52.22 45.56 79.71 55.49 83.98 80.63 226.93 659.72Russian Federation 173.08 320.65 156.72 370.88 188.09 397.52 311.60 1,258.42 3,176.95Serbia and Montenegro — — — — — — — — —Slovak Republic 10.34 15.04 12.38 21.28 15.27 22.52 24.77 68.95 190.56Slovenia 3.56 4.78 4.54 6.91 4.81 6.24 11.72 29.45 72.00Tajikistan 10.98 18.10 8.98 18.06 11.04 18.65 17.99 47.46 151.25Turkey 152.45 223.82 166.24 278.03 203.50 287.21 251.83 603.39 2,166.47Turkmenistan 8.59 14.00 8.05 15.70 9.30 15.62 13.06 36.44 120.76Ukraine 49.37 91.50 47.43 111.77 61.46 124.39 93.11 363.70 942.73Uzbekistan 52.38 79.61 48.78 86.06 59.49 87.99 96.59 231.72 742.63
Source: World Bank staff calculations.
Note: — � not available.
chaw_177-216_ch05.qxd 5/30/07 3:17 PM Page 200
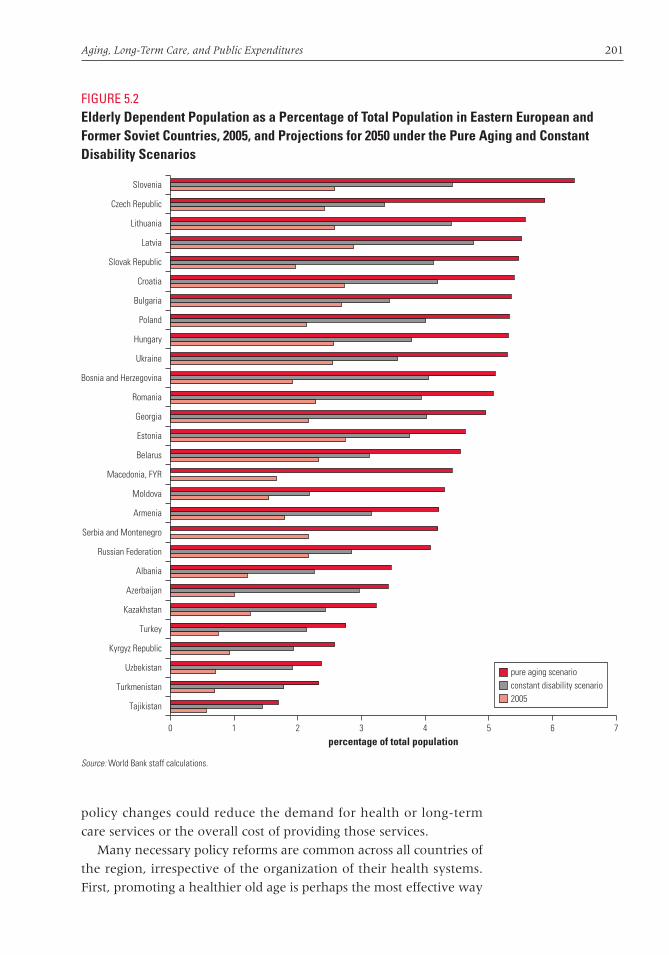
Aging, Long-Term Care, and Public Expenditures 201
policy changes could reduce the demand for health or long-term
care services or the overall cost of providing those services.
Many necessary policy reforms are common across all countries of
the region, irrespective of the organization of their health systems.
First, promoting a healthier old age is perhaps the most effective way
FIGURE 5.2Elderly Dependent Population as a Percentage of Total Population in Eastern European andFormer Soviet Countries, 2005, and Projections for 2050 under the Pure Aging and ConstantDisability Scenarios
0 1 2 3 4 5 6 7
Tajikistan
percentage of total population
Turkmenistan
Uzbekistan
Kyrgyz Republic
Turkey
Kazakhstan
Azerbaijan
Albania
Russian Federation
Serbia and Montenegro
Armenia
Moldova
Macedonia, FYR
Belarus
Estonia
Georgia
Romania
Bosnia and Herzegovina
Ukraine
Hungary
Poland
Bulgaria
Croatia
Slovak Republic
Latvia
Lithuania
Czech Republic
Slovenia
pure aging scenarioconstant disability scenario2005
Source: World Bank staff calculations.
chaw_177-216_ch05.qxd 5/30/07 3:17 PM Page 201
202 From Red to Gray
of ensuring better health and lower health expenditures for aging
populations. It is also the most long-term policy strategy; it involves
the adoption of preventive medical and social approaches at earlier
ages to forestall the needs of the elderly for clinical or long-term care
services. These approaches include changes in lifestyle, especially reg-
ular exercise and diet and weight control, as well as adoption of pre-
ventive measures to ward off illness and morbidity. The potential
payoff is considerable in that a healthier old-age cohort would collec-
tively use fewer medical and long-term care services.
Second, reforms that improve financing and delivery of long-term
care will be fundamental to containing the potential explosion of
expenditures on such care. The key lies in designing delivery arrange-
ments, including configuration of services and their accessibility to
elderly clients, that are substantially less expensive for public sector
budgets than current arrangements. Examples of such designs are the
neighborhood- and community-based arrangements termed care-
friendly districts in the Netherlands and open care centers in Greece.
These approaches introduce a category of care that is part medical and
part social, located between home care and primary care, and
designed to meet elderly needs in a more accessible way than do nor-
mal primary care services.
Third, it is important to recognize and strengthen the centrality of
informal caregivers in order to develop a cost-efficient long-term care
system. This proposal responds to two major threats to the provision
of long-term care. The first is that the predominant source of supply
for caregivers—women who are not working full-time—either has
shrunk or is projected to shrink. Thus, although a high proportion of
the elderly have at least one surviving child, there is a decreasing like-
lihood that those children will be available to provide care. The sec-
ond concern is the capacity and willingness of informal caregivers to
continue providing informal care. There is a real danger of unpaid
informal caregivers becoming overloaded and feeling compelled to
move their family members into institutional settings.
Some countries have already taken measures to address these
issues; they offer valuable lessons for the Eastern European and former
Soviet countries. Direct measures include incorporating cash as well as
service benefits in what is provided to elderly clients, thereby making
it possible to provide some financial reward to informal caregivers.
This strategy has already been adopted in a number of social health
insurance countries (for example, Austria and Germany) as well as
in several Nordic tax-based systems, where informal caregivers also
receive pension credits. In the Netherlands, both paid care and infor-
mal care can be combined for certain patients through individual
chaw_177-216_ch05.qxd 5/30/07 3:17 PM Page 202

Aging, Long-Term Care, and Public Expenditures 203
budgets, thereby allowing informal caregivers to obtain professional
assistance with more difficult tasks. Over the longer term, to the extent
that policy measures can influence household formation and reduce
the number of elderly single-person households, the conditions for
providing informal long-term care will be favorably affected.
In addition to these reforms, which are needed throughout the
region, population aging has some specific policy implications for dif-
ferent groups of countries in Eastern Europe and the former Soviet
Union.
New EU Member States
The health systems of most of the new EU member states are already
quite stretched for resources, and almost all are struggling to contain
expenditures and manage their fiscal balances. These fiscal problems
persist even though most countries have already undertaken large-
scale and comprehensive health sector reforms. Although these
reforms have succeeded in securing spending levels commensurate
with their levels of development and ensuring health outcomes at
levels commensurate with spending on health, they have left a num-
ber of issues unresolved.
First, although financing reforms have generally succeeded in safe-
guarding allocations to the health sector and protecting it from exoge-
nous shocks, the accompanying reforms in efficiency have not
contained costs. On the delivery side, the shift from the more
resource-intensive inpatient care to less expensive outpatient care
has not been accomplished, and the culture of overhospitalization
and overuse of specialized care persists. Recent gains from reductions
in the length of hospital stays per episode and increases in bed occu-
pancy rates in individual facilities have been negated by slow progress
in addressing the oversupply of hospital infrastructure. Furthermore,
not all health care systems have been able to find mechanisms of
reimbursement that are appropriate for motivating providers to
deliver better-quality services and to produce them efficiently and
cost-effectively.
Second, reforms in most countries have avoided the contentious
issue of the scope of services to be covered by the public system. The
bases for determining the scope of services covered by the health
insurance system are laid down in the constitutions of most coun-
tries. They are generally interpreted to imply universal coverage and
free access to health care services through the means of compulsory
health insurance built on the principles of solidarity and the right of
protection of individual health.
chaw_177-216_ch05.qxd 5/30/07 3:17 PM Page 203
204 From Red to Gray
Third, health sector reforms in these countries have had little or no
effect on the pervasiveness of informal payments from patients to
providers, which constitute a financial burden, especially for the poor,
and have a negative impact on equity in health care financing.
Fourth, most new EU member states do not have a well-functioning
system of quality assurance that regularly incorporates evidence-
based medicine in the production, delivery, and financing of health
care services.
At the same time, all new EU member states have populations that
are old and aging, which imposes added pressure to complete this
reform agenda. The key to managing incremental health expenditures
caused by aging is to focus on completing the reforms necessary to
address the existing deep-rooted structural faults in the design of the
health systems. In addition, long-term care strategies need to be for-
mulated in ways that ensure that costs do not spiral out of control. The
general approach of relying primarily on home care and informal
caregivers, as opposed to basing the system on institutionalized provi-
sion of long-term health care services, needs to be at the forefront of
the long-term care strategy in these countries—especially as they
come under peer pressure from the older EU member states to provide
for the long-term needs of the elderly.
Southeastern European Countries
The former Yugoslav republics—Bosnia and Herzegovina, Croatia,
FYR Macedonia, Montenegro, and Serbia—have a tradition of organ-
ized health care that dates back more than 70 years. The health system
guaranteed universal access to a liberal package of services, but the
provision of health care was marked by an overreliance on hospital
services and an underuse of primary care and preventive measures.
Health spending was historically high, and it increased even more
following the political and economic changes in the 1990s. Cur-
rently, these countries are among the highest spenders on health,
with public expenditures as high as 7.8 percent of GDP in Serbia and
Montenegro, more than 6.5 percent in Croatia, and 5.9 percent in
FYR Macedonia. These high levels of health spending have not been
sustainable, and the substantial financial deficits in recent years have
required sizable infusions of funds to keep systems afloat.
In all the countries of Southeastern Europe, the number and pro-
portion of elderly will increase significantly over the next two
decades. That increase will apply new pressures to the ongoing
reforms, which are in very early stages of formulation and imple-
mentation. As in the new EU member states, the key to managing the
chaw_177-216_ch05.qxd 5/30/07 3:17 PM Page 204
Aging, Long-Term Care, and Public Expenditures 205
potential increase in health expenditures lies first in completing the
reforms necessary to bring fiscal discipline to the health system and in
realigning the incentives so as to sustain the gains of these reform
measures. In addition, these countries should formulate their long-
term care strategies by building on their strong traditions of public
health and by developing strategies to ensure that the elderly spend
increasingly more years in good health. Long-term care is nascent in
these countries; to make sure that the costs do not get out of control,
the system should rely primarily on home care and informal care
instead of on institutionalized provision of services.
Middle-Income Former Soviet Countries
Public expenditures on health in the middle-income countries of the
former Soviet Union—Belarus, Kazakhstan, Russia, and Ukraine—
are about 4 percent of GDP, which is moderate by international stan-
dards. All citizens have free access to basic health care in public
facilities, though in practice a large amount of out-of-pocket spending
in the form of voluntary and informal payments occurs there. Ineffi-
ciencies in the provision of health care are generally acute. All
middle-income former Soviet countries have extensive hospital infra-
structures (on average, more than 30 percent more hospital beds per
population than in new EU member states), and more than 80 percent
of the limited resources are spent on staff salaries and utilities, leaving
little for supplies, equipment, maintenance, and repairs. Although
some health indicators have improved over the past few years (such
as infant and maternal mortality), others have remained stagnant or
have deteriorated (such as the mortality of men age 25 to 39 and the
incidence of tuberculosis and HIV). On balance, most of the health
status indicators for the middle-income former Soviet countries are
lower than those of the new EU member states.
Aging and changing demographics pose a particular challenge for
these countries, with huge declines in their populations and substan-
tial increases in the percentage of the elderly expected over the next
two decades. Given the high levels of mortality and morbidity among
young adults in these countries, there is a real concern that the rela-
tively healthier surviving cohorts who will constitute the large major-
ity of the elderly in 2025 will be more vulnerable to illnesses at an old
age. Furthermore, if the elderly cohorts in these countries suffer
increasing disability with age, then the health systems will face inor-
dinately high fiscal and capacity pressures in coping. The biggest
and most immediate challenge for these countries, therefore, is to
improve the health status of the adult population, especially targeting
chaw_177-216_ch05.qxd 5/30/07 3:17 PM Page 205
206 From Red to Gray
the proximate causes of morbidity and mortality in the 25 to 45 age
groups.
Low-Income Former Soviet Countries
Despite improvements in recent years, the health sectors in the low-
income former Soviet countries of Armenia, Georgia, and Moldova
continue to face problems related to the financing, access, and use of
health services and to efficiency in the use of existing resources. With
continuous underfunding exacerbated by misallocation of scarce
resources, large numbers of health conditions go untreated, and the
poor in these countries suffer disproportionately. Fiscal constraints
limit the availability of public funds for the health sector, and private
out-of-pocket spending on health is large, placing a huge burden on
household incomes. Indeed, for a majority of people in these coun-
tries, the possibility of illness or injury looms as one of the most fright-
ening aspects of poverty, with health expenditures on inpatient care
being particularly catastrophic.
Overall use of health services is low compared with other coun-
tries, and not everybody who reports an illness seeks care. The gen-
eral health status of the populations of these countries is poor
and—combined with inadequate levels of public funding and high
poverty rates—it is unlikely that these countries will be able to
achieve the Millennium Development Goals and other priority tar-
gets in population health. In addition, these countries are experienc-
ing a fast-growing HIV/AIDS epidemic, although prevalence is still
relatively low. Recent years have seen increases in the number of
communicable diseases (especially those that are sexually transmit-
ted) and noncommunicable diseases (including cancers and diseases
affecting the endocrine system, nervous and sensory organs, circula-
tory system, and respiratory organs).
Aging and the changing demographic structures pose new chal-
lenges for the already beleaguered health systems in Armenia,
Georgia, and Moldova. Given the current poor levels of population
health and very low rates of use of health services, it is likely that the
majority of the current adults who live beyond 65 years by 2025 (and
thus form the elderly cohort) will be in relatively poor health. The
exponentially increasing health needs of the elderly will stretch the
system even further and put tremendous pressures on the currently
inadequately funded public system. In preparing to meet these chal-
lenges, these countries need to make significant changes now across
almost all aspects of health financing, production, and delivery. First,
chaw_177-216_ch05.qxd 5/30/07 3:17 PM Page 206

Aging, Long-Term Care, and Public Expenditures 207
total spending on health needs to increase significantly. With the cur-
rent levels of poverty, further increases in private out-of-pocket
spending on health are unlikely to be achieved, which suggests that
at least for the next few years public allocations to the health sector
will have to increase. Second, a significant proportion of public spend-
ing on health will need to be directed toward prevention and promo-
tion of lifestyle changes that ensure better and improved health.
Third, it will be necessary to educate the population on the expected
surge in the demand for long-term care in two decades, and to pre-
pare families and communities to produce and provide the associated
health services at home and in community settings.
For all governments in the region, adopting and sustaining a policy
mix to address health system issues that are being exacerbated by
aging populations will require consistency and persistence. Such a
policy will also involve careful coordination across a range of govern-
mental actors both within national governments and between public
and private actors at the national and local levels. This effort will pres-
ent a considerable challenge to governments that feel pressure to
resolve important policy matters within a single electoral cycle.
Annex 5.A: Legislation on Long-Term Care in Europe
Annex table 5.A.1 summarizes the national legislation that defines
the provision and financing of long-term care in these European
countries: Austria, France, Germany, Hungary, Luxembourg, the
Netherlands, Norway, Poland, Sweden, and the United Kingdom.
Annex 5.B: Gross Domestic Product and Public Expenditures on Health
Annex table 5.B.1 shows general government health expenditures,
general government health expenditures per capita, and the gross
domestic product of Eastern European and former Soviet countries.
Annex 5.C: Elderly Dependent Population
Annex table 5.C.1 shows estimates of the elderly dependent popula-
tion in the countries of Eastern Europe and the former Soviet Union
in 2005. Annex table 5.C.2 provides an estimate of the elderly
chaw_177-216_ch05.qxd 5/30/07 3:17 PM Page 207
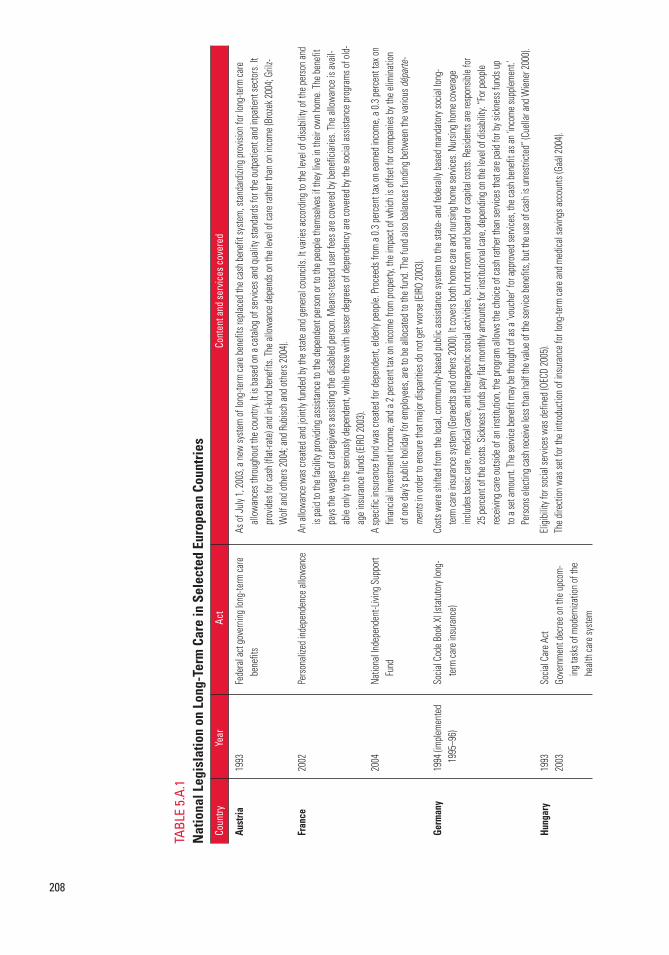
TABL
E 5.
A.1
Nat
iona
l Leg
isla
tion
on L
ong-
Term
Car
e in
Sel
ecte
d Eu
rope
an C
ount
ries
Coun
tryYe
arAc
tCo
nten
t and
serv
ices
cov
ered
Aust
ria
Fran
ce
Germ
any
Hung
ary
1993
2002
2004
1994
(imple
ment
ed
1995
–96)
1993
2003
Fede
ral a
ct go
vern
ing lo
ng-te
rm ca
re
bene
fits
Perso
naliz
ed in
depe
nden
ce al
lowan
ce
Natio
nal In
depe
nden
t-Livi
ng S
uppo
rt Fu
nd
Socia
l Cod
e Boo
k XI (s
tatu
tory
long-
term
care
insu
ranc
e)
Socia
l Car
e Act
Gove
rnme
nt de
cree o
n the
upco
m-ing
task
s of m
oder
nizat
ion of
the
healt
h car
e sys
tem
As of
July
1, 20
03, a
new
syste
m of
long
-term
care
bene
fits r
eplac
ed th
e cas
h ben
efit
syste
m, st
anda
rdizi
ng pr
ovisi
on fo
r lon
g-te
rm ca
re
allow
ance
s thr
ough
out t
he co
untry
. It is
base
d on a
cata
log of
servi
ces a
nd qu
ality
stand
ards
for t
he ou
tpat
ient a
nd in
patie
nt se
ctors.
It
prov
ides f
or ca
sh (f
lat-ra
te) a
nd in
-kind
bene
fits.
The a
llowa
nce d
epen
ds on
the l
evel
of ca
re ra
ther
than
on in
come
(Bro
zek 2
004;
Grilz
-W
olf an
d oth
ers 2
004;
and R
ubisc
h and
othe
rs 20
04).
An al
lowan
ce w
as cr
eate
d and
joint
ly fu
nded
by th
e sta
te an
d gen
eral
coun
cils.
It va
ries a
ccor
ding t
o the
leve
l of d
isabil
ity of
the p
erso
n and
is
paid
to th
e fac
ility p
rovid
ing as
sista
nce t
o the
depe
nden
t per
son o
r to t
he pe
ople
them
selve
s if t
hey l
ive in
their
own h
ome.
The b
enef
it pa
ys th
e wag
es of
care
giver
s ass
isting
the d
isable
d per
son.
Mea
ns-te
sted u
ser f
ees a
re co
vere
d by b
enef
iciar
ies. T
he al
lowan
ce is
avail
-ab
le on
ly to
the s
eriou
sly de
pend
ent,
while
thos
e with
less
er de
gree
s of d
epen
denc
y are
cove
red b
y the
socia
l ass
istan
ce pr
ogra
ms of
old-
age i
nsur
ance
fund
s (EIR
O 20
03).
A sp
ecifi
c ins
uran
ce fu
nd w
as cr
eate
d for
depe
nden
t, eld
erly
peop
le. Pr
ocee
ds fr
om a
0.3 pe
rcent
tax o
n ear
ned i
ncom
e, a 0
.3 pe
rcent
tax o
n fin
ancia
l inve
stmen
t inc
ome,
and a
2 pe
rcent
tax o
n inc
ome f
rom
prop
erty,
the i
mpac
t of w
hich i
s offs
et fo
r com
panie
s by t
he el
imina
tion
of on
e day
’s pu
blic h
olida
y for
emplo
yees
, are
to be
alloc
ated
to th
e fun
d. Th
e fun
d also
balan
ces f
undin
g bet
ween
the v
ariou
s dép
arte
-me
ntsi
n ord
er to
ensu
re th
at m
ajor d
ispar
ities
do no
t get
wor
se (E
IRO
2003
).
Costs
wer
e shif
ted f
rom
the l
ocal,
comm
unity
-bas
ed pu
blic a
ssist
ance
syste
m to
the s
tate
- and
fede
rally
base
d man
dato
ry so
cial lo
ng-
term
care
insur
ance
syste
m(G
erae
dtsa
ndot
hers
2000
).Itc
over
sbot
hhom
ecar
eand
nursi
ngho
mese
rvice
s.Nu
rsing
home
cove
rage
includ
esba
sicca
re,m
edica
lcar
e,an
dthe
rape
utic
socia
lacti
vities
,but
notr
oom
andb
oard
orca
pital
costs
.Res
ident
sare
resp
onsib
lefo
r25
perce
ntof
thec
osts.
Sick
ness
fund
spay
flatm
onth
lyam
ount
sfor
instit
ution
alca
re,d
epen
dingo
nthe
level
ofdis
abilit
y.“F
orpe
ople
rece
iving
care
outsi
deof
anins
titut
ion,t
hepr
ogra
mall
owst
hech
oiceo
fcas
hrat
hert
hans
ervic
esth
atar
epaid
forb
ysick
ness
fund
sup
toas
etam
ount
.The
servi
cebe
nefit
mayb
etho
ught
ofas
a‘vo
uche
r’fo
rapp
rove
dser
vices
,the
cash
bene
fitas
an‘in
come
supp
lemen
t.’Pe
rsons
electi
ngca
shre
ceive
lesst
hanh
alfth
evalu
eoft
hese
rvice
bene
fits,
butt
heus
eofc
ashi
sunr
estri
cted”
(Cue
llara
ndW
iener
2000
).
Eligib
ility f
or so
cial s
ervic
es w
as de
fined
(OEC
D 20
05).
The d
irecti
on w
as se
t for
the i
ntro
ducti
on of
insu
ranc
e for
long
-term
care
and m
edica
l sav
ings a
ccou
nts (
Gaál
2004
).
208
chaw_177-216_ch05.qxd 5/30/07 3:17 PM Page 208
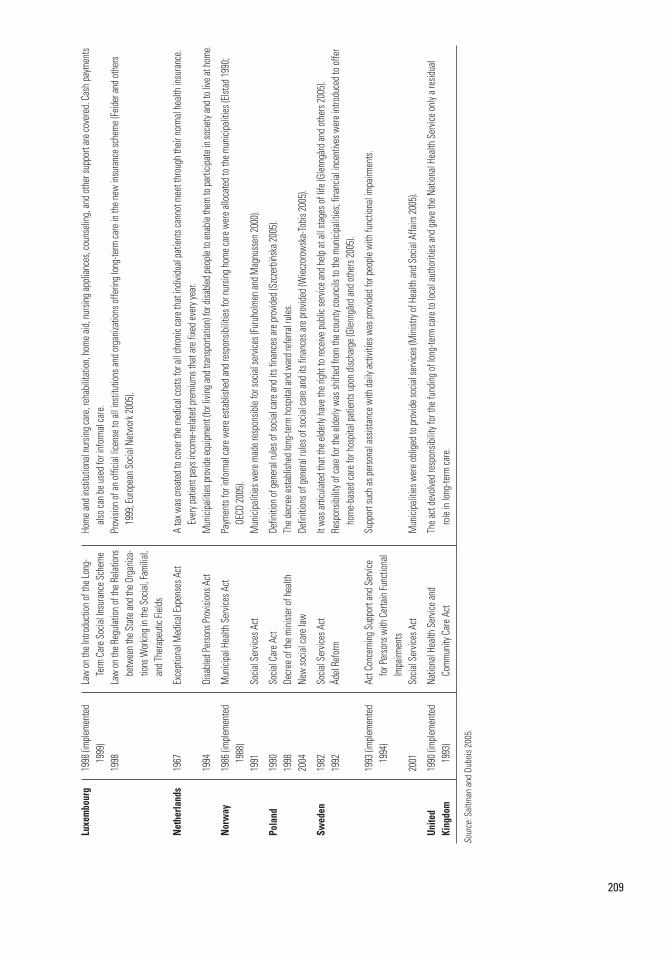
Luxe
mbo
urg
Neth
erla
nds
Norw
ay
Pola
nd
Swed
en
Unite
dKi
ngdo
m
1998
(imple
ment
ed
1999
)19
98
1967
1994
1986
(imple
ment
ed
1988
)19
91
1990
1998
2004
1982
1992
1993
(imple
ment
ed
1994
)
2001
1990
(imple
ment
ed
1993
)
Law
on th
e Int
rodu
ction
of th
e Lon
g-Te
rm C
are S
ocial
Insu
ranc
e Sch
eme
Law
on th
e Reg
ulatio
n of t
he R
elatio
ns
betw
eent
heSt
atea
ndth
eOrg
aniza
-tio
ns W
orkin
g in t
he S
ocial
, Fam
ilial,
and T
hera
peut
ic Fie
lds
Exce
ption
al M
edica
l Exp
ense
s Act
Disa
bled P
erso
ns Pr
ovisi
ons A
ct
Mun
icipa
l Hea
lth S
ervic
es A
ct
Socia
l Ser
vices
Act
Socia
l Car
e Act
Decre
e of t
he m
iniste
r of h
ealth
New
socia
l car
e law
Socia
l Ser
vices
Act
Ädel
Refo
rm
Act C
once
rning
Sup
port
and S
ervic
e fo
r Per
sons
with
Cer
tain
Func
tiona
l Im
pairm
ents
Socia
l Ser
vices
Act
Natio
nal H
ealth
Ser
vice a
nd
Comm
unity
Car
e Act
Home
and i
nstit
ution
al nu
rsing
care
, reh
abilit
ation
, hom
e aid,
nursi
ng ap
plian
ces,
coun
selin
g, an
d oth
er su
ppor
t are
cove
red.
Cash
paym
ents
also c
an be
used
for i
nfor
mal c
are.
Prov
ision
of an
offic
ial lic
ense
to al
l insti
tutio
ns an
d org
aniza
tions
offe
ring l
ong-
term
care
in th
e new
insu
ranc
e sch
eme (
Feide
r and
othe
rs 19
99; E
urop
ean S
ocial
Net
work
2005
).
A ta
x was
crea
ted t
o cov
er th
e med
ical c
osts
for a
ll chr
onic
care
that
indiv
idual
patie
nts c
anno
t mee
t thr
ough
their
norm
al he
alth i
nsur
ance
. Ev
ery p
atien
t pay
s inc
ome-
relat
ed pr
emium
s tha
t are
fixe
d eve
ry ye
ar.M
unici
palit
iespr
ovide
equip
ment
(forl
iving
andt
rans
porta
tion)
ford
isable
dpeo
pleto
enab
leth
emto
parti
cipat
eins
ociet
yand
toliv
eath
ome.
Paym
ents
for i
nfor
mal c
are w
ere e
stabli
shed
and r
espo
nsibi
lities
for n
ursin
g hom
e car
e wer
e allo
cate
d to t
he m
unici
palit
ies (E
lstad
1990
; OE
CD 20
05).
Mun
icipa
lities
wer
e mad
e res
pons
ible f
or so
cial s
ervic
es (F
uruh
olmen
and M
agnu
ssen
2000
).
Defin
ition
of ge
nera
l rule
s of s
ocial
care
and i
ts fin
ance
s are
prov
ided (
Szcz
erbi
nska
2005
).Th
e dec
ree e
stabli
shed
long
-term
hosp
ital a
nd w
ard r
efer
ral r
ules.
Defin
ition
s of g
ener
al ru
les of
socia
l car
e and
its f
inanc
es ar
e pro
vided
(Wiec
zoro
wska
-Tobis
2005
).
It wa
s arti
culat
ed th
at th
e elde
rly ha
ve th
e righ
t to r
eceiv
e pub
lic se
rvice
and h
elp at
all s
tage
s of l
ife (G
lenng
ård a
nd ot
hers
2005
).Re
spon
sibilit
y of c
are f
or th
e elde
rly w
as sh
ifted
from
the c
ount
y cou
ncils
to th
e mun
icipa
lities
; fina
ncial
ince
ntive
s wer
e int
rodu
ced t
o offe
r ho
me-b
ased
care
for h
ospit
al pa
tient
s upo
n disc
harg
e (Gl
enng
ård a
nd ot
hers
2005
).
Supp
ort s
uch a
s per
sona
l ass
istan
ce w
ith da
ily ac
tiviti
es w
as pr
ovide
d for
peop
le wi
th fu
nctio
nal im
pairm
ents.
Mun
icipa
lities
wer
e obli
ged t
o pro
vide s
ocial
servi
ces (
Mini
stry o
f Hea
lth an
d Soc
ial A
ffairs
2005
).
The a
ct de
volve
d res
pons
ibilit
y for
the f
undin
g of l
ong-
term
care
to lo
cal a
utho
rities
and g
ave t
he N
ation
al He
alth S
ervic
e only
a re
sidua
l ro
le in
long-
term
care
.
Sour
ce:S
altm
an a
nd D
uboi
s 20
05.
209
chaw_177-216_ch05.qxd 5/30/07 3:17 PM Page 209
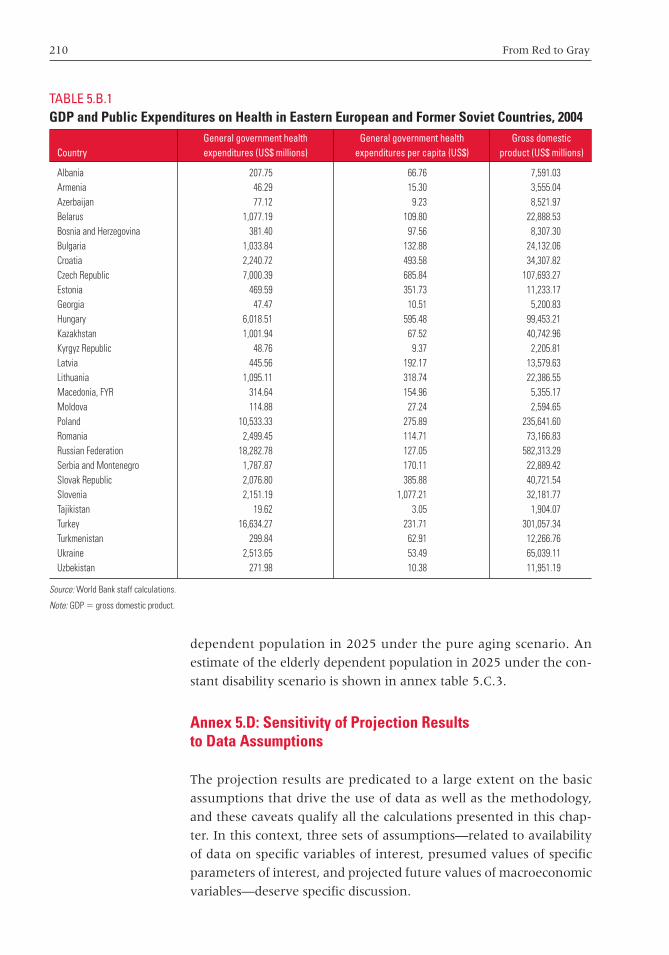
210 From Red to Gray
dependent population in 2025 under the pure aging scenario. An
estimate of the elderly dependent population in 2025 under the con-
stant disability scenario is shown in annex table 5.C.3.
Annex 5.D: Sensitivity of Projection Results to Data Assumptions
The projection results are predicated to a large extent on the basic
assumptions that drive the use of data as well as the methodology,
and these caveats qualify all the calculations presented in this chap-
ter. In this context, three sets of assumptions—related to availability
of data on specific variables of interest, presumed values of specific
parameters of interest, and projected future values of macroeconomic
variables—deserve specific discussion.
TABLE 5.B.1GDP and Public Expenditures on Health in Eastern European and Former Soviet Countries, 2004
General government health General government health Gross domestic Country expenditures (US$ millions) expenditures per capita (US$) product (US$ millions)
Albania 207.75 66.76 7,591.03Armenia 46.29 15.30 3,555.04Azerbaijan 77.12 9.23 8,521.97Belarus 1,077.19 109.80 22,888.53Bosnia and Herzegovina 381.40 97.56 8,307.30Bulgaria 1,033.84 132.88 24,132.06Croatia 2,240.72 493.58 34,307.82Czech Republic 7,000.39 685.84 107,693.27Estonia 469.59 351.73 11,233.17Georgia 47.47 10.51 5,200.83Hungary 6,018.51 595.48 99,453.21Kazakhstan 1,001.94 67.52 40,742.96Kyrgyz Republic 48.76 9.37 2,205.81Latvia 445.56 192.17 13,579.63Lithuania 1,095.11 318.74 22,386.55Macedonia, FYR 314.64 154.96 5,355.17Moldova 114.88 27.24 2,594.65Poland 10,533.33 275.89 235,641.60Romania 2,499.45 114.71 73,166.83Russian Federation 18,282.78 127.05 582,313.29Serbia and Montenegro 1,787.87 170.11 22,889.42Slovak Republic 2,076.80 385.88 40,721.54Slovenia 2,151.19 1,077.21 32,181.77Tajikistan 19.62 3.05 1,904.07Turkey 16,634.27 231.71 301,057.34Turkmenistan 299.84 62.91 12,266.76Ukraine 2,513.65 53.49 65,039.11Uzbekistan 271.98 10.38 11,951.19
Source: World Bank staff calculations.
Note: GDP � gross domestic product.
chaw_177-216_ch05.qxd 5/30/07 3:17 PM Page 210

Aging, Long-Term Care, and Public Expenditures 211
Data on Specific Variables of Interest
Data on age-related public expenditures on health are not available
for most countries, especially non–European Union (EU) member
states, so an average age-cost profile is used for the purposes of pro-
jecting future health expenditures in this exercise. This may be a lim-
iting assumption: for instance, if average nominal spending on
cohorts age 60 to 70 in the non-EU member states is four times nom-
inal spending instead of the stipulated average of three times nominal
spending on cohorts age 20 to 30, the projected expenditure figures
will underestimate actual expenditures. Even more limiting is the
assumption made about death-related costs, which are not available
for almost any of the countries in the study sample and are assumed
for the purposes of these projections to have the same ratio between
TABLE 5.C.1Estimates of Elderly Dependent Population, 2005 thousands
65–70 years 70–74 years 75–79 years 80 years and older
Country Male Female Male Female Male Female Male Female Total
Albania 3.62 4.79 3.46 5.07 3.31 5.39 2.77 9.44 37.85Armenia 4.19 7.61 3.84 7.26 5.74 9.30 3.88 12.34 54.17Azerbaijan 7.10 12.50 7.39 14.25 8.18 13.02 5.26 16.70 84.40Belarus 13.21 28.58 12.96 33.70 17.23 42.59 14.68 64.61 227.56Bosnia and Herzegovina 7.17 11.94 6.82 12.88 6.79 11.35 4.43 13.43 74.80Bulgaria 12.57 20.96 15.84 30.28 20.01 31.81 22.44 53.36 207.26Croatia 8.02 13.54 8.93 18.63 10.44 19.53 10.53 34.49 124.10Czech Republic 13.42 22.28 15.46 31.24 20.88 37.94 26.32 79.50 247.03Estonia 1.99 4.14 2.02 5.07 2.61 6.14 2.49 11.98 36.43Georgia 7.46 12.88 6.53 13.02 9.40 16.37 6.65 24.68 96.97Hungary 13.35 26.23 14.98 35.07 20.01 40.36 26.04 83.49 259.52Kazakhstan 16.40 31.40 9.70 21.24 15.66 34.78 9.97 45.74 184.88Kyrgyz Republic 3.76 6.39 3.26 6.71 4.52 8.37 3.05 12.71 48.78Latvia 3.62 7.33 3.36 8.91 4.18 10.79 3.60 24.68 66.47Lithuania 4.62 9.40 5.09 12.47 6.44 14.88 7.48 27.95 88.32Macedonia, FYR 2.63 4.04 2.09 5.07 3.13 4.84 3.32 7.99 33.10Moldova 4.54 8.84 4.32 9.73 5.39 10.60 5.26 16.36 65.04Poland 46.93 83.28 53.18 113.71 66.82 128.53 78.95 250.47 821.87Romania 34.29 58.19 37.25 72.47 46.81 74.03 50.97 121.24 495.24Russian Federation 201.00 439.17 155.33 422.23 224.11 569.35 174.79 919.48 3,105.46Serbia and Montenegro 15.62 25.10 18.43 34.25 22.79 35.34 24.65 50.82 227.01Slovak Republic 5.82 10.72 6.43 14.52 8.18 16.37 11.63 32.31 105.98Slovenia 3.05 4.89 3.26 6.85 4.18 7.81 4.16 16.34 50.53Tajikistan 3.48 5.17 2.69 4.77 3.83 5.02 3.05 8.35 36.35Turkey 49.06 80.93 56.26 90.28 58.99 82.03 47.92 85.31 550.77Turkmenistan 2.84 4.70 2.40 4.80 2.96 5.39 2.22 8.35 33.65Ukraine 79.59 164.22 59.90 149.19 91.52 216.13 77.28 346.67 1,184.51Uzbekistan 16.05 24.91 13.82 25.21 17.92 27.71 15.51 48.28 189.42
Source: United Nations 2005, author’s calculations.
chaw_177-216_ch05.qxd 5/30/07 3:17 PM Page 211
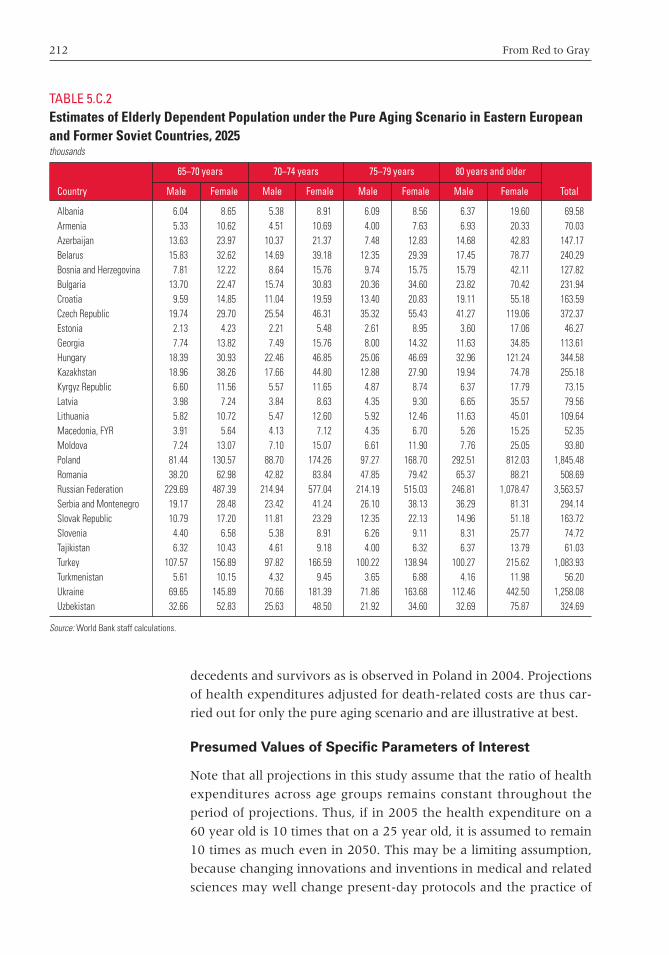
212 From Red to Gray
decedents and survivors as is observed in Poland in 2004. Projections
of health expenditures adjusted for death-related costs are thus car-
ried out for only the pure aging scenario and are illustrative at best.
Presumed Values of Specific Parameters of Interest
Note that all projections in this study assume that the ratio of health
expenditures across age groups remains constant throughout the
period of projections. Thus, if in 2005 the health expenditure on a
60 year old is 10 times that on a 25 year old, it is assumed to remain
10 times as much even in 2050. This may be a limiting assumption,
because changing innovations and inventions in medical and related
sciences may well change present-day protocols and the practice of
TABLE 5.C.2Estimates of Elderly Dependent Population under the Pure Aging Scenario in Eastern Europeanand Former Soviet Countries, 2025thousands
65–70 years 70–74 years 75–79 years 80 years and older
Country Male Female Male Female Male Female Male Female Total
Albania 6.04 8.65 5.38 8.91 6.09 8.56 6.37 19.60 69.58Armenia 5.33 10.62 4.51 10.69 4.00 7.63 6.93 20.33 70.03Azerbaijan 13.63 23.97 10.37 21.37 7.48 12.83 14.68 42.83 147.17Belarus 15.83 32.62 14.69 39.18 12.35 29.39 17.45 78.77 240.29Bosnia and Herzegovina 7.81 12.22 8.64 15.76 9.74 15.75 15.79 42.11 127.82Bulgaria 13.70 22.47 15.74 30.83 20.36 34.60 23.82 70.42 231.94Croatia 9.59 14.85 11.04 19.59 13.40 20.83 19.11 55.18 163.59Czech Republic 19.74 29.70 25.54 46.31 35.32 55.43 41.27 119.06 372.37Estonia 2.13 4.23 2.21 5.48 2.61 8.95 3.60 17.06 46.27Georgia 7.74 13.82 7.49 15.76 8.00 14.32 11.63 34.85 113.61Hungary 18.39 30.93 22.46 46.85 25.06 46.69 32.96 121.24 344.58Kazakhstan 18.96 38.26 17.66 44.80 12.88 27.90 19.94 74.78 255.18Kyrgyz Republic 6.60 11.56 5.57 11.65 4.87 8.74 6.37 17.79 73.15Latvia 3.98 7.24 3.84 8.63 4.35 9.30 6.65 35.57 79.56Lithuania 5.82 10.72 5.47 12.60 5.92 12.46 11.63 45.01 109.64Macedonia, FYR 3.91 5.64 4.13 7.12 4.35 6.70 5.26 15.25 52.35Moldova 7.24 13.07 7.10 15.07 6.61 11.90 7.76 25.05 93.80Poland 81.44 130.57 88.70 174.26 97.27 168.70 292.51 812.03 1,845.48Romania 38.20 62.98 42.82 83.84 47.85 79.42 65.37 88.21 508.69Russian Federation 229.69 487.39 214.94 577.04 214.19 515.03 246.81 1,078.47 3,563.57Serbia and Montenegro 19.17 28.48 23.42 41.24 26.10 38.13 36.29 81.31 294.14Slovak Republic 10.79 17.20 11.81 23.29 12.35 22.13 14.96 51.18 163.72Slovenia 4.40 6.58 5.38 8.91 6.26 9.11 8.31 25.77 74.72Tajikistan 6.32 10.43 4.61 9.18 4.00 6.32 6.37 13.79 61.03Turkey 107.57 156.89 97.82 166.59 100.22 138.94 100.27 215.62 1,083.93Turkmenistan 5.61 10.15 4.32 9.45 3.65 6.88 4.16 11.98 56.20Ukraine 69.65 145.89 70.66 181.39 71.86 163.68 112.46 442.50 1,258.08Uzbekistan 32.66 52.83 25.63 48.50 21.92 34.60 32.69 75.87 324.69
Source: World Bank staff calculations.
chaw_177-216_ch05.qxd 5/30/07 3:17 PM Page 212
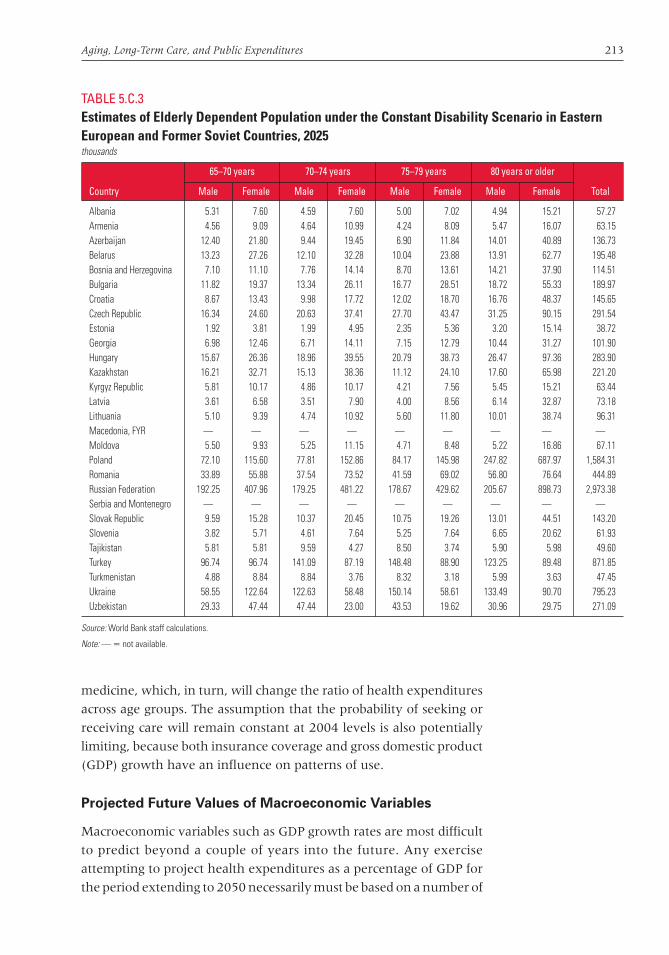
Aging, Long-Term Care, and Public Expenditures 213
medicine, which, in turn, will change the ratio of health expenditures
across age groups. The assumption that the probability of seeking or
receiving care will remain constant at 2004 levels is also potentially
limiting, because both insurance coverage and gross domestic product
(GDP) growth have an influence on patterns of use.
Projected Future Values of Macroeconomic Variables
Macroeconomic variables such as GDP growth rates are most difficult
to predict beyond a couple of years into the future. Any exercise
attempting to project health expenditures as a percentage of GDP for
the period extending to 2050 necessarily must be based on a number of
TABLE 5.C.3Estimates of Elderly Dependent Population under the Constant Disability Scenario in EasternEuropean and Former Soviet Countries, 2025thousands
65–70 years 70–74 years 75–79 years 80 years or older
Country Male Female Male Female Male Female Male Female Total
Albania 5.31 7.60 4.59 7.60 5.00 7.02 4.94 15.21 57.27Armenia 4.56 9.09 4.64 10.99 4.24 8.09 5.47 16.07 63.15Azerbaijan 12.40 21.80 9.44 19.45 6.90 11.84 14.01 40.89 136.73Belarus 13.23 27.26 12.10 32.28 10.04 23.88 13.91 62.77 195.48Bosnia and Herzegovina 7.10 11.10 7.76 14.14 8.70 13.61 14.21 37.90 114.51Bulgaria 11.82 19.37 13.34 26.11 16.77 28.51 18.72 55.33 189.97Croatia 8.67 13.43 9.98 17.72 12.02 18.70 16.76 48.37 145.65Czech Republic 16.34 24.60 20.63 37.41 27.70 43.47 31.25 90.15 291.54Estonia 1.92 3.81 1.99 4.95 2.35 5.36 3.20 15.14 38.72Georgia 6.98 12.46 6.71 14.11 7.15 12.79 10.44 31.27 101.90Hungary 15.67 26.36 18.96 39.55 20.79 38.73 26.47 97.36 283.90Kazakhstan 16.21 32.71 15.13 38.36 11.12 24.10 17.60 65.98 221.20Kyrgyz Republic 5.81 10.17 4.86 10.17 4.21 7.56 5.45 15.21 63.44Latvia 3.61 6.58 3.51 7.90 4.00 8.56 6.14 32.87 73.18Lithuania 5.10 9.39 4.74 10.92 5.60 11.80 10.01 38.74 96.31Macedonia, FYR — — — — — — — — —Moldova 5.50 9.93 5.25 11.15 4.71 8.48 5.22 16.86 67.11Poland 72.10 115.60 77.81 152.86 84.17 145.98 247.82 687.97 1,584.31Romania 33.89 55.88 37.54 73.52 41.59 69.02 56.80 76.64 444.89Russian Federation 192.25 407.96 179.25 481.22 178.67 429.62 205.67 898.73 2,973.38Serbia and Montenegro — — — — — — — — —Slovak Republic 9.59 15.28 10.37 20.45 10.75 19.26 13.01 44.51 143.20Slovenia 3.82 5.71 4.61 7.64 5.25 7.64 6.65 20.62 61.93Tajikistan 5.81 5.81 9.59 4.27 8.50 3.74 5.90 5.98 49.60Turkey 96.74 96.74 141.09 87.19 148.48 88.90 123.25 89.48 871.85Turkmenistan 4.88 8.84 8.84 3.76 8.32 3.18 5.99 3.63 47.45Ukraine 58.55 122.64 122.63 58.48 150.14 58.61 133.49 90.70 795.23Uzbekistan 29.33 47.44 47.44 23.00 43.53 19.62 30.96 29.75 271.09
Source: World Bank staff calculations.
Note: — � not available.
chaw_177-216_ch05.qxd 5/30/07 3:17 PM Page 213
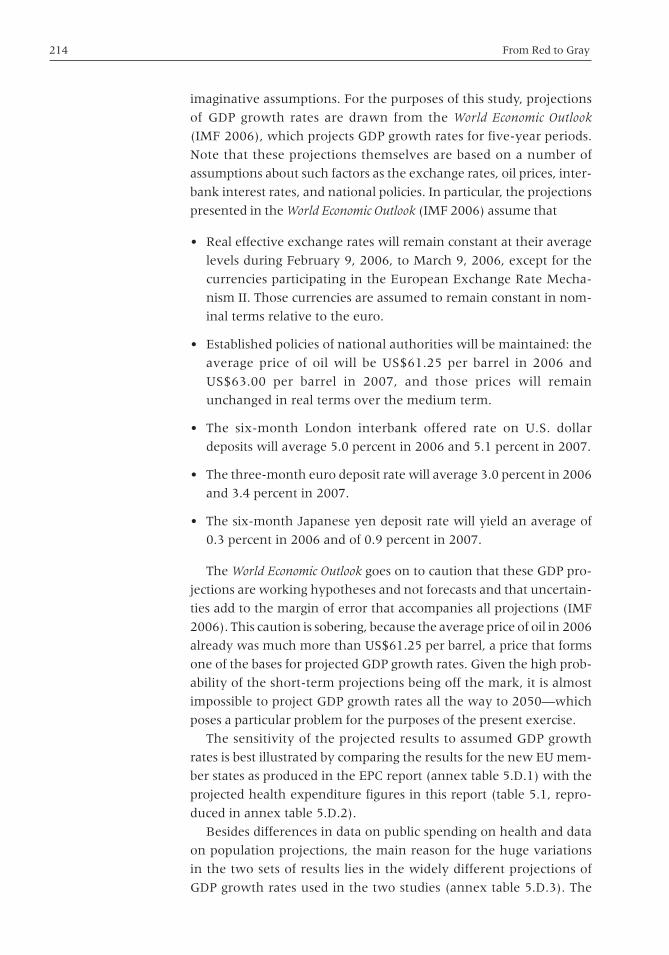
214 From Red to Gray
imaginative assumptions. For the purposes of this study, projections
of GDP growth rates are drawn from the World Economic Outlook
(IMF 2006), which projects GDP growth rates for five-year periods.
Note that these projections themselves are based on a number of
assumptions about such factors as the exchange rates, oil prices, inter-
bank interest rates, and national policies. In particular, the projections
presented in the World Economic Outlook (IMF 2006) assume that
• Real effective exchange rates will remain constant at their average
levels during February 9, 2006, to March 9, 2006, except for the
currencies participating in the European Exchange Rate Mecha-
nism II. Those currencies are assumed to remain constant in nom-
inal terms relative to the euro.
• Established policies of national authorities will be maintained: the
average price of oil will be US$61.25 per barrel in 2006 and
US$63.00 per barrel in 2007, and those prices will remain
unchanged in real terms over the medium term.
• The six-month London interbank offered rate on U.S. dollar
deposits will average 5.0 percent in 2006 and 5.1 percent in 2007.
• The three-month euro deposit rate will average 3.0 percent in 2006
and 3.4 percent in 2007.
• The six-month Japanese yen deposit rate will yield an average of
0.3 percent in 2006 and of 0.9 percent in 2007.
The World Economic Outlook goes on to caution that these GDP pro-
jections are working hypotheses and not forecasts and that uncertain-
ties add to the margin of error that accompanies all projections (IMF
2006). This caution is sobering, because the average price of oil in 2006
already was much more than US$61.25 per barrel, a price that forms
one of the bases for projected GDP growth rates. Given the high prob-
ability of the short-term projections being off the mark, it is almost
impossible to project GDP growth rates all the way to 2050—which
poses a particular problem for the purposes of the present exercise.
The sensitivity of the projected results to assumed GDP growth
rates is best illustrated by comparing the results for the new EU mem-
ber states as produced in the EPC report (annex table 5.D.1) with the
projected health expenditure figures in this report (table 5.1, repro-
duced in annex table 5.D.2).
Besides differences in data on public spending on health and data
on population projections, the main reason for the huge variations
in the two sets of results lies in the widely different projections of
GDP growth rates used in the two studies (annex table 5.D.3). The
chaw_177-216_ch05.qxd 5/30/07 3:17 PM Page 214
Aging, Long-Term Care, and Public Expenditures 215
TABLE 5.D.1Projection Results as Percentage of GDP under the Pure AgingScenario in Selected Eastern European and Former Soviet Countries,2010–50: Economic Policy Committee Report
2010 2030 2050Country (% of GDP) (% of GDP) (% of GDP) Change 2010–50
Czech Republic 6.7 7.7 8.3 1.5Estonia 5.6 6.0 6.3 0.7Hungary 5.7 6.2 6.5 0.8Latvia 5.3 5.6 5.9 0.6Lithuania 3.8 4.1 4.4 0.6Poland 4.3 5.0 5.4 1.1Slovak Republic 4.6 5.5 6.1 1.5Slovenia 6.6 7.4 7.8 1.2
Source: European Commission 2006.
TABLE 5.D.2Projection Results as Percentage of GDP under the Pure AgingScenario in Selected Eastern European and Former Soviet Countries,2010–50: from Table 5.2
2010 2030 2050Country (% of GDP) (% of GDP) (% of GDP) Change 2010–50
Czech Republic 6.65 7.09 6.83 0.18Estonia 4.27 4.46 4.56 0.29Hungary 6.16 6.34 6.16 0.00Latvia 3.31 3.30 3.17 �0.14Lithuania 5.02 5.04 4.72 �0.30Poland 4.58 5.01 4.84 0.26Slovak Republic 5.24 5.90 5.89 0.65Slovenia 6.88 7.44 7.07 0.25
Source: World Bank staff calculations.
TABLE 5.D.3Projected Annual Growth of GDP in Selected Eastern Europeanand Former Soviet Countries, 2010–50 percent
2010 2020 2030 2040 2050
Country EPC WB EPC WB EPC WB EPC WB EPC WB
Czech Republic 3.6 3.8 2.5 3.8 1.9 3.8 0.4 3.8 0.8 3.8Estonia 5.6 6.1 2.7 6.1 2.3 6.1 1.3 6.1 0.6 6.1Hungary 3.3 4.1 2.5 4.1 2.1 4.1 0.8 4.1 1.1 4.1Latvia 7.4 4.3 2.9 4.3 2.1 4.3 1.2 4.3 0.4 4.3Lithuania 6.1 5.8 3.0 5.8 1.9 5.8 1.3 5.8 0.4 5.8Poland 5.0 5.0 3.2 5.0 2.2 5.0 0.7 5.0 0.4 5.0Slovak Republic 5.3 5.1 3.3 5.1 2.0 5.1 0.4 5.1 0.3 5.1Slovenia 3.6 3.9 2.4 3.9 2.0 3.9 1.0 3.9 1.1 3.9
Source: EPC values: European Commission 2006. WB values: IMF 2006.
Note: EPC � Economic Policy Committee; WB � World Bank.
chaw_177-216_ch05.qxd 5/30/07 3:17 PM Page 215
216 From Red to Gray
column labeled “EPC” presents the projected GDP growth rates as
used in the Economic Policy Committee study, which are much
lower than the projected growth rates used in this study (the column
labeled “WB”). With such huge differences in projected growth rates,
it is not surprising that the projected share of health expenditures in
GDP are so much higher in EPC calculations compared with the con-
clusions of this study, which holds the 2010 projected GDP growth
rate constant to 2050.
Notes
1. In particular, the SHARE study finds that “the proportion of unique ormultiple overnight hospital stays is higher in the older age categories upto 80 to 84 years (p � 0.0001). At this age, more than one in five personsreported one or more hospital admissions over the last twelve months.The proportion of repeat hospitalizations reaches 8 percent at the age of75–79; it is slightly lower in older age groups . . . whilst 9 percent of indi-viduals aged 50–54 had inpatient or outpatient surgeries in the pasttwelve months, the proportion in the 75–79 age category is 14 percent.Lower rates are observed at the age of 80–84 (13 percent) or 85� (9 per-cent)” (Börsch-Supan and others 2005: 137).
2. See annex table 5.B.1 for the base data on health expenditures used inthis exercise.
3. A measure of physical functioning of adults, first developed by Katz andothers (1963), ADL (activities of daily living) evaluate difficulties in per-forming such activities as dressing, bathing, eating, toileting, transferringfrom bed to chair, walking across a small room, and the like. In recentyears, this assessment of functional abilities has been further refined intothree general categories of activity: basic, instrumental, and advancedactivities. Basic activities of daily living (BADL) encompass those coveredby the original ADL and include the ability to bathe, dress, use the toilet,transfer from bed to chair, and feed oneself independently. Instrumentalactivities of daily living (IADL) include using the telephone, shopping,preparing meals, housekeeping, taking medications, and handlingfinances. Advanced activities of daily living (AADL) are primarilyassessed in clinical settings as person-specific recreational, occupational,and community participation; changes in these daily habits may reflectdysfunction.
4. See annex table 5.C.2 for estimates for 2025.5. See annex table 5.C.3 for estimates for 2025.6. In addition to research reported earlier in this chapter, Kotlikoff and
Hagist (2005) conclude that growth in real benefit levels (that is, healthexpenditures per person at a given age) in 10 OECD countries explainsas much as 89 percent of overall health care spending growth.
chaw_177-216_ch05.qxd 5/30/07 3:17 PM Page 216
217
Introduction
The transition to a market economy and political liberalization have
presented major challenges to the education systems of Eastern Euro-
pean and former Soviet countries. Reforms have been initiated
throughout the region to meet these challenges, but the reforms are
by no means complete. The demographic changes taking place are
now imposing additional stresses on the region’s education systems.
Lower fertility levels in general are reducing the demand for pre-
school, primary, and secondary education and are shifting demand
toward higher education. To the extent that they have already affected
education systems, these changes have exacerbated the problem of
redundant capacity of staff and facilities at the primary and secondary
levels and the problem of shortage of capacity in higher education.
Only at the preschool level have education systems adapted them-
selves to reduced demand, and this adjustment occurred for entirely
extraneous reasons.1 Demographic change will lead to further ineffi-
ciencies in the use of budget resources for education unless there
Aging and Education
CHAPTER 6
chaw_217-262_ch06.qxd 6/1/07 10:42 AM Page 217

218 From Red to Gray
are fundamental changes in the financing and management of these
systems.2
Two unique features of the region affect how its education systems
have responded to demographic change to date and will continue
to respond in the future. The first—already emphasized in earlier
chapters—is that the demographic transition occurred at lower levels
of income than in other regions where this transition has occurred.3
The second is that the poorest of the former Soviet republics inherited
education systems that were far more extensive than they could have
afforded to develop and could afford to maintain with their own
resources. These features create special challenges for policy, espe-
cially in the poorest countries. A central conclusion of this chapter is
that slowing population growth and aging are increasing the urgency
of making the reforms in education that are needed in order to
respond to needs of the market economy and to maintain growth and
productivity as global competition intensifies. This finding applies
equally to Turkey.
The education interventions that transition countries need to
make to respond to the effects of aging and to address the global
competitiveness agenda are similar to those that more industrial
countries must make (box 6.1). However, such interventions are
likely to be more challenging for the transition countries because
they are starting further behind. At the same time, some aspects of
the reform agenda may be easier for the transition countries. For
example, in higher education, the less developed programs in the
transition countries may carry less baggage and thus be easier to redi-
rect. More generally, policy reform may be more tractable in the tran-
sition countries than in the founding member countries of the
European Union (EU), because the transition countries may be more
amenable to innovation and to taking a more fundamental approach
to policy reform.
The rest of this chapter is organized as follows. The next section
describes key features of education performance since the start of the
transition, including developments attributable to demographic
change. It also describes the special features of education systems in
the transition countries that result from the legacy of the Soviet
period and the effects of the transition to date.4 The section that fol-
lows then presents an analysis of the effect of demographic changes
on enrollment. The chapter next considers how improvements in
education can contribute to productivity and growth, thereby helping
old countries in the region counteract the negative economic conse-
quences of aging. Finally, policy implications are laid out.
chaw_217-262_ch06.qxd 6/1/07 10:42 AM Page 218

Aging and Education 219
BOX 6.1
How Are Education Systems Implicated in the Process of Demographic Change?
The process of demographic change in the Eastern European and former Soviet countries is
changing demand for schooling and calling on education systems to meet the challenge of
preparing a higher-productivity population.
Changing Demand for Schooling
The aging of populations in countries of the region is leading to changes in the size of school-age
cohorts and to shifts in the demand for education at various levels. Under the right circum-
stances, these changes could be a source of fiscal savings. Shrinking school-age populations
could provide a demographic windfall by allowing increased enrollment ratios without expanded
staff and facilities. Alternatively, it could allow a scaling back of staff and facilities—and signifi-
cant budget savings—without reduced education coverage (again, in relative terms). These
benefits will not occur spontaneously. Reaping the potential fiscal benefit of slowing population
growth will require implementing a range of measures to allow and to encourage efficiency
improvements.
Supporting Higher Growth and Productivity
Education systems could play an important role in offsetting the possible negative effects of
demographic change on economic growth and productivity, while contributing to the productivity
gains that will be needed in the global economic context. This imperative is not limited to the tran-
sition countries. It is also a serious challenge for the advanced EU countries, which are concerned
about the possibility of being left behind as other countries move more quickly to upgrade and
modernize their education systems and to make them more inclusive. The recent Lisbon Council
Policy Brief summarizes this concern:
“The time when Europe competed mostly with countries that offered low-skill work at low wages
is long gone. Today, countries like China and India are starting to deliver high skills at low costs—
and at an ever-increasing pace. This is profoundly changing the rules of the game. There is no way
for Europe to stop these rapidly developing countries from producing wave after wave of highly
skilled graduates. . . . Faced with a rapidly changing world, Europe’s school systems will have to
make considerable headway if they are to meet the demands of modern societies. Some of these
changes will require additional investment, particularly in the early years of schooling. But the evi-
dence also shows that money is not a guarantee for strong results. . . . In short, if Europe wants to
retain its competitive edge at the top of the global added-value chain, the education system must
be made more flexible, more effective, and more easily accessible to a wider range of people.
(Schleicher 2006: 2)”
chaw_217-262_ch06.qxd 6/1/07 10:42 AM Page 219

220 From Red to Gray
How Education Systems Have Changed Since Transition
Education systems in the region were affected by a number of shocks
in the first 15 years of transition. Demography has already had an
impact and, of course, the political and economic transition has had
fundamental effects throughout the region.
Changes in Cohort Sizes and Enrollments
Fertility declines were well under way in most of the region’s coun-
tries by the start of the transition, and they had a dramatic effect on
school-age populations, which declined throughout the 1990s in all
transition countries except Azerbaijan, the Kyrgyz Republic, Tajikistan,
Turkmenistan, and Uzbekistan.5 In most other transition countries,
the decline between 1989 and 2003 was at least 20 percent, and in
Estonia, Georgia, and Moldova, it was more than 30 percent. School-
age population figures for a selection of countries from different
subregions and with different demographic profiles are shown in
figure 6.1. In the Russian Federation, population in the 0 to 17 age
group declined by almost 10 million during this period. Migration
contributed to the decline in the poorer republics of the former Soviet
Union and mitigated the decline in Russia itself. Because the fertility
FIGURE 6.1Change in School-Age Population, 0 to 17 years, Eastern Europeanand Former Soviet Benchmark Countries, 1989–2003
Source: UNICEF, 2004, table 1.2.
601989 1990 1991 1992 1993 1994 1995 1996 1997 1998 1999 2000 2001 2002 2003
70
110
100
90
80
year
perc
enta
geof
chan
ge
Albania Bulgaria Czech RepublicKyrgyz Republic Poland Russian Federation
chaw_217-262_ch06.qxd 6/1/07 10:42 AM Page 220
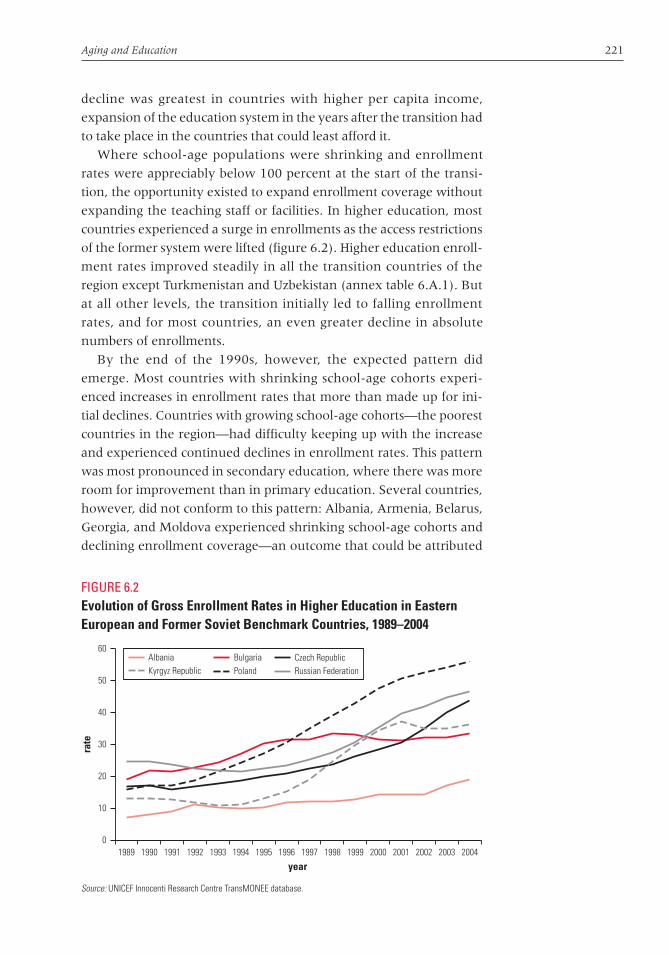
Aging and Education 221
decline was greatest in countries with higher per capita income,
expansion of the education system in the years after the transition had
to take place in the countries that could least afford it.
Where school-age populations were shrinking and enrollment
rates were appreciably below 100 percent at the start of the transi-
tion, the opportunity existed to expand enrollment coverage without
expanding the teaching staff or facilities. In higher education, most
countries experienced a surge in enrollments as the access restrictions
of the former system were lifted (figure 6.2). Higher education enroll-
ment rates improved steadily in all the transition countries of the
region except Turkmenistan and Uzbekistan (annex table 6.A.1). But
at all other levels, the transition initially led to falling enrollment
rates, and for most countries, an even greater decline in absolute
numbers of enrollments.
By the end of the 1990s, however, the expected pattern did
emerge. Most countries with shrinking school-age cohorts experi-
enced increases in enrollment rates that more than made up for ini-
tial declines. Countries with growing school-age cohorts—the poorest
countries in the region—had difficulty keeping up with the increase
and experienced continued declines in enrollment rates. This pattern
was most pronounced in secondary education, where there was more
room for improvement than in primary education. Several countries,
however, did not conform to this pattern: Albania, Armenia, Belarus,
Georgia, and Moldova experienced shrinking school-age cohorts and
declining enrollment coverage—an outcome that could be attributed
FIGURE 6.2Evolution of Gross Enrollment Rates in Higher Education in EasternEuropean and Former Soviet Benchmark Countries, 1989–2004
Source: UNICEF Innocenti Research Centre TransMONEE database.
01989 1990 1991 1992 1993 1994 1995 1996 1997 1998 1999 2000 2001 2002 2003 2004
10
60
50
40
30
20
year
rate
Albania Bulgaria Czech RepublicKyrgyz Republic Poland Russian Federation
chaw_217-262_ch06.qxd 6/1/07 10:42 AM Page 221
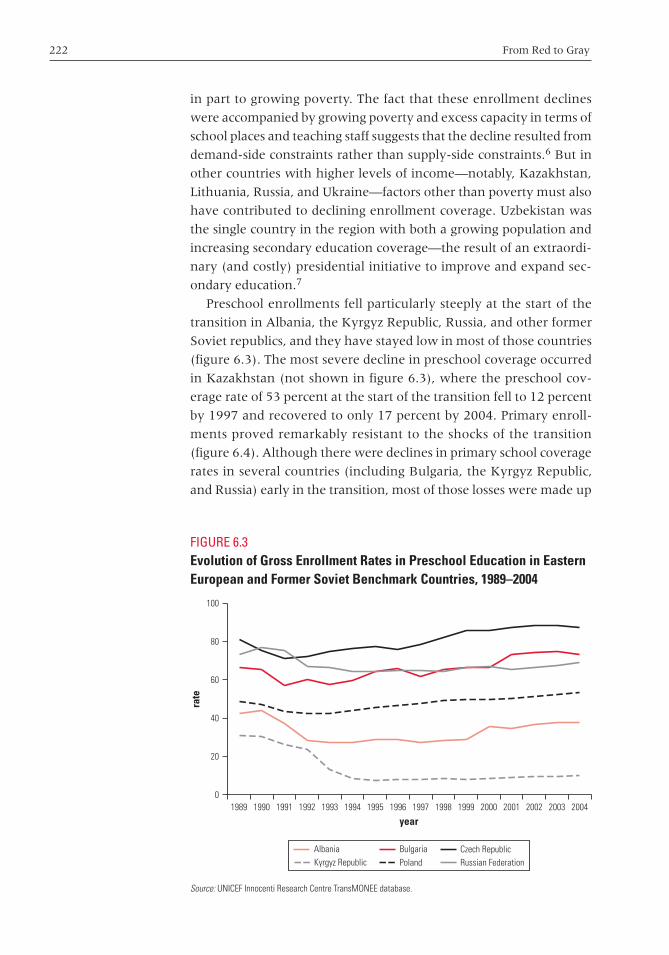
222 From Red to Gray
in part to growing poverty. The fact that these enrollment declines
were accompanied by growing poverty and excess capacity in terms of
school places and teaching staff suggests that the decline resulted from
demand-side constraints rather than supply-side constraints.6 But in
other countries with higher levels of income—notably, Kazakhstan,
Lithuania, Russia, and Ukraine—factors other than poverty must also
have contributed to declining enrollment coverage. Uzbekistan was
the single country in the region with both a growing population and
increasing secondary education coverage—the result of an extraordi-
nary (and costly) presidential initiative to improve and expand sec-
ondary education.7
Preschool enrollments fell particularly steeply at the start of the
transition in Albania, the Kyrgyz Republic, Russia, and other former
Soviet republics, and they have stayed low in most of those countries
(figure 6.3). The most severe decline in preschool coverage occurred
in Kazakhstan (not shown in figure 6.3), where the preschool cov-
erage rate of 53 percent at the start of the transition fell to 12 percent
by 1997 and recovered to only 17 percent by 2004. Primary enroll-
ments proved remarkably resistant to the shocks of the transition
(figure 6.4). Although there were declines in primary school coverage
rates in several countries (including Bulgaria, the Kyrgyz Republic,
and Russia) early in the transition, most of those losses were made up
FIGURE 6.3Evolution of Gross Enrollment Rates in Preschool Education in EasternEuropean and Former Soviet Benchmark Countries, 1989–2004
Source: UNICEF Innocenti Research Centre TransMONEE database.
01989 1990 1991 1992 1993 1994 1995 1996 1997 1998 1999 2000 2001 2002 2003 2004
20
100
80
60
40
year
rate
Albania Bulgaria Czech RepublicKyrgyz Republic Poland Russian Federation
chaw_217-262_ch06.qxd 6/1/07 10:42 AM Page 222

Aging and Education 223
by subsequent improvements. Even so, gross enrollment rates in pri-
mary education remained below 90 percent in Armenia, Bosnia and
Herzegovina, and Russia as of 2004, indicating important unfinished
business in addressing the causes of incomplete coverage.8
Secondary enrollment rates fell early in the transition by more than
a third in Albania, Armenia, Azerbaijan, and Georgia and by at least a
quarter in Kazakhstan, the Kyrgyz Republic, Lithuania, Romania, and
Uzbekistan (see figure 6.5 for some benchmarks). In Tajikistan and
Turkmenistan, secondary enrollment rates have fallen steadily since
the breakup of the Soviet Union and remain well below half the cov-
erage rates at the start of the transition. Collapsing enrollments in
vocational and technical specializations account for most of the
declines in secondary coverage. The most dramatic example is Albania,
where enrollments in secondary vocational education and training
fell from 54 percent of the age group in 1989 to less than 6 percent of
the age group by the end of the decade.9 As is discussed later, these
declines reflect the declining relevance of vocational education and
training to the skill needs of economies as they open up to interna-
tional competition.
Education System Responses to the Economic and Political Transition
The economic and political aspects of the transition have fundamen-
tally affected education systems. The rest of this section looks at these
FIGURE 6.4Evolution of Gross Enrollment Rates in Primary Education in EasternEuropean and Former Soviet Benchmark Countries, 1989–2004
Source: UNICEF Innocenti Research Centre TransMONEE database.
851989 1990 1991 1992 1993 1994 1995 1996 1997 1998 1999 2000 2001 2002 2003 2004
90
110
105
100
95
year
rate
Albania Bulgaria Czech RepublicKyrgyz Republic Poland Russian Federation
chaw_217-262_ch06.qxd 6/1/07 10:42 AM Page 223
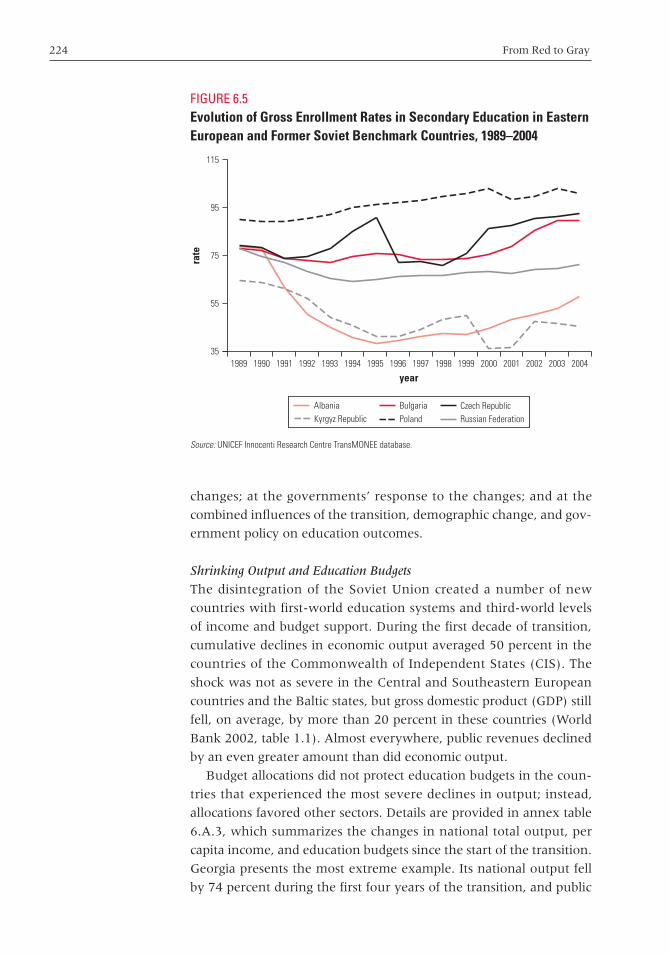
224 From Red to Gray
changes; at the governments’ response to the changes; and at the
combined influences of the transition, demographic change, and gov-
ernment policy on education outcomes.
Shrinking Output and Education Budgets
The disintegration of the Soviet Union created a number of new
countries with first-world education systems and third-world levels
of income and budget support. During the first decade of transition,
cumulative declines in economic output averaged 50 percent in the
countries of the Commonwealth of Independent States (CIS). The
shock was not as severe in the Central and Southeastern European
countries and the Baltic states, but gross domestic product (GDP) still
fell, on average, by more than 20 percent in these countries (World
Bank 2002, table 1.1). Almost everywhere, public revenues declined
by an even greater amount than did economic output.
Budget allocations did not protect education budgets in the coun-
tries that experienced the most severe declines in output; instead,
allocations favored other sectors. Details are provided in annex table
6.A.3, which summarizes the changes in national total output, per
capita income, and education budgets since the start of the transition.
Georgia presents the most extreme example. Its national output fell
by 74 percent during the first four years of the transition, and public
FIGURE 6.5Evolution of Gross Enrollment Rates in Secondary Education in EasternEuropean and Former Soviet Benchmark Countries, 1989–2004
Source: UNICEF Innocenti Research Centre TransMONEE database.
351989 1990 1991 1992 1993 1994 1995 1996 1997 1998 1999 2000 2001 2002 2003 2004
55
115
95
75
year
rate
Albania Bulgaria Czech RepublicKyrgyz Republic Poland Russian Federation
chaw_217-262_ch06.qxd 6/1/07 10:42 AM Page 224

Aging and Education 225
revenues fell by a similar amount. During the same period, budget
allocations for education declined from 6.1 percent of GDP to 0.6 per-
cent, almost destroying the education system in the process. In 2004,
real GDP had partially recovered to 42 percent of its 1989 level, but
real public expenditures on education were just 20 percent of their
1989 level. Similarly, but to a lesser degree, budget allocations accen-
tuated the cumulative effect of declining output and revenues in
Armenia, Azerbaijan, Bulgaria, the Kyrgyz Republic, the former
Yugoslav Republic of Macedonia, and Moldova. In some countries,
including Latvia, Lithuania, and Tajikistan, budget allocations actu-
ally mitigated the effect of cumulative output and revenue declines.
In Russia and Ukraine, they were neutral.
In most of the countries with rising GDP, budget allocations
favored the education sector. This was the case for Belarus, Poland,
and Slovenia. Budget allocations in Estonia favored education early in
the transition, when output was falling, but favored other sectors in
later years, when output was rising (although still allocating a larger
share to the sector than most other countries in the region). The
unusually high proportion of education sector spending in Uzbekistan
reflects the expansion in secondary vocational education noted earlier.
Features of the Inherited Education Systems
In addition to these budget shocks, which had large and immediate
impacts in many countries of the region, the transition also brought
major changes in the role of education and in education governance.
The Eastern European and former Soviet countries entered the tran-
sition with highly developed education systems that were closely
aligned with the needs of a planned economy (see Berryman 2000;
Laporte and Schweitzer 1994). Coverage of education at the pre-
school, primary, and secondary levels was close to universal. The
structure of the economy emphasized manufacturing, and most sec-
ondary students were enrolled in vocational and technical programs
that were oriented to the specific skill needs of local public enter-
prises. Access to university education was strictly controlled and
largely limited to producing scientists and engineers for manufactur-
ing industries. Wages and salaries were set normatively, rather than
on the basis of educational qualifications and productivity, and played
no role in allocating skills where they were most needed. Salaries for
jobs that required highly educated workers were often lower than for
jobs with minimal skill requirements. Services were neglected, and so
were the skills—including humanities, business, and social sciences—
associated with the service sector. The role of education as an instru-
ment of personal growth and enrichment was entirely unrecognized.
chaw_217-262_ch06.qxd 6/1/07 10:42 AM Page 225
226 From Red to Gray
The teaching and learning process emphasized accumulation of
factual knowledge. Pedagogical methods emphasized discipline and
respect for authority but tended to discourage student inquiry and
initiative. Teaching effort and resources focused on the students who
performed most highly on national academic competitions. Less
attention was paid to low-performing students, who were routinely
assigned to short, terminal programs of vocational training.
Transition Challenges: Changing Skill Requirements
The move to a market economy and the breakup of the Soviet Union
and its alliances ended the internal consistency of the former system
and launched three broad trends with mutually reinforcing effects on
labor markets and skill requirements (Mertaugh and Hanushek 2005):
• First, market liberalization meant that production was driven by
consumer choice rather than by central production targets. Prices
of outputs and inputs were freed from administrative control.
Wage and salary levels were no longer normatively set but were
free to reflect differences in productivity and to signal emerging
scarcities and redundancies in specific labor market skills.
• Second, the opening of the transition economies and the disap-
pearance of subsidies and guaranteed markets required that enter-
prises compete to survive. This situation created powerful new
incentives for efficiency in production.
• Third, freer flows of trade, of financial resources, of information,
and of human capital interacted with an acceleration of technolog-
ical change throughout the global economy, reinforcing the other
demands for change in the new EU member economies.
Together, these developments led to a major reconfiguration of the
structure of production; to the creation of entirely new industries,
especially in the service sector; and to the accelerating pace of economic
change. These trends fundamentally transformed skill requirements,
making some skills—especially in the manufacturing sector—
redundant and creating excess demand for others; they also made
skill requirements more volatile and less predictable over time (see
Commander and Kollo 2004; Peter 2003). It also led to major adjust-
ments in the returns to skills, widening wage differentials between
high-skill and low-skill workers. Open and sizable unemployment
appeared (World Bank 2005a). Lifetime employment became the
exception rather than the rule, necessitating a change in jobs—and
often occupations—several times in the course of one’s working life.
chaw_217-262_ch06.qxd 6/1/07 10:42 AM Page 226

Aging and Education 227
Government Policy Response
The collapse of output, income, and revenues early in the transition
made it difficult to undertake the reforms needed to respond to this
new environment (box 6.2)—or even to maintain education systems
as they were in the pretransition era. That collapse also exposed the
inefficiencies of the planned economy, in which prices did not reflect
BOX 6.2
Reforms Needed in Education Systems
The main reforms necessitated by the transition were the following:
• Secondary and higher education needed to become more demand driven rather than centrally
directed.
• Vocational education at the secondary level needed to teach more generic skills for a few
broad families of occupational specializations rather than highly specific skills for a large num-
ber of narrow occupations.
• Vocational education needed to give more emphasis to developing numeracy skills, problem-
solving skills, communications skills (including foreign language proficiency), and teamwork
skills and needed to give less emphasis to job-specific skills.
• Primary, secondary, and higher education needed to provide more opportunities for students
and teachers to apply information technology throughout the curriculum, including use of com-
puters to access and share information on the World Wide Web.
• Career counseling needed to be developed to provide students, teachers, and parents with
up-to-date information on the implications of education choices for employment opportunities
and options for further education.
• Higher education needed to be more flexible at entry and to offer easier transfer opportunities
across programs and faculties.
• Higher education needed to provide stronger performance incentives to students and faculty.
• The legal and fiscal environment needed to change to encourage employers and local govern-
ments to develop lifelong learning programs to meet local (and global) skill needs.
At the same time, the sharp contraction of public resources for education called for diversification
of financing, more efficient management of education, and a new formula for allocating public re-
sources that rewarded efficiency, innovation, and responsiveness to the demands of students
and the economy.
Source: Mertaugh and Hanushek 2005.
chaw_217-262_ch06.qxd 6/1/07 10:42 AM Page 227

228 From Red to Gray
scarcity and incentives to hoard staff members, inventories, and
infrastructure were strong. Implementation of education policy
reforms to address the new needs of the transition economy was also
hampered by the fragmentation of responsibilities—first during the
breakup of the Soviet Union and then during a politically motivated
rush to decentralization throughout the region. Decentralization also
made it more difficult to address the growing problem of poverty,
which was one of the earliest and most visible byproducts of transi-
tion (World Bank 2002, table 1.7).
Governments’ initial response to collapsing revenues and collapsing
education budgets at the start of the transition focused on reducing
expenditures, as already discussed, and diversifying financing sources.
Expenditure cutbacks occurred largely through sharply reduced
budget outlays for preschool education, shortened durations of com-
pulsory schooling, suspensions of expenditures for school maintenance
and for renewal of teaching and learning materials, arrears in teacher
salary payments at the start of the transition, and falling real salary
levels thereafter. In many of the transition countries, the duration of
compulsory education was shortened from 11 years to 8 or 9 years.
Sources of financing were diversified through five sets of actions:
• Decentralizing (in principle, but rarely in fact) the responsibility for
financing and managing most primary and secondary education
programs from central to regional and local governments
• Introducing student fees and other user charges (including “con-
tracted” provision of secondary and higher education within pub-
lic schools and universities for students with entry scores below
the threshold for budget-financed admission)
• Requiring parents to purchase textbooks and other educational
materials that formerly had been provided free by schools
• Expanding private education
• Allowing schools to raise and retain funds through actions such as
rental or sale of unneeded facilities and provision of paid extracur-
ricular courses.
In addition, many teachers and school principals generated
income through paid tutoring and solicitation of informal payments
from students and parents. This practice very significantly augments
teacher salaries in more affluent areas, where parents can afford
these payments. It also exacerbates disparities in teaching and learn-
ing conditions and creates perverse incentives for teaching practices,
chaw_217-262_ch06.qxd 6/1/07 10:42 AM Page 228
Aging and Education 229
including withholding part of the curriculum in order to generate a
demand for private tuition.
Decentralization has typically involved financing teacher salaries
from the state budget but devolving responsibility for school mainte-
nance and provision of educational materials (and often even teacher
training) to local governments. In principle, the decentralization of
responsibilities for education finance and management to local gov-
ernments offers the potential to make the management of education
more efficient and the content of education more responsive to local
needs. It could also encourage the mobilization of additional resources
for education. However, fundamental problems in the design of
decentralization policy in the transition countries have blocked the
attainment of these benefits. A widespread problem that prevents the
actual implementation of decentralization is that the discretion of
local governments to reconfigure schools and to reduce staffing or
redeploy staff members to improve efficiency is constrained by cen-
trally imposed norms on class size and teaching hours, as well as, in
many cases, central constraints on hiring and firing teachers and
school principals (see Fiszbein 2001; Godfrey 2004; Herczy nski 2002;
Kitaev 1996; Levacic 2003; Rysalieva and Ibraeva 1999).
In most countries in the region, decentralization was meant to be
accompanied by a move from input-based to output-based financing.
Per student or capitation-based financing was expected not only to
provide a basis for determining the size of budget transfers from cen-
tral to local governments for education financing, but also to provide
an incentive for improved efficiency—including shedding teachers
and consolidating schools in response to shrinking enrollments. The
Czech Republic, Romania, and the Slovak Republic have adopted
nationwide capitation financing schemes, and pilot schemes are under
implementation on a small scale in the Kyrgyz Republic, Russia, and
Uzbekistan. But practical problems associated with implementing this
model have prevented its adoption in other countries in the region
(box 6.3).
The most serious problem has been lack of agreement on a practi-
cal, output-based formula for central transfers to local governments.
As a result, central budgets throughout the region continue to finance
primary and secondary teacher salaries and often other essentials
such as utilities and textbooks. Another fundamental problem is that
centrally established norms for minimum and maximum class sizes,
teaching hours, and the like, as well as prohibitions on closing schools,
limit the flexibility of local governments to configure schools and
deploy teachers more efficiently.
chaw_217-262_ch06.qxd 6/1/07 10:42 AM Page 229

230 From Red to Gray
Consequences for Education Systems
Not surprisingly, decentralization and the actions taken by govern-
ments in response to shrinking budgets led to a number of adverse
consequences for education programs, including the closure of many
preschools and a sharp decline in preschool enrollment in many coun-
tries early in the transition. The increased reliance on financing from
local governments and households with different capacities con-
tributed to the emergence of sizable differences in education quality
(described later). It may also have contributed to the declines observed
in secondary education coverage (annex table 6.A.1). Reliance on
BOX 6.3
Fundamental Problems with Current Financing Formulas
The continued central financing of core education expenditures reflects the awareness on the
part of central governments that education quality and coverage will fall to unacceptable levels in
poorer localities if local governments have to rely on their own resources to finance these inputs.
But current financing formulas have three fundamental problems:
• Many important educational inputs—such as equipment and materials, programs for poor stu-
dents and at-risk students, and school maintenance—are usually financed locally, which leads
to significant disparities in the quality and coverage of education. Unfortunately, these needs
are greatest in localities with the lowest incomes, revenues, and educational performance. It
is important to ensure adequate financing for these expenditures as well—preferably, through
a central financing instrument that targets schools and localities that have the greatest needs.
• Teacher training, while included in principle in central transfers, is in reality not provided to any
significant degree. Failure to fund teacher training is a high-risk and low-efficiency option be-
cause it means that an education system’s most important assets—the teachers—are not
equipped to perform their work effectively, especially in introducing the important innovations
planned under ongoing and future reforms.
• There are no incentives for improved efficiency—and often not even the means to achieve it—
because centrally established norms on minimum and maximum class sizes, teaching hours,
and the like limit the flexibility of local governments to configure schools and deploy teachers
more efficiently. The gap-filling transfer mechanism provides no incentive for local govern-
ments to move toward larger class sizes, because it does not allow them to keep any of the
salary savings that such a move would generate. For this reason—and also because of the
shrinkage of the school-age cohort—schools in rural areas and small towns tend to be at (or
below) the minimum permissible class size. The situation for areas that have growing popula-
tions is the reverse. There, classes tend to be the maximum size permissible and to operate
on multiple shifts because limited classroom capacity and the lack of investment budget re-
sources to build new schools do not allow the luxury of smaller class sizes.
chaw_217-262_ch06.qxd 6/1/07 10:42 AM Page 230

Aging and Education 231
extrabudgetary sources of financing often created perverse incentives
such as those already mentioned regarding teacher behavior as well as
the incentive for production activities in vocational schools and ser-
vice provision in general secondary schools (such as offering com-
puter classes to the community) to displace educational activities.
Although it is difficult to document, corruption in the form of solic-
itation of informal payments for better examination scores and for
admission to university programs also became (and remains) a seri-
ous concern in most transition countries. Legal ceilings on parental
contributions to teachers have generally not been effective in reduc-
ing the scale of the problem, but the adoption of high-quality and
high-security external examinations as the sole basis of university
admission in Georgia, the Kyrgyz Republic, and Turkey has proven to
be an effective tool for reducing the incidence of corruption in higher
education.
Impacts of Transition on Education: Changing Quality
Transition has affected the quality of education in two important
respects. First, the shrinkage of resources for education and the
decentralization of finance and management of education have
reduced the resources available to households and schools to support
the education process and have contributed to a deterioration of the
classroom teaching and learning environment in some schools, with
adverse learning outcomes. Another factor that may have contributed
to this outcome was the erosion of teacher salaries, which led to
demotivation and the need for many teachers to work at other jobs in
order to support their families. Second, the change in skill require-
ments has meant that even if the content of education programs had
been relevant to skill needs in the economy at the start of the transi-
tion, it was less so under the transformed skill requirements of the
market economy. One indication of this mismatch was the sharp
decline in secondary vocational enrollments that occurred during the
first decade of the transition. In Albania, for example, the secondary
school–age group enrolled in secondary vocational programs declined
from 55 percent to just 6 percent. Other countries also experienced
declines: in Kazakhstan, from 44 percent to 20 percent; in Latvia,
from 48 percent to 27 percent; in Romania, from 78 percent to 44 per-
cent; in Russia, from 53 percent to 40 percent; and in Ukraine, from
40 percent to 28 percent (UNICEF 2004).
External assessments of student achievement are the preferred
instrument for assessing the effects of transition-related changes in
learning conditions on actual learning outcomes. The most direct evi-
dence of changes in learning achievement over time in the transition
chaw_217-262_ch06.qxd 6/1/07 10:42 AM Page 231
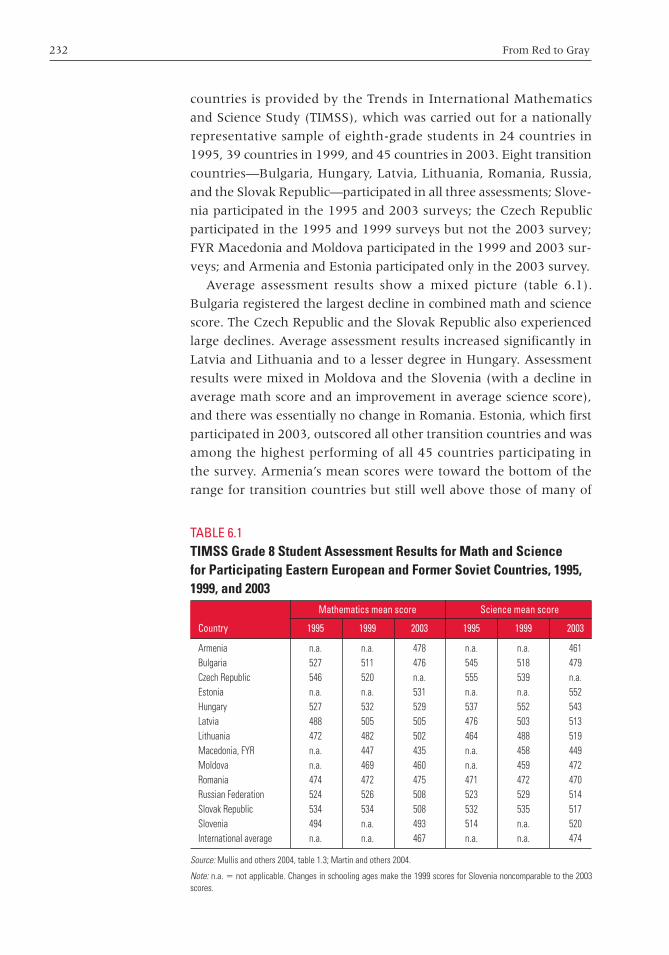
232 From Red to Gray
countries is provided by the Trends in International Mathematics
and Science Study (TIMSS), which was carried out for a nationally
representative sample of eighth-grade students in 24 countries in
1995, 39 countries in 1999, and 45 countries in 2003. Eight transition
countries—Bulgaria, Hungary, Latvia, Lithuania, Romania, Russia,
and the Slovak Republic—participated in all three assessments; Slove-
nia participated in the 1995 and 2003 surveys; the Czech Republic
participated in the 1995 and 1999 surveys but not the 2003 survey;
FYR Macedonia and Moldova participated in the 1999 and 2003 sur-
veys; and Armenia and Estonia participated only in the 2003 survey.
Average assessment results show a mixed picture (table 6.1).
Bulgaria registered the largest decline in combined math and science
score. The Czech Republic and the Slovak Republic also experienced
large declines. Average assessment results increased significantly in
Latvia and Lithuania and to a lesser degree in Hungary. Assessment
results were mixed in Moldova and the Slovenia (with a decline in
average math score and an improvement in average science score),
and there was essentially no change in Romania. Estonia, which first
participated in 2003, outscored all other transition countries and was
among the highest performing of all 45 countries participating in
the survey. Armenia’s mean scores were toward the bottom of the
range for transition countries but still well above those of many of
TABLE 6.1TIMSS Grade 8 Student Assessment Results for Math and Sciencefor Participating Eastern European and Former Soviet Countries, 1995,1999, and 2003
Mathematics mean score Science mean score
Country 1995 1999 2003 1995 1999 2003
Armenia n.a. n.a. 478 n.a. n.a. 461Bulgaria 527 511 476 545 518 479Czech Republic 546 520 n.a. 555 539 n.a.Estonia n.a. n.a. 531 n.a. n.a. 552Hungary 527 532 529 537 552 543Latvia 488 505 505 476 503 513Lithuania 472 482 502 464 488 519Macedonia, FYR n.a. 447 435 n.a. 458 449Moldova n.a. 469 460 n.a. 459 472Romania 474 472 475 471 472 470Russian Federation 524 526 508 523 529 514Slovak Republic 534 534 508 532 535 517Slovenia 494 n.a. 493 514 n.a. 520International average n.a. n.a. 467 n.a. n.a. 474
Source: Mullis and others 2004, table 1.3; Martin and others 2004.
Note: n.a. 5 not applicable. Changes in schooling ages make the 1999 scores for Slovenia noncomparable to the 2003scores.
chaw_217-262_ch06.qxd 6/1/07 10:42 AM Page 232
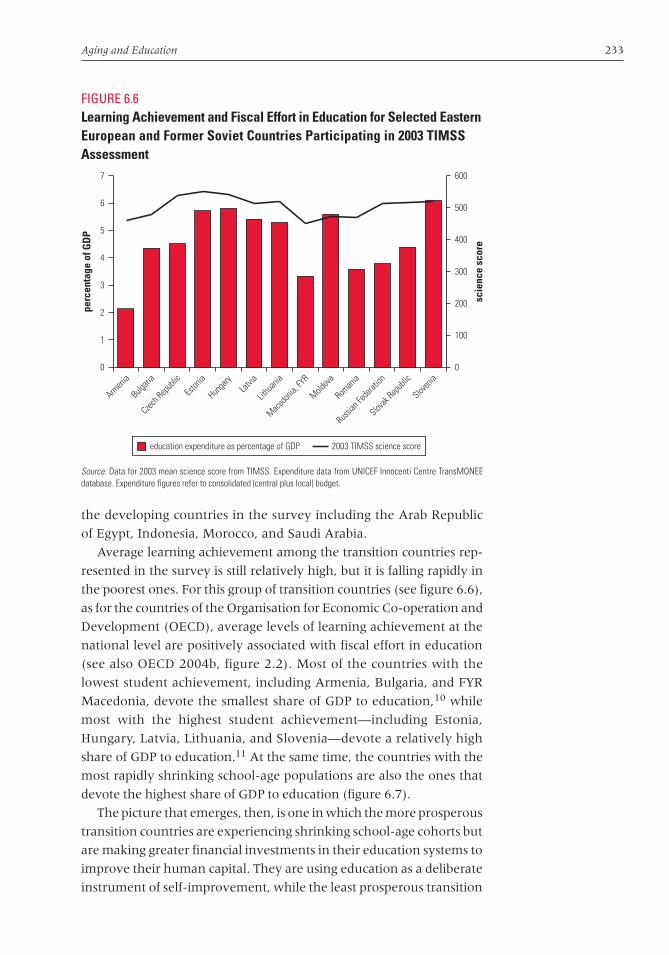
Aging and Education 233
the developing countries in the survey including the Arab Republic
of Egypt, Indonesia, Morocco, and Saudi Arabia.
Average learning achievement among the transition countries rep-
resented in the survey is still relatively high, but it is falling rapidly in
the poorest ones. For this group of transition countries (see figure 6.6),
as for the countries of the Organisation for Economic Co-operation and
Development (OECD), average levels of learning achievement at the
national level are positively associated with fiscal effort in education
(see also OECD 2004b, figure 2.2). Most of the countries with the
lowest student achievement, including Armenia, Bulgaria, and FYR
Macedonia, devote the smallest share of GDP to education,10 while
most with the highest student achievement—including Estonia,
Hungary, Latvia, Lithuania, and Slovenia—devote a relatively high
share of GDP to education.11 At the same time, the countries with the
most rapidly shrinking school-age populations are also the ones that
devote the highest share of GDP to education (figure 6.7).
The picture that emerges, then, is one in which the more prosperous
transition countries are experiencing shrinking school-age cohorts but
are making greater financial investments in their education systems to
improve their human capital. They are using education as a deliberate
instrument of self-improvement, while the least prosperous transition
FIGURE 6.6Learning Achievement and Fiscal Effort in Education for Selected EasternEuropean and Former Soviet Countries Participating in 2003 TIMSSAssessment
Source: Data for 2003 mean science score from TIMSS. Expenditure data from UNICEF Innocenti Centre TransMONEEdatabase. Expenditure figures refer to consolidated (central plus local) budget.
0
Armen
ia
Bulgari
a
Czech Rep
ublic
Eston
ia
Hunga
ryLat
via
Lithu
ania
Macedo
nia, FY
R
Moldova
Roman
ia
Russian
Federa
tion
Slovak
Repub
lic
Sloven
ia
2
1
7 600
6
5
500
400
300
200
100
0
4
3
perc
enta
geof
GD
P
scie
nce
scor
e
education expenditure as percentage of GDP 2003 TIMSS science score
chaw_217-262_ch06.qxd 6/1/07 10:42 AM Page 233
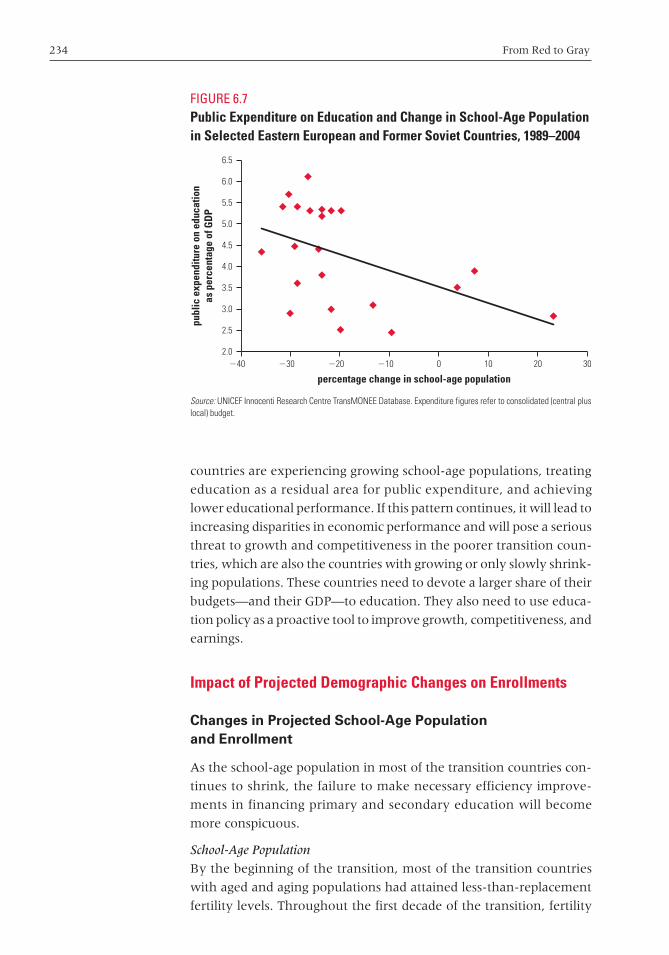
234 From Red to Gray
countries are experiencing growing school-age populations, treating
education as a residual area for public expenditure, and achieving
lower educational performance. If this pattern continues, it will lead to
increasing disparities in economic performance and will pose a serious
threat to growth and competitiveness in the poorer transition coun-
tries, which are also the countries with growing or only slowly shrink-
ing populations. These countries need to devote a larger share of their
budgets—and their GDP—to education. They also need to use educa-
tion policy as a proactive tool to improve growth, competitiveness, and
earnings.
Impact of Projected Demographic Changes on Enrollments
Changes in Projected School-Age Population and Enrollment
As the school-age population in most of the transition countries con-
tinues to shrink, the failure to make necessary efficiency improve-
ments in financing primary and secondary education will become
more conspicuous.
School-Age Population
By the beginning of the transition, most of the transition countries
with aged and aging populations had attained less-than-replacement
fertility levels. Throughout the first decade of the transition, fertility
FIGURE 6.7Public Expenditure on Education and Change in School-Age Populationin Selected Eastern European and Former Soviet Countries, 1989–2004
Source: UNICEF Innocenti Research Centre TransMONEE Database. Expenditure figures refer to consolidated (central pluslocal) budget.
2.0
2.5
3020100210220230240
3.0
3.5
6.5
6.0
5.0
5.5
4.0
4.5
percentage change in school-age population
publ
icex
pend
iture
oned
ucat
ion
aspe
rcen
tage
ofG
DP
chaw_217-262_ch06.qxd 6/1/07 10:42 AM Page 234
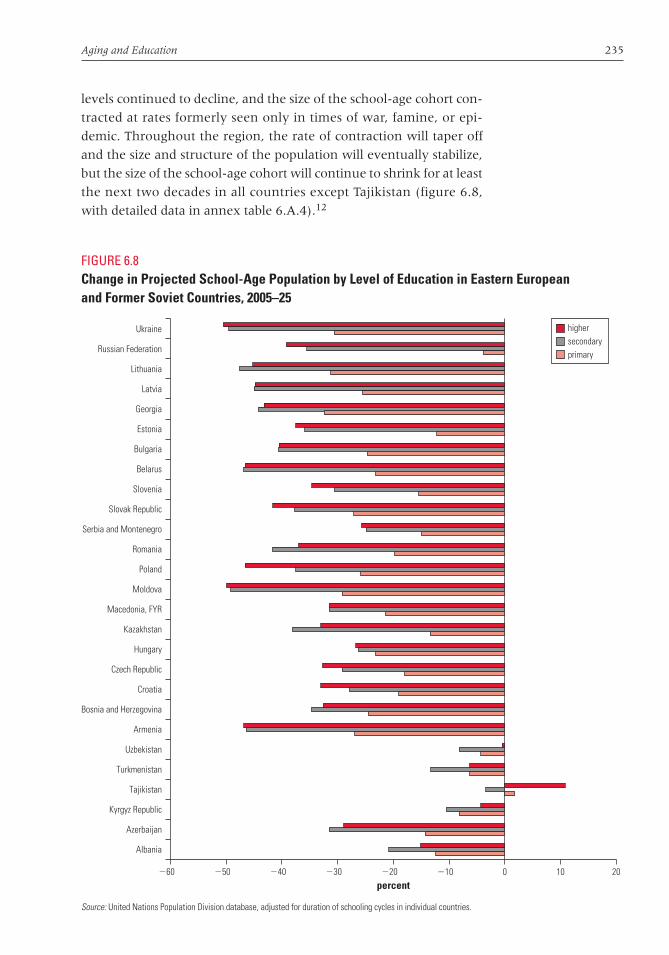
Aging and Education 235
levels continued to decline, and the size of the school-age cohort con-
tracted at rates formerly seen only in times of war, famine, or epi-
demic. Throughout the region, the rate of contraction will taper off
and the size and structure of the population will eventually stabilize,
but the size of the school-age cohort will continue to shrink for at least
the next two decades in all countries except Tajikistan (figure 6.8,
with detailed data in annex table 6.A.4).12
FIGURE 6.8Change in Projected School-Age Population by Level of Education in Eastern Europeanand Former Soviet Countries, 2005–25
Source: United Nations Population Division database, adjusted for duration of schooling cycles in individual countries.
220230240250260 210 100 20
Albania
percent
Ukraine highersecondaryprimary
Azerbaijan
Kyrgyz Republic
Tajikistan
Turkmenistan
Uzbekistan
Armenia
Bosnia and Herzegovina
Croatia
Czech Republic
Hungary
Kazakhstan
Macedonia, FYR
Moldova
Poland
Romania
Serbia and Montenegro
Slovak Republic
Slovenia
Belarus
Bulgaria
Estonia
Georgia
Latvia
Lithuania
Russian Federation
chaw_217-262_ch06.qxd 6/1/07 10:42 AM Page 235
236 From Red to Gray
In most countries, the decline in school-age populations will be con-
siderably larger than the substantial decline in the population age 0 to
17 that occurred between 1998 and 2004. The declines will be espe-
cially large, as would be expected, for countries that have old and aging
populations. Even the countries with young populations are expected
to see significantly smaller school-age cohorts. The single exception is
Tajikistan, which is expected to experience a slight overall increase in
primary school–age and university-age populations between 2005 and
2025. In general, the declines are very large—in some cases up to
50 percent from 2005 to 2025—reflecting the unprecedented pace of
fertility decline in the region. The magnitude of the decline implies
that there are major opportunities for savings, which could be used to
improve the quality, relevance, and coverage of education. But
harvesting those gains will require fundamental policy changes.
For most countries, the shrinkage of school-age populations will
occur progressively over the coming two decades, but some will see siz-
able oscillations in cohort sizes as demographic changes work their way
through the population pyramid. These oscillations will occur in all the
countries that currently have young populations but also in Belarus,
Bulgaria, the Czech Republic, Estonia, FYR Macedonia, and Russia.
Enrollment Projections
Coverage rates in education (annex table 6.A.5) leave significant
room for improvement. The large declines in primary school coverage
in Armenia, Bosnia and Herzegovina, and Turkmenistan during the
transition have resulted in current gross enrollment rates in primary
education that are well below 90 percent. Russia experienced a
smaller decline but its starting point was also low, leaving its current
coverage rate also below 90 percent. The larger declines in coverage
that occurred at the secondary level have left current rates below
50 percent in eight transition countries: Armenia, Azerbaijan, Bosnia
and Herzegovina, Georgia, the Kyrgyz Republic, Moldova, Tajikistan,
and Turkmenistan. Secondary coverage is below 80 percent in all
countries except Bulgaria, Croatia, the Czech Republic, Hungary,
Poland, the Slovak Republic, and Slovenia. Despite sizable increases
in higher-education coverage rates everywhere except Turkmenistan
and Uzbekistan, coverage remains low—particularly in the poorest
of the transition countries (which are also the countries with the
youngest populations).
To assess the enrollment implications of these cohort-size changes,
we projected enrollments to 2025, assuming that current enrollment
rates converge to full coverage in primary and secondary education
by the end of the period and to the current OECD mean enrollment
chaw_217-262_ch06.qxd 6/1/07 10:42 AM Page 236

Aging and Education 237
rate for higher education (55 percent) by 2025.13 This assumption is
consistent with recent trends. The results of this exercise are summa-
rized in figure 6.9 and annex table 6.A.6. Although school-age
cohorts in most transition countries are shrinking, continued improve-
ments in enrollment rates will lead to very high rates of growth in sec-
ondary and higher education enrollments in the countries with young
FIGURE 6.9Change in Projected Enrollments by Level of Education in Eastern European and Former SovietCountries, 2005–25
Source: World Bank projection model, based on assumptions described in text and population projections from the United Nations Population Division database,adjusted for duration of schooling cycles in individual countries. Enrollment increases exceeding 100 percent are truncated in this figure for presentation purposes.
220240260 806040200 100
Albania
percent
Ukrainehighersecondaryprimary
Azerbaijan
Kyrgyz Republic
Tajikistan
Turkmenistan
Uzbekistan
Armenia
Bosnia and Herzegovina
Croatia
Czech Republic
Hungary
Kazakhstan
Macedonia, FYR
Moldova
Poland
Romania
Serbia and Montenegro
Slovak Republic
Slovenia
Belarus
Bulgaria
Estonia
Georgia
Latvia
Lithuania
Russian Federation
chaw_217-262_ch06.qxd 6/1/07 10:42 AM Page 237
238 From Red to Gray
populations, as well as in Bosnia and Herzegovina, Serbia and
Montenegro, and (for higher education) FYR Macedonia. Georgia
and Lithuania are projected to have modest rates of growth in sec-
ondary enrollments over the period. All other countries are expected
to experience shrinking enrollments, even in higher education,
where shrinking cohort size is likely to more than offset improved
coverage rates.
Implications of Projections
These changes have three major implications: (a) flexibility is needed
in allocating resources, (b) this flexibility must be motivated through
finance and management reform, and (c) demand constraints must
be addressed.
Allocating Resources with Flexibility
The capacity of education programs—especially in terms of infra-
structure and staff—will need to respond to the sizable changes in
enrollments that will occur over the next two decades. Most coun-
tries will need to progressively shed teachers and consolidate school
infrastructure. Others, however, will need the flexibility to alternately
expand and contract programs in order to respond to oscillations in
enrollments at particular levels of education.
Uzbekistan provides a good illustration. Total population is pro-
jected to increase progressively over the next two decades.14 But the
recent fertility decline has pinched the base of the education pyramid
in such a way that the size of specific school-age cohorts will fluctu-
ate sharply for at least the next two decades. As shown in figure 6.10,
the size of the secondary-school-age population grew rapidly starting
in 2000. The government has responded to this increase with a major
investment program to expand capacity and upgrade quality in sec-
ondary education. But just as this program is completed (in 2009),
the size of the secondary cohort will start a sharp decline. New needs
will arise in primary education, where cohort sizes will increase
sharply after a decade of decline. These coming demographic fluctua-
tions are not speculative; for the most part, they are the inevitable
consequence of the aging of the existing population. The fluctuations
in the size of school-age cohorts will have a major bearing on the
need for school facilities, teachers, textbooks, and other educational
inputs at each stage of education.
Motivating Flexibility through Finance and Management Reforms
The second implication of the projected enrollment trends is that
reforms in education finance and management need to move ahead
chaw_217-262_ch06.qxd 6/1/07 10:42 AM Page 238
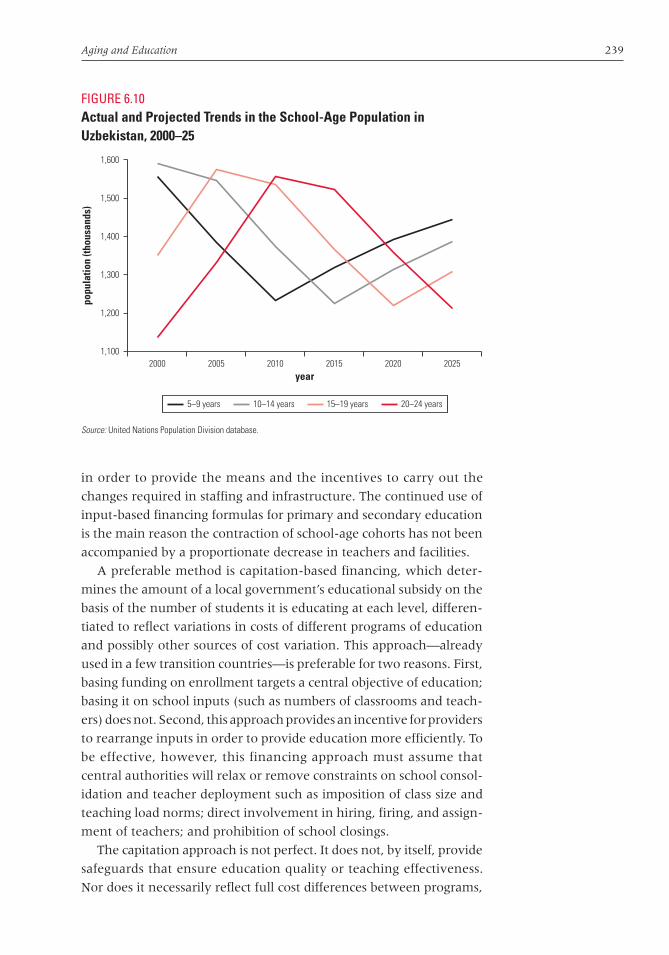
Aging and Education 239
in order to provide the means and the incentives to carry out the
changes required in staffing and infrastructure. The continued use of
input-based financing formulas for primary and secondary education
is the main reason the contraction of school-age cohorts has not been
accompanied by a proportionate decrease in teachers and facilities.
A preferable method is capitation-based financing, which deter-
mines the amount of a local government’s educational subsidy on the
basis of the number of students it is educating at each level, differen-
tiated to reflect variations in costs of different programs of education
and possibly other sources of cost variation. This approach—already
used in a few transition countries—is preferable for two reasons. First,
basing funding on enrollment targets a central objective of education;
basing it on school inputs (such as numbers of classrooms and teach-
ers) does not. Second, this approach provides an incentive for providers
to rearrange inputs in order to provide education more efficiently. To
be effective, however, this financing approach must assume that
central authorities will relax or remove constraints on school consol-
idation and teacher deployment such as imposition of class size and
teaching load norms; direct involvement in hiring, firing, and assign-
ment of teachers; and prohibition of school closings.
The capitation approach is not perfect. It does not, by itself, provide
safeguards that ensure education quality or teaching effectiveness.
Nor does it necessarily reflect full cost differences between programs,
FIGURE 6.10Actual and Projected Trends in the School-Age Population inUzbekistan, 2000–25
Source: United Nations Population Division database.
1,1002000 2005 2010 2015 2020 2025
1,200
1,400
1,600
1,300
1,500
year
popu
latio
n(th
ousa
nds)
5–9 years 10–14 years 15–19 years 20–24 years
chaw_217-262_ch06.qxd 6/1/07 10:42 AM Page 239
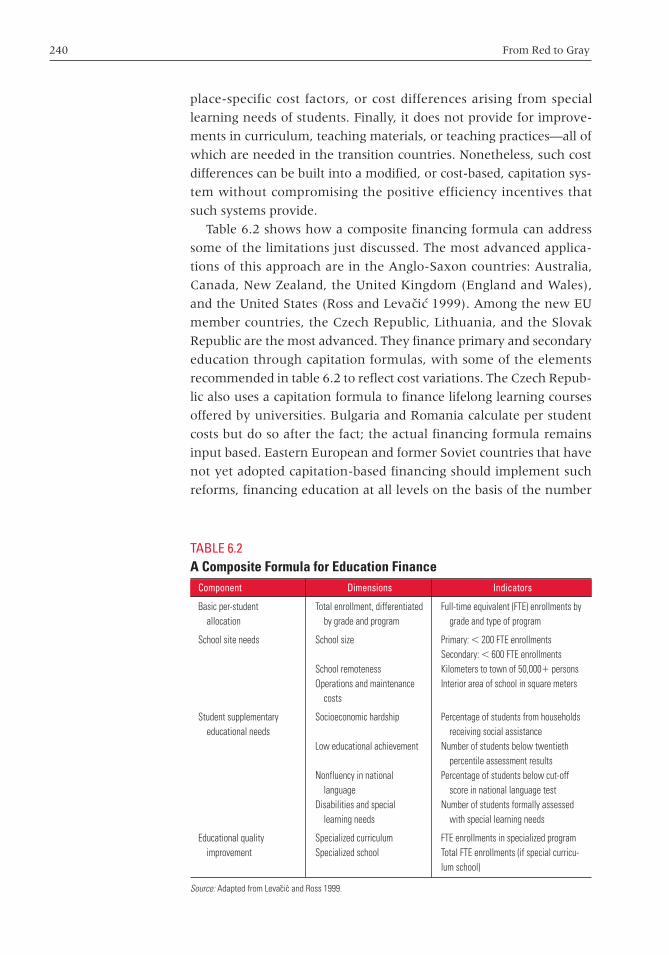
240 From Red to Gray
place-specific cost factors, or cost differences arising from special
learning needs of students. Finally, it does not provide for improve-
ments in curriculum, teaching materials, or teaching practices—all of
which are needed in the transition countries. Nonetheless, such cost
differences can be built into a modified, or cost-based, capitation sys-
tem without compromising the positive efficiency incentives that
such systems provide.
Table 6.2 shows how a composite financing formula can address
some of the limitations just discussed. The most advanced applica-
tions of this approach are in the Anglo-Saxon countries: Australia,
Canada, New Zealand, the United Kingdom (England and Wales),
and the United States (Ross and Levacic 1999). Among the new EU
member countries, the Czech Republic, Lithuania, and the Slovak
Republic are the most advanced. They finance primary and secondary
education through capitation formulas, with some of the elements
recommended in table 6.2 to reflect cost variations. The Czech Repub-
lic also uses a capitation formula to finance lifelong learning courses
offered by universities. Bulgaria and Romania calculate per student
costs but do so after the fact; the actual financing formula remains
input based. Eastern European and former Soviet countries that have
not yet adopted capitation-based financing should implement such
reforms, financing education at all levels on the basis of the number
Basic per-student allocation
School site needs
Student supplementary educational needs
Educational quality improvement
Total enrollment, differentiated by grade and program
School size
School remotenessOperations and maintenance
costs
Socioeconomic hardship
Low educational achievement
Nonfluency in national language
Disabilities and special learning needs
Specialized curriculumSpecialized school
Full-time equivalent (FTE) enrollments by grade and type of program
Primary: , 200 FTE enrollmentsSecondary: , 600 FTE enrollmentsKilometers to town of 50,0001 personsInterior area of school in square meters
Percentage of students from households receiving social assistance
Number of students below twentieth percentile assessment results
Percentage of students below cut-off score in national language test
Number of students formally assessed with special learning needs
FTE enrollments in specialized programTotal FTE enrollments (if special curricu-lum school)
Source: Adapted from Levacic and Ross 1999.
TABLE 6.2A Composite Formula for Education Finance
Component Dimensions Indicators
chaw_217-262_ch06.qxd 6/1/07 10:42 AM Page 240

Aging and Education 241
of students rather than inputs and differentiating allocations to reflect
intrinsic differences in the cost of education delivery, such as the
higher cost of technical specializations and the greater population dis-
persion in rural areas.
The details of how the formula reflects cost differences do matter.
If financing formulas simply mirror the current unit costs of different
localities, the resulting schedule of coefficients will legitimate an inef-
ficient delivery model. The same considerations apply to differentia-
tion of costs for different programs of studies. In the Slovak Republic,
for example, per student recurrent costs are 100 percent higher for
upper secondary vocational education and sports education schools
than for gymnasia. Per student costs in professional art schools are
almost four times as high as in gymnasia (Canning 2001). These unit
costs differ largely as a function of class size and teaching loads, but
they are not differentials that should necessarily be encouraged to
continue. Secondary art schools in the Slovak Republic typify the
problem of unsustainably high costs that result from classes that are
too small. The recurrent-cost financing formula for upper secondary
and higher education should encourage institutions to rationalize
course offerings. Doing so could take the form of moving toward
more affordable class sizes or reconfiguring course offerings—for
example, by providing art education as one of several options in com-
prehensive secondary schools rather than in freestanding art schools.15
A still more advanced approach is to finance educational results
rather than enrollments. Some of the charter school contracts in the
United States, for example, condition payments to private education
providers on the achievement of agreed targets in terms of learning
achievement. Similarly, some state accountability systems reward
schools for large gains in student achievement. The Czech model for
subsidizing private education embodies the same approach. It
finances a higher proportion of recurrent costs for schools that meet
higher quality standards. This approach is likely to grow in use as the
tools for assessing school performance improve.
Addressing Demand Constraints
The third implication of the enrollment projections is that strategies to
achieve full coverage of primary and secondary education need
to address the demand-side constraints that are largely responsible
for incomplete enrollment coverage. Surveys on the factors affect-
ing school attendance point to income-related constraints as the
main obstacle. At the compulsory schooling level, they include the
inability of families to afford the cost of textbooks and other school-
related necessities and the lack of resources at schools for heating.
chaw_217-262_ch06.qxd 6/1/07 10:42 AM Page 241

242 From Red to Gray
Nonattendance in upper secondary education is more often related to
the perception on the part of students and parents that education is of
low quality and will not lead to better employment prospects or higher
earnings. Improved quality and relevance of education programs
should help induce higher attendance. But raising enrollment rates
among the groups at greatest risk is likely to require additional efforts,
including targeted initiatives, such as counseling and tutoring for stu-
dents who have learning difficulties, and economic initiatives, such as
targeted subsidies for poor students to defray the cost of school trans-
portation and purchase or rental of textbooks and school supplies.
Improved Productivity through Better Education Systems
One of the themes of this chapter is that improvements in productiv-
ity are essential if the Eastern European and former Soviet countries
are to counteract the potential negative consequences of aging for
economic growth. Human capital growth and technological change
are the main sources of productivity increases.16 Education—including
vocational training and lifelong learning—plays a key role in both. At
the individual level, higher educational attainment is consistently
associated with higher lifetime earnings. At the country level, the
relationship between average educational attainment and economic
growth is more elusive. But learning achievement, which captures
both duration and quality dimensions of education, has been found
to be consistently related to economic growth performance in the
OECD countries (Coulombe, Tremblay, and Marchand 2004). A key
lesson for the transition countries is not only that educational attain-
ment must increase to the levels of the high-performing OECD coun-
tries but also that education must be of high quality and relevant to
the actual skill needs in the labor market. This message is particularly
relevant for the transition countries for two reasons: (a) because the
transition itself led to a serious disconnect between the skills provided
by education systems and the needs of the market economy and
(b) because these education systems have only begun to respond to
the new skill needs.
Education plays a key role in supporting the process of develop-
ment from low-income, resourced-based economies to high-income,
knowledge-based economies. A recent study of global competitive-
ness (Schwab, Porter, and Sachs 2001) identified three successive
stages of economic development—factor-driven growth, investment-
driven growth, and innovation-driven growth—and characterized
the role of education in each of those stages as shown in table 6.3.
chaw_217-262_ch06.qxd 6/1/07 10:42 AM Page 242

Aging and Education 243
For Eastern European and former Soviet countries to move
through the stages described in table 6.3 implies substantive improve-
ments in their education systems. In one sense, these countries face a
challenge in using education as a strategic intervention to promote
growth and productivity because of the unfinished reform agenda.
But incomplete reform could also provide an advantage for the tran-
sition countries insofar as redundancy of the teaching staff and facili-
ties permits expanded coverage without expanded capacity and
insofar as the introduction of performance incentives encourages
more effective teaching without necessarily increasing resources.
As they complete the reforms in management and financing of
their education systems during the next decade, the transition coun-
tries will need to give greater attention to substantive reforms that are
needed to make their education systems more responsive to the needs
of the global economy. These substantive reforms must expand cover-
age, improve relevance and quality, and achieve greater inclusiveness.
Expanding Education Coverage
Together with supportive macroeconomic and financial policy and
infrastructure investments, education plays a key role in developing
the human capital needed at each of these successive stages of devel-
opment. The main challenge for education coverage in the transition
TABLE 6.3The Role of Education in the Stages of Economic Development
Development stage
Factor-driven growth
Investment-driven growth
Innovation-driven growth
Key economic challenges
Get factor markets working properly to mobilize land, labor, and capital
Attract foreign direct investment and imported technology toexploit land, labor, and capitaland begin to link the nationaleconomy with the globaleconomy
Generate high rate of innovation, adaptation, and commercializa-tion of new technologies
Focus of economic production
Natural resource extraction, assembly, and labor-intensive manufacturing;dominant primary sector
Manufacturing and outsourced service exports; dominantsecondary sector
Innovative products and services at the global technology frontier;dominant tertiary sector
Education and labor-marketrequirements
Basic education, low-level skills, disciplined work habits
Universal secondary education,improved secondary vocational andtechnical education, lifelong learn-ing to retool and update skills, andflexible labor markets (easy entry,easy exit)
Highly developed higher education, especially in science and engineer-ing specializations; high rates ofsocial learning, especially science-based learning; dynamic researchand development sector linkinghigher education programs andinnovating firms
Source: Adapted from Schwab, Porter, and Sachs 2001.
chaw_217-262_ch06.qxd 6/1/07 10:42 AM Page 243

244 From Red to Gray
countries is to increase enrollment rates in secondary and higher
education, which remain well below OECD levels. As described ear-
lier, shrinking school-age cohorts will facilitate the task of improving
coverage for many countries because the availability of redundant
staff members and facilities will preclude the need for necessarily
increasing resources.
Improving Relevance and Quality of Education
Challenges are more complex in terms of education content and
structure. The Programme for International Student Assessment
(PISA), carried out by the OECD for 15-year-old students in OECD
countries and in a small number of other countries, indicates that
education systems are not effective in producing students with the
kinds of skills increasingly needed in modern economies.17 Whereas
the TIMSS assessment tests students’ mastery of the formal curricu-
lum, the PISA test instrument specifically aims to assess students’
mastery of higher-order skills such as synthesizing knowledge across
disciplinary boundaries, integrating uncertainty into analysis, moni-
toring their own learning progress, and knowing where to access rel-
evant information. Because these are precisely the skills that are
needed for most of the fastest-growing jobs in the global economy,
the PISA results provide a better indication of how well education
systems are doing in providing relevant skills for the future.18
The transition countries that participated in the PISA assessment in
2000 and 2003 generally performed poorly relative to other OECD
countries (annex table 6.A.7)—a far less impressive performance
than on the TIMSS assessment. In Russia, performance fell in both
absolute and relative terms. In other countries, performance improved
in absolute terms, if not in relative terms. This was the case for Latvia
and Poland, for example: mean scores in mathematics and reading
improved sharply, but Poland’s ranking improved only slightly and
Latvia’s actually declined because of the gains registered by other
countries. Hungary’s mean scores improved slightly in both math and
reading but slipped in both areas in the country rankings. The Czech
Republic recorded an anomalous performance, with a marked
improvement in math between 2000 and 2003 but deterioration in
reading. In general, the performance of the transition countries in the
PISA was weaker in reading than in mathematics. The two conspicu-
ous exceptions were Latvia and Poland, where major improvements
in 2003 brought the mean reading scores and country rankings well
above the mean math scores.
chaw_217-262_ch06.qxd 6/1/07 10:42 AM Page 244

Aging and Education 245
These findings from the PISA assessment indicate that the educa-
tion systems of most Eastern European and former Soviet countries
have a long way to go before they provide the skills that are most
needed for improved economic performance, especially if they are to
catch up to countries near the top of the scale. Raising learning
achievement as measured in the PISA assessment to the average lev-
els of the OECD would require a deliberate and sustained effort.
Matching the performance of the high-growth Asian countries would
require an even greater effort.
Moreover, these findings relate to the performance of students at
the compulsory education level, where the transition countries have
achieved essentially the same coverage levels as the other OECD
countries. The need for improvement at the upper secondary and
higher education levels is likely to be even greater—both because
coverage levels are much lower than in the other OECD countries
and because quality and relevance are likely to be lower as well. The
imperative of expanding coverage of secondary and higher education
has already been described. The only international study that sheds
further light on the needs for improved quality and relevance in
upper secondary and higher education in the transition countries is
the International Adult Literacy Survey carried out by the OECD and
Statistics Canada in the mid-1990s (OECD and Statistics Canada
1997). Covering 11 OECD countries, including Poland, this study
examined adults’ understanding of a range of concepts and their abil-
ity to apply those concepts effectively. It found that 75 percent of the
Polish population age 16 to 65 performed below the level judged nec-
essary by labor market experts and employers to function effectively
in an information-rich workplace—far below the level recorded for
the other OECD countries. The same study found much lower levels
of unemployment and higher levels of earnings among workers with
higher functional literacy proficiency in all the countries surveyed.
Follow-up work supported by Statistics Canada documented the
deterioration of functional literacy skills over time unless those skills
are maintained through subsequent training or work experience in
an information-rich work environment (Coulombe, Tremblay, and
Marchand 2004). An implication of those findings is that the educa-
tion system of Poland at all levels—and presumably the systems of
the other transition countries as well—does not convey effectively to
students the ability to apply concepts. It also suggests that whatever
practical skills the education system manages to impart deteriorate
more rapidly than they would in a more information-rich working
environment and an environment that offers more opportunities for
lifelong learning.
chaw_217-262_ch06.qxd 6/1/07 10:42 AM Page 245

246 From Red to Gray
Enabling Lifelong Learning
Lifelong learning is extremely limited in the transition countries
even though economic liberalization strengthened the incentives
for employers to provide training, while growing dispersion of
productivity-related earnings strengthens the incentive for individ-
uals to seek training. But legal proscriptions and onerous certification
requirements, as well as the absence of positive inducements such as
tax benefits for employer-provided training, inhibit the development
of lifelong learning programs by private providers. By contrast, some
EU member states have well-established policies and institutions to
encourage employers to provide training for their employees and
fairly high rates of adult participation in training and education (fig-
ure 6.11). A general conclusion is that the most effective strategy for
promoting the development of lifelong learning may consist of a two-
pronged approach involving the removal of legal and other impedi-
ments to training and the promotion of policies to strengthen the
competitiveness of the business environment—and, hence, the incen-
tives for individuals to seek training and for firms to provide it.
Improving the Inclusiveness of Education
Although education was accorded a high priority during the commu-
nist period, which was consistent with an egalitarian socialist ideology,
FIGURE 6.11Participation of Adults in Education and Training in Selected EU Countries, 2005
Source: Eurostat database.
0
25
20
15
10
5
30
35
perc
enta
geof
part
icip
atio
n
Austria
country
Belgium
Bulgari
a
Czech Rep
ublic
Denmark
Eston
ia
Finlan
dFra
nce
German
y
Hunga
ry
Irelan
dLat
via
Lithu
ania
Netherl
ands
Norway
Polan
d
Roman
ia
Slovak
Repub
lic
Sloven
ia
Sweden
Switzerla
nd
United
Kingdo
m
chaw_217-262_ch06.qxd 6/1/07 10:42 AM Page 246
Aging and Education 247
education policy retained important elitist aspects. Examples include
the highly restricted access to higher education (not always based
purely on merit) and the practice of streaming the bulk of students
into terminal, occupation-specific courses relatively early in their
studies. In education, as in athletics, the system was judged by the per-
formance of the best, and disproportionate attention was devoted to
developing the best performers. Extraordinary efforts and resources
were devoted to the most gifted students, who were selected to com-
pete in the academic equivalent of the Olympics and groomed for
optimal performance.
Even today, a tendency prevails in the transition countries to judge
the quality of education systems by the performance of the best stu-
dents. This yardstick is not suited to the needs of the global economy.
A comparison of growth rates of different countries indicates that all
segments of the population need high-quality and relevant education
if the economy is to prosper and grow (Hanushek and Kimko 2000).
Educational policies that leave some groups of students behind lead
to social fragmentation, risking cleavages that could undermine the
core principles of the expanded European Union.
Concerns over the possibility that education could lead to greater
social fragmentation are not limited to the transition countries.
Annex table 6.A.8 shows mean mathematical literacy scores from the
PISA 2000 for OECD countries and the differences in mean scores
that are attributable to differences in socioeconomic status, starting
with the highest level of mathematics proficiency. Some education
systems achieve quality and equity together (for example, Finland,
Japan, and the Republic of Korea); others achieve quality at the
expense of equity (for example, Belgium, France, Switzerland, and
the United Kingdom); still others have relatively low, but equitable,
performance (for example, Italy, Mexico, and Poland); and some
achieve neither quality nor equity (for example, Germany, Hungary,
Luxembourg, and the United States). This last situation is a cause for
serious concern and requires immediate corrective action.
One of the implications of the strong quality-equity trade-off in
Germany is that education currently tends to perpetuate and rein-
force socioeconomic differences rather than to mitigate them. In part,
this outcome may reflect the early streaming of students into aca-
demic and vocational programs under Germany’s dual system of
vocational and technical education. This system is already under
threat from the growing unwillingness of German employers to pro-
vide training for apprentices. German policy makers have responded
to this development by exhorting employers to accept more appren-
tices. These findings on the equity outcomes of education suggest,
chaw_217-262_ch06.qxd 6/1/07 10:42 AM Page 247

248 From Red to Gray
however, that this approach may be misguided. Recent international
evidence suggests that early tracking in schools not only generally
leads to wider variation in student outcomes but also does not offer
clear gains in terms of overall levels of achievement (Hanushek and
Wößmann 2005). Indeed, one of the factors behind the marked
improvement in Poland’s mean performance in the PISA 2003 may
be the policy decision it made after the 2000 survey to delay differen-
tiation of students in secondary education programs until after age 15
(OECD 2004a).
Policy Implications
Reform of education systems to meet the needs of the market econ-
omy is in progress in varying degrees throughout the region. Nowhere
is it complete, and in some countries, it has barely begun. Initial policy
efforts during transition focused on coping with collapsing output and
education budgets and with the problems associated with the (politi-
cally motivated) devolution of responsibilities for preschool and basic
education to parents and local governments.
Throughout the region, the transition led to immediate changes in
enrollment patterns. Preschool coverage plunged early as a conse-
quence of budgetary collapse and the devolution of delivery responsi-
bility to local governments. Demand for higher education, which was
rigorously limited in the former system, has maintained steady and
impressive growth in all countries of the region except Uzbekistan.
The main casualties of budget collapse early in the transition entailed
a severe erosion of teachers’ salaries and a general deterioration of
teaching and learning conditions at all levels of education—from
which all the countries in the region are still struggling to recover.
Educational results, especially in science and math, used to be a source
of pride. But learning achievement in those transition countries that
have participated in international assessments is generally falling,
especially in those competency areas that are most crucial to evolving
labor market needs. In the countries that have not participated in
such assessments, the picture is probably worse.
The major dislocation of trading patterns among the countries of
the former Soviet bloc and the restructuring of many of the largest
employers led to a growing disconnect between the skills produced
by education and training systems and the evolving skill needs in
the labor market. This disconnect is reflected in labor market devel-
opments, including rising unemployment for school leavers in many
chaw_217-262_ch06.qxd 6/1/07 10:42 AM Page 248

Aging and Education 249
programs of study and changing patterns of demand for specific
education programs—including declining demand for most secondary
vocational education programs. To the extent that education systems
in the eastern part of the region have accommodated these challenges,
their response has generally been passive, with little if any change in
the structure of programs or the process for allocating students to spe-
cialized areas of study.
Within this context, the demographic transition has led to unprece-
dented swings in school-age cohort sizes. The need to adjust educa-
tion systems to these swings has only added to the already daunting
challenges facing education policy makers in the region. The incom-
pleteness of reforms responding to the economic and political transi-
tion has limited the ability of education systems to respond to the
demographic transition. In general, the education systems that were
further down the path of dealing with the economic and political
transition have made better progress in responding to the demo-
graphic transition. But here, too, reform is incomplete. Lower fertility
levels are reducing the demand for preschool, primary, and secondary
education and twisting the demand for education in favor of higher
education. To the extent that they have already affected education
systems, these changes have added to the problems of (a) redundant
capacity of staff members and facilities at the primary and secondary
levels and (b) shortage of capacity in higher education. Future
changes in age structure will lead to further inefficiency in the use of
budget resources for education, unless there are fundamental changes
in the arrangements for financing and managing education systems.
Table 6.4 brings together some key parameters that illustrate the
education policy challenges for the four groups of aging countries:
European Union countries, Southeastern European countries, middle-
income CIS countries, and low-income CIS countries. How they rank
on these parameters reflects to some extent the education reform
that has already been undertaken. It also reflects the nature and
magnitude of the challenge of completing reforms to respond to the
needs and opportunities of the economic, political, and demographic
transitions.
Table 6.5 summarizes the reform priorities for the four groups of
old countries. The most conspicuous education challenge arising from
the demographic transition is to harvest the efficiency improvements
made possible under the economic and political transition in order to
complete the unfinished program of reform. The overall challenge is
to build the capacity to develop human resources that can efficiently
drive national economic growth in an increasingly competitive global
chaw_217-262_ch06.qxd 6/1/07 10:42 AM Page 249
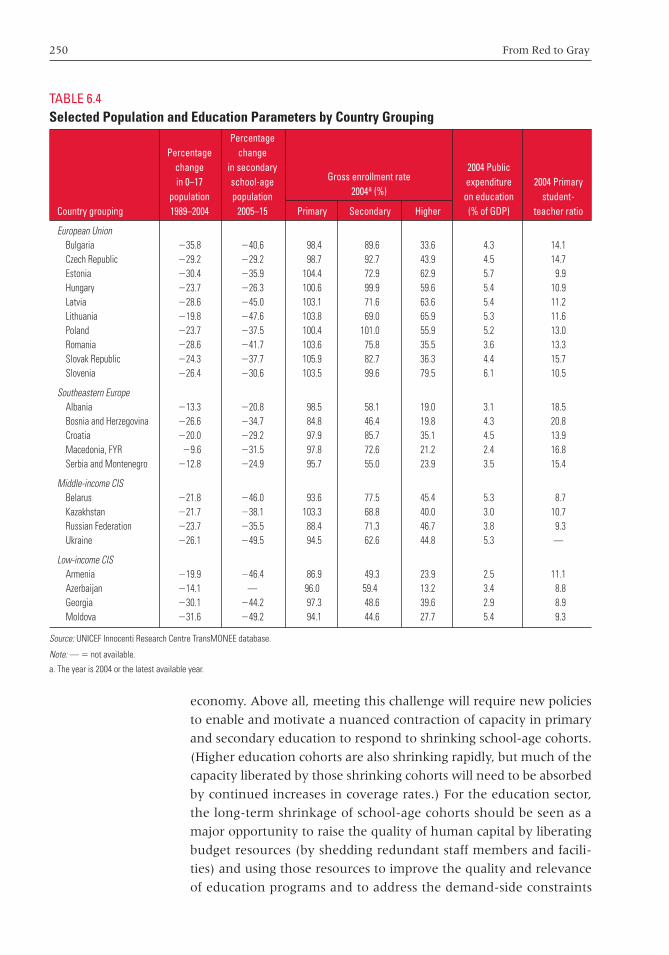
250 From Red to Gray
economy. Above all, meeting this challenge will require new policies
to enable and motivate a nuanced contraction of capacity in primary
and secondary education to respond to shrinking school-age cohorts.
(Higher education cohorts are also shrinking rapidly, but much of the
capacity liberated by those shrinking cohorts will need to be absorbed
by continued increases in coverage rates.) For the education sector,
the long-term shrinkage of school-age cohorts should be seen as a
major opportunity to raise the quality of human capital by liberating
budget resources (by shedding redundant staff members and facili-
ties) and using those resources to improve the quality and relevance
of education programs and to address the demand-side constraints
TABLE 6.4Selected Population and Education Parameters by Country Grouping
PercentagePercentage change
change in secondary 2004 Publicin 0–17 school-age expenditure 2004 Primary
population population on education student-Country grouping 1989–2004 2005–15 Primary Secondary Higher (% of GDP) teacher ratio
European UnionBulgaria 235.8 240.6 98.4 89.6 33.6 4.3 14.1Czech Republic 229.2 229.2 98.7 92.7 43.9 4.5 14.7Estonia 230.4 235.9 104.4 72.9 62.9 5.7 9.9Hungary 223.7 226.3 100.6 99.9 59.6 5.4 10.9Latvia 228.6 245.0 103.1 71.6 63.6 5.4 11.2Lithuania 219.8 247.6 103.8 69.0 65.9 5.3 11.6Poland 223.7 237.5 100.4 101.0 55.9 5.2 13.0Romania 228.6 241.7 103.6 75.8 35.5 3.6 13.3Slovak Republic 224.3 237.7 105.9 82.7 36.3 4.4 15.7Slovenia 226.4 230.6 103.5 99.6 79.5 6.1 10.5
Southeastern EuropeAlbania 213.3 220.8 98.5 58.1 19.0 3.1 18.5Bosnia and Herzegovina 226.6 234.7 84.8 46.4 19.8 4.3 20.8Croatia 220.0 229.2 97.9 85.7 35.1 4.5 13.9Macedonia, FYR 29.6 231.5 97.8 72.6 21.2 2.4 16.8Serbia and Montenegro 212.8 224.9 95.7 55.0 23.9 3.5 15.4
Middle-income CISBelarus 221.8 246.0 93.6 77.5 45.4 5.3 8.7Kazakhstan 221.7 238.1 103.3 68.8 40.0 3.0 10.7Russian Federation 223.7 235.5 88.4 71.3 46.7 3.8 9.3Ukraine 226.1 249.5 94.5 62.6 44.8 5.3 —
Low-income CISArmenia 219.9 246.4 86.9 49.3 23.9 2.5 11.1Azerbaijan 214.1 — 96.0 59.4 13.2 3.4 8.8Georgia 230.1 244.2 97.3 48.6 39.6 2.9 8.9Moldova 231.6 249.2 94.1 44.6 27.7 5.4 9.3
Source: UNICEF Innocenti Research Centre TransMONEE database.
Note: — 5 not available.
a. The year is 2004 or the latest available year.
Gross enrollment rate2004a (%)
chaw_217-262_ch06.qxd 6/1/07 10:42 AM Page 250
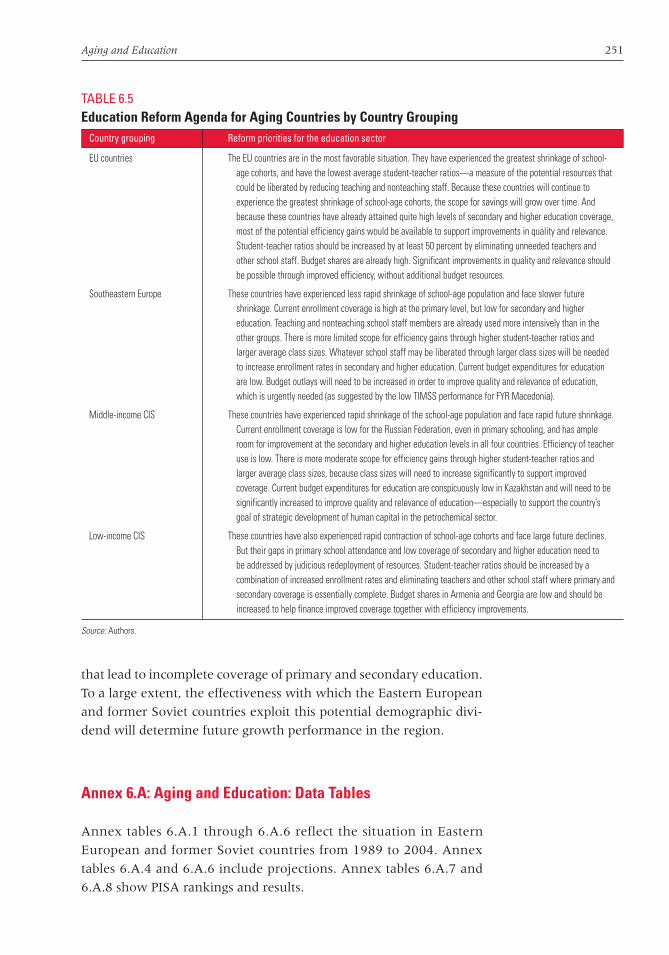
Aging and Education 251
that lead to incomplete coverage of primary and secondary education.
To a large extent, the effectiveness with which the Eastern European
and former Soviet countries exploit this potential demographic divi-
dend will determine future growth performance in the region.
Annex 6.A: Aging and Education: Data Tables
Annex tables 6.A.1 through 6.A.6 reflect the situation in Eastern
European and former Soviet countries from 1989 to 2004. Annex
tables 6.A.4 and 6.A.6 include projections. Annex tables 6.A.7 and
6.A.8 show PISA rankings and results.
TABLE 6.5Education Reform Agenda for Aging Countries by Country Grouping
Country grouping Reform priorities for the education sector
EU countries The EU countries are in the most favorable situation. They have experienced the greatest shrinkage of school-age cohorts, and have the lowest average student-teacher ratios—a measure of the potential resources thatcould be liberated by reducing teaching and nonteaching staff. Because these countries will continue toexperience the greatest shrinkage of school-age cohorts, the scope for savings will grow over time. Andbecause these countries have already attained quite high levels of secondary and higher education coverage,most of the potential efficiency gains would be available to support improvements in quality and relevance.Student-teacher ratios should be increased by at least 50 percent by eliminating unneeded teachers andother school staff. Budget shares are already high. Significant improvements in quality and relevance shouldbe possible through improved efficiency, without additional budget resources.
Southeastern Europe These countries have experienced less rapid shrinkage of school-age population and face slower future shrinkage. Current enrollment coverage is high at the primary level, but low for secondary and highereducation. Teaching and nonteaching school staff members are already used more intensively than in theother groups. There is more limited scope for efficiency gains through higher student-teacher ratios andlarger average class sizes. Whatever school staff may be liberated through larger class sizes will be neededto increase enrollment rates in secondary and higher education. Current budget expenditures for educationare low. Budget outlays will need to be increased in order to improve quality and relevance of education,which is urgently needed (as suggested by the low TIMSS performance for FYR Macedonia).
Middle-income CIS These countries have experienced rapid shrinkage of the school-age population and face rapid future shrinkage. Current enrollment coverage is low for the Russian Federation, even in primary schooling, and has ampleroom for improvement at the secondary and higher education levels in all four countries. Efficiency of teacheruse is low. There is more moderate scope for efficiency gains through higher student-teacher ratios andlarger average class sizes, because class sizes will need to increase significantly to support improvedcoverage. Current budget expenditures for education are conspicuously low in Kazakhstan and will need to besignificantly increased to improve quality and relevance of education—especially to support the country’sgoal of strategic development of human capital in the petrochemical sector.
Low-income CIS These countries have also experienced rapid contraction of school-age cohorts and face large future declines. But their gaps in primary school attendance and low coverage of secondary and higher education need to be addressed by judicious redeployment of resources. Student-teacher ratios should be increased by acombination of increased enrollment rates and eliminating teachers and other school staff where primary andsecondary coverage is essentially complete. Budget shares in Armenia and Georgia are low and should beincreased to help finance improved coverage together with efficiency improvements.
Source: Authors.
chaw_217-262_ch06.qxd 6/1/07 10:42 AM Page 251

252 From Red to Gray
TABLE 6.A.1Change in 0 to 17 Year Population, 1989–2004; Gross Enrollment Rates in 2004; and Change in Gross Enrollment Rates, 1989–2004, Eastern European and Former Soviet Countries
Percent changein population Gross enrollment ratesa (%) Change in gross enrollment rates (%)
0 to 17 years Primary Secondary Higher Primary Secondary Higher
Young populationsKyrgyz Republic 17.2 95.2 45.3 36.2 13.0 219.7 123.0Tajikistan 123.1 95.4 28.8 14.4 11.3 231.3 12.9Turkmenistan 133.3 80.0 28.1 2.5 211.2 238.7 27.7Uzbekistan 116.3 96.8 74.8 8.3 14.7 15.4 26.7
Aging populationsAlbania 213.3 98.5 58.1 19.0 23.7 220.7 117.1Armenia 219.9 86.9 49.3 23.9 28.6 218.2 14.6Azerbaijan 13.7 91.0 45.6 13.2 12.5 217.2 11.3Bosnia and Herzegovina 226.6 84.8 46.4 19.8 28.7 — 111.2Kazakhstan 221.7 103.3 68.8 40.0 19.5 27.3 121.9FYR Macedonia 29.6 97.8 72.6 21.2 24.2 114.2 11.9Moldova 231.6 94.1 44.6 27.7 0.0 222.5 111.5
Aged populationsBelarus 221.8 93.6 77.5 45.4 22.3 21.7 110.9Bulgaria 235.8 98.4 89.6 33.6 0.0 111.4 114.5Croatia 220.0 97.9 85.7 35.1 13.7 17.6 117.7Czech Republic 229.2 98.7 92.7 43.9 11.8 113.5 127.3Estonia 230.4 104.4 72.9 62.9 18.1 18.8 126.8Georgia 230.1 97.3 48.6 39.6 12.3 28.0 120.8Hungary 223.7 100.6 99.9 59.6 12.1 127.2 147.4Latvia 228.6 103.1 71.6 63.6 17.4 11.4 143.0Lithuania 219.8 103.8 69.0 65.9 18.8 24.3 138.3Poland 223.7 100.4 101.0 55.9 20.4 110.8 139.9Romania 228.6 103.6 75.8 35.5 17.8 214.1 128.3Russian Federation 223.7 88.4 71.3 46.7 21.6 26.5 121.9Serbia and Montenegro 212.8 95.7 55.0 23.9 10.6 — 11.7Slovak Republic 224.3 105.9 82.7 36.3 18.9 13.7 122.9Slovenia 226.4 103.5 99.6 79.5 10.1 119.1 156.4Ukraine 226.1 94.5 62.6 44.8 11.7 23.0 122.5
Source: UNICEF Innocenti Research Centre TransMONEE database.
Note: — 5 not available.
a. The rates are for 2004 or the latest available year.
chaw_217-262_ch06.qxd 6/1/07 10:42 AM Page 252
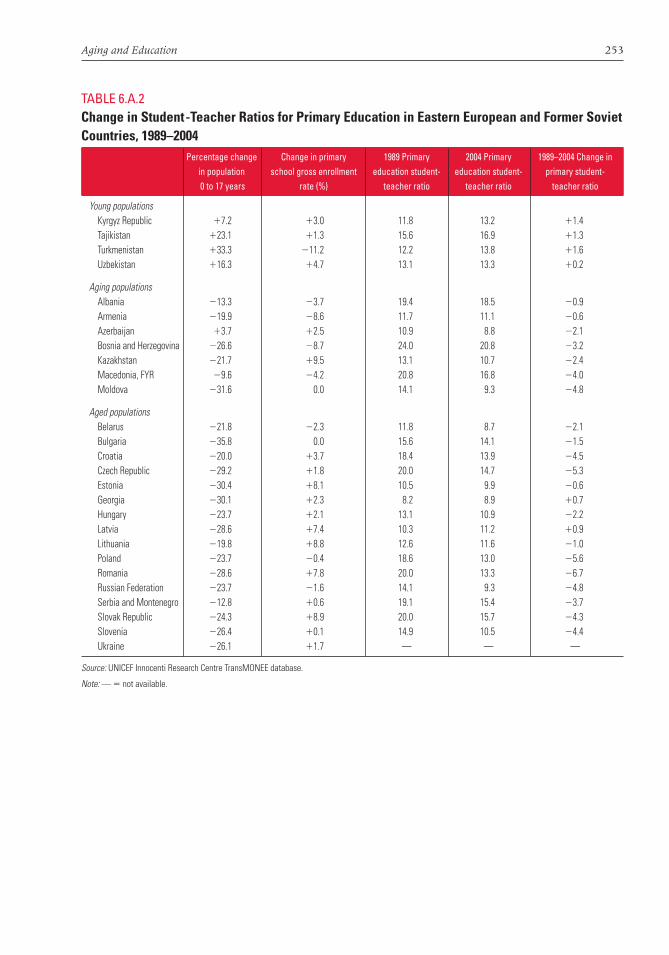
Aging and Education 253
TABLE 6.A.2Change in Student-Teacher Ratios for Primary Education in Eastern European and Former SovietCountries, 1989–2004
Percentage change Change in primary 1989 Primary 2004 Primary 1989–2004 Change in in population school gross enrollment education student- education student- primary student-0 to 17 years rate (%) teacher ratio teacher ratio teacher ratio
Young populationsKyrgyz Republic 17.2 13.0 11.8 13.2 11.4Tajikistan 123.1 11.3 15.6 16.9 11.3Turkmenistan 133.3 211.2 12.2 13.8 11.6Uzbekistan 116.3 14.7 13.1 13.3 10.2
Aging populationsAlbania 213.3 23.7 19.4 18.5 20.9Armenia 219.9 28.6 11.7 11.1 20.6Azerbaijan 13.7 12.5 10.9 8.8 22.1Bosnia and Herzegovina 226.6 28.7 24.0 20.8 23.2Kazakhstan 221.7 19.5 13.1 10.7 22.4Macedonia, FYR 29.6 24.2 20.8 16.8 24.0Moldova 231.6 0.0 14.1 9.3 24.8
Aged populationsBelarus 221.8 22.3 11.8 8.7 22.1Bulgaria 235.8 0.0 15.6 14.1 21.5Croatia 220.0 13.7 18.4 13.9 24.5Czech Republic 229.2 11.8 20.0 14.7 25.3Estonia 230.4 18.1 10.5 9.9 20.6Georgia 230.1 12.3 8.2 8.9 10.7Hungary 223.7 12.1 13.1 10.9 22.2Latvia 228.6 17.4 10.3 11.2 10.9Lithuania 219.8 18.8 12.6 11.6 21.0Poland 223.7 20.4 18.6 13.0 25.6Romania 228.6 17.8 20.0 13.3 26.7Russian Federation 223.7 21.6 14.1 9.3 24.8Serbia and Montenegro 212.8 10.6 19.1 15.4 23.7Slovak Republic 224.3 18.9 20.0 15.7 24.3Slovenia 226.4 10.1 14.9 10.5 24.4Ukraine 226.1 11.7 — — —
Source: UNICEF Innocenti Research Centre TransMONEE database.
Note: — 5 not available.
chaw_217-262_ch06.qxd 6/1/07 10:42 AM Page 253
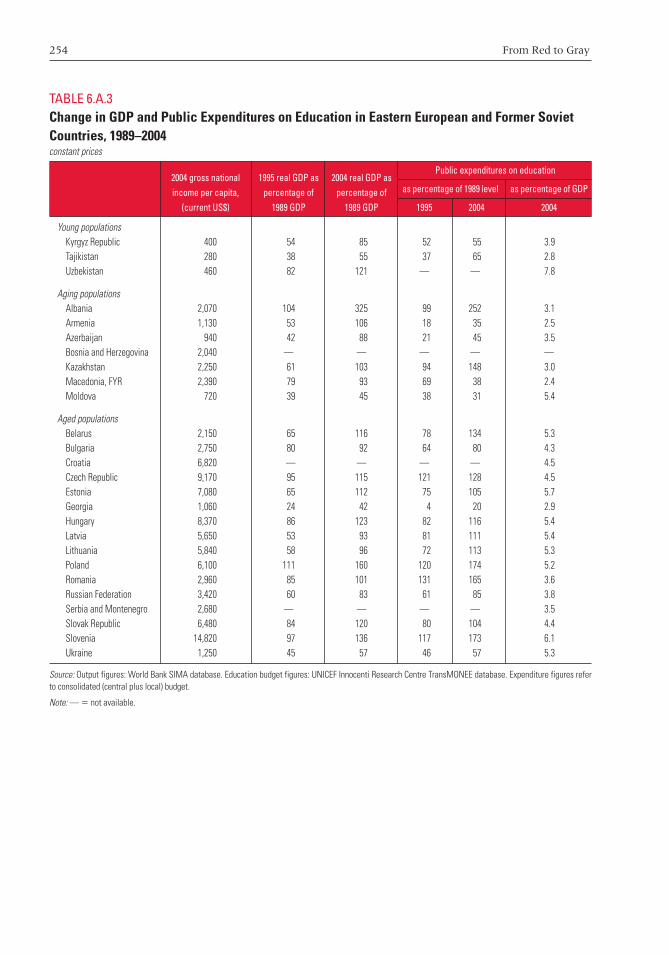
254 From Red to Gray
TABLE 6.A.3Change in GDP and Public Expenditures on Education in Eastern European and Former SovietCountries, 1989–2004constant prices
2004 gross national 1995 real GDP as 2004 real GDP as Public expenditures on education
income per capita, percentage of percentage of as percentage of 1989 level as percentage of GDP
(current US$) 1989 GDP 1989 GDP 1995 2004 2004
Young populationsKyrgyz Republic 400 54 85 52 55 3.9Tajikistan 280 38 55 37 65 2.8Uzbekistan 460 82 121 — — 7.8
Aging populationsAlbania 2,070 104 325 99 252 3.1Armenia 1,130 53 106 18 35 2.5Azerbaijan 940 42 88 21 45 3.5Bosnia and Herzegovina 2,040 — — — — —Kazakhstan 2,250 61 103 94 148 3.0Macedonia, FYR 2,390 79 93 69 38 2.4Moldova 720 39 45 38 31 5.4
Aged populationsBelarus 2,150 65 116 78 134 5.3Bulgaria 2,750 80 92 64 80 4.3Croatia 6,820 — — — — 4.5Czech Republic 9,170 95 115 121 128 4.5Estonia 7,080 65 112 75 105 5.7Georgia 1,060 24 42 4 20 2.9Hungary 8,370 86 123 82 116 5.4Latvia 5,650 53 93 81 111 5.4Lithuania 5,840 58 96 72 113 5.3Poland 6,100 111 160 120 174 5.2Romania 2,960 85 101 131 165 3.6Russian Federation 3,420 60 83 61 85 3.8Serbia and Montenegro 2,680 — — — — 3.5Slovak Republic 6,480 84 120 80 104 4.4Slovenia 14,820 97 136 117 173 6.1Ukraine 1,250 45 57 46 57 5.3
Source: Output figures: World Bank SIMA database. Education budget figures: UNICEF Innocenti Research Centre TransMONEE database. Expenditure figures referto consolidated (central plus local) budget.
Note: — 5 not available.
chaw_217-262_ch06.qxd 6/1/07 10:42 AM Page 254
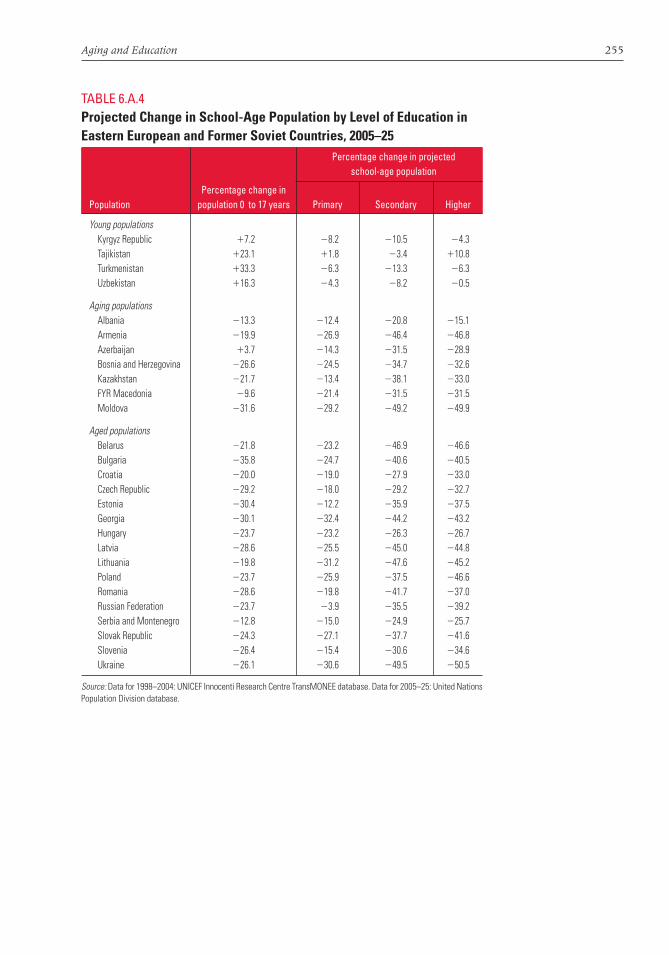
Aging and Education 255
TABLE 6.A.4Projected Change in School-Age Population by Level of Education inEastern European and Former Soviet Countries, 2005–25
Percentage change in projected school-age population
Percentage change in Population population 0 to 17 years Primary Secondary Higher
Young populationsKyrgyz Republic 17.2 28.2 210.5 24.3Tajikistan 123.1 11.8 23.4 110.8Turkmenistan 133.3 26.3 213.3 26.3Uzbekistan 116.3 24.3 28.2 20.5
Aging populationsAlbania 213.3 212.4 220.8 215.1Armenia 219.9 226.9 246.4 246.8Azerbaijan 13.7 214.3 231.5 228.9Bosnia and Herzegovina 226.6 224.5 234.7 232.6Kazakhstan 221.7 213.4 238.1 233.0FYR Macedonia 29.6 221.4 231.5 231.5Moldova 231.6 229.2 249.2 249.9
Aged populationsBelarus 221.8 223.2 246.9 246.6Bulgaria 235.8 224.7 240.6 240.5Croatia 220.0 219.0 227.9 233.0Czech Republic 229.2 218.0 229.2 232.7Estonia 230.4 212.2 235.9 237.5Georgia 230.1 232.4 244.2 243.2Hungary 223.7 223.2 226.3 226.7Latvia 228.6 225.5 245.0 244.8Lithuania 219.8 231.2 247.6 245.2Poland 223.7 225.9 237.5 246.6Romania 228.6 219.8 241.7 237.0Russian Federation 223.7 23.9 235.5 239.2Serbia and Montenegro 212.8 215.0 224.9 225.7Slovak Republic 224.3 227.1 237.7 241.6Slovenia 226.4 215.4 230.6 234.6Ukraine 226.1 230.6 249.5 250.5
Source: Data for 1998–2004: UNICEF Innocenti Research Centre TransMONEE database. Data for 2005–25: United NationsPopulation Division database.
chaw_217-262_ch06.qxd 6/1/07 10:42 AM Page 255

256 From Red to Gray
TABLE 6.A.5Gross Enrollment Rates for Eastern European and Former SovietCountries, 2004percentage
Secondary
Country Primary Total of which vocational Higher
Albania 98.5 58.1 9.7 19.0Armenia 86.9 49.3 11.9 23.9Azerbaijan 91.0 45.6 10.5 13.2Belarus 93.6 77.5 17.7 45.4Bosnia and Herzegovina 84.8 46.4 30.6 19.8Bulgaria 98.4 89.6 49.3 33.6Croatia 97.9 85.7 62.9 35.1Czech Republic 98.7 92.7 73.5 43.9Estonia 104.4 72.9 61.1 62.9Georgia 97.3 48.6 13.2 39.6Hungary 100.6 99.9 61.5 59.6Kazakhstan 103.3 68.8 34.3 40.0Kyrgyz Republic 95.2 45.3 12.7 36.2Latvia 103.1 71.6 26.5 63.6Lithuania 103.8 69.0 18.0 65.9Macedonia, FYR 97.8 72.6 44.3 21.2Moldova 94.1 44.6 16.1 27.7Poland 100.4 101.1 53.9 55.9Romania 103.6 75.8 49.7 35.5Russian Federation 88.4 71.3 42.1 46.7Serbia and Montenegro 95.7 55.0 41.2 23.9Slovak Republic 105.9 82.7 51.1 36.3Slovenia 97.1 99.6 62.3 79.5Tajikistan 95.4 28.8 7.8 14.4Turkmenistan 80.0 28.1 6.5 2.5Ukraine 94.5 62.6 29.6 44.8Uzbekistan 96.8 74.8 41.6 8.3OECD average 103.4 100.1 49.1 55.0
Source: UNICEF Innocenti Research Centre TransMONEE database.
Note: The gross enrollment rate (GER) is defined as the number of students enrolled at a given level of education, dividedby the population of the normal age group for that level of education. GERs typically overstate actual education coverage(and can exceed 100 percent) because they include over-age students and foreign students in the numerator, but not in thedenominator.
chaw_217-262_ch06.qxd 6/1/07 10:42 AM Page 256

Aging and Education 257
TABLE 6.A.6Shrinkage of School-Age Population, 1990–2000, and Change inProjected Enrollments by Level of Education, in Eastern European andFormer Soviet Countries, 2005–25
Percentage change in projected
Percentage change in population enrollments, 2005–25
0 to 17 years, 1989–2004 Primary Secondary Higher
Young populationsKyrgyz Republic 17.2 23.6 198.1 145.4Tajikistan 123.1 17.7 1234.5 1322.3Turkmenistan 133.3 117.2 1208.4 11,923.1Uzbekistan 116.3 21.2 122.7 1559.9
Aging populationsAlbania 213.3 211.0 136.6 1145.3Armenia 219.9 216.0 18.4 122.5Azerbaijan 13.7 25.8 150.4 1195.5Bosnia and Herzegovina 226.6 210.9 140.2 185.5Kazakhstan 221.7 216.2 210.0 27.9Macedonia, FYR 29.6 219.6 25.4 177.1Moldova 231.6 231.8 232.9 222.7
Aged populationsBelarus 221.8 218.0 231.3 235.1Bulgaria 235.8 223.4 233.7 22.8Croatia 220.0 217.4 216.0 15.6Czech Republic 229.2 216.9 223.7 215.9Estonia 230.4 215.4 212.8 236.9Georgia 230.1 230.6 114.7 220.9Hungary 223.7 223.6 226.3 226.7Latvia 228.6 227.7 222.8 244.4Lithuania 219.8 226.8 117.1 110.0Poland 223.7 247.1 243.3 246.7Romania 228.6 222.6 223.1 22.4Russian Federation 223.7 18.7 29.6 228.5Serbia and Montenegro 212.8 211.3 136.7 171.2Slovak Republic 224.3 231.2 224.4 211.5Slovenia 226.4 212.8 229.9 234.9Ukraine 226.1 226.5 219.4 239.2
Source: Data for 1998–2004: UNICEF Innocenti Research Centre TransMONEE database. Data for 2005–25: World Bankprojection model, based on assumptions described in the text and data from United Nations Population Division database.
chaw_217-262_ch06.qxd 6/1/07 10:42 AM Page 257

258 From Red to Gray
TABLE 6.A.7Country Rankings in Mean Scores of 15-Year-Old Students in OECD PISA Assessment, 2000 and 2003
2000 2003
Mathematics Reading Mathematics Reading
Hong Kong (China) (560) Finland (546) Hong Kong (China) (550) Finland (543)Japan (557) Canada (534) Finland (544) Korea, Rep. of (534)Korea, Rep. of (547) New Zealand (529) Korea, Rep. of (542) Canada (528)New Zealand (537) Australia (528) Netherlands (538) Australia (525)Finland (536) Ireland (527) Lichtenstein (536) Lichtenstein (525)Australia (533) Hong Kong (China) (525) Japan (534) New Zealand (522)Canada (533) Korea, Rep. of (525) Canada (532) Ireland (515)Switzerland (529) United Kingdom (523) Belgium (529) Sweden (514)United Kingdom (529) Japan (522) Macau (China) (527) Netherlands (513)Belgium (520) Sweden (516) Switzerland (527) Hong Kong (China) (510)France (517) Austria (507) Australia (524) Belgium (507)Austria (515) Belgium (507) New Zealand (523) Norway (500)Denmark (514) Iceland (507) Czech Republic (516) Switzerland (499)Iceland (514) Norway (505) Iceland (515) Japan (498)Lichtenstein (514) France (505) Denmark (514) Macau (China) (498)Sweden (510) United States (504) France (511) Poland (497)Ireland (503) Denmark (497) Sweden (509) France (496)Norway (499) Switzerland (494) Austria (506) United States (495)Czech Republic (498) Spain (493) Germany (503) Denmark (492)United States (493) Czech Republic (492) Ireland (503) Iceland (492)Germany (490) Italy (487) Slovak Republic (498) Germany (491)Hungary (488) Germany (484) Norway (495) Austria (491)Russian Federation (478) Lichtenstein (483) Luxembourg (493) Latvia (491)Spain (476) Hungary (480) Poland (490) Czech Republic (489)Poland (470) Poland (479) Hungary (490) Hungary (482)Latvia (463) Greece (474) Spain (485) Spain (481)Italy (457) Portugal (470) Latvia (483) Luxembourg (479)Portugal (454) Russian Federation (462) United States (483) Portugal (478)Greece (447) Latvia (458) Russian Federation (468) Italy (476)Luxembourg (446) Israel (452) Portugal (466) Greece (472)Israel (433) Luxembourg (441) Italy (466) Slovak Republic (469)Thailand (432) Thailand (431) Greece (445) Russian Federation (442)Bulgaria (430) Bulgaria (430) Serbia and Montenegro (437) Turkey (441)Argentina (388) Mexico (422) Turkey (423) Uruguay (434)Indonesia (387) Argentina (418) Uruguay (422) Thailand (420)Mexico (387) Chile (410) Thailand (417) Serbia (412)Chile (384) Brazil (396) Mexico (385) Brazil (403)Albania (381) Macedonia, FYR (373) Indonesia (360) Mexico (400)Macedonia, FYR (381) Indonesia (371) Tunisia (359) Indonesia (382)Brazil (334) Albania (349) Brazil (356) Tunisia (375)Peru (292) Peru (327)
Source: OECD 2003, 2004a.
Note: Eastern European and Former Soviet Countries are in bold.
chaw_217-262_ch06.qxd 6/1/07 10:42 AM Page 258

Aging and Education 259
TABLE 6.A.8PISA 2000 Results: Mean Mathematical Literacy Scores and ScoreGradient Attributable to Differences in Socioeconomic Status
Mean score in Country mathematical literacy Score gradienta
Japan 557 24Korea, Rep. of 547 23New Zealand 537 45Finland 536 30Australia 533 46Canada 533 37Switzerland 529 49United Kingdom 529 49Belgium 520 48France 517 48Austria 515 41Denmark 514 42Iceland 514 24Sweden 510 36Ireland 503 38OECD Average 500 41Norway 499 42Czech Republic 498 49United States 493 48Germany 490 60Hungary 488 54Spain 476 32Poland 470 38Italy 457 32Portugal 454 41Greece 447 38Luxembourg 446 46Mexico 387 35
Source: OECD 2004b.
a. Score difference is associated with a one-unit increase in socioeconomic status (on a six-point scale).
Notes
1. Preschool enrollment declined because local communities andenterprises often could not afford to maintain preschools after thetransition.
2. Although the region has seen some development of private education,including in public universities in the form of fee-paid “contract” places,education remains overwhelmingly a public sector activity.
3. China’s situation is not comparable, because the population of China isexpected to continue growing for at least 20 years, despite the success ofthe one-child policy, and because its rapid economic growth and its dual-istic economic structure allow policy options that are not available to thepoorest of the Eastern European and former Soviet countries, whichhave shrinking populations.
chaw_217-262_ch06.qxd 6/1/07 10:42 AM Page 259

260 From Red to Gray
4. Other studies that have examined the effects of population aging ondemand for education generally do not account for these differences. Forexample, recent studies of the fiscal effects of aging populations in coun-tries of the European Union and the Organization for Economic Co-operation and Development include an examination of prospectiveimpacts on education expenditures. This comparative-static analysisassumes that changes in education expenditures are directly propor-tional to changes in enrollments and gross domestic product per worker.As a result, it projects sizable fiscal savings from smaller school-agecohorts. This assumption and the conclusions derived from it are lessappropriate for the transition countries, where education systems stillembody much of the redundant capacity and inefficiency that they accu-mulated under the former socialist system, and where recent declines inschool-age cohorts have led to increased inefficiency rather than tobudget savings. See, for example, Dang, Antolin, and Oxley (2001) andthe chapter on education in European Commission (2006).
5. The largest increase occurred in Turkmenistan, where the populationage 0 to 17 increased by 33 percent between 1989 and 2003. Because ofrestrictions on emigration, this increase is attributable almost exclusivelyto natural increase. The increases in the size of the 0 to 17 age cohort inAzerbaijan, the Kyrgyz Republic, Tajikistan, and Turkmenistan wouldhave been larger in the absence of net out-migration.
6. This conclusion is supported by findings from Living Standards Measure-ment Study surveys in a number of the transition countries—includingBosnia and Herzegovina, Bulgaria, the Kyrgyz Republic, Romania,Russia, Serbia and Montenegro, and Uzbekistan—that the most fre-quently reported reasons for secondary school–age children not attend-ing school are that families cannot afford the costs of schooling and thatthe children need to work to supplement household income.
7. This effort was unique not only for its results but also for its cost. It waslargely responsible for raising the education sector share of gross domes-tic product to 9 percent in 2002—among the highest in the world (WorldBank 2005c). The share is projected to increase to 10.5 percent in 2009.
8. These gross enrollment rates overstate actual coverage because theyinclude overage students in the numerator but not in the denominator.
9. These data are from the United Nations Children’s Fund’s InnocentiResearch Centre TransMONEE database.
10. Although private sector education is developing in the region, coverageremains very limited.
11. Russia is an exception to this pattern. It recorded a moderately highlevel of learning achievement despite a relatively modest fiscal effort ineducation.
12. This projection is based on the medium-variant age-specific populationprojections of the United Nations Population Division (United Nations2005). School-age groups are defined with regard to the structure ofeducation programs in the respective countries.
13. In the few countries in which gross enrollment rates in higher educationare already at or above the OECD mean, we assume continuation of cur-rent gross enrollment rates.
chaw_217-262_ch06.qxd 6/1/07 10:42 AM Page 260
Aging and Education 261
14. Population is projected to increase from just over 25 million in 2004 to34 million in 2025.
15. In the Czech Republic, per student allocations in upper secondaryschooling range from about CZK 24,000 for gymnasia and business acad-emies to about CZK 29,000 for technical schools. This relatively narrowspread encourages more efficient delivery of technical education.Because any additional costs must be financed from local sources, it alsoencourages local authorities to consider very carefully whether technicaleducation programs that cost more than this amount provide good valueto the local community.
16. There is extensive research on the sources of growth in general and onthe role of human capital investments in particular, using both macro-level and micro-level data on rates of return on education. See, for exam-ple, Barro and Sala-i-Martin (2003), Bils and Klenow (2000), andHanushek and Kimko (2000).
17. The PISA surveys for 2000 included eight Eastern European and formerSoviet countries: Albania, Bulgaria, the Czech Republic, Hungary, Latvia,FYR Macedonia, Poland, and Russia. In 2003, Albania, Bulgaria, theCzech Republic, Hungary, Latvia, Poland, Russia, and FYR Macedoniadid not participate, but Serbia and Montenegro, the Slovak Republic,and Turkey participated.
18. This finding is revealed by the experience of the OECD countries and thetransition countries themselves (OECD 2003; World Bank 2003).
chaw_217-262_ch06.qxd 6/1/07 10:42 AM Page 261

chaw_217-262_ch06.qxd 6/1/07 10:42 AM Page 262
Barro, Robert J., and Xavier Sala-i-Martin. 2003. Economic Growth, 2nd ed.Cambridge, MA: MIT Press.
Berryman, Sue E. 2000. Hidden Challenges to Education Systems in TransitionCountries. Washington, DC: World Bank
Bils, Mark, and Peter J. Klenow. 2000. “Does Schooling Cause Growth?”American Economic Review 90 (5): 1160–83.
Blanchet, Didier. 1993. “Does an Ageing Labour Force Call for Large Adjust-ment in Training or Wage Policies?” In Labour Markets in an Ageing Europe,ed. Paul Johnson and Klaus F. Zimmermann, 1–25. Cambridge, U.K.:Cambridge University Press.
Bloom, David E., David Canning, Rick Mansfield, and Michael Moore. 2006.“Demographic Change, Social Security Systems, and Savings.” NBERWorking Paper 12621, National Bureau of Economic Research, Cambridge,MA.
Börsch-Supan, Axel. 2003. “Labor Market Effect of Population Aging.”Labour 17: 5–44.
Börsch-Supan, Axel, Agar Brugiavini, Hendrik Jürges, Johan Mackenbach,Johannes Siegrist, and Guglielmo Weber. 2005. Health, Ageing, and Retire-ment in Europe—First Results from the Survey of Health, Ageing, and Retirementin Europe. Mannheim, Germany: Mannheim Research Institute for theEconomics of Aging.
Börsch-Supan, Axel, Anette Reil-Held, and Reinhold Schnabel. 2003.“Household Saving in Germany.” In Life-Cycle Savings and Public Policy: ACross-National Study of Six Countries, ed. Axel Börsch-Supan, 57–99. SanDiego, CA: Academic Press.
References
263
chaw_ref_263-271.qxd 5/31/07 2:52 PM Page 263
264 From Red to Gray
Brozek, Dorothea. 2004. “The Austrian Long-Term Care Insurance.” Euro-pean Centre for Excellence on Personal Assistance Project, Vienna. http://www.independentliving.org/docs7/brozek200409a.html.
Canning, Mary. 2001. “Educational Policy Priorities in Slovakia: A DiscussionPaper.” World Bank, Washington, D.C.
Castles, Francis G. 2000. “Population Aging and the Public Purse: How RealIs the Problem?” Paper presented at the Australasian Political StudiesAssociation Conference, Canberra, October 3–6.
Comas-Herrera, Adelina, and Raphael Wittenberg, eds. 2003. European Studyof Long-Term Care Expenditure. London: Personal Social Services ResearchUnit, London School of Economics.
Commander, Simon, and Janos Kollo. 2004. “The Changing Demand forSkills: Evidence from the Transition.” Discussion Paper 1073, Institute forthe Study of Labor, Bonn, Germany.
Costa-Font, Joan, and Concepció Patxot. 2003. “Long-Term Care for OlderPeople in Spain.” In European Study of Long-Term Care Expenditure, ed. AdelinaComas-Herrera and Raphael Wittenberg, 43–57. London: Personal SocialServices Research Unit, London School of Economics.
———. 2005. “The Design of the Long-Term Care System in Spain: Policyand Financial Constraints.” Social Policy and Society 4 (1): 11–20.
Coulombe, Serge, Jean-François Tremblay, and Sylvie Marchand. 2004.“International Adult Literacy Survey: Literacy Scores, Human Capital, andGrowth across Fourteen OECD Countries.” Working Paper, StatisticsCanada, Ottawa.
Cuellar, Alison Evans, and Joshua M. Wiener. 2000. “Can Social Insurance forLong-Term Care Work? The Experience of Germany.” Health Affairs 19 (3):8–25.
Dang, Thai Than, Pablo Antolin, and Howard Oxley. 2001. “Fiscal Implicationsof Ageing: Projections of Age-Related Spending.” Economics DepartmentWorking Paper 305, Organisation for Economic Co-operation and Devel-opment, Paris.
de Serres, Alain, Dave Turner, Claud Giorno, Ann Vourc’h, and PeteRichardson. 1998. “The Macroeconomic Implications of Ageing in aGlobal Context.” OECD Economics Department Working Paper 193,OECD Economics Department, Paris.
EBRD (European Bank for Reconstruction and Development). 2006. Transi-tion Report 2006: Finance in Transition. London: EBRD.
Economic Policy Committee. 2001. “Budgetary Challenges Posed by AgingPopulations: The Impact on Public Spending, Health and Long-Term Carefor the Elderly and Possible Indicators of the Long-Term Sustainability ofPublic Finances.” Directorate General for Economic and Financial Affairsof the European Commission, Brussels.
EIRO (European Industrial Relations Observatory). 2003. “Controversy overReform of ‘Personalised Independence Allowance.’” http://www.eiro.eurofound.eu.int/.
Elstad, Jon Ivar. 1990. “Health Services and Decentralized Government: TheCase of Primary Health Services in Norway.” International Journal of HealthServices 20 (4): 545–59.
European Economy. 2005. Special Report No. 4. Office for Official Publica-tions of the EC. Luxembourg.
chaw_ref_263-271.qxd 5/31/07 2:52 PM Page 264
References 265
European Commission. 2006. The Impact of Ageing on Public Expenditure:Projections for the EU-25 Member States on Pensions, Healthcare, Long-TermCare, Education, and Unemployment Transfers (2004–50). Brussels: Euro-pean Commission, Directorate General for Economic and FinancialAffairs.
European Social Network. 2005. http://www.socialeurope.com/english/e_file.htm.
Fair, Ray C. 1994. “How Fast Do Old Men Slow Down?” Review of Economicsand Statistics 76 (1): 103–18.
———. 2004. “Estimated Physical and Cognitive Aging Effects.” DiscussionPaper 1495, Cowles Foundation, Yale University, New Haven, CT.
Faruqee, Hamid. 2002. “Population Aging and Its Macroeconomic Implica-tions: A Framework for Analysis.” IMF Working Paper 02/16, Interna-tional Monetary Fund, Washington, DC.
Feider, Jean-Marie, Paul Hansen, Andrée Kerger, Robert Kieffer, GeorgesSchroeder, Catherine Thomé, and Raymond Wagener. 1999. “L’assurancedépendance.” Bulletin luxembourgeois des questions sociales 7 (special issue):1–170.
Feldstein, Martin, and Charles Horioka. 1980. “Domestic Saving and Interna-tional Capital Flows.” Economic Journal 90 (358): 314–29.
Fiszbein, Ariel, ed. 2001. Decentralizing Education in Transition Societies: CaseStudies from Central and Eastern Europe. Washington, DC: World Bank.
Flabbi, Luca, Stefano Paternostro, and Erwin Tiongson. 2007. “Returns toEducation in the Economic Transition: A Systematic Assessment UsingComparable Data.” Policy Research Working Paper 4225, World Bank,Washington, DC.
Furuholmen, Christine, and Jon Magnussen. 2000. Health Care Systems inTransition: Norway. Copenhagen: World Health Organization RegionalOffice for Europe, on behalf of the European Observatory on Health Sys-tems and Policies.
Gaál, Péter. 2004. Health Care Systems in Transition: Hungary. Copenhagen:World Health Organization Regional Office for Europe, on behalf of theEuropean Observatory on Health Systems and Policies.
Galenson, David W., and Bruce A. Weinberg. 2000. “Age and the Quality ofWork: The Case of Modern American Painters.” Journal of Political Economy108 (4): 761–77.
Geraedts, Max, Geoffrey V. Heller, and Charlene A. Harrington. 2000.“Germany’s Long-Term-Care Insurance: Putting a Social Insurance Modelinto Practice.” Milbank Quarterly 78: 375–401
Glenngård Anna H., Frida Hjalte, Marianne Svensson, Anders Anell, andVaida Bankauskaite. 2005. Health Care Systems in Transition: Sweden.Copenhagen: World Health Organization Regional Office for Europe, onbehalf of the European Observatory on Health Systems and Policies.
Godfrey, Martin. 2004. “Russian Federation: Per Capita Financing of Educa-tion: Experience and Issues.” Russia Country Office Policy Note 29943,World Bank, Moscow.
Gregory, Paul R., Manouchehr Mokhtari, and Wolfram Schrettl. 1999. “Do theRussians Really Save That Much?—Alternate Estimates from the RussianLongitudinal Monitoring Survey.” Review of Economics and Statistics 81 (4):694–703.
chaw_ref_263-271.qxd 5/31/07 2:52 PM Page 265

266 From Red to Gray
Grilz-Wolf, Margit, Charlotte Strümpel, Kai Leichsenring, and Kathrin Komp.2004. “Providing Integrated Health and Social Care for Older Persons inAustria.” In Providing Integrated Health and Social Care for Older Persons: AEuropean Overview of Issues at Stake, ed. Kai Leichsenring and Andy M.Alaszewski, 97–138. Aldershot, U.K.: Ashgate.
Hanushek, Erik A., and Dennis D. Kimko. 2000. “Schooling, Labor-ForceQuality, and the Growth of Nations.” American Economic Review 90 (5):1184–208.
Hanushek, Eric A., and Ludger Woessman. 2005. “Does Educational TrackingAffect Performance and Inequality? Differences-in-Differences Evidenceacross Countries.” NBER Working Paper 11124, National Bureau of Eco-nomic Research, Cambridge, MA.
Herczynski, Jan. 2002. “Key Issues of Governance and Finance of KyrgyzEducation.” Center for Social and Economic Research, Warsaw.
Holzmann, Robert. 2005. “Demographic Alternatives for Aging IndustrialCountries: Increased Total Fertility Rate, Labor Force Participation, orImmigration.” IZA Discussion Paper 1885, Institute for the Study of Labor,Bonn.
Holzman, Robert, and Richard Hinz. 2005. Old Age Income Support in the21st Century: An International Perspective on Pension Systems and Reform.Washington, DC: World Bank.
Howse, Kenneth. 2005. “Policies for Healthy Ageing.” Ageing Horizons 2: 3–15.Hutten, Jack B. F., and Ada Kerkstra, eds. 1996. Home Care in Europe: A Country-
Specific Guide to Its Organization and Financing. Aldershot, U.K.: ArenaAshgate.
IMF (International Monetary Fund). 2006. World Economic Outlook: Globaliza-tion and Inflation. Washington, DC: IMF.
Johansson, Lennarth. 1997. “Decentralisation from Acute to Home Care Set-tings in Sweden.” Health Policy 41 (suppl. 1): S131–43.
Karlsson, Martin, Les Mayhew, Robert Plumb, and Ben Rickayzen. 2004. “AnInternational Comparison of Long-Term Care Arrangements: An Investi-gation into the Equity, Efficiency, and Sustainability of the Long-TermCare Systems in Germany, Japan, the United Kingdom, and the UnitedStates.” Actuarial Research Paper 156, Actuarial Research Centre, CassBusiness School, London.
Katz, Sidney, Amasa B. Ford, Roland W. Moskowitz, Beverly A. Jackson, andMarjorie W. Jaffe. 1963. “Studies of Illness in the Aged.” Journal of theAmerican Medical Association 185: 914–19.
Kertesi, Gabor, and Janos Kollo. 2001. “Economic Transformation and theRevaluation of Human Capital—Hungary, 1986–1999.” Budapest WorkingPaper on the Labour Market 2001/4, Institute of Economics, HungarianAcademy of Sciences, Budapest.
Kitaev, Igor. 1996. Educational Finance in Central Asia and Mongolia. Paris:United Nations Educational, Scientific, and Cultural Organization.
Klevmarken, N. Anders. 1993. “On Aging and Earnings.” In Labour Markets inan Ageing Europe, ed. Paul Johnson and Klaus F. Zimmermann, 151–77.Cambridge, U.K.: Cambridge University Press.
Kotlikoff, Laurence J., and Christian Hagist. 2005. “Who’s Going Broke?Comparing Healthcare Costs in Ten OECD Countries.” NBER WorkingPaper 11833, National Bureau of Economic Research, Cambridge, MA.http://www.nber.org/papers/w11833.
chaw_ref_263-271.qxd 5/31/07 2:52 PM Page 266
References 267
Laporte, Bruno, and Julian Schweitzer. 1994. “Education and Training.” InLabor Markets and Social Policy in Central and Eastern Europe: The Transitionand Beyond, ed. Nicholas Barr, 260–87. New York and London: OxfordUniversity Press.
Leichsenring, Kai. 2004. “Developing Integrated Health and Social Care Ser-vices for Older Persons in Europe.” International Journal of Integrated Care 4:1–18.
Levacic, Rosalind. 2003. “Financing Schools to Achieve Efficiency and Equity:A Review of Principles and Practices and their Application to Bosnia-Herzegovina.” Working Paper. World Bank, Washington, DC.
Levacic, Rosalind, and Kenneth Ross. 1999. “Principles for Designing Needs-Based School Funding Formulae.” In Needs-Based Resource Allocation inEducation via Formula Funding of Schools, ed. Kenneth Ross and RosalindLevacic. Paris: International Institute for Education Planning; UnitedNations Educational, Scientific, and Cultural Organization.
Lim, Kyung-Mook, and David N. Weil, 2003. “The Baby Boom and the StockMarket Boom.” Working Paper 2003–07, Department of Economics,Brown University, Providence.
Loayza, Normal, Klaus Schmidt-Hebbel, and Luis Servén. 2000. “What DrivesPrivate Saving around the World?” Policy Research Working Paper 2309,World Bank, Washington, DC.
Lührmann, Melanie 2003. “Demographic Change, Foresight, and Interna-tional Capital Flows.” MEA Discussion Paper 03038, Mannheim ResearchInstitute for the Economics of Aging, University of Mannheim, Mannheim,Germany.
Mansoor, Ali, and Bryce Quillin, eds., 2006. Migration and Remittances: EasternEurope and the Former Soviet Union. Washington, DC: World Bank.
Martin, Michael O., Ina V. S. Mullis, Eugenio J. Gonzalez, and Steven J.Chrostowski. 2004. TIMSS 2003 International Science Report: Findings fromIEA’s Trends in International Mathematics and Science Study at the Fourth andEighth Grades. Boston: International Association for the Evaluation of Edu-cational Achievement.
Martins, Oliveira, J. F. Gomand, P. Antolin, C. de la Maisonneuve, and K.-Y.Yoo. 2005. “The Impact of Ageing on Demand, Factor Markets, andGrowth.” OECD Economics Department Working Paper No. 420, OECD,Paris.
McDonald, Peter. 2000. “The Toolbox of Public Policies to Impact on Fertility:A Global View.” Paper presented at the annual seminar of the EuropeanObservatory on Family Matters, Low Fertility, Families, and Public Poli-cies, Seville, Spain, September 15–16.
McGrail, Kimberlyn, Bo Green, Morris L. Barer, Robert G. Evans, ClydeHertzman, and Charles Normand. 2000. “Age, Costs of Acute and Long-Term Care, and Proximity to Death: Evidence for 1987–88 and 1994–95in British Columbia.” Age and Ageing 29 (3): 249–53.
Mertaugh, Michael, and Erik Hanushek. 2005. “Education and Training.” InLabor Markets and Social Policy in Central and Eastern Europe: The Accession andBeyond, ed. Nicholas Barr, 207–42. Washington, DC: World Bank.
Ministry of Health and Social Affairs, Sweden. 2005. “Policy for the Elderly.”Fact Sheet 14 (May). Ministry of Health and Social Affairs, Stockholm.
Ministry of the Interior and Health and Ministry of Social Affairs and GenderEquality, Denmark. 2002. “Questionnaire on Health and Long-Term Care
chaw_ref_263-271.qxd 5/31/07 2:52 PM Page 267
268 From Red to Gray
for the Elderly.” Ministry of the Interior and Health and Ministry of SocialAffairs and Gender Equality, Copenhagen.
Modigliani, Franco, and Richard E. Brumberg. 1954. “Utility Analysis andthe Consumption Function.” In Post-Keynesian Economics, ed. Kenneth K.Kurihara, 388–436. New Brunswick, NJ: Rutgers University Press.
Mullis, Ina V. S., Michael O. Martin, Eugenio J. Gonzalez, and Steven J.Chrostowski. 2004. TIMSS 2003 International Mathematics Report: Findingsfrom IEA’s Trends in International Mathematics and Science Study at the Fourthand Eighth Grades. Boston: International Association for the Evaluation ofEducational Achievement.
Nesti, Giorgia, Stefano Campostrini, Stefano Garbin, Paola Piva, Patrizia DiSanto, and Filomena Tunzi. 2004. “Providing Integrated Health and SocialCare for Older Persons in Italy.” In Providing Integrated Health and Social Carefor Older Persons: A European Overview of Issues at Stake, ed. Kai Leichsenringand Andy M. Alaszewski, 371–414. Aldershot, U.K.: Ashgate.
OECD (Organisation for Economic Co-operation and Development). 1998.“Maintaining Prosperity in an Ageing Society: The OECD Study on thePolicy Implications of Ageing.” Working Paper AWP 4.1, Paris, OECD.
———. 2003. Literacy Skills for the World of Tomorrow: Further Results from PISA2000. Paris: OECD.
———. 2004a. Learning for Tomorrow’s World: First Results from PISA2003. Paris: OECD. http://www.pisa.oecd.org/document/55/0,2340,en_32252351_32236173_33917303_1_1_1_1,00.html.
———. 2004b. Messages from PISA 2000. Paris: OECD. ———. 2005. Long-Term Care for Older People. Paris: OECD. ———. 2006. Live Longer, Work Longer: A Synthesis Report of the Ageing and
Employment Policies Project. Paris: OECD.OECD and Statistics Canada. 1997. Literacy Skills for the Knowledge Society: Fur-
ther Results from the International Adult Literacy Survey. Paris: OECD.Oster, Sharon M., and Daniel S. Hamermesh. 1998. “Aging and Productivity
among Economists.” Review of Economics and Statistics 80 (1): 154–56.Peter, Klara Sabirianova. 2003. “Skill-Biased Transition: The Role of Markets,
Institutions, and Technological Change.” Working Paper 2003-616,William Davidson Institute, University of Michigan, Ann Arbor.
Poterba. 2004. “The Impact of Population Aging on Financial Markets.”NBER Working Paper 10851, National Bureau of Economic Research,Cambridge, MA.
Prskawetz, Alexia, Thomas Fent, and Ross Guest. 2005. “Workforce Agingand Labor Productivity: The Role of Supply and Demand for Labor in theG7.” Working Paper, Vienna Institute of Demography, Vienna.
Puska Pekka, Jaako Tuomilehto, Jukka Salonen, Aulikki Nissinen, J. Virtamo,S. Björkqvist, Kaj Koskela, L. Neittaanmäki, L. Takalo, T. E. Kottke, J.Mäki, P. Sipilä, and P. Varvikko. 1981. The North Karelia Project: Evaluationof a Comprehensive Community Programme for Control of Cardiovascular Diseasesin North Karelia, Finland, 1972–1977. Copenhagen: World Health Organiza-tion, European Office.
Remery, Chantal, Kene Henkens, Joop Schippers, and Peter Ekamper.2003. “Managing an Aging Workforce and a Tight Labor Market: ViewsHeld by Dutch Employers.” Population Research and Policy Review 22 (1):21–40.
chaw_ref_263-271.qxd 5/31/07 2:52 PM Page 268

References 269
Richardson, Jeff, and Iain Robertson. 1999. “Aging and the Cost of HealthServices.” Working Paper 90, Centre for Health Program Evaluation,Melbourne, Australia.
Romer, David. 1996. Advanced Macroeconomics. New York: McGraw-Hill.Ross, Kenneth, and Rosalind Levacic, eds. 1999. Needs-Based Resource Alloca-
tion in Education via Formula Funding of Schools. Paris: International Institutefor Education Planning; United Nations Educational, Scientific, and Cul-tural Organization.
Roth, Günter, and Monika Reichert. 2004. “Providing Integrated Health andSocial Care for Older Persons in Germany.” In Providing Integrated Healthand Social Care for Older Persons: A European Overview of Issues at Stake, ed.Kai Leichsenring and Andy M. Alaszewski, 269–328. Aldershot, U.K.:Ashgate.
Rubisch, Max, Silvia Philipp, Walter Wotzel, and Ilse Enge. 2004. Provision forLong-Term Care in Austria. Vienna: Federal Ministry of Social Security, Gen-erations, and Consumer Protection.
Rutkowski, Jan, and Stefano Scarpetta, with Arup Banerji, Philip O’Keefe,Gaëlle Pierre, and Milan Vodopivec. 2005. Enhancing Job Opportunities:Eastern Europe and the Former Soviet Union. Washington, DC: World Bank.
Rysalieva, Symbat, and Gulmira Ibraeva. 1999. “Educational Financing andBudgeting in Kyrgyzstan.” International Institute for Education Plan-ning; United Nations Educational, Scientific, and Cultural Organization,Paris.
Salonen, Paula, and Riitta Haverinen. 2004. “Providing Integrated Healthand Social Care for Older Persons in Finland.” In Providing Integrated Healthand Social Care for Older Persons: A European Overview of Issues at Stake, ed.Kai Leichsenring and Andy M. Alaszewski, 181–228. Aldershot, U.K.:Ashgate.
Salthouse, Timothy A. 1984. “Effects of Age and Skill in Typing.” Journal ofExperimental Psychology 113 (3): 345–71.
Saltman, Richard B., Reinhard Busse, and Josep Figueras, eds. 2004. SocialHealth Insurance Systems in Western Europe. Berkshire, U.K.: Open Univer-sity Press/McGraw-Hill Education.
Saltman, Richard B., and Hans F. W. Dubois. 2005. “The Impact of Aging onHealth and Long-Term Care Services in Europe: A Review of RecentThinking.” Background paper prepared for the World Bank, European andCentral Asia Unit, Human Development Division, Washington, DC.
Schleicher, Andreas. 2006. The Economics of Knowledge: Why Education Is Key toEurope’s Success. Brussels: Lisbon Council for Economic Competitivenessand Social Renewal.
Schwab, Klaus, Michael Porter, and Jeffrey Sachs, eds. 2001. The Global Com-petitiveness Report, 2001/2002. Geneva: World Economic Forum.
Seshamani, Meena, and Alastair Gray. 2003. “Health Care Expenditures andAging: An International Comparison.” Applied Health Economics and HealthPolicy 2 (1): 9–16.
Sissouras, Aris, Maria Ketsetzopoulou, Nikos Bouzas, Evi Fagadaki, OlgaPapaliou, and Aliki Fakoura. 2004. “Providing Integrated Health andSocial Care for Older Persons in Greece.” In Providing Integrated Health andSocial Care for Older Persons: A European Overview of Issues at Stake, ed. KaiLeichsenring and Andy M. Alaszewski, 329–70. Aldershot, U.K.: Ashgate.
chaw_ref_263-271.qxd 5/31/07 2:52 PM Page 269
270 From Red to Gray
Stooker, Tom, Joost W. van Acht, Erik M. van Barneveld, René C. van Vliet,Ben A. van Hout, Dick J. Hessing, and Jan J. Busschbach. 2001. “Costs inthe Last Year of Life in the Netherlands.” Inquiry 38 (1): 73–80.
Szczerbinska, Katarzyna, ed. 2005. “The Accessibility of Health and SocialCare for the Elderly in Poland.” Comparison of Longitudinal EuropeanStudies on Aging (CLESA) program, Jagiellonian University, Krakow.
Taylor, Philip. 2003. “A New Deal for Older Workers? The Employment Situ-ation for Older Workers in the United Kingdom.” In Ageing and the Transi-tion to Retirement: A Comparative Analysis of European Welfare States, ed. TonyMaltby, Bert de Vroom, Maria-Louisa Mirabile, and Einar Øverbye,186–204. Aldershot, U.K.: Ashgate.
UNICEF (United Nations Children’s Fund). 2004. Innocenti Social Monitor 2004:Economic Growth and Child Poverty in the CEE/CIS and the Baltic States.Florence, Italy: UNICEF Innocenti Research Centre.
United Nations. 2005. World Population Prospects: The 2004 Revision. New York:United Nations, Department of Economic and Social Affairs, PopulationDivision.
U.S. Social Security Department. 2004. Social Security Programs throughout theWorld. Washington, DC: U.S. Social Security Department. http://www.ssa.gov/policy/docs/progdesc/ssptw/2004-2005/europe/index.html.
Vaarama, Marja, Anne Hakkarainen, Päivi Voutilainen, and Eeva Päivärinta.2000. “Vanhusten palvelut” [“Services for the Elderly”]. In Sosiaalija ter-veydenhuollon palvelukatsaus 2000 [Social Welfare and Health Care ServiceReview 2000], ed. Hannu Uusitalo, Antti Parpo, and Anne Hakkarainen,75–98. Helsinki: Reports of National Research and Development Centrefor Welfare and Health.
Van den Berg Jeths, Anneke, Joost M. Timmermans, Nancy Hoeymans, andI. B. Woittiez. 2004. Ouderen nu en in de toekomst: Gezondheid, verpleging enverzorging 2000–2020 [Elderly Now and in the Future: Health, Nursing, and Care2000–2020]. RIVM (National Institute for Public Health and the Environ-ment)/SCP (Social and Cultural Planning Office of the Netherlands).Houten, Netherlands: Bohn Stafleu Van Loghum.
Van Dijck, J. A. A. M., J. W. W. Coebergh, S. Siesling, and O. Visser, eds.2002. Trends of Cancer in the Netherlands 1989–1998. Utrecht, Netherlands:Vereniging van Integrale Kankercentra.
Van Oers, Johannes A. M., ed. 2002. Gezondheid op koers? Volksgezondheidtoekomst verkenning 2002 [Health on Course? The 2002 Dutch Public Health Sta-tus and Forecast Report]. Houten, Netherlands: Bohn Stafleu Van Loghum.
van Ours, Jan. 2006. “Labor Market Effects of Aging: What about the ECACountries?” Background paper prepared for the World Bank, Washington,DC.
Visco, Ignazio. 2005. Ageing and Pension System Reform: Implications for FinancialMarkets and Economic Policies. Report prepared at the request of the Deputiesof the Group of 10. September.
Vittorelli, Christophe, Steve Kapsos, Ferdinand Lepper, Farhad Mehran,James Brown, and Fiifi Amoako Johnson. 2006. “ILO Estimates and Pro-jections of the Economically Active Population: 1980–2020 (Fifth Edition):Methodological Description,” International Labour Organization, Geneva.
Wieczorowska-Tobis, Katarzyna. 2005. “Long-Term Care in Poland.” Min-istry of Health and Social Affairs, Stockholm.
chaw_ref_263-271.qxd 5/31/07 2:52 PM Page 270
References 271
Wittenberg, Raphael, and Adelina Comas-Herrera. 2003. “Trends in Eco-nomic Growth and Real Costs of Care.” In European Study of Long-TermCare Expenditure, ed. Adelina Comas-Herrera and Raphael Wittenberg,139–46. London: Personal Social Services Research Unit, London Schoolof Economics.
Working Group Investigating the Significance of Non-Institutional and Insti-tutional Care. 2001. Memorandum (Final Report) of the Working Group Inves-tigating the Significance of Non-Institutional and Institutional Care. Helsinki:Working Group Memorandum of Ministry of Social Affairs and Health.
World Bank. 2002. Transition: The First Ten Years: Analysis and Lessons for East-ern Europe and the Former Soviet Union. Washington, DC: World Bank.
———. 2003. Lifelong Learning in the Global Knowledge Economy: Challenges forDeveloping Countries. Washington, DC: World Bank.
———. 2005a. Enhancing Job Opportunities: Eastern Europe and the Former SovietUnion. Washington, DC: World Bank.
———. 2005b. From Disintegration to Reintegration: Eastern Europe and the For-mer Soviet Union in International Trade. Washington, DC: World Bank.
———. 2005c. “Uzbekistan: Public Expenditure Review.” World Bank Report31014-UZ, World Bank, Washington, DC.
———. 2006. Migration and Remittances in Eastern Europe and the Former SovietUnion. Washington, DC: World Bank.
———. Forthcoming a. The Path to Prosperity: Productivity Growth in EasternEurope and the Former Soviet Union. Washington, DC: World Bank.
———. Forthcoming b. Productivity Growth, Job Creation, and DemographicChange in Eastern Europe and the Former Soviet Union. Washington, DC:World Bank.
Yemtsov, Ruslan, Stefania Cnobloch, and Cem Mete. 2006. “Evolution of thePredictors of Earnings during Transition.” World Bank, Washington, DC.
chaw_ref_263-271.qxd 5/31/07 2:52 PM Page 271

Eco-AuditEnvironmental Benefits Statement
The World Bank is committed to preserving endangered forestsand natural resources. The Office of the Publisher has chosen toprint From Red to Gray on recycled paper with 25 percent post-consumer waste, in accordance with the recommended standardsfor paper usage set by the Green Press Initiative, a nonprofit programsupporting publishers in using fiber that is not sourced from endan-gered forests. Using this paper, the following were saved: 11 trees,7 mil. BTUs of energy, 1,197 lbs. CO2 equivalent greenhouse gases,3,924 gals. of waste water, 649 lbs. of solid waste. For more infor-mation, visit www.greenpressinitiative.org.
chaw_green_page.qxd 5/31/07 2:50 PM Page 272