from the collapse of socialism to the crisis of … · from the collapse of socialism to the crisis...
TRANSCRIPT

FROM THE COLLAPSE OF SOCIALISM
TO THE CRISIS OF CAPITALISM
Experiences of Central and Eastern
European Countries
19 th Conference on Alternative Economic Policy in Europe
London, 20-22 September 2013
Jože Mencinger, PF UL and EIPF
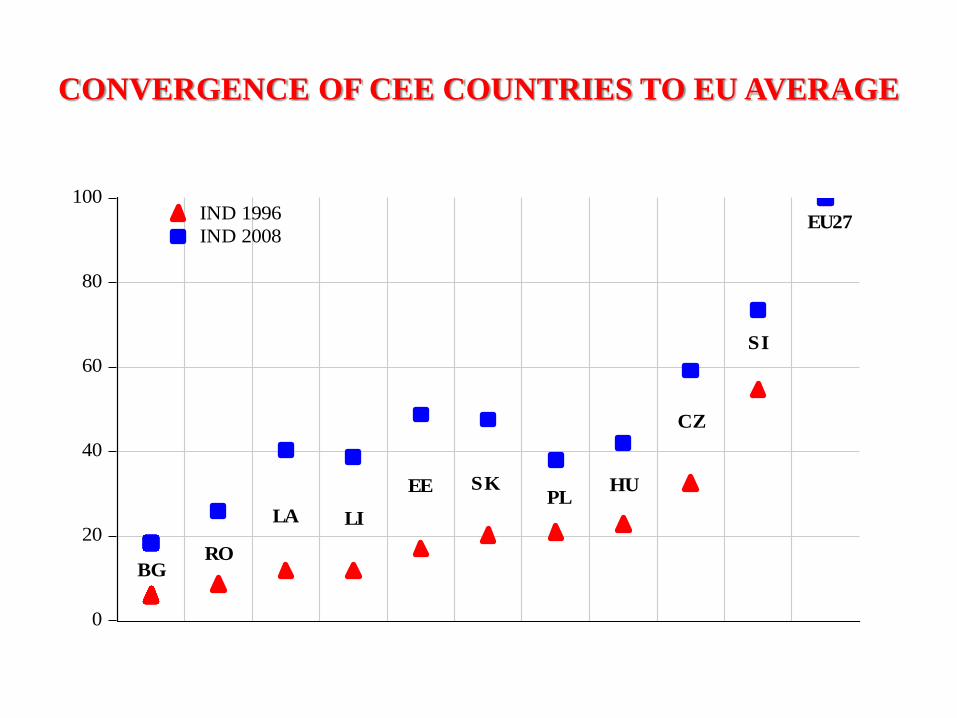
CONVERGENCE OF CEE COUNTRIES TO EU AVERAGE
0
20
40
60
80
100IND 1996
IND 2008
BGRO
LA LI
EE SKPL
HU
CZ
SI
EU27

LONG RUN DEVELOPMENT OF CEE
COUNTRIES
90
100
110
120
130
140
150
160
170
180
96 97 98 99 00 01 02 03 04 05 06 07 08 09 10 11 12 13 14
EU15
CEE
index
1996=100

CEE COUNTRIES AT THE END OF “GOLDEN ERA”
2007 or 2008
Popula-
tion,
millions
GDP/
Capita
€
Unemp
rate
%
Export/
GDP
ratio
Export/
Capita
€
Current
Account
%GDP
Net
Financia
Position
% GDP
Budget
Balance
% GDP
Public
debt
% GDP
Credits
GDP
ratio
Czech R 10.3 13100 5.3 0.69 9600 -3.3 -36.6 -9.6 28.7 0.72
Estonia 1.34 10300 4.7 0.51 6310 -17.3 -75.0 2.5 3.4 -
Latvia 2.28 8200 6.0 0.30 3030 -22.9 -70.6 -0-3 9.7 1.15
Lithuania 3-38 7900 4.3 0.44 4770 -13.7 -49-9 -1.0 7.31 0.71
Hungary 10.1 9300 7.4 0.68 7340 -4.4 -109.9 -4.9 66.0 0.81
Poland 38.1 8100 9.6 0.32 3040 -3.7 -45.9 -1.9 45.2 0.59
Slovakia 5.40 11700 11.1 0.76 8950 -5.7 -49.7 -1.9 29.4 0.56
Slovenia 2.02 17300 4.9 0.59 11500 -4.9 -21.9 -0.1 24.1 1.09
Bulgaria 7.70 4000 6.9 0.40 1990 -21.5 -113.3 1.1 18.2 0.85
Romania 21.5 5800 6.4 0.24 1560 -14.1 -45.8 -2.5 13.0 0.53
EU15 330 27200 7.2 - - - - -0.7 66.3 -
EU27 501 23600 7.1 - - - - -0-9 59.0 -

THE DEPENDENCE OF CEE ON EU15
-12
-8
-4
0
4
8
2001 2002 2003 2004 2005 2006 2007 2008 2009 2010 2011
CEE
EU15
%
-12
-8
-4
0
4
8
12
2001 2002 2003 2004 2005 2006 2007 2008 2009 2010 2011
%
CEE
EU15
-40
-30
-20
-10
0
10
20
30
2001 2002 2003 2004 2005 2006 2007 2008 2009 2010 2011
CEE
EU15
%
-20
-10
0
10
20
30
2001 2002 2003 2004 2005 2006 2007 2008 2009 2010 2011
%
CEE
EU15
GROSS DOMESTIC PRODUCT
HOUSEHOLDS CONSUMPTION
INVESTMENTS DEMAND
EXPORTS

ECONOMIC PERFORMANCE AND SOCIAL COHESION
OF EU STATES
78
80
82
84
86
88
90
92
94
50 55 60 65 70 75 80
DK
NL
SE
UK
CY
FI
DE
F
LU
CS
AT
HU
BE LT
PL
PTIESK
EE
GR
LA
ES IT
employment rate
Slovenia
100- risk of
poverty rate

RANKING OF CEE COUNTRIES BY SOME RATING
INSTITUTIONS
Heritage
Foundation
Index
178 countries
Fraser
Freedom
Index
141 countries
WEF
Index
139 countires
ECI
Index
128 countries
HDI
Index
179 countries
Czech Republic 70.4 (3) 7.13 (6) 4.57 (2) 1.63 (1) 0.865 (2)
Estonia 75.2 (1) 7.52 (2) 4.61 (1) 0.79 (7) 0.835 (3)
Latvia 65.8 (6) 6.92 (9) 4.14 (9) 0.59 (9) 0.805 (8)
Lithuania 71.3 (2) 7.40 (4) 4.38 (5) 0.68 (8) 0.810 (7)
Hungary 66.6 (5) 7.52 (3) 4.33 (6) 1.43 (3) 0.816 (5)
Poland 64.1 (10) 70.0 (8) 4.51 (3) 1.02 (5) 0.813 (6)
Slovakia 69.5 (4) 7.56 (1) 4.25 (7) 1.38 (4) 0.834 (4)
Slovenia 64.6 (9) 6.78 (10) 4.42 (4) 1.52 (2) 0.884 (1)
Bulgaria 64.9 (7) 7.34 (5) 4.13 (10) 0.59 (10) 0.771 (10)
Romania 64.7 (8) 7.08 (7) 4.16 (8) 0.94 (5) 0.781 (9)
Values of Heritage Foundation index are between 89 and 22, Fraser index between 9.01 and 4.06, WEF between 5.63
and 2.73, ECI index between 2.31 and 0.19, HDI between 0.94 and 0.34; in bracquests position among CEE
countries.
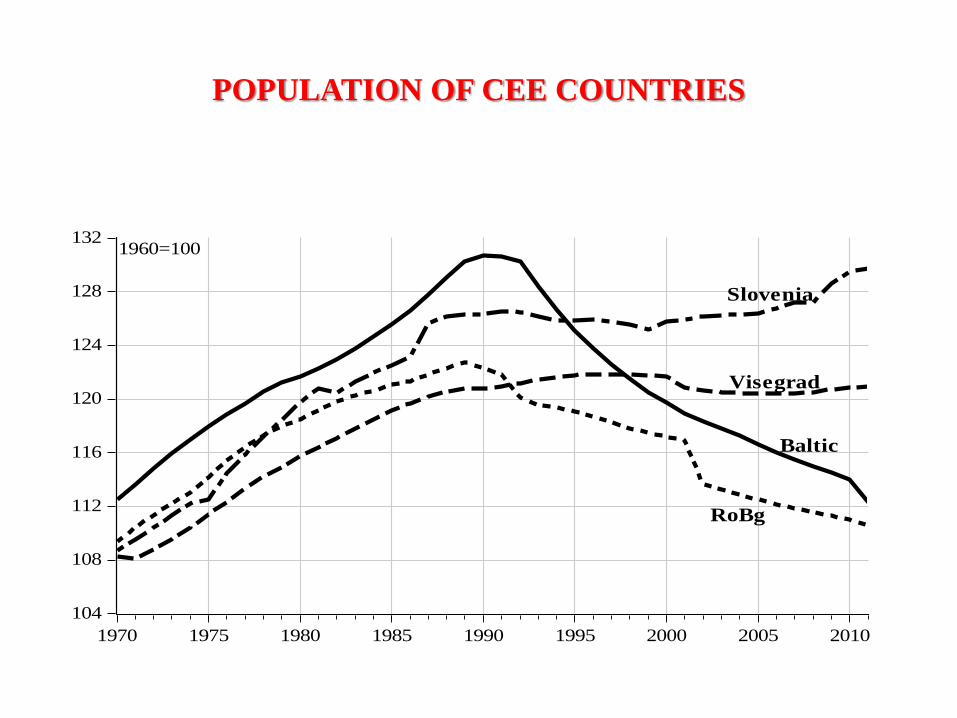
POPULATION OF CEE COUNTRIES
104
108
112
116
120
124
128
132
1970 1975 1980 1985 1990 1995 2000 2005 2010
Baltic
RoBg
Visegrad
Slovenia
1960=100
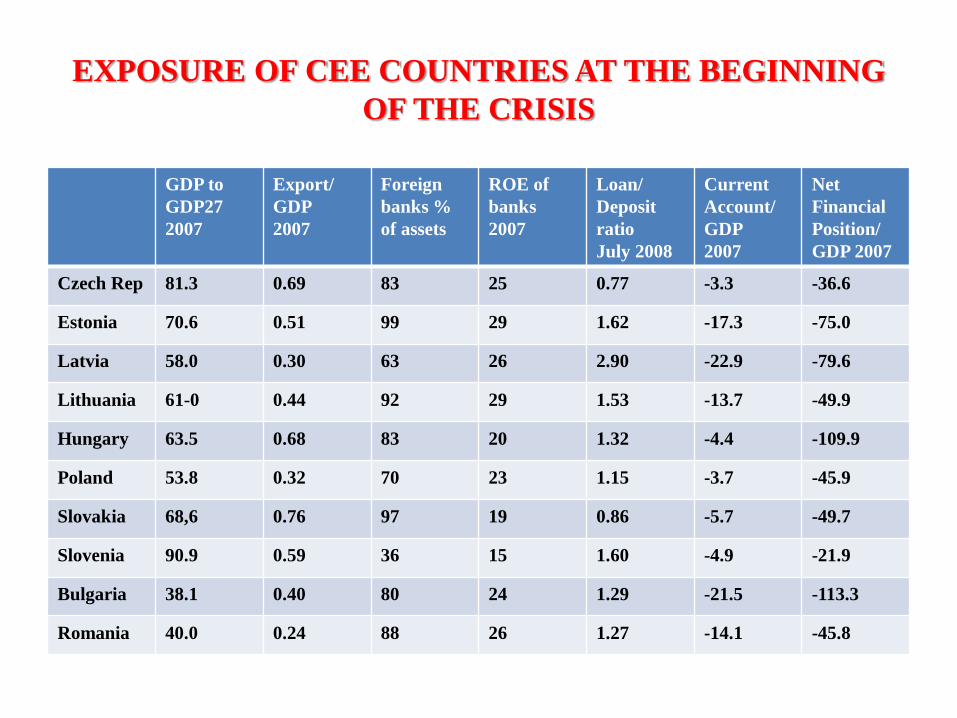
EXPOSURE OF CEE COUNTRIES AT THE BEGINNING
OF THE CRISIS
GDP to
GDP27
2007
Export/
GDP
2007
Foreign
banks %
of assets
ROE of
banks
2007
Loan/
Deposit
ratio
July 2008
Current
Account/
GDP
2007
Net
Financial
Position/
GDP 2007
Czech Rep 81.3 0.69 83 25 0.77 -3.3 -36.6
Estonia 70.6 0.51 99 29 1.62 -17.3 -75.0
Latvia 58.0 0.30 63 26 2.90 -22.9 -79.6
Lithuania 61-0 0.44 92 29 1.53 -13.7 -49.9
Hungary 63.5 0.68 83 20 1.32 -4.4 -109.9
Poland 53.8 0.32 70 23 1.15 -3.7 -45.9
Slovakia 68,6 0.76 97 19 0.86 -5.7 -49.7
Slovenia 90.9 0.59 36 15 1.60 -4.9 -21.9
Bulgaria 38.1 0.40 80 24 1.29 -21.5 -113.3
Romania 40.0 0.24 88 26 1.27 -14.1 -45.8

PERFORMANCE IN THE CRISIS
-4
0
4
8
12
16
-10 0 10 20 30 40 50 60 70
change in debt, 2008-2011
ch
an
ge i
n u
nem
plo
ym
en
t 2
008
-20
11
%
% Greece
Spain
Ireland
Germany
Sweden
Portugal
UK
Slovenia
BG
Estonia
LA
LT
CY
RO
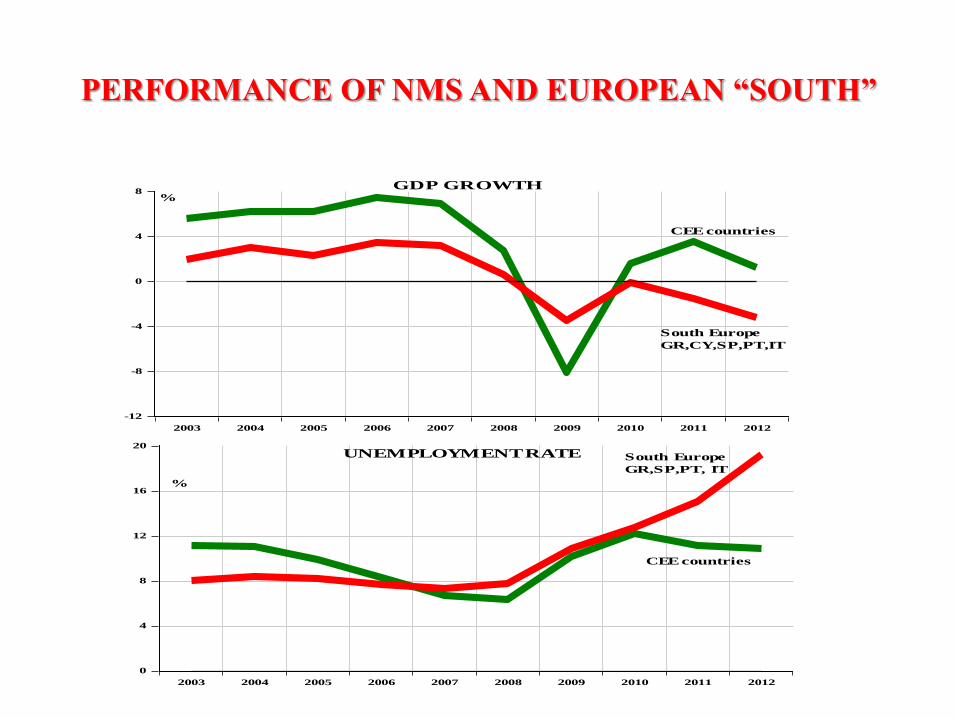
PERFORMANCE OF NMS AND EUROPEAN “SOUTH”
-12
-8
-4
0
4
8
2003 2004 2005 2006 2007 2008 2009 2010 2011 2012
CEE countries
%
0
4
8
12
16
20
2003 2004 2005 2006 2007 2008 2009 2010 2011 2012
CEE countries
South Europe
GR,SP,PT, IT
South Europe
GR,CY,SP,PT,IT
%
GDP GROWTH
UNEMPLOYMENT RATE
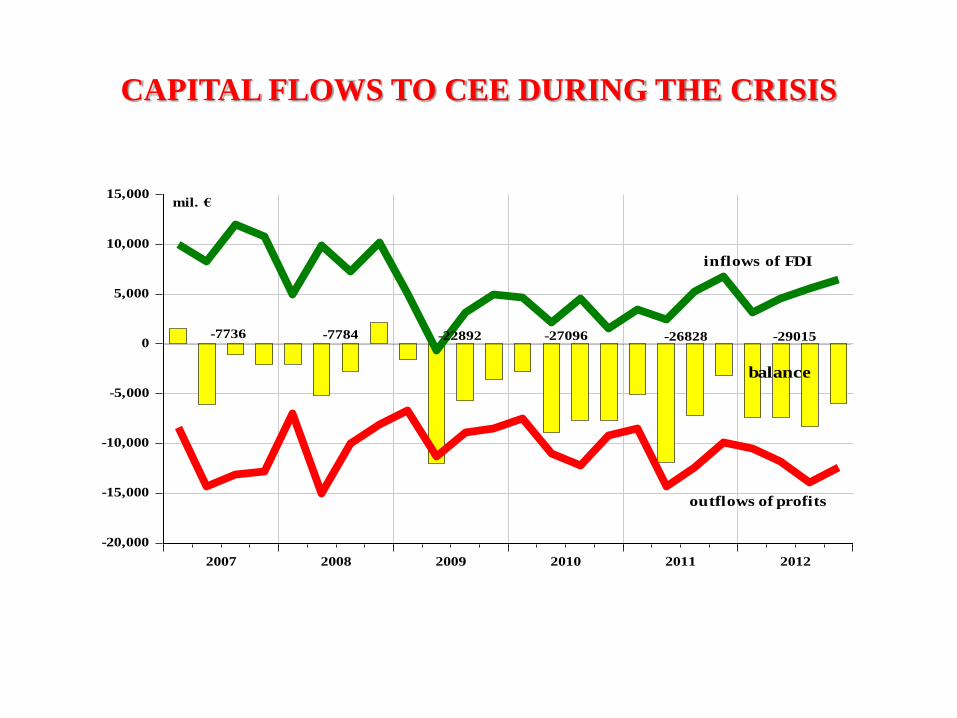
CAPITAL FLOWS TO CEE DURING THE CRISIS
-20,000
-15,000
-10,000
-5,000
0
5,000
10,000
15,000
2007 2008 2009 2010 2011 2012
-7736 -7784 -22892 -27096 -26828 -29015
mil. €
inflows of FDI
outflows of profits
balance

RECOVERY BY EXPORTS
EU27, “SOUTH”, NMS
-30
-20
-10
0
10
20
30
40
2008 2009 2010 2011 2012 2013
NMS
EU27
"SOUTH"
%
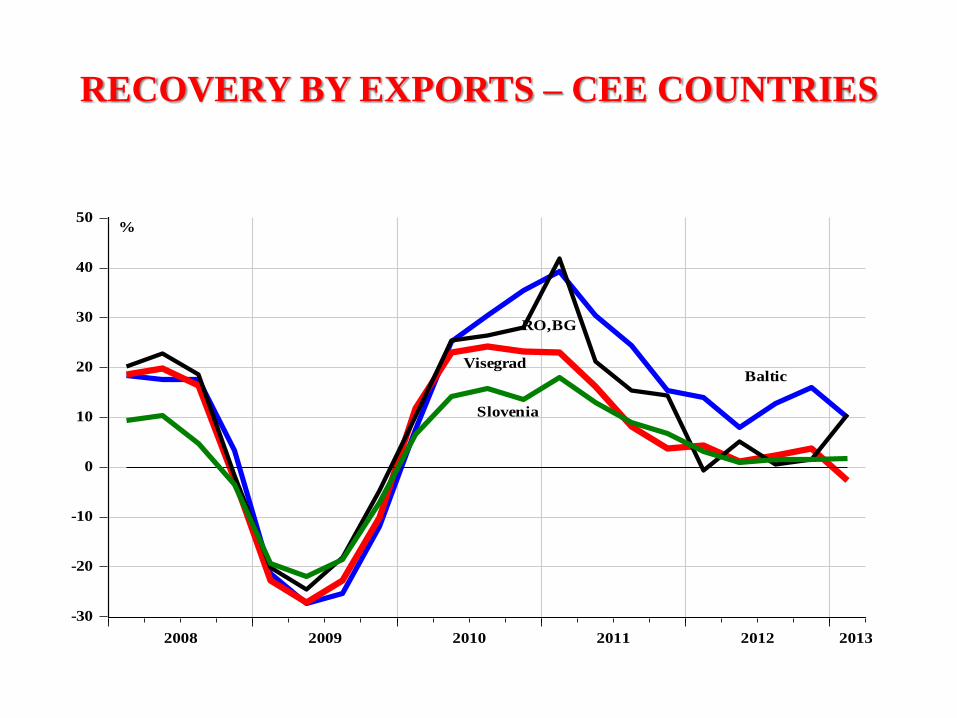
RECOVERY BY EXPORTS – CEE COUNTRIES
-30
-20
-10
0
10
20
30
40
50
2008 2009 2010 2011 2012 2013
Baltic
RO,BG
Visegrad
Slovenia
%

THE OUTCOME OF CASINO CAPITALISM IN
SLOVENIA
8,000
12,000
16,000
20,000
24,000
28,000
32,000
2004 2005 2006 2007 2008 2009 2010 2011
0.8
0.9
1.0
1.1
1.2
1.3
1.4
1.5
1.6
1.7
2004 2005 2006 2007 2008 2009 2010 2011
2,000
4,000
6,000
8,000
10,000
12,000
14,000
2004 2005 2006 2007 2008 2009 2010 2011
-2,000
0
2,000
4,000
6,000
8,000
10,000
12,000
2004 2005 2006 2007 2008 2009 2010 2011
mil. €
mil. € CREDITS AND DEPOSITS LOANS/DEPOSITS RATIO
SBI INDEX NET FOREIGN DEBT
credits
deposits