from there to back again?: australian inflation and
TRANSCRIPT

Department of the Parliamentary Library
;&
•"4>.).f~~~#Parliamentary
Research
Service
v"
BACKGROUND PAPER
No.9 1994
From There to Back Again?:Australian Inflation and Unemployment
1964 to 1993
.-.1'i'l:'r+i/:'.
Parliament of the Commonwealth of Australia
.. ,..r:-. r:~r---sr--rr-J;_. .... ._. .- -.-jj;~:;?i;;;~ ~. ~L_. __ .a...:..a__" ~-'-"_. "_ .....-r.,' --- --,.;.. __. .1Jnt__ _ "" _ ,i '*%• • 1111 "'l. ,

ISBN 1037-2938
Copyright Commonwealth of Australia 1994
Except to the extent of the uses permitted under the CopyrighlAct 1968, no part of this publication maybe reproduced or transmitted in any form or by any means including information storage and retrievalsystem, without the prior written consent of the Department of the Parliamentary Library, other thanby Members of the Australian Parliament in the course of their official duties.
Published by the Department of the Parliamentary Library, 1994

·Michael WarbyStatistics Group
9 June 1994
ParliamentaryResearch Service
Background Paper Number 9 1994From There to Back Again?:
Australian Inflation andUnemployment 1964 to 1993
Telephone: 062772485Facsimile: 06 2772454

AcknowledgmentsBob Bennett, Marco Bini, Phil Hanratty, Keith Hughes, Kim Jackson, Stephen O'Neill and June
Verrier all provided helpful comments and information. Sandra Bailey was (once again) amazinglypatient with the tables, the formatting and the page numbering.
This paper has been prepared for general distribution to Members of the Australian Parliament.Readers outside the Parliament are reminded that this is not an Australian Government doCUment, buta paper prepared by the author and published by the Parliamentary Research Service to contribute toconsideration of the issues by Senators and Members. The views expressed in this Paper are those ofthe author and do not necessarily reflect those of the Parliamentary Research Service and are not tobe attributed to the Department of the Parliamentary Librsty.
"

CONTENTS
EXECUTIVE SUMMARY 1
List of Abbreviations . . . . . . . . . . . . . . . . . . . . . . . . . . . . 3Glossary 3List of Tables and Graphs 4
INTRODUCTION 5
MACROECONOMIC GOALS 6
ECONOMIC INSTITUTIONS 6
INFLATION AND UNEMPLOYMENT 1964·1993 9
1964-1970: Managing Prosperity. . . . . . . . . . . . . . . .. . 91971-1975: Stagflation Arrives 111976-1980: Fighting Inflation First 121981-1983: Unemployment Surges 121984-1987: Inflation or Unemployment? 141988-1993: Low Inflation Returns 14The Phillips Curve 16
Short Run and Long Run . . . . . . . . . . . . . . . . . . . . . . . .. 18NAIRU \ 19
THE LABOUR MARKET 1966-1994 20
What is Unemployment? 20Labour Cost and Aggregate Demand 31Market Regulation and Intervention 35Technological Change 36Capital Shortage 37
CONCLUSION 41
APPENDIX:INCOME SUPPORT AND DEREGULATION 42
Regulatory Cost Shortfall 42Direct Income Support . . . . . . . . . . . . . . . . . . . . . . . . . . . . . . 42
REFERENCES 46

From There to Back Again? 1
Executive Summary
Having both low inflation and low unemployment would generally beregarded as good macroeconomic outcomes for Australia.Unfortunately, Australia has not managed this double since the veryearly 1970's.
Recent success against inflation,
Australia has achieved 10 consecutive quarters where the annualinflation rate, as measured by the Consumer Price Index (CPl),was less than 2.5%,
has not been matched by success against unemployment. On thecontrary, unemployment is at levels not experienced in a sustainedway since the 1930's.
By mapping together Australia's annual inflation and unemploymentexperience from 1964, the economic history of Australia over thatperiod can be broken up into macroeconomic "episodes", charting thedifferent circumstances public policy has confronted.
It also allows discussion of the "Phillips Curve", originally anapparent "trade-off' between unemployment and inflation. Thehistorical evidence for Australia
suggests that there have been periods· when such a trade-offexisted
• also clearly shows there have been other periods when one or ~
both increased without any compensating decrease in the other.
The positive implication from this is the possibility of breaking outof the apparent constraint involved in such a trade-off and achievingboth low inflation and low unemployment.
The Paper also provides a discussion, aimed at a lay audience of theso-called "natural rate of unemployment", more precisely known asthe Non-Accelerating Inflation Rate of Unemployment (or NAIRU).
Success against inflation leads naturally to increased attention onunemployment. Development of effective policy to deal withunemployment requires a good understanding of the history andstructures of the Australian labour market. By looking at aggregatequarterly labour supply (participation), labour demand (employment),real wages and demand for goods and services for the period August1966 to March 1994 certain patterns can be identified

2 From There to Back Again?
the employment to population ratio and the participation ratehave been used as indicators oflabour demand and labour supplyin order to abstract away from population increase
the major sign ofdeteriorating labour market performance inAustralia has been the fall in the employment/populationratio since 1974
it is not growth in labour supply but a deterioration inthe demand for labour (relative to the population) whichhas led to mass unemployment.
The evidence suggests (unsurprisingly) that changes J-n real wagesout of step with changes in demand for goods and services can havemajor effects on the Australian labour market
in the mid 1970's and early 1980's, increases in real wageswithout matching increases in demand for goods and serviceslead to falls in labour demand and sharp increases inunemployment
in the mid to late 1980's, increases in demand for goods andservices with little or no increases in real wages lead to increasesin labour demand and significant declines in unemployment
the recent recession has been marked by a sharp decline indemand for goods and services but mild increases in real wagesleading to another bout of decreased labour demand and sharpincreases in unemployment.
~ This suggests that Australia's labour market institutions have apersistent tendency to produce wage outcomes at variance.withdemand conditions
this variance allowed considerable employment growth in the midto late 1980's but has been deleterious at other times.
The Paper contains an Appendix which attempts to estimate theextra expenditure on labour needed to employ all the currentlyunemployed at the level specified by a current minimum federalaward and the fiscal cost of providing equivalent earned income "topups" in a deregulated labour market.
..

From There to Back Again? 3
List of Abbreviations
CPI - Consumer Price Index
GNE - Gross National Expenditure
HDI - household disposable income
WSE - wage and salary earner
WSS - wages, salaries and supplements
Glossary
Aggregate demand - total demand for goods and services.
Demand shock - sudden change in the level of demand for goods andservices.
Gross National Expenditure - total expenditure on goods and servicesin Australia. Does not include exports but does include imports.
Economic shock - sudden change in economic circumstances.
Employment /population ratio - proportion ofcivilian population aged15 years or in employment.
,""
Labour force - the employed plus the unemployed.
-c·" National turnover ofgoods and services - gross national expenditureplus exports of goods and services. Total expenditure on goods andservices produced and/or sold in Australia.
Participation rate - proportion of civilian population aged 15 years orover either in employment or looking for work.
Real growth - growth after discounting for the effect of inflation.
Supply shock - sudden change in inputs to production of goods andservices.
Unemployment rate - proportion of labour force not in employmentand looking for work.

4 From There to Back Again?
List of Tables and Graphs
Table A:
Table B:
Unemployment, Inflation and HouseholdDisposable Income, Australia, 1964 to 1993 ..... 7
Participation Rates(a) Quarterly,August 1966 to March 1994, (%CPop) 22
Table Cl: Employment and Civilian Population(a)Quarterly, August 1966 to June 1993 25
Table C2: EmploymentJPopulation Ratios Quarterly,August 1966 to June 1993, (% CPop) 28
Table D: Real Wages and Real Demand Per CapitalJuly 1966 to December 1993, Trend " 38
Table El: Distribution of Earnings and Hours,All Employees August 1993 44
Table E2: Hourly Rates 45
Graph 1: From Prosperity to Stagflation, 1964 to 1975 ... 10
Graph 2: Fight Inflation First, 1976 to 1980 " 13
Graph 3: Unemployment Surges, 1981 to 1983 .. . . . . . .. 13
Graph 4: Inflation or Unemployment?, 1984 to 1987 . . . .. 15
.Graph 5: Low Inflation Returns, 1988 to 1993 15·
Graph 6: Inflation and Unemployment, 1964 to 1993 17
Graph 7:
Graph 8:
Labour Supply and Demand, TrendQuarterly, July 1966 to March 1994 . . . . . . . . . . 21
Employment, Real Wages & Real Demand, Trend,Quarterly, July 1966 to March 1994 . . . . . . . . . . 33

From There to Back Again? 5
Introduction
Having both low inflation and low unemployment would generally beregarded as good macroeconomic outcomes for Australia.Unfortunately, Australia has not managed this double since the veryearly 1970's.
Recently, Australia has achieved 10 consecutive quarters where theannual inflation rate, as measured by the Consumer Price Index(CPl), was less than 2.5%, the lowest level of inflation since the1960's.
This success against inflation has not been matched by successagainst unemployment. On the contrary, unemployment is at levelsnot experienced in a sustained way since the Great Depression of the1930's.
This Paper maps Australia's inflation and unemployment experiencesince 1964 (the earliest year from which reasonably reliable andconsistent labour market statistics are available) as a convenient wayof breaking up the macroeconomic history of Australia into distinctepisodes. It then goes on to discuss the overall performance of theAustralian labour market since 1966 in more detail.
'\. ~ .-

6 From There to Back Again?
Macroeconomic Goals
Growing incomes, plenty of jobs, stable prices. If the Australianeconomy produced these things in a reliable and sustainable way,that would be very widely regarded as an excellent framework toachieve individual and other social goals.
Unfortunately, as Table A indicates, the Australian economy has notbeen reliably producing all three outcomes for many years - not sincethe late 1960's.
Looking at Table A, we can see the surge in inflation in the early1970's and the subsequent surge in unemployment beginning in 1974
indeed, by earlier standards, Australia has been experiencingmass unemployment since late 1974.
As is unsurprising, higher levels of unemployment have beenassociated with lower levels of real growth in household disposableincome per capita.
As the section on Inflation and Unemployment 1964-1993 belowshows, Australian economic history since 1964 can be betterunderstood as being a series of "macroeconomic episodes". These areillustrated graphically by mapping Australia's inflation andunemployment performance together. These "episodes" are often setoff by demand or supply "shocks" - sudden changes in economicconditions
the ability to cope with such sudden changes are one of thetesting characteristics of economic and social institutions
as changes, both gradual and sudden, are inevitable, it is animportant virtue of social and economic institutions that theybe able to cope effectively which such shifts.

From There to Back Again? 7
Table A: UNEMPLOYMENT, INFLATION AND HOUSEHOLDDISPOSABLE INCOMEAustralia, 1964 to 1993
Unemployment Real growth inCPI Rate HDI per capita
(%pa) (%LF) (%)
1964 2.1 1.4 4.61965 4.1 1.3 0.21966 2.6 1.6 2.11967 3.2 1.9 3.41968 3.1 1.9 2.11969 3.0 1.8 4.0
1970 3.5 1.6 2.41971 5.7 1.9 2.61972 6.5 2.6 3.71973 9.1 2.3 8.61974 15.3 2.7 3.21975 15.3 4.9 2.1
1976 13.2 4.8 -1.71977 12.3 5.7 -1.21978 7.9 6.5 2.21979 9.1 6.3 3.01980 10.0 6.1 0.4
.\1981 9.7 5.8 1.41982 11.2 7.2 -0.61983 10.1 10.0 0.4
';:;< 1984 3.9 9.0 3.21985 6.8 8.3 1.01986 9.1 8.1 -0.61987 8.5 8.1 -0.4
1988 7.0 7.2 3.21989 7.8 6.2 4.01990 7.3 6.9 1.7
·1991 3.2 9.6 -1.71992 1.0 10.8 1.51993 1.8 10.9 0.1
HDI - household disIXlsable income.
Sources: ABS Cat. Nos 3101.0, 3102.0, 5206.0, 6203.0, 6401.0.

8 From There to Back Again?
Economic Institutions·
When economists talk of economic institutions, they do not only mean individualorganisations, they also mean enduring structural features of an economy. Thuslaws and cultural attitudes are parts of the institutional structure of an economy.
In the following sections, references to Australia's "economic institutions" meanprimarily its labour market institutions such as:
arbitration systems and awards
• other industrial relations and labour laws
tax systems
other labour costs, such as worker's compensation
income support arrangements, particularly for unemployed
firm structure, size and management culture
union structure, size and culture.
In examining how well such institutions function, particularly how well they copewith external pressures and changing circumstances, questions such as
• how they affect the cost oflabour, its availability, its skill levels
whether they encourage/discourage efficient use of capital
whether they encourage cooperative or adversarial behaviour within firms
• whether management is effective, innovative, outward looking
whether unions are "inclusive" (i.e. consider interests of broad groups ofworkers, or interests broadly) or "exclusive" (i.e. consider only narrowinterests)
are all of considerable importance.

From There to Back Again? 9
Iilflation and Unemployment 1964-1993
If two variables are plotted against each other in a graph with two axes, one foreach variable, then, if there is a relationship between the variables, a patternshould emerge on the plot
a vertical or horizontal line suggests no direct connection (as one variable canshift without the other altering)
a diagonal line suggests a direct relationship
a line which slopes from the top left down to the bottom right suggests a"trade-off' relationship
i.e. more of one means less of the other
a line which slopes from the bottom left up to the top right suggests amutually supporting relationship
i.e. more of one means more of the other and vice versa.
As we see below, the relationship between unemployment and inflation inAustralia is a highly variable one - sometimes there does appear to be an apparentrelationship, at other times there appears to be no relationship at all.
1964-1970: Managing Prosperity
Graph No.1 actually covers two episodes. The first is the period 1964-70. Duringthis period Australia suffered no demand or supply "shocks": no sudden large-scaleeconomic changes. Economic policy had the enviable task of"managing prosperity"without having to cope with sudden changes. During this period, inflation andunemployment were both low and there was no obvious relationship between thetwo.

Graph No 1
From Prosperity to Stagf~ation
Inflation and Unemployment, 1964 to 1975......
16 - - 16 01974 1975
~~
14 - , -14 ~~~
0
til12 - - 12 '"'"".
+-~C
QJ -.;:sU 10- -10 .'"
L 1973QJ
0..8- \ -8.
c0.-+- 6- 1971~ -60
-'l-
C-~ J,::~ /1970 -4
19671968
19692 - '1966 -2
1964 Sources: ABS Cat Nos 6203.0, 6401.0.
0- I I I I I I I I I -02 3 4 5 6 7 8 9 10
Unemployment, Per Cent

From There to Back Again? 11
1971-1975: Stagflation Arrives
The second period covered by Graph No.1 is the period 1971-1975,when there was an unambiguous deterioration in Australia's inflationand unemployment performance. From 1970 to 1974, inflationincreased dramatically (from 3.5% p.a. to 15.3% p.a.), withunemployment going up only slightly (from a rate of 1.6% to 2.7%).However, from 1974 to 1975 unemployment suddenly shot up (to4.9%). Australia's twenty year (so far) departure from fullunemployment had begun.
During this period, Australia suffered both demand and supplyshocks. A surge in wages and government expenditure pushed updemand. In 1973, the first "Oil Shock" hit with the OPEC boycott andaccompanying dramatic rise in the price of oil. This "supply shock"led to an international recession and a drop in demand for Australia'sexports. Both the use of monetary expansion to fund increasedCommonwealth expenditure and the surge in demand fosteredinflation. The credit squeeze which followed this monetary blow-outthen discouraged demand. The surge in wages raised the cost oflabour, discouraging employment. The drop in demand from theinternational recession and domestic credit squeeze translated thisinto mass unemployment.
During the 1971-1975 period, Australia's public policy and labourmarket institutions generated a series of internal "shocks" to theAustralian economy while coping poorly with external shocks. Therewas still no sign of any clear relationship between inflation andunemployment. Australia simply achieved much more of both.
.", ,

12 From There to Back Again?
1976·1980: Fighting Inflation First
During the period 1976-1980, a relationship between inflation andunemployment emerged (Graph No.2). Success in reducing inflationwas matched by higher rates ofunemployment. Lower unemploymentwas accompanied by higher inflation.
While there was not the unambiguous deterioration in inflation andunemployment performance of the 1970-1975 period, Australia'sinflation and unemployment performance remained poor. The publicpolicy emphasis, in the absence of any clear program of institutionalreform, on "grinding down" inflation was hardly an unambiguoussuccess, as unemployment was tending to "grind up" as inflation"ground down". By 1980, Australia had 10% p.a. inflation and 6%unemployment rate. Not a good outcome, particularly by the,standards of 10 years earlier.
A sign of the deterioration in the Australian labour market was thatthe participation rate - the proportion of the civilian population aged15 or over in work or looking for work - began to fall after a periodof continuous growth (see Graph 7 below).
1981-1983: Unemployment Surges
The period 1981 to 1983 saw another unambiguous deterioration inAustralia's inflation and unemployment performance (Graph No.3).Unemployment increased dramatically with no improvement ininflation. The apparent "trade-off' between unemployment andinflation seen earlier had disappeared in the face ofanother round ofinternal and external economic "shocks".
The wage "break-out" of 1981-82 partly flowing from the expectationof a "resources boom" raised the cost of labour, discouragingemployment. It ran straight into the international recession resultingfrom the 1979 "Oil Shock". The combination of increased cost oflabour with a dramatic drop in demand resulted in theunemployment rate increasing dramatically to a post-GreatDepression record.
Once again, Australia's public policy and labour market institutions'had coped badly with economic shocks.

From There to Back Again? 13
Graph No 2
Fighting Inflation FirstInflation and Unemployment, 1976 to 1980
16 - -161976
14 - 1977 -14
~
12 - - 12l:.,1980
U197910 - - 10L. 1978.,
ll.8- -8
l:.~ 6- -6~
0...l: 4- -4
2- Sources: ASS Cat Nos 6203.0, 6401.0. -2
O- J I J I I I I I I -02 3 4 5 6 7 8 9 10
Unemployment, Per Cent,.,:'
Graph No 3,'-',
Unemployment SurgesInflation and Unemployment, 1981 to 1983
16 - -16
198214 - -14
1983~
12 - 1981 - 12l:.,U
... 10 - ~ - 10.,ll.
8~ -8l:.~ 6- -6~
0...l: 4- -4
2- Sources: ASS Cat Nos 6203.0, 6401.0. -2
0- I I I I I I I I I -02 3 4 5 6 7 8 9 . 10
Unemployment, Per Cent

14 From There to Back Again?
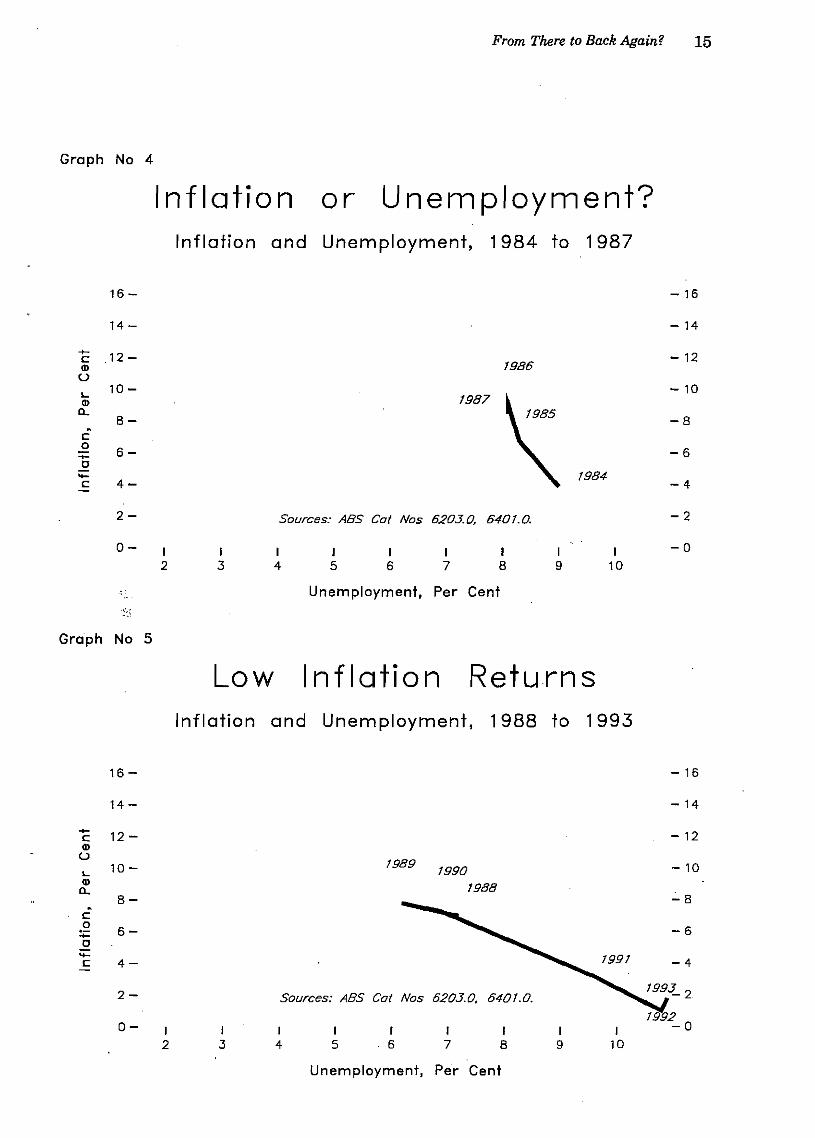
1984-1987: Inflation or Unemployment?
The drop in demand from the severe recession, aided by the wagefreeze, provided a low inflation (4%) outcome in 1984. Over the next3 years, inflation resurged (to 8.5% p.a.) while unemploymentdropped back (to 8.1%) (Graph No.4)
• annual inflation rose by four percentage points whileunemployment fell by one percentage point.
Despite significant employment growth over the period, massunemployment appeared to be entrenched.
1988-1993: Low Inflation Returns
In 1987-1989, there was a sudden breakthrough in employment(Graph No.5). Unemployment dropped to 6% with very little changein inflation which remained at the 7-8% p.a. level.
Then came recession. Unemployment surged up to a new postDepression record. However, unlike the previous major recession of1982-83, inflation dropped dramatically and stayed low. At the endof the period, inflation is at levels not seen in Australia since the1960's.
Australia has taken over twenty years to get back to low inflation.Unfortunately, in doing so, unemployment has blown out to a rate ofover 10%.·
From There to Back Again? 15
Inflation and Unemployment, 1988 to 1993
16 - -16
14 - -14
- 12 - -12cQ)
U19B9
L. 10 - 1990 - 10Q)
19BBc..8- - -8
c.~ 6- --..... -6-0..... -............ 1991c 4- -4
2- Sources: ASS Cot Nos 6203.0. 6401.0.
~20- I I I I I I I I I -0
2 3 4 5 6 7 8 9 10
Unemployment, Per Cent

16 From There to Back Again?
The Phillips Curve
In 1958, New Zealand born, and later ANU resident, economist A. W.Phillips published a paper on unemployment rates and changes inmoney wages in the UK for period 1861 to 1957. From this paperdeveloped the "Phillips Curve", an apparent relation betweeninflation and unemployment. The idea behind the Phillips Curve,which came from empirical data rather than theoretical implications,was that less unemployment could be "purchased" by more inflationand vice versa. If unemployment and inflation were plotted on agraph, one axis of which was the inflation rate and the other was theunemployment rate, there appeared to be a curve which moved fromthe top left quadrant to the bottom right quadrant
Graphs 2, 4 and 5 display "Phillips Curves" of this type.
The Phillips Curve both provided an apparent policy opportunity
depending whether inflation or unemployment was regarded asa greater problem, policy makers could apparently get less ofonevia more of the other
and a policy constraint
if it held, one could not have less of both
nor more of both.
However, the Phillips Curve does not always hold
Graphs 1 and 3 display no signs of Phillips Curve behaviour forthose periods
and it proved eminently possible to have more of both (see Graph 1in particular). Even when it does hold, the evidence is that, inAustralia, it is easier to generate a higher rate of inflation than alower rate of unemployment.
Graph No.6 plots Australia's inflation and unemployment experiencefrom 1964 to 1993. It shows clearly Australia's movement over thirtyyears from low inflation and low unemployment to low inflation andhigh unemployment via a complicated path. The variable nature ofthe interaction between unemployment and inflation is quite clear
for the last 29 years, there has been an apparent trade-offbetween inflation and unemployment in 14 years and noapparent trade-off in 15 years.
While it is true the trade-off has been more frequent in later periods,it is also clear that the apparent trade-off is subject to sudden shifts,including disappearance. This does not make the "simple" PhillipsCurve a very reliable basis for public policy.

Graph. No 6 Inflation and UnemploymentAustralia, 1964 to 1993
16 - 1974 1975 - 16
14 - -141976
12 - - 121982+-
CQ)
U 10- 1986 -101981
I.- 1973Q)
CL-88-.
c0.-
+- 6- -6 ~0'+- ~C 1965
~4 ,970,967
-4 OJ8'
1968 r1969
2- 1966
~1964 Sources: ABS Cat Nos 6203.0, 6401.0. 1993~.
;:l...1992
0- I I I I I I I I I -0.....
2 3 4 5 6 7 8 9 10 -:J
Unemployment, Per Cent

18 From Thereto Back Again?
Short Run and Long Run
Economists nowadays talk of two Phillips Curve - the short runPhillips Curve, which applies until workers' expectations ofinflationbecome accurate - and the long run Phillips Curve - when workers'expectations of inflation are accurate.
If prices rise unexpectedly, real wages fall. The real cost of labourhas fallen, to employment can be expected to rise. So, unexpectedinflation
or inflation which wages do not adjust for
does allow the possibility of trading off inflation and unemployment
arguably, the decline in real wages in the early part ofthe Accordunderpinned the employment growth and Phillips Curve (seeGraph 4) of that period.
Similarly, ifprices do not rise by as much as expected in agreed wageincreases, then real wages will rise while inflation falls
again, there will be an apparent trade-off between higherunemployment and lower inflation.
Alternatively, if a tight monetary policy squeezes demand andinflation down, but wages do not adjust accordingly, thenunemployment can be expected to rise
again, there will be an apparent trade-off between higherunemployment and lower inflation
arguably, this is what happened when, from 1988, monetarypolicy was apparently targeted at reducing the CurrentAccount deficits, hence the Phillips Curve of that period (seeGraph 5). .
But suppose wages match the inflation rate. Then changes ininflation will be matched by changes in money wages. Real wageswill not change, so, unless there is a shift in demand for goods andservices, unemployment will not change, so the apparent trade-offbetween inflation and unemployment will disappear
i.e. there will be no "simple" (i.e. short run) Phillips Curve.
Instead, different levels of inflation will have the same level ofunemployment (unless other circumstances change)
unchanging unemployment for different levels of inflation (i.e. avertical line) is the long run Phillips Curve.

From There to Back Again? 19
NAIRU
These considerations have led economists to talk about the "NAIRU"or Non-Accelerating Inflation Rate of Unemployment (sometimes,rather misleadingly, known as the "natural rate of unemployment").The NAIRU is the rate of unemployment below which, given currentcircumstances and institutional arrangements, one cannot go exceptat the cost of increasing inflation
i.e. of having price rises higher than expected, so that real wagesfall.
Since expectations will adjus~ after a time, one has to keep "fooling"people about the increases in inflation to keep decreasingunemployment
• i.e. inflation must keep accelerating
because, once expectations "catch up" with inflation, unemploymentwill stabilise while, if expectations "overshoot" inflation
and money wages go up more than inflation
real wages will rise and unemployment, given a certain level ofdemand for goods and services, will increase.
But the NAIRU is not "set in concrete". It depends on theinstitutional and other arrangements operating in the economy. Thepositive side ofthe apparent unemployment-inflation trade-off beingpresent only part of the time is the possibility of achieving both lowinflation and low unemployment. In particular, changing institutionalarrangements so a lower level of unemployment is compatible withlow inflation. To put it another way, the Phillips Curve is about"demand side" constraints operating in given institutionalarrangements. "Supply side" policies aimed at changing the wayeconomic institutions function offer the possibility of achieving bothlow inflation and low unemployment.
Having achieved apparently stable low inflation, high unemploymentis the most obvious and immediate economic problem afflictingAustralia.

20 From There to Back Again?
The Labour Market 1966-1994
As we have seen, Australia is in the twentieth year of the systematic·poor performance (as indicated by persistent high unemployment) ofits labour market institutions. This poor performance well and trulypre-dates the economic policy changes of the 1980's: changes whichare best seen as a response to deteriorations in Australia's economicperformance.
What is Unemployment?
Unemployment is the excess of the supply oflabour over the demandfor labour. To put it another way, unemployment occurs when thenumber of people wanting to work exceeds the number ofjobs beingoffered.
Population growth provides a complicating factor. As the populationgrows, unless the proportion of those 15 or over employed or lookingfor work (i.e. the participation rate) falls, the supply of labour (Le.the number of people wanting jobs) increases. Thus populationgrowth means employment must increase merely for theunemployment rate not to go up.
In order to compensate for population growth, the following analysisis done in terms of the proportion of the civilian population 15 orover wanting jobs (the participation rate) and the proportion of thecivilian population 15 or over in employment (theemployment /population ratio). The former will be taken to representlabour supply, the latter labour demand.
Another complicating factor is changes in hours worked. It is possiblefor changes in labour demand to show up partly in hours worked more overtime as demand for goods and services pick up, less in thereverse case. For the sake of simplicity, this complication will beignored.
Graph No.7 graphs quarterly labour demand and labour supply overthe period July 1966 to March 1994. We can see clearly that it is nota ~owth in labour supply which has led to entrenched massunemployment, but a deterioration in demand for labour. TheAustralian economy's capacity to generate employment has clearlydeteriorated over the period.

Graph No 7
Labour Supply and DemandTrend, QuarterIYt",'Jttly 1966 to March 1994
- 60
- 58
- 64
r - 54
Part/c/pat/on Rate
Unemp/oyment
(Excess of supply over demand)
Emp/oyment/Popu/at/on Rat/o56 -
(Labour Demond)
58 -
co
62 -
64 -
co.-
+-o::::lQ..
o0...
I(J)
0...
+-C(J)
U
>U
+LO
54 - I I I I I I I I
0'0 10 1~ 1ll< 10 1'0 <00 'O~ <oll< <00 <0<0 gO g~
:,':/\ y.)0 yP yet' y:P y:P :,'00 :,'00 :,'00 :,'00 :,'00 :,'00 :,'00
Sources: ABS Cot Nos. 6203.0, 6204.0.

22 From There to Back Again?
Table B: PARTICIPATION RATES(a)Quarterly, August 1966 to March 1994, (O/oCPop)
Original TrendCh)Persons Males Females Persons Males Females
Sep 59.9 84.0 36.3 60.2 84.1 36.7Dec 60.1 83.7 36.8 60.2 84.0 36.8Mar67 60.6 84.4 37.2 60.2 83.9 37.0Jun 60.2 83.8 37.1 60.2 83.8 37.2Sep 60.1 83.5 37.2 60.4 83.8 37.4Dec 60.3 83.5 37.5 60.4 83.8 37.5Mar68 60.8 84.1 37.9 60.4 83.6 37.7Jun 60.5 83.5 37.9 60.5 83.5 37.9Sep 60.2 83.2 37.7 60.4 83.4 37.9Dec 60.2 83.0 37.8 60.4 83.4 37.9Mar69 60.9 83.9 38.4 60.5 83.3 38.0Jun 60.4 83.2 38.1 60.5 83.1 38.2Sep 60.2 82.7 38.1 60.6 83.0 38.5Dec 60.9 ·82.8 39.3 60.8 83.1 39.0
Mar70 61.4 83.8 39.4 61.1 83.3 39.3Jun 61.3 83.4 39.7 61.3 83.4 39.6Sep 61.2 83.1 39.6 61.5 83.3 40.1Dec 61.5 82.7 40.6 61.5 83.0 40.3Mar71 61.8 83.3 40.7 61.5 82.9 40.6Jun 61.8 83.1 40.8 61.6 82.9 40.7Sep 61.0 82.5 40.0 61.4 82.8 40.4Dec 61.1 82.4 40.2 61.1 82.6 40.0Mar72 61.5 83.1 40.2 61.1 82.6 39.8Jun 61.1 82.7 39.9 61.3 82.7 40.2Sep 61.3 82.5 40.6 61.6 82.8 40.9Dec 62.0 82.5 41.8 61.9 82.7 41.5Mar73 62.2 82.8 42.0 61.8 82.3 41.6Jan 61.5 82.1 41.3 61.7 82.2 41.6Sep 61.6 82.1 41.4 61.9 82.4 41.8Dec 62.1 82.2 42.4 62.1 82.4 42.2Mar74 62.6 82.6 43.0 62.2 82.2 42.6Jun 62.2 82.0 42.7 62.1 81.8 42.7Sep 61.4 81.0 42.2 62.0 81.5 42.8Dec 62.3 81.4 43.5 62.1 81.5 43.1

From There to Back Again? 23
Table B: PARTICIPATION RATES(a)Quarterly, August 1966 to March 1994, (%CPop) (Cont.)
Original Trend(h}Persons Males Females Persons Males Females
Mar75 62.6 82.0 43.5 62.1 81.5 43.3Jun 62.0 81.3 43.1 62.0 81.2 43.2Sep 61.6 80.5 43.0 62.2 81.0 43.8Dec 62.7 80.7 45.0 62.5 80.9 44.4Mar76 62.7 81.4 44.5 62.5 80.9 44.4Jun 62.2 81.0 43.8 62.1 80.7 43.8Sep 61.3 80.0 43.0 61.8 80.5 43.4Dec 61.5 80.2 43.2 61.7 80.4 43.3Mar77 62.4 80.9 44.3 62.0 80.4 43.9Jun 62.3 80.5 44.4 62.2 80.4 44.5Sep 61.8 79.8 44.2 62.0 80.2 44.4Dec 61.4 79.3 43.8 61.6 79.8 43.9Mar78 61.2 80.1 43.7 61.3 79.5 43.6Jun '61.2 79.0 43.8 61.1 79.1 43.7Sep 60.6 78.3 43.5 60.9 78.6 43.6Dec 60.9 78.6 43.7 60.7 78.5 43.5Mar79 60.8 78.9 43.3 60.7 78.5 43.4Jun 60.6 78.4 43.3 60.6 78.5 43.3Sep 60.5 78.1 43.4 60.7 78.4 43.6Dec 61.1 78.4 44.3 60.9 78.4 44.0
Mar80 61.2 78.6 44.3 61.1 78.3 44.4Jun 61.2 78.2 44.7 61.3 78.3 44.8Sep. 61.4 78.1 45.1 61.5 78.4 45.1Dec 61.4 78.4 45.0 61.3 78.3 44.8Mai81 61.2 78.7 44.3 61.2 78.3 44.6Jun 61.1 78.0 44.7 61.2 78.2 44.7Sep 61.1 77.9 44.9 61.2 78.0 44.9Dec 61.1 77.6 45.1 61.0 77.7 44.9Mar82 61.1 78.0 44.7 60.9 77.6 44.8Jun 60.6 77.2 44.6 60.7 77.4 44.6Sep 60.5 77.1 44.3 60.7 77.4 44.5Dec 61.0 77.5 44.9 60.8 77.4 44.7Mar83 60.7 77.3 44.5 60.5 77.0 44.6Jun 60.3 76.6 44.6 60.4 ·76.8 44.6Sep 60.3 76.5 44.6 60.4 76.6 44.7Dec 60.5 76.5 44.9 60.4 76.5 44.8Mar84 60.6 76.9 44.8 60.5 76.5 44.9Jun 60.7 76:3 45.5 60.7 76.5 45.3Sep 60.4 76.0 45.2 60.6 76.2 45.4Dec 60.5 75.8 45.7 60.5 75.8 45.6

24 From There to Back Again?
Table B: PARTICIPATION RATES(a)Quarterly, August 1966 to March 1994, (%CPop) (Cont.)
Original TrendCblPersons Males Females Persons Males Females
Mar85 60.7 76.1 45.7 60.5 75.7 45.7Jun 60.5 75.5 45.9 60.6 75.7 45.9Sep 60.7 75.6 46.3. 60.9 75.8 46.4Dec 61.3 75.8 47.2 61.2 75.9 47.0Mar86 61.7 76.3 47.5 61.6 75.9 47.6Jun 62.0 75.9 48.5 62.0 76.0 48.4Sep 61.8 75.6 48.3 62.0 75.8 48.5Dec 62.1 75.7 48.8 62.0 75.7 48.6Mar87 62.1 75.8 48.7 62.0 75.5 48.8Jun 62.0 75.3 49.0 62.0 75.5 48.9Sep 61.8 75.2 48.8 62.0 75.3 49.0Dec 62.0 75.1 49.3 61.9 75.1 49.2Mar88 62.4 75.6 49.5 62.3 75.4 49.6Jun 62.5 75.4 50.0 62.4 75.4 49.7Sep 62.0 74.8 49.7 62.3 75.0 49.8Dec 62.6 75.2 50.3 62.5 75.1 50.2Mar89. 62.7 75.4 50.4 62.8 75.3 50.6Jun 63.1 75.4 51.2 63.1 75.4 51.1Sep 63.2 75.4 51.3 63.3 75.5 51.5Dec 63.6 75.6 51.9 63.4 75.5 51.7
Mar90 63.5 75.5 51.8 63.6 75.5 52.0Jun 63.8 75.6 52.4 63.8 75.7 52.3Sep 63.8 75.6 52.4 63.9 75.8 52.5Dec 63.9 75.7 . 52.4 63.7 75.5 52.2Mar91 63.5 75.4 51.9 63.5 75.2 52.2Jun 63.4 74.8 52.4 63.3 74.8 52.1Sep 62.9 74.2 51.9 63.0 74.4 51.9Dec 63.0 74.5 51.9 63.0 74.5 51.9Mar92 63.1 74.7 51.9 63.0 74.4 52.0Jun 62.9 74.2 51.9 63.0 74.4 52.0Sep 62.9 74.2 52.0 .63.0 74.3 52.0Dec 62.7 73.9 51.8 62.7 73.9 51.8Mar93 62.6 74.0 51.6 62.4 73.7 51.6Jun 62.3 73.5 51.4 62.3 73.6 51.4Sep 62.4 73.4 51.7 62.6 73.7 51.9Dec 63.0 73.8 52.5 62.9 73.8 52.4Mar94 63.0 73.9 52.3 62.9 73.7 52.5
(a) Mid month of quarter until March quarter 1978. Quarterly average thereafter.(b) ABS trended data from June quarter 1978 onwards. Application of 5-term Henderson moving average to seasonally
adjusted data up to March quarter 1978.
Sources: ABS Cat. Nos 6203.0, 6204.0.

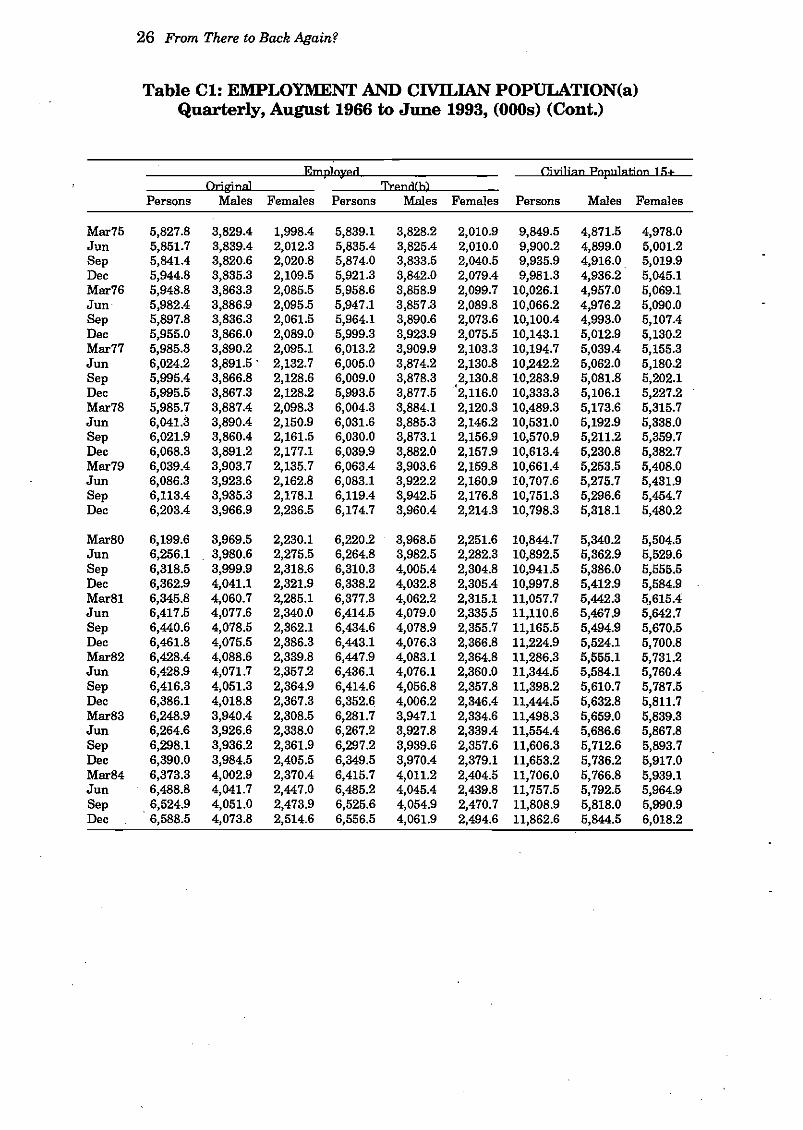
From There to Back Again? 25
Table Cl: EMPLOYMENT AND CIVILIAN POPULATION(a)Quarterly, August 1966 to June 1993, (Ooos)
Employed Civilian population 15+Original Trend(h)
Persons Males Females Persons Males Females Persons Males Females
Sep 4,823.8 3,365.6 1,458.2 4,841.7 3,376.4 1,465.3 8,180.3 4,055.2 4,125.1Dec 4,853.7 3,373.1 1,480.6 4,856.6 3,381.0 1,475.6 8,207.2 4,069.1 4,138.1Mar67 4,901.3 3,403.7 1,497.6 4,882.0 3,389.6 1,492.4 8,265.8 4,095.4 4,170.4Jun 4,906.5 3,404.1 1,502.4 4,917.4 3,407.8 1,509.5 8,312.4 4,116.7 4,195.7Sep 4,933.0 3,410.0 1,523.0 4,914.4 3,390.8 1,523.5 8,348.4 4,134.4 4,214.0Dec 4,971.1 3,432.2 1,538.9 4,919.2 3,383.3 1,535.9 8,381.0 4,152.6 4,228.4Mar68 5,017.9 3,464.6 1,553.3 4,972.3 3,421.5 1,550.9 8,443.3 4,179.8 4,263.5Jun 5,032.6 3,465.3 1,567.3 5,041.7 3,471.1 1,570.6 8,486.1 4,200.5 4,285.6Sep 5,055.7 3,478.2 1,577.5· 5,062.0 3,482.4 1,579.6 8,532.4 4,225.3 4,307.1Dec 5,078.8 3,487.8 1,591.0 5,092.4 3,502.8 1,589.6 8,573.4 4,244.5 4,328.9Mar69 5,152.9 3,540.4 1,612.5 5,128.2 3,522.5 1,605.7 8,642.3 4,279.2 4,363.1Jun 5,159.9 3,542.4 1,617.5 5,162.3 3,539.3 1,623.0 8,694.6 4,306.1 4,388.5Sep 5,182.9 3,546.7 1,636.2 5,198.3 3,552.7 1,645.6 8,743.4 4,331.2 4,412.2Dec 5,254.6 3,562.9 1,691.7 5,255.4 3,579.2 1,676.2 8,792.3 4,355.4 4,436.9
Mar70 5,331.7 3,631.5 1,700.2 5,317.5 3,612.6 1,704.9 8,857.0 4,387.8 4,489.2Jun 5,371.7 3,641.8 1,729.9 5,369.5 3,639.0 1,730.5 8,907.8 4,413.8 4,494.0Sep 5,395.5 3,647.7 1,747.8 5,411.3 3,652.4 . 1,758.9 8,950.9 4,433.4 4,517.5Dec 5,450.9 3,651.5 1,799.4 5,447.0 3,665.6 1,781.4 9,003.3 4,481.0 4,542.3Mar71 5,491.5 3,695.7 1,795.8 5,485.7 3,681.9 1,803.9 9,074.6 4,494.0 4,580.6Jun 5,526.6 . 3,707.2 1,819.4 5,519.3 3,702.5 1,816.8 9,123.2 4,520.5 4,602.7Sep 5,515.7 3,712.7 1,803.0 5,531.8 3,717.6 1,814.2 9,191.1 4,556.1 4,635.0Dec 5,532.8 3,713.7 1,819.1 5,528.5 3,724.4 1,804.1 9,242.2 4,579.9 4,662.3Mar72 5,543.5 3,740.2 1,803.3 5,535.2 3,731.5 1,803.7 9,290.7 4,603.4 4,687.3Jun 5,567.7 3,756.4 1,811.3 5,569.7 3,747.3 1,822.4 9,332.6 4,623.6 4,709.0Sep 5,609.8 3,757.7 1,852.1 5,624.4 3,768.5 1,855.9 9,379.2 4,646.2 4,733.0Dec 5,684.3 3,780.2 1,904.1 5,674.5 3,786.0 1,888.6 9,423.8 4,668.3 4,755.5Mar73 5,708.3 3,801.5 1,906.8 5,696.3 3,789.9 1,906.4 9,470.0 4,690.4 4,779.6Jun 5,719.6 3,804.6 1,915.0 5,732.0 3,806.4 1,925.6 9,512.7 4,711.1 4,801.6Sep 5,782.9 3,839.6 1,943.3 5,787.8 3,839.2 1,948.5 9,563.4 4,738.8 4,824.6Dec 5,849.3 3,854.9 1,994.4 5,849.0 3,867.9 1,981.0 9,616.0 4,763.4 4,852.6Mar74 5,902.1 3,890.1 2,012.0 5,892.7 . 3,880.6 2,012.2 9,670.2 4,789.5 4,880.7Jun 5,918.0 3,894.2 2,023.8 5,906.2 3,880.1 2,026.1 9,721.4 4,814.6 4,906.8Sep 5,855.2 3,847.1 2,008.1 5,889.2 3,864.5 2,024.7 9,768.4 4,835.4 4,933.0Dec 5,889.5 3,843.7 2,045.8 5,862.1 3,843.7 2,018.4 9,821.0 4,862.4 4,958.6
26 From There to Back Again?
Table Cl: EMPLOYMENT AND CIVll..IAN POPULATION(a)Quarterly, August 1966 to June 1993, (Ooos) (Cont.)
-_. Emplopd CiviliaD Popnlation 15±Original TrendCh)
Persons Males Females Persons Males Females Persons Males Females
Mar75 5,827.8 3,829.4 1,998.4 5,839.1 3,828.2 2,010.9 9,849.5 4,871.5 4,978.0Jun 5,851.7 3,839.4 2,012.3 5,835.4 3,825.4 2,010.0 9,900.2 4,899.0 5,001.2Sep 5,841.4 3,820.6 2,020.8 5,874.0 3,833.5 2,040.5 9,935.9 4,916.0. 5,019.9Dec 5,944.8 3,835.3 2,109.5 5,921.3 3,842.0 2,079.4 9,981.3 4,936.2 5,045.1Mar76 5,948.8 3,863.3 2,085.5 5,958.6 3,858.9 2,099.7 10,026.1 4,957.0 5,069.1Jun 5,982.4 3,886.9 2,095.5 5,947.1 3,857.3 2,089.8 10,066.2 4,976.2 5,090.0Sep 5,897.8 3,836.3 2,061.5 5,964.1 3,890.6 2,073.6 10,100.4 4,993.0 5,107.4Dec 5,955.0 3,866.0 2,089.0 5,999.3 3,923.9 2,075.5 10,143.1 5,012.9 5,130.2Mar77 5,985.3 3,890.2 2,095.1 6,013.2 3,909.9 2,103.3 10,194.7 5,039.4 5,155.3Jun 6,024.2 3,891.5 . 2,132.7 6,005.0 3,874.2 2,130.8 10,242.2 5,062.0 5,180.2Sep 5,995.4 3,866.8 2,128.6 6,009.0 3,878.3 2,130.8 10,283.9 5,081.8 5,202.1Dec 5,995.5 3,867.3 2,128.2 5,993.5 3,877.5 "2,116.0 10,333.3 5,106.1 5,227.2Mar78 5,985.7 3,887.4 2,098.3 6,004.3 3,884.1 2,120.3 10,489.3 5,173.6 5,315.7Jun 6,041.3 3,890.4 2,150.9 6,031.6 3,885.3 2,146.2 10,531.0 5,192.9 5,338.0Sep 6,021.9 3,860.4 2,161.5 6,030.0 3,873.1 2,156.9 10,570.9 5,211.2 5,359.7Dec 6,068.3 3,891.2 2,177.1 6,039.9 3,882.0 2,157.9 10,613.4 5,230.8 5,382.7Mar79 6,039.4 3,903.7 2,135.7 6,063.4 3,903.6 2,159.8 10,661.4 5,253.5 5,408.0Jun 6,086.3 3,923.6 2,162.8 6,083.1 3,922.2 2,160.9 10,707.6 5,275.7 5,431.9Sep 6,113.4 3,935.3 2,178.1 6,119.4 3,942.5 2,176.8 10,751.3 5,296.6 5,454.7Dec 6,203.4 3,966.9 2,236.5 6,174.7 3,960.4 2,214.3 10,798.3 5,318.1 5,480.2
Mar80 6,199.6 3,969.5 2,230.1 6,220.2 3,968.5 2,251.6 10,844.7 5,340.2 5,504.5Jun 6,256.1 . 3,980.6 2,275.5 6,264.8 3,982.5 2,282.3 10,892.5 5,362.9 5,529.6Sep 6,318.5 3,999.9 2,318.6 6,310.3 4,005.4 2,304.8 10,941.5 5,386.0 5,555.5Dec 6,362.9 4,041.1 2,321.9 6,338.2 4,032.8 2,305.4 10,997.8 5,412.9 5,584.9Mar81 6,345.8 4,060.7 2,285.1 6,377.3 4,062.2 2,315.1 11,057.7 5,442.3 /\,615.4Jun 6,417.5 4,077.6 2,340.0 6,414.5 4,079.0 2,335.5 11,110.6 5,467.9 5,642.7Sep 6,440.6 4,078.5 2,362.1 6,434.6 4,078.9 2,355.7 11,165.5 5,494.9 5,670.5Dec 6,461.8 4,075.5 2,386.3 6,443.1 4,076.3 2,366.8 11,224.9 5,524.1 5,700.8Mar82 6,428.4 4,088.6 2,339.8 6,447.9 4,083.1 2,364.8 11,286.3 5,555.1 5,731.2Jun 6,428.9 4,071.7 2,357.2 6,436.1 4,076.1 2,360.0 11,344.5 5,584.1 5,760.4Sep 6,416.3 4,051.3 2,364.9 6,414.6 4,056.8 2,357.8 11,398.2 5,610.7 5,787.5Dec 6,386.1 4,018.8 2,367.3 6,352.6 4,006.2 2,346.4 11,444.5 5,632.8 5,811.7Mar83 6,248.9 3,940.4 2,308.5 6,281.7 3,947.1 2,334.6 11,498.3 5,659.0 5,839.3Jun 6,264.6 3,926.6 2,338.0 6,267.2 3,927.8 2,339.4 11,554.4 5,686.6 5,867.8Sep 6,298.1 3,936.2 2,361.9 6,297.2 3,939.6 2,357.6 11,606.3 5,712.6 5,893.7Dec 6,390.0 3,984.5 2,405.5 6,349.5 3,970.4 2,379.1 11,653.2 5,736.2 5,917.0Mar84 6,373.3 4,002.9 2,370.4 6,415.7 4,011.2 2,404.5 11,706.0 5,766.8 5,939.1Jun 6,488.8 4,041.7 2,447.0 6,485.2 4,045.4 2,439.8 11,757.5 5,792.5 5,964.9Sep 6,524.9 4,051.0 2,473.9 6,525.6 4,054.9 2,470.7 11,808.9 5,818.0 5,990.9Dec 6,588.5 4,073.8 2,514.6 6,556.5 4,061.9 2,494.6 11,862.6 5,844.5 6,018.2

From There to Back Again? 27
Table Cl: EMPLOYMENT AND CIVILIAN POPULATION(a)Quarterly, August 1966 to June 1993, (Ooos) (Cont.)
Employed Civilian PopJdatjon 15+Original Trend(h)
Persons Males Females Persons Males Females Persons Males Females
Mar85 6,568.5 4,074.9 2,493.6 6,593.0 4,077.4 2,515.6 11,920.7 ·5,873.5 6,047.2Jun 6,635.4 4,092.6 2,542.8 6,642.6 4,097.5 2,545.1 11,975.6 5,901.3 6,074.3Sep 6,731.2 4,139.1 2,592.1 6,730.3 4,141.9 2,588.4 12,031.4 5,929.8 6,101.6Dec 6,854.6 4,198.9 2,655.7 6,822.5 4,188.8 2,633.7 12,096.2 5,962.6 6,133.6Mar86 6,859.1 4,209.0 2,650.1 6,895.3 4,214.3 2,681.0 12,164.3 5,997.0 6,167.2Jun 6,994.9 4,242.8 2,752.1 6,981.2 4,238.9 2,742.3 12,228.8 6,029.6 6,199.1Sep 6,983.6 4,230.3 2,753.3 6,997.5 4,239.7 2,757.7 12,291.9 6,061.2 6,230.7Dec 7,060.5 4,255.1 2,805.4 7,019.1 4,241.2 2,777.9 12,356.7 6,093.3 6,263.4Mar87 7,019.4 4,250.5 2,768.9 7,058.2 4,257.8 2,800.5 12,424.4 6,126.8 6,297.6Jun 7,114.0 4,280.8 2,833.3 7,112.3 4,285.9 2,826.4 12,489.9 6,159.2 6,330.7Sep 7,151.5 4,303.3 2,648.2 7,149.2 4,301.3 2,847.9 12,551.2 6,189.6 6,361.6Dec 7,230.1 4,329.5 2,900.6 7,202.0 4,323.0 2,879.0 12,617.4 6,222.6 6,394.8Mar88 7,271.4 4,374.8 2,896.6 7,303.2 4,378.6 2,924.6 12,688.1 6,258.0 6,430.0Jun 7,372.2 4,409.9 2,962.3 7,364.6 4,409.7 2,954.9 12,753.4 6,290.6 6,462.9Sep 7,413.2 4,421.1 2,992.1 7,417.9 4,429.9 2,988.1 12,814.5 6,321.7 6,492.9Dec 7,536.3 4,487.9 3,048.4 7,498.4 4,468.0 3,030.4 12,879.3 6,354.1 . 6,525.2Mar89 7,541.7 4,491.6 3,050.1 7,592.8 4,509.1 3,083.7 12,941.5 6,376.3 6,565.2Jun 7,703.4 4,557.5 3,145.9 7,690.7 4,554.3 3,136.4 12,998.7 6,404.8 6,593.9Sep 7,765.9 4,583.0 3,182.9 7,768.8 4,589.5 3,179.3 13,054.8 6,432.1 6,622.7Dec 7,868.2 4,632.0 3,236.1 7,823.0 4,610.2 3,212.8 13,113.3 6,460.9 6,652.4
Mar90 7,795.0 4,594.2 3,200.7 7,855.3 4,613.8 3,241.5 13,169.4 6,438.6 6,680.8Jun 7,898.9 4,622.3 3,276.6 7,888.4 4,619.7 3,268.7 13,222.0 6,514.0 6,707.9Sep, 7,877.7 4,601.6 3,276.1 7,875.1 4,603.8 3,271.3 13,270.2 6,536.7 6,733.4Dec :, 7,863.8 4,582.8 3,281.0 7,818.0 4,564.2 3,253.9 13,320.8 6,561.0 6,759.8Mar91 7,688.5 4,492.4 3,196.1 7,749.7 4,511.4 3,238.3 13,368.5 6,583.5 6,785.1
-Jun ",i 7,699.7 4,460.2 3,239.5 7,678.6 4,453.5 3,225.1 13,414.1 6,604.7 6,809.4Sep:; 7,644.7 4,419.4 3,225.3 7,640.3 4,423.4 3,216.8 13,459.3 6,626.0 6,833.3
" 7,669.5 4,438.7 3,230.9 7,640.0 4,422.8 3,217.2 13,507.4 6,649.3 6,858.1Dec \'.\~
Mar92 7,593.0 4,401.3 3,191.7 7,643.4 4,419.7 3,223.7 13,551.7 6,670.8 6,880.9Jun 7,639.7 4,409.5 3,230.2 7,642.4 4,412.6 3,229.8 13,591.8 6,690.1 6,90.1.7Sep 7,665.9 4,412.1 3,253.7 7,641.7 4,404.2 3,237.6 13,630.1 6,708.5 6,921.6Dec 7,649.2 4,399.9 3,249.3 7,623.0 4,389.7 3,233.4 13,670.6 6,728.3 6,942.4Mar93 7,579.0 4,375.9 3,203.1 7,621.3 4,388.2 3,233.1 13,711.6 6,748.3 6,963.3Jun 7,641.6 4,399.8 3,241.8 7,639.0 . 4,401.4 3,237.7 13,751.8 6,768.3 6,983.5Sep 7,694.4 4,426.6 3,267.8 7,686.7 4,425.7 3,261.0 13,791.3 6,787.6 . 7,003.7Dec 7,803.4 4,479.8 3,323.6 7,760.3 4,461.7 3,298.6 13,832.4 6,807.6 7,024.8Mar94 7,755.4 4,466.1 3,289.3 7,818.3 4,488.1 3,330.2 13,874.4 6,828.7 7,045.8
(a) Mid month of quarter until March quarter 1978. Quarterly average thereafter.(b) ABS trended data from June quarter 1978 onwards. Application of 5-term. Henderson moving average to seasonally
adjusted data up to March quarter 1978.
Sources: ABS Cat. Nos 6203.0, 6204.0.

28 From There to Back Again?
Table C2: EMPLOYMENTIPOPULATION RATIOSQuarterly, August 1966 to June 1993, (% CPop)
Original TrendCb)Persons Males Females Persons Males Females
Sep 59.0 83.0 35.3 59.2 83.3 35.5Dec 59.1 82.9 35.8 59.2 83.1 35.7Mar67 59.3 83.1 35.9 59.1 82.8 35.8Jan 59.0 82.7 35.8 59.2 82.8 36.0Sep 59.1 82.5 36.1 58.9 82.0 36.2Dec 59.3 82.7 36.4 58.7 81.5 36.3Mar68 59.4 82.9 36.4 58.9 81.9 36.4Jun 59.3 82.5 36.6 59.4 82.6 36.6Sep 59.3 82.3 36.6 59.3 82.4 36.7Dec 59.2 82.2 36.8 59.4 82.5 36.7Mar69 59.6 82.7 37.0 59.3 82.3 36.8Jun 59.3 82.3 36.9 59.4 82.2 37.0Sep 59.3 81.9 37.1 59.5 82.0 37.3Dec 59.8 81.8 38.1 59.8 82.2 37.8
Mar70 60.2 82.8 38.0 60.0 82.3 38.1Jun 60.3 82.5 38.5 60.3 82.4 38.5Sep 60.3 82.3 38.7 60.5 82.4 38.9Dec 60.5 81.9 39.6 60.5 82.2 39.2Mar71 60.5 82.2 39.2 60.5 81.9 39.4Jun 60.6 82.0 39.5 60.5 81.9 39.5Sep 60.0 81.5 38.9 60.2 81.6 39.1Dec 59.9 81.1 39.0 59.8 81.3 38.7Mar72 59.7 81.2 38.5 59.6 81.1 38.5Jun 59.7 81.2 38.5 59.7 81.0 38.7Sep 59.8 80.9 39.1 60.0 81.1 39.2Dec 60.3 81.0 40.0 60.2 81.1 39.7Mar73 60.3 81.0 39.9 60.2 80.8 39.9Jan 60.1 80.8 39..9 60.3 80.8 40.1Sep 60.5 81.0 40.3 60.5 81.0 40.4Dec 60.8 80.9 41.1 60.8 81.2 40.8Mar74 61.0 81.2 41.2 60.9 81.0 41.2Jun 60.9 80.9 41.2 60.8 80.6 41.3Sep 59.9 79.6 40.7 60.3 79.9 41.0Dec 60.0 79.0 41.3 59.7 79.0 40.7

From There to Back Again? 29v
Table C2: EMPLOYMENTIPOPULATION RATIOSQuarterly, August 1966 to Juue 1993, (% CPop) (Cont.)
Original TrendChlPersons Males Females Persons Males Females
Mar75 59.2 78.6 40.1 59.3 78.6 40.4Jun 59.1 78.4 40.2 58.9 78.1 40.2Sep 58.8 77.7 40.3 59.1 78.0 40.6Dec 59.6 77.7 41.8 59.3 77.8 41.2Mar76 59.3 77.9 41.1 59.4 77.8 41.4Jun 59.4 78.1 41.2 59.1 77.5 41.1Sep 58.4 76.8 40.4 59.0 77.9 40.6Dec 58.7 77.1 40.7 59.1 78.3 40.5Mar77 58.7 77.2 40.6 59.0 77.6 40.8Jun 58.8 76.9 41.2 58.6 76.5 41.1Sep 58.3 76.1 40.9 58.4 76.3 41.0Dec 58.0 75.7 40.7 58.0 75.9 40.5Mar78 57.1 75.1 39.5 57.2 75.1 39.9Jun 57.4 74.9 40.3 57.3 74.8 40.2Sep . 57.0 74.1 40.3 57.0 74.3 40.2Dec 57.2 74.4 40.4 56.9 74.2 40.1Mar79 56.6 74.3 39.5 56.9 74.3 39.9Jun 56.8 74.4 39.8 56.8 74.3 39.8Sep 56.9 74.3 39.9 56.9 74.4 39.9Dec 57.4 74.6 40.8 57.2 74.5 40.4
Mar80 57.2 74.3 40.5 57.4 74.3 40.9Jun 57.4 74.2 41.2 57.5 74.3 41.3Sep 57.7 74.3 41.7 57.7 74.4 41.5Dec 57.9 74.7 41.6 57.6 74.5 41.3Mar81 . 57.4 74.6 40.7 57.7 74.6 41.2Jun 57.8 74.6 41.5 57.7 74.6 41.4Sep 57.7 74.2 41.7 57.6 74.2 41.5 .Dec 57.6 73.8 41.9 57.4 73.8 41.5Mar82 57.0 73.6 40.8 57.1 73.5 41.3Jun 56.7 72.9 40.9 56.7 73.0 41.0Sep 56.3 72.2 40.9 56.3 72.3 40.7Dec 55.8 71.3 40.7 55.5 71.1 40.4Mar83 54.3 69.6 39.5 54.6 69.7 40.0Jun 54.2 69.1 39.8 54.2 69.1 39.9Sep 54.3 68.9 40.1 54.3 69.0 40.0Dec 54.8 69.5 40.7 54.5 69.2 40.2Mar84 54.4 69.4 39.9 54.8 69.6 40.5Jun 55.2 69.8 41.0 55.2 69.8 40.9Sep 55.3 69.6 41.3 55.3 69.7 41.2Dec 55.5 69.7 41.8 55.3 69.5 41.5

30 From There to Back Again? .
Table C2: EMPLOYMENTIPOPULATION RATIOSQuarterly, August 1966 to June 1993, (% CPop) (Cont.)
Original Trend(blPersons Males Females Persons Males Females
Mar85 55.1 69.4 41.2 55.3 69.4 41.6Jun 55.4 69.4 41.9 55.5 69.4 41.9Sep 55.9 69.8 42.5 55.9 69.8 42.4Dec 56.7 70.4 43.3 56.4 70.3 42.9Mar86 56.4 70.2 43.0 56.7 70.3 43.5Jun 57.2 70.4 44.4 57.1 70.3 44.2Sep 56.8 69.8 44.2 56.9 69.9 44.3Dec 57.1 69.8 44.8 56.8 69.6 44.4Mar87 56.5 69.4 44.0 56.8 69.5 44.5Jun 57.0 69.5 44.8 56.9 69.6 44.6Sep 57.0 69.5 44.8 57.0 69.5 44.8Dec 57.3 69.6 . 45.4 57.1 69.5 45.0Mar88 57.3 69.9 45.0 57.6 70.0 45.5Jun 57.8 70.1 45.8 57.7 70.1 45.7Sep 57.9 69.9 46.1 57.9 70.1 46.0Dec 58.5 70.6 46.7 58.2 70.3 46.4Mar89 58.3 70.4 46.5 58.7 70.7 47.0Jun 59.3 71.2 47.7 59.2 71.1 47.6Sep 59.5 71.3 48.1 59.5 71.4 48.0Dec 60.0 71.7 48.6 59.7 71.4 48.3
Mar90 59.2 70.8 47.9 59.6 71.1 48.5Jun 59.7 71.0 48.8 59.7 70.9 48.7Sep 59.4 70.4 ·48.7 59.3 70.4 48.6Dec 59.0 69.8 48.5 58.7 69.6 48.1Mar91 57.5 68.2 47.1 58.0 68.5 47.7Jun 57.4 67.5 47.6 57.2 67.4 47.4Sep 56.8 66.7 47.2 56.8 66.8 47.1Dec 56.8 66.8 47.1 56.6 66.5 46.9Mar92 56.0 66.0 46.4 56.4 66.3 46.8Jun 56.2 65.9 46.8 56.2 66.0 46.8Sep 56.2 65.8 47.0 56.1 65.7 46.8Dec 56.0 65.4 46.8 55.8 65.2 46.6Mar93 55.3 64.8 46.0 55.6 65.0 46.4Jun 55.6 65.0 46.4 55.5 65.0 46.4Sep 55.8 65.2 46.7 55.7 65.2 46.6Dec 56.4 65.8 47.3 56.1 65.5 47.0Mar94 55.9 65.4 46.7 56.4 65.7 47.3
(a) Derived from mid month of quarter until March quarter 1978. Derived from quarterly average data thereafter.(b) Derived from ABS trended data from June quarter 1978 onwards. Derived from seasonally adjusted data to which
5~term Henderson moving average applied up to March quarter 1978.
Sources: ABS Cat. Nos 6203.0. 6204.0.

From There to Back Again? 31
I
Labour demand and supply marched together from the mid 1960's tomid 1974, both rising fairly steadily. From late 1974 to 1983, theemploymenUpopulation ratio showed a clear downward trend,dropping to 54% in 1983, a drop of 6 percentage points from 1974.Over that period, labour supply also tended to fall, but the fallstarted later (in mid 1976) and was much more gentle. The resultwas a large increase in unemployment.
From .1983 to 1989, there was a major improvement in employmentdemand, with the employmenUpopulation ratio climbing back to 60%.This coincided with a period of declining or stagnant real wages. TheemploymenUpopulation ratio was still not as high as it reached inmid 1974, but it came close to those levels. Unfortunately, laboursupply also rose, so the improvement in unemployment, though quitemarked, was not as great as it would otherwise have been.
The employmenUpopulation ratio deteriorated sharply again from1989 to 1993. Labour supply was quite responsive to the downturnin demand, it again did not fall by anywhere near as much as labourdemand. Once again, there was a large surge in unemployment.
Labour Cost and Aggregate Demand
While the general labour market patterns over the last 28 years areclear, labour cost and aggregate demand need to be examined inorder to explain them. The following analytical principles underliemuch of the comments in this Paper:
(1) returns from labour (i.e. wages) positively influence laboursupply
Le. if wages and salaries go up, people will tend to beattracted into the labour market. If they go down, peoplewill tend to be discouraged from entering the labourmarket, or may leave (e.g. by early retirement)
given the importance of the labour market as a sourceof income, the former effect can be expected to begenerally stronger than the second
(2) the likelihood of employment positively influences laboursupply
Le. if employment is growing, people who are otherwise"marginally attached" to the labour market are more likelyto engage in job search activity, and thus are more likelyto be identified by the ABS as unemployed. Ifemploymentis falling, people without jobs are likely to be discouragedand reduce their job search activity or desist altogether

32 From There to Back Again?
(3) the demand for labour is negatively affected by the cost oflabour, positively affected by the demand for the goods andservices produced by that labour
i.e. if labour is more expensive, there will tend to be lessof hired, if it is cheaper, there will tend to be more of it,for a given level of demand. If demand for the goods andservices produced by labour goes up, there will tend to bemore jobs, ifit goes down, there will tend to be less, for agiven cost of labour
(4) labour is not homogeneous: both the demand for and the priceof labour will vary depending on locality, skills, supply, etc.
,
the development of the "information" "post-industrial"economy, the falls in the real cost of transport andcommunication technology and the spread ofmanufacturing technology to low wage countries havetended to have two (contradictory) effects. One is to put awide variety of skills, particularly information skills, at apremium. The other is to depress demand for lower skilljobs. Because labour is not homogeneous, this makes thepossibility ofsimultaneous oversupply oflower skill labouraccompanying shortages of skilled labour eminentlypossible
by Asian standards, Australian professional labourtends to be relatively cheap, its lower skill labourrelatively expensive.
These effects can work in different directions. For example,increasing wages may attract people into the labour market (1) butthe resultant rise in the cost of labour may discourage employment(3) and, if demand conditions are unfavourable, lead to a fall inemployment (3), discouraging labour market participation (2).Alternatively, increasing demand for goods and services may increasedemand for labour (3) but only for certain types (4) leading to asituation of substantial unemployment yet employers being unableto find suitable labour.
Graph No.8 plots the employmentJpopulation ratio seen in GraphNo.7 against real wages and real demand per capita (see Table D)
real demand per capita is used in order to abstract away frompopulation growth.
From this a fairly clear pattern emerges.

Graph No 8Employment, Real Wages & Real Demand
Trend, Quarterly, July 1966 to March 1994
120 -Real Demand per capita (LHS)
- 66
60 - r I I I I I I I I I I I - 54
0'0 1C) 1'2- 1b.: 1° 1'0 'OC) '0'2- 'Ob.: '00 '0'0 ~C) ~'2-S;;.0 "J\>0 "J\>0 "J\>0 "J\>0 "J\>0 "J\>0 "J\>0 "J\>0 "J\>0 "J\>0 "J\>0 "J\>0
Sources: ABS Cat Nos. 3101.0, 5206.0, 6203.0, 6204.0.
+Lf)..--
C0
+=0-::lQ.0
a..
c0
.->.-
~U0
-I-;l
C ~Q)
U ~
8'L
~Q)
a..~;;..'"
c.:>c.:>
- 58
- 60
- 64
-.62
Employment (RHS)
•••.... .....~. ~• .. .*. ....
~
~
••~~
~.. .. ... ...
Real Wages (LHS)
.... ..••...
~
~
~~
70 - ......t
80 -
90 -
100 -
110-
II
-.:;;tex>(J)
xQ)
"'0C
..--
C,)Q)
o..........
..--...oo

34 From There to Back Again?
From 1966 to 1970, real wages and real demand per capita increasedtogether. In the period June 1970 to June 1972, real demand droppedoff but wages continued to increase. The result was that growth inthe employment/population ratio halted and then fell. Demand thenrecovered, leading to a recovery in employment growth. In June 1974,real wages and real demand sharply diverged. Real wages increasedsignificantly while demand dropped back. Theemployment/population ratio fell sharply. Full employment ceased.
Real wages then stagnated while aggregate demand meanderedupwards.' A drop in aggregate demand in late 1977 coincided with acontinuing fall in the employment/population ratio. Subsequently,aggregate demand picked up and real wages dropped. Employmentpicked up. In 1981-82, there was another sharp divergence betweenreal wages and aggregate demand. Real wages increased dramaticallywhile aggregate demand slumped. The result was a dramatic drop inemployment. Real wages then dropped back.
Real demand began to recover in June 1983. This initiated asustained surge in aggregate demand which continued until Junequarter 1989. Real wages declined gently and then started edging up.During this period there was dramatic growth in employment. FromJune 1989 there was again a divergence between real wages and realdemand, with real wages tending to increase while aggregate demandslumped. The result was a dramatic drop in employment which wipedout most of the preceding gains in the employment/population ratio.It is only after a period of sustained demand growth, and a haltingto growth in real wages, that the employment/population ratio beganto move upward again.
To summarise
where aggregate demand grows more strongly than wages, theemployment/population ratio increases
where wages grow more strongly than aggregate demand, theemployment/population ratio falls
the Australian labour market has a persistent tendency toproduce wage outcomes at variance with demand conditions
during the period from June 1983 to June 1989, thisdivergence was benign, producing sustained employmentgrowth
on other occasions, notably 1974-5, 1982-83 and 1989-93,this divergence produced major falls in theemployment/population .ratio and major increases inunemployment
overall, the effect of the divergence has been to produce a longterm deterioration in the ability of the Australian economy toproduce jobs.

From There to Back Again? 35
Market Regulation and Intervention
In a market economy, transactions drive economic growth.Circumstances which foster transactions tend to encourage economicgrowth. Circumstances which discourage transactions tend todiscourage economic growth.
Regulation and other government interventions can have a range ofeffects on economic transactions. Obviously they can have depressiveeffects: they can ban certain transactions altogether; they can raisethe cost of engaging in transactions. Such interventions tend todiscourage transactions and thus.tend to discourage economic growth.
But government intervention can also encourage economic activity:government intervention can lower the cost of transactions or maketransactions possible that otherwise were not. For example, anefficient system ofcriminal justice and property law can dramaticallylower the "protection costs" of economic activity and/or reduce theuncertainty level in the economy. Places with effective and stableproperty-right legal systems tend to have a much higher level ofeconomic activity than places which suffer high levels of violentactivity, poor or unreliable protection of property rights, etc.
As government interventions become more pervasive through aneconomy, it becomes increasingly difficult to track their effects,particularly as the market results of such intervention may be a
., great deal more immediate and obvious than the government}dntervention which caused them.
Economists talk of markets "clearing" when demand matches supply.Ifgovernment intervenes and sets a price which is above the marketclearing level, then there will be oversupply. More will be suppliedthan will be demanded.
Even given that labour is not homogeneous, that not everyone hasthe skills or capacity to do every job and that it is therefore possibleto have both labour shortages (for example, of skilled labour) andlabour oversupply simultaneously, persistent oversupply must beregarded as strong evidence for a poor institutional structure: inparticular, of prices (and wages are the price oflabour) being set atabove market clearing levels, at least for certain types of labour
the proposal for a training wage and the use of wage subsidesclearly represent attempts to make people employable bylowering the cost of employing them.
Income support arrangements can have the effect of setting aminimum wage. With fringe benefits and leisure having a positivevalue (and most low paid work has considerable disutility), then jobs

36 From There to Back Again?
are likely to be attractive only at a certain level above incomesupport levels.
Furthermore, employability declines the longer someone is out of ajob: it is a consistent finding of studies that the chances of leavingunemployment decline the longer one is unemployed. Income supportarrangements reduce the urgency of finding ajob. In failing to applyfor appropriate jobs quick enough, people can become trapped in longterm unemployment: their employability having degraded quickerthan their own assessment of their employability
• the level of unemployment benefits paid, and the duration forwhich they are available, both tend to be positively correlatedwith higher unemployment rates!.
The effects of interventions can be unexpected. Taking on staff iscostly and involves certain risks for employers, particularly smallemployers. The more difficult it is to dismiss staff, the higher therisks involved in hiring a new worker. A possible result ofincreasingthe difficulty in dismissing staff, therefore, is to discourage hiringand/or to encourage a "flight to safety": increased reliance on thingssuch as past experience, use of networks were someone can operateas de facto "guarantor", insistence on higher skill levels, etc. inselecting staff. Thus increased dismissal rights for those currentlyemployed could adversely affect those not currently employed wholack good networks, past experience, certificated skills, etc.
Technological Change
An explanation commonly offered for persistent unemployment istechnological change. It is undoubtedly true that technological changehas greatly changed the types of jobs available and their numbers.But technological change has been doing that since before theIndustrial Revolution. The question is not whether or not change hasoccurred, but how well institutions cope with change - institutions inthe broad sense outlined previously, encompassing not merely firms,unions, wage rates, labour on-costs, taxes, education and trainingsystems, attitudes, etc.. Technological change reduces or eliminatesdemand for certain sorts of skills, increases or creates demand forother sorts of skills. It changes levels of productivity, generallyupward (thus enabling higher standards of living). Iflabour marketinstitutions, in the broad sense, adapt well to changes in labourdemand, the unemployment effects will be minimised. If they adaptpoorly to such changes, then unemployment is a very likely result.
1. Cf Layard, P R G, Nickell, S J & Jackman, R, Unemployment: MacroeconomicPerformance and Labour Market, Oxford University Press, 1991.

From There to Back Again? 37
One must look not merely at the change but also at the response toit.
Capital Shortage
Australia typically creates less financial capital than it uses. Thissituation of "capital shortage" means that it tends to have highercapital costs (in particular, higher real interest rates) than elsewhere.Arguably, this depresses employment, particularly employmentrequiring substantial investment (such as restructuring).
There are two obvious responses to this
for Australia to save more in an attempt to reduce local capitalcosts
to ensure capital (both fixed and financial) is used highlyefficiently to compensate for these higher costs.
Australian mining firms - highly reliant on export markets and veryhigh users of capital (i.e. are highly "capital intensive" in thelanguage of economists) - and firms engaged in continuous processproduction (such as steel making) typically use capital on a 24 hour,or at least multiple shift, basis. It is less common elsewhere in theeconomy. It is noticeably absent from our education and traininginstitutions. Much Australian fixed capital is used much lessintensively than it could be (or is common to our north).
Efficient use of fixed capital in particular is more easily encouraged, by flexible labour markets (flexible in sense of hours, task allocation,
etc.). There is a real question as to whether Australia's labourmarket institutions are ideally arranged to compensate for itstendencies to capital shortage.

38 From There to Back Again?
Table D: Real Wages and Real Demand Per CapitaJuly 1966 to December 1993, Trend
National turnover of goods &Non-farm WSS per WSE(a) services per capit.a
($Dec93) Index(b) (%) ($Dec93) Index(b) (%)
Sep 4978 62.9 .. 4079 67.1Dec 5041 63.7 1.3 4153 68.3 1.8Mar67 5114 64.6 1.5 4192 68.9 0.9Jun 5144 65.0 0.6 4203 69.1 0.3Sep 5221 66.0 1.5 4234 69.6 0.7Dec 5248 66.3 0.5 4268 70.2 0.8Mar68 5252 66.4 0.1 4314 71.0 1.1Jun 5266 66.6 0.3 4380 72.0 1.5Sep 5370 67.9 2.0 4458 73.3 1.8Dec 5443 68.8 1.4 4526 74.4 1.5Mar69 5508 69.6 1.2 4568 75.1 0.9Jun 5603 70.8 1.7 4595 75.6 0.6Sep 5689 71.9 1.5 4629 76.1 0.8Dec 5729 72.4 0.7 4665 76.7 0.8
Mar70 5717 72.3 -0.2 4703 77.3 0.8Jun 5750 72.7 0.6 4751 78.1 1.0Sep 5841 73.8 1.6 4794 78.9 0.9
. Dec 5953 75.2 1.9 4803 79.0 0.2Mar71 6038 76.3 1.4 4745 78.0 -1.2Jun 6075 76.8 0.6 4729 77.8 -0.3Sep 6129 77.5 0.9 4746 78.1 0.4Dec 6149 77.7 0.3 4722 77.7 -0.5Mar72 6185 78.2 0.6 4671 76.8 -1.1Jun 6225 78.7 0.7 4650 76.5 -0.5Sep 6269 79.2 0.7 4712 77.5 1.3Dec 6365 80.5 1.5 4806 79.0 2.0Mar73 6456 81.6 1.4 4863 80.0 1.2Jun 6528 82.5 1.1 4945 81.3 1.7Sep 6617 83.6 1.4 5048 83.0 2.1Dec 6662 84.2 0.7 5130 84.4 1.6Mar74 6769 85.6 1.6 5161 84.9 0;6Jun 6981 88.2 3.1 5141 84.6 -0.4Sep 7219 91.2 3.4 5116 84.1 -(}.5
Dec 7386 93.3 2.3 5109 84.0 -0.1

From There to Back Again? 39
Table D: Real Wages and Real Demand Per CapitaJuly 1966 to December 1993, Trend (Cont.)
National turnover of goods &NOD-farm WSS per WSE(a) services per capita
($Dec93) Index(b) (%) ($Dec93) Index(b) (%)
Mar75 7399 93.5 0.2 5107 84.0 -0.0Jun 7348 92.9 -0.7 5088 83.7 -0.4Sep 7271 91.9 -1.0 5110 84.0 0.4Dec 7235 91.4 -0.5 5166 85.0 1.1Mar76 7295 92.2 0.8 5240 86.2 1.4Jun 7354 93.0 0.8 5314 87.4 1.4Sep 7396 93.5 0.6 5348 88.0 0.6Dec 7402 93.6 0.1 5359 88.1 0.2Mar77 7402 93.6 -0.0 5371 88.3 0.2Jun 7395 93.5 -0.1 5335 87.7 -0.7Sep 7417 93.8 0.3 5276 86.8 -1.1Dec 7436 94.0 0.2 5244 86.3 -0.6Mar78 7492 94.7 0.8 5278 86.8 0.6Jan 7469 94.4 -0.3 5378 88.5 1.9Sep 7418 93.8 -0.7 5483 90.2 1.9Dec 7368 93.1 -0.7 5570 91.6 1.6Mar79 7343 92.8 -0.3 5598 92.1 0.5Jan 7338 92.8 -0.1 5597 92.1 -0.0Sep 7325 92.6 -0.2 5607 92.2 0.2Dec 7295 92.2 -0.4 5621 92.5 0.3'
Mar80 7304 92.3 0.1 5634 92.7 0.2Jan 7356 93.0 0.7 5651 92.9 0.3Sep : 7435 94.0 1.1 5681 93.4 0.5Dec ;' 7526 95.1 1.2 5722 94.1 0.7Mar8i 7604 96.1 1.0 5764 94.8 0.7Jun 7650 96.7 0.6 5819 95.7 1.0Sep 7687 97.2 0.5 ' 5873 96.6 0.9Dec 7771 98.2 1.1 5910 97.2 0.6Mar82 7911 100.0 1.8 5907 97.2 -0.1Jan 8070 102.0 2.0 5858 96.4 -0.8
, Sep 8147 103.0 1.0 5768 94.9 -1.5Dec 8094 102.3 -0.6 5647 92.9 -2.1Mar83 7948 100.5 -1.8 5564 91.5 -1.5Jun 7787 98.4 -2.0 5570 91.6 0.1Sep 7704 97.4 -1.1 5656 93.0 1.5Dec 7747 97.9 0.6 5789 95.2 2.4Mar84 7837 99.1 1.2 5909 97.2 2.1Jun 7906 99.9 0.9 5977 98.3 1.1Sep 7927 100.2 0.3 6020 99.0 0.7Dec 7912 100.0 -0.2 6080 100.0 1.0

40 From There to Back Again?
Table D: Real Wages and Real Demand Per CapitaJuly 1966 to December 1993, Trend (Cont.)
National turnover of goods &Non-farm WSS per WSEla) services per capit.a
($Dec93) Index(b) (%) ($Dec93) Index(b) (%)
Mar85 7884 99.6 -0.4 6171 101.5 1.5Jun 7848 99.2 -0.5 6270 103.1 1.6Sep 7827 98.9 -0.3 6343 104.3 1.2Dec 7793 98.5 -0.4 6308 103.7 -0.6Mar86 7761 98.1 -0.4 6257 102.9 -0.8Jun 7748 97.9 -0.2 6219 102.3 -0.6Sep 7714 97.5 -0.4 6214 102.2 -0.1Dec 7652 96.7 -0.8 6226 102.4 0.2Mar87 7594 96.0 -0.8 6254 102.9 0.4Jun 7564 95.6 -0.4 6316 103.9 1.0Sep 7570 95.7 0.1 6408 105.4 1.5Dec 7584 95.9 0.2 6488 106.7 1.2Mar88 7571 95.7 -0.2 6508 107.0 0.3Jun 7554 95.5 -0.2 6533 107.5 0.4Sep 7590 95.9 0.5 6595 108.5 1.0Dec 7635 96.5 0.6 6707 110.3 1.7Mar89 7661 96.8 0.3 6823 112.2 1.7Jun 7647 96.6 -0.2 6900 113.5 1.1Sep 7622 96.3 -0.3 6941 114.2 0.6Dec 7641 96.6 0.2 6939 114.1 -0.0
Mar90 7702 97.3 0.8 6898 113.5 -0.6Jun 7754 98.0 0.7 6845 112.6 -0.8Sep 7777 98.3 0.3 6791 111.7 -0.8Dec 7744 97.9 -0.4 6746 111.0 -0.7Mar91 7701 97.3 -0.6 6714 110.4 -0.5Jun 7713 97.5 0.2 6711 110.4 -0.1Sep 7784 98.4 0.9 6730 110.7 0.3Dec 7856 99.3 0.9 6765 111.3 0.5Mar92 7905 99.9 0.6 6794 111.8 0.4Jun 7915 100.0 0.1 6839 112.5 0.7Sep 7956 100.6 0.5 6881 113.2 0.6Dec 8038 101.6 1.0 6922 113.9 0.6Mar93 8115 102.6 1.0 6944 114.2 0.3Jun 8141 102.9 0.3 6980 114.8 0.5Sep 8112 102.5 -0.4 7025 115.5 0.6Dec 8048 101.7 -0.8 7080 116.5 0.8
wss - wages, salaries & supplements.WSE - wage & salary earner.
(a) Break in series prior to June 1971.(b) December 1984 = 100.
Sources: ABS Cat. Nos. 3101.0, 5206.0, 6204.0.

From There to Back Again? 41
Conclusion
The history of the past thirty years indicates that Australia faces anapparent trade-off between unemployment and inflation only on anirregular basis. While the recent success against inflation meansAustralia, for the first- time since the late 1960's, faces the prospectof an extended period of stable prices, immediate prospects forachieving full employment are much more doubtful.
The persistently poor performance of the Australian labour marketmust cast strong doubt on the appropriateness of Australia's basicinstitutional labour market arrangements. The last thirty years doesindicate that poor or inappropriate macroeconomic policy clearly canreduce Australia's economic performance. However, the evidence doesnot readily support the notion that macroeconomic policy cansuccessfully, for any length of time, compensate for more basicinstitutional failings.
It has been argued that the postwar experience of full employmentwas a-typical and we are in fact reverting to a more "normal" stateof affairs2
• We are now almost 20 years away from the experience offull employment: albeit the experience of30 years offull employment.But countries to our north are now well into the experience of fullemployment. Employment outcomes are not the result of historicalinevitabilities but of the interaction between institutions .andcircumstances. In the current international circumstances, theinstitutions of East Asia produce 2-4% unemployment, those ofAustralia 10% unemployment, those ofthe USA 6-7% unemployment,those of Western Europe 4-18% unemployment. We can do littleabout international circumstances but we can, ifwe have the will, dosomething about our institutions.
2. From 1890 to 1940, Australia's unemployment rate does not appear to have fallenbelow about 5% and was often considerably above that - cf. B1ainey, Geoffrey"Baffied by the Lessons of the Past" ,The Australian, 5 May 1994.

42 From There to Back Again?
Appendix:Deregulation & Income Support
Historically, one ofthe main grounds for labour market regulation inAustralia has been to achieve redistributive goals. The purpose ofthis Appendix is to examine the costs of using regulation to achievethese redistributive goals. Comparison is made with use of directincome support in a deregulated labour market. The purpose of thisAppendix is not to recommend a particular policy, but to explore thefeasibility of attaining redistributive goals in a deregulated labourmarket and indicate difficulties with current arrangements.
Regulatory Cost Shortfall
The closest equivalent to a minimum adult full time wage underfederal awards is $333.40 per week for a base level non-tradesengineering worker (Le. $9 per hour for a 38 hour week). Taking thatas the accepted minimum standard for wages, to employ all thoseunemployed in August 19933
, or who were employed and receivedless than $9 per hour, would require extra expenditure on labour ofapproximately $16.5bn p.a. without counting labour on-costs. As oncosts equal about one third of payment for time worked, on-costswould raise the total cost to about $22bn p.a.. That would representa rise of 11% in current total expenditure on wages, salaries andsupplements.
To put it another way, the Australian labour market falls about$22bn short ofexpenditure on labour required to employ all employedand unemployed Australians to minimum federal award standardswithout reducing the income of other employed Australians.Australian labour law's current requirements do not match expresseddemand for labour.
Direct Income Support
As an alternative to merely decreeing that a certain amount shall bepaid, the Commonwealth (and State) governments could instead'deregulate the labour market while the Commonwealth guaranteesthat adults' income would not fall below $9 per hour for up to 36hours worked (counting highest paid hours first) and 15-19 year olds'income would not fall below $6 per hour, provided the employer paidat least $3 per hour by "topping up" such income to the guaranteedlevel.
3. August 1993 is the latest reporting period for which requisite data on distributionof earnings is available.
From There to Back Again? 43
Assuming that everyone was able to get work at $3 an hour (i.e. thatevery unemployed person was employable at $120 per week for a 40hour job plus $40 on-costs), then such a guarantee would cost theCommonwealth government approximately $13.5bn plus $770m inadministrative costs. For an outlay of $14.3bn, the Commonwealthgovernment could achieve full employment, save $1.7bn on labourmarket programs and $7.2bn in income support for the unemployed(1994-95 budget figures) plus receive a tax "clawback" of about$2.4bn. The net cost would be about $3bn p.a. or about 2.5% of totalbudget outlays.
If successful, such a system would be highly redistributive to lowincome earners - a full time job at $9 per hour after "top_up" wouldpay about $16,750 p.a. compared to current maximum Newstartadult single rate of $7,646.60 p.a. ($147.05 per week).
It would also continue and extend the long term trend of incomesupport policy - begun with Family Income Supplement then FamilyAllowance Supplement and now with Additional Family Payment andother recent changes, particularly from the Employment White Paper- to move towards the supporting the income of low income workersvia direct paymentlbenefits. It would provide a broad mechanism forprotecting the income oflower skilled Australian workers against theimpact of competition from lower wage countries.
After twenty years of mass unemployment, and with theunemployment rate still above 10%, Australia needs someimaginative policy if it is to once again be able to provide a
., satisfactory level of employment.i'J,;

44 From There to Back Again?
Table El: Distribution of Earnings and Hours, All EmployeesAugust 1993
Hours workedLower Upper 1-19 20-29 30-34 35-39 40 41-44 45-48 49+
($) ($) (OOOs) (OOOs) (OOOs) (OOOs) (OOOs) (OOOs) (OOOs) (OOOs)
80 289.1 4.1 1.7 4.2 4.6 . 0.0 1.8 6.880 160 313.0 26.0 6.2 8.5 7.8 1.0 1.9 8.2
160 200 108.8 35.2 5.7 13.5 18.6 0.8 1.7 6.5200 240 74.9 67.8 12.4 34.5 28.1 1.9 5.9 9.0240 280 52.6 90.4 18.3 35.5 35.9 3.1 3.4 9.3280 320 31.8 71.5 30.9 62.3 46.6 6.3 6.1 9.8320 360 24.0 53.1 42.1 110.1 79.3 10.1 10.5 16.3360 400 21.0 34.8 33.2 178.7 130.3 13.8 13.5 19.2400 440 19.5 23.4 24.3 203.6 142.6 21.2 18.8 26.3440 480 13.6 17.3 21.8 188.4 125.4 26.6 25.3 25.3
480+ 72.7 105.1 112.0 1,087.1 683.1 258.3 518.4 149.3
Total allemployees 1,021.0 528.7 308.6 1,926.4 1,302.3 343.1 607.3 286.0
Total Full-time(a) Part Annual15-19 time Income
($) ($) (OOOs) (OOOs) (OOOs) (OOOs) ($)
80 312.6 19.0 1.5 293.6 4,160.080 160 372.6 40.7 11.3 331.9 8,320.0
160 200 191.0 49.9 23.8 141.1 10,400.0200 240 234.6 91.9 41.3 142.7 12,480.0240 280 248.5 103.9 38.1 144.6 14,560.0280 320 265.4 149.0 29.0 116.4 16,640.0320 360 345.7 244.3 21.4 101.4 18,720.0360 400 444.6 377.3 17.7 67.3 20,800.0400 440 480.0 429.7 8.6 50.3 22,880.0440 480 444.1 411.1 3.1 33.0 24,960.0
480+ 2,984.3 2,873.3 7.3 111.0
Total all employees 6,323.4 4,790.1 203.1 1,533.3
(a) In main job. Includes some who worked less than 35 hours per week.
Source: ABS Cat. No. 6310.0.

From There to Back Again? 45
Table E2: Hourly Rates
Hours worked1-19 20-29 30-34 35-39 40 41-44 45-48 49+
If worked maximum hoursLower Upper ($ph) ($ph) ($ph) ($ph) ($ph) ($ph) ($ph) ($ph)
80 4.2 2.8 2.4 2.1 2.0 1.8 1.7 1.680 160 8.4 5.5 4.7 4.1 4.0 3.6 3.3 3.3
160 200 10.5 6.9 5.9 5.1 5.0 4.5 4.2 4.1200 240 12.6 8.3 7.1 6.2 6.0 5.5 5.0 4.9240 280 14.7 9.7 8.2 7.2 7.0 6.4 5.8 5.7280 320 16.8 11.0 9.4 8.2 8.0 7.3 6.7 6.5320 360 18.9 12.4 10.6 9.2 9.0 8.2 7.5 7.3360 400 21.1 13.8 11.8 10.3 10.0 9.1 8.3 8.2400 440 23.2 15.2 12.9 11.3 11.0 10.0 9.2 9.0440 480 25.3 16.6 14.1 12.3 12.0 10.9 10.0 9.8
lfworked minimum hoursLower Upper ($ph)(a) ($ph) ($ph) ($ph) ($ph) ($ph) ($ph) ($ph)
80 8.0 4.0 2.7 2.3 2.0 2.0 2.0 1.680 160 16.0 8.0 5.3 4.6 4.0 3.9 3.9 3.3
160 200 20.0 10.0 6.7 5.7 5.0 4.9 4.9 4.1200 240 24.0 12.0 8.0 6.9 6.0 5.9 5.9 4.9240 280 28.0 14.0 9.3 8.0 7.0 6.8 6.8 5.7280 320 32.0 16.0 10.7 9.1 8.0 7.8 7.8 6.5320 360 36.0 18.0 12.0 10.3 9.0 8.8 8.8 7.3360 400 40.0 20.0 13.3 11.4 10.0 9.8 9.8 8.2400 440 44.0 22.0 14.7 12.6 11.0 10.7 10.7 9.0440 :480' 48.0 24.0 16.0 13.7 12.0 11.7 11.7 9.8
(a) Assumes worked 10 hours.

46 From There to Back Again?
References
"A Cruise Around the Phillips Curve" Schools Brief, The Economist,Feb 19th 1994. Pp 70-71.
Blainey, Geoffrey, "Baffled by the Lessons of the Past", TheAustralian, 5 May 1994.
Layard, P. R. G., Nickell, S. J. & Jackman, R., Unemployment:Macroeconomic Performance and the Labour Market, OxfordUniversity Press, Oxford, 1991.
Phelps, Edmund S., "Phillips Curves", Eatwell, John, Milgate,Murray & Newman, Peter (eds), The New Palgrave: A Dictionary ofEconomics, Macmillan, Stockton, Maruzen, 1987, Pp 858-860.
Phillips, A. W., "The Relations Between Unemployment and the Rateof Change of Money Wages in the United Kingdom, 1861-1957",Economics 25, November 1958, Pp 283-99.
Pitchford, John, "The Phillips Curve", Bell G. & Hessian B. (eds), The'Economy in Reform, VCTA, 1993. Pp 128ft'.
Stammer, Don, "How Inflation Acts to Limit Employment" , BusinessReview Weekly, May 21994, P.44.
'\J


PARLIAMENTARYRESEARCHSERVICE PUBLICATIONS
No. Title Autbor/Group ContactE:densiOIJ
BACKGROUND PAPERS 1993
1 The 1942 Singapore disaster: assessing recent claims G. Brown/FADT 2451
2 AustralialNew Zealand: Closer Defence Relations G. Brown/FADT 2451
3 Overview of ecologically sustainable development M.Emery 2475and processes in Austrslia, 1990-92 consultant/ECIR
4 Private sector input to the APEC process J.Adams 2475consultant/ECIR
5 Labour Market Deregulation: the New ZealandExperience S.O'Neill/ECIR 2474
6 Seeking Spratly Solutions: Maritime Tensions inthe South China Sea A. ShephardIF'ADT 2551
7 Monarchy or Republic? Constitutional optionsfor States A. TwomeylLPA 2431 ~
8 The Multiculturalism and Immigration Debate1973 - 1993 J. Gardiner-GardenlSP 2411
9 Youth Issues A. Millbankconsultant/SP 2411
10 The Awakened Dragon: Chinese Foreign Policyin the 19908 B. Martin/FADT 2441
11 Politics in Fiji: Just a Question of Race? S. SherlockIFADT 2441
12 Methods of Choosing a Head of State A. TwomeylLPA 2431
13 Inflation Fighting and Reserve Bank Reform in N.Z. P. Hanratty/ECIR 2474
14 Commonwealth Government Assistance for A. BurdonAdjustment in Agriculture Consultant/ECIR 2474
15 A Guide through the Mabo maze A. TwomeylLPA 2431
16 International Year of the Family 1994 S. McInnisconsultant/SP 2456
17 Monarchy or Republic? Reserve Powers of theHead of State Y. MarshILPA 2476
18 Monarchy or Republic? A comparative outlineof major Presidential powers 1. IrelandILPA 2476
19 Sex Discrimination Legislation in Austrslia C. Larmour/SP 2456
20 Comparisons of 1991 Census Characteristics:Commonwealth Electoral Divisions A. Kopras/Stats 2482
21 void


No. Title Author/Groap ContactErtension
ISSUES BRIEFS 1993
1 Index to Parliamentary Questions on Defence: 1992 G. Brown/FADT 245i
2 Racial Vilification and Freedom of Speech A. TwomeylLPA 2431
3 1993 Elections: Preliminary Results G. Newman/Stats 2481
4 Report: Outlook 93 Conference (Minerals and Energy) P. Kay/STER 2421
5 'Office of Profit under the Crown' and Membership ofthe Commonwealth Parliament K. ColelLPA 2431
6 The Voyager Disaster: A 30 Year Saga D. AndersonIFADT 2451
7 Cambodia Prepares for Elections F. FrostlFADT 2441
8 Data-matching in Commonwealth Administrations M. Mason/LPA 2431
9 General Revenue Grants and the 1993 FinancialPremiers' Conference D. Batts/ECIR 2474
10 Waste not? Recycling and waste minimisation B. McCormick/STER 2421
11 Australian Battles on the Western Front During WWI D. AndersonIFADT 2451
12 Petrol Prices Beat the Budget - Taxing without Y. Marsh/LPA 2431Authority
13 Sales Tax and Refunds: the Mutilal Pools Case B. BaileylLPA 2646
14 Taking risks for Peace: the Israeli-PLODeclaration of Principles M.Ong/FADT 2441
15 Effects of Sub-clinica1 levels of lead in Children R. Panter/STER 2421
16 Immigration and Unemployment - a symposium report P. Hanratty/ECIR 2474
17 Australia's Oversease Aid Program: An Analysis of S. Sherlock/FAthe 1993-94 Aid Budget
This series has been discontinued. From 11 November these publications will be known asCurrent Issues Briefs.

No. Title AuthorIGmup Contact.ErleDsicm
CURRENT ISSUES BRIEFS 1993
1 APEC's Seattle Meetings: Issues for Australia F. Frost/FADT 2441
2 Are State revenues safe or does the confusionremain?: The High Court Decision in the CapitslDuplicators (No 2) Case B. Bailey/LPA 2431
3 The Native Title Bill - Impact on the States A. Twomey/LPA 2431
4 When the tsllring had to stop: The end of theUruguay Round M. WarbylFADT 2441
~>
,;.j,


No. Title AuthorIG:roup ContactEJcteDsion
BACKGROUND PAPERS 1994
l. House of Representatives By-elections 1949-1994 G. Newman/Stats 2481
2. Medicare, Private Health Insurance and Propoeals P. Mackey/SP 2412for Change
3. The Sad Lack of Magic Pudding; Problems with M. Warby/Stats 2485Protectionism
4. State Election Dates M.Healy&M. BinilLPA ·2476
5. Arts Poliey in AustraliaA history' of Commonwealth involvement in the arts J. Gardiner-Garden/SP 2415
6. Agricultural, Livestock & Forestry' Levies & Charges J. Fleming1. Ireland/LPA 2438
7. Index to Parliamentary' Questions on Defence: G. Brown/FADT 2452
8. Growth and Employment Strategies: Europe, Japan & S. O'Neill&US P. Hanratty/ECm 2463

No. flUe Autbor/GI'Uflp ContactEztension
CURRENT ISSUES BRIEFS 1994
1 "Restoring Full Employment": An Overview S. O'NeillG. Winter &D. Daniels ECIR/SP 2457
2 Report: Outlook 94 Conference (Minerals and Energy) P. KaylSTER 2421
3 Reducing Unemployment: A Conference Report
4 Assessments of the Economic Outlook
P.Hanratty/ECIR
J. Kain/ECIR
2457
2460
5. Japan and the Hosokawa Government: A PreliminaryPost-mortem M UnderdownlFADT 2443
6. Strange Bedfellows: The United Nations HumanRights Committee and the Tasmanian Parliament A TwomeylLPA
7. Population Policies: Family Planning andReproductive Rights C. LarmourlSP
8. A House Divided: The South Mrican Election ofApril 1994 A. ShephardlFADT
9. Australia's Overseas Aid Program: An analysis ofthe 1994-95 Aid Budget R. Tomar/FADT
10. The Killing Fields of Rwanda A. Shephard/FADT
2432
2410
2450
2459
2450

,
,
No. 7itle Aut1lorJ{lroup QmtactE:cteDsiaIJ
RESEARCHPAPERS 1994
1 National competition Policy: Overviewand Assessment J. Kain/ECIR 2460
2 Natural Gas - An Australian Growth Industry P. Kay/STER 2422