front standard v 3.5 - usgs tools in the bha included the geovision resis- tivity, the ecoscope, the...
TRANSCRIPT

Site NGHP-01-06
By T. Collett, M. Riedel, J. Cochran, R. Boswell, J. Presley, P. Kumar, A. Sathe, A. Sethi, M. Lall, and the National Gas Hydrate Program Expedition 01 Scientists
Scientific Investigations Report 2012–5054
U.S. Department of the InteriorU.S. Geological Survey


Contents
Background and Objectives .....................................................................................................................385Operations ...................................................................................................................................................385
Hole NGHP-01-06A............................................................................................................................385Downhole Hogging ....................................................................................................................................386
Logging While Drilling ......................................................................................................................386Operations .................................................................................................................................386Gas Monitoring with Real Time LWD/MWD Data ...............................................................386LWD Log Quality .......................................................................................................................389
LWD Porosities ..................................................................................................................................393LWD Borehole Images .....................................................................................................................393Gas-Hydrate and Free Gas Occurrence .......................................................................................393
References Cited........................................................................................................................................396
Figures 1. Location of Site NGHP-01-06 (Prospectus Site KGGH04) in the Krishna-
Godavari (KG) Basin .................................................................................................................386 2. Section of 2D seismic line AD-94-39 around Site NGHP-01-06 (Prospectus
Site KGGH04) showing a broad basin and an extensive BSR occurrence .....................387 3. Section of seismic line AD-94-39 around Site NGHP-01-06 (Prospectus
Site KGGH04) showing predicted formation depths and BSR depth (~210 mbsf) based on a uniform seismic velocity of 1,580 m/s ...............................................................388
4. Map showing the hole occupied at Site NGHP-01-06 (KGGH01-A) ..................................389 5. Monitoring and quality control LWD/MWD logs from Hole NGHP-01-06A .....................390 6. Summary of LWD log data from Hole NGHP-01-06A...........................................................391 7. Comparison of LWD resistivity curves from Hole NGHP-01-06A with the
attenuation and phase resistivity curves obtained by the EcoScope tool at different frequencies and transmitter-receiver spacings .............................................392
8. LWD image data from Hole NGHP-01-06A ............................................................................394 9. Water saturations from Archie’s equation and LWD porosity and resistivity
logs in Hole NGHP-01-06A .......................................................................................................395


Site NGHP-01-06
By T. Collett, M. Riedel, J. Cochran, R. Boswell, J. Presley, P. Kumar, A. Sathe, A. Sethi, M. Lall, and the National Gas Hydrate Program Expedition 01 Scientists
OperationsThis operations summary covers the transit from Site
NGHP-01-05 (KGGH02-A) to Site NGHP-01-06 (KGGH04-A) and LWD/MWD drilling operations in Hole NGHP-01-06A. Schedule details and statistics for this site can be found as Appendixes:
• Appendix 1: NGHP Expedition 01 Operations Schedules• Appendix 2: NGHP Expedition 01 Operations StatisticsIncluded in the Glossary is a list of standard or commonly
used operations terms and acronyms.
Hole NGHP-01-06AThe 5.5 NMI transit from Site NGHP-01-05 to Site
NGHP-01-06 was completed in 1.25 hr at an average speed of 4.4 kt.
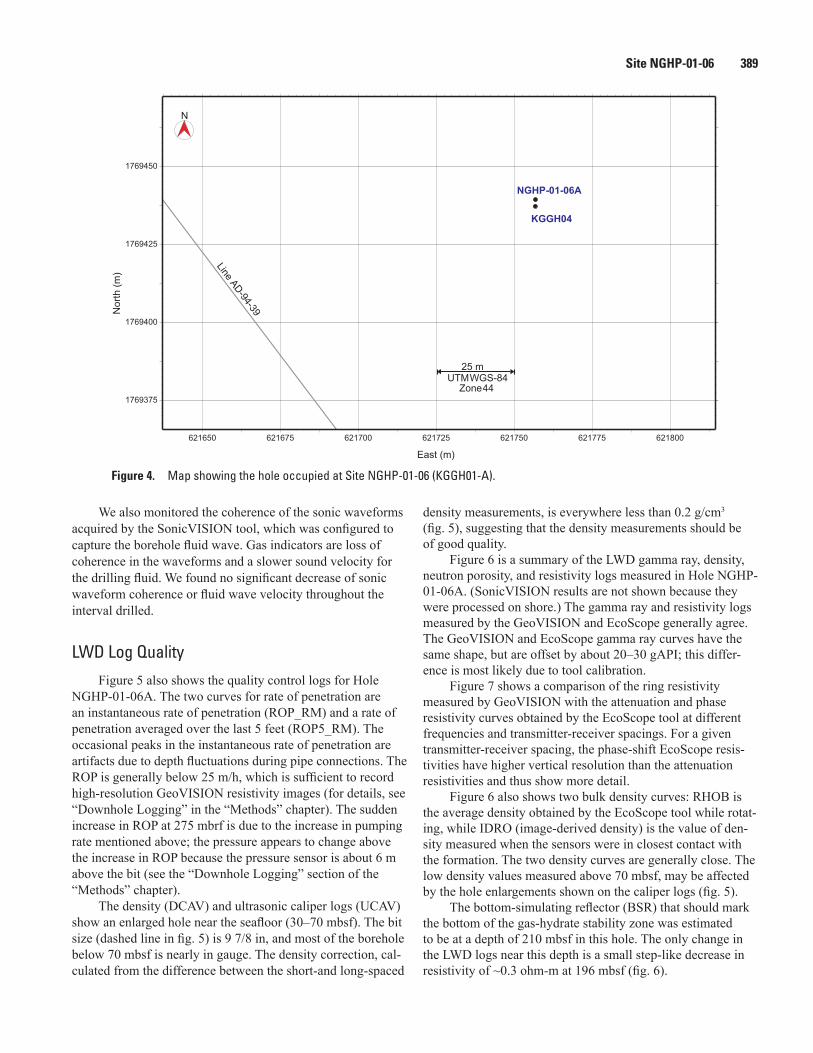
The first and only hole of Site NGHP-01-06 was drilled on Leg 2 of Expedition 01 as the sixth hole of a 12-hole LWD/MWD transect (fig. 4). The sea voyage ended at 1824 hr May 25, 2006; thrusters/hydrophones were immediately lowered. The vessel was switched from cruise mode to DP control at 1845 hr and at 1900 hr a positioning beacon was deployed at the Hole NGHP-01-06A location coordinates. The LWD/MWD tools, consist-ing of the GeoVISION (RAB), EcoScope, SonicVISION, and TeleScope, were assembled. A continuity test was conducted just below the water line and then the pipe was pulled back up to load the nuclear source. The drill string was subsequently lowered to the seafloor and the drill string was spaced out for spudding. A tag of the seafloor indicated a mudline depth of 1,171.0 mbrf. For ref-erence, the PDR depth at this site, adjusted to the rig floor DES, was 1,172.4 mbrf. After offsetting the vessel two meters N of the site coordinates, Hole NGHP-01-06A was spudded at 2355 hr on May 25. LWD/MWD drilling continued at a controlled rate of 18.3 m/h (or 15.4 m/h average net ROP including connection time) to a total depth of 350.0 mbsf. The hole was displaced with 110 barrels of 10.5 ppg mud, the top drive was set back, and the drill string was pulled clear of the seafloor at 0105 hr May 27, 2006. After removing the nuclear source and downloading data, the LWD/MWD BHA was racked back in the derrick. The rig was secured for transit, the beacon recovered, and the vessel got underway for Site NGHP-01-07 (KGGH06-A) at 0505 hr. This completed operations at Site NGHP-01-06.
Background and ObjectivesSite NGHP-01-06 (Prospectus Site KGGH04) is located
at 16° 0.0928' N, 82° 08.2767' E in the Krishna-Godavari (KG) Basin (fig. 1). The water depth is ~1,160 m. This site was not selected as a primary coring site and only LWD/MWD data were recorded.
The objectives of the work carried out at this site follow the general objectives of NGHP Expedition 01, with a focus on the LWD/MWD operations only:
• Study the occurrence of gas hydrate and estab-lish the background geophysical baselines for gas hydrate studies;
• Define the relationship between the sedimentology and structure of the sediments and the occurrence and concentration of gas hydrate;
• Calibrate remote sensing data such as seismic data by acquiring LWD/MWD data;
Site NGHP-01-06 is located along seismic line AD-94-39 (shot point 438), which illustrates the typical sequence of ridges and basins of the KG Basin (fig. 2). BSR is visible through most of the section, but it appears best imaged where it cross-cuts steeply-dipping reflectors (for example, at shot points 260 to 280 and 420 to 470). The BSR deepens to the SE as water depth gradually increases and at Site NGHP-01-06 it is located at 210 MBSF based on a 0.266 s TWT and a seismic velocity of 1,580 m/s.
Above and below the BSR, several high-amplitude, steeply dipping reflectors are identified (fig. 3). Below the GHSZ the high amplitude may be the result of free gas, whereas higher amplitude above the BSR may be attributed tothe presence of gas hydrate in the sediments. Reflec-tors entering the GHSZ from below the BSR do not appear to switch seismic polarity (from free gas to gas hydrate). Three distinct reflections can be made out within the GHSZ: the shallowest occurs at around 50 mbsf followed by a second strong reflection at ~95 mbsf; the third layer is at ~145 mbsf.
Site NGHP-01-06 is located such that it avoids the largest seismic amplitudes below the BSR and maximum hole pen-etration was therefore set to 350 mbsf.

386 Indian National Gas Hydrate Program Expedition 01 Report
GDGH10
GDGH13
GDGH11
KGGH04NGHP-01-06
GDGH14
KGGH02GDGH12-A
KGGH01
GDGH05
GDGH16GDGH05-A
GDGH06
GDGH15KGGH05
GD-3-1
KGGH03
KGGH03-A
GDGH12
GDGH14-AKGGH02-A
Depth (m)
Latit
ude
Longitude
16° 15'
16° 00'
15° 45'
81°30' 81°45' 82°00' 82°15' 82°30'
500
0
-500
-1000
-2500
-2000
-1500
-3000
Figure 1. Location of Site NGHP-01-06 (Prospectus Site KGGH04) in the Krishna-Godavari (KG) Basin.
Downhole Hogging
Logging While Drilling
OperationsAfter tagging the seafloor at 1,171 mbrf (driller’s depth),
Hole NGHP-01-06A was spudded at 2355 hr on May 25, 2006. LWD tools in the BHA included the GeoVISION resis-tivity, the EcoScope, the SonicVISION, and the TeleScope MWD. For details on each LWD tool and measurements, see the “Downhole Logging” section in the “Methods” chapter.
To avoid washing out the formation near the seafloor, Hole NGHP-01-06A was spudded at a relatively low flow rate. The first 10 m were drilled at 100 gallons per minute (gpm) with a rotation rate of 20 rotations per minute (rpm) and a rate of pen-etration (ROP) of 25 m/h. Below 10 mbsf, the rotation rate was increased to 30 rpm; over the range of 30–35 mbsf, the rotation rate was increased to 60 rpm and the flow rate was increased to ~370 gpm until the LWD tools turned on, while keeping a ROP of 25 m/h. The target depth of 350 mbsf (1,521 mbrf) was reached at 2305 hr on May 26, 2006. After pulling the entire drill string to the surface, data download and rig down were completed at 0435 hr on 26 May. (The depths in mbsf mentioned above are referenced to the seafloor depth tagged by the driller.)
Gas Monitoring with Real Time LWD/MWD Data
The LWD logs were acquired in the first holes drilled at Site NGHP-01-06 to plan coring and pressure coring operations in subsequent holes. As Hole NGHP-01-06A was drilled without coring, the LWD data had to be monitored for safety to detect gas entering the wellbore. As explained in the “Downhole Logging” section of the “Methods” chapter, the primary measurement used for gas monitoring was the “annular pressure while drilling” (APWD) measured by the EcoScope tool in the borehole annulus. We looked for sudden decreases of more than 100 psi in the annular pressure, which could be due to low-density gas entering the wellbore. We also monitored pressure increases of the same magnitude, which could be due to fluid acceleration caused by a gas kick (Aldred and others, 1998).
Figure 5 shows the borehole fluid pressure profile mea-sured in Hole NGHP-01-06A after subtraction of the hydro-static pressure. This residual pressure curve shows only minor fluctuations that are well below the 100 psi level that would have required preventive action. The most significant feature in the residual pressure is a sudden increase of about 40 psi at 269 mbsf, which happened when the pumping flow rate was increased to about 500 gpm to improve the rate of penetration in a resistant interval.

Site NGHP-01-06
387
240 260 280 300 320 340 360 380 400 420 440 460 480 5006000 7000 8000 9000 10000 11000 12000 13000 14000 15000 16000 17000 18000
NGHP-01-14A
KGGH04NGHP-01-06
1.2
1.3
1.4
1.5
1.6
1.7
1.8
1.9
2.0
2.1
2.2
2.3
Two-
way
trav
el ti
me
(s)
BSR
BSR
SP:Offset (m):
SENW
Figure 2. Section of 2D seismic line AD-94-39 around Site NGHP-01-06 (Prospectus Site KGGH04) showing a broad basin and an extensive BSR occurrence. Site NGHP-01-14 is also located along this line, about 8 km upslope to the NW. [BSR, bottom-simulating reflector]

388
Indian National Gas Hydrate Program
Expedition 01 Report
50 m
100 m
150 m
200 mBSR
250 m
300 m
350 m
410 420 430 440 450 460 470 48015000 16000 17000 18000
KGGH04NGHP-01-06
1.6
1.7
1.8
1.9
2.0
2.1
2.2
SENW
Two-
way
trav
el ti
me
(s)
SP:Offset (m):
Figure 3. Section of seismic line AD-94-39 around Site NGHP-01-06 (Prospectus Site KGGH04) showing predicted formation depths and BSR depth (~210 mbsf) based on a uniform seismic velocity of 1,580 m/s. [BSR, bottom-simulating reflector]
Site NGHP-01-06 389
We also monitored the coherence of the sonic waveforms acquired by the SonicVISION tool, which was configured to capture the borehole fluid wave. Gas indicators are loss of coherence in the waveforms and a slower sound velocity for the drilling fluid. We found no significant decrease of sonic waveform coherence or fluid wave velocity throughout the interval drilled.
LWD Log QualityFigure 5 also shows the quality control logs for Hole
NGHP-01-06A. The two curves for rate of penetration are an instantaneous rate of penetration (ROP_RM) and a rate of penetration averaged over the last 5 feet (ROP5_RM). The occasional peaks in the instantaneous rate of penetration are artifacts due to depth fluctuations during pipe connections. The ROP is generally below 25 m/h, which is sufficient to record high-resolution GeoVISION resistivity images (for details, see “Downhole Logging” in the “Methods” chapter). The sudden increase in ROP at 275 mbrf is due to the increase in pumping rate mentioned above; the pressure appears to change above the increase in ROP because the pressure sensor is about 6 m above the bit (see the “Downhole Logging” section of the “Methods” chapter).
The density (DCAV) and ultrasonic caliper logs (UCAV) show an enlarged hole near the seafloor (30–70 mbsf). The bit size (dashed line in fig. 5) is 9 7/8 in, and most of the borehole below 70 mbsf is nearly in gauge. The density correction, cal-culated from the difference between the short-and long-spaced
density measurements, is everywhere less than 0.2 g/cm3 (fig. 5), suggesting that the density measurements should be of good quality.
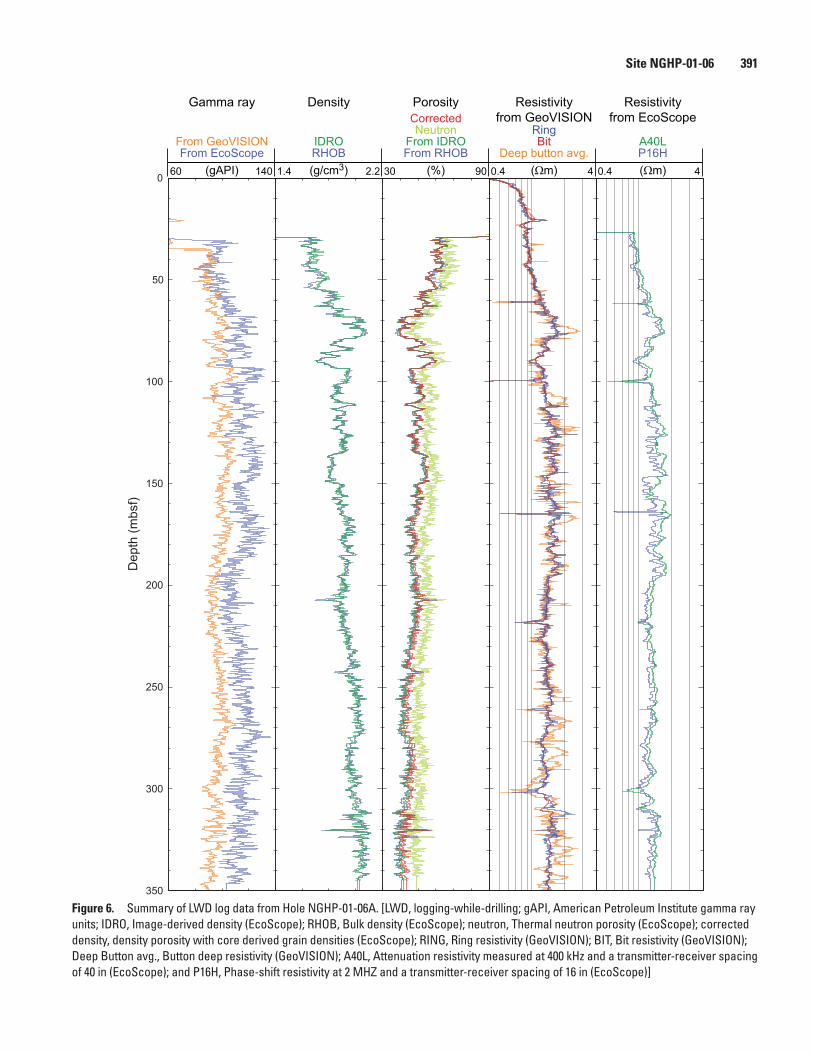
Figure 6 is a summary of the LWD gamma ray, density, neutron porosity, and resistivity logs measured in Hole NGHP-01-06A. (SonicVISION results are not shown because they were processed on shore.) The gamma ray and resistivity logs measured by the GeoVISION and EcoScope generally agree. The GeoVISION and EcoScope gamma ray curves have the same shape, but are offset by about 20–30 gAPI; this differ-ence is most likely due to tool calibration.
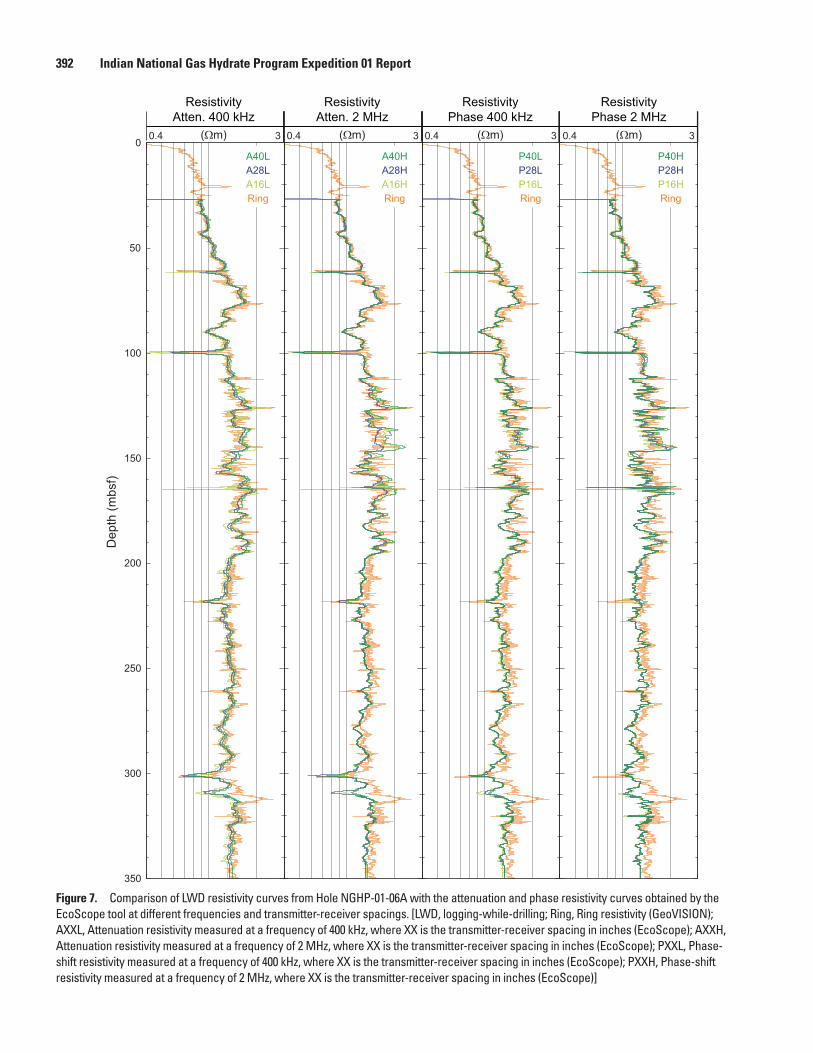
Figure 7 shows a comparison of the ring resistivity measured by GeoVISION with the attenuation and phase resistivity curves obtained by the EcoScope tool at different frequencies and transmitter-receiver spacings. For a given transmitter-receiver spacing, the phase-shift EcoScope resis-tivities have higher vertical resolution than the attenuation resistivities and thus show more detail.
Figure 6 also shows two bulk density curves: RHOB is the average density obtained by the EcoScope tool while rotat-ing, while IDRO (image-derived density) is the value of den-sity measured when the sensors were in closest contact with the formation. The two density curves are generally close. The low density values measured above 70 mbsf, may be affected by the hole enlargements shown on the caliper logs (fig. 5).
The bottom-simulating reflector (BSR) that should mark the bottom of the gas-hydrate stability zone was estimated to be at a depth of 210 mbsf in this hole. The only change in the LWD logs near this depth is a small step-like decrease in resistivity of ~0.3 ohm-m at 196 mbsf (fig. 6).
NGHP-01-06A
KGGH04
621650 621675 621700 621725 621750 621775 621800
1769375
1769400
1769425
1769450
NN
orth
(m)
East (m)
25 mUTMWGS-84
Zone44
Line AD-94-39
Figure 4. Map showing the hole occupied at Site NGHP-01-06 (KGGH01-A).

390 Indian National Gas Hydrate Program Expedition 01 ReportD
epth
(mbs
f)
Bit size
Density correctionHole diameterRate of penetrationResidual pressure-50 50 0 100 8 13 -0.3 0.3(g/cm3)(in)(m/h)(psi)
ROP5 RM UCAVROP RM DCAV
0
50
100
150
200
250
300
350
Figure 5. Monitoring and quality control LWD/MWD logs from Hole NGHP-01-06A. [LWD/MWD, logging-while-drilling/measurement-while-drilling; ROP_RM, Instantaneous rate of penetration; ROP5_RM, Rate of penetration averaged over a 5-ft interval; UCAV, Ultrasonic caliper; DCAV, Density caliper]
Site NGHP-01-06 391
Figure 6. Summary of LWD log data from Hole NGHP-01-06A. [LWD, logging-while-drilling; gAPI, American Petroleum Institute gamma ray units; IDRO, Image-derived density (EcoScope); RHOB, Bulk density (EcoScope); neutron, Thermal neutron porosity (EcoScope); corrected density, density porosity with core derived grain densities (EcoScope); RING, Ring resistivity (GeoVISION); BIT, Bit resistivity (GeoVISION); Deep Button avg., Button deep resistivity (GeoVISION); A40L, Attenuation resistivity measured at 400 kHz and a transmitter-receiver spacing of 40 in (EcoScope); and P16H, Phase-shift resistivity at 2 MHZ and a transmitter-receiver spacing of 16 in (EcoScope)]
Dep
th (m
bsf)
0
50
100
150
200
250
300
350
Corrected
60 140 1.4 2.2 30 90 0.4 4 0.4 4(gAPI) (g/cm3) (%) (Ωm) (Ωm)From EcoScope RHOB From RHOB Deep button avg. P16H
From GeoVISION IDRO From IDRO Bit A40LNeutron Ring
Gamma ray Density Porosity Resistivityfrom GeoVISION
Resistivityfrom EcoScope
392 Indian National Gas Hydrate Program Expedition 01 Report
Dep
th (m
bsf)
A40LA28LA16L
P40HP28HP16H
P40LP28LP16L
A40HA28HA16H
0
50
100
150
200
250
300
350
ResistivityAtten. 400 kHz
0.4 3 0.4 3 0.4 3 0.4 3(Ωm)
ResistivityPhase 2 MHz
(Ωm)
ResistivityPhase 400 kHz
(Ωm)
ResistivityAtten. 2 MHz
(Ωm)
Ring RingRingRing
Figure 7. Comparison of LWD resistivity curves from Hole NGHP-01-06A with the attenuation and phase resistivity curves obtained by the EcoScope tool at different frequencies and transmitter-receiver spacings. [LWD, logging-while-drilling; Ring, Ring resistivity (GeoVISION); AXXL, Attenuation resistivity measured at a frequency of 400 kHz, where XX is the transmitter-receiver spacing in inches (EcoScope); AXXH, Attenuation resistivity measured at a frequency of 2 MHz, where XX is the transmitter-receiver spacing in inches (EcoScope); PXXL, Phase-shift resistivity measured at a frequency of 400 kHz, where XX is the transmitter-receiver spacing in inches (EcoScope); PXXH, Phase-shift resistivity measured at a frequency of 2 MHz, where XX is the transmitter-receiver spacing in inches (EcoScope)]
Site NGHP-01-06 393
The depths relative to seafloor were fixed for all of the LWD logs by identifying the step change in the GeoVISION gamma ray log at the seafloor. For Hole NGHP-01-06A, the gamma ray logging pick for the seafloor was at a depth of 1,168 mbrf, 3 m above the initial depth estimated by the drillers (1,171 mbrf). The rig floor logging datum was located 10.5 m above sea level.
LWD Porosities
Sediment porosities were calculated from the LWD den-sity and neutron logs in Hole NGHP-01-06A. No core-derived physical property data were available at this site to calibrate and evaluate the log-derived porosities.
The LWD log-derived density measurements (rb) from Hole NGHP-01-06A were used to calculate sediment porosities (φ) with the standard density-porosity relation: φ = (rg – rb) / (rg – rw). We first used a constant water density (rw) of 1.03 g/cm3 and a grain/matrix density (rg) of 2.72 g/cm3. The density log-derived porosities from Hole NGHP-01-06A range from just above 60 percent at 30 mbsf to about 40 per-cent at 340 mbsf (fig. 6). The density porosities in figure 6 were calculated from both the bulk density (RHOB) and from the image-derived density curve (IDRO).
In order to estimate the influence of variable grain den-sity, but without any core sample measurements available at this site, we calculated a “corrected porosity” from the IDRO density log and using a least square power law fit with depth of the grain density measurements made on samples from nearby Site NGHP-01-14. The results in figure 6 show slightly higher porosity values in the deeper part of the hole than when assuming constant grain density, due to the increasing trend with depth measured on the core grain density.
The LWD neutron porosity log from Hole NGHP-01-06A (fig. 6) yielded sediment porosities ranging from an average value of about 65 percent at 30 mbsf to about 50 percent at 340 mbsf. Porosities measured by the neutron log are expected to be higher than those computed from the density log in clay-rich sediments, because the neutron log essentially quantifies hydrogen abundance, and counts hydrogen in clay minerals as porosity. The neutron porosity measured by the EcoScope tool shown in figure 6 is the “best thermal neutron porosity” (BPHI); it has been corrected so that the effect of clay is reduced (Adolph and others, 2005). Despite this correction, it is consis-tently higher by about 10 percent than the density porosity.
LWD Borehole Images
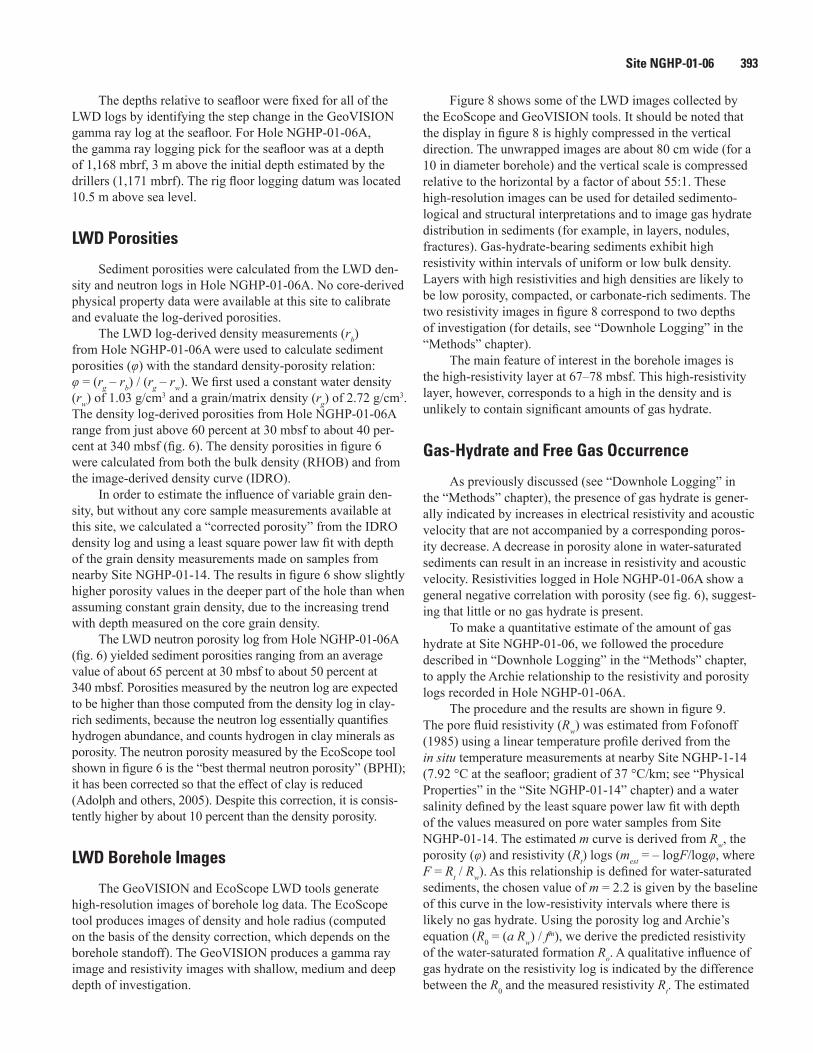
The GeoVISION and EcoScope LWD tools generate high-resolution images of borehole log data. The EcoScope tool produces images of density and hole radius (computed on the basis of the density correction, which depends on the borehole standoff). The GeoVISION produces a gamma ray image and resistivity images with shallow, medium and deep depth of investigation.
Figure 8 shows some of the LWD images collected by the EcoScope and GeoVISION tools. It should be noted that the display in figure 8 is highly compressed in the vertical direction. The unwrapped images are about 80 cm wide (for a 10 in diameter borehole) and the vertical scale is compressed relative to the horizontal by a factor of about 55:1. These high-resolution images can be used for detailed sedimento-logical and structural interpretations and to image gas hydrate distribution in sediments (for example, in layers, nodules, fractures). Gas-hydrate-bearing sediments exhibit high resistivity within intervals of uniform or low bulk density. Layers with high resistivities and high densities are likely to be low porosity, compacted, or carbonate-rich sediments. The two resistivity images in figure 8 correspond to two depths of investigation (for details, see “Downhole Logging” in the “Methods” chapter).
The main feature of interest in the borehole images is the high-resistivity layer at 67–78 mbsf. This high-resistivity layer, however, corresponds to a high in the density and is unlikely to contain significant amounts of gas hydrate.
Gas-Hydrate and Free Gas Occurrence
As previously discussed (see “Downhole Logging” in the “Methods” chapter), the presence of gas hydrate is gener-ally indicated by increases in electrical resistivity and acoustic velocity that are not accompanied by a corresponding poros-ity decrease. A decrease in porosity alone in water-saturated sediments can result in an increase in resistivity and acoustic velocity. Resistivities logged in Hole NGHP-01-06A show a general negative correlation with porosity (see fig. 6), suggest-ing that little or no gas hydrate is present.
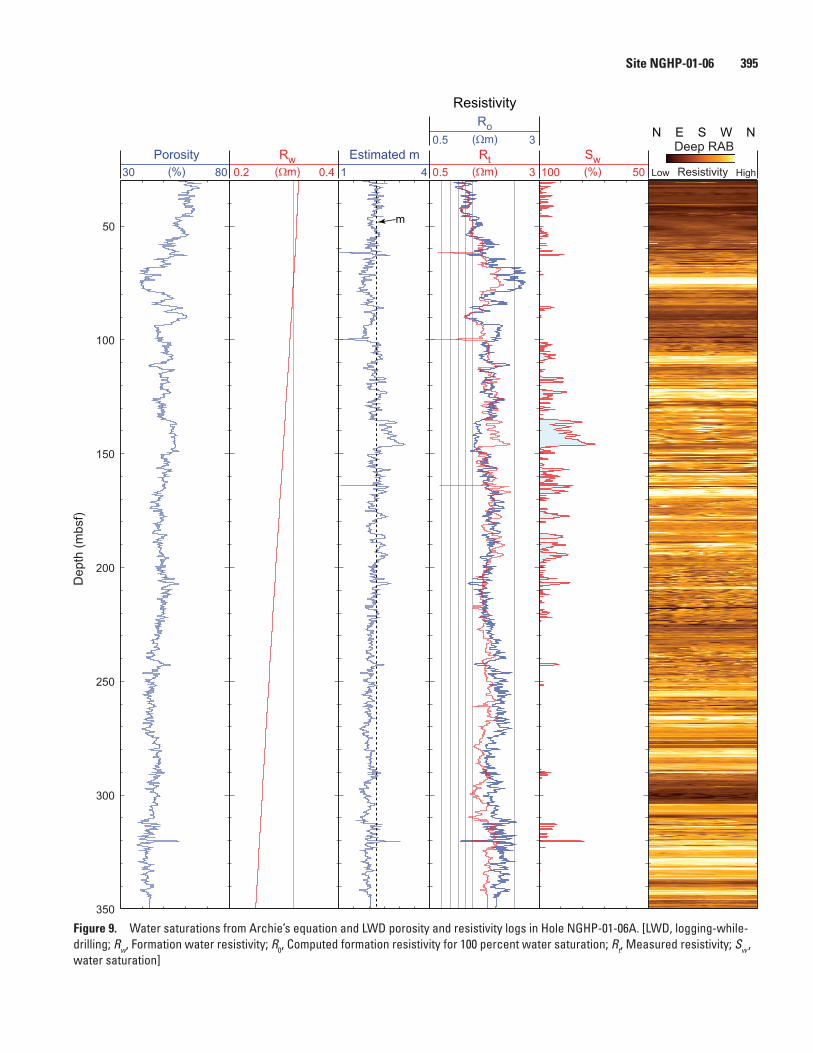
To make a quantitative estimate of the amount of gas hydrate at Site NGHP-01-06, we followed the procedure described in “Downhole Logging” in the “Methods” chapter, to apply the Archie relationship to the resistivity and porosity logs recorded in Hole NGHP-01-06A.
The procedure and the results are shown in figure 9. The pore fluid resistivity (Rw) was estimated from Fofonoff (1985) using a linear temperature profile derived from the in situ temperature measurements at nearby Site NGHP-1-14 (7.92 °C at the seafloor; gradient of 37 °C/km; see “Physical Properties” in the “Site NGHP-01-14” chapter) and a water salinity defined by the least square power law fit with depth of the values measured on pore water samples from Site NGHP-01-14. The estimated m curve is derived from Rw, the porosity (φ) and resistivity (Rt) logs (mest = – logF/logφ, where F = Rt / Rw). As this relationship is defined for water-saturated sediments, the chosen value of m = 2.2 is given by the baseline of this curve in the low-resistivity intervals where there is likely no gas hydrate. Using the porosity log and Archie’s equation (R0 = (a Rw) / fm), we derive the predicted resistivity of the water-saturated formation Ro. A qualitative influence of gas hydrate on the resistivity log is indicated by the difference between the R0 and the measured resistivity Rt. The estimated

394 Indian National Gas Hydrate Program Expedition 01 ReportD
epth
(mbs
f)
4.6 5.6 20 100
20 100
1.6 2.10 5
1.2 2.2N E S W N N E S W N
0
50
100
150
200
250
300
350
(in)Caliper(gAPI)
GeoVISION(gAPI)
EcoScope
15
160
160
5
40
40
PEF(g/cm3)Density
(%)Neutron
(%)Density
Shallow RAB
Resistivity
Deep RAB
ResistivityLow High Low HighRing
Bit
Deep RAB avg. 0.5 5(Ωm)
0.5 5(Ωm)
0.5 5(Ωm)
N E S W N
(in)
Hole radius
Gamma ray
N E S W N
(g/cm3)
Density
Porosity
Resistivity
Figure 8. LWD image data from Hole NGHP-01-06A. [LWD, logging-while-drilling; gAPI, American Petroleum Institute gamma ray units; RAB, resistivity-at-bit image obtained by the GeoVISION tool]
Site NGHP-01-06 395
Figure 9. Water saturations from Archie’s equation and LWD porosity and resistivity logs in Hole NGHP-01-06A. [LWD, logging-while-drilling; Rw, Formation water resistivity; R0, Computed formation resistivity for 100 percent water saturation; Rt, Measured resistivity; Sw , water saturation]
Dep
th (m
bsf)
Low High
N E S W N
m50
100
150
200
250
300
350
Deep RAB
Resistivity
Ro
Estimated m Rt SwRwPorosity30 80 1 4 100 500.2 0.4 0.5 3(Ωm) (%)(Ωm)(%)
0.5 3(Ωm)
Resistivity

396 Indian National Gas Hydrate Program Expedition 01 Report
water saturation, assumed to be the numerical complement of the hydrate saturation, is Sw = (R0/Rt)
1/n, where n=2 (Pearson and others, 1983). We used the “corrected” density porosity computed from the image-derived density (IDRO) and the resistivity from the 16 in, phase-shift, high-frequency propaga-tion resistivity (P16H) measured by the EcoScope tool. We use the P16H curve because it is the resistivity with the highest vertical resolution measured by the EcoScope.
As noted earlier, porosity and resistivity curves in Hole NGHP-01-06A generally mirror each other, so that the computed water-saturated resistivity R0 is very close to the measured resistivity Rt and the water saturation Sw is close to 100 percent throughout most of the logged interval (fig. 9). While the results suggest that some amount of gas hydrate could be present in several intervals between ~100 and 200 mbsf, the most prominent occurrence is at 137–148 mbsf, where the computed gas hydrate saturation reaches a maxi-mum of about 25 percent.
References Cited
Adolph, B., Archer, M., Codazzi, D., el-Halawani, T., Perciot, P., Weller, G., Evans, M., Grant, J., Griffiths, R., Hartman, D., Sirkin, G., Ichikawa, M., Scott, G., Tribe, I., and White, D., 2005, No more waiting—Formation evaluation while drilling: Oilfield Review, Autumn 2005, p. 4–21.
Aldred, W., Cook, J., Bern, P., Carpenter, B., Hutchinson, M., Lovell, J., Rezmer-Cooper, I., and Leder, P.C., 1998, Using downhole annular pressure measurements to improve drill-ing performance: Oilfield Review, Winter 1998, p. 40–55.
Fofonoff, N.P., 1985, Physical properties of seawater: Journal of Geophysical Research, v. 90, no. C2, p. 3332–3342.
Pearson, C.F.. Halleck, P.M., McGuire, P.L., Hermes, R., and Mathews, M., 1983, Natural gas hydrate deposits—A review of in situ properties: Journal of Physical Chemistry, v. 87 p. 4180–4185.