frontespizio di marino - unisa
TRANSCRIPT
UNIVERSITÀ DEGLI STUDI DI SALERNO
DIPARTIMENTO DI SCIENZE FARMACEUTICHE E BIOMEDICHE
Dottorato di Ricerca in Scienze Farmaceutiche
X-CICLO NUOVA SERIE
2008-2011
BIOPHYSICAL INVESTIGATION OF BIOMOLECULES
IN BIO-MEMBRANE MODELS
Tutor Dottoranda
Ch.ma Prof. Anna Maria D’Ursi Dott.ssa Sara Di Marino
Coordinatore
Ch.ma Prof. Nunziatina De Tommasi
Contents
Abstract I
Part 1
Chapter 1 1
Introduction 1
Chapter 2 5
Experimental Section 5
2.1 Peptide synthesis 5
2.1.1 Solid-phase peptide synthesis and purification 5
2.1.2 General procedure for cyclization 6
2.1.3 Side-chain deprotection 7
2.2 Peptide chaaracterization 7
2.2.1 Peptide purification 7
2.2.2. Mass spectral analysis 8
2.3 Antifungal test 8
2.3.1 Yeast isolated 8
2.3.2 Susceptibility testing assays 9
2.3.3 Invitro test (fluorescence microscopi) 9
2.4 Spectroscopic analysis 10
2.4.1 Circular Dichoism 10
2.4.2 Fluorescence titration measurements 10
2.4.3 Isothermal Titration Calorimetry 11
2.4.4 Nuclear Magnetic Resonance 12
2.4.5 NMR structure calculation 13
Chapter 3 14
Results 14
3.1 Antifungal activity 14
3.2 Fluorescence microscopy 16
3.3 Membrane-peptide interaction 17
3.3.1 Fluorescence titration measurements 17
3.3.2 Isothermal Titration Calorimetry 23
3.3 Conformational analysis 35
3.3.1 CD spectroscopy 35
3.3.2 NMR Spectroscopy 37
3.4 Discussion 43
References 47
Part 2
Chapter 1 54
Introduction 54
Chapter 2 59
Experimental section 59
2.1 Peptide synthesis 59
2.2 Sample preparation 60
2.3 ESR spectroscopy 62
2.4 Circular Dichroism Spectrscopy 63
2.5 Fluorescence Titration Measurements 64
2.6 Molecular Dynamics 65
2.7 NMR analysis: C8 titration 66
2.7.1 NMR structure calculation 67
Chapter 3 69
Results 69
3.1 Peptide-membrane interaction 69
3.1.1 Choise of solvent 69
3.1.2 EPS spectroscopy 69
3.1.3 Fluorescence spectroscopy 72
3.2 conformational analysis 74
3.2.1 Circular Dichroism 74
3.2.2 NMR analisi 77
3.2.3MD simulations 87
3.2.4 Discussion 96
Chapter 4 100
Conclusions 100
References 101
I
Abstract
Many drugs are available for the treatment of systemic or superficial mycoses,
but only a limited number of them are effective antifungal drugs, devoid of
toxic and undesirable side effects. Therefore there remains an urgent need for
a new generation of antifungal agents.
The present work concerns the synthesis, the antifungal activity and the
biophysical characterization of a set of linear and cyclic peptides (AMT1,
cyclo-AMT1, AMT2, cyclo-AMT2, AMT3, cyclo-AMT3) including
aminoacids characteristic of membrane-active antimicrobial peptides (AMP).
The peptides were tested against different yeast species, and displayed general
antifungal activity, with a therapeutically promising antifungal specificity
against Cryptococcus neoformans.
To shed light on the role played by the membrane cell in the antifungal
activity an extensive biophysical study was carried out using different
spectroscopic techniques. Our structural investigation provides data to exclude
the ability of the peptides to penetrate the membrane of the fungal cell,
highlighting their attitude to interact with the external surface of the bilayer.
Taken together our data support the hypothesis that the membrane cell of the
fungi may be an important platform for specific interactions of the synthesized
peptides with more specific targets involved in the cell wall synthesis.
Viral fusion glycoproteins present a membrane-proximal external region
(MPER) which is usually rich in aromatic residues and presents a marked
tendency to stably reside at the membrane interfaces, leading, through
unknown mechanisms, to a destabilization of the bilayer structure. This step
II
has been proposed to be fundamental for the fusion process between target
membrane and viral envelope. In present work, we investigate the interaction
between an octapeptide (C8) deriving from the MPER domain of gp36 of
Feline Immunodeficiency Virus and different membrane models by combining
experimental results obtained by Nuclear Magnetic Resonance, Electron Spin
Resonance, Circular Dichroism and Fluorescence Spectroscopy with
Molecular Dynamics simulations. Our data indicate that C8 binds to the lipid
bilayer adsorbing onto the membrane surface without deep penetration. As a
consequence of this interaction, the bilayer thickness decreases. The
association of the peptide with the lipid membrane is driven by hydrogen
bonds as well as hydrophobic interactions that the Trp side chains form with
the lipid headgroups. Notably these interactions may be the key to interpret at
molecular level the function played by Trp residues in all the fragments of
viral envelope involved in fusion mechanism with target membrane.
1
Chapter 1
Introduction
Fungal infections are a persistent major health problem, especially for
immunocompromised patients. Invasive fungal infections can be life-
threatening for neonates, cancer patients receiving chemotherapy, organ
transplant recipients and patients with acquired immunodeficiency syndrome
(AIDS). Many fungal infections are caused by opportunistic pathogens that
may be endogenous or acquired from the environment, including Candida,
Cryptococcus, and Aspergillus. Cryptococcosis, which is caused by the
encapsulated fungus Cryptococcus neoformans, has been lethal for HIV-
infected patients. Cryptococcus infects pulmonary organs and can disseminate
widely, most commonly to the brain and skin.(1-3)
Although it appears that many drugs are available for the treatment of
systemic or superficial mycoses, there are only a limited number of effective
antifungal drugs, many of them toxic and having undesirable side effects.
Furthermore, resistance development and fungistatic rather than fungicidal
activities represent limitations of current antifungal therapy.(4-6) Therefore
there is an urgent need for a new generation of antifungal agents.(7)
Cationic antimicrobial peptides (CAPs) have been found in almost all species
of eukaryotic organisms and are recognized as the evolutionarily conserved
components of their innate immune system that defend the host against
microbes through membrane or metabolic disruption.(8) A distinguishable
advantage of CAPs over conventional antibiotics is that they do not provoke
immune responses.(9) Regardless of their origin and biological efficacy, CAPs
share common features. They are short peptides (usually between 3-50 amino
2
acid residues), which include a large content of basic amino acids and a global
distribution of hydrophobic and hydrophilic residues. Due to the high
frequency of amino acid residues, such as R and K in their sequences, they
carry an overall positive charge in the physiological pH range, which is of
great importance for their interactions with the negative charges of bacterial
cell membranes.(8) CAPs adopt an amphipathic conformation at polar-
nonpolar interfaces with a hydrophobic domain consisting of nonpolar amino
acid residues on one side and polar or charged residues on the opposite.
Because of these physicochemical characteristics, CAPs have a tendency to
accumulate on the negatively charged microbial surfaces and membranes.
Electrostatic interactions cause the accumulation of the cationic peptides at the
negatively charged bacterial membrane, and hydrophobic interactions drive
their insertion into the lipid bilayer.(10)
Each CAP has a unique pattern of activity against a variety of Gram-positive
and Gram-negative bacteria, yeasts, fungi and viruses.(11) While the
antimicrobial peptide cecropin A is only active against Gram-positive bacteria,
(12) MG 2 and dermaseptin show activity against both types of bacteria as
well as fungi,(13),(14) and the membrane-lytic peptide MEL attacks both
prokaryotic and mammalian cells.(15)
Small CAPs rich in particular amino acid residues, such as R, W, and P have
gained high interest as lead compounds(16-20). They are usually found as
small antimicrobial motifs of much larger natural compounds.(21) The
mechanisms of interaction of small and conformationally constrained peptides
with cellular membranes, as well as the key factors that provide bacterial
specificity for these peptides, are much less well understood.(22) The
mechanisms of action for antimicrobial peptides are not completely
understood, but in most cases their biological effects are believed to involve
3
membrane disruption of the target cells.(21, 23-30) The proposed mechanism
requires positively charged aminoacids to associate with negatively charged
microbial membranes, causing the peptides to adopt a globally amphiphilic
helical conformation at the membrane–water interface. The ensuing membrane
disruption can lead directly to cell lysis and death,(31, 32) or membrane
permeabilization may allow peptide molecole to reach intracellular targets.(33,
34) AMPs have gained attention as potential antifungal agents because their
activity is not associated with resistance phenomena. Development of
resistance by sensitive microbial strains against these AMPs is less probable,
because AMPs exert their action by forming multimeric pores in the cell
membranes, leading to cell lysis,(35) or interaction with the RNA or DNA
after penetration into the cell.(36) Thus, among others, small RW-rich peptides
with improved toxicity against bacteria are interesting candidates to study the
structural motifs and forces responsible for selectivity and may pave the way
to develop new therapeutics with potent activity against multi-resistant
bacteria.
Linear and cyclic RRWWRF, dubbed AMT1 and cyclo-AMT1, respectively
(Figure 1), were recently indentified from a synthetic combinatorial library as
new antimicrobial peptides,(37-39) exerting their action by inducing curvature
strain, permeation or disintegration of the target membrane.(18, 37) Starting
from AMT1 and cyclo-AMT1 sequence, we synthesised AMT2, cyclo-AMT2,
AMT3 and cyclo- AMT3 (Figure 1) including one and two more His residues
than the AMT1 analogues, respectively. The imidazole ring characteristic of
His side chains was designed in the attempt to confer to AMT2, cyclo-AMT2,
AMT3 and cyclo-AMT3 antifungal activity analogous to the imidazole ring of
the azole antifungal compounds. The azole antifungal agents, containing either
two or three nitrogens in the azole ring, are currently the most widely used and
4
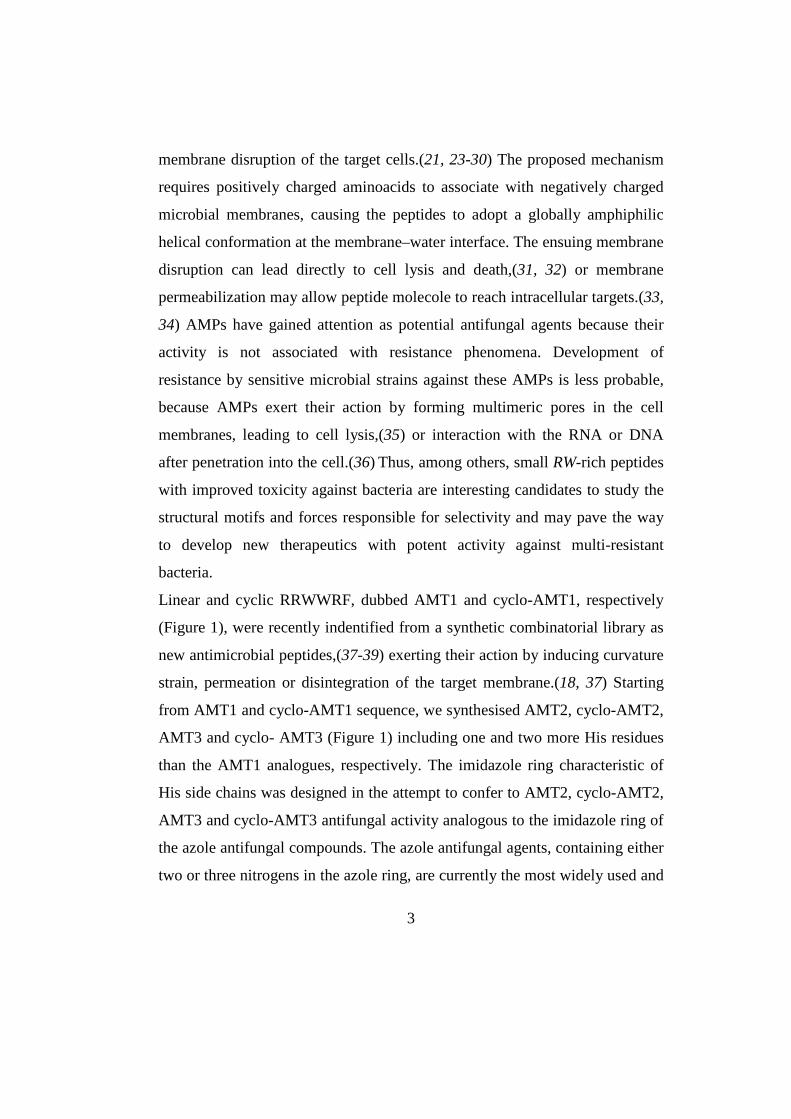
studied class of antifungal agents; they prevent synthesis of ergosterol, a major
component of fungal plasma membranes, by inhibiting the cytochrome P450-
dependent enzyme 14a-sterol demethylase.(40-44)
Figure 1 Chemical structures of AMT peptides.
The aim of this work is to verify the antifungal activity of linear and cyclic
peptides synthesized and to investigate the role of peptide-membrane
interactions in antimicrobial activity.
The antifungal activity was evalueted by in vitro test.
Then, the ability of our peptides to interact with the surface of the fungal cell
was monitored by fluorescence microscopy, using specifically labelled AMT
peptide.
To investigate the role of peptide-membrane interactions in the biological
activity, biophysical investigation was carried out based on multiple analytical
techniques including fluorescence spectroscopy, isothermal titration
calorimetry, circular dichroism (CD), and nuclear magnetic resonance (NMR).
5
Chapter 2
Experimental section
2.1 Peptide synthesis
2.1.1 Solid-phase peptide synthesis and purification
Peptides of Figure 1 were synthesized with a manual batch synthesizer
(Agitatore orbitale Mod. KS 130 basic IKA, STEROGLASS, Perugia Italy)
using a Teflon reactor (10mL), applying the Fmoc/tBu solid phase peptide
synthesis (SPPS) procedure, together with the following side chain protecting
groups: Arg, Pbf; His, Trt; Trp, Boc. (Chan, W.; White, P. Fmoc Solid Phase
Peptide Synthesis; Oxford University Press:Oxford, 2000.)
AMT1, AMT2 and AMT3 were synthesized with a Wang resin (0.6–1.0
mmol/g, 0.2 g) that was swelled with N,N-dimethylformamide (DMF) (1
mL/100 mg of resin) for 3 h before use. The Wang resin (0.6–1.0 mmol/g, 0.2
g) was treated with N-Fmoc amino acid derivatives (fourfold excess), which
were sequentially coupled to the growing peptide chain using O-benzotriazole-
N,N,N0 ,N0-tetramethyl-uronium-hexafluoro-phosphate (HBTU) (fourfold
excess) in DMF and N,N-diisopropylethylamine (DIPEA) (eightfold excess).
The coupling reaction time was 2 h. After deprotection of the last N-Fmoc
group, the peptide resin was washed with methanol and dried in vacuo to yield
the protected peptide-bound Wang resin. The deprotected peptide was cleaved
from the resin by treatment with trifluoroacetic acid
(TFA)/H2O/phenol/ethanedithiol/thioanisole (reagent K) (82.5:5:5:2.5:5 v/v)
at a ratio of 10 mL to 0.5 g of resin at room temperature for 3 h. After
filtration of the exhausted resin, the solvent was concentrated in vacuo, and the
6
residue was triturated with ether. Cyclo-AMT2, cyclo-AMT1 and cyclo-
AMT3 were synthesized using a 2-chlorotrityl chloride resin. The first N-
Fmoc amino acid (0.6–1.2 equiv relative to the resin for 2-chlorotrityl resin)
and DIPEA (4 equiv relative to amino acid) were dissolved in dry
dichloromethane (DCM) (approx. 10 mL per gram of resin) containing, if
necessary, a small amount of dry DMF (enough to facilitate dissolution of the
acid). This was added to the resin and stirred for 30–120 min. After stirring,
the resin was washed with 3X DCM/MeOH/DIPEA (17:2:1), 3 X DCM, 2X
DMF and 2 X DCM. Other N-Fmoc amino acids (fourfold excess) were
sequentially coupled to the growing peptide chain according to the Fmoc/tBu
solid phase peptide synthesis (SPPS) procedure. The final cleavage with
AcOH/MeOH/DCM (1:1:8) resulted in protected peptides.
For fluorescence microscopy study we synthesized cyclo–AMT2 and cyclo–
AMT3 including Dap (l-diamino propionic acid) aminoacid in substitution of
Trp. cyclo–AMT2 and cyclo–AMT3 with Dap aminoacid were synthesized
according to the solid phase synthesis methods using Fmoc-Dap(NBD)-OH
This was obtained by alkylating the free amino group of Nα-Fmoc, l-diamino
propionic acid (Fmoc-Dap-OH) with NBD chloride. (45)
2.1.2 General procedure for cyclization
A solution of the linear protected peptide (0.03 mmol) in dry DMF (6.5 mL)
was added at room temperature to a reaction flask containing a solution of N-
hydroxybenzotriazole (HOBt) (3 equiv, 12 mg, 0.09 mmol), HBTU (3 equiv,
34 mg, 0.09 mmol) and DIPEA (5 equiv, 0.26 mL, 1.5 mmol) in dry DMF (1
mL) using a syringe pump. The solution was added at rate of about 0.01
mL/min. Once the addition was complete, the mixture was stirred for 24 h at
room temperature. The reaction mixture was concentrated under reduced
7
pressure, and the residue was dissolved in ethyl acetate (AcOEt). The organic
phase was washed twice with 5% aqueous sodium bicarbonate (NaHCO3),
dried over sodium sulfate (Na2SO4), and filtered. The solvent was removed by
reduced pressure, and the crude residue was purified by flash chromatography
on silica gel (CHCl3/MeOH from 99:1 to 90:10) to yield the protected cyclic
peptide as a glassy white solid.
2.1.3 Side-chain deprotection
The protected cyclopeptide (0.02 mmol) was treated with 10 mL of a solution
of TFA/triisopropylsilane (TIS)/H2O 95:2.5:2.5 at room temperature. After 24
h, the reaction mixture was evaporated in vacuo, and the residue was dissolved
in 5 mL of 3 N aqueous hydrogen chloride (HCl). The aqueous phase was
washed twice with diethyl ether (Et2O) and concentrated in vacuo, yielding
the side chain-deprotected cyclopeptide as a hydrochloride salt (quant.).
2.2 Peptide characterization
2.2.1 Peptide purification
All peptides were purified by preparative reversed phase high performance
liquid chromatography (HPLC) using a Jupiter [Phenomenex, Anzola Emeilia
(BO), Italy] C18 column (25 _ 4.6 cm, 5 l, 300 Å pore size). The column was
perfused at a flow rate of 3 mL/min with a mobile phase containing solvent A
(0.1% TFA in water). A linear gradient from 50% to 90% of solvent B (0.1%
TFA in acetonitrile) for 40 min was adopted for peptide elution. The pure
fraction was collected to yield a white powder after lyophilisation. After
purification cyclo-AMT1, cyclo-AMT2 and cyclo-AMT3 were obtained in
35%, 45% and 68% overall yield, respectively. The molecular weight of the
compound was determined by mass spectral analysis.
8
2.2.2 Mass spectral analysis
Peptide fragments were characterised using a Finnigan LCQDeca ion trap
instrument equipped with an electrospray source (LCQ Deca Finnigan, San
Jose, CA, USA). The samples were directly infused into the ESI source using
a syringe pump set at a flow rate of 5 lL/min. The data were analysed with
Xcalibur software.
2.3 Antifungal tests
2.3.1 Yeast isolates
To verify the existence of antifungal activity the antifungal assays were
performed using different yeast species.
One-hundred and thirty-five yeast clinical isolates belonging to five Candida
species (20 Candida albicans, 20 Candida glabrata, 20 Candida parapsilosis,
20 Candida tropicalis and 20 Candida krusei) and 35 isolates of C.
neoformans were tested. The Candida isolates were obtained from clinical
specimens of blood, urine, vaginal fluid and sputum, whereas the C.
neoformans isolates were all recovered from blood and cerebrospinal fluid
specimens. We also included two reference C. neoformans strains, H99 and
the acapsular ATCC 52817. Isolates were identified to the species level by
standard methods and stored as glycerol stocks at -80 °C. Prior to testing,
isolates were grown on Sabouraud dextrose agar (Kima, Padua, Italy) for 48 h
at 30 °C. C. parapsilosis ATCC 22019 andC. krusei ATCC 6258 were used as
quality control strain.( Clinical and Laboratory Standards Institute (CLSI),
Reference Method for Broth Dilution Antifungal Susceptibility Testing of
Yeasts; Approved Standard, 3rd ed.; CLSI document M27–A3. (ISBN 1-
56238-666-2) Clinical and Laboratory Standards Institute, 940 West Valley
9
Road, Suite 1400, Wayne, Pennsylvania 19087-1898 USA, 2008).
2.3.2 Susceptibility testing assays
Susceptibility testing of the yeast isolates to the antifungals amphotericin B
and fluconazole and to the six investigated peptides was performed by the
broth microdilution method, as descrive in the Clinical and Laboratory
Standards Institute (CLSI) M27-A3 document48 with a final inoculum
concentration of 1.5 (±1.0) ×103 cells/mL in RPMI 1640 medium buffered to
pH 7.0 with morpholinepropanesulphonic acid. Standard powders of
amphotericin B and fluconazole were obtained from their respective
manufacturers. For each drug, trays containing 0.1 mL of the serially diluted
drug solution (2× final concentration) in each well were inoculated with 0.1
mL of each diluted yeast inoculum suspension and then incubated for 48 h
(Candida species isolates) or for 72 h (C. neoformans isolates) at 35 °C. The
final concentrations of the standard antifungal drugs ranged from 0.03 to 16
lg/mL for amphotericin B and from 0.125 to 64 lg/mL for fluconazole, while
those of the peptides ranged from 1 to 512 lg/mL. The minimum inhibitory
concentration (MIC) endpoint was defined as the lowest concentration of drug
that produced a prominent decrease in turbidity (∼50% reduction in growth)
compared with that of the drug-free growth control.
2.3.3 In vitro test (fluorescence microscopy)
Candida albicans strains ATCC 90028 and MYA-2876 were grown for 17 h
in 10 ml YPD-broth at 28 °C to obtain mid-logarithmic phase organisms and
washed three times, then diluted in 10 mM Tris, pH 7.4 to a concentration of
1×10⁷ cfu/ml. 100 µl samples of the C. albicans suspensions were incubated
for 5 min on ice together with 1 µl of cyclo-AMT1 or cyclo-AMT3 (2 mg/ml).
10
The pellets were washed three times in 10 mM Tris, pH 7.4. Cell FIX (Becton
Dickinson Catalogue No. 340181) was added (to a final concentration of 4%
formaldehyde) and the yeast cell pellets were incubated 15 min on ice and then
45 min in room temperature. Ethanol washed glass cover slips were coated
with 0.25 ml of poly-lysine (0.2 mg/ml dissolved in water), dried and then
washed with distilled water. The samples were adhered to the poly-lysine
glasses for 30 min and mounted on microscope slides for visual inspection. A
Nikon Eclipse TE300 inverted fluorescence microscope was used.
2.4 Spectroscopic analysis
2.4.1 Circular dichroism (CD)
The samples for CD experiments in micelles of SDS were prepared by
dissolving an appropriate amount of peptide (0,15 mM) in a SDS micelle
solution (=0.08 mol kg-1). All CD spectra were recorded using a JASCO J810
spectropolarimeter at room temperature and with a cell path length of 1 mm.
CD spectra were acquired at 25 °C using a measurement range from 190 to
260 nm, 1-nm band width, four accumulations, and 10-nm/min scanning
speed. Spectra were corrected for solvent contribution. For an estimation of
secondary structure content, CD spectra were analysed using the SELCONN
algorithm from the DICHROWEB website.(46)
2.4.2 Fluorescence titration measurements
Fluorescence measurements were performed at 300 K using a LS 55
Luminescence Spectrofluorimeter (Perkin Elmer). The excitation wavelength
was 280 nm and emission spectra were recorded between 300 and 400 nm, at
exitation slit width 5nm and emission slit width 2.5 nm, scan speed 50nm/min.
11
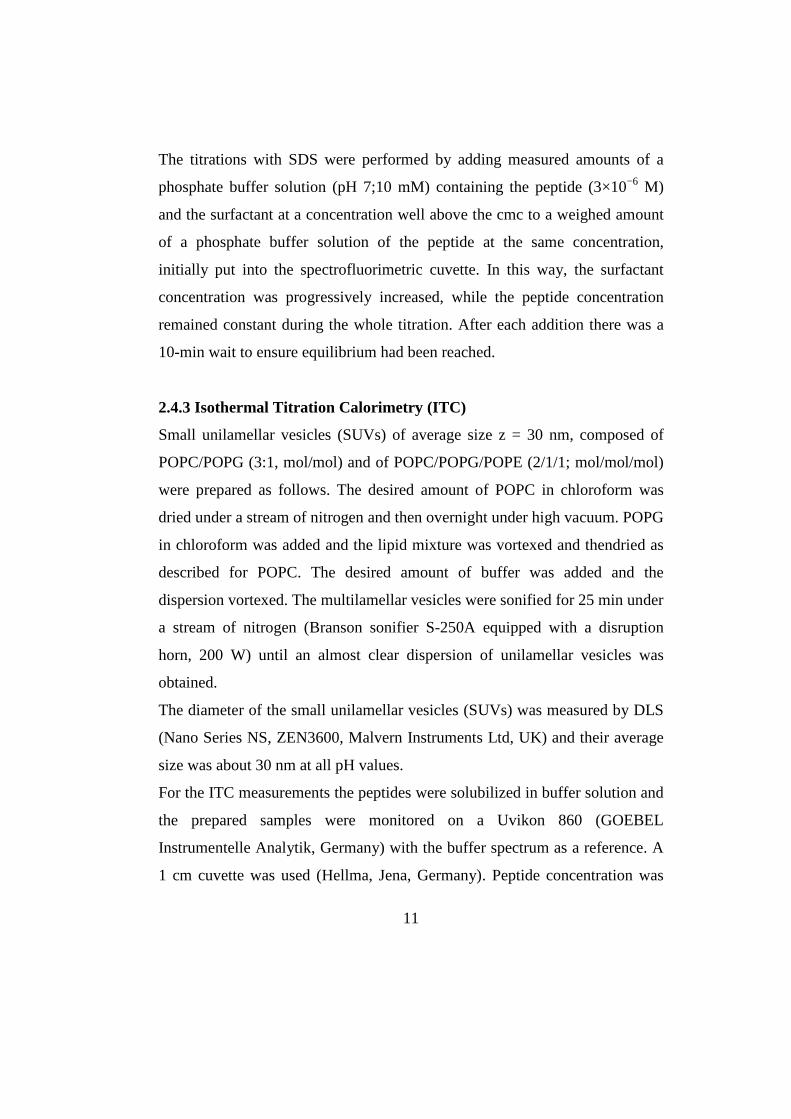
The titrations with SDS were performed by adding measured amounts of a
phosphate buffer solution (pH 7;10 mM) containing the peptide (3×10⁻⁶ M)
and the surfactant at a concentration well above the cmc to a weighed amount
of a phosphate buffer solution of the peptide at the same concentration,
initially put into the spectrofluorimetric cuvette. In this way, the surfactant
concentration was progressively increased, while the peptide concentration
remained constant during the whole titration. After each addition there was a
10-min wait to ensure equilibrium had been reached.
2.4.3 Isothermal Titration Calorimetry (ITC)
Small unilamellar vesicles (SUVs) of average size z = 30 nm, composed of
POPC/POPG (3:1, mol/mol) and of POPC/POPG/POPE (2/1/1; mol/mol/mol)
were prepared as follows. The desired amount of POPC in chloroform was
dried under a stream of nitrogen and then overnight under high vacuum. POPG
in chloroform was added and the lipid mixture was vortexed and thendried as
described for POPC. The desired amount of buffer was added and the
dispersion vortexed. The multilamellar vesicles were sonified for 25 min under
a stream of nitrogen (Branson sonifier S-250A equipped with a disruption
horn, 200 W) until an almost clear dispersion of unilamellar vesicles was
obtained.
The diameter of the small unilamellar vesicles (SUVs) was measured by DLS
(Nano Series NS, ZEN3600, Malvern Instruments Ltd, UK) and their average
size was about 30 nm at all pH values.
For the ITC measurements the peptides were solubilized in buffer solution and
the prepared samples were monitored on a Uvikon 860 (GOEBEL
Instrumentelle Analytik, Germany) with the buffer spectrum as a reference. A
1 cm cuvette was used (Hellma, Jena, Germany). Peptide concentration was
12
determined from the absorption measured at 280 nm.
Isothermal titration calorimetry was performed with a VP ITC instrument
(Microcal, Northampton, MA). The cell volume was Vcell = 0.203 ml. The
peptide solution and lipid dispersion were degassed under vacuum and
equilibrated at the experimental temperature for 10 min before filling the cells
and syringe. The heats of reaction were corrected with the heat of dilution of
POPC/POPG titrated into buffer.
Raw data were processed using the Origin software provided by Microcal.
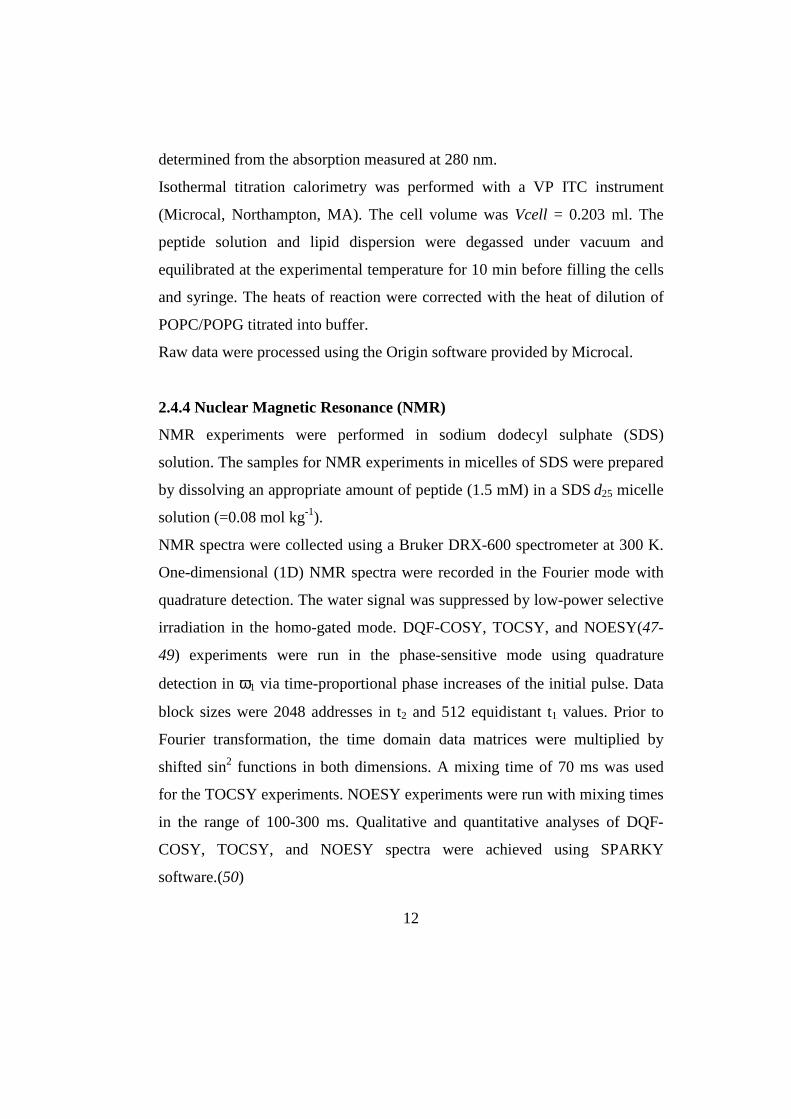
2.4.4 Nuclear Magnetic Resonance (NMR)
NMR experiments were performed in sodium dodecyl sulphate (SDS)
solution. The samples for NMR experiments in micelles of SDS were prepared
by dissolving an appropriate amount of peptide (1.5 mM) in a SDS d25 micelle
solution (=0.08 mol kg-1).
NMR spectra were collected using a Bruker DRX-600 spectrometer at 300 K.
One-dimensional (1D) NMR spectra were recorded in the Fourier mode with
quadrature detection. The water signal was suppressed by low-power selective
irradiation in the homo-gated mode. DQF-COSY, TOCSY, and NOESY(47-
49) experiments were run in the phase-sensitive mode using quadrature
detection in ω1 via time-proportional phase increases of the initial pulse. Data
block sizes were 2048 addresses in t2 and 512 equidistant t1 values. Prior to
Fourier transformation, the time domain data matrices were multiplied by
shifted sin2 functions in both dimensions. A mixing time of 70 ms was used
for the TOCSY experiments. NOESY experiments were run with mixing times
in the range of 100-300 ms. Qualitative and quantitative analyses of DQF-
COSY, TOCSY, and NOESY spectra were achieved using SPARKY
software.(50)
13
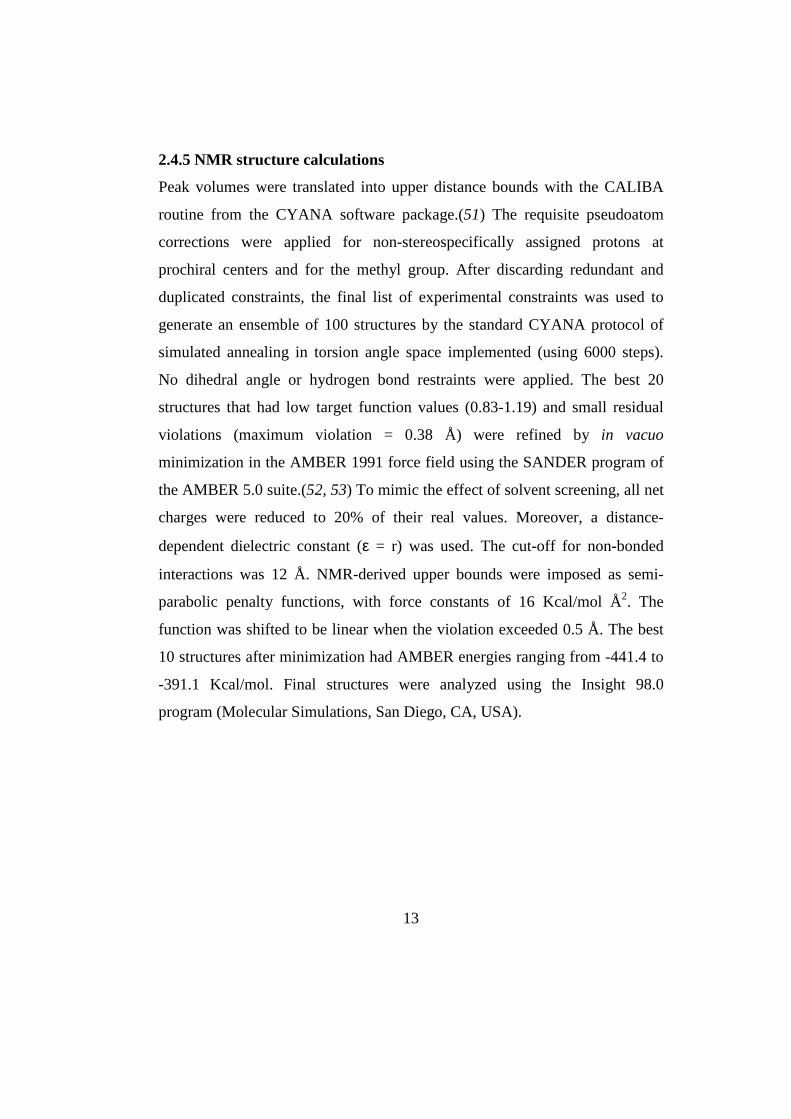
2.4.5 NMR structure calculations
Peak volumes were translated into upper distance bounds with the CALIBA
routine from the CYANA software package.(51) The requisite pseudoatom
corrections were applied for non-stereospecifically assigned protons at
prochiral centers and for the methyl group. After discarding redundant and
duplicated constraints, the final list of experimental constraints was used to
generate an ensemble of 100 structures by the standard CYANA protocol of
simulated annealing in torsion angle space implemented (using 6000 steps).
No dihedral angle or hydrogen bond restraints were applied. The best 20
structures that had low target function values (0.83-1.19) and small residual
violations (maximum violation = 0.38 Å) were refined by in vacuo
minimization in the AMBER 1991 force field using the SANDER program of
the AMBER 5.0 suite.(52, 53) To mimic the effect of solvent screening, all net
charges were reduced to 20% of their real values. Moreover, a distance-
dependent dielectric constant (ε = r) was used. The cut-off for non-bonded
interactions was 12 Å. NMR-derived upper bounds were imposed as semi-
parabolic penalty functions, with force constants of 16 Kcal/mol Å2. The
function was shifted to be linear when the violation exceeded 0.5 Å. The best
10 structures after minimization had AMBER energies ranging from -441.4 to
-391.1 Kcal/mol. Final structures were analyzed using the Insight 98.0
program (Molecular Simulations, San Diego, CA, USA).
14
Chapter 3
RESULTS
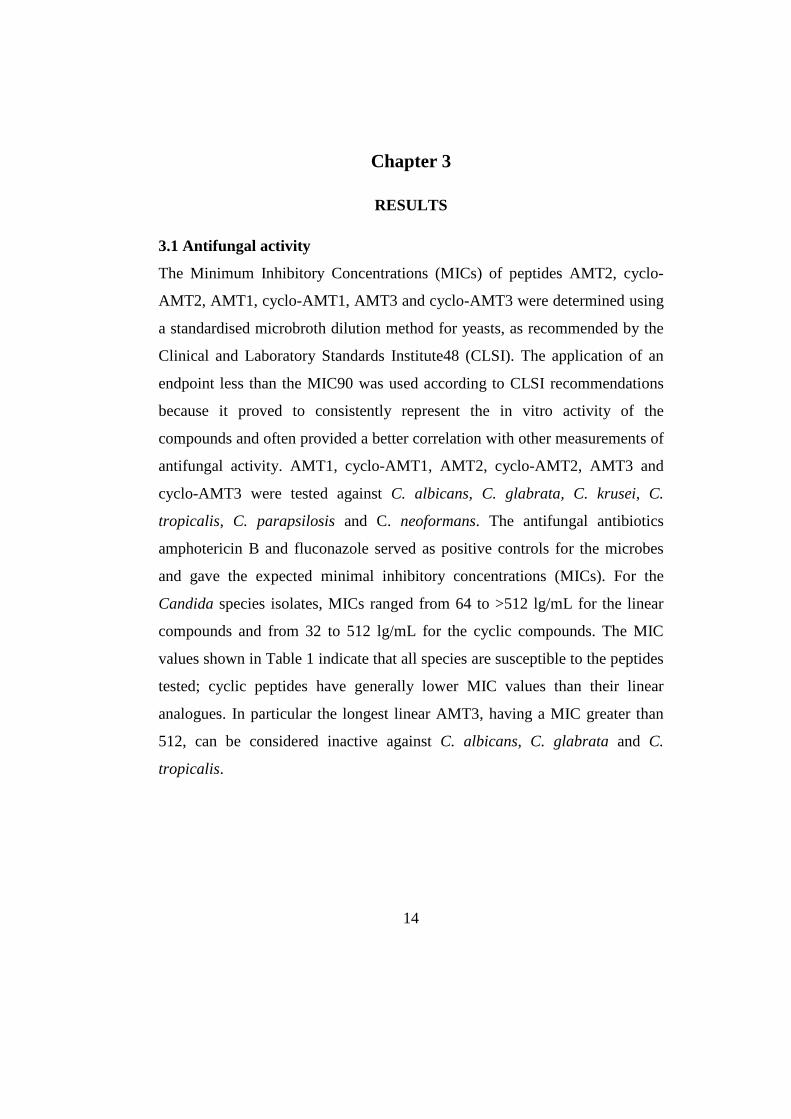
3.1 Antifungal activity
The Minimum Inhibitory Concentrations (MICs) of peptides AMT2, cyclo-
AMT2, AMT1, cyclo-AMT1, AMT3 and cyclo-AMT3 were determined using
a standardised microbroth dilution method for yeasts, as recommended by the
Clinical and Laboratory Standards Institute48 (CLSI). The application of an
endpoint less than the MIC90 was used according to CLSI recommendations
because it proved to consistently represent the in vitro activity of the
compounds and often provided a better correlation with other measurements of
antifungal activity. AMT1, cyclo-AMT1, AMT2, cyclo-AMT2, AMT3 and
cyclo-AMT3 were tested against C. albicans, C. glabrata, C. krusei, C.
tropicalis, C. parapsilosis and C. neoformans. The antifungal antibiotics
amphotericin B and fluconazole served as positive controls for the microbes
and gave the expected minimal inhibitory concentrations (MICs). For the
Candida species isolates, MICs ranged from 64 to >512 lg/mL for the linear
compounds and from 32 to 512 lg/mL for the cyclic compounds. The MIC
values shown in Table 1 indicate that all species are susceptible to the peptides
tested; cyclic peptides have generally lower MIC values than their linear
analogues. In particular the longest linear AMT3, having a MIC greater than
512, can be considered inactive against C. albicans, C. glabrata and C.
tropicalis.
15
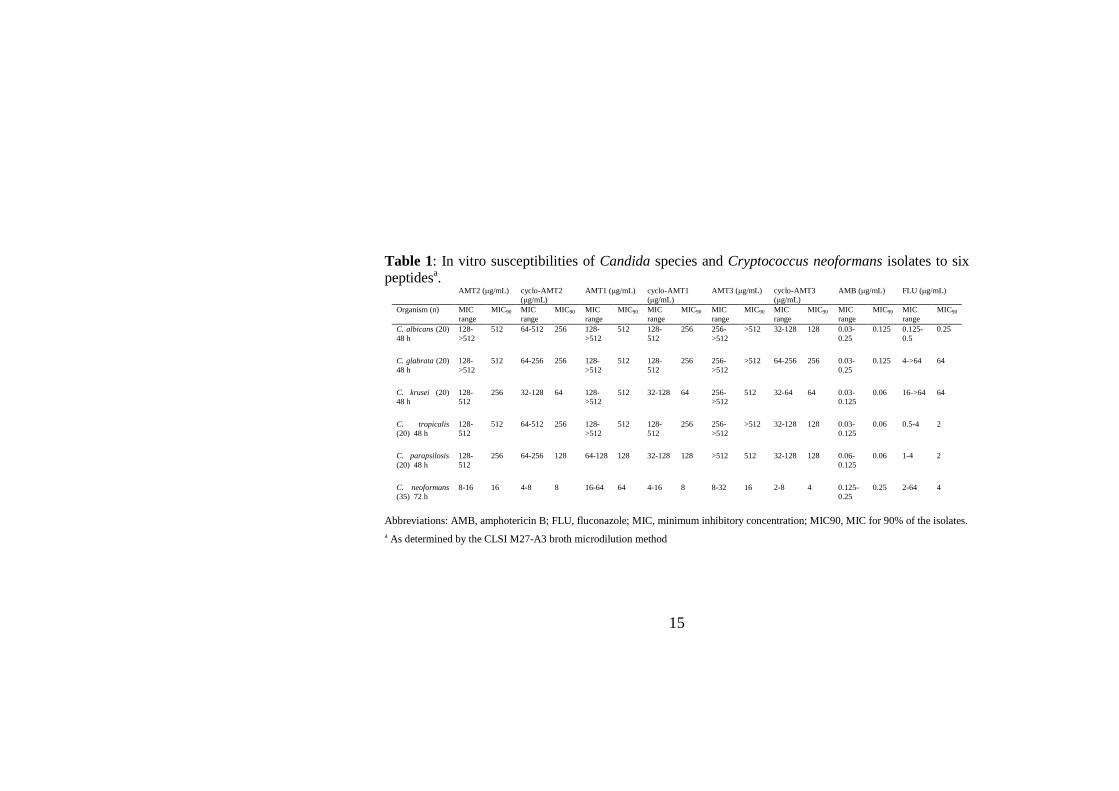
Table 1: In vitro susceptibilities of Candida species and Cryptococcus neoformans isolates to six peptidesa.
AMT2 (µg/mL) cyclo-AMT2 (µg/mL)
AMT1 (µg/mL) cyclo-AMT1 (µg/mL)
AMT3 (µg/mL) cyclo-AMT3 (µg/mL)
AMB (µg/mL) FLU (µg/mL)
Organism (n) MIC range
MIC90 MIC range
MIC90 MIC range
MIC90 MIC range
MIC90 MIC range
MIC90 MIC range
MIC90 MIC range
MIC90 MIC range
MIC90
C. albicans (20) 48 h
128->512
512 64-512 256 128->512
512 128-512
256 256->512
>512 32-128 128 0.03-0.25
0.125 0.125-0.5
0.25
C. glabrata (20) 48 h
128->512
512 64-256 256 128->512
512 128-512
256 256->512
>512 64-256 256 0.03-0.25
0.125 4->64 64
C. krusei (20) 48 h
128-512
256 32-128 64 128->512
512 32-128 64 256->512
512 32-64 64 0.03-0.125
0.06 16->64 64
C. tropicalis (20) 48 h
128-512
512 64-512 256 128->512
512 128-512
256 256->512
>512 32-128 128 0.03-0.125
0.06 0.5-4 2
C. parapsilosis (20) 48 h
128-512
256 64-256 128 64-128 128 32-128 128 >512 512 32-128 128 0.06-0.125
0.06 1-4 2
C. neoformans (35) 72 h
8-16 16 4-8 8 16-64 64 4-16 8 8-32 16 2-8 4 0.125-0.25
0.25 2-64 4
Abbreviations: AMB, amphotericin B; FLU, fluconazole; MIC, minimum inhibitory concentration; MIC90, MIC for 90% of the isolates. a As determined by the CLSI M27-A3 broth microdilution method
16
Interestingly, all compounds are significantly more active against C.
neoformans. Cryptococcus is a pathogenic fungus responsible for severe
opportunistic infections. The most prominent feature of this yeast is its
elaborate polysaccharide capsule, a complex structure that is required for
virulence. To investigate the origin of this specificity, we tested our
compounds against the acapsular C. neoformans strain ATCC 52817. MIC
values against ATCC 52817 are quite similar to those of C. neoformans H99
(16 lg/ mL for AMT2, 8 lg/mL for cyclo-AMT2, 16 lg/mL for AMT1, 8 lg/mL
for cyclo-AMT1, 8 lg/mL for AMT3 and 4 lg/mL for cyclo- AMT3),
indicating the absence of any specific interaction with the capsular structure.
3.2 Fluorescence microscopy
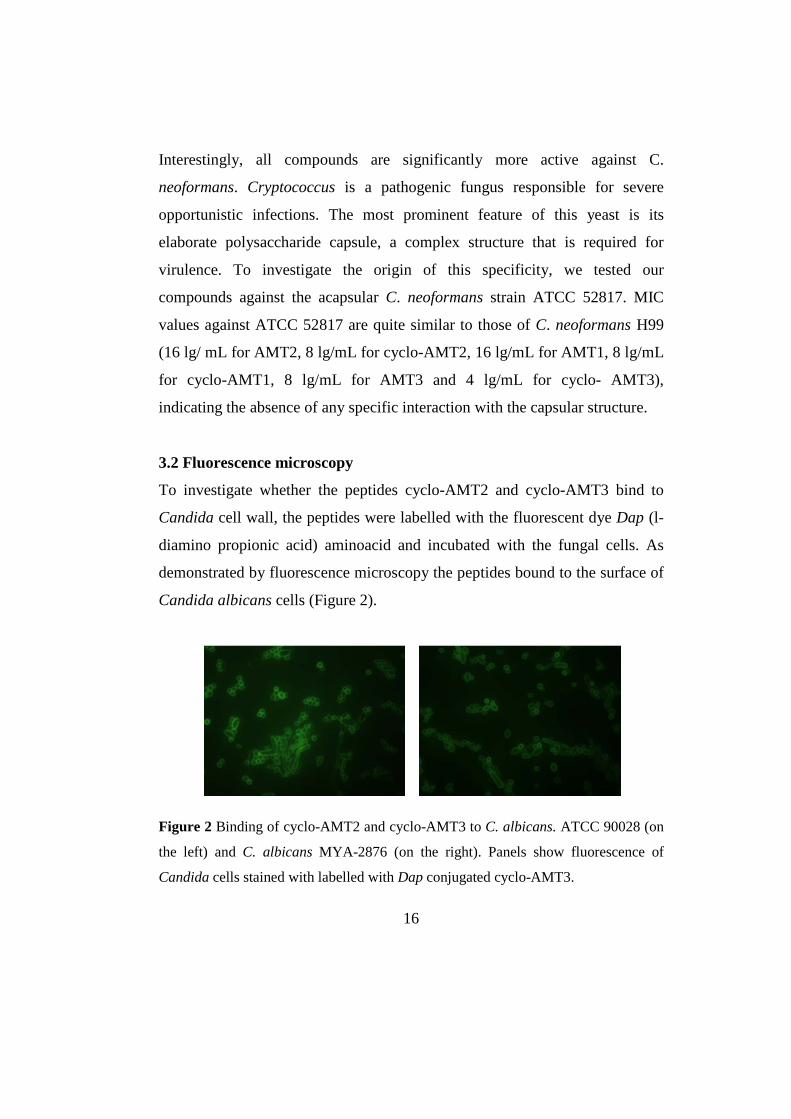
To investigate whether the peptides cyclo-AMT2 and cyclo-AMT3 bind to
Candida cell wall, the peptides were labelled with the fluorescent dye Dap (l-
diamino propionic acid) aminoacid and incubated with the fungal cells. As
demonstrated by fluorescence microscopy the peptides bound to the surface of
Candida albicans cells (Figure 2).
Figure 2 Binding of cyclo-AMT2 and cyclo-AMT3 to C. albicans. ATCC 90028 (on
the left) and C. albicans MYA-2876 (on the right). Panels show fluorescence of
Candida cells stained with labelled with Dap conjugated cyclo-AMT3.
17
3.3 Membrane-peptide interaction
3.3.1 Fluorescence titration measurement.
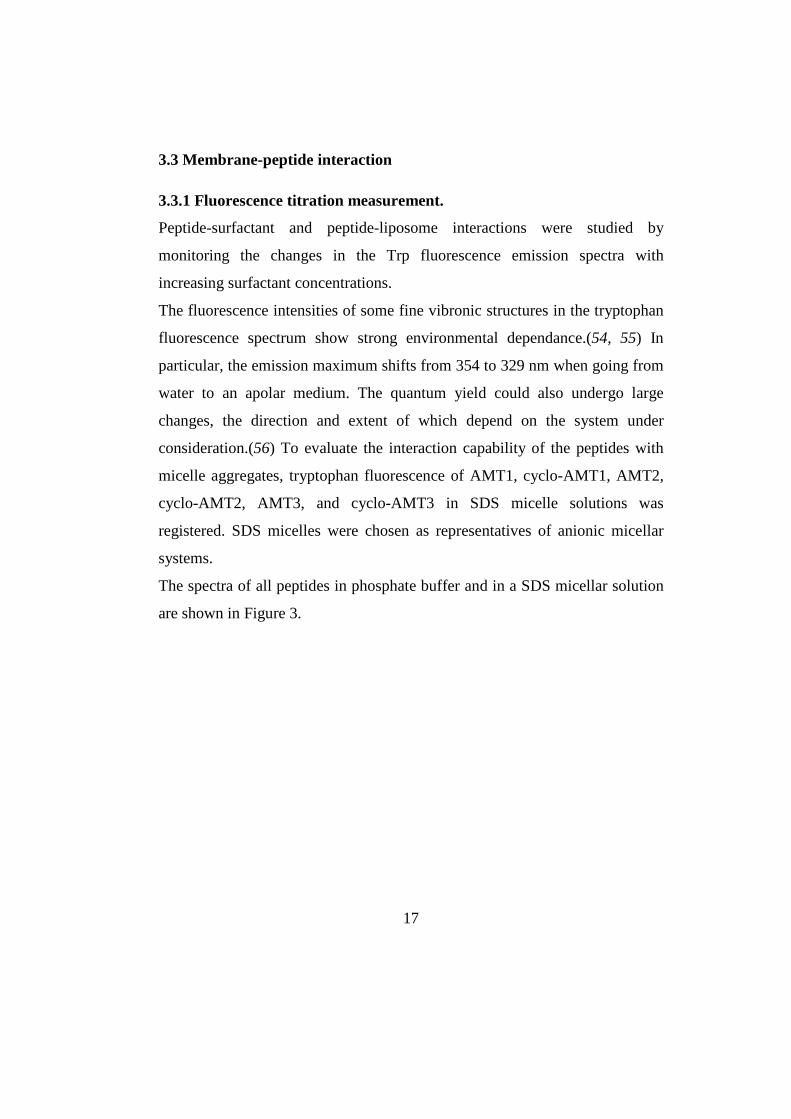
Peptide-surfactant and peptide-liposome interactions were studied by
monitoring the changes in the Trp fluorescence emission spectra with
increasing surfactant concentrations.
The fluorescence intensities of some fine vibronic structures in the tryptophan
fluorescence spectrum show strong environmental dependance.(54, 55) In
particular, the emission maximum shifts from 354 to 329 nm when going from
water to an apolar medium. The quantum yield could also undergo large
changes, the direction and extent of which depend on the system under
consideration.(56) To evaluate the interaction capability of the peptides with
micelle aggregates, tryptophan fluorescence of AMT1, cyclo-AMT1, AMT2,
cyclo-AMT2, AMT3, and cyclo-AMT3 in SDS micelle solutions was
registered. SDS micelles were chosen as representatives of anionic micellar
systems.
The spectra of all peptides in phosphate buffer and in a SDS micellar solution
are shown in Figure 3.
18
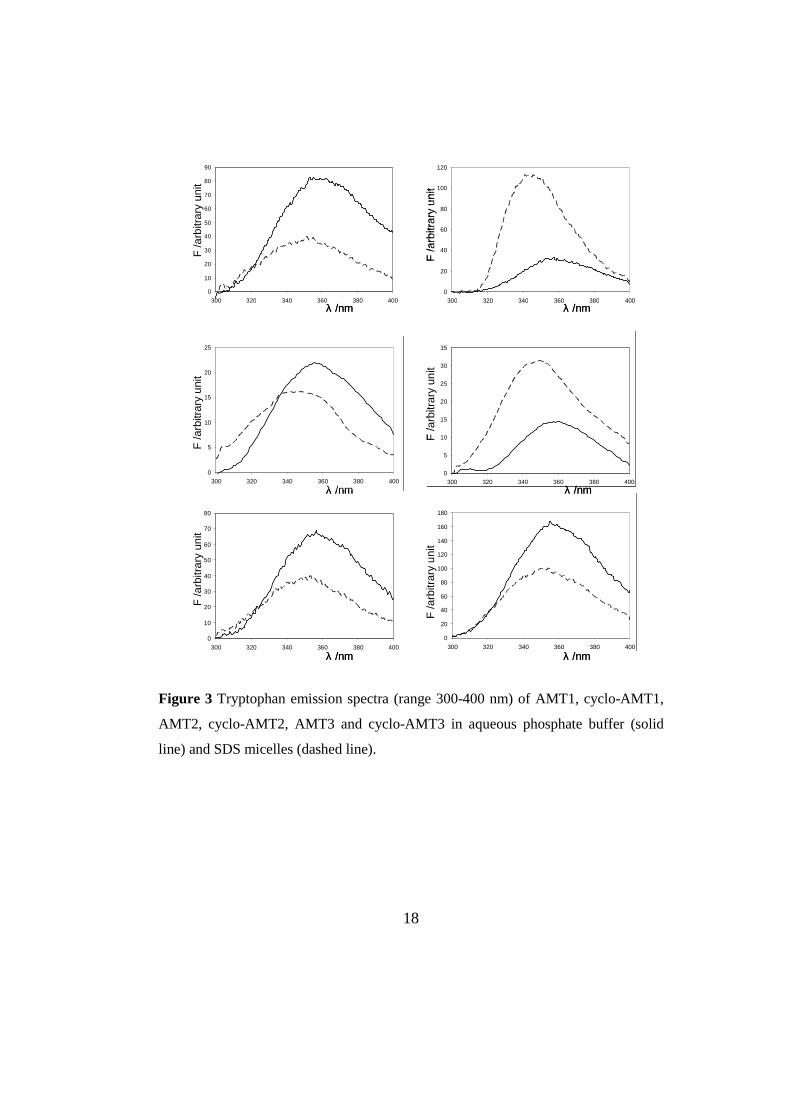
Figure 3 Tryptophan emission spectra (range 300-400 nm) of AMT1, cyclo-AMT1,
AMT2, cyclo-AMT2, AMT3 and cyclo-AMT3 in aqueous phosphate buffer (solid
line) and SDS micelles (dashed line).
0
5
10
15
20
25
300 320 340 360 380 400
0
10
20
30
40
50
60
70
80
90
300 320 340 360 380 400
0
5
10
15
20
25
30
35
300 320 340 360 380 400
0
20
40
60
80
100
120
300 320 340 360 380 400
0
20
40
60
80
100
120
140
160
180
300 320 340 360 380 4000
10
20
30
40
50
60
70
80
300 320 340 360 380 400
λ /nm λ /nm
λ /nm
λ /nmλ /nm
λ /nm
F /a
rbitr
ary
unit
F /a
rbitr
ary
unit
F /a
rbitr
ary
unit
F /a
rbitr
ary
unit
F /a
rbitr
ary
unit
F /a
rbitr
ary
unit
0
5
10
15
20
25
300 320 340 360 380 400
0
10
20
30
40
50
60
70
80
90
300 320 340 360 380 400
0
5
10
15
20
25
30
35
300 320 340 360 380 400
0
20
40
60
80
100
120
300 320 340 360 380 400
0
20
40
60
80
100
120
140
160
180
300 320 340 360 380 4000
10
20
30
40
50
60
70
80
300 320 340 360 380 400
λ /nm λ /nm
λ /nm
λ /nmλ /nm
λ /nm
F /a
rbitr
ary
unit
F /a
rbitr
ary
unit
F /a
rbitr
ary
unit
F /a
rbitr
ary
unit
F /a
rbitr
ary
unit
F /a
rbitr
ary
unit
19
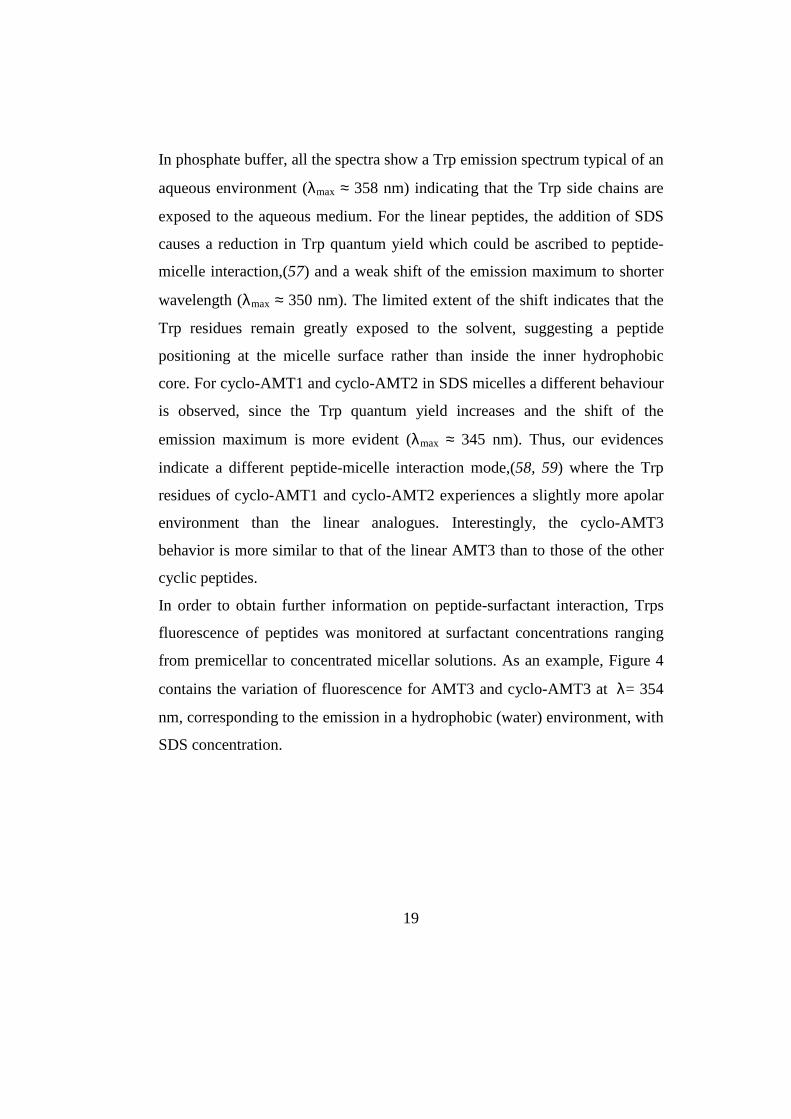
In phosphate buffer, all the spectra show a Trp emission spectrum typical of an
aqueous environment (λmax ≈ 358 nm) indicating that the Trp side chains are
exposed to the aqueous medium. For the linear peptides, the addition of SDS
causes a reduction in Trp quantum yield which could be ascribed to peptide-
micelle interaction,(57) and a weak shift of the emission maximum to shorter
wavelength (λmax ≈ 350 nm). The limited extent of the shift indicates that the
Trp residues remain greatly exposed to the solvent, suggesting a peptide
positioning at the micelle surface rather than inside the inner hydrophobic
core. For cyclo-AMT1 and cyclo-AMT2 in SDS micelles a different behaviour
is observed, since the Trp quantum yield increases and the shift of the
emission maximum is more evident (λmax ≈ 345 nm). Thus, our evidences
indicate a different peptide-micelle interaction mode,(58, 59) where the Trp
residues of cyclo-AMT1 and cyclo-AMT2 experiences a slightly more apolar
environment than the linear analogues. Interestingly, the cyclo-AMT3
behavior is more similar to that of the linear AMT3 than to those of the other
cyclic peptides.
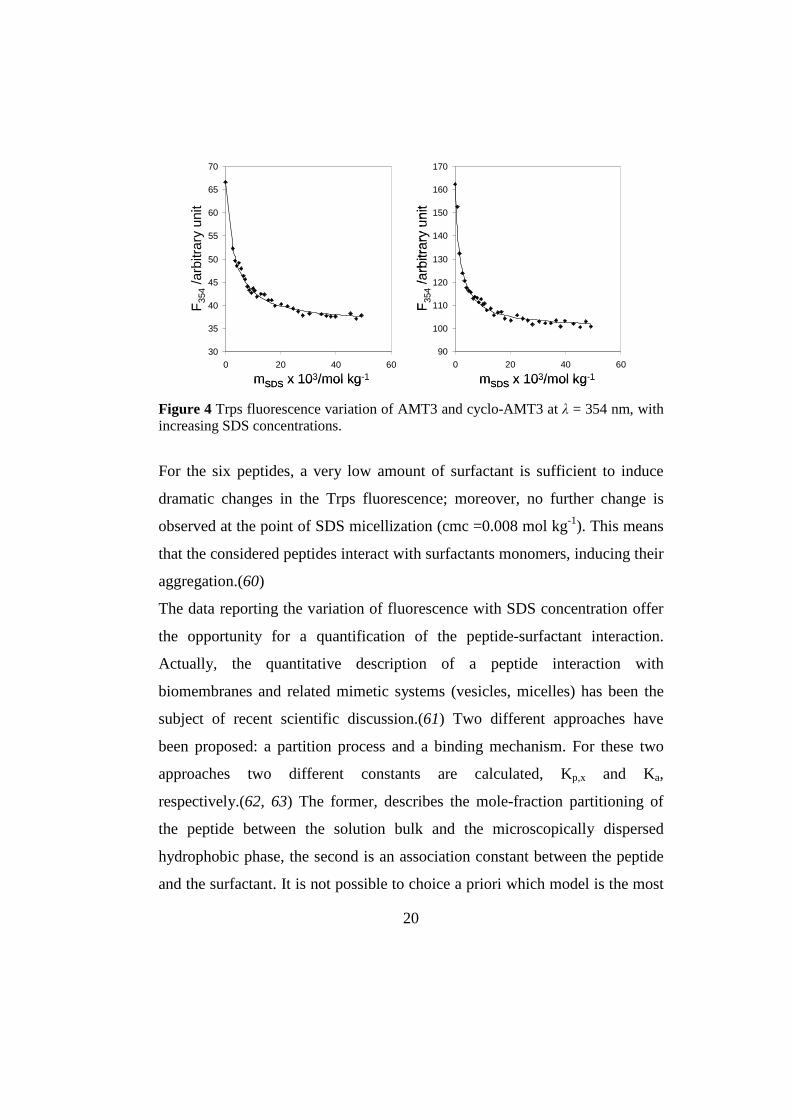
In order to obtain further information on peptide-surfactant interaction, Trps
fluorescence of peptides was monitored at surfactant concentrations ranging
from premicellar to concentrated micellar solutions. As an example, Figure 4
contains the variation of fluorescence for AMT3 and cyclo-AMT3 at λ= 354
nm, corresponding to the emission in a hydrophobic (water) environment, with
SDS concentration.
20
Figure 4 Trps fluorescence variation of AMT3 and cyclo-AMT3 at λ = 354 nm, with increasing SDS concentrations.
For the six peptides, a very low amount of surfactant is sufficient to induce
dramatic changes in the Trps fluorescence; moreover, no further change is
observed at the point of SDS micellization (cmc =0.008 mol kg-1). This means
that the considered peptides interact with surfactants monomers, inducing their
aggregation.(60)
The data reporting the variation of fluorescence with SDS concentration offer
the opportunity for a quantification of the peptide-surfactant interaction.
Actually, the quantitative description of a peptide interaction with
biomembranes and related mimetic systems (vesicles, micelles) has been the
subject of recent scientific discussion.(61) Two different approaches have
been proposed: a partition process and a binding mechanism. For these two
approaches two different constants are calculated, Kp,x and Ka,
respectively.(62, 63) The former, describes the mole-fraction partitioning of
the peptide between the solution bulk and the microscopically dispersed
hydrophobic phase, the second is an association constant between the peptide
and the surfactant. It is not possible to choice a priori which model is the most
30
35
40
45
50
55
60
65
70
0 20 40 60
90
100
110
120
130
140
150
160
170
0 20 40 60
F35
4/a
rbitr
ary
unit
F35
4/a
rbitr
ary
unit
mSDS x 103/mol kg-1 mSDS x 103/mol kg-1
30
35
40
45
50
55
60
65
70
0 20 40 60
90
100
110
120
130
140
150
160
170
0 20 40 60
F35
4/a
rbitr
ary
unit
F35
4/a
rbitr
ary
unit
mSDS x 103/mol kg-1 mSDS x 103/mol kg-1
21
representative model for the system under scrutiny, but the choice depends on
the trend evidenced by Trps fluorescence at λ = 354 nm in function of
surfactant concentration.
In the case of our peptides, the variation of Trps fluorescence at λ = 354 nm in
function of surfactant concentration shows a saturation trend. For this trend the
binding approach is proved the most representative model; here, interpolation
of the experimental Trp fluorescence data, F, by means of the proper equation
allows the estimation Ka (association constant between the peptide and the
surfactant) and n (surfactant molecules) as described below.
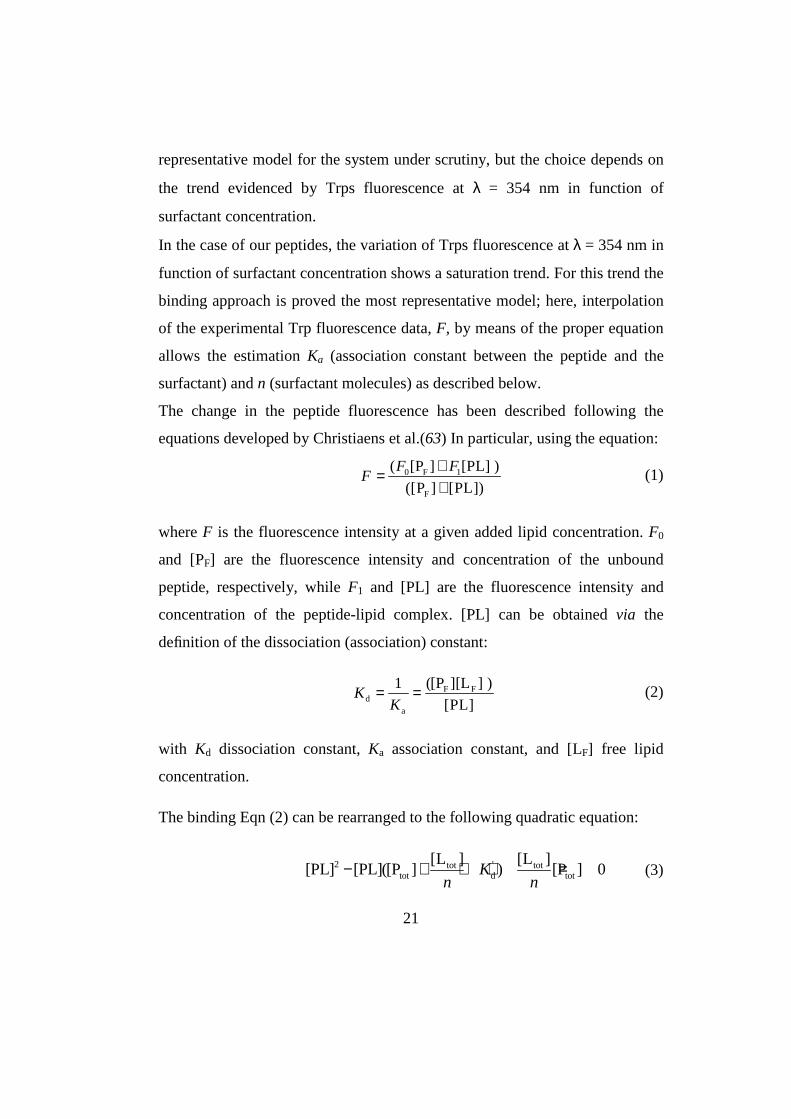
The change in the peptide fluorescence has been described following the
equations developed by Christiaens et al.(63) In particular, using the equation:
0 F 1
F
( [P ] [PL] )
([P ] [PL])
+=+
F FF (1)
where F is the fluorescence intensity at a given added lipid concentration. F0
and [PF] are the fluorescence intensity and concentration of the unbound
peptide, respectively, while F1 and [PL] are the fluorescence intensity and
concentration of the peptide-lipid complex. [PL] can be obtained via the
definition of the dissociation (association) constant:
F Fd
a
([P ][L ] )1
[PL]= =K
K (2)
with Kd dissociation constant, Ka association constant, and [LF] free lipid
concentration.
The binding Eqn (2) can be rearranged to the following quadratic equation:
2 'tot tottot d tot
[L ] [L ][PL] [PL]([P ] ) [P ] 0− + + + =K
n n (3)
22
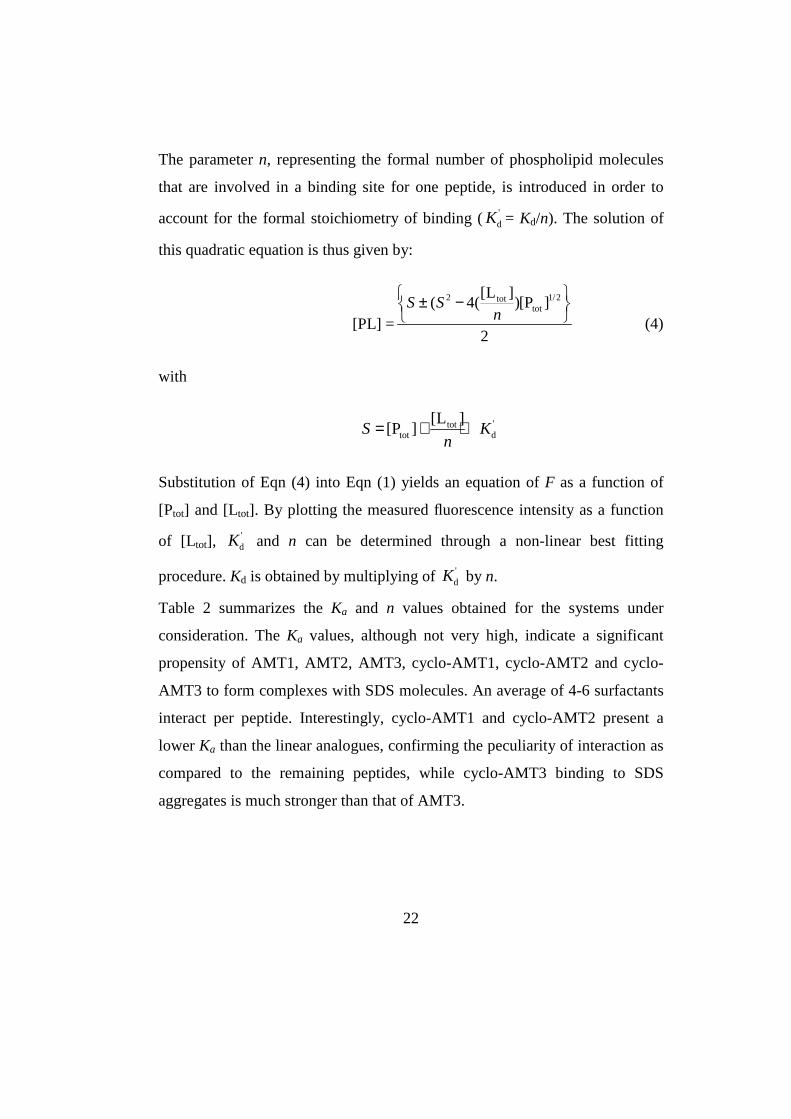
The parameter n, representing the formal number of phospholipid molecules
that are involved in a binding site for one peptide, is introduced in order to
account for the formal stoichiometry of binding ('dK = Kd/n). The solution of
this quadratic equation is thus given by:
2 1/2tottot
[L ]( 4( )[P ]
[PL] =2
± −
S Sn
(4)
with
'tottot d
[L ][P ]= + +S K
n
Substitution of Eqn (4) into Eqn (1) yields an equation of F as a function of
[Ptot] and [Ltot]. By plotting the measured fluorescence intensity as a function
of [L tot], 'dK and n can be determined through a non-linear best fitting
procedure. Kd is obtained by multiplying of 'dK by n.
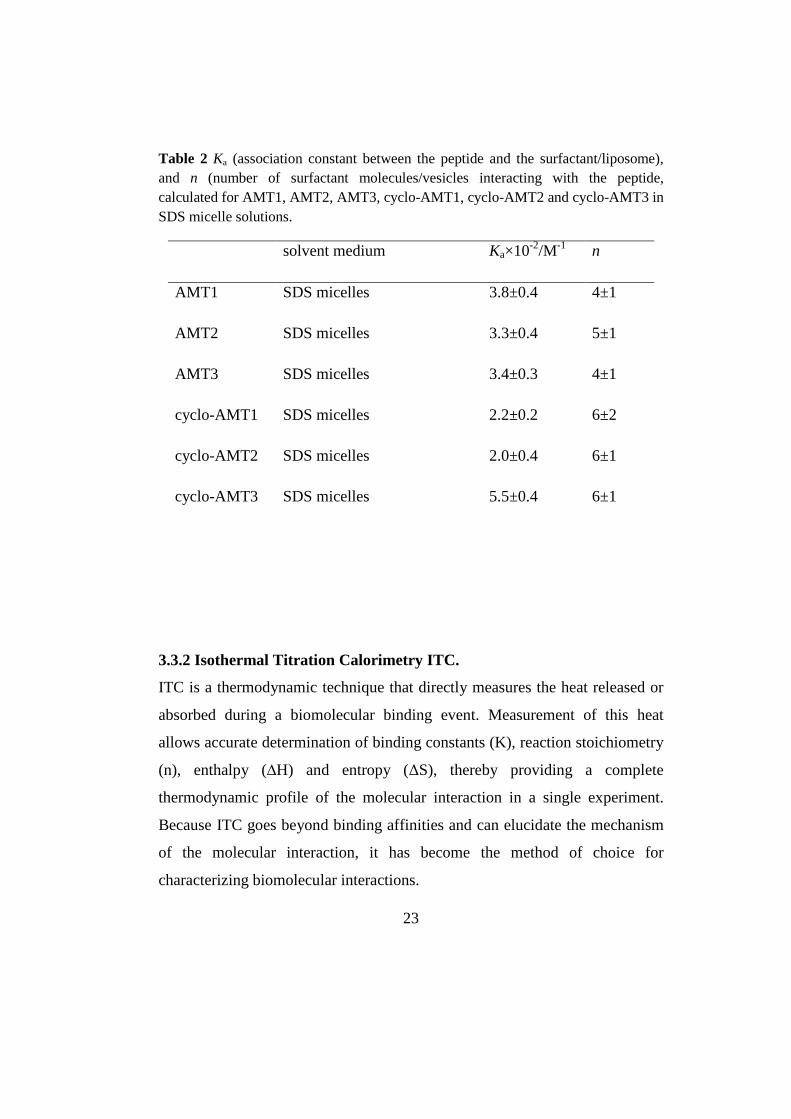
Table 2 summarizes the Ka and n values obtained for the systems under
consideration. The Ka values, although not very high, indicate a significant
propensity of AMT1, AMT2, AMT3, cyclo-AMT1, cyclo-AMT2 and cyclo-
AMT3 to form complexes with SDS molecules. An average of 4-6 surfactants
interact per peptide. Interestingly, cyclo-AMT1 and cyclo-AMT2 present a
lower Ka than the linear analogues, confirming the peculiarity of interaction as
compared to the remaining peptides, while cyclo-AMT3 binding to SDS
aggregates is much stronger than that of AMT3.
23
Table 2 Ka (association constant between the peptide and the surfactant/liposome), and n (number of surfactant molecules/vesicles interacting with the peptide, calculated for AMT1, AMT2, AMT3, cyclo-AMT1, cyclo-AMT2 and cyclo-AMT3 in SDS micelle solutions.
solvent medium Ka×10-2/M-1 n
AMT1 SDS micelles 3.8±0.4 4±1
AMT2 SDS micelles 3.3±0.4 5±1
AMT3 SDS micelles 3.4±0.3 4±1
cyclo-AMT1 SDS micelles 2.2±0.2 6±2
cyclo-AMT2 SDS micelles 2.0±0.4 6±1
cyclo-AMT3 SDS micelles 5.5±0.4 6±1
3.3.2 Isothermal Titration Calorimetry ITC.
ITC is a thermodynamic technique that directly measures the heat released or
absorbed during a biomolecular binding event. Measurement of this heat
allows accurate determination of binding constants (K), reaction stoichiometry
(n), enthalpy (∆H) and entropy (∆S), thereby providing a complete
thermodynamic profile of the molecular interaction in a single experiment.
Because ITC goes beyond binding affinities and can elucidate the mechanism
of the molecular interaction, it has become the method of choice for
characterizing biomolecular interactions.
24
To study lipid-peptide interaction by ITC there are two different type of
titration.(64)
In the first titration mode the peptide solution is injected into the lipid
dispersion contained in the calorimeter cell. In this titration the lipids vesicles
are in excess compared to the peptide, so all peptide molecules injected bind
the vesicle surface, provided the binding constant is sufficiently large. Each
injection gives the same heat of reaction hi, and hi /δni provide the enthalpy of
binding, ∆H0.
In the second titration mode the peptide contained in the calorimeter cell is
titrated with lipid vesicles injections. As this type of titration was previously
preferred to study AMT1 and cyclo-AMT1 binding to POPC vesicles(65) we
have adopted this titration mode and experimental conditions for our
experiments.
Peptide-lipid interaction: electrostatic/hydrophobic factor
The first measurements investigated the AMT interaction to POPC/POPG
(75/25, M/M) SUVs at pH 7.4 and 25°C. POPC/POPG 3:1 M/M is often used
to mimic the electrostatic charge of cytoplasmic membrane of yeast as C.
Albicans.(66, 67)
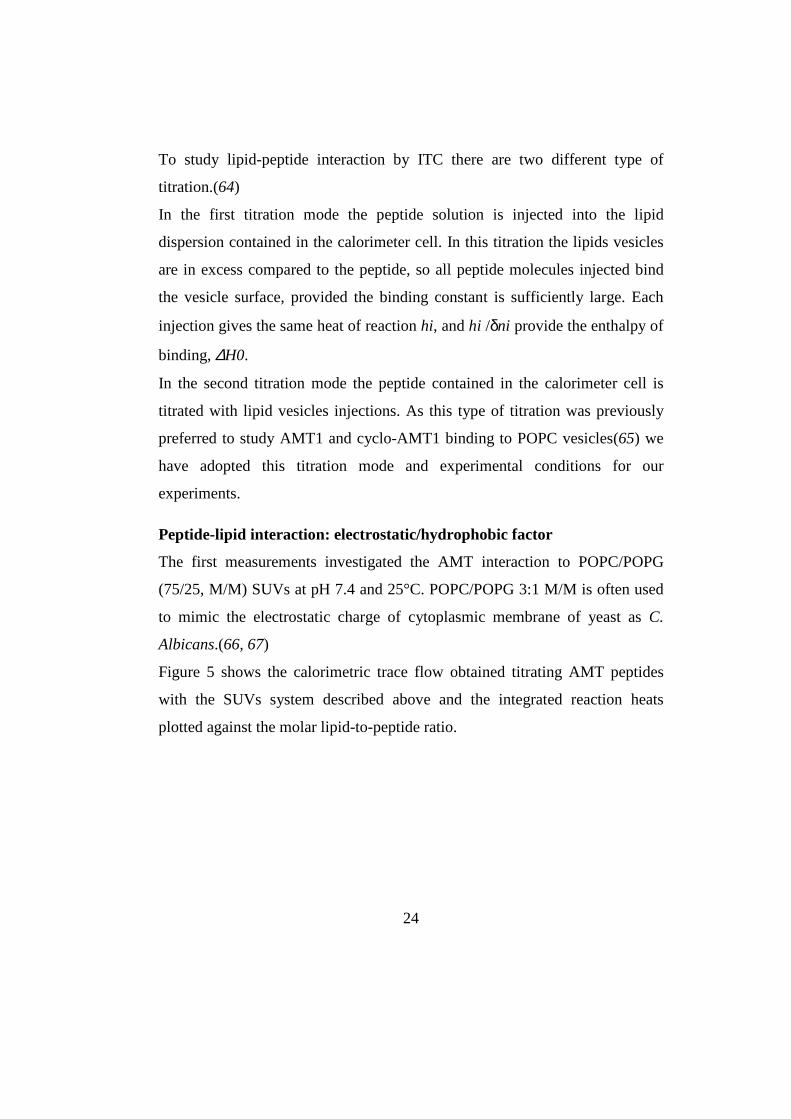
Figure 5 shows the calorimetric trace flow obtained titrating AMT peptides
with the SUVs system described above and the integrated reaction heats
plotted against the molar lipid-to-peptide ratio.
25
Figure 5 Titration of each peptide with POPC/POPG (75/25 M/M) SUVs at pH 7.4
and 25°C. UP: ITC trace (differential heating power vs. time). Down: the cumulative
heat of reaction as a function of the lipid to-to-peptide molar ratio.
In each titration the binding of peptide to vesicles produce exothermic heat of
reaction. The exothermic heat flow decreases with increasing number of
injections because less and less peptide is available for binding. The residual
heat is the heat of dilution of the lipid dispersion in the buffer.
The molar binding enthalpy ∆H0 of peptides to POPC/POPG SUVs can be
determined from the total heat released in the titration, ∑hi, and the molar
amount of peptide in the sample cell, n0, according to
∆�� = ∑ ���
(1)
0 20 40 60 80 100 120
-0.50
-0.40
-0.30
-0.20
-0.10
0.00
-4.00
-3.00
-2.00
-1.00
0.00
1.000 20 40 60 80
Time (min)
µca
l/sec
Molar Ratio
KC
al/M
ole
of In
ject
ant
0 20 40 60 80 100 120
-0.50
-0.40
-0.30
-0.20
-0.10
0.00
-4.00
-3.00
-2.00
-1.00
0.00
1.000 20 40 60 80
Time (min)
µca
l/sec
Molar Ratio
KC
al/M
ole
of In
ject
ant
0 20 40 60 80 100-0.50
-0.40
-0.30
-0.20
-0.10
0.00
-4.00
-3.00
-2.00
-1.00
0.00
1.000 20 40 60 80
Time (min)
µca
l/sec
Molar Ratio
KC
al/M
ole
of In
ject
ant
0 20 40 60 80 100-0.50
-0.40
-0.30
-0.20
-0.10
0.00
-4.00
-3.00
-2.00
-1.00
0.00
1.000 20 40 60 80
Time (min)
µca
l/sec
Molar Ratio
KC
al/M
ole
of In
ject
ant
0 20 40 60 80 100
-0.40
-0.30
-0.20
-0.10
0.00
-4.00
-3.00
-2.00
-1.00
0.00
1.000 20 40 60 80
Time (min)µ
cal/s
ec
Molar Ratio
KC
al/M
ole
of In
ject
ant
0 10 20 30 40 50 60 70 80
-0.40
-0.30
-0.20
-0.10
0.00
-4.00
-3.00
-2.00
-1.00
0.00
1.000 20 40 60 80
Time (min)
µca
l/sec
Molar Ratio
KC
al/M
ole
of In
ject
ant
AMT1 CYCLO-AMT1
CYCLO-AMT2 CYCLO-AMT3 AMT3
AMT2
26
The enthalpy of the reaction is calculated according to Equation (1) assuming
that the total amount of peptide in the calorimeter is bound. The calculated
binding enthalpies ∆H0 are listed in Table 3.
High-sensitivity calorimetric experiments can allow the definition of a binding
isotherm,(68) Xib = f(cf). It describes the extent of binding, Xi
b, as a function of
the concentration of free peptide, cf, at each injection of the titration. Xib is
defined as the ratio between the molar amount of bound peptide, nipep bound, and
the molar amount of injected lipid available for binding, niL, after i injections.
�� = � � ,�����
�
��� (2)
niL is given by the lipid concentration in the syringe, the volume of injection
and the number i of injections performed. nipep bound is determined from the
experimental heats of reaction hi as follows:
����,������ = ∑ ���
���∆�!"�##$ � (3)
with cpep0 the total peptide concentration in the calorimeter cell and Vcell the
volume of the calorimeter cell. The molar amount of peptide bound to the lipid
membrane (equation 3) combined with the principle of mass conservation
allows the calculation of the free peptide concentration in solution. This
provides the description of the binding isotherm without assuming a specific
binding model.
The calculation of further thermodynamic parameters such as the binding
constant or the free energy of the reaction requires the analysis of the binding
isotherm. In the present context it is based on a surface partitioning model in
which the peptide binding to the lipid membrane is dependent on the peptide
affinity for the lipid and the concentration of peptide, cM, found immediately
above the plane of binding(69, 70) according to:
27
� = %�&' (4)
with K0 the intrinsic binding constant. The surface partitioning model takes
into account the attraction of positively-charged peptides to the negatively-
charged membrane surface. The peptide concentration at the membrane
surface, cM, is therefore higher than the peptide concentration in the bulk, cf.
The Boltzmann law expresses the electrostatic equilibrium between these two
concentrations:
&' = &()*+, -Ψ./ 0 (5)
where zp is the peptide effective charge, Ψ is the membrane surface potential,
F0 is the Faraday constant and RT is the thermal energy. Ψ can be calculated
from the Gouy-Chapman theory. It leads to the peptide concentration at the
membrane surface after each lipid injection and finally to the intrinsic binding
constant K0, according to equation (4).
The free energy of binding ∆G0 follows from: ∆G0 = -RTln(55.5 K0). The
factor 55.5 is the molar concentration of water and corrects for the cratic
contribution. The binding entropy can be derived from the second law of
thermodynamics, ∆G0 = ∆H0-T∆S0.
The thermodynamic parameters calculated are summerized in Table 3.
28
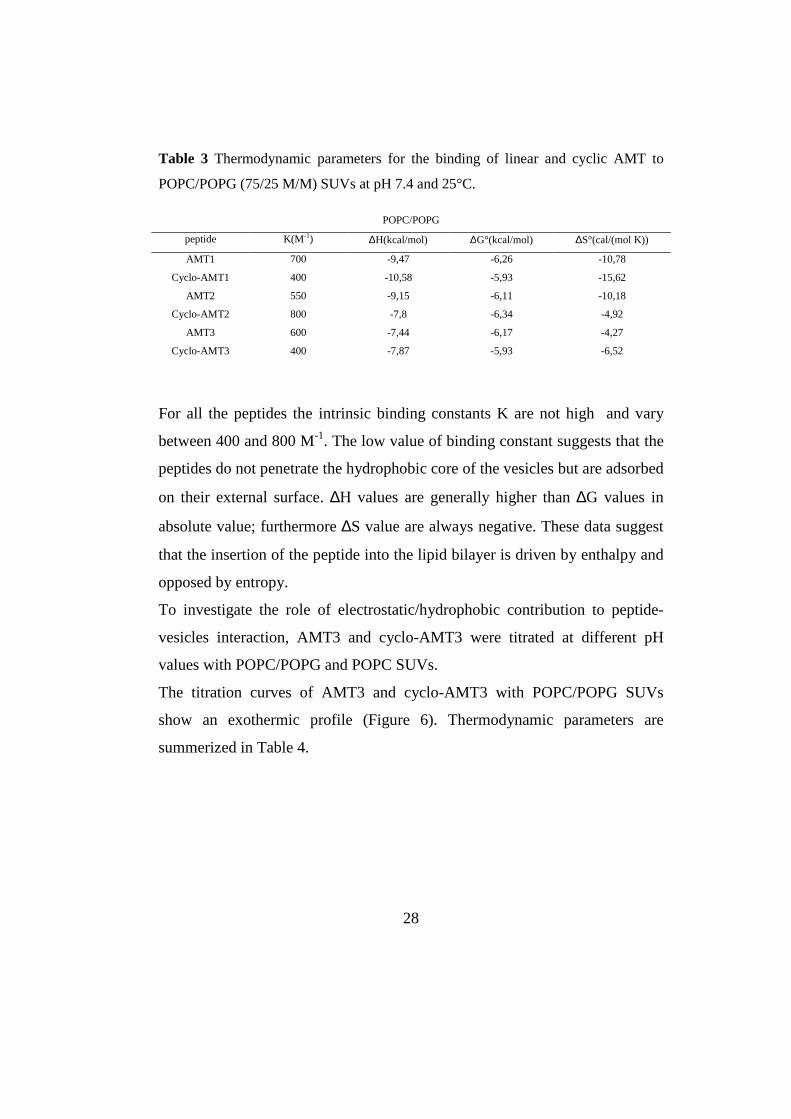
Table 3 Thermodynamic parameters for the binding of linear and cyclic AMT to
POPC/POPG (75/25 M/M) SUVs at pH 7.4 and 25°C.
POPC/POPG
peptide K(M-1) ∆H(kcal/mol) ∆G°(kcal/mol) ∆S°(cal/(mol K))
AMT1 700 -9,47 -6,26 -10,78
Cyclo-AMT1 400 -10,58 -5,93 -15,62
AMT2 550 -9,15 -6,11 -10,18
Cyclo-AMT2 800 -7,8 -6,34 -4,92
AMT3 600 -7,44 -6,17 -4,27
Cyclo-AMT3 400 -7,87 -5,93 -6,52
For all the peptides the intrinsic binding constants K are not high and vary
between 400 and 800 M-1. The low value of binding constant suggests that the
peptides do not penetrate the hydrophobic core of the vesicles but are adsorbed
on their external surface. ∆H values are generally higher than ∆G values in
absolute value; furthermore ∆S value are always negative. These data suggest
that the insertion of the peptide into the lipid bilayer is driven by enthalpy and
opposed by entropy.
To investigate the role of electrostatic/hydrophobic contribution to peptide-
vesicles interaction, AMT3 and cyclo-AMT3 were titrated at different pH
values with POPC/POPG and POPC SUVs.
The titration curves of AMT3 and cyclo-AMT3 with POPC/POPG SUVs
show an exothermic profile (Figure 6). Thermodynamic parameters are
summerized in Table 4.
29
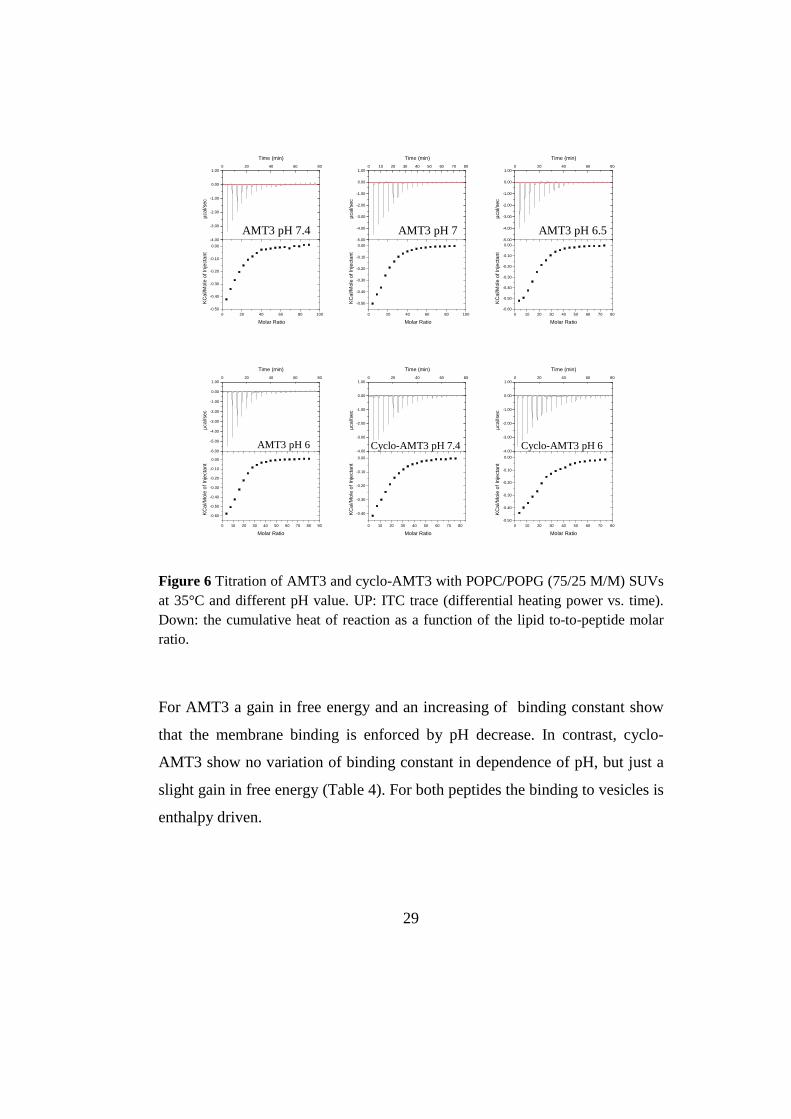
Figure 6 Titration of AMT3 and cyclo-AMT3 with POPC/POPG (75/25 M/M) SUVs at 35°C and different pH value. UP: ITC trace (differential heating power vs. time). Down: the cumulative heat of reaction as a function of the lipid to-to-peptide molar ratio.
For AMT3 a gain in free energy and an increasing of binding constant show
that the membrane binding is enforced by pH decrease. In contrast, cyclo-
AMT3 show no variation of binding constant in dependence of pH, but just a
slight gain in free energy (Table 4). For both peptides the binding to vesicles is
enthalpy driven.
0 20 40 60 80 100-0.50
-0.40
-0.30
-0.20
-0.10
0.00
-4.00
-3.00
-2.00
-1.00
0.00
1.000 20 40 60 80
Time (min)
µca
l/sec
Molar Ratio
KC
al/M
ole
of In
ject
ant
0 20 40 60 80 100
-0.50
-0.40
-0.30
-0.20
-0.10
0.00
-5.00
-4.00
-3.00
-2.00
-1.00
0.00
1.000 10 20 30 40 50 60 70 80
Time (min)
µca
l/sec
Molar Ratio
KC
al/M
ole
of In
ject
ant
0 10 20 30 40 50 60 70 80-0.60
-0.50
-0.40
-0.30
-0.20
-0.10
0.00-5.00
-4.00
-3.00
-2.00
-1.00
0.00
1.000 20 40 60 80
Time (min)
µca
l/sec
Molar Ratio
KC
al/M
ole
of In
ject
ant
0 10 20 30 40 50 60 70 80 90
-0.60
-0.50
-0.40
-0.30
-0.20
-0.10
0.00
-6.00
-5.00
-4.00
-3.00
-2.00
-1.00
0.00
1.000 20 40 60 80
Time (min)
µca
l/sec
Molar Ratio
KC
al/M
ole
of In
ject
ant
0 10 20 30 40 50 60 70 80
-0.40
-0.30
-0.20
-0.10
0.00
-4.00
-3.00
-2.00
-1.00
0.00
1.000 20 40 60 80
Time (min)
µca
l/sec
Molar Ratio
KC
al/M
ole
of In
ject
ant
0 10 20 30 40 50 60 70 80-0.50
-0.40
-0.30
-0.20
-0.10
0.00
-4.00
-3.00
-2.00
-1.00
0.00
1.000 20 40 60 80
Time (min)
µca
l/sec
Molar Ratio
KC
al/M
ole
of In
ject
ant
AMT3 pH 7.4 AMT3 pH 7 AMT3 pH 6.5
AMT3 pH 6 Cyclo-AMT3 pH 6 Cyclo-AMT3 pH 7.4
30
Table 4 Thermodynamic parameters for the binding of AMT3 and cyclo-AMT3 to POPC/POPG (75/25 M/M) SUVs at 35°C and different pH value.
POPC/POPG
peptide K(M-1) ∆H(kcal/mol) ∆G°(kcal/mol) ∆S°(cal/(mol K)) pH T(°C)
AMT3 800 -7,45 -6,55 -2,93 7.4 35
AMT3 900 -9,06 -6,62 -7,92 7.0 35
AMT3 1700 -9,21 -7,01 -7,14 6.5 35
AMT3 6000 -9,22 -7,78 -4,67 6.0 35
Cyclo-AMT3 400 -7,87 -5,93 -6,52 7.4 25
Cyclo-AMT3 400 -9,54 -6,12 -11,09 6.0 35
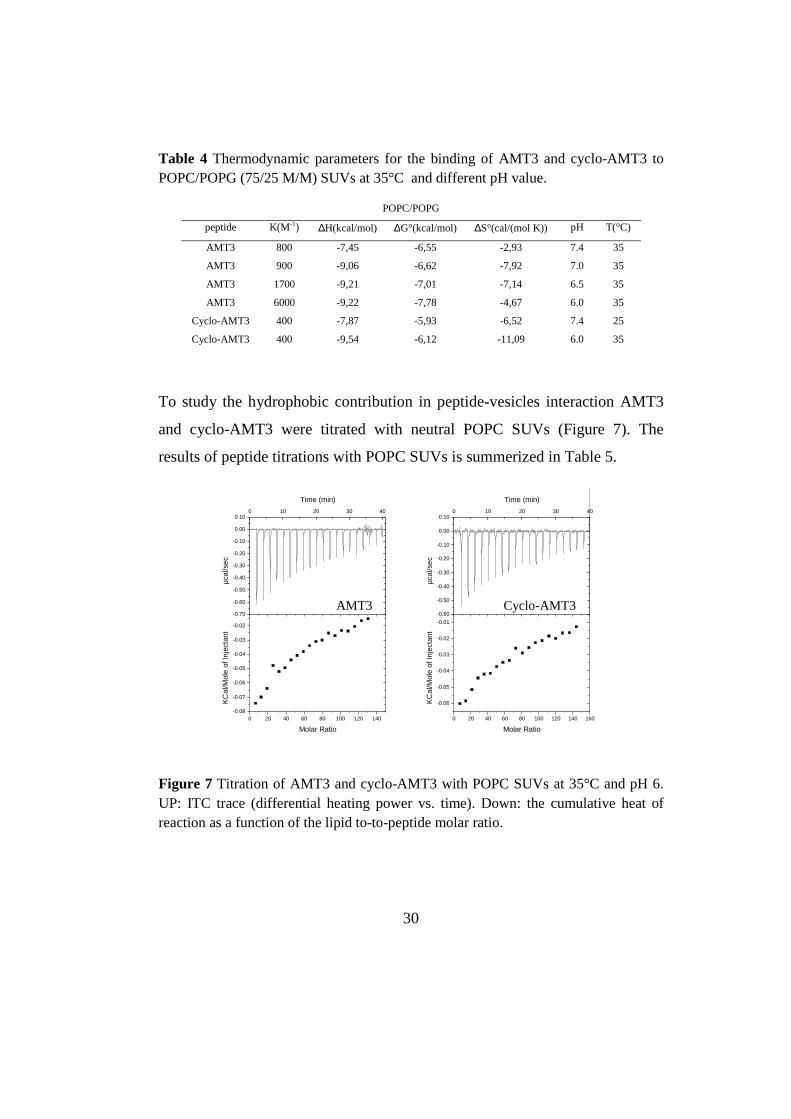
To study the hydrophobic contribution in peptide-vesicles interaction AMT3
and cyclo-AMT3 were titrated with neutral POPC SUVs (Figure 7). The
results of peptide titrations with POPC SUVs is summerized in Table 5.
Figure 7 Titration of AMT3 and cyclo-AMT3 with POPC SUVs at 35°C and pH 6. UP: ITC trace (differential heating power vs. time). Down: the cumulative heat of reaction as a function of the lipid to-to-peptide molar ratio.
0 20 40 60 80 100 120 140-0.08
-0.07
-0.06
-0.05
-0.04
-0.03
-0.02
-0.70
-0.60
-0.50
-0.40
-0.30
-0.20
-0.10
0.00
0.100 10 20 30 40
Time (min)
µca
l/sec
Molar Ratio
KC
al/M
ole
of In
ject
ant
0 20 40 60 80 100 120 140 160
-0.06
-0.05
-0.04
-0.03
-0.02
-0.01
-0.60
-0.50
-0.40
-0.30
-0.20
-0.10
0.00
0.100 10 20 30 40
Time (min)
µca
l/sec
Molar Ratio
KC
al/M
ole
of In
ject
ant
AMT3 Cyclo-AMT3
31
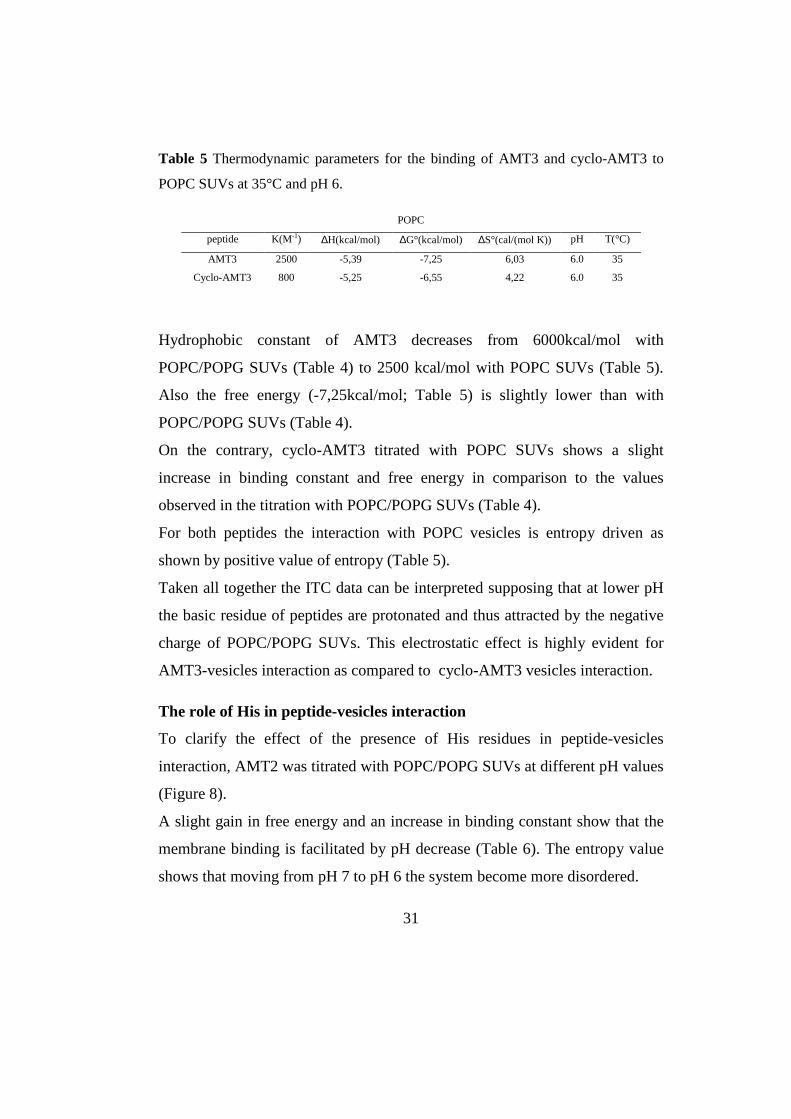
Table 5 Thermodynamic parameters for the binding of AMT3 and cyclo-AMT3 to
POPC SUVs at 35°C and pH 6.
POPC
peptide K(M-1) ∆H(kcal/mol) ∆G°(kcal/mol) ∆S°(cal/(mol K)) pH T(°C)
AMT3 2500 -5,39 -7,25 6,03 6.0 35
Cyclo-AMT3 800 -5,25 -6,55 4,22 6.0 35
Hydrophobic constant of AMT3 decreases from 6000kcal/mol with
POPC/POPG SUVs (Table 4) to 2500 kcal/mol with POPC SUVs (Table 5).
Also the free energy (-7,25kcal/mol; Table 5) is slightly lower than with
POPC/POPG SUVs (Table 4).
On the contrary, cyclo-AMT3 titrated with POPC SUVs shows a slight
increase in binding constant and free energy in comparison to the values
observed in the titration with POPC/POPG SUVs (Table 4).
For both peptides the interaction with POPC vesicles is entropy driven as
shown by positive value of entropy (Table 5).
Taken all together the ITC data can be interpreted supposing that at lower pH
the basic residue of peptides are protonated and thus attracted by the negative
charge of POPC/POPG SUVs. This electrostatic effect is highly evident for
AMT3-vesicles interaction as compared to cyclo-AMT3 vesicles interaction.
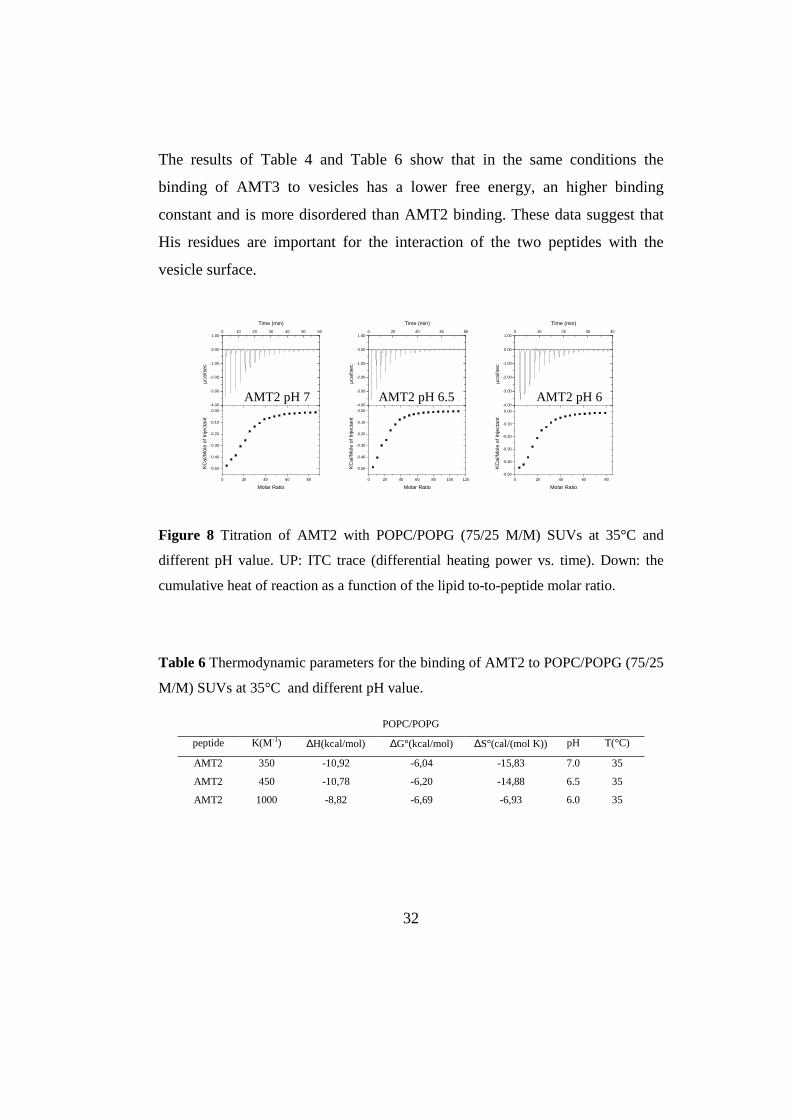
The role of His in peptide-vesicles interaction
To clarify the effect of the presence of His residues in peptide-vesicles
interaction, AMT2 was titrated with POPC/POPG SUVs at different pH values
(Figure 8).
A slight gain in free energy and an increase in binding constant show that the
membrane binding is facilitated by pH decrease (Table 6). The entropy value
shows that moving from pH 7 to pH 6 the system become more disordered.
32
The results of Table 4 and Table 6 show that in the same conditions the
binding of AMT3 to vesicles has a lower free energy, an higher binding
constant and is more disordered than AMT2 binding. These data suggest that
His residues are important for the interaction of the two peptides with the
vesicle surface.
Figure 8 Titration of AMT2 with POPC/POPG (75/25 M/M) SUVs at 35°C and
different pH value. UP: ITC trace (differential heating power vs. time). Down: the
cumulative heat of reaction as a function of the lipid to-to-peptide molar ratio.
Table 6 Thermodynamic parameters for the binding of AMT2 to POPC/POPG (75/25
M/M) SUVs at 35°C and different pH value.
POPC/POPG
peptide K(M-1) ∆H(kcal/mol) ∆G°(kcal/mol) ∆S°(cal/(mol K)) pH T(°C)
AMT2 350 -10,92 -6,04 -15,83 7.0 35
AMT2 450 -10,78 -6,20 -14,88 6.5 35
AMT2 1000 -8,82 -6,69 -6,93 6.0 35
0 20 40 60 80
-0.50
-0.40
-0.30
-0.20
-0.10
0.00
-4.00
-3.00
-2.00
-1.00
0.00
1.000 10 20 30 40 50 60
Time (min)
µca
l/sec
Molar Ratio
KC
al/M
ole
of In
ject
ant
0 20 40 60 80 100 120
-0.50
-0.40
-0.30
-0.20
-0.10
0.00
-4.00
-3.00
-2.00
-1.00
0.00
1.000 20 40 60 80
Time (min)
µca
l/sec
Molar Ratio
KC
al/M
ole
of In
ject
ant
0 20 40 60 80-0.50
-0.40
-0.30
-0.20
-0.10
0.00
-4.00
-3.00
-2.00
-1.00
0.00
1.000 10 20 30 40
Time (min)
µca
l/sec
Molar Ratio
KC
al/M
ole
of In
ject
ant
AMT2 pH 7 AMT2 pH 6.5 AMT2 pH 6
33
The role of membrane fluidity in peptide-vesicles interaction
To understand the influence of membrane fluidity we repeated the titration of
AMT3 and cyclo-AMT3 with POPC/POPG+cholesterol, and
POPC/POPG/POPE+cholesterol SUVs that mimics the composition of the
outer leaflet of yeast membrane (Figure 9).(66, 67)
Cholesterol is used as mimetic of ergosterol, the sterol component in yeast
membrane. Cholesterol is an essential component in the membranes of most
eukaryotic cells, in which it mediates many functions including membrane
fluidity, permeability and the formation of ordered membrane domains. The
presence of cholesterol decreases the membrane fluidity.
POPC/POPG/POPE/cholesterol 50/25/25 M/M/M bilayers are more densely
packed than POPC/POPG/cholesterol 75/25 M/M bilayers.(71) In contrast to
POPC, the head group of POPE is a primary amine that makes it capable for
the formation of intra and intermolecular hydrogen bonds to lipid phosphate
groups.(72) As a result, the water-lipid interface of a POPE membrane is more
densely packed than POPC membrane.
The results of titrations are summerized in Table 7 and 8.
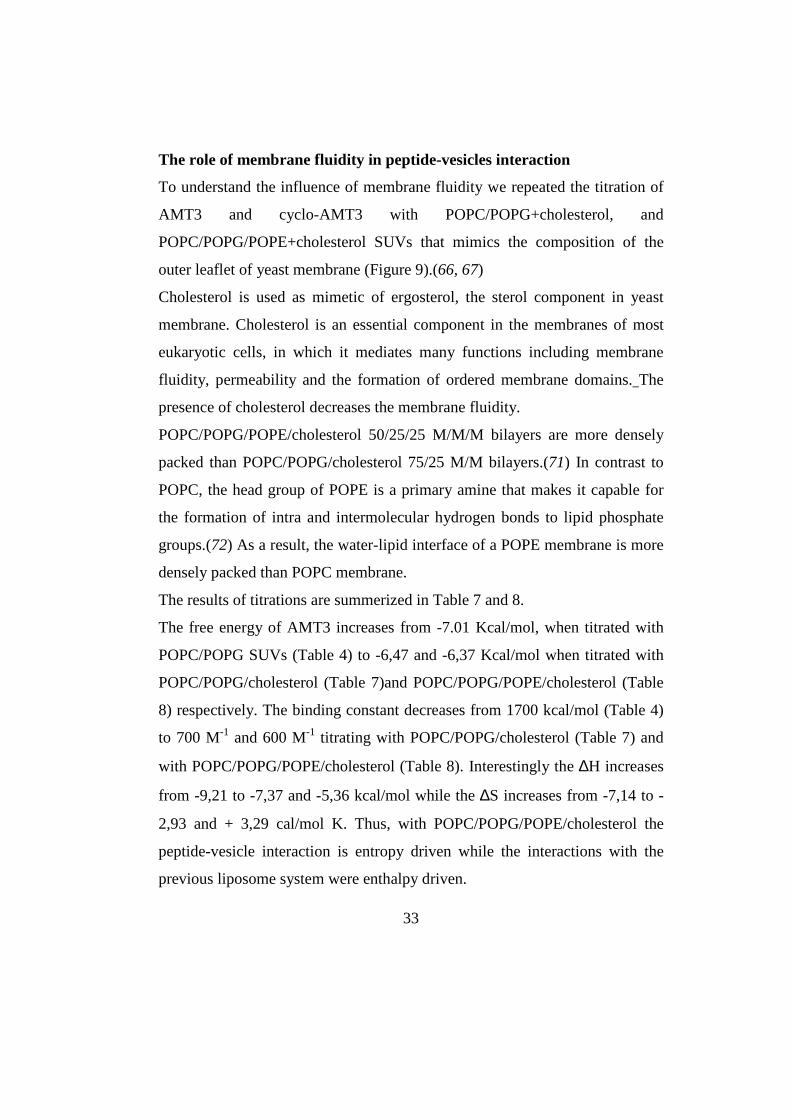
The free energy of AMT3 increases from -7.01 Kcal/mol, when titrated with
POPC/POPG SUVs (Table 4) to -6,47 and -6,37 Kcal/mol when titrated with
POPC/POPG/cholesterol (Table 7)and POPC/POPG/POPE/cholesterol (Table
8) respectively. The binding constant decreases from 1700 kcal/mol (Table 4)
to 700 M-1 and 600 M-1 titrating with POPC/POPG/cholesterol (Table 7) and
with POPC/POPG/POPE/cholesterol (Table 8). Interestingly the ∆H increases
from -9,21 to -7,37 and -5,36 kcal/mol while the ∆S increases from -7,14 to -
2,93 and + 3,29 cal/mol K. Thus, with POPC/POPG/POPE/cholesterol the
peptide-vesicle interaction is entropy driven while the interactions with the
previous liposome system were enthalpy driven.
34
The binding constant of cyclo-AMT3 titrated with POPC/POPG/cholesterol
SUVs is 250 M-1 and it slightly decreases to 150 M-1 when the peptide is
titrated with POPC/POPG/POPE/cholesterol vesicles. The results of the
titrations of cyclo-AMT3 with the two vesicles system show an increase of ∆G
and ∆H and a decrease of ∆S (see Tables 7 and 8). The data show that the
peptide-membrane interaction is opposed by membrane rigidity.
Figure 9 Titration of AMT3 and cyclo-AMT3 with POPC/POPG and cholesterol SUVs and with POPC/POPE/POPG and cholesterol SUVs at 35°C and pH 6.5. UP: ITC trace (differential heating power vs. time). Down: the cumulative heat of reaction as a function of the lipid to-to-peptide molar ratio.
0 10 20 30 40 50 60 70 80
-0.40
-0.35
-0.30
-0.25
-0.20
-0.15
-0.10
-0.05
0.00-4.00
-3.00
-2.00
-1.00
0.00
0 10 20 30 40 50
Time (min)
µca
l/sec
Molar Ratio
KC
al/M
ole
of In
ject
ant
0 20 40 60 80 100
-0.30
-0.20
-0.10
0.00
-3.00
-2.00
-1.00
0.00
1.000 10 20 30 40 50
Time (min)
µca
l/sec
Molar Ratio
KC
al/M
ole
of In
ject
ant
0 10 20 30 40 50 60 70 80
-0.25
-0.20
-0.15
-0.10
-0.05
0.00
-2.50
-2.00
-1.50
-1.00
-0.50
0.00
0 10 20 30 40 50 60
Time (min)
µca
l/sec
Molar Ratio
KC
al/M
ole
of In
ject
ant
0 20 40 60 80 100-0.25
-0.20
-0.15
-0.10
-0.05
0.00
-2.00
-1.50
-1.00
-0.50
0.00
0 10 20 30 40 50 60
Time (min)
µca
l/sec
Molar Ratio
KC
al/M
ole
of In
ject
ant
AMT3 POPC/POPG/chol
Cyclo-AMT3 POPC/POPG/chol
AMT3 POPC/POPG/POPE/chol
Cyclo-AMT3 POPC/POPG/POPE/chol
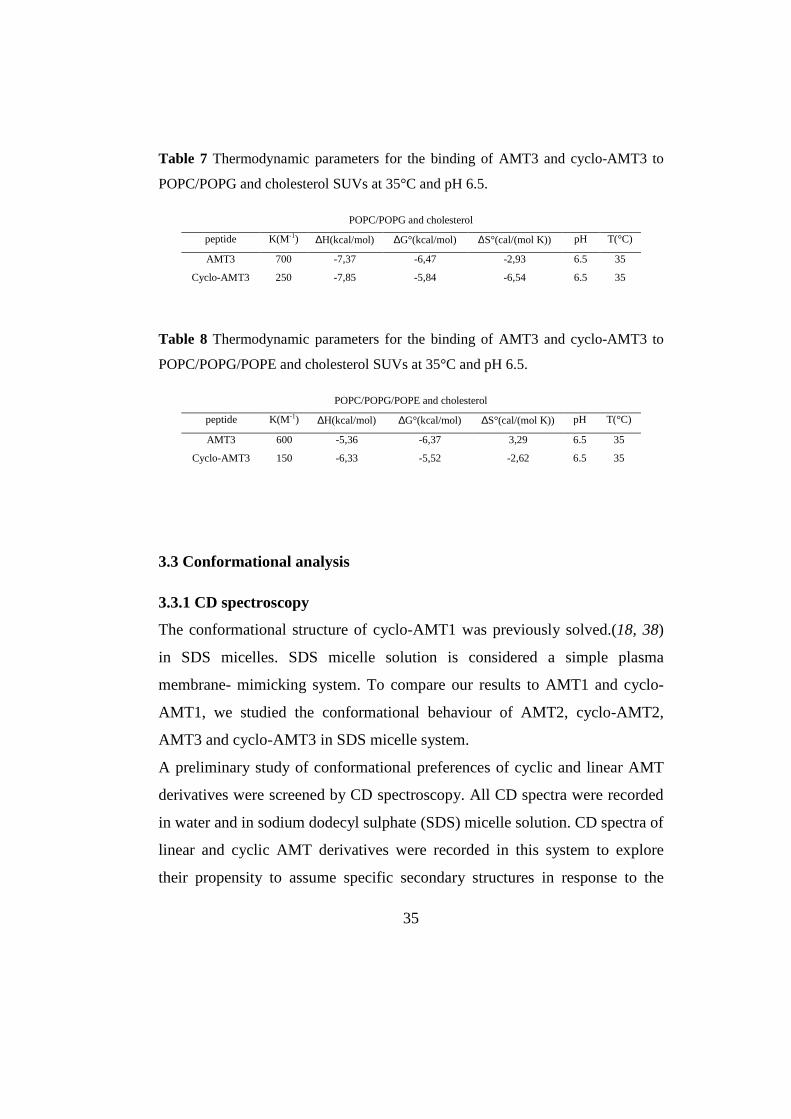
35
Table 7 Thermodynamic parameters for the binding of AMT3 and cyclo-AMT3 to
POPC/POPG and cholesterol SUVs at 35°C and pH 6.5.
POPC/POPG and cholesterol
peptide K(M-1) ∆H(kcal/mol) ∆G°(kcal/mol) ∆S°(cal/(mol K)) pH T(°C)
AMT3 700 -7,37 -6,47 -2,93 6.5 35
Cyclo-AMT3 250 -7,85 -5,84 -6,54 6.5 35
Table 8 Thermodynamic parameters for the binding of AMT3 and cyclo-AMT3 to
POPC/POPG/POPE and cholesterol SUVs at 35°C and pH 6.5.
POPC/POPG/POPE and cholesterol
peptide K(M-1) ∆H(kcal/mol) ∆G°(kcal/mol) ∆S°(cal/(mol K)) pH T(°C)
AMT3 600 -5,36 -6,37 3,29 6.5 35
Cyclo-AMT3 150 -6,33 -5,52 -2,62 6.5 35
3.3 Conformational analysis
3.3.1 CD spectroscopy
The conformational structure of cyclo-AMT1 was previously solved.(18, 38)
in SDS micelles. SDS micelle solution is considered a simple plasma
membrane- mimicking system. To compare our results to AMT1 and cyclo-
AMT1, we studied the conformational behaviour of AMT2, cyclo-AMT2,
AMT3 and cyclo-AMT3 in SDS micelle system.
A preliminary study of conformational preferences of cyclic and linear AMT
derivatives were screened by CD spectroscopy. All CD spectra were recorded
in water and in sodium dodecyl sulphate (SDS) micelle solution. CD spectra of
linear and cyclic AMT derivatives were recorded in this system to explore
their propensity to assume specific secondary structures in response to the
36
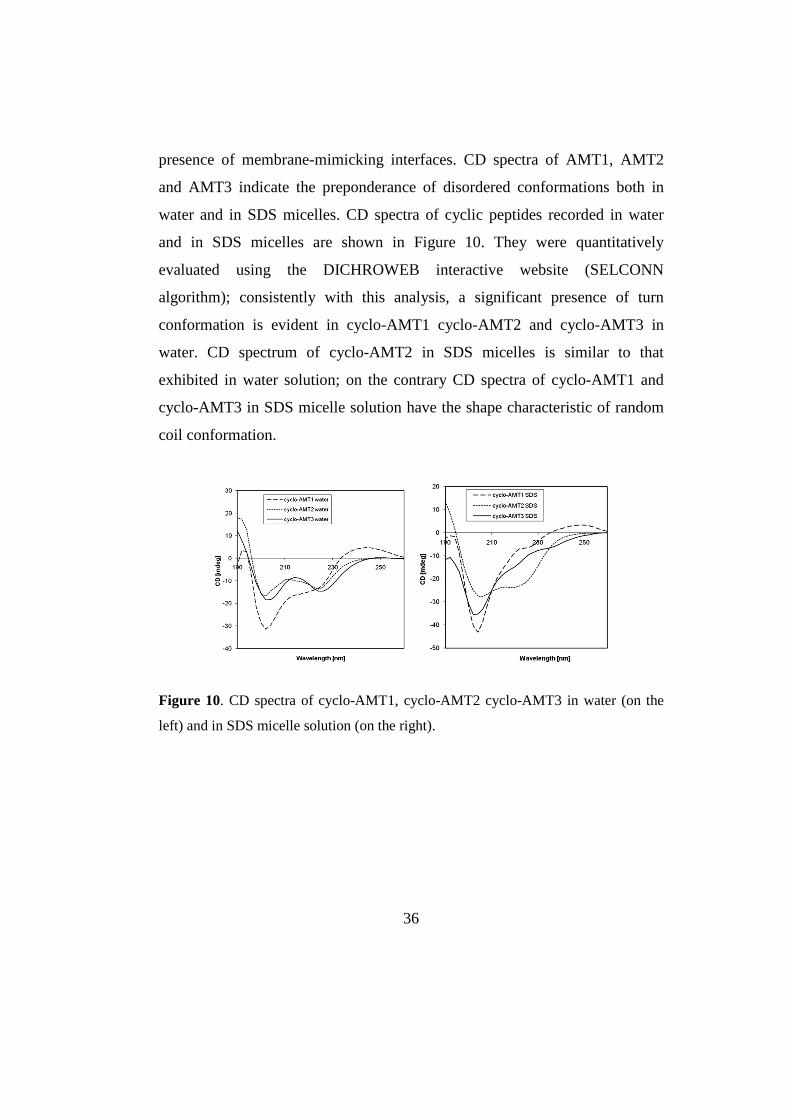
presence of membrane-mimicking interfaces. CD spectra of AMT1, AMT2
and AMT3 indicate the preponderance of disordered conformations both in
water and in SDS micelles. CD spectra of cyclic peptides recorded in water
and in SDS micelles are shown in Figure 10. They were quantitatively
evaluated using the DICHROWEB interactive website (SELCONN
algorithm); consistently with this analysis, a significant presence of turn
conformation is evident in cyclo-AMT1 cyclo-AMT2 and cyclo-AMT3 in
water. CD spectrum of cyclo-AMT2 in SDS micelles is similar to that
exhibited in water solution; on the contrary CD spectra of cyclo-AMT1 and
cyclo-AMT3 in SDS micelle solution have the shape characteristic of random
coil conformation.
Figure 10. CD spectra of cyclo-AMT1, cyclo-AMT2 cyclo-AMT3 in water (on the
left) and in SDS micelle solution (on the right).
37
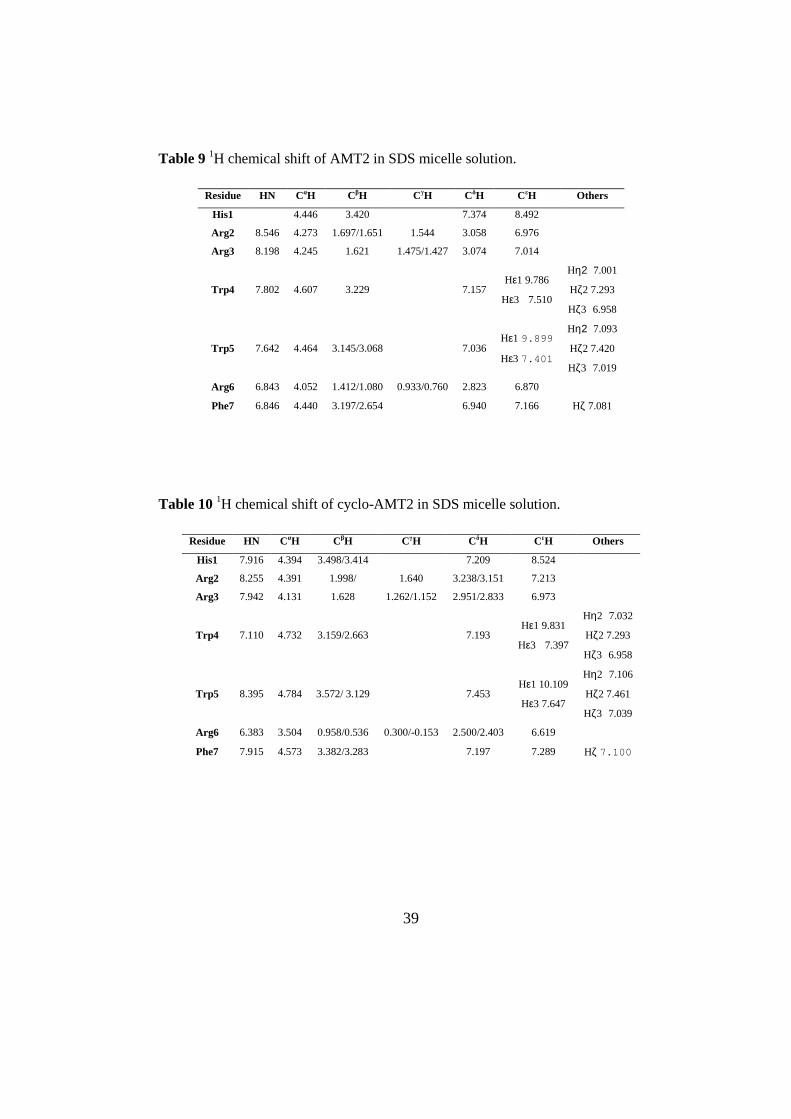
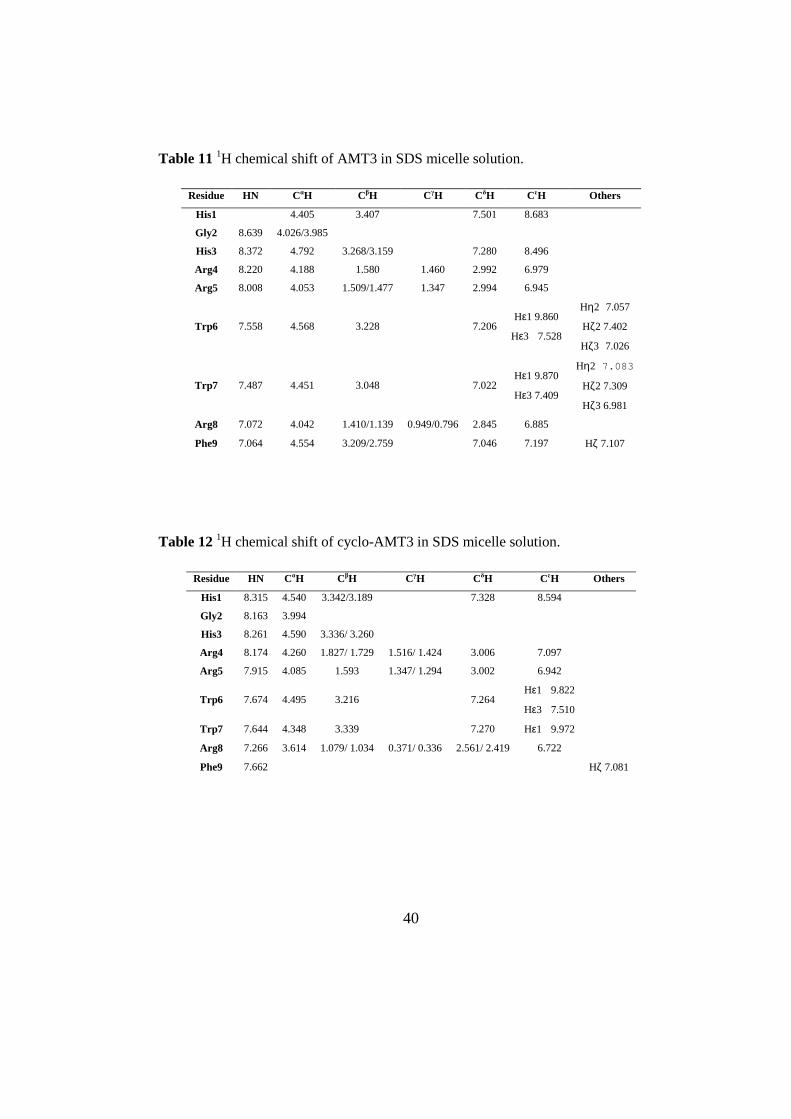
3.3.2 NMR Spectroscopy.
The NMR structure of cyclo-AMT1 in SDS micelles was previously
solved.(38, 65) In this work, NMR structure of AMT2, AMT3, cyclo-AMT2
and cyclo-AMT3 are solved and compared to cyclo-AMT1 structure.
Accordingly a whole set of 1D and 2D proton spectra were recorded in pure
SDS micelles. To check the absence of self-aggregation, spectra were acquired
in the peptide concentration range of 0.5-15 mM. No significant changes were
observed in the distribution and shape of 1H resonances, indicating that no
aggregation phenomena occurred in this concentration range. The NOESY
spectra of linear and cyclic peptides acquired in SDS micelles are showed in
Figure 11. The spectra shown considerable high quality NOE cross-peaks that
were essential to assign all resonance and to understand the conformational
structure of peptides in exam. The chemical shift assignments of proton
spectra were achieved via the standard systematic application of TOCSY and
NOESY experiments. The proton chemical shifts of peptides in SDS micelle
solution are reported in Tables 9-12.
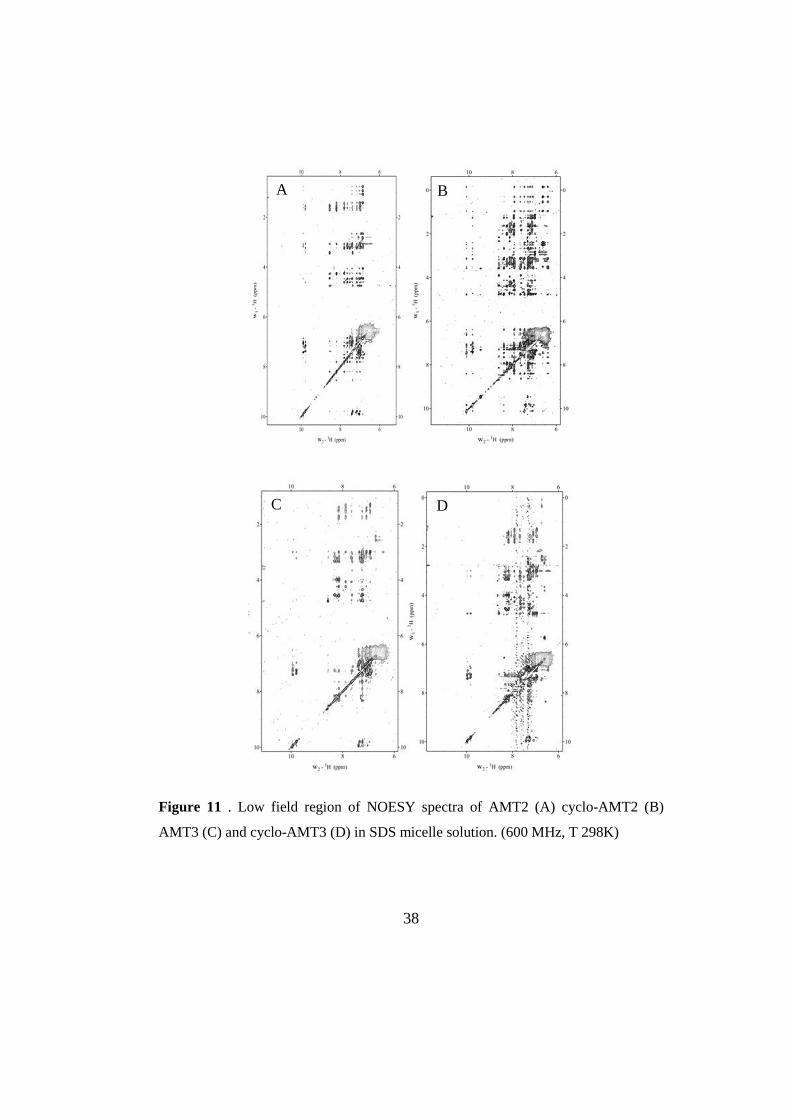
38
Figure 11 . Low field region of NOESY spectra of AMT2 (A) cyclo-AMT2 (B)
AMT3 (C) and cyclo-AMT3 (D) in SDS micelle solution. (600 MHz, T 298K)
C D
A B
39
Table 9 1H chemical shift of AMT2 in SDS micelle solution.
Residue HN CαH CβH CγH CδH CεH Others
His1 4.446 3.420 7.374 8.492
Arg2 8.546 4.273 1.697/1.651 1.544 3.058 6.976
Arg3 8.198 4.245 1.621 1.475/1.427 3.074 7.014
Trp4 7.802 4.607 3.229 7.157 Hε1 9.786
Hε3 7.510
Hη2 7.001
Hζ2 7.293
Hζ3 6.958
Trp5 7.642 4.464 3.145/3.068 7.036 Hε1 9.899
Hε3 7.401
Hη2 7.093
Hζ2 7.420
Hζ3 7.019
Arg6 6.843 4.052 1.412/1.080 0.933/0.760 2.823 6.870
Phe7 6.846 4.440 3.197/2.654 6.940 7.166 Hζ 7.081
Table 10 1H chemical shift of cyclo-AMT2 in SDS micelle solution.
Residue HN CαH CβH CγH CδH CεH Others
His1 7.916 4.394 3.498/3.414 7.209 8.524
Arg2 8.255 4.391 1.998/ 1.640 3.238/3.151 7.213
Arg3 7.942 4.131 1.628 1.262/1.152 2.951/2.833 6.973
Trp4 7.110 4.732 3.159/2.663 7.193 Hε1 9.831
Hε3 7.397
Hη2 7.032
Hζ2 7.293
Hζ3 6.958
Trp5 8.395 4.784 3.572/ 3.129 7.453 Hε1 10.109
Hε3 7.647
Hη2 7.106
Hζ2 7.461
Hζ3 7.039
Arg6 6.383 3.504 0.958/0.536 0.300/-0.153 2.500/2.403 6.619
Phe7 7.915 4.573 3.382/3.283 7.197 7.289 Hζ 7.100
40
Table 11 1H chemical shift of AMT3 in SDS micelle solution.
Residue HN CαH CβH CγH CδH CεH Others
His1 4.405 3.407 7.501 8.683
Gly2 8.639 4.026/3.985
His3 8.372 4.792 3.268/3.159 7.280 8.496
Arg4 8.220 4.188 1.580 1.460 2.992 6.979
Arg5 8.008 4.053 1.509/1.477 1.347 2.994 6.945
Trp6 7.558 4.568 3.228 7.206 Hε1 9.860
Hε3 7.528
Hη2 7.057
Hζ2 7.402
Hζ3 7.026
Trp7 7.487 4.451 3.048 7.022 Hε1 9.870
Hε3 7.409
Hη2 7.083
Hζ2 7.309
Hζ3 6.981
Arg8 7.072 4.042 1.410/1.139 0.949/0.796 2.845 6.885
Phe9 7.064 4.554 3.209/2.759 7.046 7.197 Hζ 7.107
Table 12 1H chemical shift of cyclo-AMT3 in SDS micelle solution.
Residue HN CαH CβH CγH CδH CεH Others
His1 8.315 4.540 3.342/3.189 7.328 8.594
Gly2 8.163 3.994
His3 8.261 4.590 3.336/ 3.260
Arg4 8.174 4.260 1.827/ 1.729 1.516/ 1.424 3.006 7.097
Arg5 7.915 4.085 1.593 1.347/ 1.294 3.002 6.942
Trp6 7.674 4.495 3.216 7.264 Hε1 9.822
Hε3 7.510
Trp7 7.644 4.348 3.339 7.270 Hε1 9.972
Arg8 7.266 3.614 1.079/ 1.034 0.371/ 0.336 2.561/ 2.419 6.722
Phe9 7.662 Hζ 7.081
41
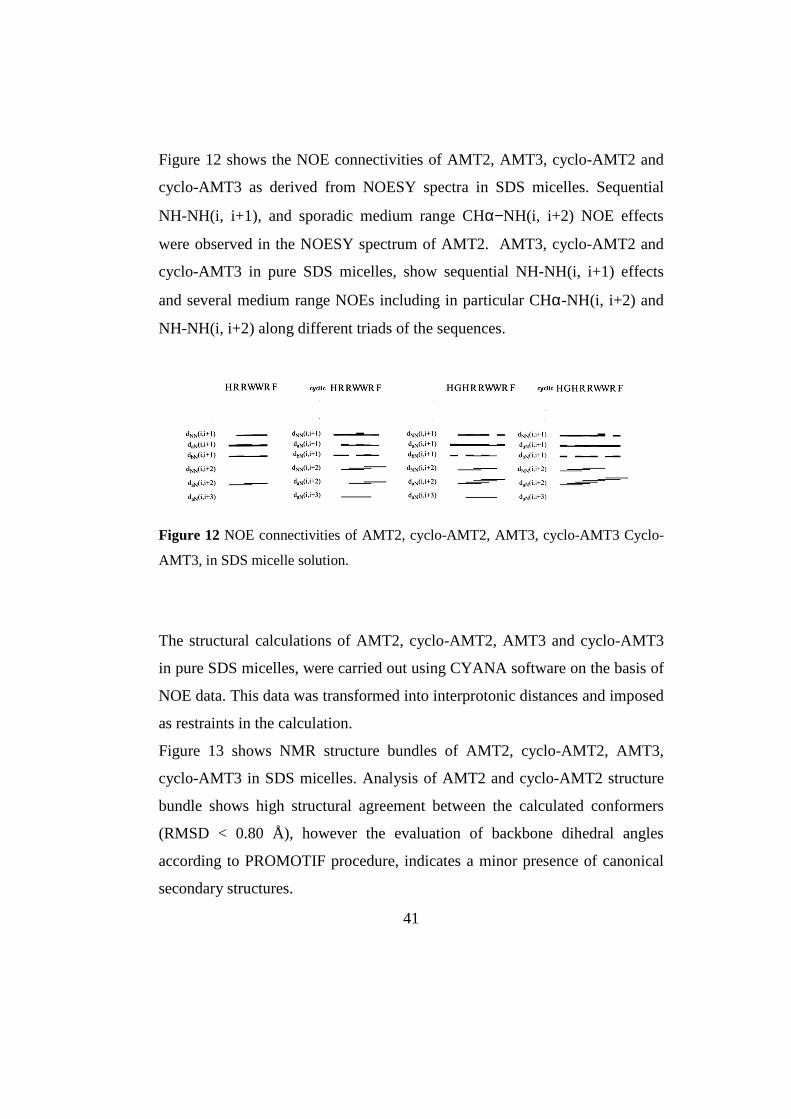
Figure 12 shows the NOE connectivities of AMT2, AMT3, cyclo-AMT2 and
cyclo-AMT3 as derived from NOESY spectra in SDS micelles. Sequential
NH-NH(i, i+1), and sporadic medium range CHα−NH(i, i+2) NOE effects
were observed in the NOESY spectrum of AMT2. AMT3, cyclo-AMT2 and
cyclo-AMT3 in pure SDS micelles, show sequential NH-NH(i, i+1) effects
and several medium range NOEs including in particular CHα-NH(i, i+2) and
NH-NH(i, i+2) along different triads of the sequences.
Figure 12 NOE connectivities of AMT2, cyclo-AMT2, AMT3, cyclo-AMT3 Cyclo-
AMT3, in SDS micelle solution.
The structural calculations of AMT2, cyclo-AMT2, AMT3 and cyclo-AMT3
in pure SDS micelles, were carried out using CYANA software on the basis of
NOE data. This data was transformed into interprotonic distances and imposed
as restraints in the calculation.
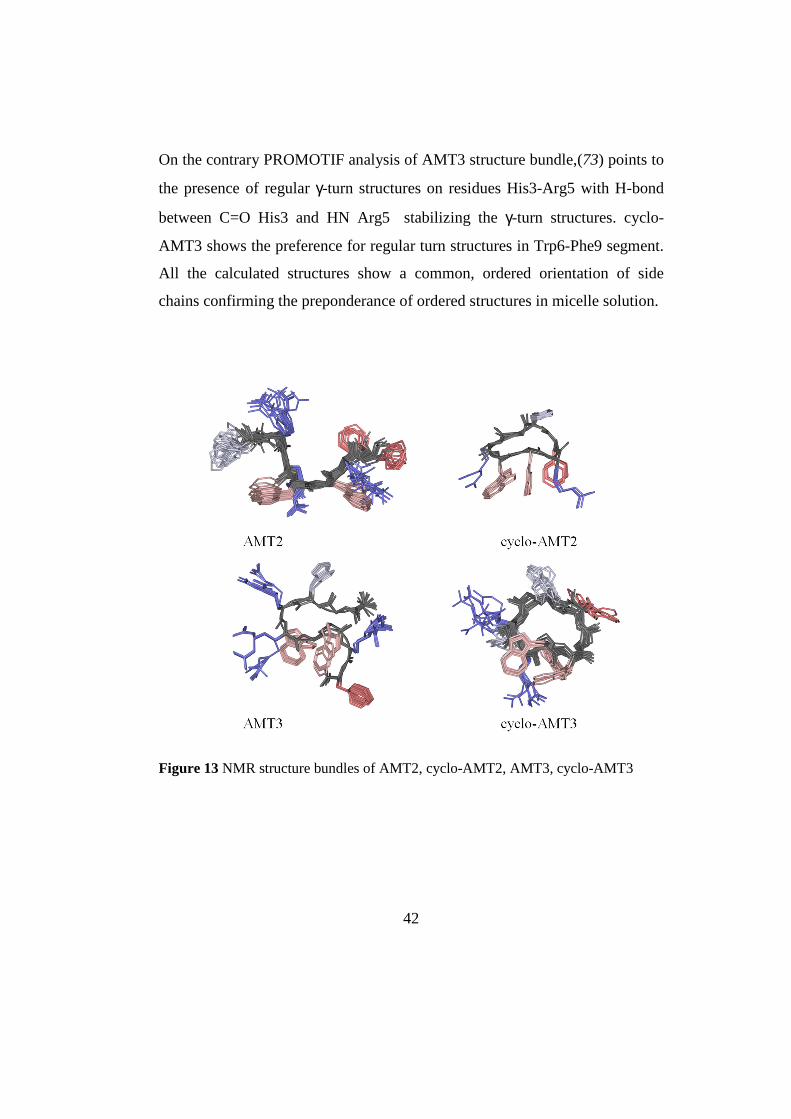
Figure 13 shows NMR structure bundles of AMT2, cyclo-AMT2, AMT3,
cyclo-AMT3 in SDS micelles. Analysis of AMT2 and cyclo-AMT2 structure
bundle shows high structural agreement between the calculated conformers
(RMSD < 0.80 Å), however the evaluation of backbone dihedral angles
according to PROMOTIF procedure, indicates a minor presence of canonical
secondary structures.
42
On the contrary PROMOTIF analysis of AMT3 structure bundle,(73) points to
the presence of regular γ-turn structures on residues His3-Arg5 with H-bond
between C=O His3 and HN Arg5 stabilizing the γ-turn structures. cyclo-
AMT3 shows the preference for regular turn structures in Trp6-Phe9 segment.
All the calculated structures show a common, ordered orientation of side
chains confirming the preponderance of ordered structures in micelle solution.
Figure 13 NMR structure bundles of AMT2, cyclo-AMT2, AMT3, cyclo-AMT3
43
3.4 Discussion
Several short membrane-active peptides have shown antifungal activity due to
their interfacial properties.(23-25) AMT1, a peptide selected from a synthetic
combinatorial library, and its cyclic analogue cyclo-AMT1 were recently
shown to possess antimicrobial and haemolytic activity.(39, 65)
AMT2, cyclo-AMT2, AMT3 and cyclo-AMT3 (Figure 1) were designed by
adding to AMT1 and cyclo-AMT1 one and two His residues, respectively. His
residues, which contain an imidazole ring in their side chains, were added in
an attempt to confer to new peptides, activity analogous to the imidazole ring
of the azole antifungal compounds.
Antifungal tests of the peptides synthesized show even marginal antifungal
activity against the selected fungal species tested: due to their sequence typical
of the AMPs this fungicidal activity may be related to peptide-membrane
destabilising ability.
Linear compounds are less active than their cyclic analogues. In agreement
with CD data, which show minimal regular secondary structures in linear
peptides, the conformational flexibility seems to prevent the interaction
between the peptides and the fungal target. On the contrary, the higher activity
exhibited by the cyclo-peptides indicates that limited peptide conformational
freedom is important for antifungal activity, probably due to a required
orientation of the amino acid side chain in the peptide- membrane interaction.
In addition higher activity of the cyclic peptides could be also caused by the
improved stability of the cyclic compound against proteolytic degradation.
The data show that all peptides tested possess very low MIC90 values against
C. neoformans. These results are promising for drug development. C.
neoformans infection is a life-threatening complication for
immunocompromised hosts, being the main cause of fatal meningoencephalitis
44
in AIDS patients and producing fatal cryptococcosis in patients who have
undergone organ transplants. Thus new compounds acting against this fungus
are highly desirable. Experiments on capsular strains of C. neoformans
excluded a selective interaction of our peptides with the most prominent
feature of this yeast, the capsular structure, indicating that the specificity
against C. neoformans depends on interaction with a C. neoformans-specific
target. Due to their sequence typical of the CAPs the fungicidal activity may
be related to peptide-membrane destabilising ability.
To evaluate the impact that the interaction with the fungal membrane may
have on the antifungal activity of the peptides, we investigated the structural
behaviour of AMT2, cyclo-AMT2, AMT3, cyclo-AMT3 in membrane
mimetic systems represented by SDS micelles. The ability of the cyclo-
peptides to interact with the fungal cell surface of Candida Albicans was
monitored using fluorescence microscopy. Observation by fluorescence
microscopy of Candida Albicans cells incubated with Dap labelled cyclo-
AMT3, confirmed the preference of cyclo-AMT3 to be localized on the
surface of the cell.
Fluorescence spectra indicate that all the peptides have tendency to be exposed
to the aqueous medium. In the presence of increasing amounts of SDS, they
are localized at the interface between the aqueous and the lipid media,
avoiding the membrane hydrophobic core. Specifically peptides show strong
interactions with detergent monomers (Table 2).
The binding of AMT peptides to phospholipid vesicles was
thermodynamically studied by isothermal titration calorimetry. Accordingly to
the fluorescence microscopy results, ITC data evidence low values of binding
constant (see tables 3, 7, 8), suggesting that the peptides do not penetrate the
hydrophobic core of the membrane, but lye on the external surface of the
45
membrane. Calorimetric study also show that for linear peptides the affinity
for the membrane surface depends on electrostatic interaction. (table 4-5);
while the interaction of cyclic peptides with liposome surface is more
dependent on hydrophobic contribution (table 4-5).
NMR study of peptides in micelle solution allows the calculation of 3D model
to interpreter in term of molecular structure the behaviour of cyclo-peptides at
the membrane interface. NMR structure bundles evidence high structural
agreement between the calculated conformers (RMSD < 0.5), with regular turn
structures prevalent on WWRF segment of cyclic analogues. A common
orientation of the side chains is evident. In particular in the cyclic peptides,
interactions between the side chains of WRF residues are evident thanks to
cation-pi interactions involving the guanidino moiety of Arg and the aromatic
rings of Trp and Phe. This interaction, that may be the driving force for the
stabilization of the peptide conformations, is more favoured in the cyclic
analogues as compared to the linear peptides. Here indeed, the side chains of
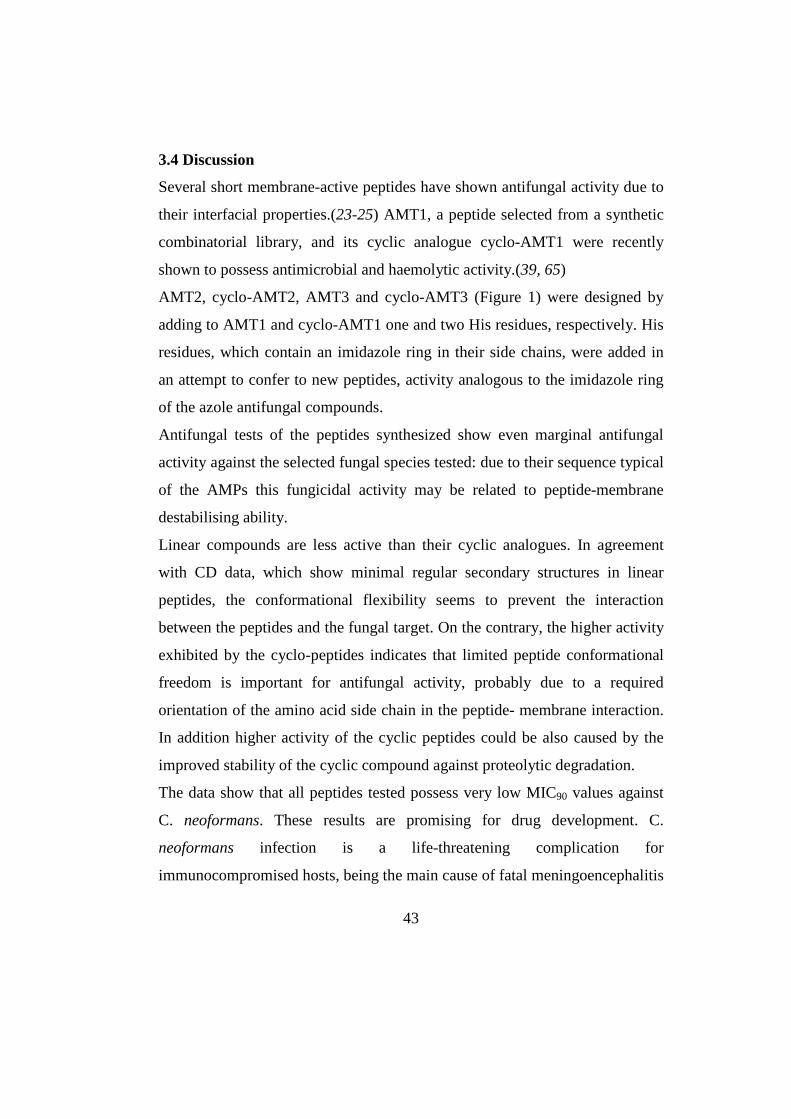
Trp, Arg and Phe appear to be clustered on one surface of the cycle (Figure
14). In particular, cyclo-AMT2 presents on one side of its cyclic scaffold the
side chains of the three residues WRF, whereas cyclo-AMT3 presents on one
side of its cyclic scaffold the side chains of the three residues WRF in addition
to the other Arg that may contribute to enforce the interaction with the
negative charges of the membrane. This organization of the side-chain, that
confirms the calorimetric data indicating an interaction of cyclic peptides
based on hydrophobic forces, may be the basis to rationalize the relation
between the antifungal activity and the structural features of the peptides under
scrutiny.
46
Figure 14 Comparison of the best NMR models of AMT2, cyclo-AMT2,
AMT3, cyclo-AMT3.
Fluorescence spectroscopy, fluorescence microscopy and calorimetric
observations, lead to exclude an unspecific mechanism of activity based on
the destabilization of the membrane cell: the peptides do not form membrane
pores, neither penetrate membrane cell, but they are localized on the
membrane surface, exerting their antimicrobial activity possibly for interaction
with a specific target. On these bases the positioning of the peptides on the
membrane surface is crucial for an effective interaction with the target. Trp
and Arg residues are known to be residues able to stabilize the interaction with
membrane cell.(74) The clustering of such residues on one surface of the
cyclo-AMT2 and cyclo-AMT3, could stabilize the positioning of the peptides
on the fungal cellular wall to induce an efficient interaction with the molecular
target.
47
References
1. Walsh, T. J., Groll, A., Hiemenz, J., Fleming, R., Roilides, E., and Anaissie, E. (2004) Infections due to emerging and uncommon medically important fungal pathogens, Clinical microbiology and infection : the official publication of the European Society of Clinical Microbiology and Infectious Diseases 10 Suppl 1, 48-66.
2. Georgopapadakou, N. H., and Tkacz, J. S. (1995) The fungal cell wall as a drug target, Trends Microbiol 3, 98-104.
3. Nagiec, M. M., Nagiec, E. E., Baltisberger, J. A., Wells, G. B., Lester, R. L., and Dickson, R. C. (1997) Sphingolipid synthesis as a target for antifungal drugs. Complementation of the inositol phosphorylceramide synthase defect in a mutant strain of Saccharomyces cerevisiae by the AUR1 gene, The Journal of biological chemistry 272, 9809-9817.
4. White, T. C., Marr, K. A., and Bowden, R. A. (1998) Clinical, cellular, and molecular factors that contribute to antifungal drug resistance, Clinical microbiology reviews 11, 382-402.
5. Nathan, C. (2004) Antibiotics at the crossroads, Nature 431, 899-902. 6. Wenzel, R. P. (2004) The antibiotic pipeline--challenges, costs, and
values, The New England journal of medicine 351, 523-526. 7. Polak, A. (1999) The past, present and future of antimycotic
combination therapy, Mycoses 42, 355-370. 8. Zasloff, M. (2002) Antimicrobial peptides of multicellular organisms,
Nature 415, 389-395. 9. Hancock, R. E. W., and Sahl, H. G. (2006) Antimicrobial and host-
defense peptides as new anti-infective therapeutic strategies, Nature biotechnology 24, 1551-1557.
10. Oren, Z., and Shai, Y. (1998) Mode of action of linear amphipathic alpha-helical antimicrobial peptides, Biopolymers 47, 451-463.
11. Brogden, K. A. (2005) Antimicrobial peptides: pore formers or metabolic inhibitors in bacteria?, Nature Reviews Microbiology 3, 238-250.
12. Boman, H. G., Agerberth, B., and Boman, A. (1993) Mechanisms of action on Escherichia coli of cecropin P1 and PR-39, two antibacterial peptides from pig intestine, Infection and immunity 61, 2978.
13. Helmerhorst, E. J., Reijnders, I. M., van’t Hof, W., Veerman, E. C. I., and Nieuw Amerongen, A. V. (1999) A critical comparison of the hemolytic and fungicidal activities of cationic antimicrobial peptides, FEBS letters 449, 105-110.
48
14. Leite, J. R. S. A., Brand, G. D., Silva, L. P., Kückelhaus, S. A. S., Bento, W. R. C., Araújo, A. L. T., Martins, G. R., Lazzari, A. M., and Bloch Jr, C. (2008) Dermaseptins from Phyllomedusa oreades and Phyllomedusa distincta: Secondary structure, antimicrobial activity, and mammalian cell toxicity, Comparative Biochemistry and Physiology-Part A: Molecular & Integrative Physiology 151, 336-343.
15. Raghuraman, H., and Chattopadhyay, A. (2007) Melittin: a membrane-active peptide with diverse functions, Bioscience reports 27, 189-223.
16. Otvos, J., L. (2002) The short proline-rich antibacterial peptide family, Cellular and molecular life sciences 59, 1138-1150.
17. Strøm, M. B., Haug, B. E., Skar, M. L., Stensen, W., Stiberg, T., and Svendsen, J. S. (2003) The pharmacophore of short cationic antibacterial peptides, Journal of medicinal chemistry 46, 1567-1570.
18. Dathe, M., Nikolenko, H., Klose, J., and Bienert, M. (2004) Cyclization increases the antimicrobial activity and selectivity of arginine-and tryptophan-containing hexapeptides, Biochemistry 43, 9140-9150.
19. Hilpert, K., Volkmer-Engert, R., Walter, T., and Hancock, R. E. W. (2005) High-throughput generation of small antibacterial peptides with improved activity, Nature biotechnology 23, 1008-1012.
20. Svenson, J., Brandsdal, B. O., Stensen, W., and Svendsen, J. S. (2007) Albumin binding of short cationic antimicrobial micropeptides and its influence on the in vitro bactericidal effect, Journal of medicinal chemistry 50, 3334-3339.
21. van 't Hof, W., Veerman, E. C., Helmerhorst, E. J., and Amerongen, A. V. (2001) Antimicrobial peptides: properties and applicability, Biol Chem 382, 597-619.
22. Jelokhani�Niaraki, M., Prenner, E., Kay, C., McElhaney, R., and Hodges, R. (2002) Conformation and interaction of the cyclic cationic antimicrobial peptides in lipid bilayers, The Journal of peptide research 60, 23-36.
23. Garibotto, F. M., Garro, A. D., Masman, M. F., Rodriguez, A. M., Luiten, P. G., Raimondi, M., Zacchino, S. A., Somlai, C., Penke, B., and Enriz, R. D. (2010) New small-size peptides possessing antifungal activity, Bioorganic & medicinal chemistry 18, 158-167.
24. Masman, M. F., Rodriguez, A. M., Raimondi, M., Zacchino, S. A., Luiten, P. G., Somlai, C., Kortvelyesi, T., Penke, B., and Enriz, R. D. (2009) Penetratin and derivatives acting as antifungal agents, European journal of medicinal chemistry 44, 212-228.
25. Masman, M. F., Somlai, C., Garibotto, F. M., Rodriguez, A. M., de la Iglesia, A., Zacchino, S. A., Penke, B., and Enriz, R. D. (2008)
49
Structure-antifungal activity relationship of His-Phe-Arg-Trp-Gly-Lys-Pro-Val-NH2 and analogues, Bioorganic & medicinal chemistry 16, 4347-4358.
26. Sharma, R. K., Sundriyal, S., Wangoo, N., Tegge, W., and Jain, R. (2010) New antimicrobial hexapeptides: synthesis, antimicrobial activities, cytotoxicity, and mechanistic studies, ChemMedChem 5, 86-95.
27. Nowak-Jary, J., and Andruszkiewicz, R. (2009) Antifungal activity of thionated analogues of Nva-FMDP and Lys-Nva-FMDP, Polish journal of microbiology / Polskie Towarzystwo Mikrobiologow = The Polish Society of Microbiologists 58, 295-299.
28. Wang, C. W., Yip, B. S., Cheng, H. T., Wang, A. H., Chen, H. L., Cheng, J. W., and Lo, H. J. (2009) Increased potency of a novel D-beta-naphthylalanine-substituted antimicrobial peptide against fluconazole-resistant fungal pathogens, FEMS yeast research 9, 967-970.
29. Karlsson, A. J., Pomerantz, W. C., Neilsen, K. J., Gellman, S. H., and Palecek, S. P. (2009) Effect of sequence and structural properties on 14-helical beta-peptide activity against Candida albicans planktonic cells and biofilms, ACS chemical biology 4, 567-579.
30. Shai, Y. (2002) Mode of action of membrane active antimicrobial peptides, Biopolymers 66, 236-248.
31. Chen, Y., Vasil, A. I., Rehaume, L., Mant, C. T., Burns, J. L., Vasil, M. L., Hancock, R. E., and Hodges, R. S. (2006) Comparison of biophysical and biologic properties of alpha-helical enantiomeric antimicrobial peptides, Chemical biology & drug design 67, 162-173.
32. den Hertog, A. L., van Marle, J., van Veen, H. A., Van't Hof, W., Bolscher, J. G., Veerman, E. C., and Nieuw Amerongen, A. V. (2005) Candidacidal effects of two antimicrobial peptides: histatin 5 causes small membrane defects, but LL-37 causes massive disruption of the cell membrane, The Biochemical journal 388, 689-695.
33. Helmerhorst, E. J., Breeuwer, P., van't Hof, W., Walgreen-Weterings, E., Oomen, L. C., Veerman, E. C., Amerongen, A. V., and Abee, T. (1999) The cellular target of histatin 5 on Candida albicans is the energized mitochondrion, The Journal of biological chemistry 274, 7286-7291.
34. Gennaro, R., Zanetti, M., Benincasa, M., Podda, E., and Miani, M. (2002) Pro-rich antimicrobial peptides from animals: structure, biological functions and mechanism of action, Current pharmaceutical design 8, 763-778.
35. Hancock, R. E. (1997) Peptide antibiotics, Lancet 349, 418-422.
50
36. Park, C. B., Kim, H. S., and Kim, S. C. (1998) Mechanism of action of the antimicrobial peptide buforin II: buforin II kills microorganisms by penetrating the cell membrane and inhibiting cellular functions, Biochemical and biophysical research communications 244, 253-257.
37. Blondelle, S. E., Takahashi, E., Dinh, K. T., and Houghten, R. A. (1995) The antimicrobial activity of hexapeptides derived from synthetic combinatorial libraries, The Journal of applied bacteriology 78, 39-46.
38. Appelt, C., Wessolowski, A., Soderhall, J. A., Dathe, M., and Schmieder, P. (2005) Structure of the antimicrobial, cationic hexapeptide cyclo(RRWWRF) and its analogues in solution and bound to detergent micelles, Chembiochem : a European journal of chemical biology 6, 1654-1662.
39. Appelt, C., Eisenmenger, F., Kuhne, R., Schmieder, P., and Soderhall, J. A. (2005) Interaction of the antimicrobial peptide cyclo(RRWWRF) with membranes by molecular dynamics simulations, Biophysical journal 89, 2296-2306.
40. Fromtling, R. A. (1988) Overview of medically important antifungal azole derivatives, Clinical microbiology reviews 1, 187-217.
41. Koltin, Y., and Hitchcock, C. A. (1997) The search for new triazole antifungal agents, Current opinion in chemical biology 1, 176-182.
42. Kauffman, C. A., and Carver, P. L. (1997) Antifungal agents in the 1990s. Current status and future developments, Drugs 53, 539-549.
43. Sheehan, D. J., Hitchcock, C. A., and Sibley, C. M. (1999) Current and emerging azole antifungal agents, Clinical microbiology reviews 12, 40-79.
44. Georgopapadakou, N. H., and Walsh, T. J. (1996) Antifungal agents: chemotherapeutic targets and immunologic strategies, Antimicrobial agents and chemotherapy 40, 279-291.
45. Dufau, I., and Mazarguil, H. (2000) Design of a fluorescent amino acid derivative usable in peptide synthesis, Tetrahedron Letters 41, 6063-6066.
46. Whitmore, L., and Wallace, B. A. (2004) DICHROWEB, an online server for protein secondary structure analyses from circular dichroism spectroscopic data, Nucleic acids research 32, W668-673.
47. Piantini, U., Sorensen, O., and Ernst, R. R. (1982) Multiple quantum filters for elucidating NMR coupling networks, Journal of the American Chemical Society 104, 6800-6801.
48. Bax, A., and Davis, D. G. (1985) MLEV-17-based two-dimensional homonuclear magnetization transfer spectroscopy, J. magn. Reson 65, 355-360.
51
49. Jeener, J., Meier, B., Bachmann, P., and Ernst, R. R. (1979) Investigation of exchange processes by two�dimensional NMR spectroscopy, The Journal of Chemical Physics 71, 4546.
50. Goddard, T., and Kneller, D. (2004) SPARKY 3, University of California, San Francisco.
51. Güntert, P., Mumenthaler, C., and Wüthrich, K. (1997) Torsion angle dynamics for NMR structure calculation with the new program D1, Journal of molecular biology 273, 283-298.
52. Pearlman, D. A., Case, D. A., Caldwell, J. W., Ross, W. S., Cheatham, T. E., DeBolt, S., Ferguson, D., Seibel, G., and Kollman, P. (1995) AMBER, a package of computer programs for applying molecular mechanics, normal mode analysis, molecular dynamics and free energy calculations to simulate the structural and energetic properties of molecules, Computer Physics Communications 91, 1-41.
53. Case, D. A., Pearlman, D. A., Caldwell, J. W., Cheatham III, T. E., Wang, J., Ross, W. S., Simmerling, C., Darden, T., Merz, K. M., and Stanton, R. V. (2002) AMBER 7, University of California, San Francisco.
54. Konev, S. V., and Udenfriend, S. (1967) Fluorescence and phosphorescence of proteins and nucleic acids, Plenum Press New York.
55. Ambrosone, L., D'Errico, G., and Ragone, R. (1997) Interaction of tryptophan and N-acetyltryptophanamide with dodecylpentaoxyethyleneglycol ether micelles, Spectrochimica Acta Part A: Molecular and Biomolecular Spectroscopy 53, 1615-1620.
56. Callis, P. R., and Liu, T. (2004) Quantitative prediction of fluorescence quantum yields for tryptophan in proteins, The Journal of Physical Chemistry B 108, 4248-4259.
57. Dufourcq, J., Faucon, J., Maget-Dana, R., Pileni, M., and Hélčne, C. (1981) Peptide-membrane interactions A fluorescence study of the binding of oligopeptides containing aromatic and basic residues to phospholipid vesicles, Biochimica et Biophysica Acta (BBA)-Biomembranes 649, 67-75.
58. Spadaccini, R., D'Errico, G., D'Alessio, V., Notomista, E., Bianchi, A., Merola, M., and Picone, D. (2010) Structural characterization of the transmembrane proximal region of the hepatitis C virus E1 glycoprotein, Biochimica et Biophysica Acta (BBA)-Biomembranes 1798, 344-353.
59. Galdiero, S., Falanga, A., Vitiello, G., Vitiello, M., Pedone, C., D'Errico, G., and Galdiero, M. (2010) Role of membranotropic sequences from herpes simplex virus type I glycoproteins B and H in
52
the fusion process, Biochimica et Biophysica Acta (BBA)-Biomembranes 1798, 579-591.
60. Esposito, C., D'Errico, G., Armenante, M. R., Giannecchini, S., Bendinelli, M., Rovero, P., and D'Ursi, A. M. (2006) Physicochemical characterization of a peptide deriving from the glycoprotein gp36 of the feline immunodeficiency virus and its lipoylated analogue in micellar systems, Biochimica et biophysica acta 1758, 1653-1661.
61. Santos, N. C., Prieto, M., and Castanho, M. A. (2003) Quantifying molecular partition into model systems of biomembranes: an emphasis on optical spectroscopic methods, Biochimica et biophysica acta 1612, 123-135.
62. Nernst, W. (1891) Verteilung eines Stoffes zwischen zwei Lösungsmitteln und zwischen Lösungsmittel und Dampfraum, Z. phys. Chem 8, 110-139.
63. Christiaens, B., Symoens, S., Verheyden, S., Engelborghs, Y., Joliot, A., Prochiantz, A., Vandekerckhove, J., Rosseneu, M., and Vanloo, B. (2002) Tryptophan fluorescence study of the interaction of penetratin peptides with model membranes, European journal of biochemistry / FEBS 269, 2918-2926.
64. Seelig, J. (1997) Titration calorimetry of lipid-peptide interactions, Biochimica et biophysica acta 1331, 103-116.
65. Dathe, M., Nikolenko, H., Klose, J., and Bienert, M. (2004) Cyclization increases the antimicrobial activity and selectivity of arginine- and tryptophan-containing hexapeptides, Biochemistry 43, 9140-9150.
66. Avrahami, D., and Shai, Y. (2002) Conjugation of a magainin analogue with lipophilic acids controls hydrophobicity, solution assembly, and cell selectivity, Biochemistry 41, 2254-2263.
67. Makovitzki, A., Avrahami, D., and Shai, Y. (2006) Ultrashort antibacterial and antifungal lipopeptides, Proceedings of the National Academy of Sciences of the United States of America 103, 15997-16002.
68. Seelig, J., Nebel, S., Ganz, P., and Bruns, C. (1993) Electrostatic and nonpolar peptide-membrane interactions. Lipid binding and functional properties of somatostatin analogues of charge z = +1 to z = +3, Biochemistry 32, 9714-9721.
69. Wenk, M. R., and Seelig, J. (1997) Interaction of octyl-beta-thioglucopyranoside with lipid membranes, Biophysical journal 73, 2565-2574.
70. Wieprecht, T., Dathe, M., Schumann, M., Krause, E., Beyermann, M., and Bienert, M. (1996) Conformational and functional study of
53
magainin 2 in model membrane environments using the new approach of systematic double-D-amino acid replacement, Biochemistry 35, 10844-10853.
71. Andrew, T. L., and Swager, T. M. (2007) A fluorescence turn-on mechanism to detect high explosives RDX and PETN, Journal of the American Chemical Society 129, 7254-7255.
72. McIntosh, T. J. (1996) Hydration properties of lamellar and non-lamellar phases of phosphatidylcholine and phosphatidylethanolamine, Chemistry and physics of lipids 81, 117-131.
73. Hutchinson, E. G., and Thornton, J. M. (1996) PROMOTIF--a program to identify and analyze structural motifs in proteins, Protein science : a publication of the Protein Society 5, 212-220.
74. Chan, D. I., Prenner, E. J., and Vogel, H. J. (2006) Tryptophan-and arginine-rich antimicrobial peptides: structures and mechanisms of action, Biochimica et Biophysica Acta (BBA)-Biomembranes 1758, 1184-1202.

54
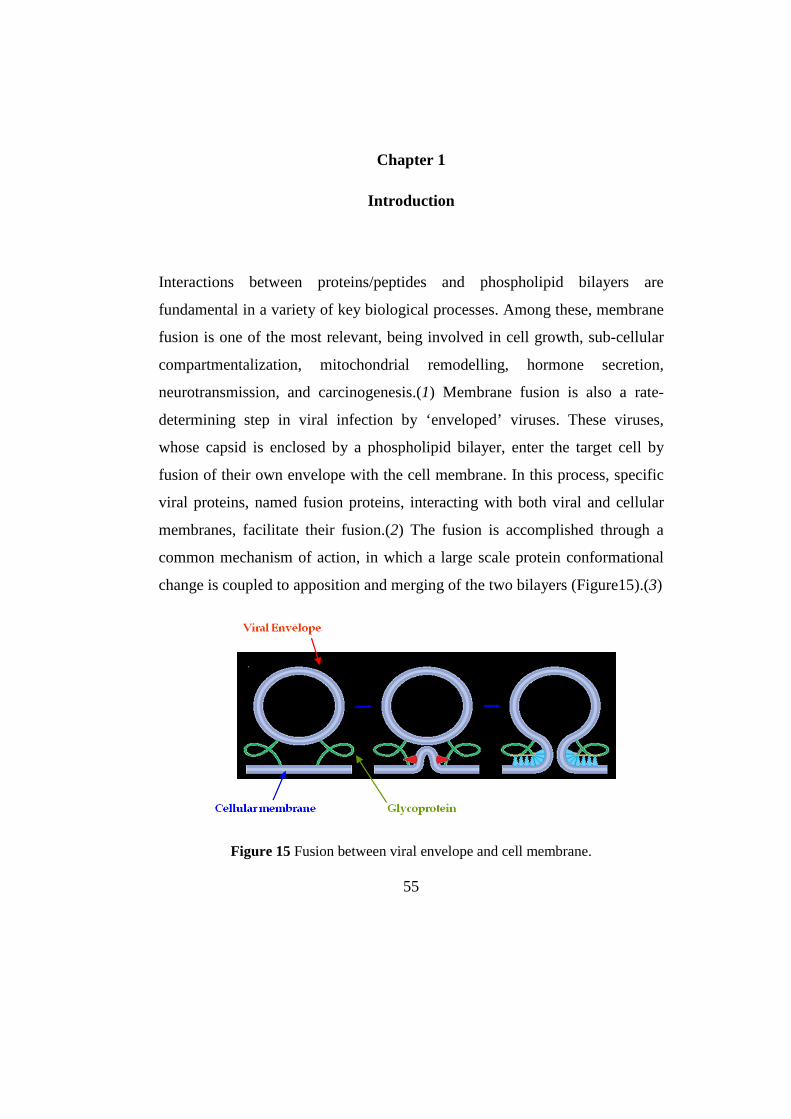
55
Chapter 1
Introduction
Interactions between proteins/peptides and phospholipid bilayers are
fundamental in a variety of key biological processes. Among these, membrane
fusion is one of the most relevant, being involved in cell growth, sub-cellular
compartmentalization, mitochondrial remodelling, hormone secretion,
neurotransmission, and carcinogenesis.(1) Membrane fusion is also a rate-
determining step in viral infection by ‘enveloped’ viruses. These viruses,
whose capsid is enclosed by a phospholipid bilayer, enter the target cell by
fusion of their own envelope with the cell membrane. In this process, specific
viral proteins, named fusion proteins, interacting with both viral and cellular
membranes, facilitate their fusion.(2) The fusion is accomplished through a
common mechanism of action, in which a large scale protein conformational
change is coupled to apposition and merging of the two bilayers (Figure15).(3)
Figure 15 Fusion between viral envelope and cell membrane.
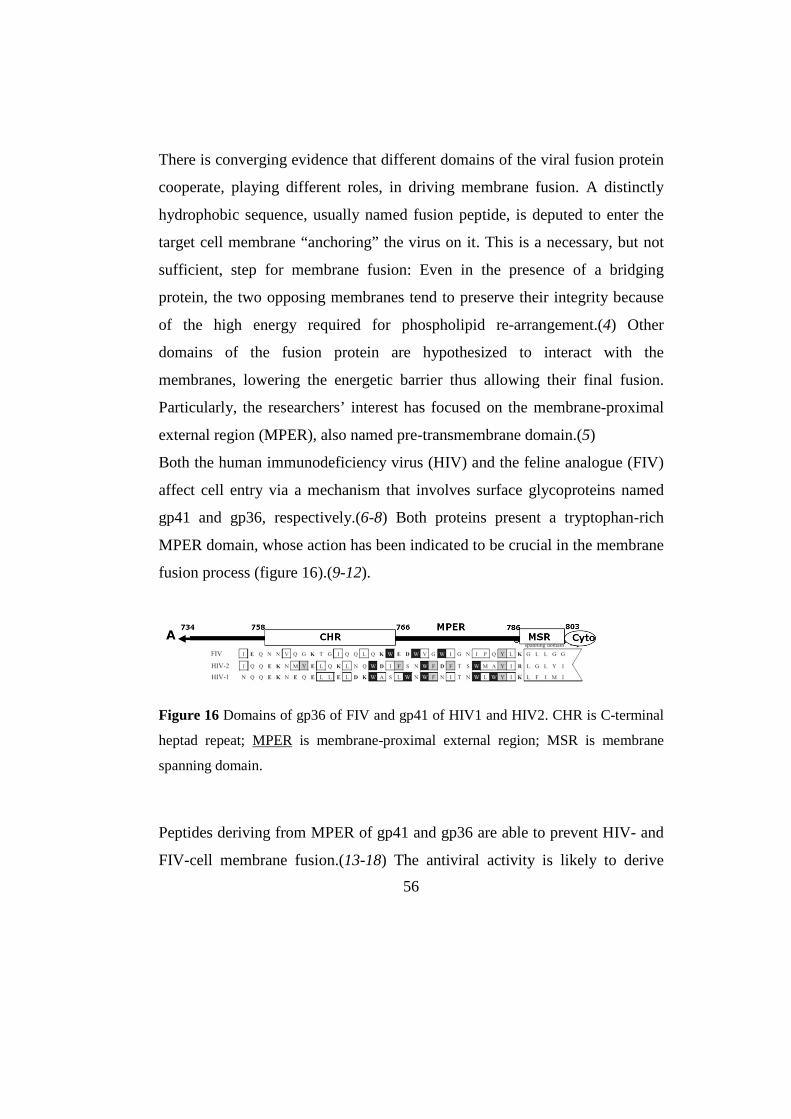
56
There is converging evidence that different domains of the viral fusion protein
cooperate, playing different roles, in driving membrane fusion. A distinctly
hydrophobic sequence, usually named fusion peptide, is deputed to enter the
target cell membrane “anchoring” the virus on it. This is a necessary, but not
sufficient, step for membrane fusion: Even in the presence of a bridging
protein, the two opposing membranes tend to preserve their integrity because
of the high energy required for phospholipid re-arrangement.(4) Other
domains of the fusion protein are hypothesized to interact with the
membranes, lowering the energetic barrier thus allowing their final fusion.
Particularly, the researchers’ interest has focused on the membrane-proximal
external region (MPER), also named pre-transmembrane domain.(5)
Both the human immunodeficiency virus (HIV) and the feline analogue (FIV)
affect cell entry via a mechanism that involves surface glycoproteins named
gp41 and gp36, respectively.(6-8) Both proteins present a tryptophan-rich
MPER domain, whose action has been indicated to be crucial in the membrane
fusion process (figure 16).(9-12).
Figure 16 Domains of gp36 of FIV and gp41 of HIV1 and HIV2. CHR is C-terminal
heptad repeat; MPER is membrane-proximal external region; MSR is membrane
spanning domain.
Peptides deriving from MPER of gp41 and gp36 are able to prevent HIV- and
FIV-cell membrane fusion.(13-18) The antiviral activity is likely to derive
57
from adsorption of the peptide on the external surface of the target-cell
membrane, where it competes with the TM glycoprotein of the virus.(19)
We identified a 20-mer synthetic peptide (P59) corresponding to the fragment
767-786 of the membrane proximal ectodomain of FIV transmembrane
glycoprotein. This peptide potently inhibited the growth of tissue culture-
adapted FIV in feline fibroblastoid CrFK cells. Antiviral activity of p59 was
found to map to a short segment containing three conserved Trp residues, a
derivative of eight amino acids (770W-I777), designated C8. Peptide C8
activity was found to be dependent on conservation of the Trp motif.
Preliminary structural studies showed that peptide C8 possesses a
conformational propensity highly uncommon for peptides of its size, which
may account for its considerable antiviral potency in spite of small size.(18)
Considering the involvement of these fragment in the processes mediating the
fusion of virus and host cell membranes the characterization of P59 and C8 in
membrane mimetic systems seems particularly interesting. Accordingly the
structural behavior of P59 and C8 in different membrane models was
extensively explored by means of several different biophysical techniques.
ESR and fluorescence experiments, using spin-labeled lipids, demonstrated
that the P59 peptide associates with lipid bilayers.(20) by binding at the
membrane surface or polar–apolar interface. This is consistent with high-
resolution nuclear magnetic resonance (NMR) analysis of P59 in micellar
environments, which revealed a region of secondary structural order in the
sequence extending from Trp770 to Ile777 (21) In particular, an amphipathic,
turn-helical structure forms, in which the polar or charged residues are
positioned on one side, with the opposite side occupied by hydrophobic
58
residues including the three tryptophans, which have a propensity to localize
to the polar–apolar interface of membranes. (22, 23)
Biophysical characterization of C8 in dimyristoylphosphatidylcholine
liposomes (DMPC) bilayers, by means of ESR,fluorescence and CD
spectroscopies showed that C8 adsorbs strongly on the bilayer surface. This
data, although derived from a large volume of experimental work, depict only
a preliminary view of C8 interaction with membrane cell. A clear conceptual
framework for the mechanism of action of C8 on the bilayer microstructure is
lacking and the exact nature and the extent of Trp-lipid interactions remains
unresolved.
In this context the aim of the present experimental work is the characterization
of the conformational propensities of C8 in membrane mimetic system using
high resolution NMR data. Structural investigation of C8-POPC interactions
on the lipid bilayer microstructure to present a clear description at a molecular
level of the early events of the fusion process.
59
Chapter 2
Experimental section
2.1 Peptide synthesis
The aminoacid sequence of C8 peptide is Ac-Trp-Glu-Asp-Trp-Val-Gly-Trp-
Ile-CO-NH2 and the deuterated C8-d5all was synthesized including Trp-d5 in all
the Trp positions. Trp-d5 including deuterons atoms on indole ring and NH-
Fmoc protected group (L-Tryptophan-N-Fmoc(Indole-D5), 98%) was
purchased from Cambridge Isotope Laboratories Incs. (Andover, MA, USA).
C8 and C8-d5all were synthesized on a manual batch synthesizer (PLS 4°-4,
Advanced ChemTech, Louisville, KY, USA) using a Teflon reactor (10 mL),
applying the Fmoc/tBu solid phase peptide synthesis (SPPS) procedure. The
Rink-resin was swelled with DMF (1 mL/100 mg of resin) for 3 h before use.
Stepwise peptide assembly was performed by repeating for each added amino
acid the following deprotection–coupling cycle: 1) Swelling: DMF (1 mL/100
mg of resin) for 5 min; 2) Fmoc-deprotection: resin is washed twice with 20%
piperidine in DMF (1 mL/100 mg of resin, one wash for 5 min followed by
another wash for 20 min); 3) Resin-washings: DMF (5 min); 4) Coupling:
scale employing HBTU/HOBt/DIPEA (2.5:2.5:3.5 eq.) as the coupling system
and 2.5 eq. of the Fmoc protected amino acids. Each coupling was monitored
by Kaiser test,(24) whose negative response indicated that recouplings were
not needed; 5) Resin-washings: DMF (3°-5 min) and DCM (1°-5 min). After
deprotection of the last NH-Fmoc group, peptides were acetylated with a
solution of acetic anhydride (12.5%) and DIPEA (2.5%) in DMF for 2 h.
The protected hydrogenated peptide C8 was cleaved from the resin by
60
treatment with TFA/H2O/thioanisole (reagent K) (95:2.5:2.5 v/v). In contrast,
to avoid D2O/H2O exchange, the protected peptide C8-d5all was cleaved from
resin by treatment with TFAd/D2O/TIS at a ratio of 10 mL to 0.5 g of resin at
room temperature for 3 h.29,30 Trifluoroacetic acid-D (D, 99.5%) (TFAd) and
deuterium oxide (D, 99.9%) (D2O) were purchased from Cambridge Isotope
Laboratories Incs. All the other reagents and solvents were purchased from
Aldrich (St. Louis, MO) and were used as received.
After filtration of the exhausted resin, the solvent was concentrated in vacuo
and the residue was triturated with ether. The crude peptide was purified by
preparative reversed phase high performance liquid chromatography (HPLC)
using a Jupiter [Phenomenex, Anzola Emeilia (BO), Italy] C18 column (25°-
4.6 cm, 5 µ, 300 Å pore size). The column was perfused at a flow rate of 3
mL/min with a mobile phase containing solvent A (0.1% TFA in water). A
linear gradient from 50% to 90% of solvent B (acetonitrile in 0.1% TFA) for
40 min was adopted for peptide elution. The pure fraction was collected to
yield a white powder after lyophilization. The molecular weight of the
compound was determined by mass spectral analysis, using a Finnigan LCQ-
Deca ion trap instrument equipped with an electrospray source (LCQ Deca
Finnigan, San Jose, CA, USA). The samples were directly infused into the ESI
source using a syringe pump set at a flow rate of 5 µl/min. Data were analyzed
with Xcalibur software.
2.2 Sample preparation
The phospholipid palmitoyl oleoyl phosphatidylcholine (POPC) was obtained
from Avanti Polar Lipids (Birmingham, AL, USA).
61
POPC liposomes, to be used for ESR, CD and spectrofluorimetry experiments,
were prepared by pouring appropriate amounts of phospholipid in
dichloromethane/methanol (2/1 v/v) in small test tubes. For ESR experiments
1% wt/wt of spin-labeled phosphatidylcholines in ethanol was added.
Dichloromethane, methanol and ethanol, HPLC-grade solvents, were obtained
from Merck (Darmstadt, Germany).A thin film of the lipid was produced by
evaporating the solvent with dry nitrogen gas. Final traces of solvent were
removed by subjecting the sample to vacuum desiccation for at least 3 h. The
samples were then hydrated with 20-50 µL of 10 mM phosphate buffer, 137
mM NaCl, 2.7 mM KCl, pH 7.4 (PBS) and vortexed, obtaining a suspension
of MultiLamellar Vesicles (MLVs). For ESR experiments this suspension was
transferred to a 25-µL glass capillary and flame sealed. For CD and
spectrofluorimetry experiments, Large Unilamellar Vesicles (LUVs), obtained
from MLVs by nine-fold extrusion through a polycarbonate membrane of 100-
nm pore size, were preferred for their lower radiation scattering. Liposomal
samples (both MLVs and LUVs) containing the peptide were prepared in a
similar manner, except that the lipid film was hydrated directly with a peptide
solution in PBS.
For CD experiments sodium dodecyl sulphate (SDS) and dodecyl
phosphorcoline (DPC) were used.
For NMR experiments deuterated sodium dodecyl sulphate (SDS-d25) and
deuterated dodecyl phosphorcoline (DPC-d38) were used.
To conduct CD and NMR experiments in a water solution, dry C8 was
dissolved in phosphate buffer (25mM pH 6.8). This yielded final
concentrations of 0.15 mM (CD experiments) and 1.5 mM (NMR
experiments). For NMR samples, a H2O/D2O mixture (90:10, v/v) was used.
62
The obtained solutions were titrated with increasing amount of surfactant
(SDS, DPC) moving from submicelle to micelle concentration.
The samples for CD and NMR experiments in mixed micelles of DPC and
SDS (90/10, M/M) were prepared by dissolving the peptide (0.15 mM for CD
experiments and 1.5 mM for NMR experiments) in a DPC/SDS (90/10, M/M)
water mixture.
2.3 ESR spectroscopy
Spin-labeled phosphatidylcholines (n-PCSL) with the nitroxide group at
different positions, n, in the sn-2 acyl chain, to be used for ESR experiments,
were synthesized as described by Marsh and Watts.(25, 26) The spin-labels
were stored at -20°C in ethanol solutions at a concentration of 1 mg/mL.
ESR spectra of lipid and lipid/peptide samples a peptide solution in PBS were
recorded on a 9 GHz Bruker Elexys E-500 spectrometer (Bruker, Rheinstetten,
Germany). Samples prepared for ESR measurements contained POPC (10 mg
mL-1 corresponding to 1.3×10⁻² M) and C8 at 0.5:1 weight ratio
(corresponding to 0.33 molar ratio). Such a high ratio was chosen to be sure of
the lipid bilayer saturation condition.(27) Capillaries containing the samples
were placed in a standard 4 mm quartz sample tube containing light silicone
oil for thermal stability. The temperature of the sample was regulated at 37 °C
and maintained constant during the measurement by blowing thermostated
nitrogen gas through a quartz Dewar. The instrumental settings were as
follows: sweep width, 120 G; resolution, 1024 points; modulation frequency,
100 kHz; modulation amplitude, 1.0 G; time constant, 20.5 ms, incident
power, 5.0 mW. Several scans, typically 16, were accumulated to improve the
signal-to-noise ratio. Values of the outer hyperfine splitting, 2Amax, were
63
determined by measuring, through a home-made MATLAB-based routine, the
difference between the low-field maximum and the high-field minimum.(28)
The main source of error on the 2Amax value is the uncertainty in composition
of samples prepared by mixing few microliters of mother solutions. For this
reason, reproducibility of 2Amax determination was estimated by evaluating its
value for selected independently prepared samples with the same nominal
composition. It was found to be ±0.4 G.
2.4 Circular Dichroism Spectroscopy
Circular Dichroism (CD) experiments were performed at 37 °C on a 810-Jasco
spectropolarimeter, using a quartz cuvette with a path length of 1 mm. CD
spectra of C8 were measured in PBS and in the presence of POPC unilamellar
vesicles. The spectra are an average of three consecutive scans from 250 to
200 nm, recorded with a bandwidth of 2.0 nm, a time constant of 16s, and a
scan rate of 5 nm/min. Mean residues ellipticities, [θ], were calculated as
(MRW×θ)/(10×d×c). MRW=M/(n-1), where M is the molecular mass of the
peptide and n is the number of amino acids (n-1 is the number peptide bonds).
θ is the observed ellipticity in degrees, d is the pathlength is cm and c is the
concentration in g mL-1. Samples prepared for CD measurements contained
the peptide (1×10⁻⁴ M) and the phospholipid at a 10-fold higher concentration
(1×10⁻³ M). During all the measurements, the trace of the high tension voltage
was checked to be less than 700 V, which should ensure reliability of the data
obtained.(29) Base lines of either solvent or vesicular suspensions without
peptide were subtracted from each respective sample to yield the peptide
contribution.
64
The propensity of the peptide to assume a helical conformation was estimated
from measurements of helical mean residue ellipticity at 222nm.(30) We used
[θ]222 values of 0 and -40,000 (1-2.5/n) degrees cm2 dmol-1 per amino acid
residue for 0% and 100% helicity. The correction for aromatic CD
contributions to [θ]222 due to two internal Trp residues has been applied (
aromatic222[ ]θ =-2.300 per residue). Finally, the fraction helix was calculated by
222[ ]θ /( helix222[ ]θ + aromatic
222[ ]θ ).
For titration experiments with surfactant molecules, CD experiments were
carried out on a JASCO J810 spectropolarimeter at room temperature, using a
quartz cuvette with a path length of 1 mm. CD spectra were the average of
four accumulations from 190 to 260 nm, recorded with a band width of 1-nm,
at a scanning speed of 10-nm/min. Base lines of either solvent or micellar
solutions without peptide were subtracted from each respective sample to yield
the contribution. Estimation of secondary structure content was carried out
using the algorithms from the DICHROWEB website.(31)
In CD experiments C8 was recorded in water and titrated with surfactant
molecules. The CD spectra of C8 were recorded in water and in presence of
0,6mM, 1,2mM, 5mM and 10mM of DPC and in presence of 2mM 4mM,
8mM of SDS. Then the C8 conformational behaviour was investigated in
mixed micelles of DPC and SDS (90:10; M/M) by dissolving the peptide in a
DPC/SDS water mixture.
2.5 Fluorescence Titration Measurements
C8-phospholipid interactions were also studied by monitoring the changes in
the Trp fluorescence emission spectra of the peptide upon addition of
65
increasing amounts of POPC unilamellar vescicles. Fluorescence
measurements were performed at 37 °C using a Jasco FP750
spectrofluorimeter, equipped with a thermostatically controlled cuvette holder.
The excitation wavelength was 280 nm and emission spectra were recorded
between 310 and 450 nm, with slit widths of 2 nm.
The titration was performed by adding measured amounts of a solution
containing the peptide (1×10⁻⁴ M) and suspended lipid vesicles to a weighed
amount of a solution of the peptide at the same concentration, initially put into
the spectrofluorimetric cuvette. In this way, the lipid concentration was
progressively increased (from 0 to ~1×10⁻³ M), while the peptide
concentration remained constant during the whole titration. After each
addition there was a 20-min wait to ensure equilibrium had been reached.
2.6 Molecular dynamics
All the computer simulations reported in this study were performed using
GROMACS 3.2 package(32) and the GROMOS96 force field. The starting
model of C8 obtained by NMR measurements(18) was placed in a box
containing a mixture of POPC lipids and water molecules. After the peptide
insertion in the box, all water molecules with oxygen atoms closer to 0.40 nm
from a non-hydrogen atom of the peptide were removed. Initially, the peptide
is solvated in the water phase at a distance of 7 Å from the lipid bilayer. Five-
eight simulations of 10 ps were performed, with the atomic coordinates of the
peptide restrained to the initial positions, to equilibrate the system. This
resulted in final systems containing 128 lipids, the C8 molecule and about
10950 water molecules. Molecular dynamics simulations have been performed
using the procedure described elsewhere.(33-35) Briefly, the temperature was
66
set to 310 K by coupling the system to an external bath. Bond lengths were
constrained by the Linear Constraint Solver (LINCS) algorithm.(36) Part
Mesh Ewald method (PME) was used for the treatment of electrostatic
interactions for atoms at a distance greater than 9 Å. The force field and the
coordinates for POPC were downloaded from the Tieleman group web-site
(http://mouse.bio.ucalgary.ca) and are the same used for other works
performed by us (33, 37) and other authors(38, 39)
Three simulations have been performed with different initial C8 positions. The
simulation time of the three trajectories is 70 ns. Since the analysis of the three
trajectories showed similar results, only the features of one of the three
trajectories are described. The lipid bilayer has been characterized by the
analysis of membrane thickness, defined as the average phosphate-phosphate
distance and of the density profile. Lipid tail parameters have been calculated
with respect to the membrane normal axis. The helicity of the peptide has been
determined by DSSP. Images have been created with Pymol
(www.pymol.org).
2.7 NMR analysis: C8 titration
NMR spectra were recorded on a Bruker DRX-600 spectrometer. Dry peptide
was dissolved in phosphate buffer (25mM pH 6.8). The obtained solution was
titrated with increasing amount of surfactant (SDS, DPC) moving from
submicelle to micelle concentration. Each step of the titration was monitored
by one dimentional (1D) 1H homonuclear spectra. 1D 1H homonuclear spectra
were recorded in the Fourier mode, with quadrature detection.
Two-dimensional (2D) spectra of the final micelle solutions were recorded. 2D 1H homonuclear TOCSY and NOESY were run in the phase –sensitive mode
67
using quadrature detection in ω1 by time –proportional phase incrementation
of the initial pulse.(40-42). The water signal was suppressed using
WATERGATE pulse sequence experiments.(43). Data block sizes were 2048
addresses in t2 and 512 equidistant t1 values. Before Fourier transformation,
the time domain data matrices were multiplied by shifted sin2 functions in both
dimensions. A mixing time of 70 ms was used for the TOCSY experiments.
NOESY experiments were run at 300 K with mixing times in the range of 100-
300 ms. Qualitative and quantitative analyses of DQF-COSY, TOCSY, and
NOESY spectra were achieved using SPARKY software.(44)
2.7.1 NMR structure calculations.
Peak volumes were translated into upper distance bounds with the CALIBA
routine from the CYANA software package.(45) The requisite pseudoatom
corrections were applied for non-stereospecifically assigned protons at
prochiral centers and for the methyl group. After discarding redundant and
duplicated constraints, the final list of experimental constraints was used to
generate an ensemble of 100 structures by the standard CYANA protocol of
simulated annealing in torsion angle space implemented (using 10000 steps).
No dihedral angle or hydrogen bond restraints were applied. The best 50
structures that had low target function values and small residual violations
were refined by in vacuo minimization in the AMBER 1991 force field using
the SANDER program of the AMBER 5.0 suite.(46, 47) To mimic the effect
of solvent screening, all net charges were reduced to 20% of their real values.
Moreover, a distance-dependent dielectric constant (ε = r) was used. The cut-
off for non-bonded interactions was 12 Å. NMR-derived upper bounds were
imposed as semi-parabolic penalty functions, with force constants of 16
68
Kcal/mol Å2. The function was shifted to be linear when the violation
exceeded 0.5 Å. The best 10 structures after minimization had AMBER
energies ranging from -441.4 to -391.1 Kcal/mol. Final structures were
analyzed using the Insight 98.0 program (Molecular Simulations, San Diego,
CA, USA).
69
CHAPTER 3
RESULTS
3.1 PEPTIDE-MEMBRANE INTERACTION
3.1.1 Choice of solvent
Micelle solution are made of surfactants, such as the zwitterionic dodecyl
phosphocoline (DPC) or the negatively charged sodium dodecyl sulphate
(SDS), at a concentration much higher than their c.m.c. These surfactants
forms spherical aggregates where the polar head groups are located on the
surface and the hydrophobic tail in the core. From a technical viewpoint the
micelles are appropriate for the high-resolution liquid-state NMR studies
because they have short rotational correlation time due to their small size.(48,
49).
3.1.2 EPS spectroscopy
The Electron Spin Resonance spectroscopy (ESR), by using spin-labeled
substances (peptides and/or lipids) has been proved to give substantial
information on the interaction between viral fusion peptides and lipid
membranes.(20, 27, 50-53) Association of these peptides with lipid
membranes can be detected from the perturbation of the chain mobility of
spin-labeled lipids, as reported in the literature for membrane proteins.(54)
ESR spectra of C8 were recorded in the presence of POPC bilayers, a
membrane mimetic system including both a saturated (C16) and an
unsaturated (C18) fatty acid, like most of phospholipids present in mammalian
cell membranes.
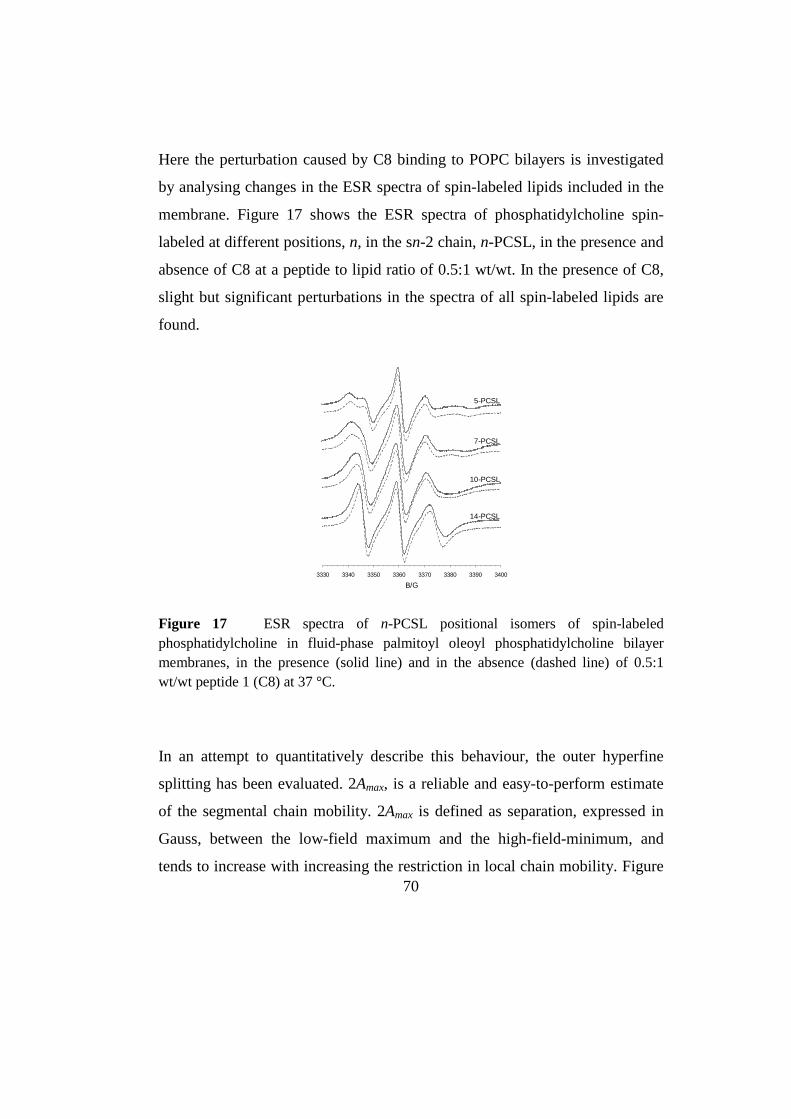
70
Here the perturbation caused by C8 binding to POPC bilayers is investigated
by analysing changes in the ESR spectra of spin-labeled lipids included in the
membrane. Figure 17 shows the ESR spectra of phosphatidylcholine spin-
labeled at different positions, n, in the sn-2 chain, n-PCSL, in the presence and
absence of C8 at a peptide to lipid ratio of 0.5:1 wt/wt. In the presence of C8,
slight but significant perturbations in the spectra of all spin-labeled lipids are
found.
Figure 17 ESR spectra of n-PCSL positional isomers of spin-labeled phosphatidylcholine in fluid-phase palmitoyl oleoyl phosphatidylcholine bilayer membranes, in the presence (solid line) and in the absence (dashed line) of 0.5:1 wt/wt peptide 1 (C8) at 37 °C.
In an attempt to quantitatively describe this behaviour, the outer hyperfine
splitting has been evaluated. 2Amax, is a reliable and easy-to-perform estimate
of the segmental chain mobility. 2Amax is defined as separation, expressed in
Gauss, between the low-field maximum and the high-field-minimum, and
tends to increase with increasing the restriction in local chain mobility. Figure
3330 3340 3350 3360 3370 3380 3390 3400
B/G
5-PCSL
14-PCSL
10-PCSL
7-PCSL
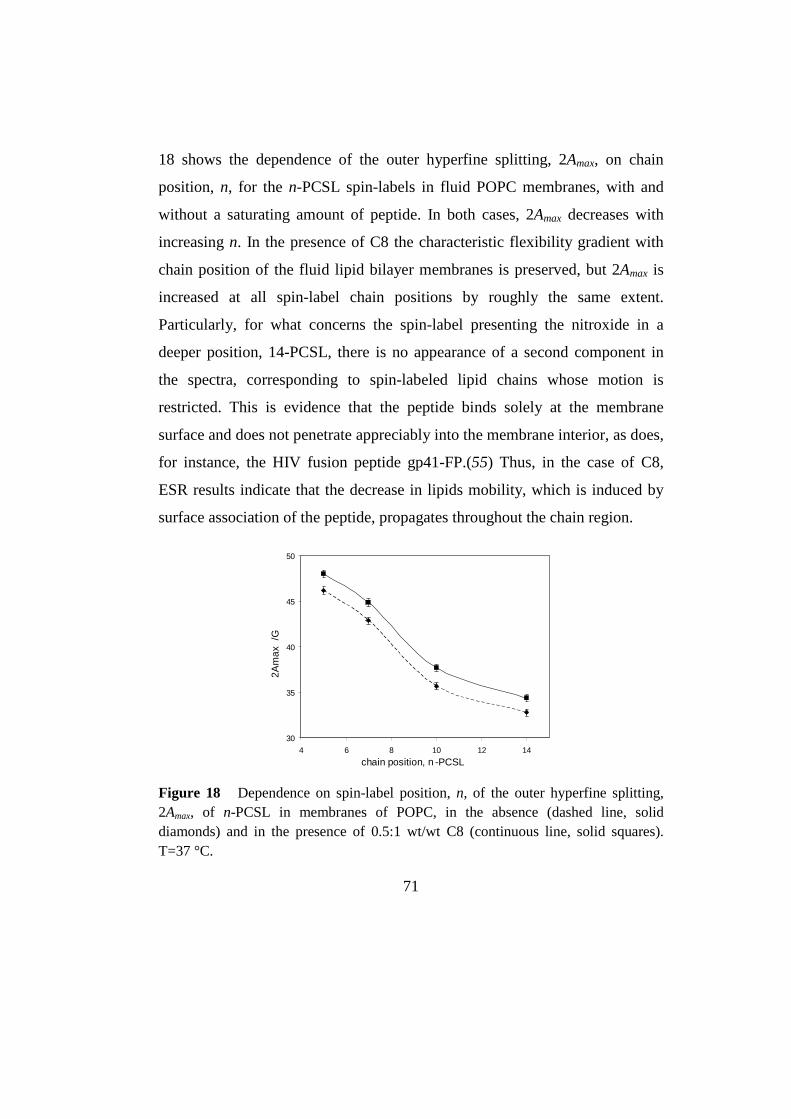
71
18 shows the dependence of the outer hyperfine splitting, 2Amax, on chain
position, n, for the n-PCSL spin-labels in fluid POPC membranes, with and
without a saturating amount of peptide. In both cases, 2Amax decreases with
increasing n. In the presence of C8 the characteristic flexibility gradient with
chain position of the fluid lipid bilayer membranes is preserved, but 2Amax is
increased at all spin-label chain positions by roughly the same extent.
Particularly, for what concerns the spin-label presenting the nitroxide in a
deeper position, 14-PCSL, there is no appearance of a second component in
the spectra, corresponding to spin-labeled lipid chains whose motion is
restricted. This is evidence that the peptide binds solely at the membrane
surface and does not penetrate appreciably into the membrane interior, as does,
for instance, the HIV fusion peptide gp41-FP.(55) Thus, in the case of C8,
ESR results indicate that the decrease in lipids mobility, which is induced by
surface association of the peptide, propagates throughout the chain region.
Figure 18 Dependence on spin-label position, n, of the outer hyperfine splitting, 2Amax, of n-PCSL in membranes of POPC, in the absence (dashed line, solid diamonds) and in the presence of 0.5:1 wt/wt C8 (continuous line, solid squares). T=37 °C.
30
35
40
45
50
4 6 8 10 12 14
chain position, n -PCSL
2Am
ax /
G…
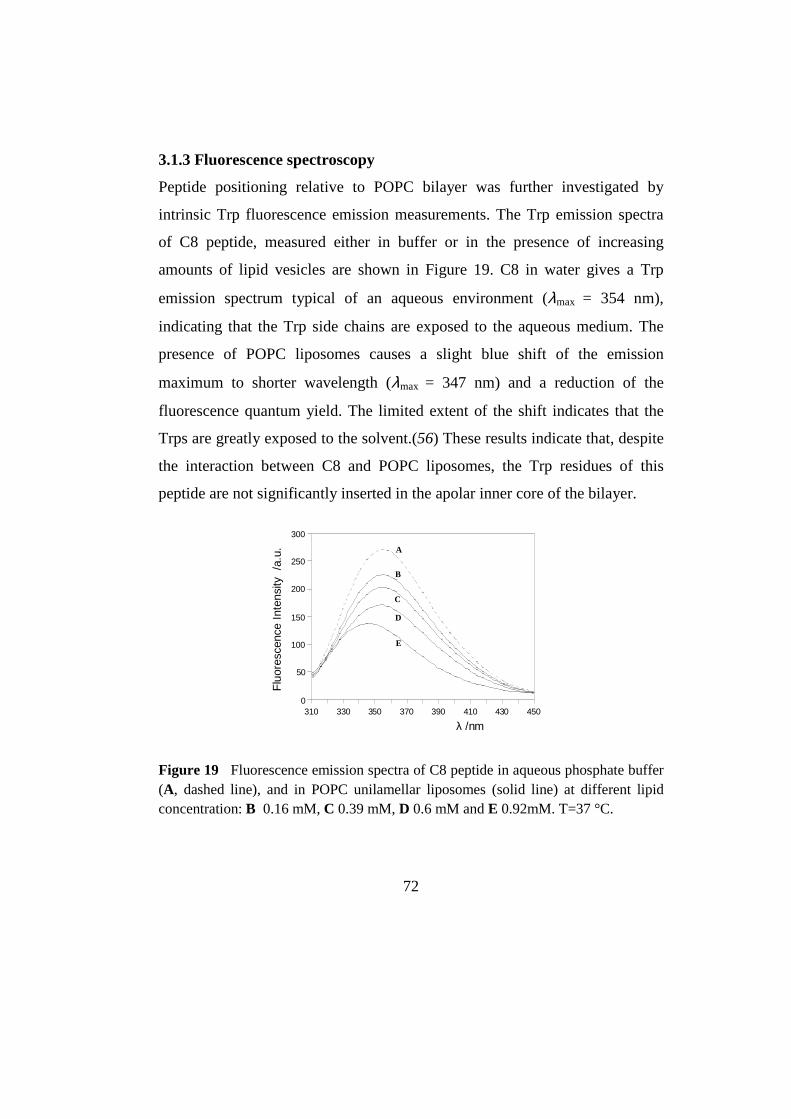
72
3.1.3 Fluorescence spectroscopy
Peptide positioning relative to POPC bilayer was further investigated by
intrinsic Trp fluorescence emission measurements. The Trp emission spectra
of C8 peptide, measured either in buffer or in the presence of increasing
amounts of lipid vesicles are shown in Figure 19. C8 in water gives a Trp
emission spectrum typical of an aqueous environment (λmax = 354 nm),
indicating that the Trp side chains are exposed to the aqueous medium. The
presence of POPC liposomes causes a slight blue shift of the emission
maximum to shorter wavelength (λmax = 347 nm) and a reduction of the
fluorescence quantum yield. The limited extent of the shift indicates that the
Trps are greatly exposed to the solvent.(56) These results indicate that, despite
the interaction between C8 and POPC liposomes, the Trp residues of this
peptide are not significantly inserted in the apolar inner core of the bilayer.
0
50
100
150
200
250
300
310 330 350 370 390 410 430 450
Flu
ores
cenc
e In
tens
ity
/a.u
.
λ /nm
A
B
C
D
E
Figure 19 Fluorescence emission spectra of C8 peptide in aqueous phosphate buffer (A, dashed line), and in POPC unilamellar liposomes (solid line) at different lipid concentration: B 0.16 mM, C 0.39 mM, D 0.6 mM and E 0.92mM. T=37 °C.
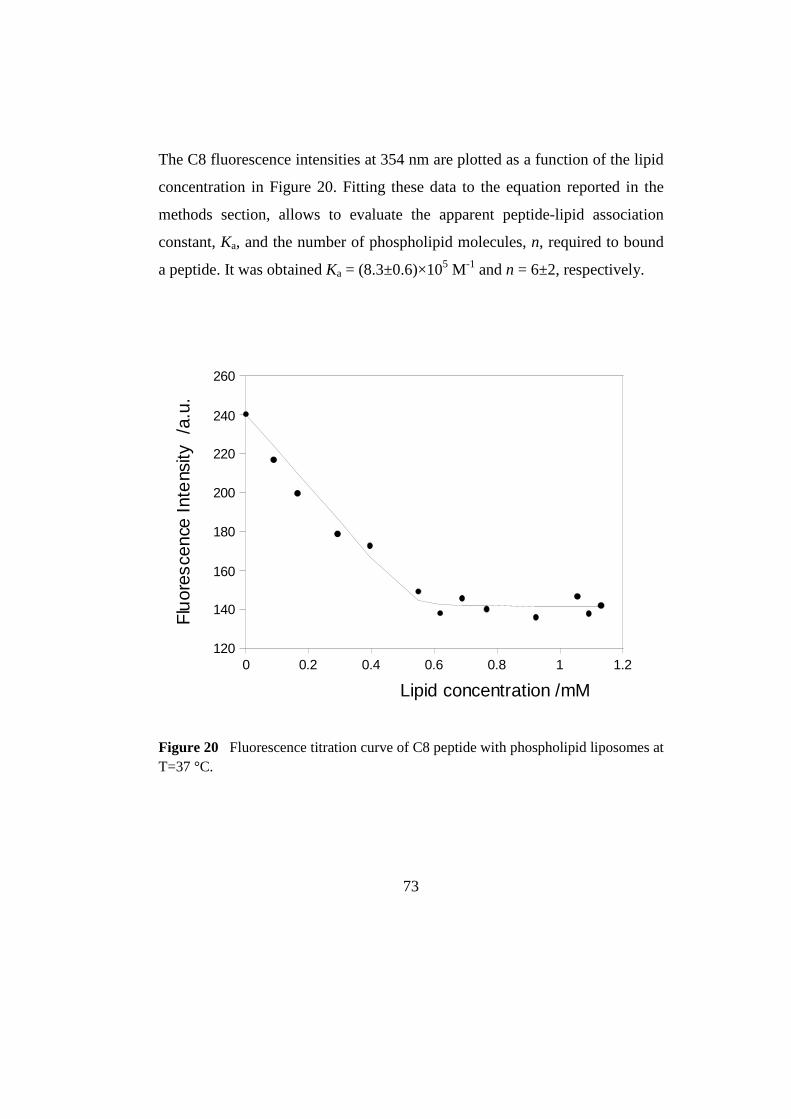
73
The C8 fluorescence intensities at 354 nm are plotted as a function of the lipid
concentration in Figure 20. Fitting these data to the equation reported in the
methods section, allows to evaluate the apparent peptide-lipid association
constant, Ka, and the number of phospholipid molecules, n, required to bound
a peptide. It was obtained Ka = (8.3±0.6)×105 M-1 and n = 6±2, respectively.
120
140
160
180
200
220
240
260
0 0.2 0.4 0.6 0.8 1 1.2
Flu
ores
cenc
e In
tens
ity
/a.u
.
Lipid concentration /mM
Figure 20 Fluorescence titration curve of C8 peptide with phospholipid liposomes at T=37 °C.
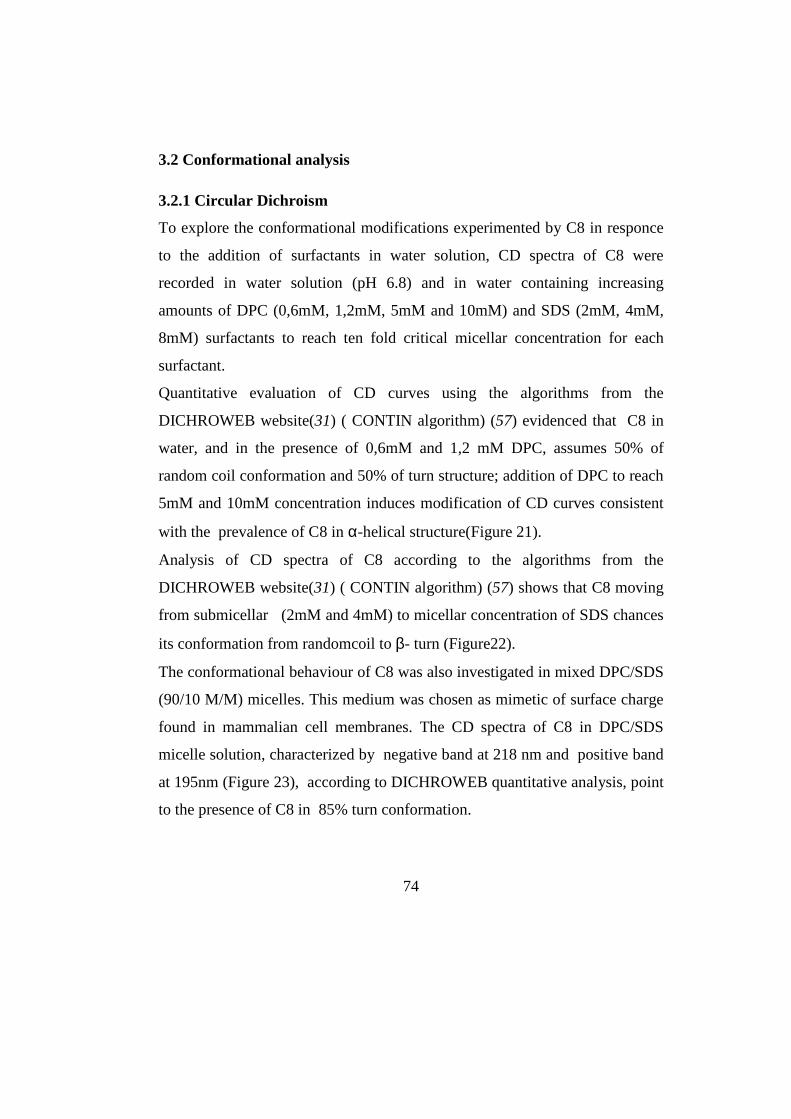
74
3.2 Conformational analysis
3.2.1 Circular Dichroism
To explore the conformational modifications experimented by C8 in responce
to the addition of surfactants in water solution, CD spectra of C8 were
recorded in water solution (pH 6.8) and in water containing increasing
amounts of DPC (0,6mM, 1,2mM, 5mM and 10mM) and SDS (2mM, 4mM,
8mM) surfactants to reach ten fold critical micellar concentration for each
surfactant.
Quantitative evaluation of CD curves using the algorithms from the
DICHROWEB website(31) ( CONTIN algorithm) (57) evidenced that C8 in
water, and in the presence of 0,6mM and 1,2 mM DPC, assumes 50% of
random coil conformation and 50% of turn structure; addition of DPC to reach
5mM and 10mM concentration induces modification of CD curves consistent
with the prevalence of C8 in α-helical structure(Figure 21).
Analysis of CD spectra of C8 according to the algorithms from the
DICHROWEB website(31) ( CONTIN algorithm) (57) shows that C8 moving
from submicellar (2mM and 4mM) to micellar concentration of SDS chances
its conformation from randomcoil to β- turn (Figure22).
The conformational behaviour of C8 was also investigated in mixed DPC/SDS
(90/10 M/M) micelles. This medium was chosen as mimetic of surface charge
found in mammalian cell membranes. The CD spectra of C8 in DPC/SDS
micelle solution, characterized by negative band at 218 nm and positive band
at 195nm (Figure 23), according to DICHROWEB quantitative analysis, point
to the presence of C8 in 85% turn conformation.
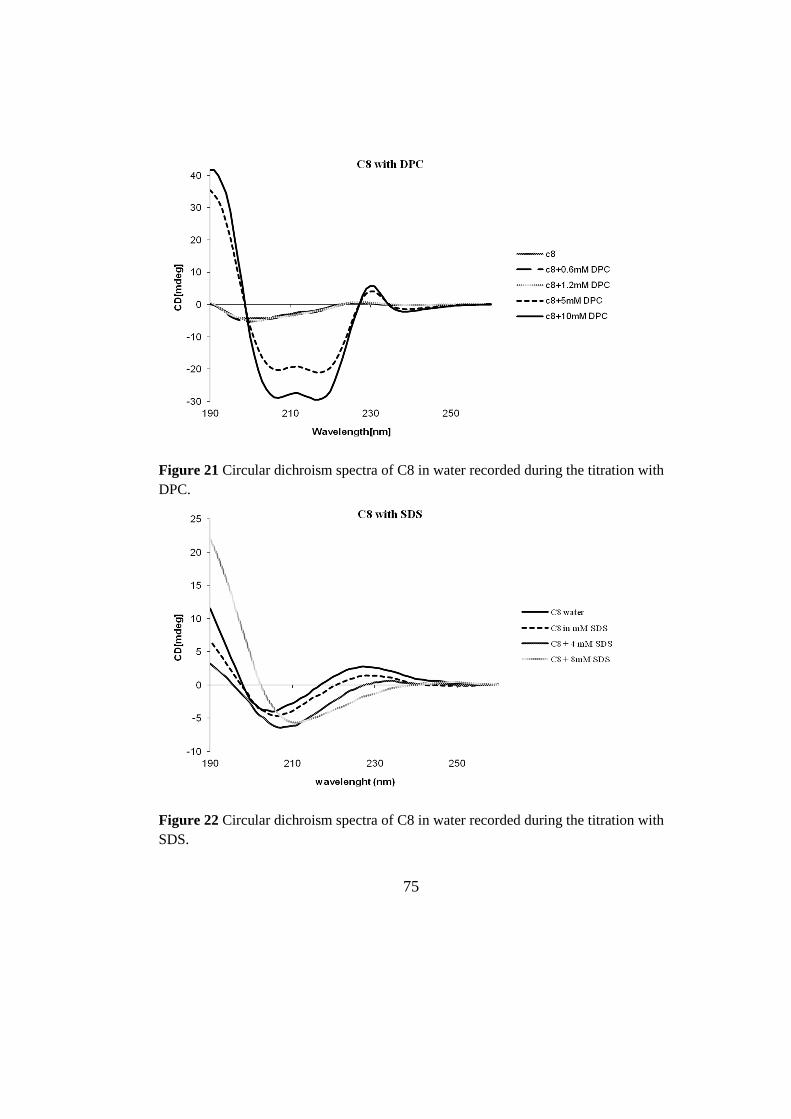
75
Figure 21 Circular dichroism spectra of C8 in water recorded during the titration with DPC.
Figure 22 Circular dichroism spectra of C8 in water recorded during the titration with SDS.
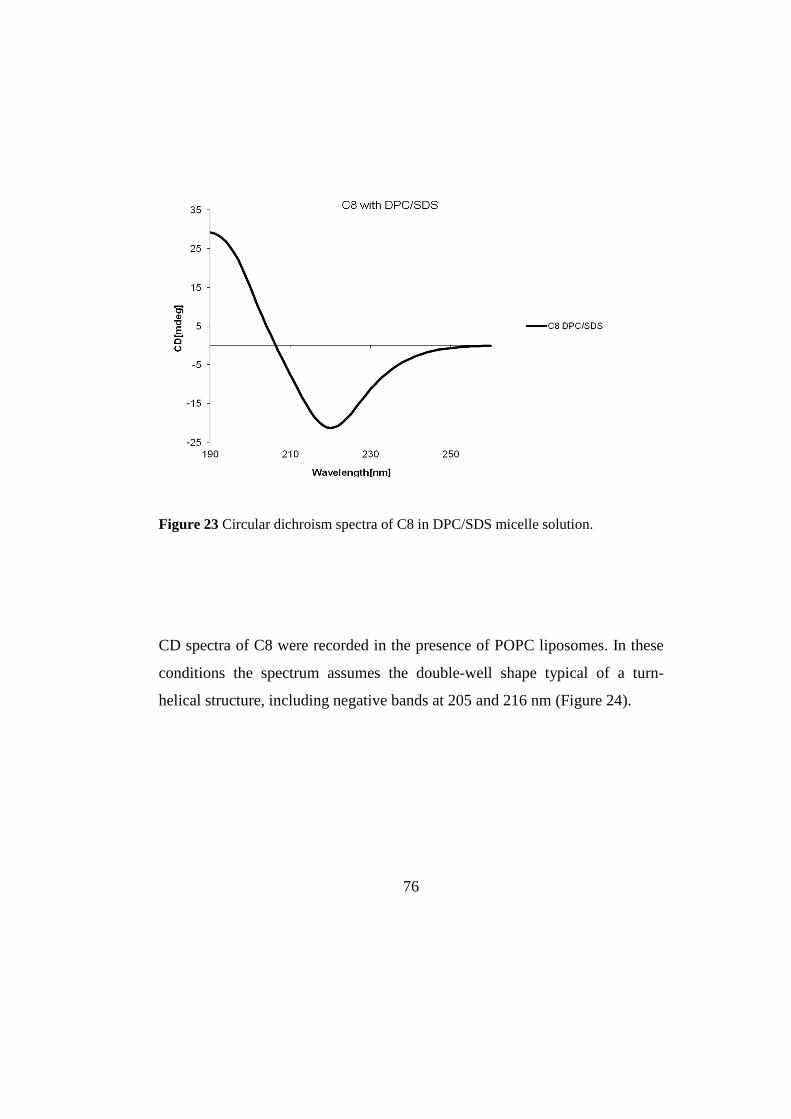
76
Figure 23 Circular dichroism spectra of C8 in DPC/SDS micelle solution.
CD spectra of C8 were recorded in the presence of POPC liposomes. In these
conditions the spectrum assumes the double-well shape typical of a turn-
helical structure, including negative bands at 205 and 216 nm (Figure 24).
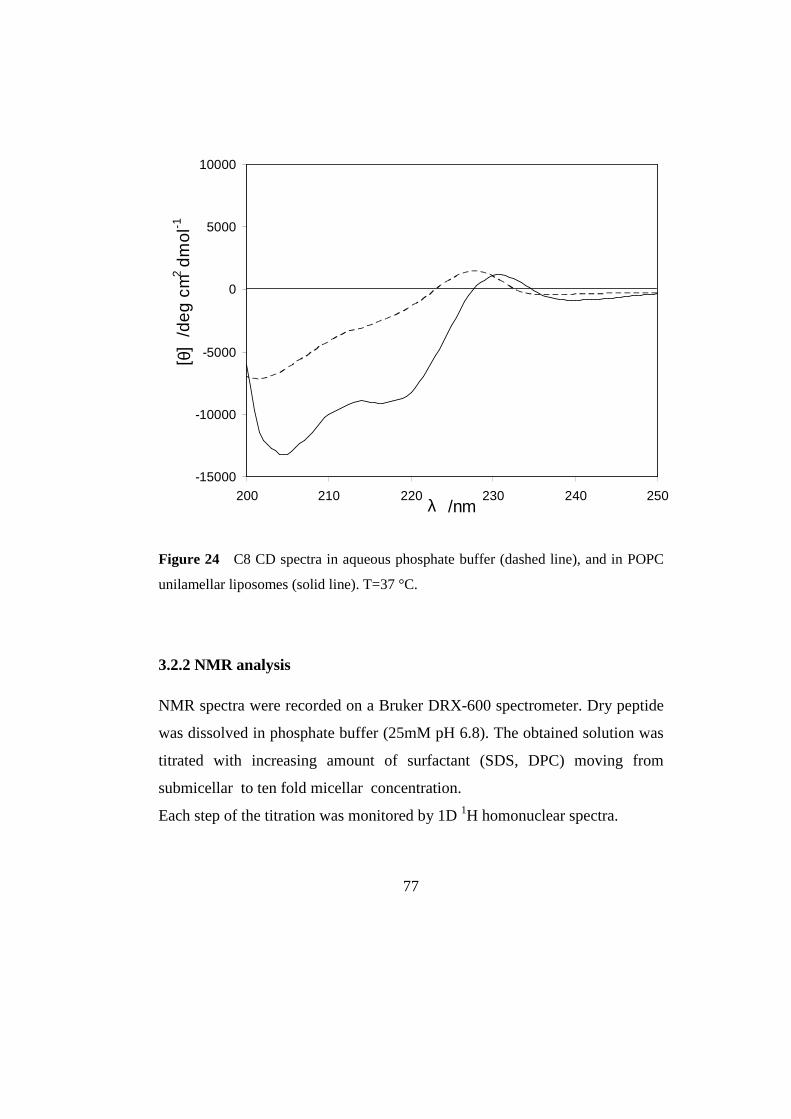
77
Figure 24 C8 CD spectra in aqueous phosphate buffer (dashed line), and in POPC
unilamellar liposomes (solid line). T=37 °C.
3.2.2 NMR analysis
NMR spectra were recorded on a Bruker DRX-600 spectrometer. Dry peptide
was dissolved in phosphate buffer (25mM pH 6.8). The obtained solution was
titrated with increasing amount of surfactant (SDS, DPC) moving from
submicellar to ten fold micellar concentration.
Each step of the titration was monitored by 1D 1H homonuclear spectra.
-15000
-10000
-5000
0
5000
10000
200 210 220 230 240 250λ /nm
[ θ]
/deg
cm
2 dm
ol -1
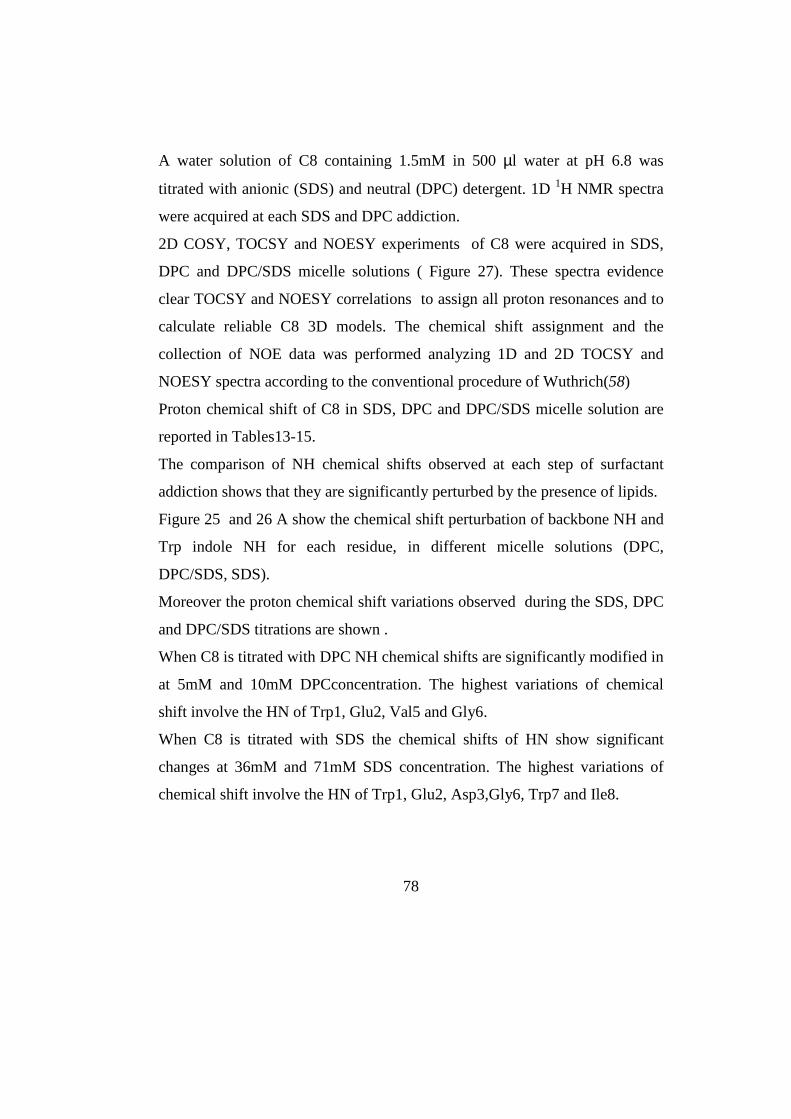
78
A water solution of C8 containing 1.5mM in 500 µl water at pH 6.8 was
titrated with anionic (SDS) and neutral (DPC) detergent. 1D 1H NMR spectra
were acquired at each SDS and DPC addiction.
2D COSY, TOCSY and NOESY experiments of C8 were acquired in SDS,
DPC and DPC/SDS micelle solutions ( Figure 27). These spectra evidence
clear TOCSY and NOESY correlations to assign all proton resonances and to
calculate reliable C8 3D models. The chemical shift assignment and the
collection of NOE data was performed analyzing 1D and 2D TOCSY and
NOESY spectra according to the conventional procedure of Wuthrich(58)
Proton chemical shift of C8 in SDS, DPC and DPC/SDS micelle solution are
reported in Tables13-15.
The comparison of NH chemical shifts observed at each step of surfactant
addiction shows that they are significantly perturbed by the presence of lipids.
Figure 25 and 26 A show the chemical shift perturbation of backbone NH and
Trp indole NH for each residue, in different micelle solutions (DPC,
DPC/SDS, SDS).
Moreover the proton chemical shift variations observed during the SDS, DPC
and DPC/SDS titrations are shown .
When C8 is titrated with DPC NH chemical shifts are significantly modified in
at 5mM and 10mM DPCconcentration. The highest variations of chemical
shift involve the HN of Trp1, Glu2, Val5 and Gly6.
When C8 is titrated with SDS the chemical shifts of HN show significant
changes at 36mM and 71mM SDS concentration. The highest variations of
chemical shift involve the HN of Trp1, Glu2, Asp3,Gly6, Trp7 and Ile8.
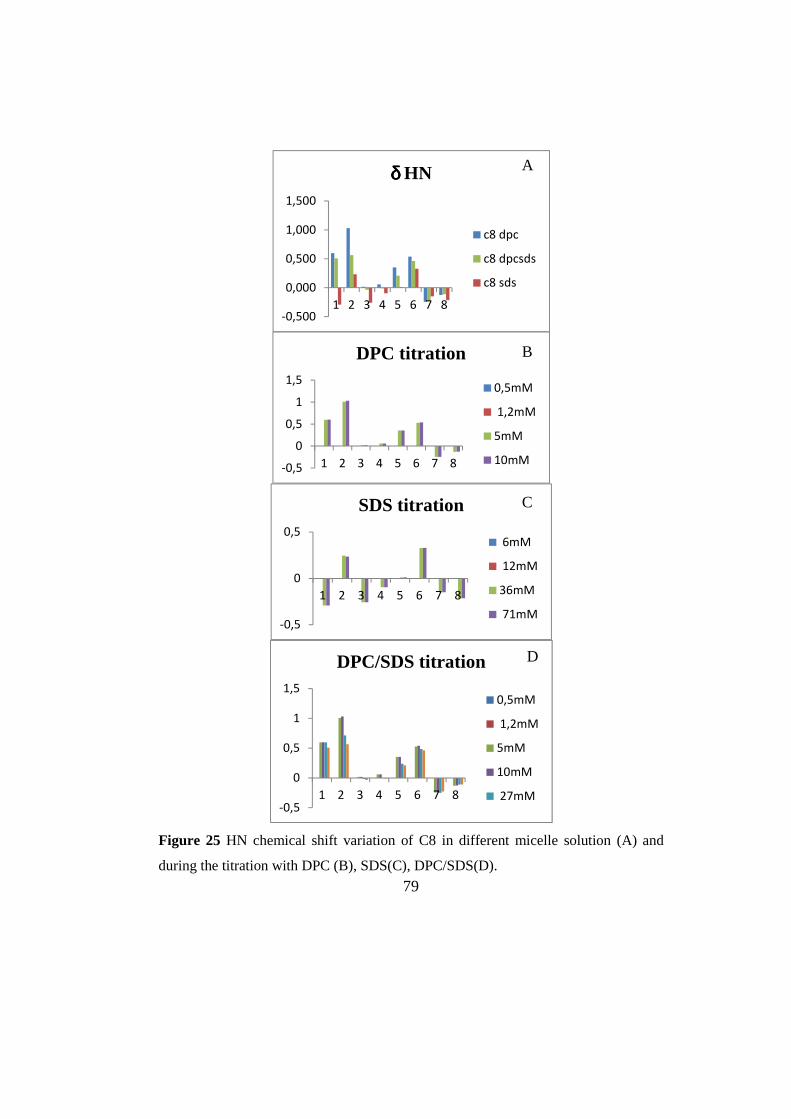
79
Figure 25 HN chemical shift variation of C8 in different micelle solution (A) and
during the titration with DPC (B), SDS(C), DPC/SDS(D).
-0,500
0,000
0,500
1,000
1,500
1 2 3 4 5 6 7 8
δδδδ HN
c8 dpc
c8 dpcsds
c8 sds
-0,5
0
0,5
1
1,5
1 2 3 4 5 6 7 8
DPC titration
0,5mM
1,2mM
5mM
10mM
-0,5
0
0,5
1 2 3 4 5 6 7 8
SDS titration
6mM
12mM
36mM
71mM
-0,5
0
0,5
1
1,5
1 2 3 4 5 6 7 8
DPC/SDS titration
0,5mM
1,2mM
5mM
10mM
27mM
A
B
C
D
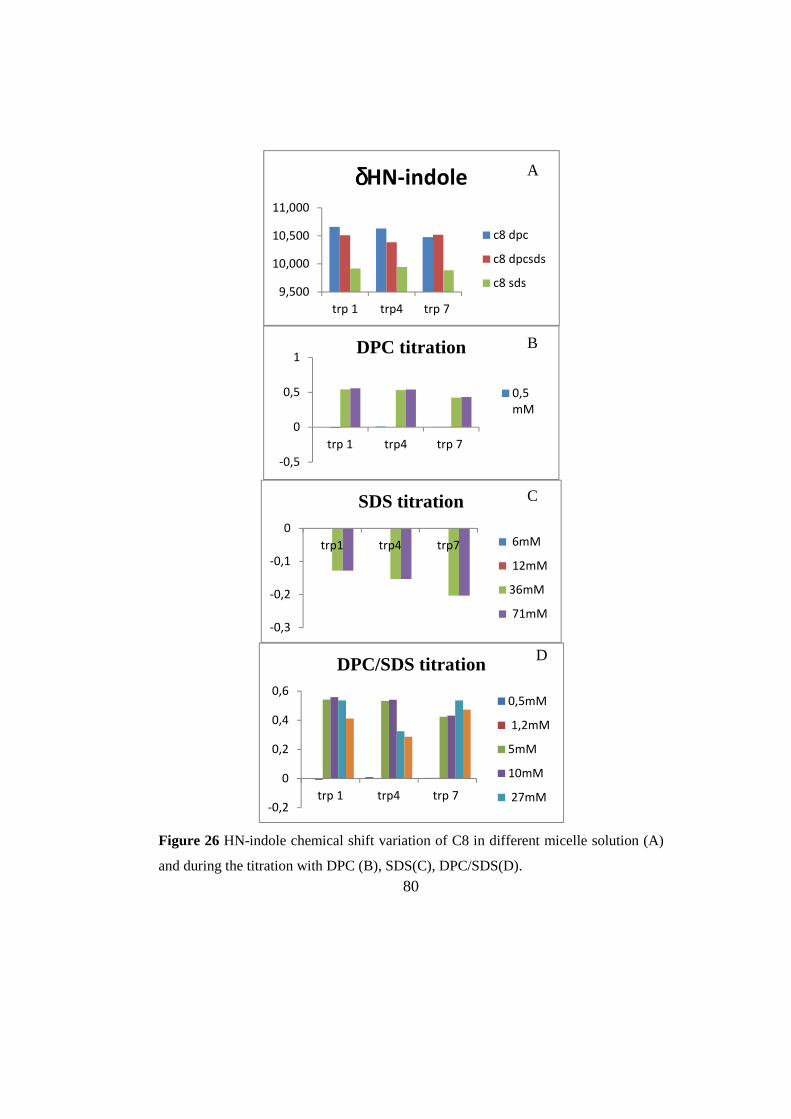
80
Figure 26 HN-indole chemical shift variation of C8 in different micelle solution (A)
and during the titration with DPC (B), SDS(C), DPC/SDS(D).
9,500
10,000
10,500
11,000
trp 1 trp4 trp 7
δδδδHN-indole
c8 dpc
c8 dpcsds
c8 sds
-0,5
0
0,5
1
trp 1 trp4 trp 7
DPC titration
0,5
mM
-0,3
-0,2
-0,1
0
trp1 trp4 trp7
SDS titration
6mM
12mM
36mM
71mM
-0,2
0
0,2
0,4
0,6
trp 1 trp4 trp 7
DPC/SDS titration
0,5mM
1,2mM
5mM
10mM
27mM
A
B
D
C
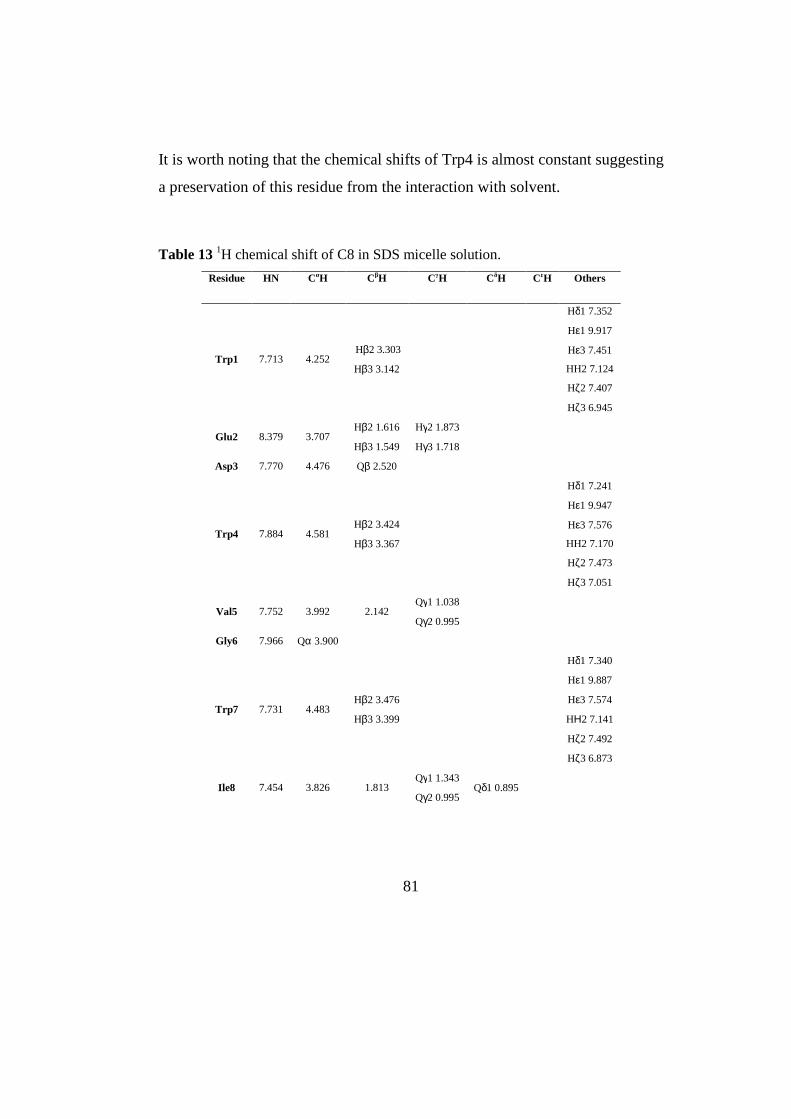
81
It is worth noting that the chemical shifts of Trp4 is almost constant suggesting
a preservation of this residue from the interaction with solvent.
Table 13 1H chemical shift of C8 in SDS micelle solution.
Residue HN CαH CβH CγH CδH CεH Others
Trp1 7.713 4.252 Hβ2 3.303
Hβ3 3.142
Hδ1 7.352
Hε1 9.917
Hε3 7.451
HH2 7.124
Hζ2 7.407
Hζ3 6.945
Glu2 8.379 3.707 Hβ2 1.616
Hβ3 1.549
Hγ2 1.873
Hγ3 1.718
Asp3 7.770 4.476 Qβ 2.520
Trp4 7.884 4.581 Hβ2 3.424
Hβ3 3.367
Hδ1 7.241
Hε1 9.947
Hε3 7.576
HH2 7.170
Hζ2 7.473
Hζ3 7.051
Val5 7.752 3.992 2.142 Qγ1 1.038
Qγ2 0.995
Gly6 7.966 Qα 3.900
Trp7 7.731 4.483 Hβ2 3.476
Hβ3 3.399
Hδ1 7.340
Hε1 9.887
Hε3 7.574
HΗ2 7.141
Hζ2 7.492
Hζ3 6.873
Ile8 7.454 3.826 1.813 Qγ1 1.343
Qγ2 0.995 Qδ1 0.895
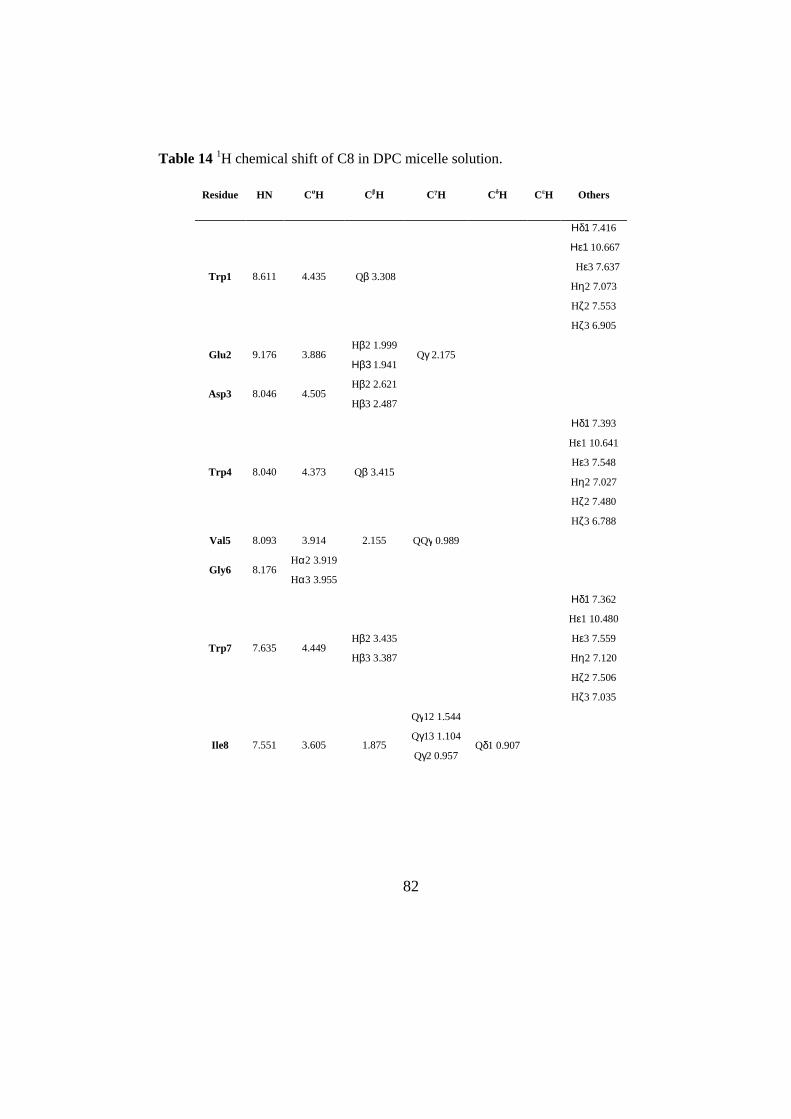
82
Table 14 1H chemical shift of C8 in DPC micelle solution.
Residue HN CαH CβH CγH CδH CεH Others
Trp1 8.611 4.435 Qβ 3.308
Ηδ1 7.416
Ηε1 10.667
Hε3 7.637
Hη2 7.073
Hζ2 7.553
Hζ3 6.905
Glu2 9.176 3.886 Hβ2 1.999
Ηβ3 1.941 Qγ 2.175
Asp3 8.046 4.505 Hβ2 2.621
Hβ3 2.487
Trp4 8.040 4.373 Qβ 3.415
Ηδ1 7.393
Hε1 10.641
Hε3 7.548
Hη2 7.027
Hζ2 7.480
Hζ3 6.788
Val5 8.093 3.914 2.155 QQγ 0.989
Gly6 8.176 Hα2 3.919
Hα3 3.955
Trp7 7.635 4.449 Hβ2 3.435
Hβ3 3.387
Ηδ1 7.362
Hε1 10.480
Hε3 7.559
Hη2 7.120
Hζ2 7.506
Hζ3 7.035
Ile8 7.551 3.605 1.875
Qγ12 1.544
Qγ13 1.104
Qγ2 0.957
Qδ1 0.907
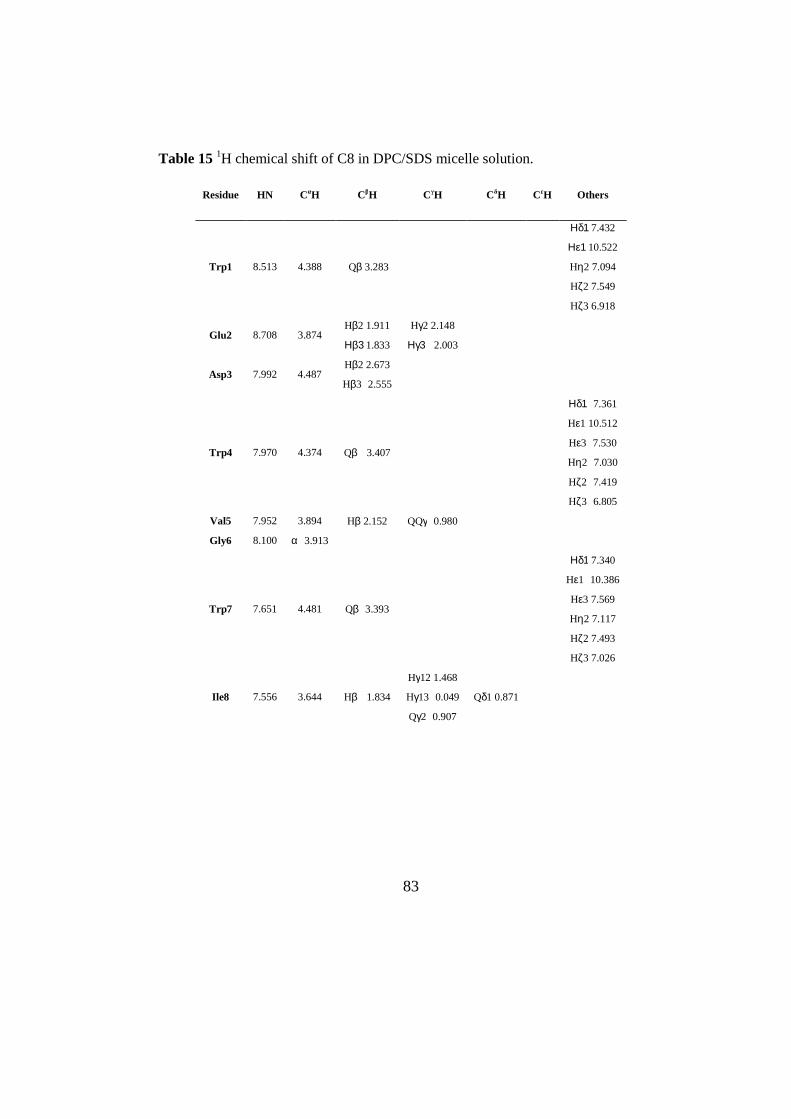
83
Table 15 1H chemical shift of C8 in DPC/SDS micelle solution.
Residue HN CαH CβH CγH CδH CεH Others
Trp1 8.513 4.388 Qβ 3.283
Ηδ1 7.432
Ηε1 10.522
Hη2 7.094
Hζ2 7.549
Hζ3 6.918
Glu2 8.708 3.874 Hβ2 1.911
Ηβ3 1.833
Hγ2 2.148
Ηγ3 2.003
Asp3 7.992 4.487 Hβ2 2.673
Hβ3 2.555
Trp4 7.970 4.374 Qβ 3.407
Ηδ1 7.361
Hε1 10.512
Hε3 7.530
Hη2 7.030
Hζ2 7.419
Hζ3 6.805
Val5 7.952 3.894 Hβ 2.152 QQγ 0.980
Gly6 8.100 α 3.913
Trp7 7.651 4.481 Qβ 3.393
Ηδ1 7.340
Hε1 10.386
Hε3 7.569
Hη2 7.117
Hζ2 7.493
Hζ3 7.026
Ile8 7.556 3.644 Hβ 1.834
Hγ12 1.468
Hγ13 0.049
Qγ2 0.907
Qδ1 0.871
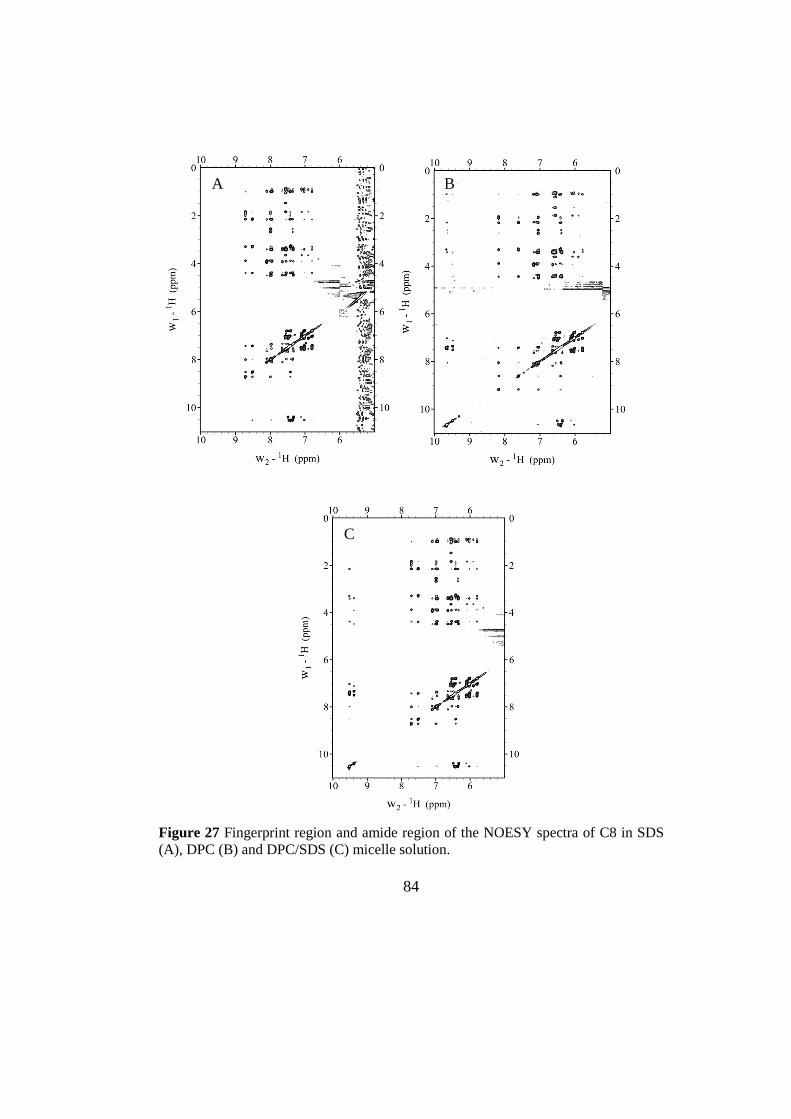
84
Figure 27 Fingerprint region and amide region of the NOESY spectra of C8 in SDS (A), DPC (B) and DPC/SDS (C) micelle solution.
A B
C
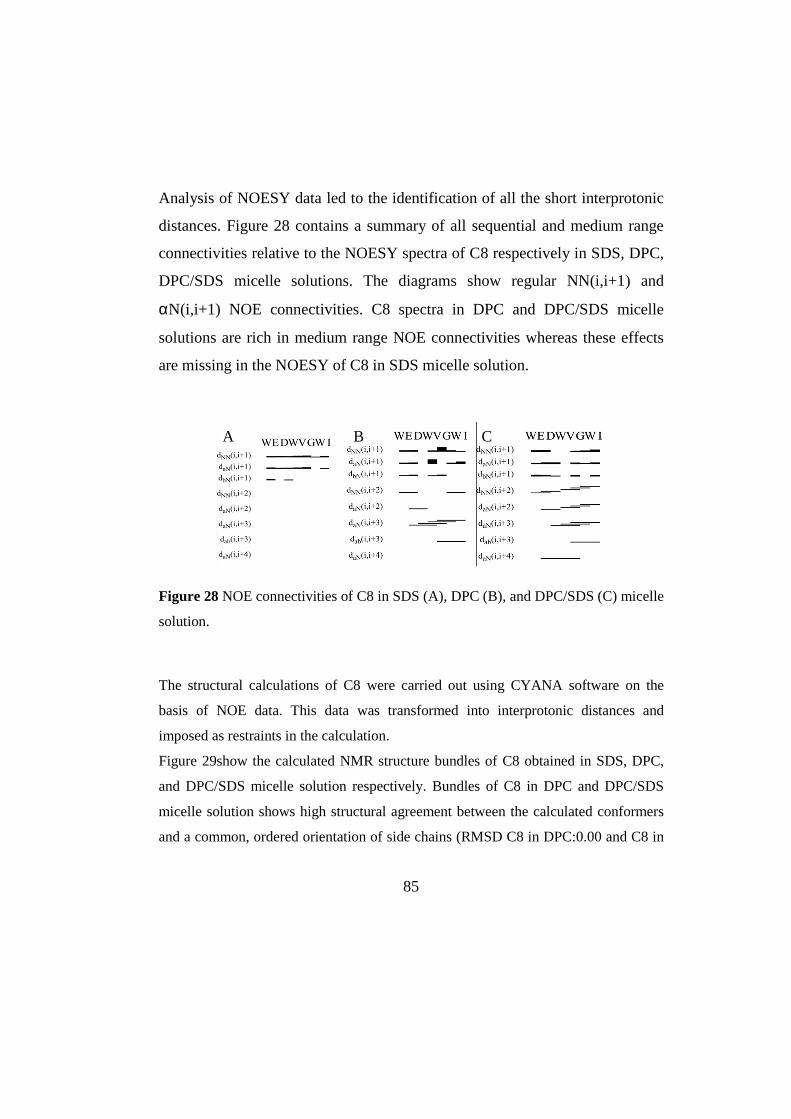
85
Analysis of NOESY data led to the identification of all the short interprotonic
distances. Figure 28 contains a summary of all sequential and medium range
connectivities relative to the NOESY spectra of C8 respectively in SDS, DPC,
DPC/SDS micelle solutions. The diagrams show regular NN(i,i+1) and
αN(i,i+1) NOE connectivities. C8 spectra in DPC and DPC/SDS micelle
solutions are rich in medium range NOE connectivities whereas these effects
are missing in the NOESY of C8 in SDS micelle solution.
Figure 28 NOE connectivities of C8 in SDS (A), DPC (B), and DPC/SDS (C) micelle
solution.
The structural calculations of C8 were carried out using CYANA software on the
basis of NOE data. This data was transformed into interprotonic distances and
imposed as restraints in the calculation.
Figure 29show the calculated NMR structure bundles of C8 obtained in SDS, DPC,
and DPC/SDS micelle solution respectively. Bundles of C8 in DPC and DPC/SDS
micelle solution shows high structural agreement between the calculated conformers
and a common, ordered orientation of side chains (RMSD C8 in DPC:0.00 and C8 in
A B C
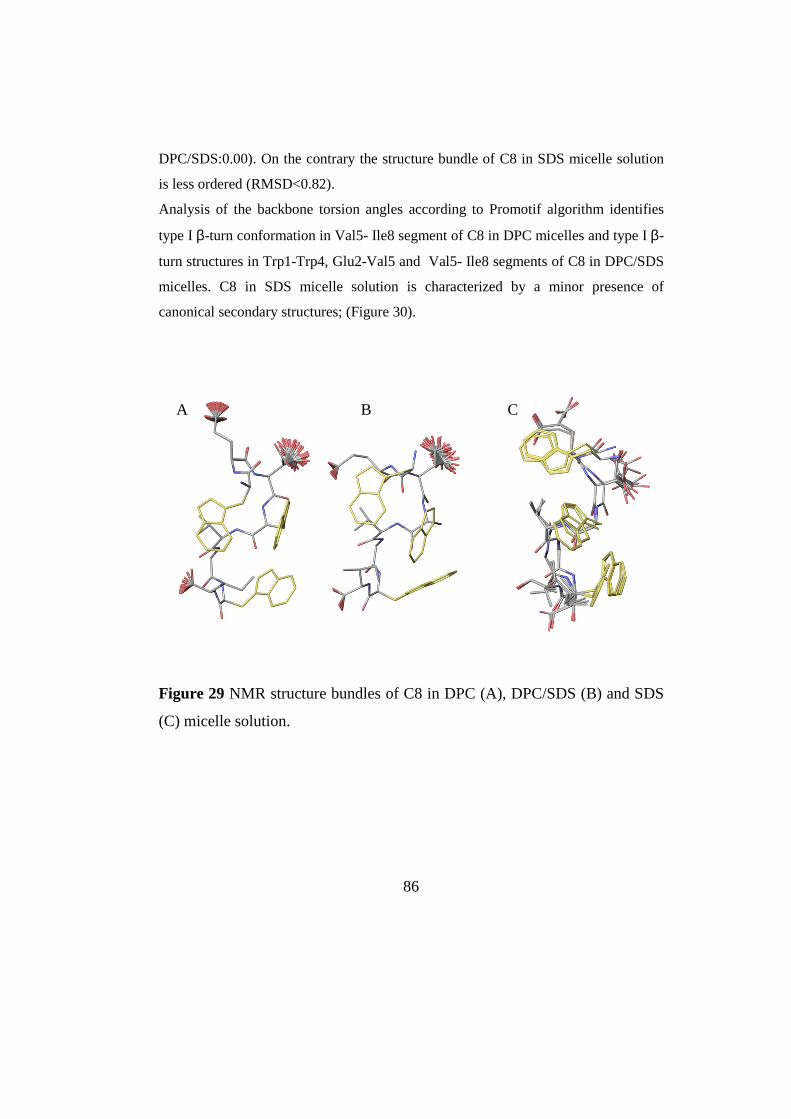
86
DPC/SDS:0.00). On the contrary the structure bundle of C8 in SDS micelle solution
is less ordered (RMSD<0.82).
Analysis of the backbone torsion angles according to Promotif algorithm identifies
type I β-turn conformation in Val5- Ile8 segment of C8 in DPC micelles and type I β-
turn structures in Trp1-Trp4, Glu2-Val5 and Val5- Ile8 segments of C8 in DPC/SDS
micelles. C8 in SDS micelle solution is characterized by a minor presence of
canonical secondary structures; (Figure 30).
Figure 29 NMR structure bundles of C8 in DPC (A), DPC/SDS (B) and SDS
(C) micelle solution.
A B C
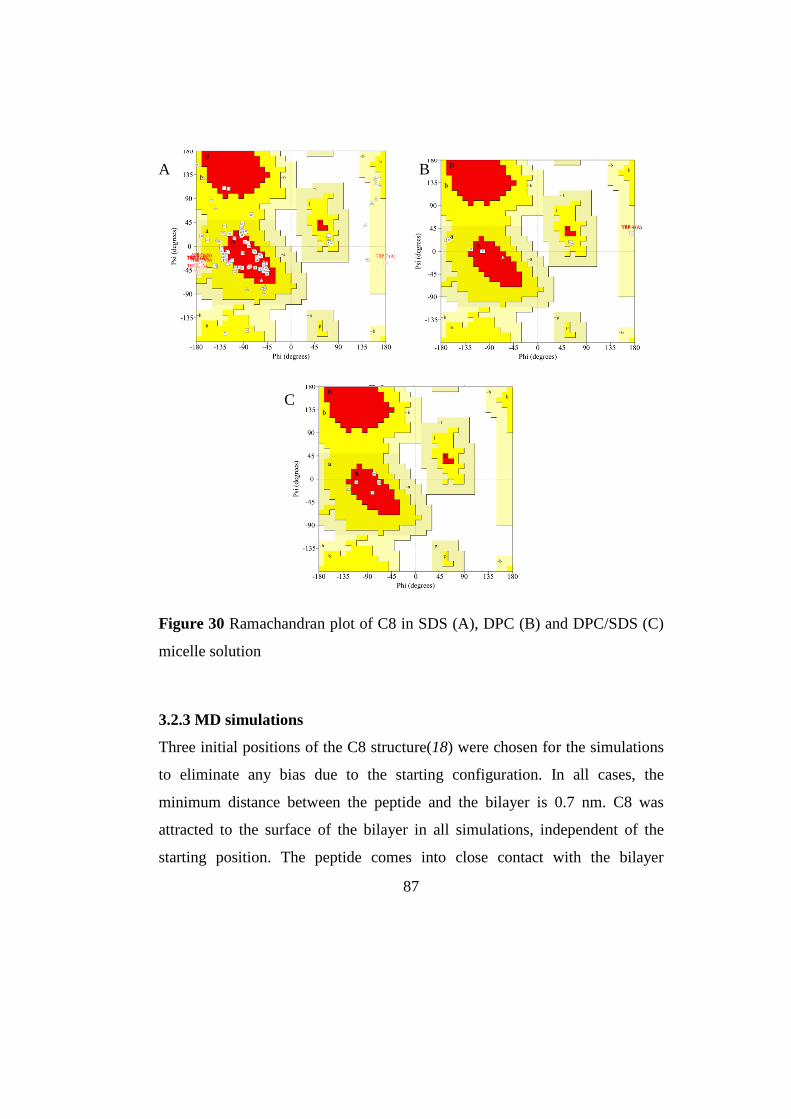
87
Figure 30 Ramachandran plot of C8 in SDS (A), DPC (B) and DPC/SDS (C)
micelle solution
3.2.3 MD simulations
Three initial positions of the C8 structure(18) were chosen for the simulations
to eliminate any bias due to the starting configuration. In all cases, the
minimum distance between the peptide and the bilayer is 0.7 nm. C8 was
attracted to the surface of the bilayer in all simulations, independent of the
starting position. The peptide comes into close contact with the bilayer
A B
C
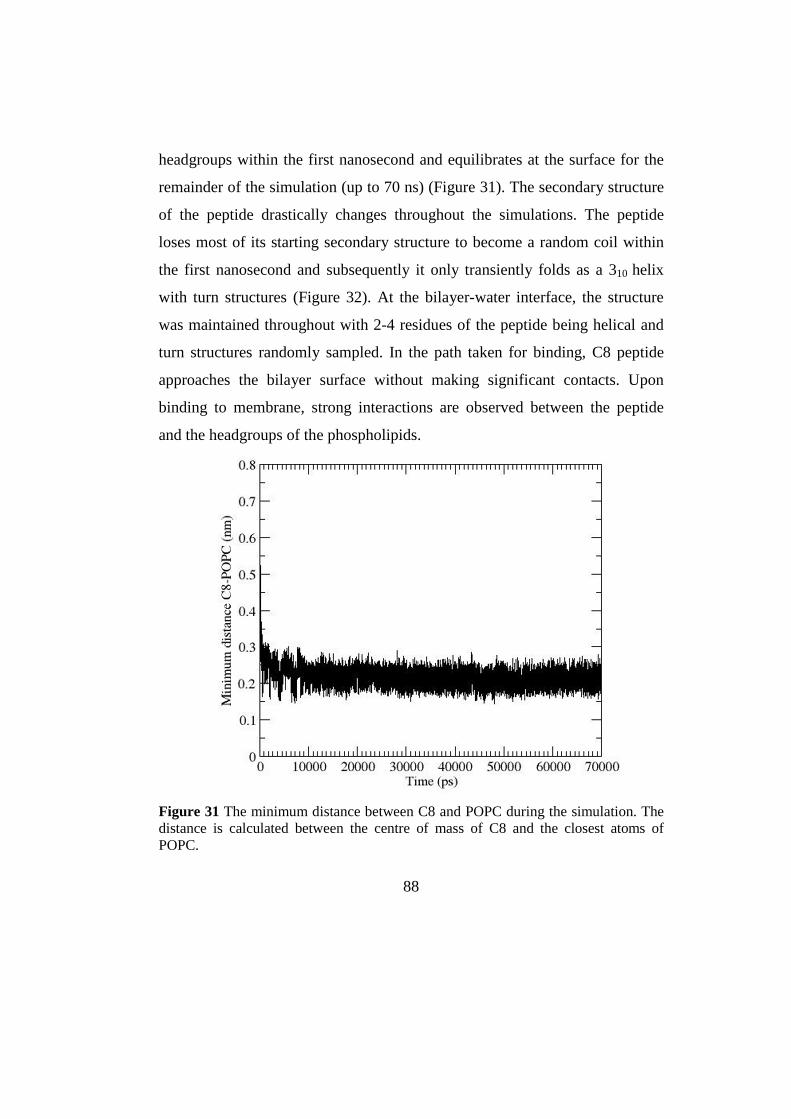
88
headgroups within the first nanosecond and equilibrates at the surface for the
remainder of the simulation (up to 70 ns) (Figure 31). The secondary structure
of the peptide drastically changes throughout the simulations. The peptide
loses most of its starting secondary structure to become a random coil within
the first nanosecond and subsequently it only transiently folds as a 310 helix
with turn structures (Figure 32). At the bilayer-water interface, the structure
was maintained throughout with 2-4 residues of the peptide being helical and
turn structures randomly sampled. In the path taken for binding, C8 peptide
approaches the bilayer surface without making significant contacts. Upon
binding to membrane, strong interactions are observed between the peptide
and the headgroups of the phospholipids.
Figure 31 The minimum distance between C8 and POPC during the simulation. The distance is calculated between the centre of mass of C8 and the closest atoms of POPC.
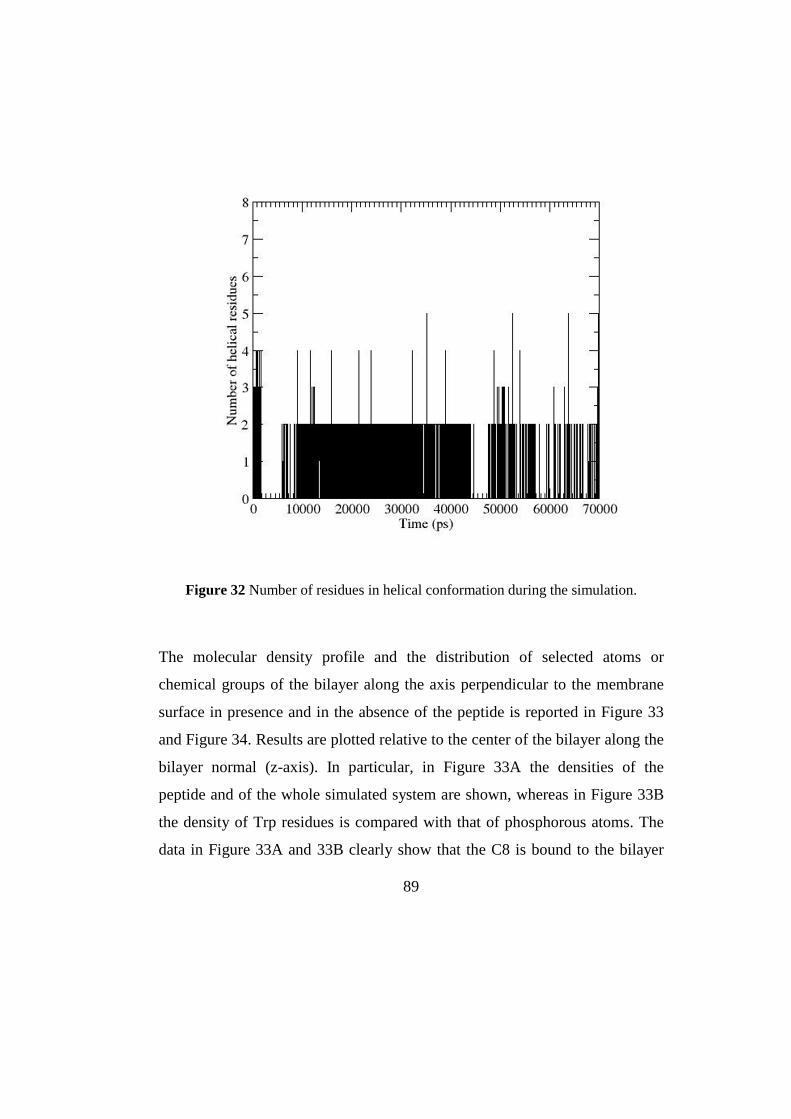
89
Figure 32 Number of residues in helical conformation during the simulation.
The molecular density profile and the distribution of selected atoms or
chemical groups of the bilayer along the axis perpendicular to the membrane
surface in presence and in the absence of the peptide is reported in Figure 33
and Figure 34. Results are plotted relative to the center of the bilayer along the
bilayer normal (z-axis). In particular, in Figure 33A the densities of the
peptide and of the whole simulated system are shown, whereas in Figure 33B
the density of Trp residues is compared with that of phosphorous atoms. The
data in Figure 33A and 33B clearly show that the C8 is bound to the bilayer
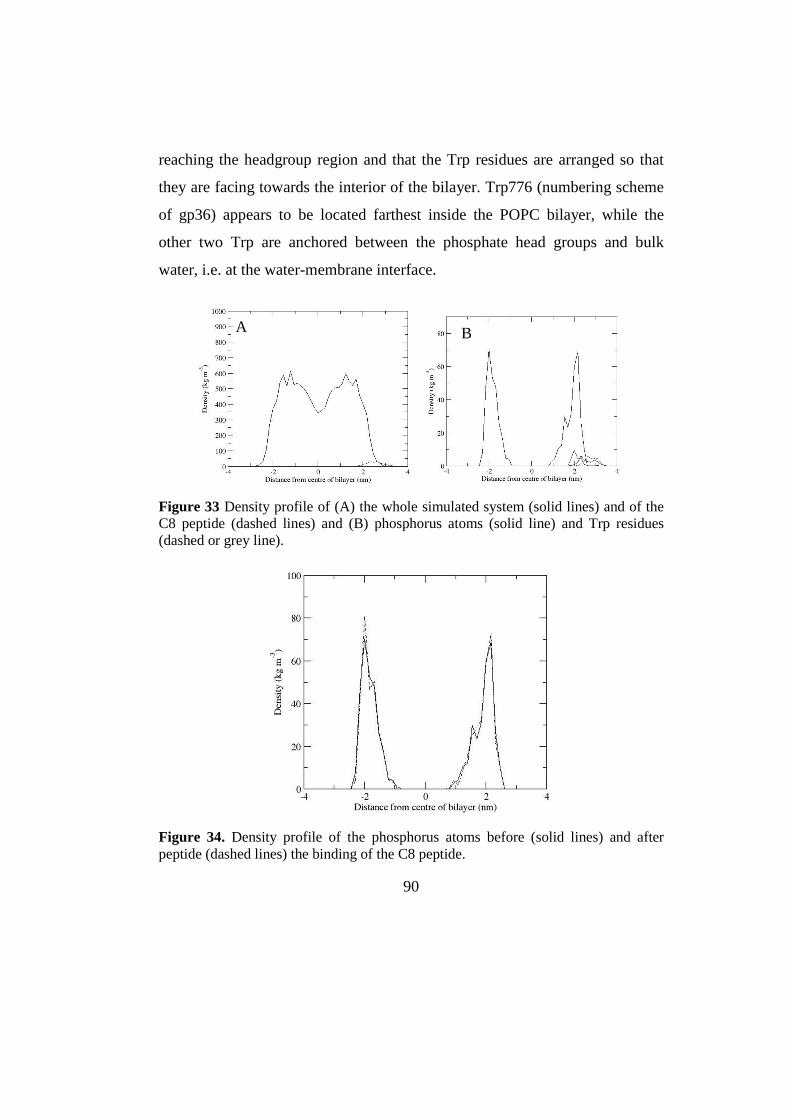
90
reaching the headgroup region and that the Trp residues are arranged so that
they are facing towards the interior of the bilayer. Trp776 (numbering scheme
of gp36) appears to be located farthest inside the POPC bilayer, while the
other two Trp are anchored between the phosphate head groups and bulk
water, i.e. at the water-membrane interface.
Figure 33 Density profile of (A) the whole simulated system (solid lines) and of the C8 peptide (dashed lines) and (B) phosphorus atoms (solid line) and Trp residues (dashed or grey line).
Figure 34. Density profile of the phosphorus atoms before (solid lines) and after peptide (dashed lines) the binding of the C8 peptide.
A B
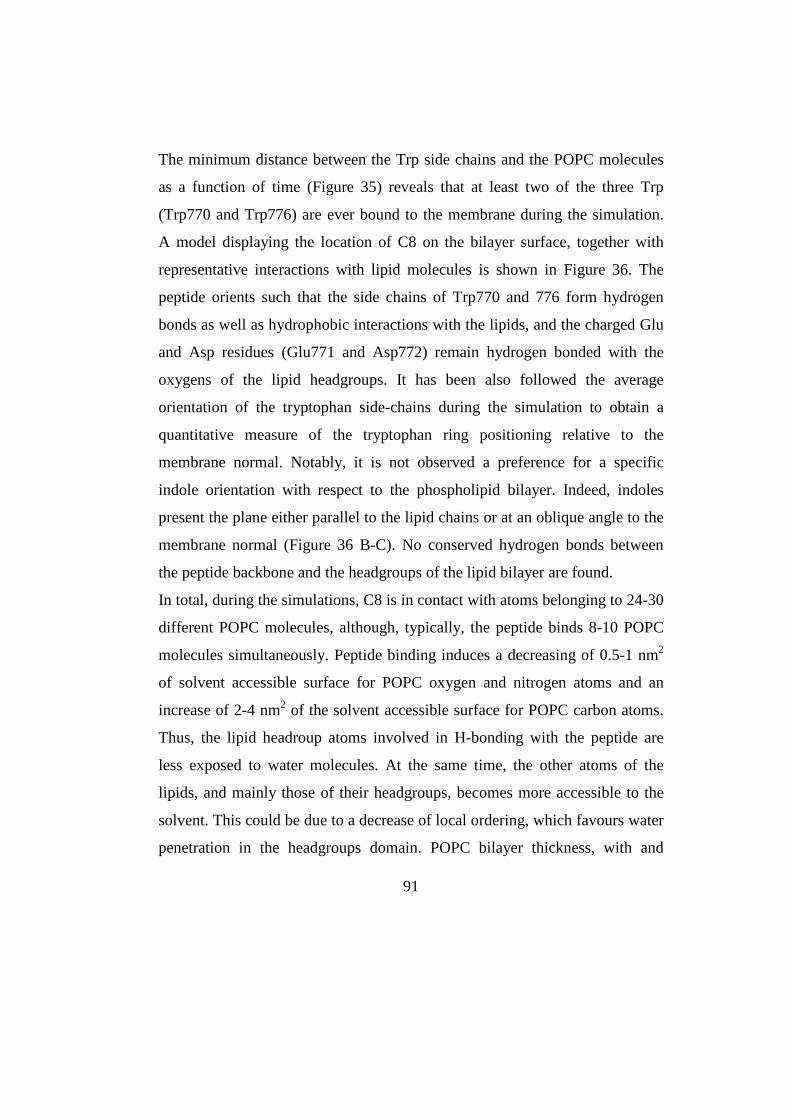
91
The minimum distance between the Trp side chains and the POPC molecules
as a function of time (Figure 35) reveals that at least two of the three Trp
(Trp770 and Trp776) are ever bound to the membrane during the simulation.
A model displaying the location of C8 on the bilayer surface, together with
representative interactions with lipid molecules is shown in Figure 36. The
peptide orients such that the side chains of Trp770 and 776 form hydrogen
bonds as well as hydrophobic interactions with the lipids, and the charged Glu
and Asp residues (Glu771 and Asp772) remain hydrogen bonded with the
oxygens of the lipid headgroups. It has been also followed the average
orientation of the tryptophan side-chains during the simulation to obtain a
quantitative measure of the tryptophan ring positioning relative to the
membrane normal. Notably, it is not observed a preference for a specific
indole orientation with respect to the phospholipid bilayer. Indeed, indoles
present the plane either parallel to the lipid chains or at an oblique angle to the
membrane normal (Figure 36 B-C). No conserved hydrogen bonds between
the peptide backbone and the headgroups of the lipid bilayer are found.
In total, during the simulations, C8 is in contact with atoms belonging to 24-30
different POPC molecules, although, typically, the peptide binds 8-10 POPC
molecules simultaneously. Peptide binding induces a decreasing of 0.5-1 nm2
of solvent accessible surface for POPC oxygen and nitrogen atoms and an
increase of 2-4 nm2 of the solvent accessible surface for POPC carbon atoms.
Thus, the lipid headroup atoms involved in H-bonding with the peptide are
less exposed to water molecules. At the same time, the other atoms of the
lipids, and mainly those of their headgroups, becomes more accessible to the
solvent. This could be due to a decrease of local ordering, which favours water
penetration in the headgroups domain. POPC bilayer thickness, with and
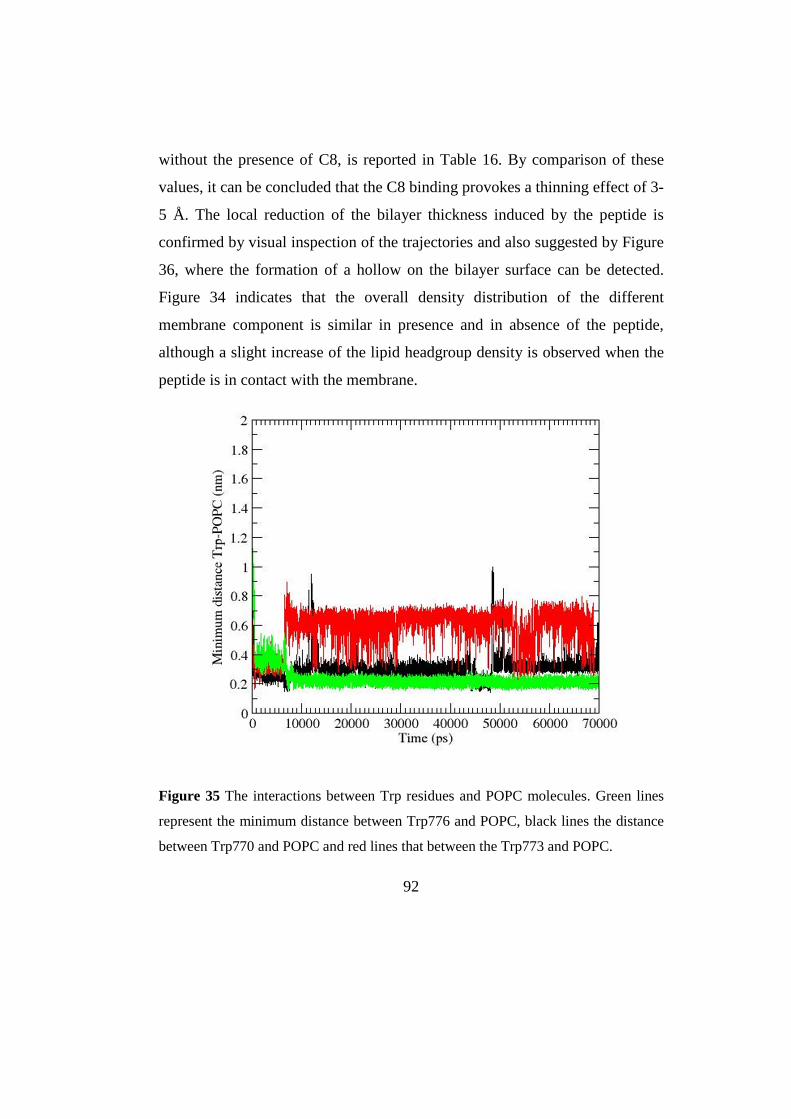
92
without the presence of C8, is reported in Table 16. By comparison of these
values, it can be concluded that the C8 binding provokes a thinning effect of 3-
5 Å. The local reduction of the bilayer thickness induced by the peptide is
confirmed by visual inspection of the trajectories and also suggested by Figure
36, where the formation of a hollow on the bilayer surface can be detected.
Figure 34 indicates that the overall density distribution of the different
membrane component is similar in presence and in absence of the peptide,
although a slight increase of the lipid headgroup density is observed when the
peptide is in contact with the membrane.
Figure 35 The interactions between Trp residues and POPC molecules. Green lines
represent the minimum distance between Trp776 and POPC, black lines the distance
between Trp770 and POPC and red lines that between the Trp773 and POPC.
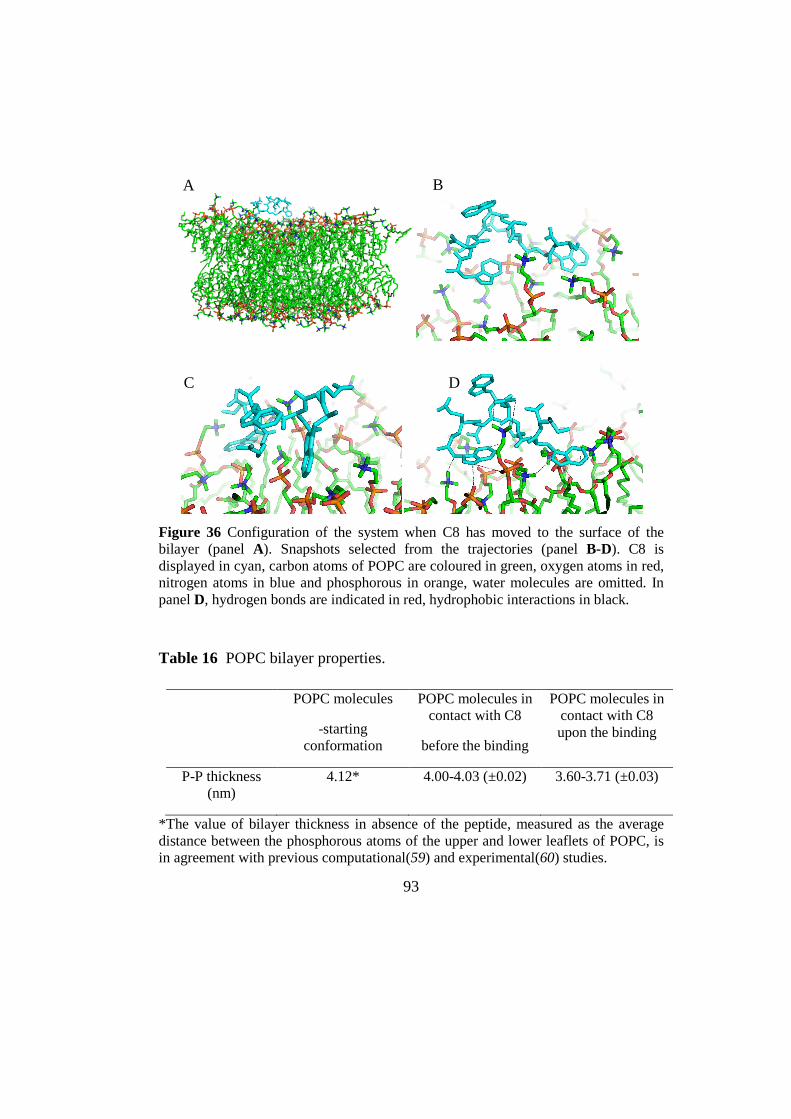
93
Figure 36 Configuration of the system when C8 has moved to the surface of the bilayer (panel A). Snapshots selected from the trajectories (panel B-D). C8 is displayed in cyan, carbon atoms of POPC are coloured in green, oxygen atoms in red, nitrogen atoms in blue and phosphorous in orange, water molecules are omitted. In panel D, hydrogen bonds are indicated in red, hydrophobic interactions in black.
Table 16 POPC bilayer properties.
POPC molecules
-starting conformation
POPC molecules in contact with C8
before the binding
POPC molecules in contact with C8 upon the binding
P-P thickness (nm)
4.12* 4.00-4.03 (±0.02) 3.60-3.71 (±0.03)
*The value of bilayer thickness in absence of the peptide, measured as the average distance between the phosphorous atoms of the upper and lower leaflets of POPC, is in agreement with previous computational(59) and experimental(60) studies.
A B
C D
94
The local increase of the lipid packing density in the bilayer upon C8 binding
reflects in the dynamics of the lipid molecules. C8 creates a local tension on
the lipid, reducing the mobility of the lipid chains. The calculated order
parameters of the lipids in direct contact with the peptide compared with those
of the other lipids constituting the bilayer are reported in Figure 37A. For
POPC molecules in contact with C8, calculated values are slightly higher in
magnitude (indicating more order in the system), particularly for the last atoms
of the chain. Similar results have been obtained comparing the root mean
square deviations of POPC molecules in the presence and in the absence of the
peptide. Interestingly, a slightly different effect of peptide binding on the two
monolayers is also observed. In fact, inspection of Figure 37B shows that, in
the peptide-bound leaflet, acyl chain mobility is slightly higher close to the
interface and somewhat lower in more internal region.
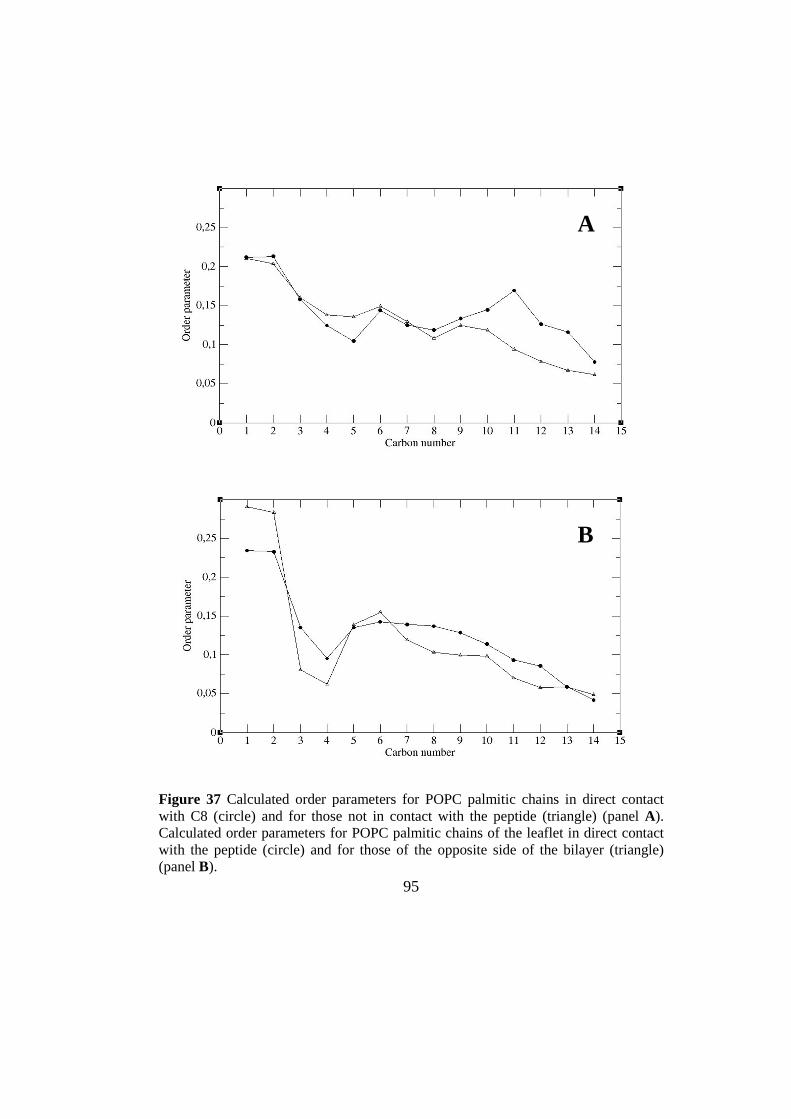
95
Figure 37 Calculated order parameters for POPC palmitic chains in direct contact with C8 (circle) and for those not in contact with the peptide (triangle) (panel A). Calculated order parameters for POPC palmitic chains of the leaflet in direct contact with the peptide (circle) and for those of the opposite side of the bilayer (triangle) (panel B).
B
A
96
3.2.4 Discussion
C8 is an octapeptide deriving from MPER domain of FIV gp36. The protein
domain corresponding to the C8 sequence has been hypothesized to exert a
destabilizing effect on the target-cell membrane, favouring its fusion with the
viral envelope. The presence of three Trp residues and their spatial
arrangement has been found to be essential to promote the C8 interaction with
lipid membranes.(27) However, to date the experimental approaches used do
not have the necessary resolution to determine the atomic details of the
interaction between the peptide and the lipids, and consequently the
mechanism trough which the peptide originates lipid bilayer perturbation
remains unknown. In this work, we investigate the C8-lipid interactions
combining a variety of experimental techniques with MD simulations. In
particular, in our computations both the peptide and the lipids are considered
at the atomistic level, thus allowing to analyze not only changes in peptide
conformation, but also perturbations in lipid packing due to peptide-bilayer
interaction.
Concerning experimental data, we use: i. CD to explore the general C8
conformational preferences in response to different membrane mimicking
systems; ii. NMR to study the conformational behaviour of C8 in membrane
mimicking system made up of micelle solution of SDS, DPC and DPC/SDS;
iii. spectrofluorimetry to highlight the polarity of the microenvironment
experienced by the Trp residues and to estimate the stoichiometry of the
peptide-lipid interaction, iv. ESR spectroscopy to detect perturbations in lipid
structuring and dynamics.
97
The combined analysis of the results obtained by the different experimental
and computational approaches techniques and MD data allows to obtain a
complete description of the system structure and behaviour at molecular level.
NMR and CD data show that C8 secondary structure changes moving from
water to membrane mimicking environments represented by SDS, DPC and
DPC/SDS micelle solution respectively. In particular this effect is significant
in the presence of micellar concentrations of zwitterionic DPC surfactant
where an evident modification of CD spectra is detectable, corresponding to
the conformational transition of C8 from random coil to turn-helical
structures. The conformational modification of C8 is also observable in the
variations of NH chemical shift values measured during the titration with the
different surfactants. Notably the titration with DPC induces selective
modification of NH chemical shifts, as compared to a more general
perturbation induced by SDS tensioactive. This observation indicates that in
DPC micellar medium the conformational packing of C8 imposes selective
expositions of NH protons to the solvent. The calculation of 3D models based
on NMR data shows that in the three different micelle solutions C8 has a
propensity to assume turn-helical conformations. Confirming CD data, this
tendency is particular evident in DPC and in DPC/SDS mixed micelles,
where the peptide is arranged in type I β-turn structures along all the sequence.
NMR structures are characterized by ordered orientation of the side chains. In
particular non-parallel orientation of Trp1 and Trp4 indolyl rings, form an
“umbrella” surface to protect the backbone of Glu3 from the contact with the
solvent. This exposition of the side chains, accounts for the constant values of
NH chemical shifts observed for Glu3 residue during surfactant titration,
moreover suggests that it may be the surface responsible for the absoption of
98
C8 on the external surface of bilayer. Fluorescence and MD results confirm
these data, indicating that Trp residues remain exposed to the external aqueous
medium. In particular MD data shows that Trp form hydrogen bonds with the
phospholipid headgroup, targeting this residue to interfacial region between
water and the hydrophobic core of the bilayer, thus hampering a deep insertion
of C8 into the membrane. MD simulations also show that the three C8 Trp
residues are important in directing and anchoring the peptide to the membrane
interface. We do not find a preferential orientation of the indole plane with
respect to the membrane bilayer. But according to NMR conformational
analysis, upon membrane binding, C8 tends to assume a turn-helical
conformation. Because of the short peptide sequence, the secondary structure
dynamically changes with time, nevertheless a strict interplay between peptide
conformation and its membrane-interacting ability is observable.
A C8 molecule interacts with an average of 6-10 lipids simultaneously. This is
shown by both fluorescence and MD data. However simulations point out that
a total of 24-30 different POPC molecules come in contact with the peptide.
The peptide affects lipids order and dynamics. The peptide effect propagates
along the lipid acyl chain till the deep interior of the bilayer. In particular, both
the ESR and MD data clearly show that the presence of the peptide induces a
reduction of the segmental acyl chain mobility for n ≥ 5-8. As a result of the
peptide adsorption, a local reduction of the bilayer thickness by 2-5 Å is
detected. In more details, MD results specify that the peptide adsorption
perturbs the lipid packing and mobility in the bilayer leaflet in direct contact
with the peptide, the opposite one being less perturbed. This marked
asymmetry of the bilayer originates a sort of invagination, as well detectable in
the MD simulation shown in Fig. 36A. Thus our results definitely highlight

99
that changes in the POPC microstructuring due to the C8 interaction reflect on
the lipid bilayer mesostructure.
100
CHAPTER 4
CONCLUSIONS
The experimental strategy set up for this study, has proved to be extremely
informative of the miscrostructure and dynamics of complex systems such as
lipid membranes interacting with peptides/proteins. Particularly, MD
simulations have been found to be a valuable tool to rationalize all the
experimental results obtained by NMR, CD, ESR and fluorescence
spectroscopy. The findings of the present work could help in shedding light on
the mechanism through which viral glycoproteins help to overcome the
energetic barrier inherent with the fusion between the target cell plasma
membrane and the viral envelope, and particularly on the role played by the
MPER protein domain in the process. Our data suggest that lipid bilayer
destabilization could be a consequence of the asymmetric perturbation of the
bilayer that starts with an increased hydration of lipid headgroups coupled to
an increase of lipid ordering in the leaflet exposed to the approaching viral
glycoprotein. In particular, since water organization at membrane interface has
been proposed to control the fusion dynamics, the increment of bilayer
hydration could be a fundamental part of role played by the MPER fusion
protein domain during the process.
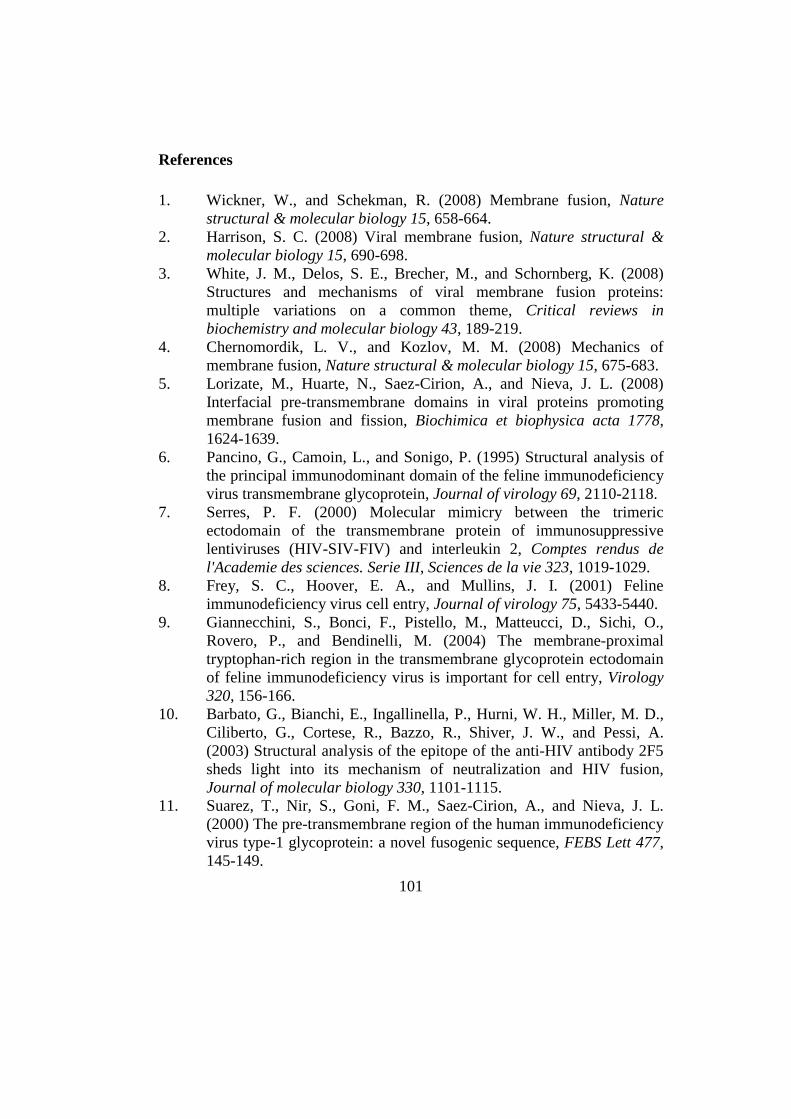
101
References
1. Wickner, W., and Schekman, R. (2008) Membrane fusion, Nature structural & molecular biology 15, 658-664.
2. Harrison, S. C. (2008) Viral membrane fusion, Nature structural & molecular biology 15, 690-698.
3. White, J. M., Delos, S. E., Brecher, M., and Schornberg, K. (2008) Structures and mechanisms of viral membrane fusion proteins: multiple variations on a common theme, Critical reviews in biochemistry and molecular biology 43, 189-219.
4. Chernomordik, L. V., and Kozlov, M. M. (2008) Mechanics of membrane fusion, Nature structural & molecular biology 15, 675-683.
5. Lorizate, M., Huarte, N., Saez-Cirion, A., and Nieva, J. L. (2008) Interfacial pre-transmembrane domains in viral proteins promoting membrane fusion and fission, Biochimica et biophysica acta 1778, 1624-1639.
6. Pancino, G., Camoin, L., and Sonigo, P. (1995) Structural analysis of the principal immunodominant domain of the feline immunodeficiency virus transmembrane glycoprotein, Journal of virology 69, 2110-2118.
7. Serres, P. F. (2000) Molecular mimicry between the trimeric ectodomain of the transmembrane protein of immunosuppressive lentiviruses (HIV-SIV-FIV) and interleukin 2, Comptes rendus de l'Academie des sciences. Serie III, Sciences de la vie 323, 1019-1029.
8. Frey, S. C., Hoover, E. A., and Mullins, J. I. (2001) Feline immunodeficiency virus cell entry, Journal of virology 75, 5433-5440.
9. Giannecchini, S., Bonci, F., Pistello, M., Matteucci, D., Sichi, O., Rovero, P., and Bendinelli, M. (2004) The membrane-proximal tryptophan-rich region in the transmembrane glycoprotein ectodomain of feline immunodeficiency virus is important for cell entry, Virology 320, 156-166.
10. Barbato, G., Bianchi, E., Ingallinella, P., Hurni, W. H., Miller, M. D., Ciliberto, G., Cortese, R., Bazzo, R., Shiver, J. W., and Pessi, A. (2003) Structural analysis of the epitope of the anti-HIV antibody 2F5 sheds light into its mechanism of neutralization and HIV fusion, Journal of molecular biology 330, 1101-1115.
11. Suarez, T., Nir, S., Goni, F. M., Saez-Cirion, A., and Nieva, J. L. (2000) The pre-transmembrane region of the human immunodeficiency virus type-1 glycoprotein: a novel fusogenic sequence, FEBS Lett 477, 145-149.
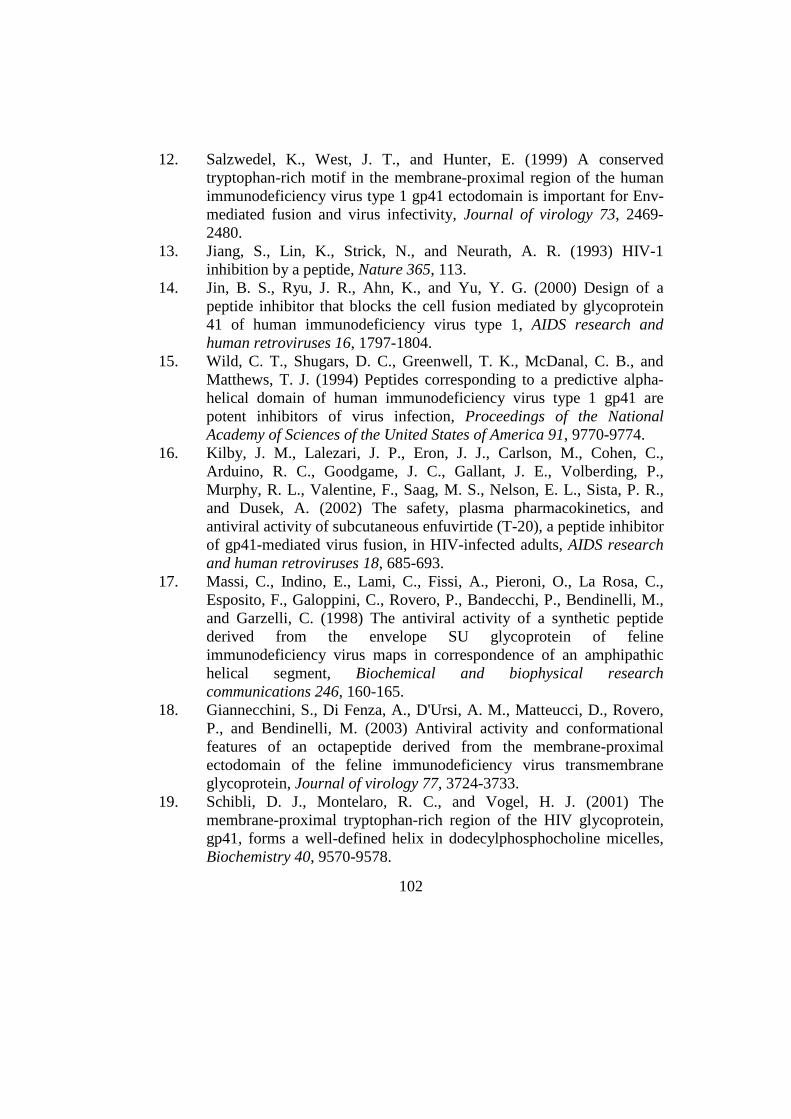
102
12. Salzwedel, K., West, J. T., and Hunter, E. (1999) A conserved tryptophan-rich motif in the membrane-proximal region of the human immunodeficiency virus type 1 gp41 ectodomain is important for Env-mediated fusion and virus infectivity, Journal of virology 73, 2469-2480.
13. Jiang, S., Lin, K., Strick, N., and Neurath, A. R. (1993) HIV-1 inhibition by a peptide, Nature 365, 113.
14. Jin, B. S., Ryu, J. R., Ahn, K., and Yu, Y. G. (2000) Design of a peptide inhibitor that blocks the cell fusion mediated by glycoprotein 41 of human immunodeficiency virus type 1, AIDS research and human retroviruses 16, 1797-1804.
15. Wild, C. T., Shugars, D. C., Greenwell, T. K., McDanal, C. B., and Matthews, T. J. (1994) Peptides corresponding to a predictive alpha-helical domain of human immunodeficiency virus type 1 gp41 are potent inhibitors of virus infection, Proceedings of the National Academy of Sciences of the United States of America 91, 9770-9774.
16. Kilby, J. M., Lalezari, J. P., Eron, J. J., Carlson, M., Cohen, C., Arduino, R. C., Goodgame, J. C., Gallant, J. E., Volberding, P., Murphy, R. L., Valentine, F., Saag, M. S., Nelson, E. L., Sista, P. R., and Dusek, A. (2002) The safety, plasma pharmacokinetics, and antiviral activity of subcutaneous enfuvirtide (T-20), a peptide inhibitor of gp41-mediated virus fusion, in HIV-infected adults, AIDS research and human retroviruses 18, 685-693.
17. Massi, C., Indino, E., Lami, C., Fissi, A., Pieroni, O., La Rosa, C., Esposito, F., Galoppini, C., Rovero, P., Bandecchi, P., Bendinelli, M., and Garzelli, C. (1998) The antiviral activity of a synthetic peptide derived from the envelope SU glycoprotein of feline immunodeficiency virus maps in correspondence of an amphipathic helical segment, Biochemical and biophysical research communications 246, 160-165.
18. Giannecchini, S., Di Fenza, A., D'Ursi, A. M., Matteucci, D., Rovero, P., and Bendinelli, M. (2003) Antiviral activity and conformational features of an octapeptide derived from the membrane-proximal ectodomain of the feline immunodeficiency virus transmembrane glycoprotein, Journal of virology 77, 3724-3733.
19. Schibli, D. J., Montelaro, R. C., and Vogel, H. J. (2001) The membrane-proximal tryptophan-rich region of the HIV glycoprotein, gp41, forms a well-defined helix in dodecylphosphocholine micelles, Biochemistry 40, 9570-9578.
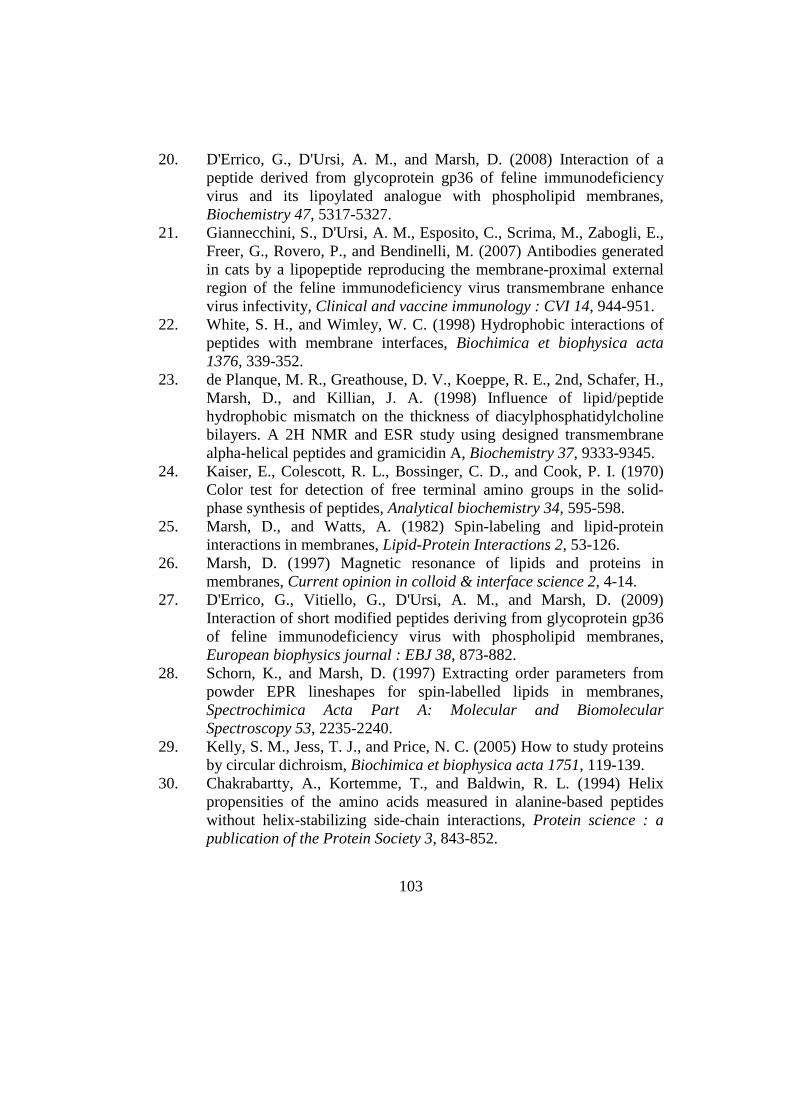
103
20. D'Errico, G., D'Ursi, A. M., and Marsh, D. (2008) Interaction of a peptide derived from glycoprotein gp36 of feline immunodeficiency virus and its lipoylated analogue with phospholipid membranes, Biochemistry 47, 5317-5327.
21. Giannecchini, S., D'Ursi, A. M., Esposito, C., Scrima, M., Zabogli, E., Freer, G., Rovero, P., and Bendinelli, M. (2007) Antibodies generated in cats by a lipopeptide reproducing the membrane-proximal external region of the feline immunodeficiency virus transmembrane enhance virus infectivity, Clinical and vaccine immunology : CVI 14, 944-951.
22. White, S. H., and Wimley, W. C. (1998) Hydrophobic interactions of peptides with membrane interfaces, Biochimica et biophysica acta 1376, 339-352.
23. de Planque, M. R., Greathouse, D. V., Koeppe, R. E., 2nd, Schafer, H., Marsh, D., and Killian, J. A. (1998) Influence of lipid/peptide hydrophobic mismatch on the thickness of diacylphosphatidylcholine bilayers. A 2H NMR and ESR study using designed transmembrane alpha-helical peptides and gramicidin A, Biochemistry 37, 9333-9345.
24. Kaiser, E., Colescott, R. L., Bossinger, C. D., and Cook, P. I. (1970) Color test for detection of free terminal amino groups in the solid-phase synthesis of peptides, Analytical biochemistry 34, 595-598.
25. Marsh, D., and Watts, A. (1982) Spin-labeling and lipid-protein interactions in membranes, Lipid-Protein Interactions 2, 53-126.
26. Marsh, D. (1997) Magnetic resonance of lipids and proteins in membranes, Current opinion in colloid & interface science 2, 4-14.
27. D'Errico, G., Vitiello, G., D'Ursi, A. M., and Marsh, D. (2009) Interaction of short modified peptides deriving from glycoprotein gp36 of feline immunodeficiency virus with phospholipid membranes, European biophysics journal : EBJ 38, 873-882.
28. Schorn, K., and Marsh, D. (1997) Extracting order parameters from powder EPR lineshapes for spin-labelled lipids in membranes, Spectrochimica Acta Part A: Molecular and Biomolecular Spectroscopy 53, 2235-2240.
29. Kelly, S. M., Jess, T. J., and Price, N. C. (2005) How to study proteins by circular dichroism, Biochimica et biophysica acta 1751, 119-139.
30. Chakrabartty, A., Kortemme, T., and Baldwin, R. L. (1994) Helix propensities of the amino acids measured in alanine-based peptides without helix-stabilizing side-chain interactions, Protein science : a publication of the Protein Society 3, 843-852.
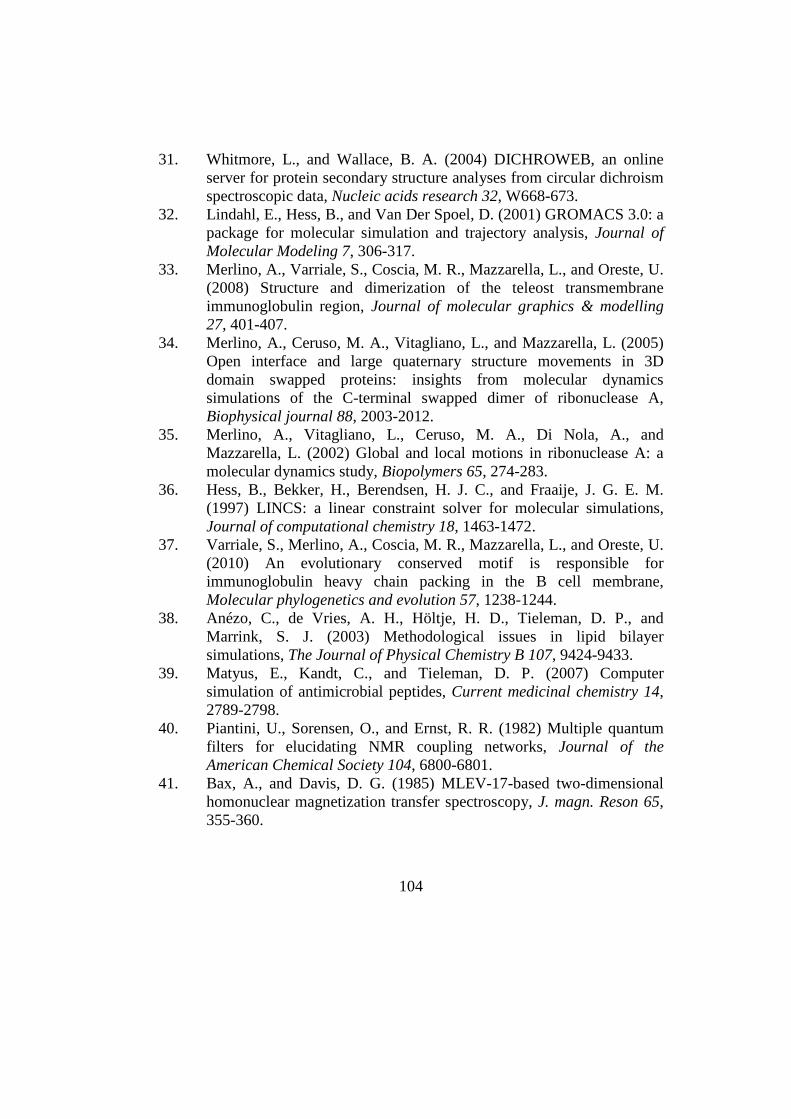
104
31. Whitmore, L., and Wallace, B. A. (2004) DICHROWEB, an online server for protein secondary structure analyses from circular dichroism spectroscopic data, Nucleic acids research 32, W668-673.
32. Lindahl, E., Hess, B., and Van Der Spoel, D. (2001) GROMACS 3.0: a package for molecular simulation and trajectory analysis, Journal of Molecular Modeling 7, 306-317.
33. Merlino, A., Varriale, S., Coscia, M. R., Mazzarella, L., and Oreste, U. (2008) Structure and dimerization of the teleost transmembrane immunoglobulin region, Journal of molecular graphics & modelling 27, 401-407.
34. Merlino, A., Ceruso, M. A., Vitagliano, L., and Mazzarella, L. (2005) Open interface and large quaternary structure movements in 3D domain swapped proteins: insights from molecular dynamics simulations of the C-terminal swapped dimer of ribonuclease A, Biophysical journal 88, 2003-2012.
35. Merlino, A., Vitagliano, L., Ceruso, M. A., Di Nola, A., and Mazzarella, L. (2002) Global and local motions in ribonuclease A: a molecular dynamics study, Biopolymers 65, 274-283.
36. Hess, B., Bekker, H., Berendsen, H. J. C., and Fraaije, J. G. E. M. (1997) LINCS: a linear constraint solver for molecular simulations, Journal of computational chemistry 18, 1463-1472.
37. Varriale, S., Merlino, A., Coscia, M. R., Mazzarella, L., and Oreste, U. (2010) An evolutionary conserved motif is responsible for immunoglobulin heavy chain packing in the B cell membrane, Molecular phylogenetics and evolution 57, 1238-1244.
38. Anézo, C., de Vries, A. H., Höltje, H. D., Tieleman, D. P., and Marrink, S. J. (2003) Methodological issues in lipid bilayer simulations, The Journal of Physical Chemistry B 107, 9424-9433.
39. Matyus, E., Kandt, C., and Tieleman, D. P. (2007) Computer simulation of antimicrobial peptides, Current medicinal chemistry 14, 2789-2798.
40. Piantini, U., Sorensen, O., and Ernst, R. R. (1982) Multiple quantum filters for elucidating NMR coupling networks, Journal of the American Chemical Society 104, 6800-6801.
41. Bax, A., and Davis, D. G. (1985) MLEV-17-based two-dimensional homonuclear magnetization transfer spectroscopy, J. magn. Reson 65, 355-360.
105
42. Jeener, J., Meier, B., Bachmann, P., and Ernst, R. R. (1979) Investigation of exchange processes by two�dimensional NMR spectroscopy, The Journal of Chemical Physics 71, 4546.
43. Piotto, M., Saudek, V., and Sklenář, V. (1992) Gradient-tailored excitation for single-quantum NMR spectroscopy of aqueous solutions, Journal of biomolecular NMR 2, 661-665.
44. Goddard, T., and Kneller, D. (2004) SPARKY 3, University of California, San Francisco.
45. Güntert, P., Mumenthaler, C., and Wüthrich, K. (1997) Torsion angle dynamics for NMR structure calculation with the new program D1, Journal of molecular biology 273, 283-298.
46. Pearlman, D. A., Case, D. A., Caldwell, J. W., Ross, W. S., Cheatham, T. E., DeBolt, S., Ferguson, D., Seibel, G., and Kollman, P. (1995) AMBER, a package of computer programs for applying molecular mechanics, normal mode analysis, molecular dynamics and free energy calculations to simulate the structural and energetic properties of molecules, Computer Physics Communications 91, 1-41.
47. Case, D. A., Pearlman, D. A., Caldwell, J. W., Cheatham III, T. E., Wang, J., Ross, W. S., Simmerling, C., Darden, T., Merz, K. M., and Stanton, R. V. (2002) AMBER 7, University of California, San Francisco.
48. Kapica, M., Zabielska, M., Puzio, I., Jankowska, A., Kato, I., Kuwahara, A., and Zabielski, R. (2007) Obestatin stimulates the secretion of pancreatic juice enzymes through a vagal pathway in anaesthetized rats-preliminary results, Journal of Physiology and Pharmacology 58, 123.
49. Mitchell, T. W., Ekroos, K., Blanksby, S. J., Hulbert, A. J., and Else, P. L. (2007) Differences in membrane acyl phospholipid composition between an endothermic mammal and an ectothermic reptile are not limited to any phospholipid class, The Journal of experimental biology 210, 3440-3450.
50. Galdiero, S., Falanga, A., Vitiello, G., Vitiello, M., Pedone, C., D'Errico, G., and Galdiero, M. (2010) Role of membranotropic sequences from herpes simplex virus type I glycoproteins B and H in the fusion process, Biochimica et Biophysica Acta (BBA)-Biomembranes 1798, 579-591.
51. Spadaccini, R., D'Errico, G., D'Alessio, V., Notomista, E., Bianchi, A., Merola, M., and Picone, D. (2010) Structural characterization of the transmembrane proximal region of the hepatitis C virus E1
106
glycoprotein, Biochimica et Biophysica Acta (BBA)-Biomembranes 1798, 344-353.
52. Gordon, L. M., Curtain, C. C., Zhong, Y. C., Kirkpatrick, A., Mobley, P. W., and Waring, A. J. (1992) The amino-terminal peptide of HIV-1 glycoprotein 41 interacts with human erythrocyte membranes: peptide conformation, orientation and aggregation, Biochimica et biophysica acta 1139, 257-274.
53. Curtain, C., Separovic, F., Nielsen, K., Craik, D., Zhong, Y., and Kirkpatrick, A. (1999) The interactions of the N-terminal fusogenic peptide of HIV-1 gp41 with neutral phospholipids, European biophysics journal : EBJ 28, 427-436.
54. Marsh, D. (2010) Electron spin resonance in membrane research: protein–lipid interactions from challenging beginnings to state of the art, European Biophysics Journal 39, 513-525.
55. Vacklin, H. P., Tiberg, F., Fragneto, G., and Thomas, R. K. (2005) Phospholipase A2 hydrolysis of supported phospholipid bilayers: a neutron reflectivity and ellipsometry study, Biochemistry 44, 2811-2821.
56. Ambrosone, L., D'Errico, G., and Ragone, R. (1997) Interaction of tryptophan and N-acetyltryptophanamide with dodecylpentaoxyethyleneglycol ether micelles, Spectrochimica Acta Part A: Molecular and Biomolecular Spectroscopy 53, 1615-1620.
57. Wesson, L., and Eisenberg, D. (1992) Atomic solvation parameters applied to molecular dynamics of proteins in solution, Protein science : a publication of the Protein Society 1, 227-235.
58. Wuthrich, K. (1986) NMR of proteins and nucleic acids, Wiley. 59. Vaccaro, L., Cross, K. J., Kleinjung, J., Straus, S. K., Thomas, D. J.,
Wharton, S. A., Skehel, J. J., and Fraternali, F. (2005) Plasticity of influenza haemagglutinin fusion peptides and their interaction with lipid bilayers, Biophysical journal 88, 25-36.
60. Kinoshita, K., Furuike, S., and Yamazaki, M. (1998) Intermembrane distance in multilamellar vesicles of phosphatidylcholine depends on the interaction free energy between solvents and the hydrophilic segments of the membrane surface, Biophys Chem 74, 237-249.