fronts, jets, and counter-flows in the western iberian upwelling … · fronts, jets, and...
TRANSCRIPT

J O U R N A L O F
M A R I N E S Y S T E M S
ELSEVIER Journal of Marine Systems 35 (2002) 61-77www. elsevier. com/locate/j marsy s
Fronts, jets, and counter-flows in the Western Iberian upwelling system
Alvaro Peliz, Teresa L. Rosa, A. Miguel P. Santos*, Joaquim L. PissarraInstituto de Investigagäo das Pescas e do Mar (IPIMAR), IPIMAR-DAA, Av. de Brasilia, 1449-006 Lisbon, Portugal
Received 13 April 2000; accepted 30 January 2002
Abstract
The results o f a fine resolution hydrology survey conducted off the northern Portuguese coast at the end o f the upwelling season are presented. The most striking features were the upwelling front and the associated southward jet. Counter-flows were detected both over the slope and at the inner-shelf. The southward current is surface intensified with maximum values o f about 40 cm s ~~ 1 and diverges to the south o f the observed area recirculating both onshore and offshore. Along the slope, a warmer and saltier poleward current interacts with the je t generating an anticyclonic eddy about the Aveiro Canyon. Possible mechanisms o f topographic forcing and filament development in the zone are discussed. Inshore, a coastal current advects warmer water northward creating a second front at the inner-shelf. The surface layers to the coastal side of the upwelling front are dominated by a low salinity lens, which we proposed to name the Western Iberia Buoyant Plume (WIBP). The equatorward flow, the coastal current and the stratification input o f the WIBP introduce strong complexity into the dynamics o f this double- frontal upwelling system. The plume is stirred being partially advected to the south and offshore while entrained in the upwelling jet. On the shore side, the plume is advected to the north by the coastal counter-flow. A conceptual model o f circulation is presented. © 2002 Elsevier Science B.V. All rights reserved.
Keywords: Coastal upwelling; Jets and counter-flows; Filaments; Western Iberian Buoyant Plume (WIBP); Topographic forcing; Canyons
1. Introduction
The Western coast of the Iberian Peninsula is the northernmost limit of the Eastern North Atlantic Upwelling System. Although, in recent years, several international projects have focussed on the Eastern North Atlantic boundary processes (e.g. SEFOS, OMEX, MORENA), there is still a considerable lack of studies and published work dedicated to this partic-
Corresponding author. Tel.: +351-21-302-7193; fax: +351-21- 301-5948.
E-mail address: [email protected] (A.M.P. Santos).
ular area. Much of the existing knowledge about the upwelling off Western Iberia Coastal Transition Zone was produced using satellite imagery (e.g. Fiúza, 1983; Haynes et al., 1993; Sousa and Bricaud, 1992; Peliz and Fiúza, 1999), and few in situ studies were conducted during active and/or relaxation upwelling periods and they usually lack synopticity and/or resolution.
The Western Iberian circulation and hydrology undergo strong seasonality. Upwelling favourable winds, southward along the coast, occur typically in late spring and summer (Wooster et al., 1976; Fiúza et al., 1982), while during winter, weak northerly interspersed occasionally by strong south-southwest winds, favour coastal convergence. In the absence of
0924-7963/02/$ - see front matter © 2002 Elsevier Science B.V. All rights reserved. PII: S 0 9 2 4 -7 9 6 3 (0 2 )0 0 0 7 6 -3

62 A. Peliz et al. / Journal o f Marine Systems 35 (2002) 61-77
coastal upwelling, the surface circulation off Western Iberia is predominantly northward. This northward circulation is partially driven by meridional alongshore density gradients and assumes a character of a poleward jet transporting higher salinity and warmer (subtropical) waters over the upper slope and shelf break (e.g. Frouin et al., 1990; Haynes and Barton, 1990; Dubert, 1998).
The Azores High migrates northward in spring and the southward wind regime starts to dominate. After the first days of intense winds, coastal upwelling develops as a thin along-shore band of colder water, which is sometimes intensified at the capes. As the wind persists, finger-like structures start to develop merging gradually into larger filaments, offshore oriented, 30 to 40 km wide and up to 250 km long, which transport upwelled waters to the deep ocean.
These filaments have different shapes and dimensions and may have different dynamic origins. Haynes et al. (1993), based on SST observations off Western Iberia, suggested that those anchored to capes are probably related to topographic forcing conducting to the separation of the upwelling jet, whereas in the areas with smooth coastlines and bathymetry, they are probably related to evolution of frontal instabilities. Peliz and Fiúza (1999), in their analysis of satellite-derived phytopigment imagery in the area, also observed some qualitative differences between both types of offshore oriented high pigment concentration features. Roed and Shi (1999) investigated the generation of such structures with reduced gravity models and concluded that they do not depend on coastline or bathymetric irregularities to start developing, but shelf/slope topographic forcing is an important mechanism for the anchoring of these mesoscale structures.
Another aspect of the Northwestern Iberian coastal zone concerns the influence of the many terrestrial fresh water sources in the area (Douro, Minho and Mondego, other smaller rivers and the Galician Rias). They originate a low salinity water lens that extends along the coast. Despite the seasonal variation of runoff with significant decrease in summer, this buoyant plume is present all year round. Although it constitutes a recurrent pattem in most hydrographic data of the region, references to this structure are practically absent in scientific literature. Herein, it is proposed to refer to it as the Western Iberia Buoyant Plume (WIBP). The way it interacts and affects surface
coastal upwelling in the area constitutes a complex problem, which has never been investigated before.
This work presents the results of a high resolution survey off the Portuguese Northwest coast, made at the end of a fully developed upwelling period. The focus is essentially on: (i) the characterisation of the cross-shelf structure of hydrological and flow fields, (ii) the interaction of the upwelling jet with counter-flows at the slope and at the inner-shelf and (iii) on the distribution and role of the WIBP in the region. Although the survey was limited in its along-shore extension, some aspects of the system’s three-dimensionality are accessed with support of complementary satellite information and discussion on filament formation in the zone is conducted.
In Section 2, a description of the study area, data and methods is presented. Next (Section 3), we describe the meteorological conditions and analyse the upwelling event preceding the cruise. In Section 4, we present and analyse the data. Finally, in Section 5, the results are discussed.
2. Study area, data and methods
The cruise was conducted off the NW coast of Portugal, from 5th to 7th September 1998, on board R/V NORUEGA, in the framework of the European Union funded project “Experimental surveys for the assessment of juveniles (JUVESU)” (EC DG XIV FAIR CT97-3374). The observed area extended from near shore to approximately 9 ° 53' W between latitudes 41°11' N and 40°33' N (Fig. 1). The survey consisted of 80 stations, sampled along five sections perpendicular to the coastline. The study aimed at a fine-scale description of the hydrology and derived flow field of a very important nursery area for sardine juveniles.
The hydrology sampling occurred at the continental margin (shelf and continental slope) between Aveiro lagoon and Douro estuary, where the coastline shows an almost meridional alignment. The continental shelf is relatively wide ( ~ 60 km) and gently sloping with an edge defined by the 200-m isobath. The most significant topographic feature is the Aveiro Canyon (crossed by section III; see Fig. 1) where the slope gets very steep in just a few kilometres. The north and the southern edges of the canyon are known to be places of recurrent filament activity (Haynes et al., 1993; Sousa,

Latit
ude
(°N
)À. Peliz et al. / Journal o f Marine Systems 35 (2002) 61-77 63
(a)42
MINHO
41.5
ff. DO. )RO
AVEIRO .A G Í ON40.5
ff. M O N D EG O
39.5!d00
IODO
39 ff. TAGUS
38.5
3810.5 t 9.5 9
Longitude (°W)8.5
41.3
PORTO41.1
86 68 90 92Section I
W 102 100 9540.9
110 111 117 119 121123,125
40.7 139 1- '35 133 1311291127Section IV AVEIRO
Section V 140 141 1 4 2 /1 4 3 144 145 146 / 1 4 7 149 1 5 1 1 5 3 155
40.5
40.39.6 9.4 9.2
Longitude (°W)10.2 9.8 8.8 8.6 8.4
Fig. 1. (a) Study area (solid line box), bathymetry and main geographic sites, (b) Map of CTD stations performed during the JUVESU cmise (IPIMAR-02120998) on board R/V NORUEGA (September 1998).

64 A. Peliz et al. / Journal o f Marine Systems 35 (2002) 61-77
1995). This region is under the influence of three main rivers: Minho and Douro to the north, and Mondego to the south. The river runoff is mainly dependent on precipitation and, therefore, is higher during winter. Nevertheless, it originates a buoyant plume (WIBP) that is present all year round.
Hydrographic observations were made with a conductivity-temperature-depth (CTD) instrument (SBE 19 SEACAT Profiler S/N 1914697-2204, with submersible pump SBE 5T) in its first use after factory calibration. The sampling was adjusted to one scan every 0.5 s and a lowering rate of about 1 m s 1. Whenever allowed by bathymetry, data were obtained down to 1000-m depth, except in the stations of section I where the CTD was lowered only to 500 m due to technical problems. Water samples were collected for calibration and salinity measured in laboratory with a Guideline Autosal 8400B Salinometer.
Data processing included removal of spurious values by visualisation and low pass filtering, as well as shifting to allow for differences in sensor response times. Pressure reversals or slowdowns were excluded by disregarding all values obtained under CTD lowering speed equal or less than 0.5 m s 1. Salinity (computed using definition of UNESCO, 1983), and other derived variables (potential temperature, ae, and geopotential anomalies) were calculated after a vertical averaging in pressure intervals of 5 dbar.
The geopotential anomalies and the meridional components of the geostrophic currents were calculated assuming a level of no motion at 480 dbar. This level was chosen as a compromise between the maximum depth achieved at all stations and a matching with the thermohaline fields observed. The reference level of 300 and 350 dbar commonly used in the area (e.g. Frouinetal., 1990; Castro et al., 1994; Fiúza et al., 1998) does not seem adequate in typically convergent (downwelling) or divergent (upwelling) situations, as observed in the present study. The isopycnals clearly outcrop against the slope and density field at the 300 and 350 dbar levels has a considerable gradient, while at 480 dbar, the density field is almost homogeneous. For the upper slope, in depths shallower than the reference level of 480 dbar, the extrapolation approach of Reid and Mantyla (1976) was used.
The in situ data were complemented with analysis of AVHRR data acquired at the University of Dundee Satellite Receiving Station. AVHRR radiances were
converted in brightness temperature and geo-referenced.
3. The upwelling event preceding the survey
During August 1998, the meteorological situation was characterised by a typical summer upwelling favourable wind regime (Fig. 2). The Northwestern Iberia was under the influence of north-northeast atmospheric circulation during more than a month. Before the cruise, in the beginning of September, the prevailing north-northeast winds relaxed and south winds related to a cyclonic structure located west of the Iberian Peninsula, dominated during 6 -7 days. Afterwards, the influence of the Azores High is reestablished and by the end of the cruise, north winds prevailed (Fig. 2).
It is possible to observe the consequences of the relaxation event in the satellite imagery of 24th August and 8th September, respectively, the last and first cloud-free images before and after the survey (Fig. 3). The August image (Fig. 3a) shows that a fully developed upwelling event was occurring. A pair of filaments can be distinguished off northern Portugal ( ~ 41.3°N; ~ 42.0°N), as well as one major filament anchored to the south of the Aveiro canyon (~ 4 0 .3 ° N — called hereafter Aveiro Filament) approximately 230 km long (taking its zonal extension from the shelf break into deep ocean). These filaments are typical recurrent features observed off the Iberian Peninsula late in the upwelling season. While the two northern ones are related to topographic forcing, the dominant dynamical process involved in the formation of the Aveiro Filament is supposed to be flow instability resulting from the meandering of the southward flowing current (Haynes et al., 1993).
A zonal banding in temperature is noticeable to the south of Porto. A cold band along the upper slope and outer shelf separates offshore waters from inner-shelf warm waters. This banding appears with the change in coastline orientation located at the northern limit of the surveyed area, which is coincident with the Douro River estuary. The outer most limit of the cold upwelled water is located close to the offshore limit of the surveyed area.
The 8th September image obtained 1 day after the end of the cruise (Fig. 3b) reveals that changes have

A. Peliz et al. / Journal o f Marine Systems 35 (2002) 61-77
Cruise
65
EuS -5
Cabo Carvoeiro
1 3 5 7 9 11 13 15 17 19 21 23 25 27 29 31August 1998 (day)
2 4 6 8 10 12 14 16 Septem ber 1998 (day)
Fig. 2. Stick diagram of wind (m s ' ) measured at Cabo Carvoeiro (9.40 °W; 39.36°N) by the Portuguese Meteorological Office between 1st August and 15th September 1998 (negative values correspond to north winds).
occurred in the meteorological conditions modifying the surface temperature signature of the upwelling features. Fog and clouds, mainly in its northwest comer, significantly affected the image. Nevertheless, it is possible to observe that the surface signature of the filaments has dissipated and the offshore limit of the upwelling front has moved shoreward. Even if the Aveiro Filament can no longer be identified, it is still possible to notice a weakened zonal banding in surface temperature distribution.
In conclusion, from this analysis, it is evident that a very strong and fully developed upwelling event occurred during August 1998 but a short relaxation period took place just before the cmise affecting the intensity of the structures at the time of the survey.
4. Results
4.1. Water masses
The 6 —S diagram of all the CTD data obtained during the cmise is presented in Fig. 4 and therein, we identify the presence of three main water mass groups: Surface, Central and Intermediate-Mediterranean Water.
The variability in the near-surface waters, defined as dp <26.6, reflects both the presence of coastal upwelling and the strong influence of river mnoff. The large temperature gradient with surface values varying between 14 °C and more than 20 ° C corresponds to the outcrop of a well-stratified surface water column with a strong thermocline below a thin mixed layer typical of summer conditions. Low salinity values (<35.7 psu) correspond to the coastal stations generally with depths less than 150 m. The river mnoff influence is particularly clear in stations 86 to 93 of the northernmost section (41.0°N), where salinity minimum values of less than 35.25 psu are present (Figs. 4 and 5b).
The upper limit of the central waters is identified by a salinity maximum found for most stations just below the pycnocline between dp = 26.7 and dp = 26.6, with values varying between 36.0 and 36.12 psu (e.g. station 78 of Fig. 4). Due to their low salinity maximum (35.9 psu for dp = 26.75), two stations (75 and 76) standout in Fig. 4. These stations have central water values shifted towards low salinity as well.
According to Rios et al. (1992), two types of central waters can be identified off Western Iberia: Eastern North Atlantic Water of subpolar origin (ENAWsp)

40°N
41
°N _
l 40
°N
41 °N
66 A. Peliz et al. / Journal o f Marine Systems 35 (2002) 61-77
12°W 11°W 10°W 9°W 8°W
4.5 15.4 16.2 17.1 1812°W 11°W 10°W 9°W
14.5 15.4 16.2 17.1 18Fig. 3. AVFIRR Channel 4 brightness temperatures of the Western Iberian coast, (a) NOAA-14 in 24/08/98 at 03:58 UTM; (b) NOAA-14 in 08/ 09/98 at 04:32 UTM. The HRPT data were received at the Dundee Satellite Receiving Station and processed at IPIMAR.
NoOt
? N
at-
NaOf
r N
at?

À. Peliz et al. / Journal o f Marine Systems 35 (2002) 61-77 67
20
19
18
S '°— 17
CD 1 '
3 CÖ© 16 Q_ E(DÍI 15 a 'd I 14o Cl
13
12
11
35 35.1 35.2 35.3 35.4 35.5 35.6 35.7 35.8 35.9 36 36.1 36.2 36.3Salinity (psu)
Fig. 4. 6 - S multiple plots of all CTD data obtained during the cmise: Central Water mass curves are represented for ENAWst— Eastern North Atlantic Central Water (subtropical branch) and ENAWsp— Eastern North Atlantic Central Water (subpolar branch). Symbols are as follows: O — stations over the shelf with less than 150-m deep; ♦ — stations with more than 150-m deep; and ★— stations between 8.7-8.9 °W. Solid thicker line corresponds to the 75 and 76 stations.
and Eastern North Atlantic Water of subtropical origin (ENAWst) (Fig. 4). ENAWsp is related with Subpolar Mode Water, which forms due to deep convection happening during Winter in the Eastern North Atlantic, north of 46 °N (McCartney and Talley, 1982 ). This water mass is advected southward and is subducted (Paillet and Arhan, 1996). The ENAWst, formed to the north of the Azores Current at approximately 35 °N, is advected northwestward, creating with ENAWsp a subsurface front characterised by intense convergence in the vicinity of Cape Finisterre between 42 °N and 44 °N (Rios et al., 1992).
The analysis of vertical salinity gradients at the central water levels enables us to define two layers. The upper one is limited above by the salinity maximum that establishes the boundary with surface waters. It is characterised by a regular salinity gradient down to approximately a g = 27.05 (which corresponds precisely to the 0 — S values pointed out by Rios et al. (1992) as being the separation between ENAWst and ENAWsp, namely 12.2 °C and 35.66 psu). The deeper limit ofthis first layer varies from about 270 m offshore to 200 m at the near coastal stations, when the 27.05 isopycnal upwells over the slope. Below these depths, within density siufaces 27.05 < a g <27.2 (approxi-
■ d o

68 À. Peliz et al. / Journal o f Marine Systems 35 (2002) 61-77
* s t
40.9
40.8
40.7
40.6
40.5
Longitude °W
35'9
40.9 S»
40.7
40.6• 35-4
¡5 c/
40.5
Longitude °W
(C)
40.9
40.6
40.5
Longitude °W
Fig. 5. Surface distributions of: (a) temperature (°C). The zone with colder waters (<18.8° C) is represented in shaded areas; (b) salinity (psu); and (c) surface geopotential anomaly (m2 s-2) relative to 480 dbar.

A. Peliz et al. / Journal o f Marine Systems 35 (2002) 61-77 69
mately the depth layer between 250 and 500 m), another layer is defined. It is characterised by a weaker vertical salinity gradient and a water column less stratified. According to Paillet and Arhan (1996), this low stratified water has been described to be related to the subduction of the “ 12 degree” mode water and consequently its I) S characteristics are closer to the ones ofthe ENAWsp (Fig. 4). Itis clear that ENAWst is the main source of upwelled waters. However, in the vicinity of the Aveiro canyon, at about 400 m deep (not shown), isopycnals down to a g = 27.15 still reveal the influence of upwelling occurrence and upwelled waters may have a deeper origin.
The two 0 — S curves corresponding to stations 75 and 76 (Fig. 4), in the northwestern most comer of the surveyed area, show a detachment at the levels of the central waters towards low salinity values. This is an indication that they are out of the influence of the northward advection of Central Water with subtropical origin.
A salinity gradient inversion is found below (7fi ~ 27.2 (at about 500-m depth), where a minimum salinity value, ranging from 35.55 psu (in station 75) to 35.65 psu in the southern stations (e.g. station 140), defines the transition between ENAWsp and modified Mediterranean Water. The maximum salinity value is found for a g ~ 27.6 (5max = 36.24 psu; T= 12.2 °C) in section V at depths of about 800 m corresponding to the upper tongue of Mediterranean Water (Ambar and Howe, 1979).
4.2. Surface distributions and circulation
The most striking feature of the surface temperature distribution is obviously the upwelling front. Fig. 5a shows the surface temperature field with the coldest upwelled waters shaded. The front is meridio- nally oriented along the mid-shelf with the strongest zonal gradient between 9.2° and 9.35°W, slightly off the 100-m isobath. A salinity front with values increasing offshore from 35.7 to 35.9 psu follows the thermal upwelling front (Fig. 5b).
The tongue of cold upwelled water with temperatures below 18.8 °C (shaded zone in Fig. 5a) is limited at the inner-shelf side by a warm intrusion with values between 19.0 and 19.8 °C. This zonal pattem in sea surface temperature (also observable in the infrared imagery) does not have a straight corre
spondence in the surface salinity field, and a single pattem of low salinity values all over the shelf was observed. That means that a part of the WIBP at the mid-shelf has lower temperatures (denser) and comes into the observed area from the north, incorporated in the upwelling jet. A warmer (lighter) part of the WIBP is being advected from the south at the inner-shelf along the coast. The value of 35.7 psu was taken as the offshore edge of this fresher plume (Fig. 5b).
At the ocean side of the thermal front, the water is warmer and saltier (20.2 °C and 36.0 psu) and a northward intrusion is inferred from the surface distributions. The flow appears to enter the observed area from the south and turn coastward at the northern part. This intrusion is related to the poleward slope current as will be discussed later.
The geopotential anomaly at the surface shows mainly a south-southwest flow between approximately 9.6°W and 9.2°W, oriented parallel to the thermal front (Fig. 5c). The cross-shore gradient of the geopotential anomalies varies meridionally, and the geopotential lines diverge to the south indicating that the jet looses intensity and branches both offshore and coastward. Part of the flow turns cyclonicaly inshore contributing to an along-coast counter-flow, at least in the south.
Offshore, a closed pattem in the lines of the geopotential anomaly reveals the presence of an anti- cyclonic eddy. This maximum in the geopotential anomaly is over the Aveiro Canyon and is probably not an isolated feature, but more likely the result of the interaction of the southward upwelling jet (with anticyclonic vorticity in the offshore side) with the slope poleward current (which has anticyclonic vorticity on the inshore side). More discussion on this issue will be presented later.
4.3. Vertical structure
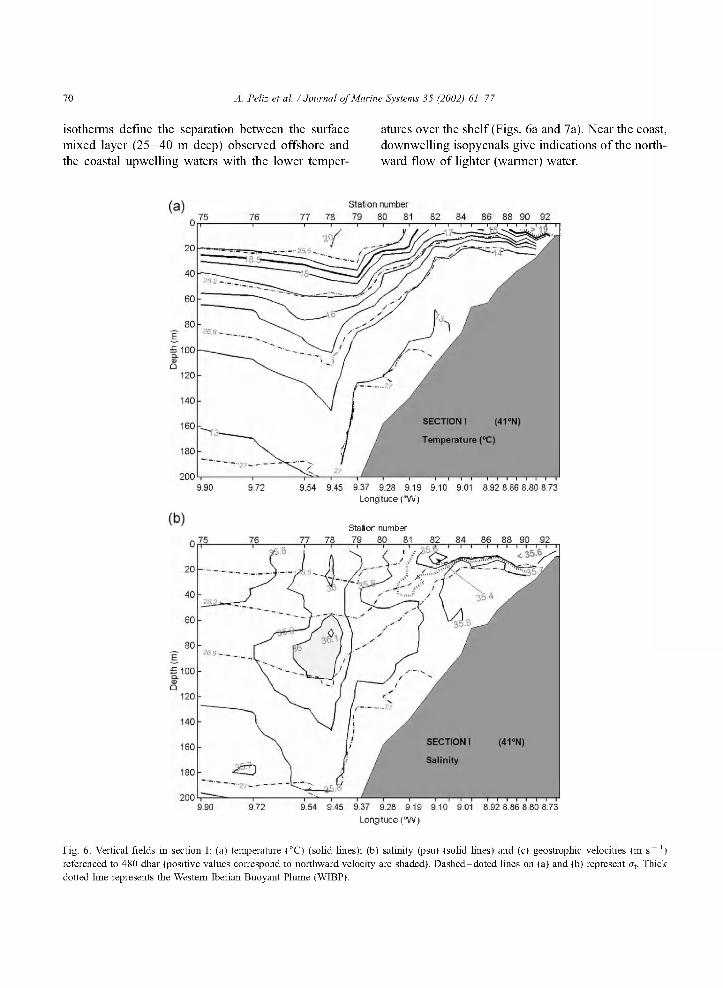
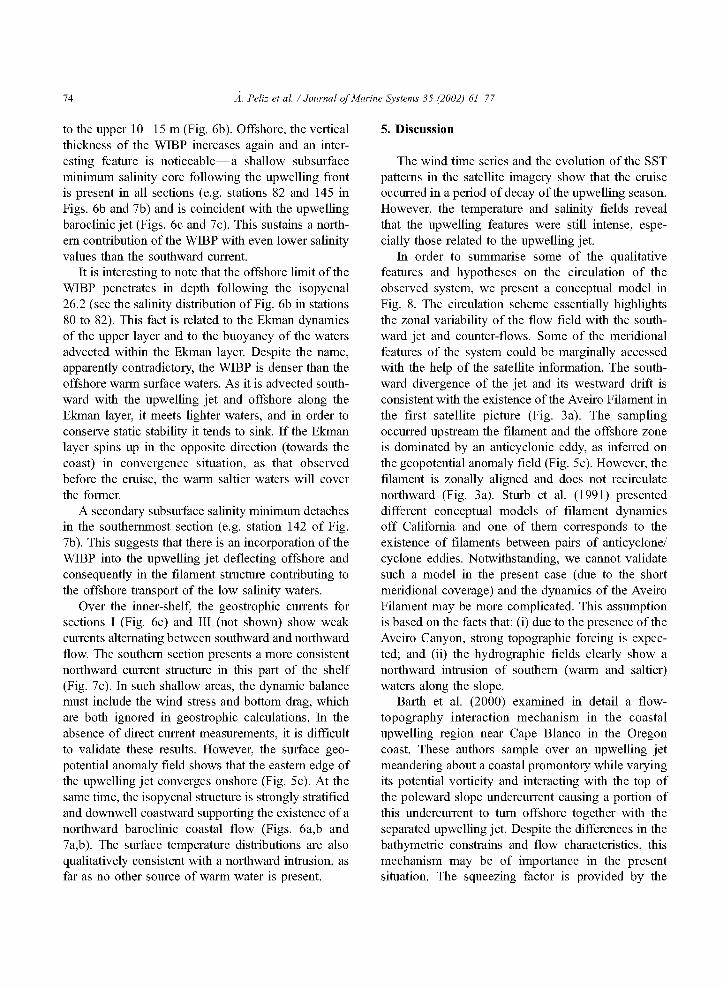
Vertical sections of density, temperature, salinity and meridional geostrophic velocity reveal the structure of the equatorward flow including the upwelling jet (Figs. 6 and 7). In the interior and bottom layers, deeper water from the upper slope, identified mainly as ENAWst (13-14 °C, 35.75-35.80 psu), is upwelled coastward in such a way that it occupies more than half the water column at mid-shelf squeezing the thermocline towards the surface. The 18.5 to 18.8 °C
70 À. Peliz et al. / Journal o f Marine Systems 35 (2002) 61-77
isotherms define the separation between the surface atures over the shelf (Figs. 6a and 7a). Near the coast,mixed layer (25-40 m deep ) observed offshore and downwelling isopycnals give indications of the north-the coastal upwelling waters with the lower temper- ward flow of lighter (warmer) water.
S la lio n num berSO 92
£ 100
120
140
SECTION I (41 °N)160T e m p e ra tu re (°C)
180
27200
9.54 9.45 9.37 9.23 9.19 9.10 9.01 8.92 S.86 8.80 8.739.90 9.72Longitude (“W )
Station num ber84
E£ 100
120
140
SECTION I160S a lin ity
180
2009.72 9.54 9.45 9.37 9.28 9 19 9.10 9.01 8.92 8.80 8.80 8.739.90
Longitude (°W>
Fig. 6. Vertical fields in section I: (a) temperature (°C) (solid lines); (b) salinity (psu) (solid lines) and (c) geostrophic velocities (m s 1} referenced to 480 dbar (positive values correspond to northward velocity are shaded). Dashed-doted lines on (a) and (b) represent crt. Thick dotted line represents the Western Iberian Buoyant Plume (WIBP).

À. Peli: et al. / Journal o f Marine Systems 35 (2002) 61-77 71
S ta tio n num ber
20
i___
100
120
140SECTION
160G eostrophic velocities (m/s) ref. level = 480 dbar
180
2009.54 9.45 9.37 9.28 9.19 9.10 9.01 8.92 8.36 8.80 8.739.90 9.72
Longitude (°W )
Fig. 6 (continued).
4.3.1. The upwelling je tThe geostrophic calculations are presented in Figs.
6c and 7c. The vertical fields correspond to the meridional (along-shore) component of the velocity, represented by dashed/white for the equatorward flow and solid/shaded for northward current. The velocity fields show a surface-intensified double-core equatorward jet with a maximum speed of about 40 cm s 1 in the northern most section (Fig. 6c) extending down to about 130 m and covering all the outer shelf. A crude estimate of the baroclinie transport of this southward jet at the northern limit of the observed area is 0.8 to 1 Sv. Further south (Fig. 7c), this flow gets broader, moves offshore and decreases in intensity to about 25 cm s 1. The remnant influence of the Aveiro Filament to the south of the sampled area (see satellite image of Fig. 3a) may be responsible for the offshore divergence of the flow and consequently for the decrease in the meridional geostrophic component.
This double-core organisation of the southward main flow corresponds in some extent to a separation between the western edge of the anticyclonic eddy and the upwelling associated front. This latter feature is also observable in the surface geopotential anomaly field as seen in Fig. 5c.
4.3.2. The slope flow and offshore circulationA sub-superficial maximum of salinity (>36 psu)
is recurrently present in all sections at approximately 80-m depth (Figs. 6b and 7b). It flows northeastward, constituting the outer edge of the anticyclone eddy seen in the geopotential field (Fig. 5c). In the southern section, the eastern limit of this high salinity waters is located offshore (Fig. 7b). In the northern section, we see that it has reattached to the slope and an isolated (high salinity) core is identifiable (Fig. 6b). This structure has a counterpart in the velocity field (Fig. 6c). The shaded zone between stations 75 and 78

72 À. Peli: et al. / Journal o f Marine Systems 35 (2002) 61-77
S ta tio n num ber144 145 146 147 149 1S1 153 155140 141 142 143
100
120
140
160SECTION V
180 T e m p e ra tu re (°CJ
2009.84 9.66 9.57 9.48 9.39 9.31 9.22 9.13 9,04 8.96 8.90 8,83
Longitude (°W)
Station number141 142 143 144 145 146 147 149 151 153 155140
35.7''2 5 6
35.3
100
120
140
160SECTION V
S a lin ity180
2009.84 9.66 9.57 9.48 9.39 9.31 9-22 5 13 9 04 8.96 8.90 8.B3
Longitude (°W)
Fig. 7. Vertical fields in section V: (a) temperature (‘ C) (solid lines); (b) salinity (psu) (solid lines) and (c) geostrophic velocities (m s 1} referenced to 480 dbar (positive values correspond to northward velocity are shaded). Dashed-doted lines on (a) and (b) represent crt. Thick dotted line represents the Western Iberian Buoyant Plume (WIBP).

À. Peli: et al. / Journal o f Marine Systems 35 (2002) 61-77 73
S ta tio n num ber
140 141 145 146 147 149 151 153 155142 143 144
' 0.21/ t ~
60
-0.05/SO
£ 100
120
140
160 SECTION V
G eostrophic velocities (m/s) ref. level = 480 dbar180
2009.84 9.66 9.57 9.48 9.39 9.31 9.22 9.13 9.04 8,96 8.90 8.83
L ongitude (°W )
Fig. 7 (continued).
corresponds to the poleward flow that is advecting northward this high salinity water. In the southern part of the survey area (Fig. 7c), both the upwelling jet and the poleward flow are displaced in the offshore direction and only part of the poleward current is sampled. This poleward current is likely a remnant of the winter poleward slope flow (e.g. Frouin et al., 1990; Haynes and Barton, 1990). The poleward current enters the study area following the slope along the 9.7°W that corresponds to the slope zone between 200 and 1000 m (see Figs. 3a and 5a), and although the bathymetry inflects eastward (at the Aveiro Canyon), the current does not contoius it immediately. It flows off the slope, generates an anticyclonic eddy with upwelling jet, and reattaches to the slope downstream of the eddy.
At about 41°N, west of 9.75°W, there is a weak southward current below 70 m (Fig. 6c). This colder and less saltier current has consistent differences in the
water mass characteristics (stations 75 and 76 on 0 — S diagram of Fig. 4) and corresponds to the large-scale slow circulation oriented to the south and sometimes called the Portugal Current (e.g. Pollard and Pu, 1985 ).
In summary, the slope flow creates a transition and contrasting zone between the shelf upwelling and the deep ocean waters, less saltier in both sides. It interacts with the bathymetry and its dynamics is influential in the upwelling structures.
4.3.3. The WIBP and the inner-shelfThe WIBP defined by S< 35.7 psu (doted thick
lines in Figs. 6b and 7b, and for clarity, only some other lower salinity lines were presented in the figures) expands all over the shelf reaching offshore the 1000-m isobath in the southernmost section. At the inner-shelf, it constitutes a layer of 20 m deep, but in the middle shelf, as a consequence of the raise in the isopycnals, it is limited to a shallower layer confined
74 A. Peliz et al. / Journal o f Marine Systems 35 (2002) 61-77
to the upper 10-15 m (Fig. 6b). Offshore, the vertical thickness of the WIBP increases again and an interesting feature is noticeable— a shallow subsurface minimum salinity core following the upwelling front is present in all sections (e.g. stations 82 and 145 in Figs. 6b and 7b) and is coincident with the upwelling baroclinie jet (Figs. 6c and 7c). This sustains a northern contribution of the WIBP with even lower salinity values than the southward current.
It is interesting to note that the offshore limit of the WIBP penetrates in depth following the isopycnal 26.2 (see the salinity distribution of Fig. 6b in stations 80 to 82). This fact is related to the Ekman dynamics of the upper layer and to the buoyancy of the waters advected within the Ekman layer. Despite the name, apparently contradictory, the WIBP is denser than the offshore warm surface waters. As it is advected southward with the upwelling jet and offshore along the Ekman layer, it meets lighter waters, and in order to conserve static stability it tends to sink. If the Ekman layer spins up in the opposite direction (towards the coast) in convergence situation, as that observed before the cruise, the warm saltier waters will cover the former.
A secondary subsurface salinity minimum detaches in the southernmost section (e.g. station 142 of Fig. 7b). This suggests that there is an incorporation of the WIBP into the upwelling jet deflecting offshore and consequently in the filament structure contributing to the offshore transport of the low salinity waters.
Over the inner-shelf, the geostrophic currents for sections I (Fig. 6c) and III (not shown) show weak currents alternating between southward and northward flow. The southern section presents a more consistent northward current structure in this part of the shelf (Fig. 7c). In such shallow areas, the dynamic balance must include the wind stress and bottom drag, which are both ignored in geostrophic calculations. In the absence of direct current measurements, it is difficult to validate these results. However, the surface geopotential anomaly field shows that the eastern edge of the upwelling jet converges onshore (Fig. 5c). At the same time, the isopycnal structure is strongly stratified and downwell coastward supporting the existence of a northward baroclinie coastal flow (Figs. 6a,b and 7a,b). The surface temperature distributions are also qualitatively consistent with a northward intrusion, as far as no other source of warm water is present.
5. Discussion
The wind time series and the evolution of the SST patterns in the satellite imagery show that the cruise occurred in a period of decay of the upwelling season. However, the temperature and salinity fields reveal that the upwelling features were still intense, especially those related to the upwelling jet.
In order to summarise some of the qualitative features and hypotheses on the circulation of the observed system, we present a conceptual model in Fig. 8. The circulation scheme essentially highlights the zonal variability of the flow field with the southward jet and counter-flows. Some of the meridional features of the system could be marginally accessed with the help of the satellite information. The southward divergence of the jet and its westward drift is consistent with the existence of the Aveiro Filament in the first satellite picture (Fig. 3a). The sampling occurred upstream the filament and the offshore zone is dominated by an anticyclonic eddy, as inferred on the geopotential anomaly field (Fig. 5c). However, the filament is zonally aligned and does not recirculate northward (Fig. 3a). Sturb et al. (1991) presented different conceptual models of filament dynamics off California and one of them corresponds to the existence of filaments between pairs of anticyclone/ cyclone eddies. Notwithstanding, we cannot validate such a model in the present case (due to the short meridional coverage) and the dynamics of the Aveiro Filament may be more complicated. This assumption is based on the facts that: (i) due to the presence of the Aveiro Canyon, strong topographic forcing is expected; and (ii) the hydrographic fields clearly show a northward intrusion of southern (warm and saltier) waters along the slope.
Barth et al. (2000) examined in detail a flow- topography interaction mechanism in the coastal upwelling region near Cape Blanco in the Oregon coast. These authors sample over an upwelling jet meandering about a coastal promontory while varying its potential vorticity and interacting with the top of the poleward slope undercurrent causing a portion of this undercurrent to turn offshore together with the separated upwelling jet. Despite the differences in the bathymetric constrains and flow characteristics, this mechanism may be of importance in the present situation. The squeezing factor is provided by the

À. Peliz et al. / Journal o f Marine Systems 35 (2002) 61-77 75
Slope polew ard f lo w
¡ ||||] L arge scale southward flow
li l i ll l Coastal counter-flow
I I U pw ellin g ] ets
□ Aiitii'v i'luna: eddy
L ow salinity core
i Thermal front
Fig. 8. Conceptual scheme of the circulation on the surveyed area.
southern edge of the Aveiro Canyon. Note that the fluid undergoes much stronger topography variation as it contours the southern part of the canyon (see the 1000-m isobath in Fig. lb). The vorticity loss is compensated by the offshore anticyclonic turn of the jet. The interaction with the poleward flow could then provide the necessary mechanism for further offshore development of the flow preventing it from returning to the shelf. This assumption is merely hypothetical as far as we did not sample over the filament. However, it is a fact that the poleward flow is displaced offshore on the southern portion and circulates anticyclonicaly with the upwelling jet generating the eddy.
The conceptual model (Fig. 8) expresses the hypothesis that the offshore divergence of the jet, the anticyclonic eddy and the Aveiro Filament (from the satellite image of Fig. 3a) may be interconnected.
Although the origin of the poleward slope flow is beyond the scope of this paper, it is worth noting that at least in the northern section (see Fig. 6b and c), the northward flow is a surface current bearing some resemblance with slope winter flow detected off the Western Iberia by Haynes and Barton (1990), and for obvious reasons, the upper part is stratified. According to these authors, this flow responds quickly to upwelling events becoming an undercurrent or even reverting at the surface. Peliz et al. (200 F) have studied numerically the response of a density-driven flow with such
characteristics to week-to-month-scale upwelling favourable wind events. They concluded that the slope poleward flow does lose intensity but conserves its general characteristics and disregarding the possibility of strong variations in the density forcing itself the winter poleward flow may persist. This corroborates the possibility that the slope poleward flow is influential in the development of the upwelling structures.
The second important counter-flow in the scheme concerns the coastal circulation and inner-shelf front. As discussed before, all the observed features pointed toward the existence of a coastal northward crurent. This warm intrusion is not related to the relaxation event because the satellite image of Fig. 3a (in full upwelling) already reveals a warm band near the coast. It is also improbable that the recirculation of the southward jet (as seen in the sruface geopotential field of Fig. 5c) is the factor driving the northward flow, since the water mass characteristics of this warm intrusion are different. This coastal counter-flow is, in our opinion, the response to the strong offshore deflection of the upwelling crurent and to the presence of the WIBP.
Although playing a secondary role in the establishment of the cross-shore density distribution responsible for the baroclinie along-shore jet, the WIBP influence the behavioru of the structures associated with the upwelling. The maintenance of the strong stratifi

76 A. Peliz et al. / Journal o f Marine Systems 35 (2002) 61-77
cation observed over the shelf reduces the thickness of the Ekman layer and correspondent offshore Ekman transport (Lentz, 1992). It creates also an inshore front with associated northward baroclinie transport. Both topographic forcing and surface stratification constitute mechanisms that contribute to the isolation of the inner-shelf, where coastal counter-flow was observed. However, these assertions need further investigation.
The hypothesis that the waters that feed the filaments may have its origin in the low coastal salinity waters of the WIBP is a very important fact because they may provide a buoyant input to the filaments, which provide a conduit of exchange between coastal and offshore waters. However, it was noted before that the WIBP loses buoyancy as it approaches the slope current with considerably warmer waters.
6. Conclusions
The Western Iberian upwelling system was studied in the beginning of September of 1998 off Western Portugal. The cruise took place at the decay of a fully developed upwelling period after a short relaxation event. The high resolution of the sampling enables the description of several frontal structures not observed in the area yet.
A double-frontal system was observed. The main upwelling front was oriented along the bathymetry off the 100-m isobath turning slightly offshore at the southern limit of the survey area. A geostrophic southward current achieving 40 cm s ~ 1 is associated to the front. The upwelled water recirculates onshore and offshore as it flows southward. At the inner-shelf, a second front separates colder upwelled waters from a warmer northward along-coast current.
At the ocean side of the upwelling front, an anticyclonic eddy was observed at the mouth of the Aveiro Canyon. The eddy is a result of the interaction of the poleward slope flow with the topography and with the upwelling jet, which in turn is also deflected offshore by the local bathymetry. We consider this flow interaction an important contribution to filament development.
The upwelling in the northern part of the Western Iberia is a very complex system of along-shore and cross-shore distribution of properties. The equatorward upwelling flow, the slope and the coastal cur
rents, together with the stratification input from the WIBP, bring strong complexity to the cross and along- shelf structure of the flow.
Although this work has contributed to a better knowledge of the upwelling structures in this area, it is our opinion that further investigations on the processes leading to the development of this upwelling double-frontal system are required. Finally, several interesting questions emerge from the observations presented here:
(1) By what means does the WIBP conserve such a strong signal up to the end of upwelling season? (If its origin is fluvial runoff)
(2) What is its role in the upwelling processes?(3) What processes contribute to the development
of the coastal counter-flow?(4) Is the poleward slope current related to the
winter density-driven flow?(5) By what means does it oppose the southward
flow regime and which role is it in the generation of upwelling filaments?
Acknowledgements
This work was carried out with the financial support from the Commission of the European Communities, Agriculture and Fisheries (FAIR) specific RTD Programme, under the frame of the project: “Experimental Survey for the Assessment of Juveniles (JTJVESU)” (CT 97-3374). A. Miguel P. Santos was partially supported by post-doctoral grant no. BPD/ 6098/95 from the Fundaç do para a Ciencia e Tecnologia (FCT), Portugal, under the PRAXIS XXI Programme. We are very grateful to E. Des Barton for so many and very useful comments and suggestions that contributed to improve this manuscript.
References
Ambar, I., Howe, M.R., 1979. Observations of the mediterranean outflow: I. Mixing in the Mediterranean outflow. Deep-Sea Research 26A, 535-554.
Barth, J.A., Pierce, S.D., Smith, R.L., 2000. A separating coastal upwelling jet at Cape Blanco, Oregon and its connection to the California current system. Deep-Sea Research, Part II 47, 783- 810.

A. Peliz et al. / Journal o f Marine Systems 35 (2002) 61-77 77
Castro, C.G., Pérez, F.F., Alvarez-Salgado, X.A., Rosón, G., Ríos, A.F., 1994. Hydrographie conditions associated with the relaxation of an upwelling event off the Galician coast (NW Spain). Journal of Geophysical Research 99, 5135-5147.
Dubert, J., 1998. Dynamic du Système de Courrants vers le Pôle au Voisinage de la Pente Continentale à l’Ouest et du Nord de la Péninsule Ibérique. PhD Thesis. Univ. Bretagne Occidentale, France, 237 pp.
Fiúza, A.F.G., 1983. Upwelling patterns off Portugal. In: Suess, E., Thiede, J. (Eds.), Coastal Upwelling. Its Sediment Record. Plenum, New York, pp. 85-98.
Fiúza, A.F.G., Macedo, M.E., Guerreiro, M.R., 1982. Climatolog- ical space and time variation of the Portugal coastal upwelling. Oceanologica Acta 5 (1), 31-40.
Fiúza, A.F.G., Hamann, M., Ambar, I., Del Rio, G., Gonzalez, N., Cabanas, J., 1998. Water masses and their circulation off western Iberia during May 1993. Deep-Sea Research 45 (7), 1127-1160.
Frouin, R., Fíuza, A.F.G., Ambar, I., Boyd, T.J., 1990. Observations of a Poleward surface current off the coasts of Portugal and Spain during winter. Journal of Geophysical Research 95, 679-691.
Haynes, R., Barton, E.D., 1990. A poleward flow along the Atlantic coast of the Iberian peninsula. Journal of Geophysical Research 95, 11425-11441.
Haynes, R., Barton, E.D., Pilling, I., 1993. Development, persistence and variability of upwelling filaments off the Atlantic coast of the Iberian peninsula. Journal of Geophysical Research 98, 22681-22692.
Lentz, S.J., 1992. The surface boundary layer in coastal upwelling regions. Journal of Physical Oceanography 22, 1517-1539.
McCartney, M.S., Talley, L.D., 1982. The subpolar mode water of the North Atlantic Ocean. Journal of Physical Oceanography 12, 1169-1188.
Paillet, J., Arhan, M., 1996. Oceanic ventilation in the eastern North Atlantic. Journal of Physical Oceanography 26, 2036-2052.
Peliz, A., Fiúza, A.F.G., 1999. Temporal and spatial variability of
CZCS-derived phytoplankton pigment concentrations off the western Iberia peninsula. International Journal of Remote Sensing 7, 1363-1403.
Peliz, A. Dubert, J., Haidvogel, D.B., 2001. Response of a density- driven eastern poleward current (EPC) to wind forcing. Journal of Physical Oceanography (Nov. 2001), submitted for publication.
Pollard, R.T., Pu, S., 1985. Structure and circulation of the upper Atlantic Ocean northeast of Azores. Progress in Oceanography14, 443-462.
Reid, J.L., Mantyla, A.W., 1976. The effect of the geostrophic flow upon coastal elevations in the Northern North Pacific. Journal of Geophysical Research 81 (18), 3100-3110.
Ríos, A.F., Pérez, F.F., Fraga, F., 1992. Water masses in the upper and middle North Atlantic Ocean East of the Azores. Deep-Sea Research 39 (3/4), 645-658.
Roed, L.P., Shi, X.B., 1999. A numerical study of the dynamics and energetics of cool filaments, jets and eddies off the Iberian peninsula. Journal of Geophysical Research 104, 29817-29841.
Sousa, F. 1995. Processos de Mesoescala ao Largo da Costa Portuguesa Utilizando Dados de Satélite e Observaçoes in situ [Mes- oscale Processes off Portuguese Coast Using Satellite and in situ Data]. PhD Thesis, University of Lisbon, Portugal, 167 pp.
Sousa, F., Bricaud, A., 1992. Satellite-derived phytoplankton pigment structures in the Portuguese upwelling area. Journal of Geophysical Research 97, 11343-11356.
Sturb, T.P., Kosro, P.M., Huyer, A., 1991. The nature of cold filaments in the California current system. Journal of Geophysical Research 96, 14743-14768.
UNESCO, 1983. Algorithms for computation of fundamental properties of seawater. UNESCO Tech. Pap. in Mar. Sei. 44. UNESCO, Paris, 53 pp.
Wooster, W.S., Bakun, A., McLain, D.R., 1976. The seasonal upwelling cycle along the eastern boundary of the North Atlantic. Journal of Marine Research 34 (2), 131-141.