fruit and tree nuts outlook · fruit and tree nut grower price index remains weak . fruit and tree...
TRANSCRIPT
1 Fruit and Tree Nuts Outlook, FTS-370, March 31, 2020
USDA, Economic Research Service
Fruit and Tree Nuts Outlook Jaclyn Kramer, coordinator Skyler Simnitt and Linda Calvin
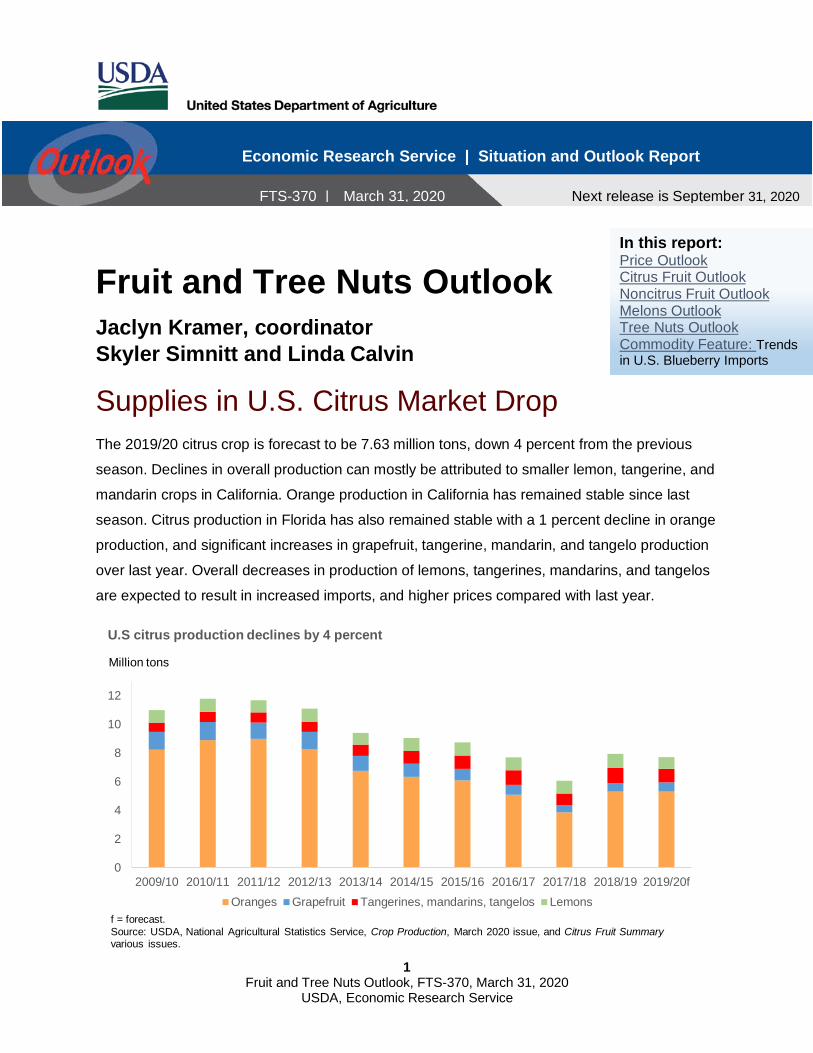
Supplies in U.S. Citrus Market Drop The 2019/20 citrus crop is forecast to be 7.63 million tons, down 4 percent from the previous
season. Declines in overall production can mostly be attributed to smaller lemon, tangerine, and
mandarin crops in California. Orange production in California has remained stable since last
season. Citrus production in Florida has also remained stable with a 1 percent decline in orange
production, and significant increases in grapefruit, tangerine, mandarin, and tangelo production
over last year. Overall decreases in production of lemons, tangerines, mandarins, and tangelos
are expected to result in increased imports, and higher prices compared with last year.
0
2
4
6
8
10
12
2009/10 2010/11 2011/12 2012/13 2013/14 2014/15 2015/16 2016/17 2017/18 2018/19 2019/20f
U.S citrus production declines by 4 percent
Oranges Grapefruit Tangerines, mandarins, tangelos Lemons
Million tons
f = forecast.Source: USDA, National Agricultural Statistics Service, Crop Production, March 2020 issue, and Citrus Fruit Summaryvarious issues.
Economic Research Service | Situation and Outlook Report
Next release is September 31, 2020
FTS-370 | March 31, 2020
In this report: Price Outlook Citrus Fruit Outlook Noncitrus Fruit Outlook Melons Outlook Tree Nuts Outlook Commodity Feature: Trends in U.S. Blueberry Imports
2 Fruit and Tree Nuts Outlook, FTS-370, March 31, 2020
USDA, Economic Research Service
Price Outlook Fruit and Tree Nut Grower Price Index Remains Weak
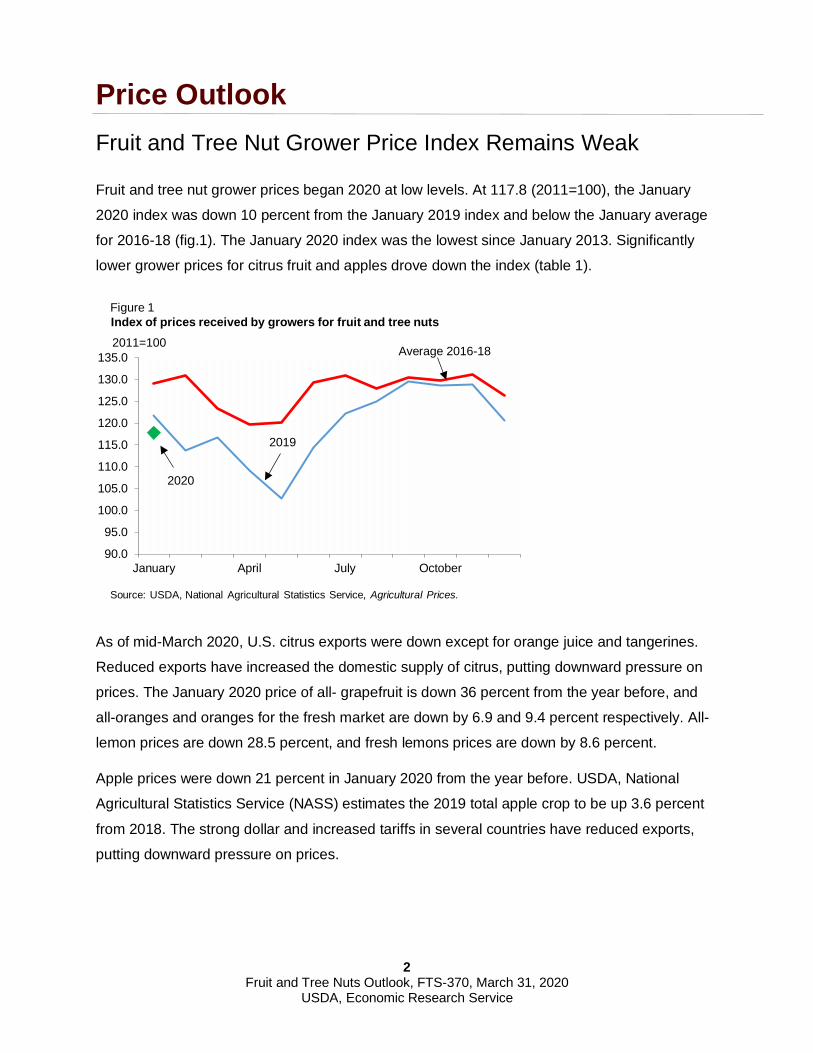
Fruit and tree nut grower prices began 2020 at low levels. At 117.8 (2011=100), the January
2020 index was down 10 percent from the January 2019 index and below the January average
for 2016-18 (fig.1). The January 2020 index was the lowest since January 2013. Significantly
lower grower prices for citrus fruit and apples drove down the index (table 1).
As of mid-March 2020, U.S. citrus exports were down except for orange juice and tangerines.
Reduced exports have increased the domestic supply of citrus, putting downward pressure on
prices. The January 2020 price of all- grapefruit is down 36 percent from the year before, and
all-oranges and oranges for the fresh market are down by 6.9 and 9.4 percent respectively. All-
lemon prices are down 28.5 percent, and fresh lemons prices are down by 8.6 percent.
Apple prices were down 21 percent in January 2020 from the year before. USDA, National
Agricultural Statistics Service (NASS) estimates the 2019 total apple crop to be up 3.6 percent
from 2018. The strong dollar and increased tariffs in several countries have reduced exports,
putting downward pressure on prices.
90.0
95.0
100.0
105.0
110.0
115.0
120.0
125.0
130.0
135.0
January April July October
Figure 1Index of prices received by growers for fruit and tree nuts2011=100
Source: USDA, National Agricultural Statistics Service, Agricultural Prices.
Average 2016-18
2019
2020
3 Fruit and Tree Nuts Outlook, FTS-370, March 31, 2020
USDA, Economic Research Service
Consumer Price Index for Fresh Fruit Starts the Year Low
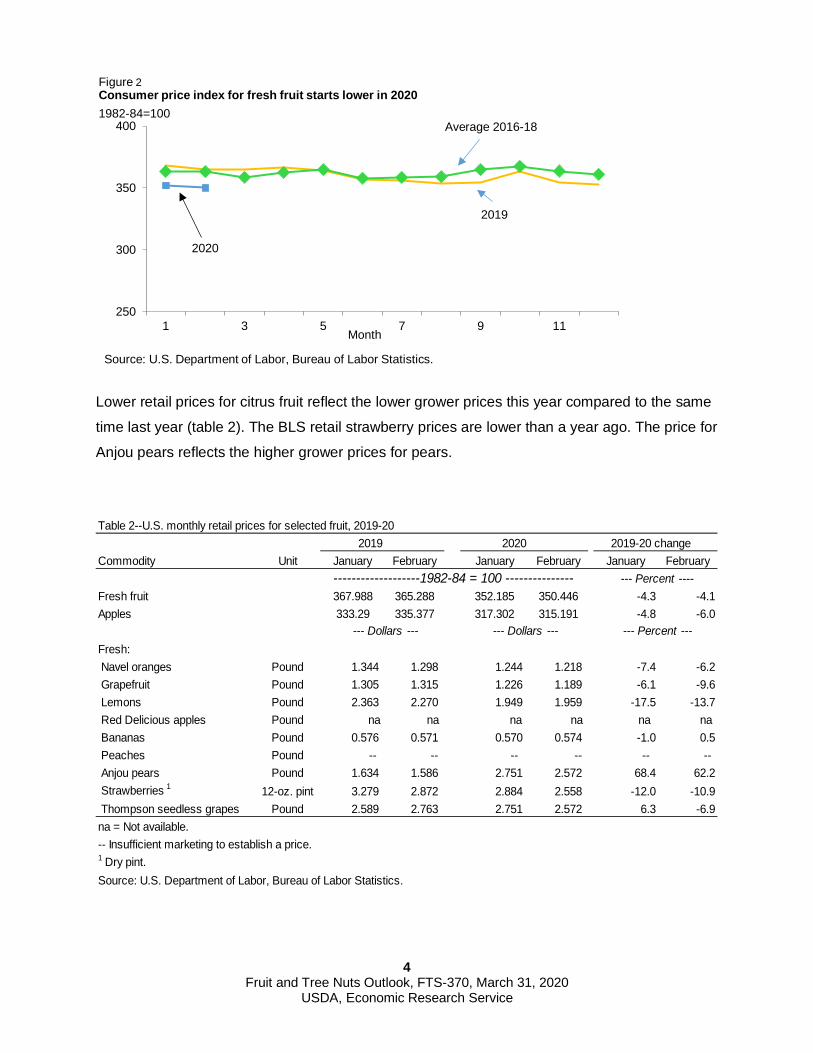
The Consumer Price Index (CPI) for fresh fruit was reported at 350.4 (1982-84=100) in
February 2020, down 4.1 percent from last February 2019 and lower than the 2016-18 January
average (fig. 2). Based on data from the U.S. Department of Labor, Bureau of Labor Statistics
(BLS), consumers paid lower prices in January and February this year compared with 2019 for
navel oranges, grapefruit, lemons, and strawberries. Consumer prices were higher for Anjou
pears. Banana prices were nearly steady. Thompson seedless grapes prices were mixed, up in
January, and lower in February. The BLS has not reported any prices for Red Delicious apples
since November 2017. Providing an indication of apple retail prices in general, the CPI for
apples was 317.3 in January 2020 and 315.2 in February 2020, both down from year-earlier
levels.
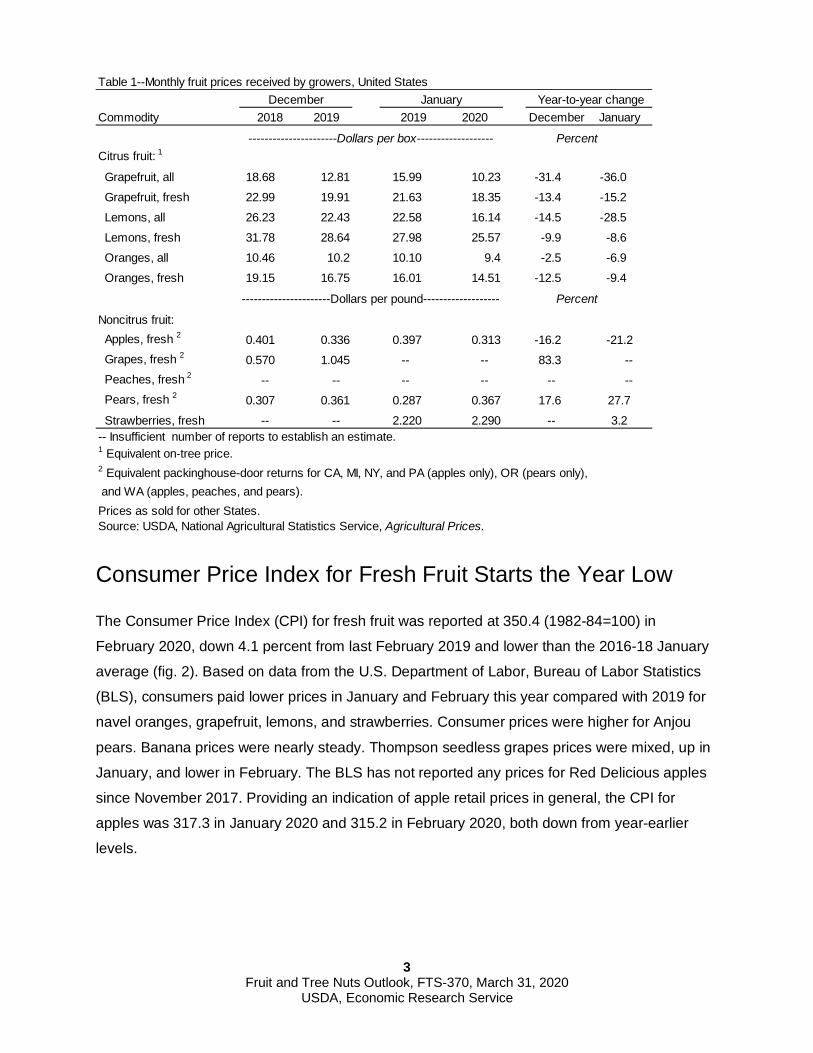
Table 1--Monthly fruit prices received by growers, United States
Commodity 2018 2019 2019 2020 December January
PercentCitrus fruit: 1
Grapefruit, all 18.68 12.81 15.99 10.23 -31.4 -36.0 Grapefruit, fresh 22.99 19.91 21.63 18.35 -13.4 -15.2 Lemons, all 26.23 22.43 22.58 16.14 -14.5 -28.5 Lemons, fresh 31.78 28.64 27.98 25.57 -9.9 -8.6 Oranges, all 10.46 10.2 10.10 9.4 -2.5 -6.9 Oranges, fresh 19.15 16.75 16.01 14.51 -12.5 -9.4
----------------------Dollars per pound------------------- Percent
Noncitrus fruit: Apples, fresh 2 0.401 0.336 0.397 0.313 -16.2 -21.2 Grapes, fresh 2 0.570 1.045 -- -- 83.3 -- Peaches, fresh 2 -- -- -- -- -- -- Pears, fresh 2 0.307 0.361 0.287 0.367 17.6 27.7 Strawberries, fresh -- -- 2.220 2.290 -- 3.2-- Insufficient number of reports to establish an estimate.1 Equivalent on-tree price.2 Equivalent packinghouse-door returns for CA, MI, NY, and PA (apples only), OR (pears only), and WA (apples, peaches, and pears). Prices as sold for other States.Source: USDA, National Agricultural Statistics Service, Agricultural Prices.
December January
----------------------Dollars per box-------------------
Year-to-year change
4 Fruit and Tree Nuts Outlook, FTS-370, March 31, 2020
USDA, Economic Research Service
Lower retail prices for citrus fruit reflect the lower grower prices this year compared to the same
time last year (table 2). The BLS retail strawberry prices are lower than a year ago. The price for
Anjou pears reflects the higher grower prices for pears.
250
300
350
400
1 3 5 7 9 11
Figure 2Consumer price index for fresh fruit starts lower in 20201982-84=100
Source: U.S. Department of Labor, Bureau of Labor Statistics.
Average 2016-18
2019
2020
Month
2019 2020 2019-20 changeCommodity Unit January February January February January February
Fresh fruit 367.988 365.288 352.185 350.446 -4.3 -4.1Apples 333.29 335.377 317.302 315.191 -4.8 -6.0
--- Dollars --- --- Dollars --- --- Percent ---Fresh: Navel oranges Pound 1.344 1.298 1.244 1.218 -7.4 -6.2 Grapefruit Pound 1.305 1.315 1.226 1.189 -6.1 -9.6 Lemons Pound 2.363 2.270 1.949 1.959 -17.5 -13.7 Red Delicious apples Pound na na na na na na Bananas Pound 0.576 0.571 0.570 0.574 -1.0 0.5 Peaches Pound -- -- -- -- -- -- Anjou pears Pound 1.634 1.586 2.751 2.572 68.4 62.2 Strawberries 1 12-oz. pint 3.279 2.872 2.884 2.558 -12.0 -10.9 Thompson seedless grapes Pound 2.589 2.763 2.751 2.572 6.3 -6.9na = Not available.-- Insufficient marketing to establish a price.1 Dry pint. Source: U.S. Department of Labor, Bureau of Labor Statistics.
Table 2--U.S. monthly retail prices for selected fruit, 2019-20
-------------------1982-84 = 100 --------------- --- Percent ----
5 Fruit and Tree Nuts Outlook, FTS-370, March 31, 2020
USDA, Economic Research Service
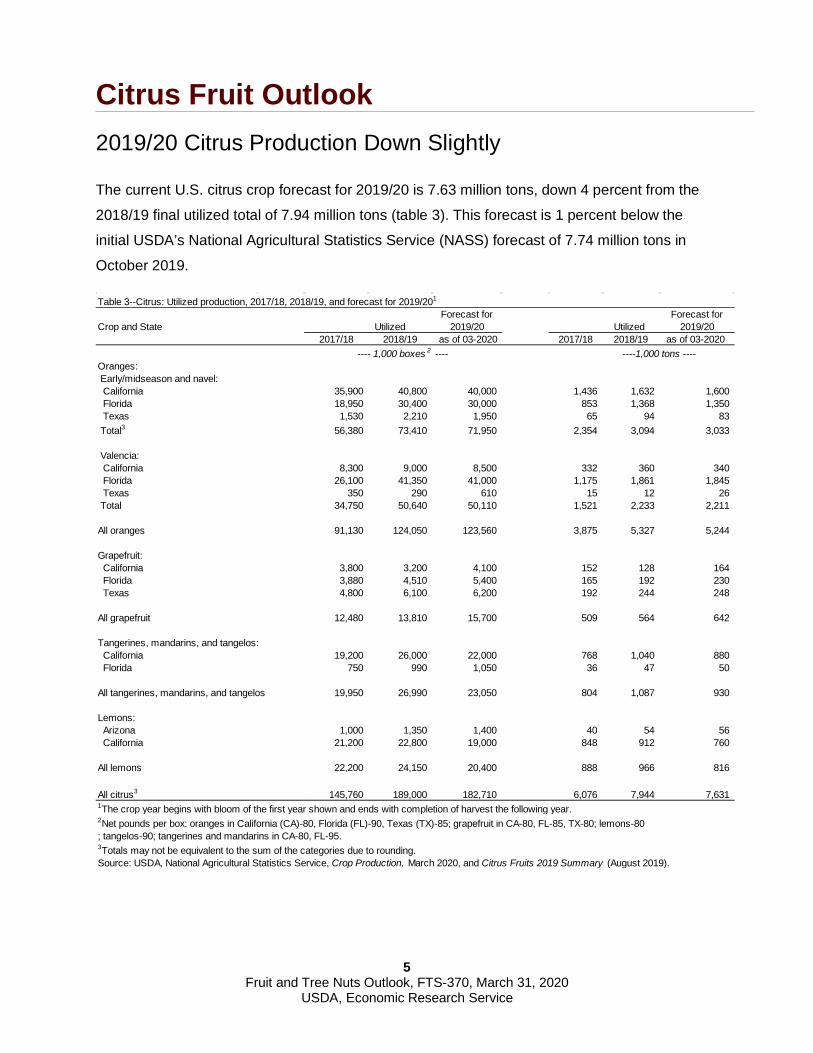
Citrus Fruit Outlook 2019/20 Citrus Production Down Slightly
The current U.S. citrus crop forecast for 2019/20 is 7.63 million tons, down 4 percent from the
2018/19 final utilized total of 7.94 million tons (table 3). This forecast is 1 percent below the
initial USDA’s National Agricultural Statistics Service (NASS) forecast of 7.74 million tons in
October 2019.
Table 3--Citrus: Utilized production, 2017/18, 2018/19, and forecast for 2019/201
Forecast for Forecast forCrop and State Utilized 2019/20 Utilized 2019/20
2017/18 2018/19 as of 03-2020 2017/18 2018/19 as of 03-2020 ----1,000 tons ----
Oranges: Early/midseason and navel: California 35,900 40,800 40,000 1,436 1,632 1,600 Florida 18,950 30,400 30,000 853 1,368 1,350 Texas 1,530 2,210 1,950 65 94 83 Total3 56,380 73,410 71,950 2,354 3,094 3,033
Valencia: California 8,300 9,000 8,500 332 360 340 Florida 26,100 41,350 41,000 1,175 1,861 1,845 Texas 350 290 610 15 12 26 Total 34,750 50,640 50,110 1,521 2,233 2,211
All oranges 91,130 124,050 123,560 3,875 5,327 5,244
Grapefruit: California 3,800 3,200 4,100 152 128 164 Florida 3,880 4,510 5,400 165 192 230 Texas 4,800 6,100 6,200 192 244 248
All grapefruit 12,480 13,810 15,700 509 564 642
Tangerines, mandarins, and tangelos: California 19,200 26,000 22,000 768 1,040 880 Florida 750 990 1,050 36 47 50
All tangerines, mandarins, and tangelos 19,950 26,990 23,050 804 1,087 930
Lemons: Arizona 1,000 1,350 1,400 40 54 56 California 21,200 22,800 19,000 848 912 760
All lemons 22,200 24,150 20,400 888 966 816
All citrus3 145,760 189,000 182,710 6,076 7,944 7,631 1The crop year begins with bloom of the first year shown and ends with completion of harvest the following year.2Net pounds per box: oranges in California (CA)-80, Florida (FL)-90, Texas (TX)-85; grapefruit in CA-80, FL-85, TX-80; lemons-80; tangelos-90; tangerines and mandarins in CA-80, FL-95.3Totals may not be equivalent to the sum of the categories due to rounding.Source: USDA, National Agricultural Statistics Service, Crop Production, March 2020, and Citrus Fruits 2019 Summary (August 2019).
---- 1,000 boxes 2 ----
6 Fruit and Tree Nuts Outlook, FTS-370, March 31, 2020
USDA, Economic Research Service
Florida and California Orange Production is Steady
All-orange production in the United States for 2019/20 is forecast about steady from last year
with a slight decrease of 1.6 percent. This decrease in production is largely because of lighter
navel and Valencia orange crops in California. Navel production in California is forecast to
decrease by 32,000 tons (2 percent) from last season and Valencia production is expected to be
down by 20,000 tons. The March 2020 issue of the NASS Crop Production report forecasts
2019/20 California all-orange production at 1.94 million tons, down 2.6 percent from 2018/19.
All-orange production in Florida is also about steady this season with a 1-percent decrease to
3.19 million tons. The early/mid-season non-Valencia crops are down by 400,000 boxes or
18,000 tons. At the same time, Valencia orange production is now projected to be down by
350,000 boxes or 16,000 tons from last year. This revised estimate for Florida Valencia
production is mostly because of lower than average fruit size this season, and higher than
average fruit drop. Relatively stable production levels of oranges this season may suggest that
growers are succeeding at slowing continued losses caused by Huanglongbing (citrus greening
disease) through improved cultivation and management practices. Although citrus greening
disease is present in all significant citrus producing States in the United States including
California, Arizona, and Texas, the effects of the disease are most observable in Florida where
between 95 and 100 percent of groves are believed to be infected with the bacteria.
Although Texas accounts for only 2 percent of U.S. commercial orange production, all-orange
production is up by 2.4 percent this season due to a more than 100 percent increase in the
Valencia orange crop this year.
Despite a smaller crop in California this year, prices for fresh oranges have declined suggesting
relatively weak domestic demand in the early part of this season. November and December
2019 prices for fresh California oranges ($19.40 and $17.80 per box) were 3 percent and 9
percent below last year’s prices. More pronounced declines in fresh orange prices can be
observed for Florida and Texas, where December 2019 per box prices are more than $5.00
lower in Florida (32 percent), and $6.50 lower (36 percent) in Texas compared with the same
month last year.
Export volumes of fresh oranges are down from the previous year. Season-to-date exports
(November 2019 – January 2020) are 3 percent below last season. The bulk of U.S. fresh
orange exports occur in the spring and USDA’s Economic Research Service (ERS) forecasts
total U.S. fresh orange exports to reach 530,000 tons in 2019/20, down 2.5 percent from last

7 Fruit and Tree Nuts Outlook, FTS-370, March 31, 2020
USDA, Economic Research Service
season. U.S. Census Bureau data show declines in exports to Canada, the largest U.S. export
market, of 10 percent. So far, U.S. fresh orange exports to other trading partners are up this
season with Mexico (38 percent), Japan (18 percent), and Singapore (9.5 percent) all up.
For the first three months of the season (November 2019 – January 2020), fresh orange imports
were at 19,861 tons, 2 percent down from the same period last season. With orange production
in Florida and California only slightly down so far this year, ERS predicts fresh orange imports at
215,000 tons in 2019/20, up 2 percent from last season. July to October are usually the most
active months for fresh orange imports. Chile and Mexico are estimated to remain the largest
suppliers of fresh market oranges to the U.S. market this season; shipments from Mexico are
down 1 percent from this time last year and shipments from Chile are down nearly 37 percent.
Florida Orange Juice Production Forecast Down
Most oranges grown in the United States (69 percent) go to processing; and Florida leads
production of oranges for processing. According to USDA’s National Agricultural Statistics
Service (NASS), 98 percent of the early midseason orchard rows were harvested by late
February. As of mid-February 2020, harvest of Valencia oranges was still in the early stages.
The average processing Florida orange price reported by NASS in January 2020 was $8.40 per
box, 10 cents higher than the same time last year. Prices are up despite relatively high
beginning stocks of frozen concentrated orange juice this season.
USDA’s Economic Research Service (ERS) forecasts orange juice production in 2019/20 to be
down from last year, with total production at 445 million single-strength equivalent gallons. ERS
forecasts orange juice imports to fall to 326 million gallons. Year-over-year decreases in import
volume have already been reported for the first 3 months of the current marketing year, down 32
percent from the same period last season. Season-to-date shipments are down by 12 percent
from Brazil. Monthly exports of U.S. orange juice are up 5 percent in the first four months of the
season relative to 2018/19
Nielsen retail sales data through February from the Florida Department of Citrus show a
continued trend of declining sales volume and overall increased price per gallon. Total orange
juice sales volume from October 2019 through mid-February 2020 were down 4.3 percent with
prices up 2.1 percent, compared with the same period last season. Not-from-concentrate (NFC)
orange juice sales constitute nearly two-thirds of total sales volume to date. NFC orange juice
prices for the season so far are averaging $8.65 per gallon, compared with $8.41 per gallon in
2018/19.
8 Fruit and Tree Nuts Outlook, FTS-370, March 31, 2020
USDA, Economic Research Service
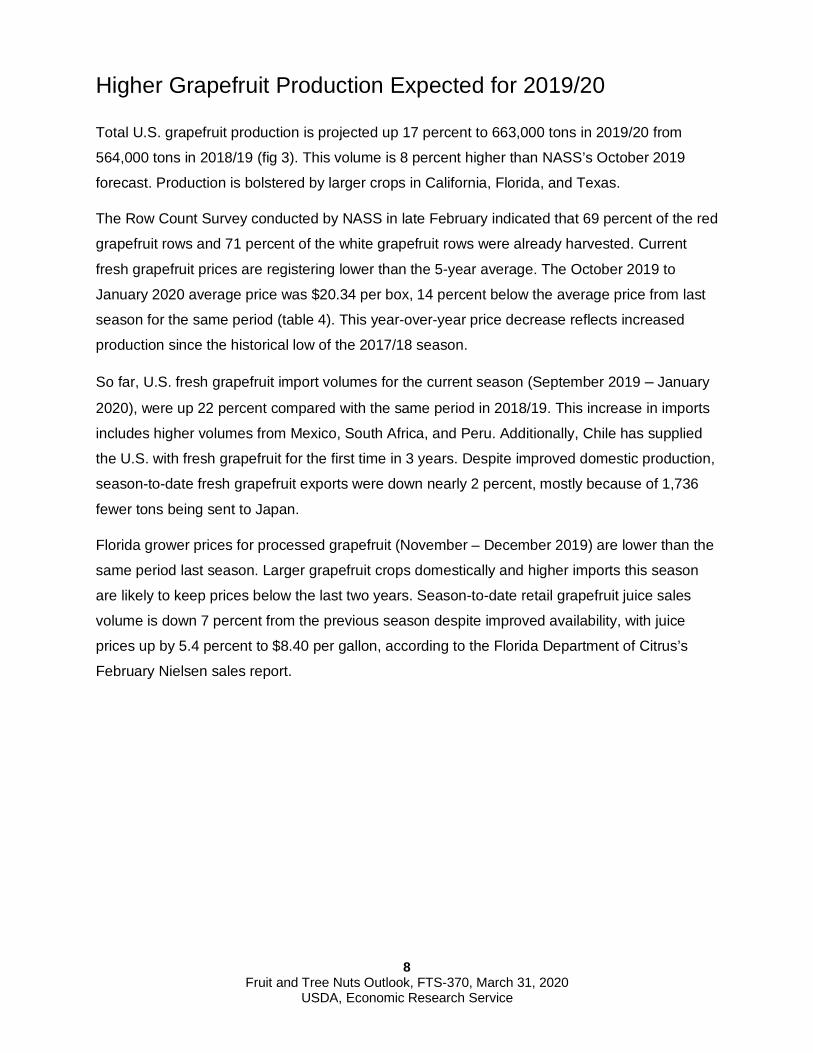
Higher Grapefruit Production Expected for 2019/20
Total U.S. grapefruit production is projected up 17 percent to 663,000 tons in 2019/20 from
564,000 tons in 2018/19 (fig 3). This volume is 8 percent higher than NASS’s October 2019
forecast. Production is bolstered by larger crops in California, Florida, and Texas.
The Row Count Survey conducted by NASS in late February indicated that 69 percent of the red
grapefruit rows and 71 percent of the white grapefruit rows were already harvested. Current
fresh grapefruit prices are registering lower than the 5-year average. The October 2019 to
January 2020 average price was $20.34 per box, 14 percent below the average price from last
season for the same period (table 4). This year-over-year price decrease reflects increased
production since the historical low of the 2017/18 season.
So far, U.S. fresh grapefruit import volumes for the current season (September 2019 – January
2020), were up 22 percent compared with the same period in 2018/19. This increase in imports
includes higher volumes from Mexico, South Africa, and Peru. Additionally, Chile has supplied
the U.S. with fresh grapefruit for the first time in 3 years. Despite improved domestic production,
season-to-date fresh grapefruit exports were down nearly 2 percent, mostly because of 1,736
fewer tons being sent to Japan.
Florida grower prices for processed grapefruit (November – December 2019) are lower than the
same period last season. Larger grapefruit crops domestically and higher imports this season
are likely to keep prices below the last two years. Season-to-date retail grapefruit juice sales
volume is down 7 percent from the previous season despite improved availability, with juice
prices up by 5.4 percent to $8.40 per gallon, according to the Florida Department of Citrus’s
February Nielsen sales report.
9 Fruit and Tree Nuts Outlook, FTS-370, March 31, 2020
USDA, Economic Research Service
Table 4--Fresh grapefruit: Average equivalent on-tree prices received by U.S. growers, 2014/15-2019/20
Month 2014/15 2015/16 2016/17 2017/18 2018/19 2019/20
------- Dollars/box1 -------
October 15.42 17.54 22.63 26.67 26.03 22.22 November 12.99 16.22 16.33 25.00 24.32 20.87 December 12.49 15.43 16.18 23.17 22.99 19.91 January 10.92 15.01 16.48 23.45 21.63 18.35 February 10.43 14.63 16.76 23.03 20.90 -- March 10.34 14.32 18.19 23.08 18.81 -- April 9.92 -- 20.90 22.46 18.4 -- May -- -- -- -- --
Oct.-Jan. average 12.96 16.05 17.91 24.57 21.87 20.34 1The net weight of a grapefruit box for Florida: 85 lb, for California: 80 lb, for Texas: 80 lb. Source: USDA, National Agricultural Statistics Service, Agricultural Prices, various issues.
Lemon Production Forecast Down in 2019/20
The U.S. lemon crop for the 2019/20 marketing season (August – July) is anticipated to be
816,000 tons, down 15.5 percent from the 2018/19 final utilized production total. This overall
smaller volume is driven exclusively by a 17 percent reduction in California’s production.
Conversely, the Arizona lemon crop is forecast to grow 4 percent up to 56,000 tons. Fresh
lemon grower prices for the first six months of the current season averaged $31.64 per box,
0
200
400
600
800
1,000
1,200
1,400
1,600
2009/10 2010/11 2011/12 2012/13 2013/14 2014/15 2015/16 2016/17 2017/18 2018/19 2019/20f
Figure 3Total U.S. grapefuit production 2009/10-2019/20Thousand tons
f = forecast.Sources: USDA, National Agricultural Statistics Service, Crop Production, March 2020 issue, and Citrus Fruit Summary, various issues.
10 Fruit and Tree Nuts Outlook, FTS-370, March 31, 2020
USDA, Economic Research Service
compared to $40.45 over the same period in 2018/19. Imports for the months of October,
November and December are at the highest levels observed in 10 years with imports from
Mexico up 33 percent, and imports from Argentina up 75 percent (August 2019 – January
2020). Despite lower domestic production levels this season, prices are substantially lower than
the same time last year. Fresh lemon exports are up 3.5 percent year-to-date at 45,821 tons,
with significant quantities going to Japan, Canada, and South Korea.
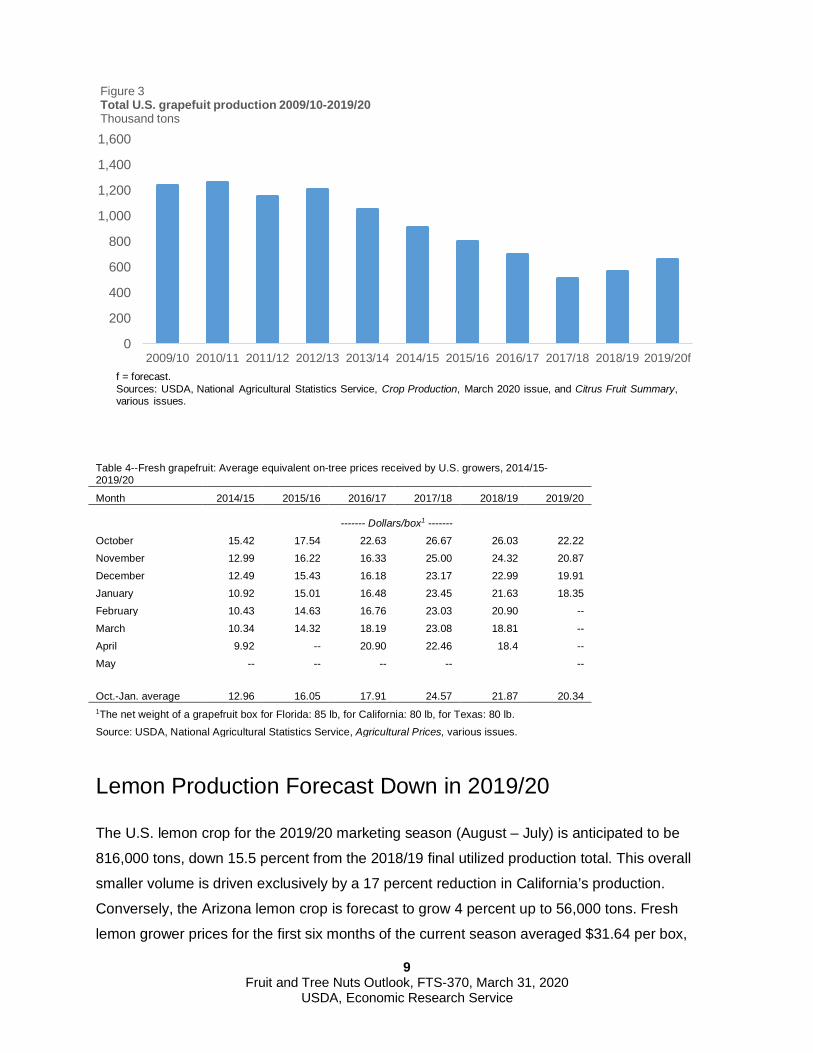
Lower Tangerine, Mandarin, and Tangelo Crops for 2019/20
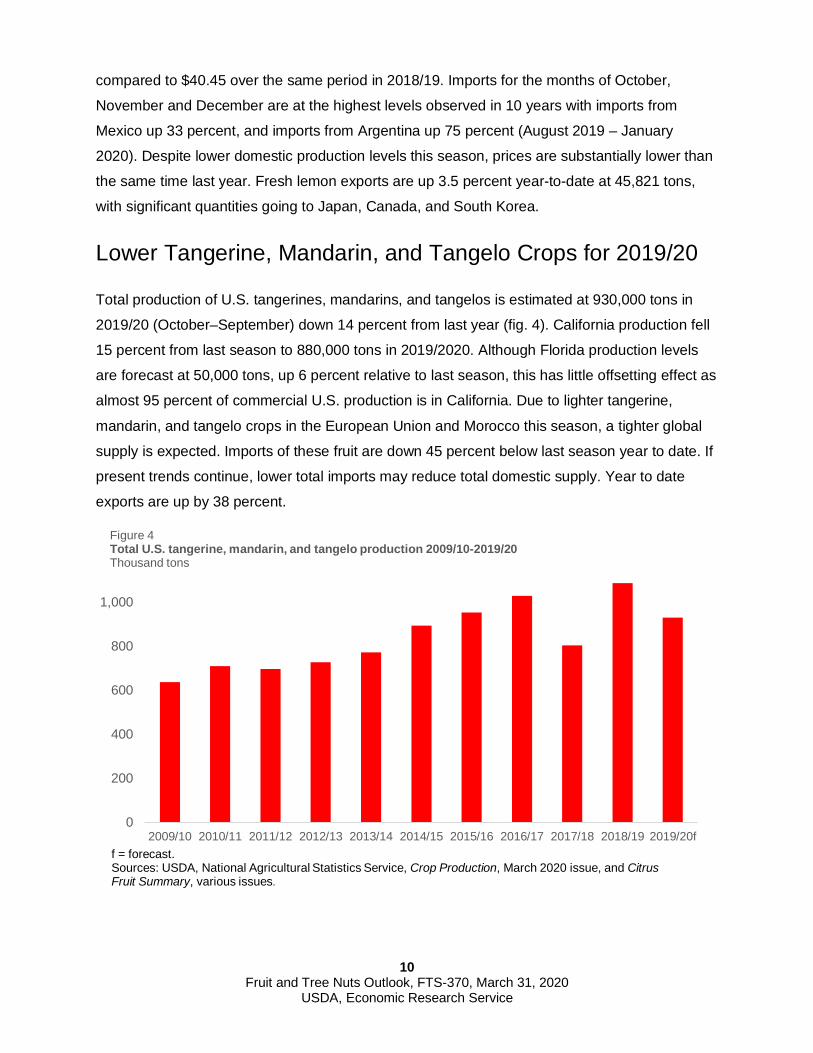
Total production of U.S. tangerines, mandarins, and tangelos is estimated at 930,000 tons in
2019/20 (October–September) down 14 percent from last year (fig. 4). California production fell
15 percent from last season to 880,000 tons in 2019/2020. Although Florida production levels
are forecast at 50,000 tons, up 6 percent relative to last season, this has little offsetting effect as
almost 95 percent of commercial U.S. production is in California. Due to lighter tangerine,
mandarin, and tangelo crops in the European Union and Morocco this season, a tighter global
supply is expected. Imports of these fruit are down 45 percent below last season year to date. If
present trends continue, lower total imports may reduce total domestic supply. Year to date
exports are up by 38 percent.
0
200
400
600
800
1,000
2009/10 2010/11 2011/12 2012/13 2013/14 2014/15 2015/16 2016/17 2017/18 2018/19 2019/20f
Figure 4Total U.S. tangerine, mandarin, and tangelo production 2009/10-2019/20 Thousand tons
f = forecast.Sources: USDA, National Agricultural Statistics Service, Crop Production, March 2020 issue, and Citrus Fruit Summary, various issues.
11 Fruit and Tree Nuts Outlook, FTS-370, March 31, 2020
USDA, Economic Research Service
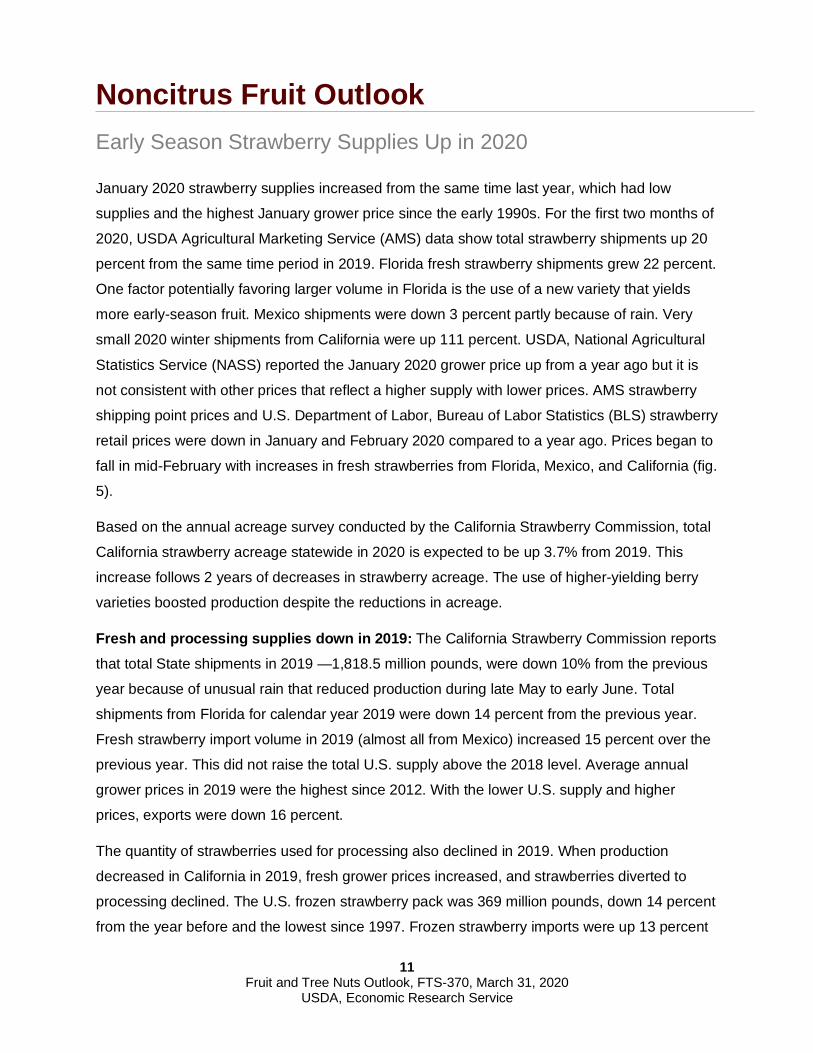
Noncitrus Fruit Outlook Early Season Strawberry Supplies Up in 2020
January 2020 strawberry supplies increased from the same time last year, which had low
supplies and the highest January grower price since the early 1990s. For the first two months of
2020, USDA Agricultural Marketing Service (AMS) data show total strawberry shipments up 20
percent from the same time period in 2019. Florida fresh strawberry shipments grew 22 percent.
One factor potentially favoring larger volume in Florida is the use of a new variety that yields
more early-season fruit. Mexico shipments were down 3 percent partly because of rain. Very
small 2020 winter shipments from California were up 111 percent. USDA, National Agricultural
Statistics Service (NASS) reported the January 2020 grower price up from a year ago but it is
not consistent with other prices that reflect a higher supply with lower prices. AMS strawberry
shipping point prices and U.S. Department of Labor, Bureau of Labor Statistics (BLS) strawberry
retail prices were down in January and February 2020 compared to a year ago. Prices began to
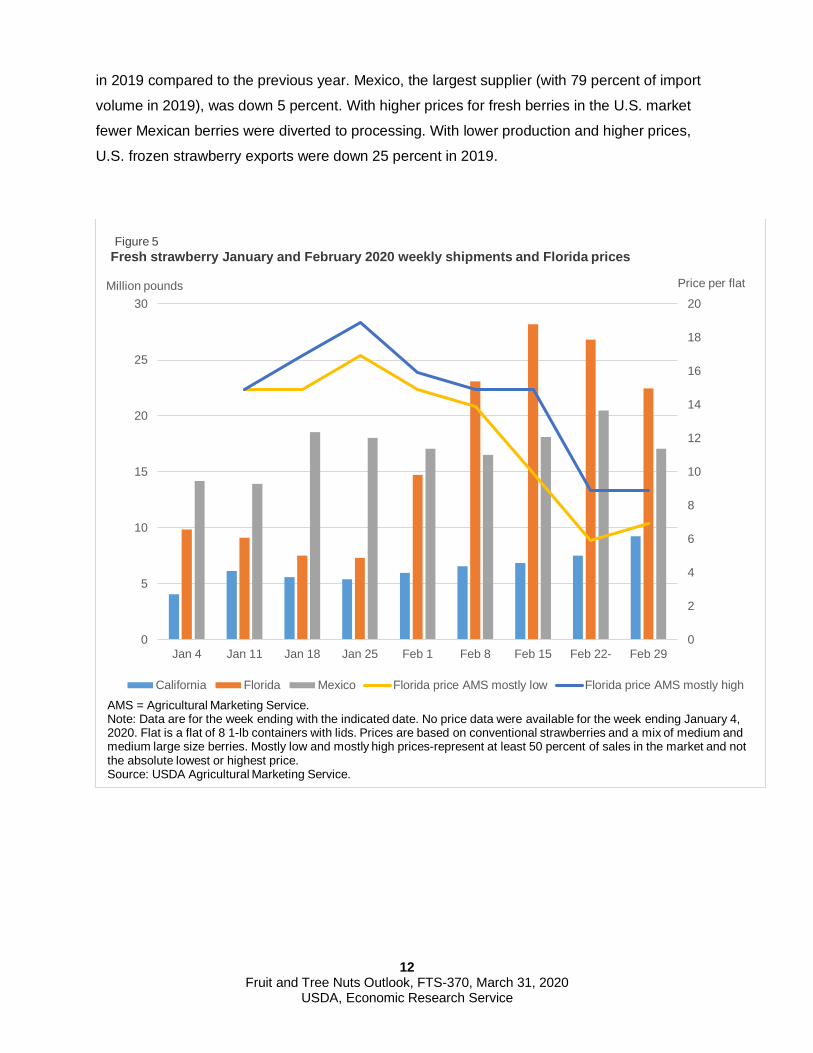
fall in mid-February with increases in fresh strawberries from Florida, Mexico, and California (fig.
5).
Based on the annual acreage survey conducted by the California Strawberry Commission, total
California strawberry acreage statewide in 2020 is expected to be up 3.7% from 2019. This
increase follows 2 years of decreases in strawberry acreage. The use of higher-yielding berry
varieties boosted production despite the reductions in acreage.
Fresh and processing supplies down in 2019: The California Strawberry Commission reports
that total State shipments in 2019 —1,818.5 million pounds, were down 10% from the previous
year because of unusual rain that reduced production during late May to early June. Total
shipments from Florida for calendar year 2019 were down 14 percent from the previous year.
Fresh strawberry import volume in 2019 (almost all from Mexico) increased 15 percent over the
previous year. This did not raise the total U.S. supply above the 2018 level. Average annual
grower prices in 2019 were the highest since 2012. With the lower U.S. supply and higher
prices, exports were down 16 percent.
The quantity of strawberries used for processing also declined in 2019. When production
decreased in California in 2019, fresh grower prices increased, and strawberries diverted to
processing declined. The U.S. frozen strawberry pack was 369 million pounds, down 14 percent
from the year before and the lowest since 1997. Frozen strawberry imports were up 13 percent
12 Fruit and Tree Nuts Outlook, FTS-370, March 31, 2020
USDA, Economic Research Service
in 2019 compared to the previous year. Mexico, the largest supplier (with 79 percent of import
volume in 2019), was down 5 percent. With higher prices for fresh berries in the U.S. market
fewer Mexican berries were diverted to processing. With lower production and higher prices,
U.S. frozen strawberry exports were down 25 percent in 2019.
0
2
4
6
8
10
12
14
16
18
20
0
5
10
15
20
25
30
Jan 4 Jan 11 Jan 18 Jan 25 Feb 1 Feb 8 Feb 15 Feb 22- Feb 29
Price per flatMillion pounds
Figure 5Fresh strawberry January and February 2020 weekly shipments and Florida prices
California Florida Mexico Florida price AMS mostly low Florida price AMS mostly highAMS = Agricultural Marketing Service.Note: Data are for the week ending with the indicated date. No price data were available for the week ending January 4, 2020. Flat is a flat of 8 1-lb containers with lids. Prices are based on conventional strawberries and a mix of medium and medium large size berries. Mostly low and mostly high prices-represent at least 50 percent of sales in the market and not the absolute lowest or highest price.Source: USDA Agricultural Marketing Service.

13 Fruit and Tree Nuts Outlook, FTS-370, March 31, 2020
USDA, Economic Research Service
2020 Began with Lower Blueberry Prices
2019: The North American Blueberry Council (NABC) estimates the 2019 total U.S. blueberry
crop at 670 million pounds with 371.7 million pounds for fresh market and 298.3 million pounds
for processing. Based on NABC data, U.S. blueberry production increased 22 percent from
2018 to 2019. The top 8 blueberry-producing States—Washington, Oregon, Georgia, Michigan,
California, New Jersey, North Carolina, and Florida—accounted for 98 percent of production in
2019; all but two grew in both fresh and processing utilization. U.S. fresh blueberry imports rose to a record 472 million pounds, up 20 percent from the
previous year’s record volume. In 2019, U.S. blueberry exports increased 73 percent from 2018
(the lowest level since 2004) to 80 million pounds, the second largest export level ever. Canada
accounted for 92 percent of U.S. exports. Per capita consumption of fresh blueberries increased
to 2.32 pounds in 2019, up 16 percent from the previous year.
2020: The U.S. blueberry market started the year with very low prices in January because of the
large volume of imported berries in the market. Peru and Chile are the two largest foreign
suppliers to the U.S. market. Imports from Peru were up 61 percent in November 2019
compared to the year before and up 156 percent in December 2019. While total January imports
were down 6 percent from January 2019 (down 3 percent from December 2019) carry-over
inventories in January were above normal. January imports from Peru were up 7 percent above
the previous January; and imports from Chile were down 17 percent. Chile’s conventional
exports to the United States were down 20 percent while organic exports grew 17 percent.
Shipping point prices declined through the week ending January 18, 2020 to mostly $9-$12 per
flat (compared to an average mostly $15.62-$18.82 in the month of January 2019) and then
began to increase. Early domestic blueberry production started with the Florida crop, which
supplies the markets with good volume from April through early May. USDA’s Agricultural
Marketing Service (AMS) reported the first shipments from Florida in 2020 for the week ending
March 14. California produces a small amount of blueberries in January and February, with
increases in production in March.
14 Fruit and Tree Nuts Outlook, FTS-370, March 31, 2020
USDA, Economic Research Service
Bumper Crop of Avocados Expected
Early projections from the California Avocado Commission (CAC) indicate statewide avocado
production for the 2019/20 season (November-October) increasing to 369 million pounds, up 70
percent from their estimate of the 2018/19 crop of 216.6 million pounds. Because of the
alternate-bearing nature of the tree, after last year’s low harvest this harvest tends to increase.
In addition, the trees are healthy after heavy rains last winter which should boost production.
Typically, avocado shipments occur from spring through summertime. USDA’s Agricultural
Marketing Service data show that this year January and February 2020 shipments are above
normal, because of the large crop and high prices. In 2019, California avocado shipments in
January and February totaled 1.14 million pounds while shipments for the same time period in
2020 reached 22.63 million pounds. Since avocados can mature on the tree for an extended
period, U.S. growers look for opportunities when fruit quality is at its peak and market conditions
are optimal. California accounts for over 80 percent of the U.S. utilized avocado production.
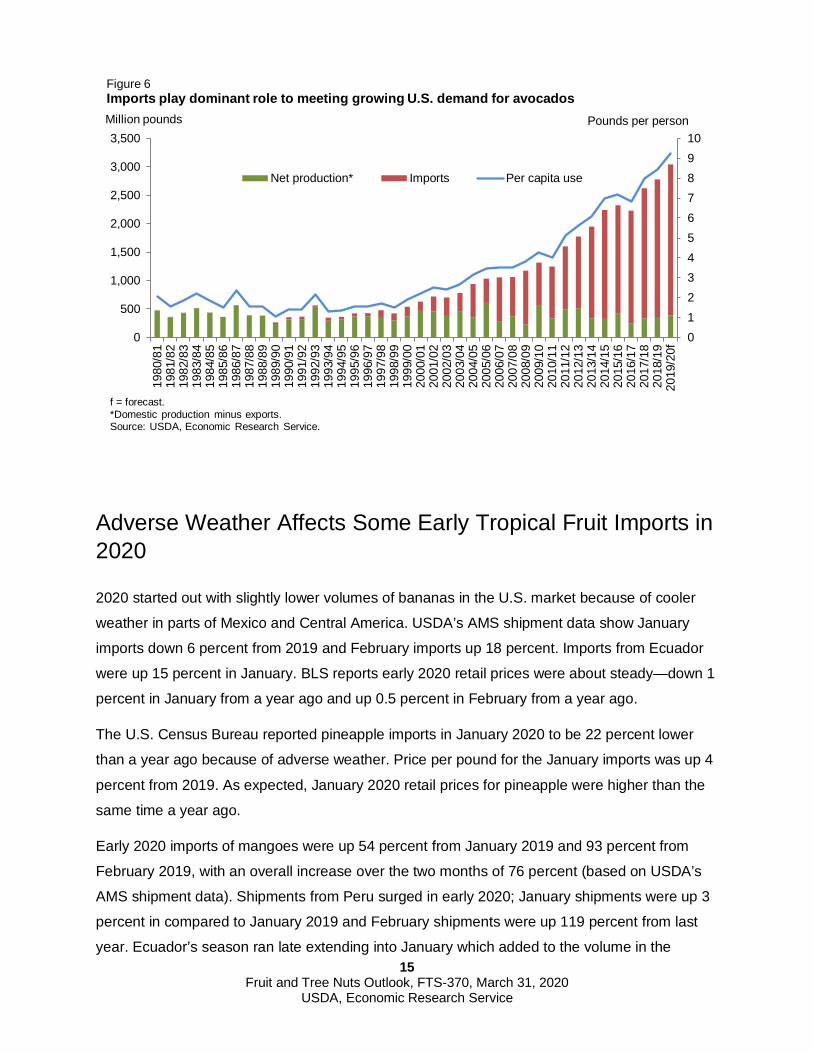
U.S. per capita consumption of avocados is rising rapidly which has tempered the effect of
growing supply on price. In the 2010/11 season per capita consumption was 4 pounds and by
2018/19 it more than doubled to 9.24 pounds (fig. 6). In January and February 2020, Mexican
avocado shipments totaled 434.87 million pounds, up 4.5 percent from the same period a year
ago and California shipments also increased. Despite the growth in supply, shipping point prices
for a 2-layer carton of Mexican avocados-Hass, all sizes, and conventional/organic — over the
two months ranged from an average of $31.64 (mostly low price) to an average of $41.14
(mostly high price) compared with 2019 prices over the two months with an average of $22.82
mostly low to an average of $26.55 mostly high. U.S. fresh avocado imports, mainly from
Mexico, continue to grow. During the 2018/19 season, imports reached a new high of 2,437
million tons, up 6 percent from the previous year, and accounted for 88 percent of domestic
supply.
In December 2019, USDA’s Foreign Agricultural Service reported that for the Mexican avocado
season 2019/20 (July-June) production is forecast to be 2.26 million metric tons (or 4.98 billion
pounds) up slightly from the 2018/19 season production of 2.18 million metric tons. Peru is now
the second largest import supplier; it accounted for 8 percent of total import volume in 2019 and
shipped from May to August.
15 Fruit and Tree Nuts Outlook, FTS-370, March 31, 2020
USDA, Economic Research Service
Adverse Weather Affects Some Early Tropical Fruit Imports in 2020
2020 started out with slightly lower volumes of bananas in the U.S. market because of cooler
weather in parts of Mexico and Central America. USDA’s AMS shipment data show January
imports down 6 percent from 2019 and February imports up 18 percent. Imports from Ecuador
were up 15 percent in January. BLS reports early 2020 retail prices were about steady—down 1
percent in January from a year ago and up 0.5 percent in February from a year ago.
The U.S. Census Bureau reported pineapple imports in January 2020 to be 22 percent lower
than a year ago because of adverse weather. Price per pound for the January imports was up 4
percent from 2019. As expected, January 2020 retail prices for pineapple were higher than the
same time a year ago.
Early 2020 imports of mangoes were up 54 percent from January 2019 and 93 percent from
February 2019, with an overall increase over the two months of 76 percent (based on USDA’s
AMS shipment data). Shipments from Peru surged in early 2020; January shipments were up 3
percent in compared to January 2019 and February shipments were up 119 percent from last
year. Ecuador’s season ran late extending into January which added to the volume in the
012345678910
0
500
1,000
1,500
2,000
2,500
3,000
3,50019
80/8
119
81/8
219
82/8
319
83/8
419
84/8
519
85/8
619
86/8
719
87/8
819
88/8
919
89/9
019
90/9
119
91/9
219
92/9
319
93/9
419
94/9
519
95/9
619
96/9
719
97/9
819
98/9
919
99/0
020
00/0
120
01/0
220
02/0
320
03/0
420
04/0
520
05/0
620
06/0
720
07/0
820
08/0
920
09/1
020
10/1
120
11/1
220
12/1
320
13/1
420
14/1
520
15/1
620
16/1
720
17/1
820
18/1
920
19/2
0f
Net production* Imports Per capita use
Figure 6Imports play dominant role to meeting growing U.S. demand for avocadosMillion pounds Pounds per person
f = forecast.*Domestic production minus exports.Source: USDA, Economic Research Service.

16 Fruit and Tree Nuts Outlook, FTS-370, March 31, 2020
USDA, Economic Research Service
market. In February 2020, average shipping point prices for 1-layer flats of Kent mangoes
ranged from a mostly low of $3.97 to mostly high of $4.49, down 42.5 and 39.6 percent from the
same numbers the year before. Peruvian shipments peaked in February and began winding
down in mid-March as shipments from Mexico began to increase.
According to the U.S. Census Bureau, January 2020 imports of papaya were up 2.5 percent
from the previous January. Imports from Mexico were steady from a year ago, while imports
from Guatemala increased 15.2 percent. In 2019, Mexico accounted for 76 percent of U.S.
imports in January, Guatemala accounted for 21 percent. USDA’s AMS shipping price data
show that in January 2020 the average mostly low price was $18 per carton of Maradol papayas
and mostly high was $20.25 per carton, down from $21.75 and $25.50 in 2019.
Banana per capita use is estimated at 28 pounds annually in 2017-19, while fresh pineapples,
mangoes, and papayas average less than 10 pounds for each. Bananas continue to outrank all
other tropical fruit in U.S. fresh import volume and fresh per capita use. Between the periods
2011-2013 and 2017-2018, average banana per capita use increased 5 percent, while mango,
papaya, and pineapple per capita use rose from 22 to 25 percent.

17 Fruit and Tree Nuts Outlook, FTS-370, March 31, 2020
USDA, Economic Research Service
Melon Outlook Melon Supplies Down Slightly in 2019
Estimated domestic disappearance (also known as net domestic availability) which is a proxy for
consumption of fresh melons totaled 7.26 billion pounds in 2019, down 6 percent from 2018.
This estimate translates to 23.5 pounds per person, down 6 percent from 25.1 pounds last year
and slightly lower than the previous 5-year average (fig. 7). The United States remains a net
importer of melons, with total melon imports averaging 3 billion pounds annually during 2015-
2019. Overall 2019 supplies were affected by decreases in domestic production and lower
imports.
Watermelons: Domestic watermelon production totaled 3.7 billion pounds in 2019, down 2
percent from the previous year (table 5). Declines in key producing States, such as California
and North Carolina, outweighed increases. Production increases in Florida and Georgia were
attributed to good weather conditions. Nearly all watermelons produced are for the fresh market,
where grower prices averaged $0.15 per pound in 2019, decreasing from $0.17 per pound in
2018.
18 Fruit and Tree Nuts Outlook, FTS-370, March 31, 2020
USDA, Economic Research Service
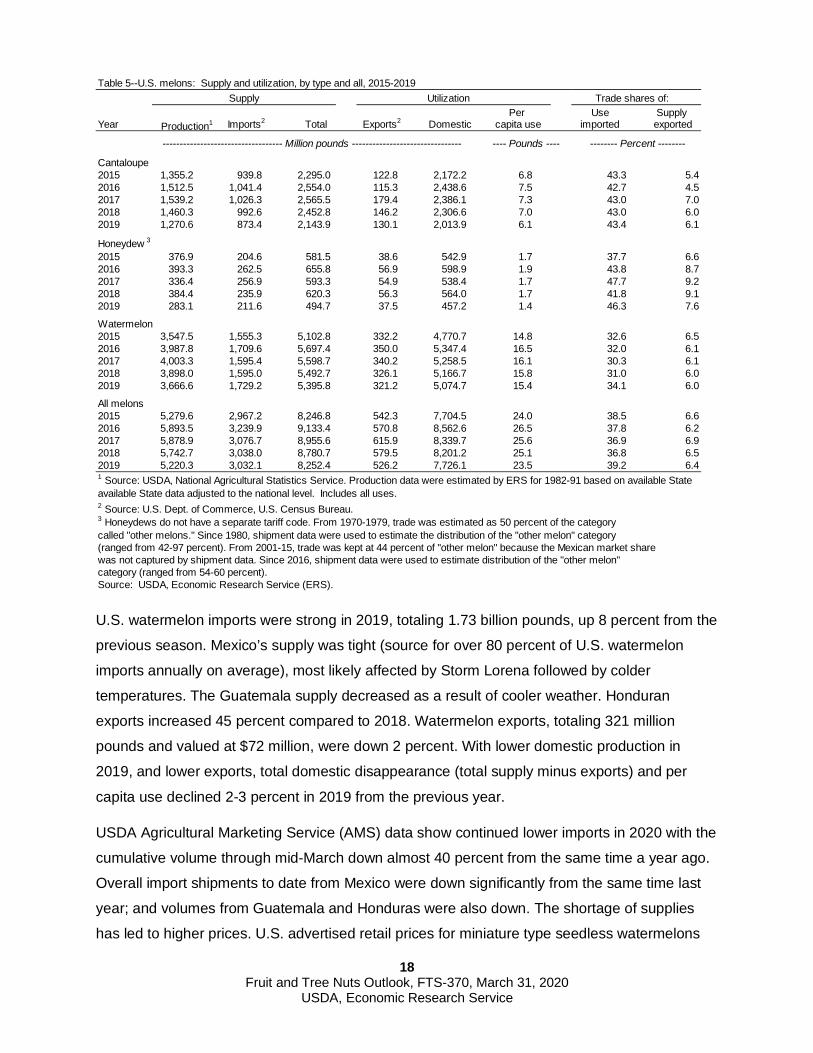
U.S. watermelon imports were strong in 2019, totaling 1.73 billion pounds, up 8 percent from the
previous season. Mexico’s supply was tight (source for over 80 percent of U.S. watermelon
imports annually on average), most likely affected by Storm Lorena followed by colder
temperatures. The Guatemala supply decreased as a result of cooler weather. Honduran
exports increased 45 percent compared to 2018. Watermelon exports, totaling 321 million
pounds and valued at $72 million, were down 2 percent. With lower domestic production in
2019, and lower exports, total domestic disappearance (total supply minus exports) and per
capita use declined 2-3 percent in 2019 from the previous year.
USDA Agricultural Marketing Service (AMS) data show continued lower imports in 2020 with the
cumulative volume through mid-March down almost 40 percent from the same time a year ago.
Overall import shipments to date from Mexico were down significantly from the same time last
year; and volumes from Guatemala and Honduras were also down. The shortage of supplies
has led to higher prices. U.S. advertised retail prices for miniature type seedless watermelons
Table 5--U.S. melons: Supply and utilization, by type and all, 2015-2019Supply Utilization Trade shares of:
Per Use Supply Year Total Domestic capita use imported exported
----------------------------------- Million pounds -------------------------------- ---- Pounds ---- -------- Percent --------
Cantaloupe2015 1,355.2 939.8 2,295.0 122.8 2,172.2 6.8 43.3 5.42016 1,512.5 1,041.4 2,554.0 115.3 2,438.6 7.5 42.7 4.52017 1,539.2 1,026.3 2,565.5 179.4 2,386.1 7.3 43.0 7.02018 1,460.3 992.6 2,452.8 146.2 2,306.6 7.0 43.0 6.02019 1,270.6 873.4 2,143.9 130.1 2,013.9 6.1 43.4 6.1
Honeydew 3
2015 376.9 204.6 581.5 38.6 542.9 1.7 37.7 6.62016 393.3 262.5 655.8 56.9 598.9 1.9 43.8 8.72017 336.4 256.9 593.3 54.9 538.4 1.7 47.7 9.22018 384.4 235.9 620.3 56.3 564.0 1.7 41.8 9.12019 283.1 211.6 494.7 37.5 457.2 1.4 46.3 7.6
Watermelon2015 3,547.5 1,555.3 5,102.8 332.2 4,770.7 14.8 32.6 6.52016 3,987.8 1,709.6 5,697.4 350.0 5,347.4 16.5 32.0 6.12017 4,003.3 1,595.4 5,598.7 340.2 5,258.5 16.1 30.3 6.12018 3,898.0 1,595.0 5,492.7 326.1 5,166.7 15.8 31.0 6.02019 3,666.6 1,729.2 5,395.8 321.2 5,074.7 15.4 34.1 6.0
All melons2015 5,279.6 2,967.2 8,246.8 542.3 7,704.5 24.0 38.5 6.62016 5,893.5 3,239.9 9,133.4 570.8 8,562.6 26.5 37.8 6.22017 5,878.9 3,076.7 8,955.6 615.9 8,339.7 25.6 36.9 6.92018 5,742.7 3,038.0 8,780.7 579.5 8,201.2 25.1 36.8 6.52019 5,220.3 3,032.1 8,252.4 526.2 7,726.1 23.5 39.2 6.4
3 Honeydews do not have a separate tariff code. From 1970-1979, trade was estimated as 50 percent of the categorycalled "other melons." Since 1980, shipment data were used to estimate the distribution of the "other melon" category(ranged from 42-97 percent). From 2001-15, trade was kept at 44 percent of "other melon" because the Mexican market sharewas not captured by shipment data. Since 2016, shipment data were used to estimate distribution of the "other melon"category (ranged from 54-60 percent). Source: USDA, Economic Research Service (ERS).
Production1
available State data adjusted to the national level. Includes all uses.
1 Source: USDA, National Agricultural Statistics Service. Production data were estimated by ERS for 1982-91 based on available State
2 Source: U.S. Dept. of Commerce, U.S. Census Bureau.
Imports2 Exports2

19 Fruit and Tree Nuts Outlook, FTS-370, March 31, 2020
USDA, Economic Research Service
per fruit through mid-March 2020 averaged $3.55 each, compared with $3.30 for the same
period last year. Prices for conventional red flesh seedless type watermelons, averaged over $5
each, higher than last year’s price.
Cantaloupe: Total U.S. crop size was down to 1.27 billion pounds in 2019, the third year of
production declines. Production in California, the top producing State, was affected by below
normal temperatures and above average rainfall resulting in a slow start and cold temperatures
slowing the growth of the crop. The crop in Arizona, a major producing State, started slowly
because of cooler temperatures and ended earlier with extreme heat causing the fruit to mature
more rapidly although the fruit quality was reported good
U.S. fresh cantaloupe import volume declined 12 percent in 2019 from the previous year to
873.4 million pounds mostly because of lower shipments from dominant supplier Guatemala,
(typically accounts for more than 50 percent of cantaloupe imports). At the same time, Mexican
and Honduran shipments increased from 2018. Export volume declined in 12 percent in 2019
from the previous year with exports falling to leading markets Canada (down 13 percent from
2018) and Mexico (down 12 percent). Total 2019 supply in the United States fell significantly
from the previous year to 2.14 billion pounds. The estimated domestic disappearance in 2019
was reduced by more than 12 percent from the previous year to 2.0 billion pounds.
In January and February 2020, cantaloupe shipments, all imports, were up from the same time
a year ago—up 50 percent. Costa Rica was down 36 percent in January-February from a year
ago, Guatemala was up 80 percent, and Honduras was up 18 percent. With increases in
shipments prices decreased. In January 2020, shipping point prices ($ per half carton) averaged
mostly $10.95-$11.68, compared to an average of mostly $13.20-$15.12 in January 2019.
February 2020 prices were only slightly up from a year ago.
Honeydew: The 2019 domestic honeydew melon production declined to 283.1 million pounds,
26 percent below 2018. Planted area and area harvested were down 10 percent from 2018.
California is the main producer, but colder temperatures and heavy rainfall pushed back planting
and slowed growth throughout the season. 2019 per capita consumption dropped nearly 20
percent as a result of declines in production and imports.
U.S. honeydew shipments for the first two months of 2020 were up 65 percent from the same
period last year, with increases in shipments from Costa Rica, Guatemala, Honduras and
Mexico. Based on USDA Agricultural Marketing Service data average retail prices averaged
$3.08 year to date, about 33 cents less than the same time last year. The 2020 U.S. honeydew
melon season is underway, with peak harvest expected in the summer months.
20 Fruit and Tree Nuts Outlook, FTS-370, March 31, 2020
USDA, Economic Research Service
Tree Nuts Outlook U.S. Pecan Production Totals Higher in 2019/20
In January 2020, USDA’s National Agricultural Statistic Service (NASS) reported U.S. pecan
production for the 2019/20 marketing season (October-September) at 264.5 million pounds
utilized in-shell basis, 6 percent above the previous year, but down from the October 2019
forecast of 281 million pounds. The change in production reflects increases in domestic
production in pecan-producing States, including strong gains in Texas and Arizona.
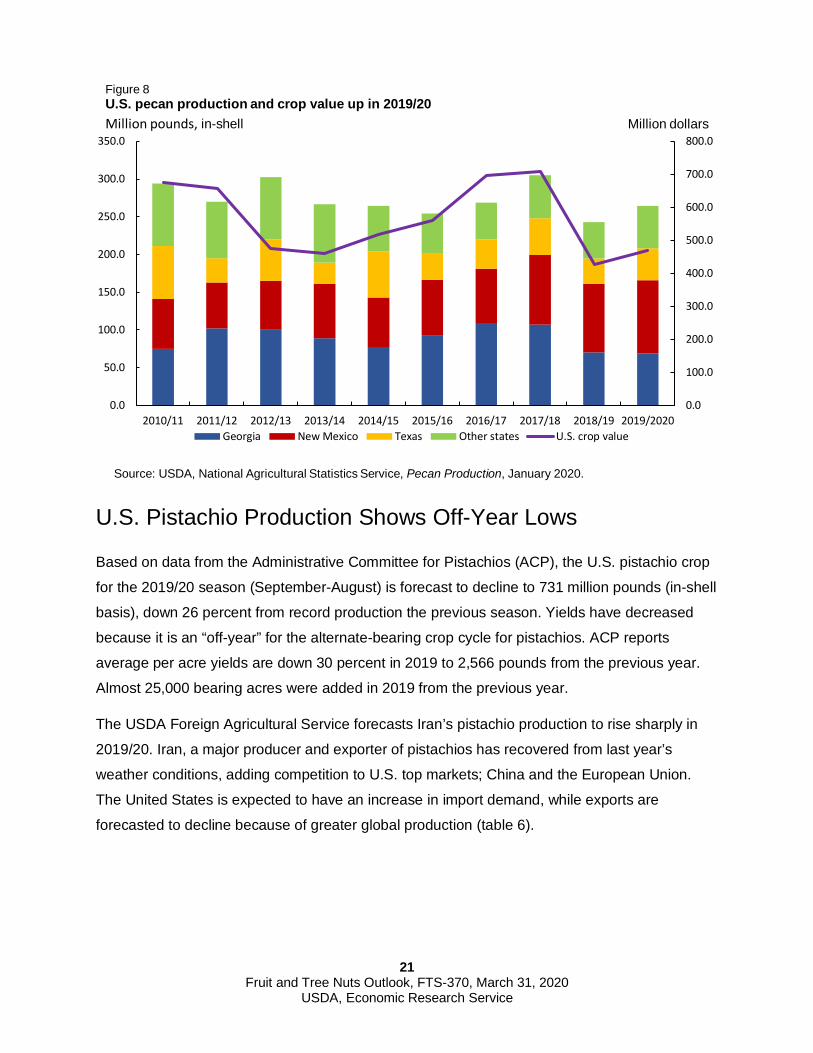
Georgia is outranked by New Mexico in 2019/2020 for a second consecutive year, after being
the leading producer of U.S. pecans for the past several years (fig. 8). Estimated at 69 million
pounds, production in Georgia in 2019/20 is down 1 percent from the previous year. Georgia is
still recovering from 2018 Hurricane Michael’s negative effects including broken tree limbs and
loss of fruiting limbs. In addition, hot dry weather in late August through October affected yields.
Statewide bearing acreage has increased from 120,000 acres in 2018 to 129,000 acres in 2019.
In New Mexico and Texas, 2019/20 production is estimated at 97 million pounds (up 6 percent
from 2018/19) and 43 million pounds (up 27 percent), respectively. In these States, along with
Arizona, Louisiana, and Oklahoma, pecan production is in the “on-year” of the crop’s alternate-
bearing cycle, which has partly contributed to the rise in production.
The U.S. average grower price for pecans rose slightly from $1.75 per pound in 2018 to $1.77
per pound in 2019. Relative price stability could be explained by lower beginning stocks—down
10 percent--compared to last year.
With the larger domestic crop in 2019/20, import demand for in-shell pecans is down, while
shelled imports —mostly from Mexico—are holding steady in October to January 2020
compared with the same period the previous season. At the same time, there has been an
increase in the cumulative volume of in-shell pecan exports in 2019/20 compared with same
period the previous season as well as a slight increase in shelled pecan exports. In 2019, China
returned as one of the top markets for US pecans and has over a 40 percent share of U.S. in-
shell pecan exports.
21 Fruit and Tree Nuts Outlook, FTS-370, March 31, 2020
USDA, Economic Research Service
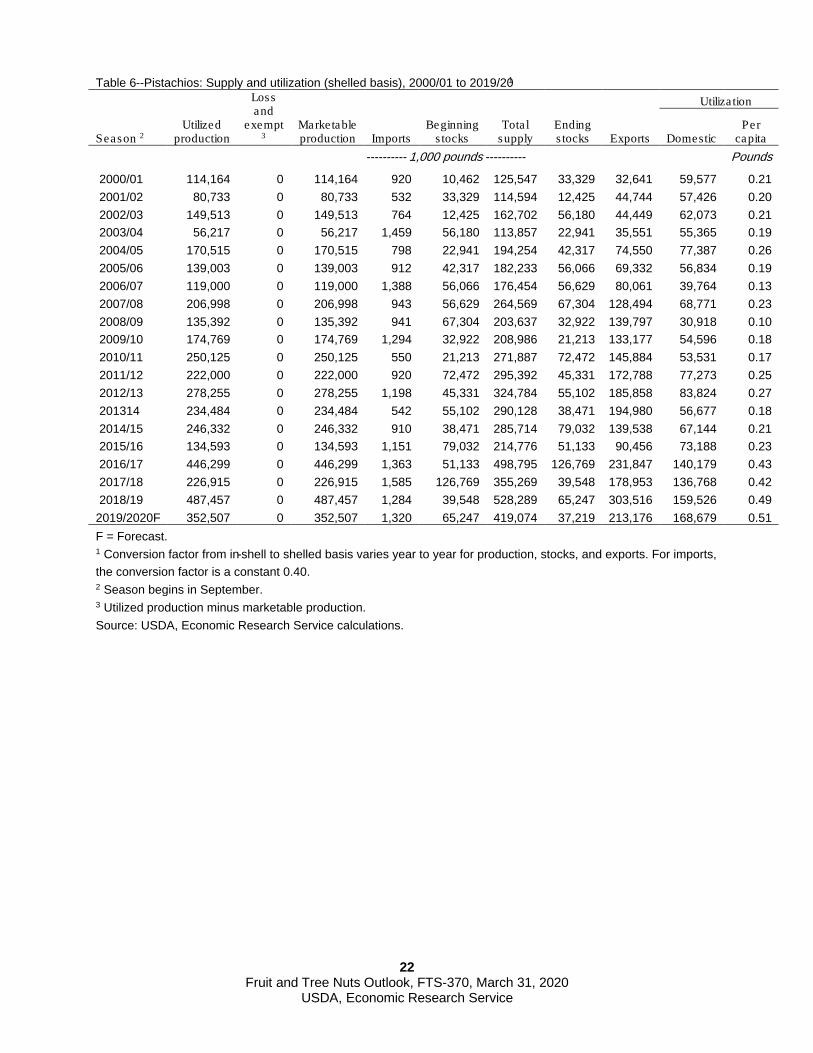
U.S. Pistachio Production Shows Off-Year Lows
Based on data from the Administrative Committee for Pistachios (ACP), the U.S. pistachio crop
for the 2019/20 season (September-August) is forecast to decline to 731 million pounds (in-shell
basis), down 26 percent from record production the previous season. Yields have decreased
because it is an “off-year” for the alternate-bearing crop cycle for pistachios. ACP reports
average per acre yields are down 30 percent in 2019 to 2,566 pounds from the previous year.
Almost 25,000 bearing acres were added in 2019 from the previous year.
The USDA Foreign Agricultural Service forecasts Iran’s pistachio production to rise sharply in
2019/20. Iran, a major producer and exporter of pistachios has recovered from last year’s
weather conditions, adding competition to U.S. top markets; China and the European Union.
The United States is expected to have an increase in import demand, while exports are
forecasted to decline because of greater global production (table 6).
0.0
100.0
200.0
300.0
400.0
500.0
600.0
700.0
800.0
0.0
50.0
100.0
150.0
200.0
250.0
300.0
350.0
2010/11 2011/12 2012/13 2013/14 2014/15 2015/16 2016/17 2017/18 2018/19 2019/2020Georgia New Mexico Texas Other states U.S. crop value
Source: USDA, National Agricultural Statistics Service, Pecan Production, January 2020.
Million pounds, in-shell Million dollars
Figure 8U.S. pecan production and crop value up in 2019/20
22 Fruit and Tree Nuts Outlook, FTS-370, March 31, 2020
USDA, Economic Research Service
Table 6--Pistachios: Supply and utilization (shelled basis), 2000/01 to 2019/201
Loss and
exempt 3
Utiliza tion
Utilized production
Marketable production
Beginning s tocks
Tota l supply
Ending s tocks
Per capita Season 2 Imports Exports Domestic
---------- 1,000 pounds ---------- Pounds 2000/01 114,164 0 114,164 920 10,462 125,547 33,329 32,641 59,577 0.21 2001/02 80,733 0 80,733 532 33,329 114,594 12,425 44,744 57,426 0.20 2002/03 149,513 0 149,513 764 12,425 162,702 56,180 44,449 62,073 0.21 2003/04 56,217 0 56,217 1,459 56,180 113,857 22,941 35,551 55,365 0.19 2004/05 170,515 0 170,515 798 22,941 194,254 42,317 74,550 77,387 0.26 2005/06 139,003 0 139,003 912 42,317 182,233 56,066 69,332 56,834 0.19 2006/07 119,000 0 119,000 1,388 56,066 176,454 56,629 80,061 39,764 0.13 2007/08 206,998 0 206,998 943 56,629 264,569 67,304 128,494 68,771 0.23 2008/09 135,392 0 135,392 941 67,304 203,637 32,922 139,797 30,918 0.10 2009/10 174,769 0 174,769 1,294 32,922 208,986 21,213 133,177 54,596 0.18 2010/11 250,125 0 250,125 550 21,213 271,887 72,472 145,884 53,531 0.17 2011/12 222,000 0 222,000 920 72,472 295,392 45,331 172,788 77,273 0.25 2012/13 278,255 0 278,255 1,198 45,331 324,784 55,102 185,858 83,824 0.27 201314 234,484 0 234,484 542 55,102 290,128 38,471 194,980 56,677 0.18 2014/15 246,332 0 246,332 910 38,471 285,714 79,032 139,538 67,144 0.21 2015/16 134,593 0 134,593 1,151 79,032 214,776 51,133 90,456 73,188 0.23 2016/17 446,299 0 446,299 1,363 51,133 498,795 126,769 231,847 140,179 0.43 2017/18 226,915 0 226,915 1,585 126,769 355,269 39,548 178,953 136,768 0.42 2018/19 487,457 0 487,457 1,284 39,548 528,289 65,247 303,516 159,526 0.49 2019/2020F 352,507 0 352,507 1,320 65,247 419,074 37,219 213,176 168,679 0.51 F = Forecast. 1 Conversion factor from in-shell to shelled basis varies year to year for production, stocks, and exports. For imports, the conversion factor is a constant 0.40. 2 Season begins in September. 3 Utilized production minus marketable production. Source: USDA, Economic Research Service calculations.

23 Fruit and Tree Nuts Outlook, FTS-370, March 31, 2020
USDA, Economic Research Service
Commodity Feature Trends in U.S. Blueberry Imports Jaclyn Kramer
According to a 2019 study in USA Today, consumers are health conscious and have a higher
awareness of the benefits of eating berries. The average blueberry per capita consumption in
2016-18 increased 457 percent from 2000-02. Domestic supplies and imports of fresh
blueberries have grown to meet domestic demand and support year-round availability. Total
U.S. imports of fresh blueberries grew 1,177 percent since 2000 to 472 million pounds in 2019.
In 2018, U.S. imports of fresh berries accounted for 67 percent of domestic fresh blueberry
consumption.
U.S. blueberry production has been trending upward, rising 284% since 2000. In 2019, the
North American Blueberry Council estimated fresh blueberry utilized production at 371.7 million
pounds. The top producing States have different seasons throughout the year. California
produces blueberries year-round, with larger supplies from May to July. Florida’s peak
production is during the early spring. New Jersey produces blueberries in the summer, while
Michigan, Washington, and Oregon produce blueberries in the fall. Countries exporting to the
United States during U.S. production’s off-season have expanded their seasons to capture
market share and higher prices, increasing competition for some U.S. producers.
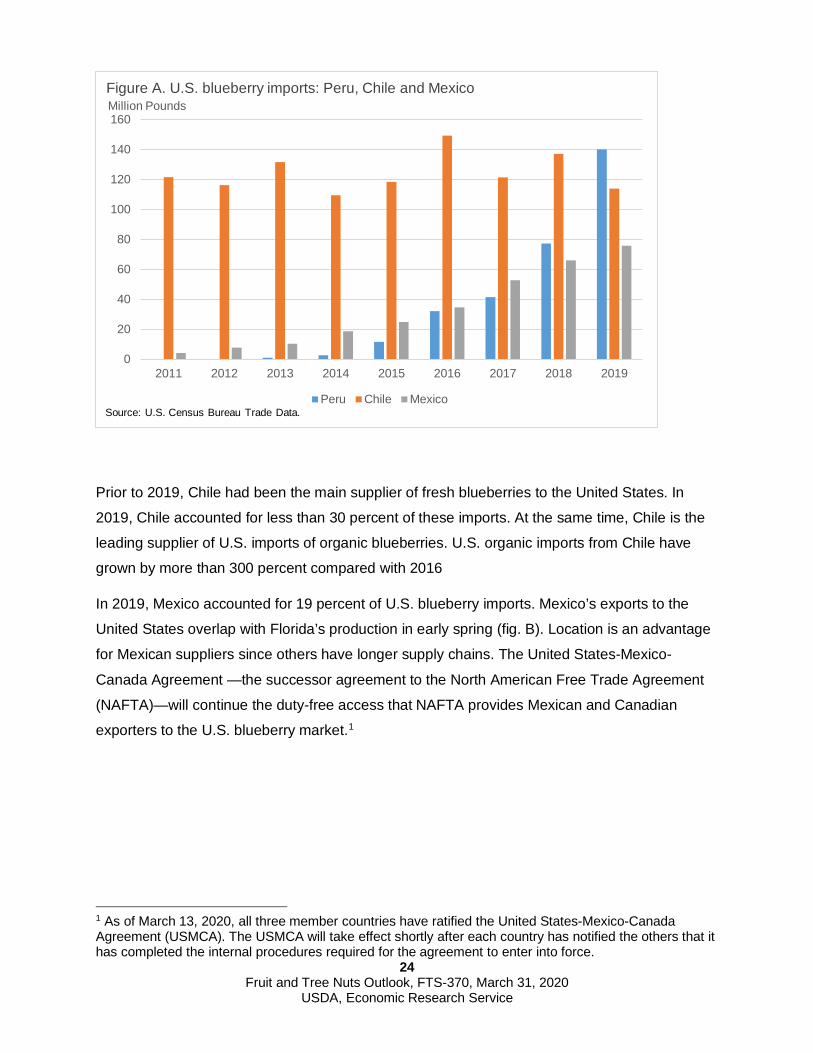
Latin America has emerged as a major growing region for blueberries, where recent plantings
have resulted in rapid production expansion and increased supply to export markets. The
leading Latin American suppliers of U.S. blueberry imports are Peru, Chile, and Mexico (fig. A).
Each country has different advantages including seasons, weather conditions, and shipping
costs.
Peru is now the number one foreign blueberry supplier to the United States. Peru’s favorable
weather conditions have played a significant role in the large increase in production. In 2019,
Peru accounted for 30% of U.S. blueberry imports. Peruvian shipments in the fall overlap with
late-season production in Oregon and Washington State.
24 Fruit and Tree Nuts Outlook, FTS-370, March 31, 2020
USDA, Economic Research Service
Prior to 2019, Chile had been the main supplier of fresh blueberries to the United States. In
2019, Chile accounted for less than 30 percent of these imports. At the same time, Chile is the
leading supplier of U.S. imports of organic blueberries. U.S. organic imports from Chile have
grown by more than 300 percent compared with 2016
In 2019, Mexico accounted for 19 percent of U.S. blueberry imports. Mexico’s exports to the
United States overlap with Florida’s production in early spring (fig. B). Location is an advantage
for Mexican suppliers since others have longer supply chains. The United States-Mexico-
Canada Agreement —the successor agreement to the North American Free Trade Agreement
(NAFTA)—will continue the duty-free access that NAFTA provides Mexican and Canadian
exporters to the U.S. blueberry market.1
1 As of March 13, 2020, all three member countries have ratified the United States-Mexico-Canada Agreement (USMCA). The USMCA will take effect shortly after each country has notified the others that it has completed the internal procedures required for the agreement to enter into force.
0
20
40
60
80
100
120
140
160
2011 2012 2013 2014 2015 2016 2017 2018 2019
Million PoundsFigure A. U.S. blueberry imports: Peru, Chile and Mexico
Peru Chile MexicoSource: U.S. Census Bureau Trade Data.

25 Fruit and Tree Nuts Outlook, FTS-370, March 31, 2020
USDA, Economic Research Service
The U.S. blueberry market is changing rapidly as demand continues to rise. Domestic
production and imports are growing. Blueberry production in Peru, Chile and Mexico is
increasing rapidly for the export market. Consumers are benefiting from year-round supply
availability and competitive prices. With this growth comes stronger competition from abroad for
U.S. producers.
0102030405060708090
100
Jan Mar May Jul Sep Nov Jan Mar May Jul Sep Nov
Million Pounds
U.S. Peru Chile Mexico ROW
2000 2019
Figure B. U.S. blueberry shipments: domestic and imports, 2000 and 2019 by month
*Note: ROW = Rest of the World, includes Canada cultivated and wild blueberries with large blueberries shipments in July and August. Source: Agricultural Marketing Service Shipment Data, U.S. Census Bureau Trade Data.

26 Fruit and Tree Nuts Outlook, FTS-370, March 31, 2020
USDA, Economic Research Service
Suggested Citation Kramer, J., Calvin, L., and Simnitt, S. (2020), Fruit and Tree Nuts Outlook, FTS-370, U.S.
Department of Agriculture, Economic Research Service, March 31, 2020.
Use of commercial and trade names does not imply approval or constitute endorsement by USDA.
In accordance with Federal civil rights law and U.S. Department of Agriculture (USDA) civil rights regulations and policies, the USDA, its Agencies, offices, and employees, and institutions participating in or administering USDA programs are prohibited from discriminating based on race, color, national origin, religion, sex, gender identity (including gender expression), sexual orientation, disability, age, marital status, family/parental status, income derived from a public assistance program, political beliefs, or reprisal or retaliation for prior civil rights activity, in any program or activity conducted or funded by USDA (not all bases apply to all programs). Remedies and complaint filing deadlines vary by program or incident.
Persons with disabilities who require alternative means of communication for program information (e.g., Braille, large print, audiotape, American Sign Language, etc.) should contact the responsible Agency or USDA's TARGET Center at (202) 720-2600 (voice and TTY) or contact USDA through the Federal Relay Service at (800) 877-8339. Additionally, program information may be made available in languages other than English.
To file a program discrimination complaint, complete the USDA Program Discrimination Complaint Form, AD-3027, found online at How to File a Program Discrimination Complaint and at any USDA office or write a letter addressed to USDA and provide in the letter all of the information requested in the form. To request a copy of the complaint form, call (866) 632-9992. Submit your completed form or letter to USDA by: (1) mail: U.S. Department of Agriculture, Office of the Assistant Secretary for Civil Rights, 1400 Independence Avenue, SW, Washington, D.C. 20250-9410; (2) fax: (202) 690-7442; or (3) email: [email protected].
USDA is an equal opportunity provider, employer, and lender.