fruit composition & quality - aggie horticulture...11/11/2016 1 fruit composition & quality...
TRANSCRIPT

11/11/2016
1
Fruit Composition & Quality
Justin Scheiner, Ph.D. Assistant Professor and
Extension Viticulture Specialist
Wine Quality Potential
High quality fruit does not guarantee high quality wine,
but low quality fruit guarantees low quality wine.

11/11/2016
2
Linking Viticulture to Wine Flavor
Grapes ~ a few hundred odorants Wine ~ 1,000 odorants
Primary flavors Secondary flavors
What are the Chemical Components?
Component Must (% by weight)
Wine (% by weight)
Water 75-85% 87-89%
Sugar 17-26% --
Alcohol -- 8-14%
Organic Acids 0.4-1.2% 0.5%
Minerals 0.1-0.4% 0.05-0.3%
Polyphenolics 0.4-0.5% 0.02-0.2%
Aroma Compounds <0.02% <0.02% Adopted from: Y. Margalit , Concepts in Wine Chemistry, 2012

11/11/2016
3
Illustration by J. Koutroumanidis, Winetitles
Consumer preference has been moving toward wines with
“ripe” characteristics.
J. Alston et al. (JWE, 2011)

11/11/2016
4
Metrics for Acidity pH reflects molar concentration of free protons
– pH = -log [H+] (e.g., a wine with a pH of 3 has 10x more free protons than a wine with pH of 4)
Titratable acidity (TA) reflects total concentration of titratable
H+ (pH + bound H+)
OH
HOOC
OH
COOH
OH
HOOC
OH
COO-
OH
-OOC
OH
COO-
Tartaric acid Bitartrate Tartrate
H+ H+
Titratable acidity is an excellent predictor of perceived acidity
From: Plane et al. 1980

11/11/2016
5
Why do we care so much about pH?
pH is critical for:
– microbial stability
– color
– malolactic fermentation
– preservatives (sulfur dioxide, sorbate)
– oxidation
Bisulfite
Molecular (antimicrobial &
antioxidant)
(antioxidant)
To achieve a “safe” level of molecular SO2 a white wine would require:
13 ppm free at pH 3.0 40 ppm free at pH 3.5 125 ppm free at pH 4.0 200 ppm free at pH 4.3
Juice/wine pH

11/11/2016
6
Organic Acids During Berry Development
0
5
10
15
20
25
0 100 20 40 60 80
Co
nce
ntr
atio
n in
Ju
ice
Days After Bloom
malic acid g/L tartaric acid g/L
veraison
Dilution
Respiration
Tartaric Acid and Potassium
OH
HOOC
OH
COOH
OH
HOOC
OH
COO-
Tartaric acid Bitartrate H+
K+

11/11/2016
7
Factors Affecting K+ Concentration
More K+ with longer hang-time, high water availability
and water stress, and dense shading, high soil K+
From: Walker et al. 2012
C. McDonnell Wood (Ph.D. Dissertation, 2011)
Clusters/vine
Clusters/vine
Clusters/vine
Not thinned
Juic
e p
H
Days after veraison
Juice pH
Cluster thinning at fruit set – Cabernet Sauvignon

11/11/2016
8
Components of Quality
Skin: 11% total tannin, long polymers, all color, volatiles, potassium
Pulp: sugars, acids, potassium
Seeds: 89% of total tannin, short polymers
Measuring Acidity
pH: test strips, pH meter
• Calibrate meter regularly
• Proper storage
• Replace buffers annually
• Temperature correction
11/11/2016
9
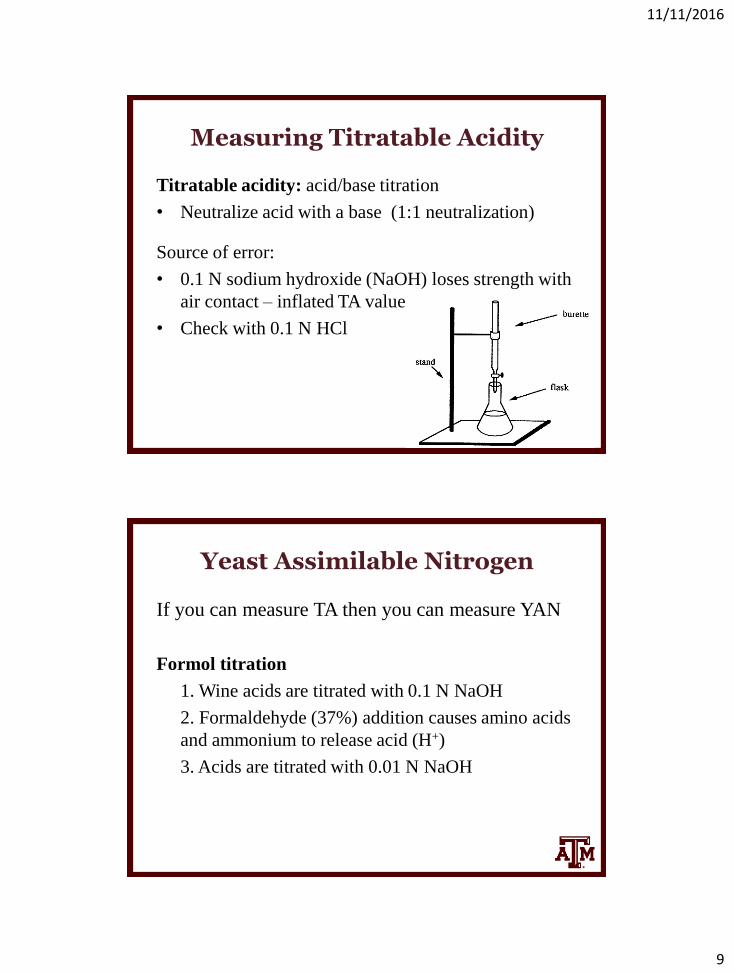
Measuring Titratable Acidity
Titratable acidity: acid/base titration
• Neutralize acid with a base (1:1 neutralization)
Source of error:
• 0.1 N sodium hydroxide (NaOH) loses strength with
air contact – inflated TA values
• Check with 0.1 N HCl
Yeast Assimilable Nitrogen
If you can measure TA then you can measure YAN
Formol titration
1. Wine acids are titrated with 0.1 N NaOH
2. Formaldehyde (37%) addition causes amino acids
and ammonium to release acid (H+)
3. Acids are titrated with 0.01 N NaOH

11/11/2016
10
Sugars
From: N. Dokoozlian, Grape Berry Growth and Development
Measuring Sugars
Soluble solids: ≥90% in ripe grapes are sugars
Hydrometer: Specific gravity (density of juice / density
of water)
• Calibrated at room temperature
Refractometer: refractive index
• Calibrated at room temperature
11/11/2016
11
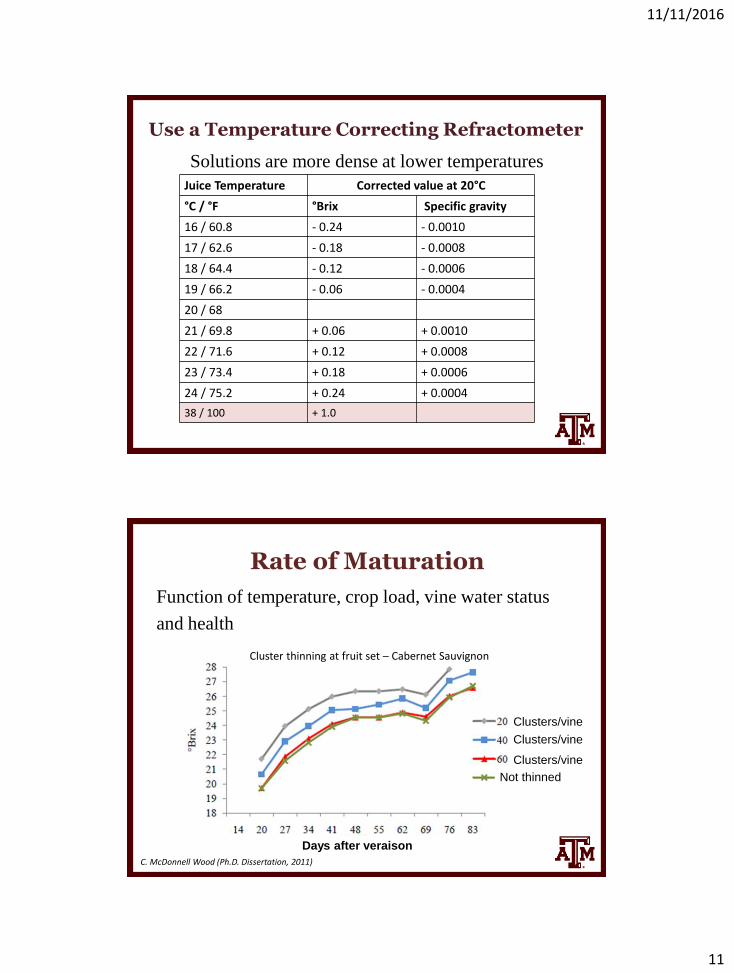
Use a Temperature Correcting Refractometer
Solutions are more dense at lower temperatures
Juice Temperature Corrected value at 20°C
°C / °F °Brix Specific gravity
16 / 60.8 - 0.24 - 0.0010
17 / 62.6 - 0.18 - 0.0008
18 / 64.4 - 0.12 - 0.0006
19 / 66.2 - 0.06 - 0.0004
20 / 68
21 / 69.8 + 0.06 + 0.0010
22 / 71.6 + 0.12 + 0.0008
23 / 73.4 + 0.18 + 0.0006
24 / 75.2 + 0.24 + 0.0004
38 / 100 + 1.0
Rate of Maturation
Function of temperature, crop load, vine water status
and health
Days after veraison
Clusters/vine
Clusters/vine
Clusters/vine
Not thinned
Days after veraison
C. McDonnell Wood (Ph.D. Dissertation, 2011)
Cluster thinning at fruit set – Cabernet Sauvignon
11/11/2016
12
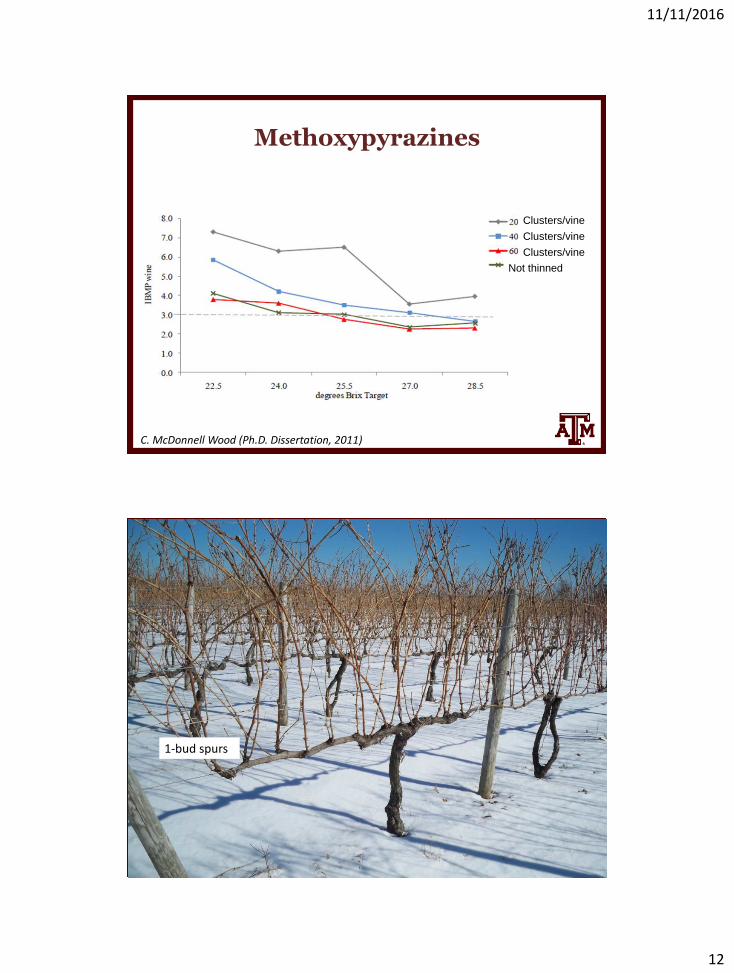
Methoxypyrazines
C. McDonnell Wood (Ph.D. Dissertation, 2011)
Clusters/vine
Clusters/vine
Clusters/vine
Not thinned
1-bud spurs

11/11/2016
13
1-bud spurs 2-bud spurs
Under-Pruned

11/11/2016
14
Divided canopy systems were developed for managing too much vigor

11/11/2016
15

11/11/2016
16
Cluster Thinning
Why: maintain balance, improve quality, reduce unevenness
When: before veraison (reduce yield), end of veraison (reduce
unevenness)
• Target least advanced clusters, weak shoots
Hedging
When: after shoots clear the top of the trellis, but before
they droop over and shade the fruiting zone
• At a minimum, leave 15 mature leaves per shoot

11/11/2016
17
Don’t over-hedge
Shoot Positioning
Why: minimize shoot overlap, improve spray
penetration, improve leaf sun exposure
When: after thinning, when shoots reach first catch
wire (for VSP systems), before tendrils become
strongly attached
• Watch out for shoot breakage

11/11/2016
18
Leaf & Lateral Removal
Why: improve cluster microclimate
When: within a few weeks of fruit set
From: Austin et al.

11/11/2016
19
Fungal Disease Reduces Quality
Late Season Grape Berry Moth

11/11/2016
20
Sampling
Accuracy Versus Precision
poor accuracy and poor precision good accuracy and good precision
poor accuracy and good precision good mean accuracy and poor precision
A good analyst should have good accuracy and precision. • precision – random error • accuracy – systematic error, difference between measured mean and true value

11/11/2016
21
Vineyard Variability
• Vineyard variability leads to reduced quality
Between vines: soil, vine age, frost damage, disease, pruning
Between clusters on the same vine: cluster position, vine stress,
disease, frost damage
Between berries on the same cluster: sun exposure,
shot berries, poor weather at
bloom, micronutrient deficiency,
disease, insect infestation
Berry or Whole Cluster Samples?

11/11/2016
22
Sample vines randomly or by a grid system
• Avoid sampling from exterior vines (border rows, end vines)
or abnormal vines
• Keep records and compare to previous years and harvest data
• If results do not correlate with harvest data, adjust sampling
procedure
Berry Sampling
Better suited for small vineyards and early sampling
• Avoid border rows and end vines
+/- 1 °Brix 200 berries (uniform vineyard)
+/- 0.5 °Brix 500 berries
– 5 berries per cluster on one cluster per vine
– One berry from each side of the shoulder, middle, and
bottom of the cluster (randomize side where sample is
taken)

11/11/2016
23
Cluster Sampling
Accounts for within cluster variability (5-7 °Brix)
Sample size should be related to the size of the
block and variability within the block
– A uniform block of ≤ 5 acres, sample 20-25 clusters
– A block with a high degree of variability, > 25
clusters
– One randomly selected cluster per vine
– Sample on both sides of the row
Do not determine maturity based on a single vine.

11/11/2016
24
• Process samples as soon as possible (within a few hours)
• Try to duplicate actual winery processing
– 300 mL of juice from 1 lb of fruit is approximately equivalent to
160 gallons of juice/ton of fruit
Processing Sample
Skin - aroma - tannins - color - cations
Seeds) - tannins - oils