fruit group - center for nutrition policy and promotion clusters, percent of consumption, and...
TRANSCRIPT

Item Clusters, Percent of Consumption, and Representative Foods for USDA Food Pattern Food Groups and Subgroups
Whole Fruit 70.4 Apples, cooked or canned 0.8 1.1 Applesauce, canned, unsweetened, without vitamin C Apples, dried 0.1 0.1 Apple, dried, sulfured, uncooked Apples, raw 18.5 26.3 Apple, raw, with skin Applesauce 1.0 1.4 Applesauce, canned, unsweetened, without vitamin C Apricot, cooked or canned 0.0 0.0 Apricot, canned, water pack Apricot, dried 0.0 0.1 Apricot, dried, sulfured, uncooked Apricot, raw 0.1 0.1 Apricots, raw Bananas, cooked or canned (Incl. red) 0.1 0.2 Bananas, raw
Bananas, dried 0.0 0.1 Bananas, dehydrated Bananas, raw (Incl. white, red, Chinese, 12.8 18.2 Bananas, raw apple types) Blackberries, cooked or canned
0.0
0.0
Blackberries, raw
Blackberries, raw 0.3 0.4 Blackberries, raw Blueberries, cooked or canned 0.2 0.4 Blueberries, raw Blueberries, dried 0.0 0.0 Blueberries, raw Blueberries, raw 1.5 2.1 Blueberries, raw Boysenberries, raw 0.0 0.0 Boysenberries, frozen, unsweetened Cantaloupe, raw 2.0 2.9 Melons, cantaloupe, raw Casaba Melon, raw 0.0 0.0 Melons, casaba, raw Cherries, cooked or canned (Incl. 0.1 0.1 Cherries, sour, red, canned, water pack maraschino) Cherries, raw
0.0
1.4
Cherries, sweet, raw
Cranberries, cooked or canned 0.1 0.2 Cranberry sauce, canned, sweetened Cranberries, dried 0.4 0.6 Cranberries, dried, sweetened Cranberries, raw 0.0 0.0 Cranberries, raw Dates, raw and cooked 0.1 0.1 Dates, deglet noor Dewberries, raw 0.0 0.0 Blackberries, raw Figs, cooked or canned 0.0 0.1 Figs, canned, water pack Figs, dried 0.0 0.0 Figs, dried, uncooked Figs, raw 0.0 0.0 Figs, raw Grapefruit, cooked or canned 0.0 0.0 Grapefruit sections, canned, water pack Grapefruit, raw 0.6 0.9 Grapefruit, raw, pink, red, and white Grapes, cooked or canned 0.0 0.0 Grapes, canned, Thompson seedless, water pack Grapes, raw 3.8 5.4 Grapes, red/green (European type), raw Guava, cooked or canned 0.0 0.0 Guavas, common, raw Guava, raw 0.0 0.0 Guavas, common, raw Honeydew Melon, raw 0.4 0.5 Melons, honeydew, raw Huckleberries, raw 0.0 0.0 Huckleberries, raw Japanese Pears, raw 0.1 0.1 Pears, asian, raw Juneberry, raw 0.0 0.0 Blackberries, raw Kiwifruit, raw 0.1 0.2 Kiwifruit, green, raw Kumquat, cooked or canned 0.0 0.0 Kumquats, raw Kumquat, raw 0.0 0.0 Kumquats, raw Lemons, raw or cooked (Incl. lemon peel 0.0 0.0 Lemons, raw, without peel & citron) Lime, raw (Incl. calamondin) 0.0 0.0 Limes, raw
FRUIT GROUP
Subgroup and Item Clusters % food % food group subgroup
Representative Food (used to represent nutrient value of the item cluster)

Item Clusters, Percent of Consumption, and Representative Foods for USDA Food Pattern Food Groups and Subgroups
Subgroup and Item Clusters % food % food Representative Food (used to represent nutrient value of the item cluster) group subgroup
Loganberries, raw 0.0 0.0 Loganberries, frozen Lychee, cooked or canned 0.0 0.0 Litchis, raw Lychee, raw 0.0 0.0 Litchis, raw Lychee, dried 0.0 0.0 Litchis, dried Mango, cooked or canned 0.0 0.0 Mangos, raw Mango, dried 0.1 0.1 Mangos, raw Mango, raw 0.8 1.2 Mangos, raw Mixed Other Fruit (NOT citrus) 0.0 0.0 Applesauce, canned, unsweetened, without vitamin C Mulberries, raw 0.0 0.0 Mulberries, raw Nectarine, cooked or canned 0.0 0.0 Peaches, canned, water pack Nectarine, raw 0.5 0.7 Nectarines, raw Oranges, cooked or canned 0.0 0.0 Tangerines, mandarin oranges, canned , juice pack Oranges, raw (Incl. orange peel) 3.5 5.0 Oranges, raw, all varieties Papaya, cooked or canned (Incl. green) 0.0 0.0 Papayas, raw
Papaya, dried 0.0 0.0 Papayas, raw Papaya, raw 0.2 0.2 Papayas, raw Passion Fruit, raw 0.0 0.0 Passion-fruit, (granadilla), purple, raw Peaches, cooked or canned 0.6 0.9 Peaches, canned, water pack Peaches, dried 0.0 0.0 Peach, dried, sulfured, uncooked Peaches, raw 2.2 3.2 Peaches, raw Pears, cooked or canned 0.4 0.6 Pears, canned, water pack Pears, dried 0.0 0.0 Pears, dried, sulfured, uncooked Pears, raw 1.5 2.1 Pears, raw Persimmons, raw 0.2 0.3 Persimmons, native, raw Pineapple, cooked or canned 0.4 0.6 Pineapples, canned, water pack Pineapple, dried 0.0 0.0 Pineapples, raw, all varieties Pineapple, raw 1.2 1.7 Pineapples, raw, all varieties Plums, dried (include dried prunes) 0.1 0.2 Plums, dried (prunes), uncooked Plums, raw 0.4 0.5 Plums, raw Plums/Prunes, cooked or canned 0.0 0.0 Plums, canned, purple, water pack Pomegranate, raw 0.1 0.1 Pomegranates, raw Raisins, cooked or canned 0.4 0.6 Raisins, seedless Raisins, raw (Incl. raw & dried currants) 1.4 2.0 Raisins, seedless Raspberries, cooked or canned 0.0 0.0 Raspberries, raw Raspberries, raw (incl. black & red) 0.2 0.3 Raspberries, raw Rhubarb, cooked or canned 0.0 0.0 Rhubarb, raw Rhubarb, raw 0.0 0.0 Rhubarb, raw Star Fruit (Carambola), cooked 0.0 0.0 Carambola (starfruit), raw Star Fruit (Carambola), raw 0.0 0.0 Carambola (starfruit), raw Strawberries, cooked, canned, dried 0.2 0.3 Strawberries, frozen, unsweetened Strawberries, raw 3.6 5.1 Strawberries, raw Tamarind, dried 0.0 0.0 Tamarinds, raw Tamarind, raw or cooked 0.0 0.0 Tamarinds, raw Tangerine, raw or canned/cooked 0.9 1.3 Tangerines (mandarin oranges), raw Unknown Citrus Fruit 0.4 0.5 Strawberries,raw Unknown Other Fruit 1.6 2.2 Applesauce, canned, unsweetened, without vitamin C Watermelon, raw 5.2 7.5 Watermelon, raw Youngberries, raw 0.0 0.0 Blackberries, raw
Whole Fruit, continued

Item Clusters, Percent of Consumption, and Representative Foods for USDA Food Pattern Food Groups and Subgroups
Subgroup and Item Clusters % food % food Representative Food (used to represent nutrient value of the item cluster) group subgroup
Fruit Juice 29.6
Apple Juice 5.4 18.3 Apple juice, canned/bottled, unsweetened, without vitamin C Apricot Juice/Nectar 0.0 0.0 Apricot nectar, canned, without vitamin C Banana Juice/Nectar 0.0 0.0 Bananas, raw Blackberry Juice 0.0 0.0 Blackberry juice, canned Cantaloupe Juice/Nectar 0.0 0.0 Melons, cantaloupe, raw Cherry Juice 0.0 0.0 Cherries, sweet, raw Cranberry Juice 0.4 1.3 Cranberry juice,unsweetened Grape Juice 1.2 4.1 Grape juice, canned, unsweetened, without vitamin C
Grapefruit Juice 0.5 1.7 Grapefruit juice, white, canned, unsweetened Guava Juice/Nectar 0.0 0.1 Guava nectar, canned Lemon Juice 0.4 1.5 Lemon juice, canned or bottled Lime Juice 0.1 0.5 Lime juice, canned or bottled, unsweetened Mango Juice/Nectar 0.1 0.3 Mango nectar, canned Mixed Fruit Juice (Citrus) 0.0 0.0 Orange juice, chilled, including from concentrate Mixed Fruit Juice (NOT citrus) 0.4 1.3 Apple juice, canned/bottled, unsweetened, without Orange Juice (Incl. tangerine & acerola)
17.2
58.2
vitamin C Orange juice, chilled, including from concentrate
Papaya Juice/Nectar 0.1 0.2 Papaya nectar, canned Passion Fruit Juice/Nectar 0.0 0.1 Passion fruit juice, yellow, raw Peach Juice/Nectar 0.0 0.0 Peach nectar, canned, without vitamin C Pear Juice/Nectar 0.0 0.0 Baby food, juice, pear Pineapple Juice 0.4 1.4 Pineapple juice, canned, unsweetened, without vitamin C
Plum Juice 0.0 0.0 Prune juice, canned Pomegranate Juice 0.2 0.6 Pomegranate juice, bottled Prune Juice 0.1 0.4 Prune juice, canned Raspberry Juice 0.0 0.0 Blackberry juice, canned Soursop Juice/Nectar 0.0 0.0 Guanabana nectar, canned Strawberry Juice 0.0 0.1 Blackberry juice, canned Unknown Citrus Fruit Juice 1.2 4.2 Orange juice, chilled, including from concentrate Unknown Other Fruit Juice 1.6 5.5 Apple juice, canned/bottled, unsweetened, without Watermelon Juice
0.0
0.1
vitamin C Watermelon, raw

Item Clusters, Percent of Consumption, and Representative Foods for USDA Food Pattern Food Groups and Subgroups
Subgroup and Item Clusters % food group
% food subgroup
Representative Food (used to represent nutrient value of the item cluster)
VEGETABLE GROUP
Dark Green Vegetables 7.5 Arugula Lettuce 0.1 0.8 Arugula, raw Bak Choy (Chinese Cabbage) 0.2 2.3 Cabbage, Chinese (pak-choi), cooked, without salt Broccoli, cooked 2.4 32.5 Broccoli, cooked, boiled, without salt Broccoli, raw 0.5 6.8 Broccoli, raw Butterhead Lettuce (Boston, Bibb) 0.0 0.0 Lettuce, butterhead (Bibb and Boston), raw Chard, cooked (Incl. cooked escarole) 0.0 0.5 Chard, swiss, cooked, boiled, without salt
Cilantro, raw and ckd 0.1 0.9 Coriander leaves (Cilantro), raw Collard Greens 0.3 4.1 Collards, cooked, boiled, without salt Grape Leaves 0.0 0.1 Grape leaves, raw Kale (Incl. lambsquarters, mustard cabbage, beet greens, bitter melon, horseradish, and jute leaves)
0.1 1.4 Kale, cooked, boiled, without salt
Mixed Dark Leafy Greens, raw (incl. Romaine, Chicory, Escarole, and Endive)
1.9 25.0 Lettuce, cos or romaine, raw
Mustard Greens (Incl. dandelion and poke greens)
0.1 1.0 Mustard greens, cooked, boiled, without salt
Parsley (Incl. epazote) 0.0 0.6 Parsley, raw Seaweed (Laver), high in Vit. A 0.0 0.0 Seaweed, laver, raw Spinach, cooked (Incl. taro leaves) 0.6 7.8 Spinach, cooked, boiled, without salt Spinach, raw 1.1 15.2 Spinach, raw Turnip Greens 0.1 1.1 Turnip greens, cooked, boiled, without salt Unknown dark green veg. 0.0 0.0 Parsley, raw Watercress (Incl. thistle leaves) 0.0 0.1 Watercress, raw
Beans and Peas (Legumes) 6.0 Black beans 0.5 8.1 Beans, black, cooked, boiled, without salt Chickpeas 0.3 4.8 Chickpeas, cooked, boiled, without salt Cowpeas 0.0 0.2 Cowpeas, common, cooked, boiled, without salt Kidney Beans 0.8 13.9 Beans, kidney, cooked, boiled, without salt Lentils 0.4 6.3 Lentils, cooked, boiled, without salt Lima beans, mature (Incl. fava and mung beans)
0.1 1.9 Lima beans, large, cooked, boiled, without salt
Pinto beans (Incl. pink beans) 2.3 37.8 Beans, pinto, cooked, boiled, without salt Soybeans/Edamame 0.0 0.8 Soybeans, mature cooked, boiled, without salt Split Peas 0.1 1.4 Peas, split, cooked, boiled, without salt Unknown legume 0.0 0.2 Beans, small white, cooked, boiled, without salt White beans (Incl. navy and pea beans) 1.5 24.7 Beans, small white, cooked, boiled, without salt

Item Clusters, Percent of Consumption, and Representative Foods for USDA Food Pattern Food Groups and Subgroups
Subgroup and Item Clusters % food group
% food subgroup
Representative Food (used to represent nutrient value of the item cluster)
Red and Orange Vegetables 23.6
Carrot Juice 0.0 0.0 Carrot juice, canned Carrots, cooked 2.4 10.2 Carrots, cooked, boiled, drained, without salt Carrots, raw 1.8 7.7 Carrots, raw Chili Pepper, hot, red, (Incl. color NS) 0.5 2.1 Peppers, hot chili, red, raw Ckd Sweet Potatoes/orange yams 0.6 2.4 Sweet potato, cooked, baked in skin, without salt Ckd Winter Squash 0.2 0.7 Squash, winter, all varieties, baked, without salt Pumpkin 0.1 0.6 Pumpkin, canned, without salt Red Peppers, sweet, bell (Incl. 0.2 0.7 Peppers, sweet, red, cooked, boiled, without salt Tomato Juice 1.2 5.1 Tomato juice, canned, without salt added Tomatoes, cooked 11.2 47.5 Tomatoes, canned, puree, without salt added Tomatoes, raw 5.4 23.0 Tomatoes, red, ripe, raw Unknown red/orange veg. 0.0 0.0 Carrots, cooked, boiled, without salt
Starchy Vegetables 26.8 Cassava (Incl. taro, burdock root, and white yam)
0.1 0.5 Cassava, raw
Corn, white (Incl. hominy) 0.5 1.8 Corn, sweet, white, cooked, boiled, without salt Corn, yellow 2.6 9.8 Corn, sweet, yellow, cooked, boiled, without salt Cowpeas, Field Peas, Blackeye Peas, not dried (Incl. pigeon peas)
0.1 0.2 Cowpeas, immature, cooked, boiled, without salt
French Fries 4.0 14.9 Potatoes, french fried, frozen, without salt, oven heated
Green Peas 1.4 5.3 Peas, green, cooked, boiled, without salt Home Fries/Hash Browns 2.6 9.7 Potatoes, hashed brown, frozen, plain, prepared Lima Beans, immature 0.3 1.1 Lima beans, immature, cooked, boiled, without salt Plantains 0.3 1.1 Plantains, cooked Potato Chips/Puffs/Sticks 4.7 17.4 Potato chips, fat free, salted Potatoes, baked 3.5 13.2 Potatoes, white, flesh and skin, baked Potatoes, boiled (Incl. breadfruit) 6.6 24.5 Potatoes, boiled, flesh, cooked without skin or salt Vegetable starches 0.1 0.2 Potato Flour Waterchestnuts (Incl. lotus root) 0.1 0.3 Waterchestnuts, chinese, canned
Other Vegetables 36.1 Artichoke 0.1 0.2 Artichokes, cooked, boiled, drained, without salt Asparagus 0.4 1.0 Asparagus, cooked, boiled, drained Avocado 1.1 2.9 Avocados, raw, all commercial varieties Bamboo Shoots 0.3 0.8 Bamboo shoots, cooked, drained, without salt Beets 0.2 0.5 Beets, cooked, boiled, drained Brussels Sprouts 0.2 0.7 Brussels sprouts, cooked, boiled, drained, without salt
Cactus (Nopales) 0.1 0.1 Nopales, cooked, without salt Cauliflower (Incl. broccoflower) 0.5 1.4 Cauliflower, cooked, boiled, drained, without salt Celery, cooked 1.2 3.3 Celery, cooked, boiled, drained, without salt Celery, raw 0.9 2.4 Celery, raw Chili Pepper, hot, green, ckd and raw (Incl. serrano and dwarf green)
0.1 0.2 Peppers, hot chili, green, raw
Chives 0.0 0.0 Chives, raw Cucumber (Incl. flowers of sesbania, squash, lily, pumpkin)
2.3 6.4 Cucumber, peeled,raw

Item Clusters, Percent of Consumption, and Representative Foods for USDA Food Pattern Food Groups and Subgroups
Subgroup and Item Clusters % food group
% food subgroup
Representative Food (used to represent nutrient value of the item cluster)
Other Vegetables, continued
Cucumber Pickles (Incl. relish and capers)
1.3 3.6 Pickles, cucumber, dill, low sodium
Edible-pod Green Peas (Incl. snowpeas, fern shoots)
0.3 0.7 Peas, edible-podded, boiled, drained, without salt
Eggplant (Incl. hearts of palm) 0.5 1.4 Eggplant, cooked, boiled, drained, without salt Garlic 0.5 1.4 Garlic, raw Green Beans (Incl. snap and yellow beans)
3.8 10.5 Beans, snap, green, cooked, boiled, drained, without salt
Green Cabbage, cooked 0.7 2.0 Cabbage, cooked, boiled, drained, without salt Green Cabbage, raw (Incl. savoy cabbage)
0.9 2.4 Cabbage, raw
Green Peppers, cooked, sweet, bell 1.1 2.9 Peppers, sweet, green, cooked, boiled, drained, without salt
Green Peppers, raw, sweet, bell (Incl. color NS)
0.7 2.0 Pepper, sweet, green, raw
Horseradish (Incl. ginger root) 0.1 0.2 Horseradish Lettuce (Incl. Iceberg) 8.1 22.3 Lettuce, iceberg, raw Miscellaneous Other Vegetables 0.0 0.1 Seaweed, wakame, raw Mungbeans Sprouts (Incl. alfalfa and buckwheat sprouts)
0.5 1.4 Mung beans, mature seeds, sprouted, cooked, boiled, drained, without salt
Mushrooms (Incl. shiitake) 1.4 3.8 Mushrooms, cooked, boiled, drained, without salt Okra (Incl. horseradish pods) 0.1 0.3 Okra, cooked, boiled, drained, without salt Olives 0.4 1.2 Olives, ripe, canned (small-extra large) Onions, mature, cooked (includes Leeks) 4.0 11.2 Onions, cooked, boiled, drained, without salt
Onions, mature, raw 1.8 4.8 Onions, raw Radishes 0.1 0.3 Radish, raw Red Cabbage (Incl. radicchio) 0.1 0.4 Cabbage, red, raw Spring Onions/Scallions 0.5 1.5 Onions, spring or scallions (includes tops and bulb), raw
Summer Squash, yellow and zucchini (Incl. spaghetti squash, chayote, bitter and winter melons)
1.0 2.9 Squash, summer, all varieties, cooked, boiled, drained, without salt
Tomatillos 0.2 0.4 Tomatillos, raw Turnips (Incl. rutabaga, jicama, kohlrabi, celeriac, fennel bulb)
0.2 0.6 Turnips, cooked, boiled, drained, without salt
Unknown other vegetable 0.6 1.8 Onions, cooked, boiled, drained, without salt

Item Clusters, Percent of Consumption, and Representative Foods for USDA Food Pattern Food Groups and Subgroups
Whole Grains 11.8 Brown rice 0.8 6.4 Brown rice, long-grain, cooked Oatmeal and other cooked cereals 1.5 12.9 Oats, regular, quick, and instant, unenriched, cooked Popcorn
1.0
8.2
without salt Popcorn, air-popped
Rye bread 0.0 0.2 Bread, rye Snack bars containing whole grains 0.3 2.8 Crackers, whole wheat, reduced fat Whole grain bagels & Eng. muffins 0.4 3.8 English muffins, whole-wheat Whole Grain Corn RTE Cereals 0.4 3.6 Cereals ready-to-eat, Kix Whole grain pasta 0.2 1.4 Spaghetti, whole wheat, cooked Whole grain rolls (not sweet) 0.1 1.2 Rolls, dinner, whole wheat Whole Grains in other foods, incl 0.1 0.7 Oats, regular, quick, and instant, unenriched, dry desserts Whole Oat RTE cereals
1.2
10.6
Cereals ready-to-eat, Cheerios
Whole Wheat Bread 3.6 30.8 Bread, whole wheat Whole wheat crackers 0.6 4.7 Crackers, whole wheat, reduced fat Whole wheat quick bread 0.2 1.8 Pancakes, whole-wheat, dry mix, incomplete, prepared
Whole Wheat RTE Cereals 1.3 11.1 Cereals,RTE, wheat, shredded, plain, sugar and salt free
Refined Grains 88.2 Bagels and English Muffins 3.7 4.2 Bagels, plain, enriched Biscuits 1.8 2.0 Biscuits, plain or buttermilk, refrigerated dough, lower fat, baked Breadings and Stuffings/Dressings 4.0 4.6 Bread, white, commercially prepared Cooked Cereal 0.3 0.3 Cereals, corn grits, white, regular and quick, enriched, cooked without salt Corn Tortilla 7.6 8.7 Tortillas, ready-to-bake or -fry, corn Flour Tortilla 5.4 6.2 Tortillas, ready-to-bake or -fry, flour Flour-based Desserts (cakes, cookies, 7.8 8.9 Cookies, animal crackers etc) French Bread
2.2
2.5
Bread, french or vienna
Other Foods Containing Refined Grains 0.1 0.1 Rice, white, long-grain, regular, cooked
Pasta and noodles 9.8 11.1 Spaghetti, cooked, enriched, without salt Pie and Pastry Crusts 1.7 1.9 Pie crust, standard-type, frozen, ready-to-bake, enriched, baked
Pizza Crust 8.4 9.5 Bread, pita, white, enriched Pretzels and Crackers 4.1 4.6 Pretzels, hard, plain, made with enriched flour, unsalted
Quick Breads 2.5 2.9 Pancakes, plain, frozen, ready-to-heat Refined Grain as Thickener 0.5 0.5 Wheat flour, white, all-purpose, enriched, bleached Refined grain RTE Cereal 1.9 2.1 Cereals ready-to-eat, Corn Flakes Snack Bars containing refined grains 0.2 0.2 Cookies, animal crackers White Bread 11.5 13.0 Bread, white, commercially prepared White Rice 5.7 6.5 Rice, white, long-grain, regular, cooked White Rolls and Buns 9.1 10.3 Rolls, hamburger or hotdog, plain
GRAIN GROUP
Subgroup and Item Clusters % food % food group subgroup
Representative Food (used to represent nutrient value of the item cluster)

Item Clusters, Percent of Consumption, and Representative Foods for USDA Food Pattern Food Groups and Subgroups
Subgroup and Item Clusters % food group
% food subgroup
Representative Food (used to represent nutrient value of the item cluster)
DAIRY GROUP
Milk 51.0
Unflavored cow milks, whole 6.6 13.0 Milk, nonfat, fluid, added vitamin A and D Unflavored cow milks, 2% 12.3 24.0 Milk, nonfat, fluid, added vitamin A and D Unflavored cow milks, 1% 5.9 11.6 Milk, nonfat, fluid, added vitamin A and D Unflavored cow milks, fat-free 6.9 13.6 Milk, nonfat, fluid, added vitamin A and D Low lactose, calcium-fortified, acidopholus, buttermilk, goat's milk & imitation milks, whole and NFS
0.2 0.4 Milk, nonfat, fluid, added vitamin A and D
Low lactose, calcium-fortified, acidopholus, buttermilk, goat's milk & imitation milks, 2%
0.1 0.2 Milk, nonfat, fluid, added vitamin A and D
Low lactose, calcium-fortified, acidopholus, buttermilk, goat's milk & imitation milks, 1% and fat-free
0.2 0.4 Milk, nonfat, fluid, added vitamin A and D
Dry & evaporated milks, whole, reduced fat, and NFS
0.1 0.2 Milk, dry, nonfat, instant, added vitamin A and D
Dry & evaporated milks, 1% and fat-free 0.0 0.0 Milk, dry, nonfat, instant, added vitamin A and D Milk NFS 0.3 0.6 Milk, nonfat, fluid, added vitamin A and D Flavored milks (chocolate, cocoa), whole 1.0 1.9 Milk, nonfat, fluid, added vitamin A and D
Flavored milks (chocolate, cocoa), 2% 1.4 2.7 Milk, nonfat, fluid, added vitamin A and D
Flavored milks (chocolate, cocoa), 1% 1.0 2.1 Milk, nonfat, fluid, added vitamin A and D
Flavored milks (chocolate, cocoa), fat- free
0.3 0.6 Milk, nonfat, fluid, added vitamin A and D
Flavored milks (chocolate, cocoa), NFS 0.6 1.1 Milk, nonfat, fluid, added vitamin A and D
Milk in coffee drinks, lattes, etc. 1.5 2.9 Milk, nonfat, fluid, added vitamin A and D Skim milk in coffee drinks, lattes, etc. 0.0 0.0 Milk, nonfat, fluid, added vitamin A and D
Milk shakes, malted milk drinks, fruit- milk drinks/smoothies, fat-free
0.0 0.0 Milk, nonfat, fluid, added vitamin A and D
Milk shakes, malted milk drinks, fruit- milk drinks/smoothies, NFS
0.9 1.8 Milk, nonfat, fluid, added vitamin A and D
Meal supplements/replacements/diet drinks
0.3 0.6 Milk, dry, nonfat, instant, added vitamin A and D
Milk powder drinks, eggnog, other bev. 0.1 0.3 Milk, dry, nonfat, instant, added vitamin A and D
Milk in soups 0.5 1.0 Milk, nonfat, fluid, added vitamin A and D Milk in casseroles, lllmixturesbatters, frozen meals, man & other dishes
3.7 7.3 Milk, nonfat, fluid, added vitamin A and D
Milk in scrambled eggs/omelets 1.7 3.3 Milk, nonfat, fluid, added vitamin A and D

Item Clusters, Percent of Consumption, and Representative Foods for USDA Food Pattern Food Groups and Subgroups
Subgroup and Item Clusters % food group
% food subgroup
Representative Food (used to represent nutrient value of the item cluster)
Milk , continued
Milk in mashed potatoes, creamed veg., sauces, gravies, salad dressings
0.7 1.4 Milk, nonfat, fluid, added vitamin A and D
Milk in puddings custards, desserts, sweetened condensed milk
0.6 1.1 Milk, nonfat, fluid, added vitamin A and D
Milk in candies and lllbarsllland cookies 1.1 2.2 Milk, dry, nonfat, instant, added vitamin A and D Milk in bread, baked products, cereals 0.8 1.6 Milk, nonfat, fluid, added vitamin A and D
Ice cream, light and fat-free 0.4 0.8 Ice creams, vanilla, fat-free Ice cream, regular and rich 1.5 2.9 Ice creams, vanilla, fat-free Ice cream sundaes, cones, sticks/bars/novelties, light and lowfat
0.2 0.3 Ice creams, vanilla, fat-free
Ice cream sundaes, cones, sticks/bars/novelties, regular, rich, NFS
0.2 0.4 Ice creams, vanilla, fat-free
Yogurt 2.6 Frozen yogurt and sherbet, regular, lowfat, fat-free, and NFS
0.3 10.9 Frozen yogurts, choc, nonfat milk, sweetened w/o sugar
Unflavored Yogurts, whole and NFS 0.1 2.2 Yogurt, plain, skim milk, 13 grams protein per 8 oz Unflavored Yogurts, lowfat 0.1 4.4 Yogurt, plain, skim milk, 13 grams protein per 8 oz Unflavored Yogurts, fat-free 0.1 4.1 Yogurt, plain, skim milk, 13 grams protein per 8 oz Flavored Yogurts (caloric sweeteners), lowfat
0.2 7.1 Yogurt, vanilla or lemon, nonfat milk, low calorie sweetener, fortified with vitamin D
Flavored Yogurts (caloric sweeteners), fat-free
0.1 2.7 Yogurt, vanilla or lemon, nonfat milk, low calorie sweetener, fortified with vitamin D
Flavored Yogurts (caloric sweeteners), NFS
0.1 2.7 Yogurt, vanilla or lemon, nonfat milk, low calorie sweetener, fortified with vitamin D
Flavored Yogurts (low calorie sweeteners), fat-free
0.1 3.2 Yogurt, vanilla or lemon, nonfat milk, low calorie sweetener, fortified with vitamin D
Flavored Yogurts (low calorie sweeteners), lowfat
0.1 5.2 Yogurt, vanilla or lemon, nonfat milk, low calorie sweetener, fortified with vitamin D
Fruit Yogurts (caloric sweeteners) incl.yogurt NS, whole
0.1 5.7 Yogurt, vanilla or lemon, nonfat milk, low calorie sweetener, fortified with vitamin D
Fruit Yogurts (caloric sweeteners) incl.yogurt NS, lowfat
0.7 26.6 Yogurt, vanilla or lemon, nonfat milk, low calorie sweetener, fortified with vitamin D
Fruit Yogurts (caloric sweeteners) incl.yogurt NS, fat-free
0.2 7.2 Yogurt, vanilla or lemon, nonfat milk, low calorie sweetener, fortified with vitamin D
Fruit Yogurts (caloric sweeteners) incl.yogurt NS, fat NFS
0.2 8.1 Yogurt, vanilla or lemon, nonfat milk, low calorie sweetener, fortified with vitamin D
Fruit Yogurts (low calorie sweeteners), fat-free
0.3 9.7 Yogurt, vanilla or lemon, nonfat milk, low calorie sweetener, fortified with vitamin D
Yogurt in other foods 0.0 0.4 Yogurt, vanilla or lemon, nonfat milk, low calorie sweetener, fortified with vitamin D

Item Clusters, Percent of Consumption, and Representative Foods for USDA Food Pattern Food Groups and Subgroups
Subgroup and Item Clusters % food group
% food subgroup
Representative Food (used to represent nutrient value of the item cluster)
Cheese 44.8
Natural cheeses (incl low sodium cheeses), regular
7.5 16.7 Cheese, mozzarella, nonfat or fat free
Natural cheeses (incl low sodium cheeses), reduced-fat
1.7 3.8 Cheese, mozzarella, nonfat or fat free
Natural cheeses (incl low sodium cheeses), lowfat and fat-free
0.2 0.5 Cheese, mozzarella, nonfat or fat free
Natural cheeses (incl low sodium cheeses), fat NFS
0.9 2.1 Cheese, mozzarella, nonfat or fat free
Cottage cheeses, regular 0.1 0.3 Cheese, cottage, lowfat, (1% milkfat) no sodium added
Cottage cheeses, lowfat and fat NFS 0.1 0.3 Cheese, cottage, lowfat, (1% milkfat) no sodium added
Processed cheeses (incl low sodium cheeses), regular
4.1 9.0 Cheese, pasturized processed, American, lowfat
Processed cheeses (incl low sodium cheeses), reduced-fat
0.1 0.1 Cheese, pasturized processed, American, lowfat
Processed cheeses (incl low sodium cheeses), lowfat and fat-free
0.2 0.5 Cheese, pasturized processed, American, lowfat
Cheese spreads, dips, sauces, soups 0.9 2.1 Cheese, pasturized processed, American, lowfat
Cheese on sandwiches 1.9 4.3 Cheese, pasturized processed, American, lowfat Cheese in grains products, snacks (incl breads and cereals), desserts/sweets, regular and NFS
0.4 0.8 Cheese, pasturized processed, American, lowfat
Cheese in grains products (incl fried cheese, gnocchi), desserts/sweets, reduced fat, lowfat, nonfat
0.3 0.6 Cheese, mozzarella, nonfat or fat free
Cheese in Mexican dishes 1.7 3.8 Cheese, Mexican, blend, reduced fat Cheese in egg or meat dishes and frozen meals
2.0 4.5 Cheese, Mexican, blend, reduced fat
Cheese on pizza and calzone, regular 8.0 17.9 cheese, mozzarella, nonfat or fat free
Cheese on pizza and calzone, reduced- fat and lowfat
8.2 18.3 cheese, mozzarella, nonfat or fat free
Cheese in pasta and Italian dishes, regular and NFS
2.3 5.1 Cheese, Mexican, blend, reduced fat
Cheese in pasta and Italian dishes, reduced fat, lowfat, and nonfat
0.3 0.6 Cheese, Mexican, blend, reduced fat
Cheese on vegetables (cheese sauce), in salads & dressings
0.8 1.8 Cheese, pasturized processed, American, lowfat
Cheese NFS 3.0 6.7 Cheese, Mexican, blend, reduced fat Soymilk 1.5
Soymilk 1.5 100.0 Soymilk (all flavors), unsweetened, added calcium, vitamins A and D

Item Clusters, Percent of Consumption, and Representative Foods for USDA Food Pattern Food Groups and Subgroups
Subgroup and Item Clusters % food group
% food subgroup
Representative Food (used to represent nutrient value of the item cluster)
PROTEIN FOODS GROUP
Eggs 7.31 Eggs 7.31 100.00 Egg, whole, cooked, hard-boiled
High Omega-3 Fish 2.36 Anchovy 0.01 0.31 Anchovy, European, canned in oil, drained Herring 0.07 3.16 Herring, Atlantic, cooked, dry heat Mackerel 0.01 0.35 Mackerel, Atlantic, cooked, dry heat Salmon 1.36 61.08 Fish, salmon, Atlantic, farmed, cooked, dry heat Sardines 0.05 2.23 Sardine, Atlantic, canned in oil, drained with bone Sea bass 0.09 3.89 Sea bass, mixed species, cooked, dry heat Swordfish 0.04 1.80 Swordfish, cooked, dry heat Trout 0.16 7.34 Trout, rainbow, farmed, cooked, dry heat Roe 0.00 0.00 Roe, mixed species, cooked dry heat Mussels 0.02 0.79 Mussel, blue, cooked, moist heat Tuna-high Omega 3 0.42 19.05 Tuna, white, canned in water, drained solids Shark 0.00 0.00 Shark, mixed species, raw Smelt 0.00 0.00 Smelt, rainbow, cooked, dry heat
Low Omega-3 Fish 8.09 Shrimp 1.75 21.60 Shrimp, cooked, moist heat Unknown Fish 0.52 6.39 Fish, pollock, Atlantic, cooked, dry heat Fish sticks 0.21 2.55 Fish, pollock, Atlantic, cooked, dry heat Restructured fish 0.02 0.30 Fish, pollock, Atlantic, cooked, dry heat Carp 0.00 0.02 Carp, cooked, dry heat Catfish 0.25 3.15 Catfish, channel, farmed, cooked, dry heat Cod 0.70 8.61 Cod, Pacific, cooked, dry heat Croaker 0.07 0.84 Croaker, Atlantic, raw Tilapia 0.52 6.40 Tilapia, cooked, dry heat Flounder 0.49 6.11 Flatfish (flounder and sole), cooked, dry heat Haddock 0.13 1.58 Haddock, cooked, dry heat Mullet 0.00 0.00 Mullet, striped, cooked, dry heat Perch 0.24 2.99 Ocean perch, Atlantic, cooked, dry heat Pike 0.08 1.03 Pike, northern, cooked, dry heat Pompano* 0.13 1.60 Pompano, Florida, cooked, dry heat Porgy 0.04 0.46 sheepshead, cooked, dry heat Tuna-low 0mega3 1.42 17.51 Tuna, light, canned in water, drained solids Whiting 0.11 1.36 Fish, whiting, mixed species, cooked, dry heat Frog 0.00 0.00 Frog legs, raw Octopus/squid 0.15 1.91 Octopus, common, cooked, moist heat Clams 0.16 1.92 Clams, mixed species, cooked, moist heat Crab 0.49 6.05 Crab, blue, cooked, moist heat Lobster 0.09 1.15 Lobster, northern, cooked, moist heat Oysters 0.22 2.66 Mollusks, oyster, Pacific, cooked, moist heat Scallops 0.09 1.09 Scallops (bay and sea), cooked, steamed Snapper 0.08 0.95 Snapper, mixed species, cooked, dry heat Halibut 0.10 1.22 Halibut, Atlantic and Pacific, cooked, dry heat Eel 0.00 0.00 Eel, mixed species, cooked, dry heat Turtle/terrapin 0.00 0.00 Turtle, green, raw Crayfish 0.05 0.57 Crayfish, mixed species, wild, cooked, moist heat Snails 0.00 0.00 Snail, raw Turbot 0.00 0.00 Flatfish (flounder and sole), cooked, dry heat
*Pompano was incorrectly assigned to the low omega-3 fatty acids subgroup but should be in the high omega-3 fatty acids subgroup instead. Because of the very low consumption of pompano, there is no change in the nutrient profile for the low and high omega-3 fatty acids subgroups.
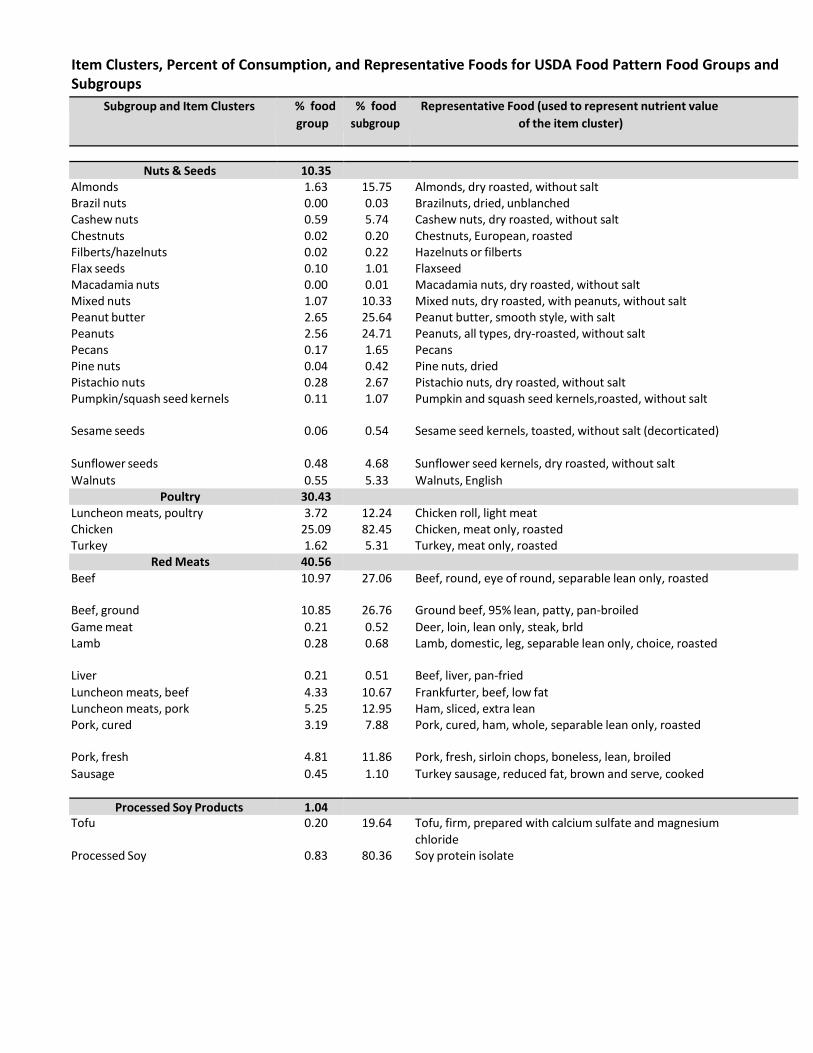
Item Clusters, Percent of Consumption, and Representative Foods for USDA Food Pattern Food Groups and Subgroups
Subgroup and Item Clusters % food group
% food subgroup
Representative Food (used to represent nutrient value of the item cluster)
Nuts & Seeds 10.35
Almonds 1.63 15.75 Almonds, dry roasted, without salt Brazil nuts 0.00 0.03 Brazilnuts, dried, unblanched Cashew nuts 0.59 5.74 Cashew nuts, dry roasted, without salt Chestnuts 0.02 0.20 Chestnuts, European, roasted Filberts/hazelnuts 0.02 0.22 Hazelnuts or filberts Flax seeds 0.10 1.01 Flaxseed Macadamia nuts 0.00 0.01 Macadamia nuts, dry roasted, without salt Mixed nuts 1.07 10.33 Mixed nuts, dry roasted, with peanuts, without salt Peanut butter 2.65 25.64 Peanut butter, smooth style, with salt Peanuts 2.56 24.71 Peanuts, all types, dry-roasted, without salt Pecans 0.17 1.65 Pecans Pine nuts 0.04 0.42 Pine nuts, dried Pistachio nuts 0.28 2.67 Pistachio nuts, dry roasted, without salt Pumpkin/squash seed kernels 0.11 1.07 Pumpkin and squash seed kernels,roasted, without salt
Sesame seeds 0.06 0.54 Sesame seed kernels, toasted, without salt (decorticated)
Sunflower seeds 0.48 4.68 Sunflower seed kernels, dry roasted, without salt Walnuts 0.55 5.33 Walnuts, English
Poultry 30.43 Luncheon meats, poultry 3.72 12.24 Chicken roll, light meat Chicken 25.09 82.45 Chicken, meat only, roasted Turkey 1.62 5.31 Turkey, meat only, roasted
Red Meats 40.56 Beef 10.97 27.06 Beef, round, eye of round, separable lean only, roasted
Beef, ground 10.85 26.76 Ground beef, 95% lean, patty, pan-broiled Game meat 0.21 0.52 Deer, loin, lean only, steak, brld Lamb 0.28 0.68 Lamb, domestic, leg, separable lean only, choice, roasted
Liver 0.21 0.51 Beef, liver, pan-fried Luncheon meats, beef 4.33 10.67 Frankfurter, beef, low fat Luncheon meats, pork 5.25 12.95 Ham, sliced, extra lean Pork, cured 3.19 7.88 Pork, cured, ham, whole, separable lean only, roasted
Pork, fresh 4.81 11.86 Pork, fresh, sirloin chops, boneless, lean, broiled Sausage 0.45 1.10 Turkey sausage, reduced fat, brown and serve, cooked
Processed Soy Products 1.04 Tofu 0.20 19.64 Tofu, firm, prepared with calcium sulfate and magnesium
chloride Processed Soy 0.83 80.36 Soy protein isolate

Item Clusters, Percent of Consumption, and Representative Foods for USDA Food Pattern Food Groups and Subgroups
Unhydrogenated soy oil 53% Canola oil 22% Olive oil 4%
Corn oil 10% Sunflower oil 3% Cottonseed oil 4% Peanut oil 1% Safflower oil 0%
Margarine (1/2 total) 3%
Oil, soybean, salad or cooking Oil, canola Oil, olive, salad or cooking Oil, corn, industrial and retail, all purpose salad or cooking Oil, sunflower, linoleic (approx. 65%) Oil, cottonseed, salad or cooking Oil, peanut, salad or cooking Oil, safflower, salad or cooking, linoleic (over 70%) Margarine-like, veg. oil spread, 60% fat, tub, with salt, without vit. D
Palm oil Palm Kernel oil Coconut oil Dairy fat (incl. butter) Pork fat (incl. lard) Vegetable shortening Beef fat (incl. tallow) Hydrogentated soy oil
8% 3% 4%
24% 7%
19% 18% 15%
Palm oil Palm kernel oil Coconut oil Butter, salted Lard Vegetable shortening,household,composite Beef fat (tallow) Soybean oil, partially hydrogenated
Margarine (1/2 total) 3% 70% fat stick margarine, without Vit. D
*Percent used in estimating the nutrient profiles for oils or solid fats.
Estimates calculated from Economic Research Service Food Availability and Loss-Adjusted Food Availability Tables for Fats and Oils (Added), 2010. (http://www.ers.usda.gov/data-products/food-availability-(per-capita)-data-system/.aspx#26715) Additional data on fat content of beef, pork, and dairy foods from CNPP's Nutrient Content of the Food Supply, 2010.
Available at www.cnpp.usda.gov/USDAFoodPatterns
Solid Fats
Oils Estimated %*
Oils and Solid Fats
Subgroup and Item Clusters % food % food Representative Food (used to represent nutrient value group* subgroup** of the item cluster)