fruits and vegetables importance for public health · fruits and vegetables per day for the...
TRANSCRIPT

Joint FAO/WHO Workshop on promotion of the production and consumption of
fruits and vegetables | Arusha, 20111 |
Fruits and vegetables
importance for public health
Joint FAO/WHO Workshop on promotion of the production and consumption of
fruits and vegetables | Arusha, 20112 |
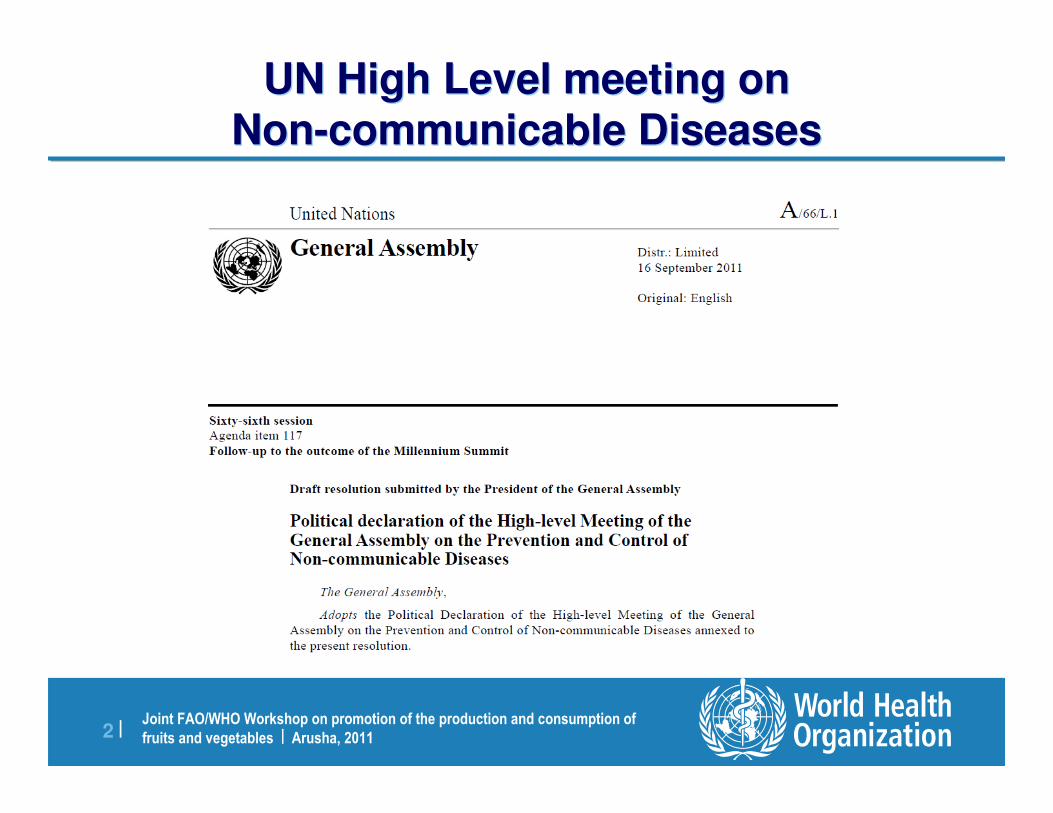
UN High Level meeting on Non-communicable Diseases
UN High Level meeting on Non-communicable Diseases

Joint FAO/WHO Workshop on promotion of the production and consumption of
fruits and vegetables | Arusha, 20113 |
Non Communicable Diseases related mortality Non Communicable Diseases related mortality

Joint FAO/WHO Workshop on promotion of the production and consumption of
fruits and vegetables | Arusha, 20114 |
Obesity affects all of usObesity affects all of usBMI 25+ (age-adjusted)
0.0
10.0
20.0
30.0
40.0
50.0
60.0
70.0
Low income Lower middle
income
Upper middle
income
High income
World Bank Income Category (2008 estimates)
Males
Females
Both Sexes
BMI 25+ (age-adjusted)
0.0
10.0
20.0
30.0
40.0
50.0
60.0
70.0
AFR AMR EMR EUR SEAR WPR
WHO Region
Males
Females
Both Sexes

Joint FAO/WHO Workshop on promotion of the production and consumption of
fruits and vegetables | Arusha, 20115 |
Promoting fruit and vegetable consumption around the world
Promoting fruit and vegetable consumption around the world
� Approximately 1.7 million (2.8%) of deaths worldwide
are attributable to low fruit and vegetable consumption.
� Low fruit and vegetable intake is among the top 10
selected risk factors for global mortality.
� Worldwide, insufficient intake of fruit and vegetables is
estimated to cause around;
– 14% of gastrointestinal cancer deaths,
– 11% of ischaemic heart disease deaths and
– 9% of stroke deaths.

Joint FAO/WHO Workshop on promotion of the production and consumption of
fruits and vegetables | Arusha, 20116 |60% of global deaths due to NCDs
Sourc
e:
WH
O's
report
on "
Glo
bal health r
isks"
Leading risk factors for global mortalityLeadingLeading riskrisk factorsfactors for global for global mortalitymortality

Joint FAO/WHO Workshop on promotion of the production and consumption of
fruits and vegetables | Arusha, 20117 |
Promoting fruit and vegetable consumption around the world
Promoting fruit and vegetable consumption around the world
� The 2003 Report of the joint WHO/FAO expert consultation on
diet, nutrition and prevention of chronic diseases, sets population
nutrient goals and recommends intake of a minimum of 400 g of
fruits and vegetables per day for the prevention of chronic
diseases such as heart diseases, cancer, diabetes and obesity.
� The report states that there is convincing evidence that fruits and
vegetables decrease the risk for obesity, and evidence that they
probably decrease the risk of diabetes. Further, there is
convincing evidence that fruit and vegetables lower the risk for
CVD.

Joint FAO/WHO Workshop on promotion of the production and consumption of
fruits and vegetables | Arusha, 20118 |
WHO’s mandateWHO’s mandate
� WHO’s mandate is to improve public health around the world with particular emphasis on decreasing inequalities in health.
� In May 2002, WHO was requested by the Member States to develop aGlobal Strategy on Diet, Physical Activity and Health in the context of the rising burden of chronic diseases.
� During a series of regional consultations to develop the strategy, Member States stressed to WHO the importance of working proactively with them to assist in increasing the consumption of fruit and vegetables.
� WHO aims to actively promote an increase in fruit and vegetable intake worldwide, especially in developing countries.
� Incorporation of fruit and vegetable consumption as part of national noncommunicable disease (NCD) prevention and school health programmes is a central aim.

Joint FAO/WHO Workshop on promotion of the production and consumption of
fruits and vegetables | Arusha, 20119 |
Global Strategy for the Prevention and Control of Noncommunicable Diseases
Global Strategy for the Prevention and Control of Noncommunicable Diseases2000
2003
2004
2008
2009
2010
2011
Global Strategy to Reduce the Harmful
Use of Alcohol
Global Strategy to Reduce the Harmful
Use of Alcohol
Set of Recommendations on the Marketing of Foods
to Children
Set of Recommendations on the Marketing of Foods
to Children
Doha Declaration
Doha Declaration
UN General Assembly resolution
A/RES/64/265
UN General Assembly resolution
A/RES/64/265
Ministerial Meetings
(Doha)
Ministerial Meetings
(Doha)
ECOSOC Ministerial Declaration
ECOSOC Ministerial Declaration
High-level
Meeting, Sept
High-level
Meeting, SeptUNSG Report
on NCDs
UNSG Report
on NCDs
Global response to the NCD epidemicGlobal response to the NCD epidemic
Ministerial
meeting, April
Ministerial
meeting, April
Member States are encouraged to implement the
recommendations of the Global Strategy on Diet,
Physical Activity and Health.
Adopted by 192 Member States

Joint FAO/WHO Workshop on promotion of the production and consumption of
fruits and vegetables | Arusha, 201110 |
Joint WHO/FAO Workshop on Fruit and Vegetables for Health (Kobe, 2004)
Joint WHO/FAO Workshop on Fruit and Vegetables for Health (Kobe, 2004)
� Making fruit and vegetables available to all: a
joint FAO/WHO workshop, held at the WHO
Kobe Center for Health Development in Japan,
addressed the need for increased fruit and
vegetable consumption.
� The workshop resulted in a framework that
proposes ways to promote increased production,
availability and access, and adequate
consumption of fruit and vegetables.

Joint FAO/WHO Workshop on promotion of the production and consumption of
fruits and vegetables | Arusha, 201111 |
Per capita consumption of Fruits and Vegetables for selected countries in AFRO
Per capita consumption of Fruits and Vegetables for selected countries in AFRO
-10
10
30
50
70
90
110
130
150
Ethio
pia
Bur
undi
Mal
awi
Moz
ambiq
ue
Tanza
nia
Rw
anda
Ken
ya
Uga
nda
Gha
na
Gui
nea
Fruit VegetableSource: Ruel et al., 2005,
www.who.int/dietphysicalactivity/fruit/en
Recommendation:> 146 kg/year

Joint FAO/WHO Workshop on promotion of the production and consumption of
fruits and vegetables | Arusha, 201112 |
Sou
rce
: S
TE
PS
Da
ta
What does the data show ?What does the data show ?
Vegetable ConsumptionVegetable ConsumptionFruit ConsumptionFruit Consumption
0
1
2
3
4
5
6
7
Botsw
ana
Eritre
aG
ambi
a
Libe
riaM
alaw
iSey
chel
les
Sierra
Leo
neSw
azila
nd
Zambi
a
Nu
mb
er/
day
Mean number of days vegetables consumed
Mean number of servings of vegetables consumed on average per day
0
1
2
3
4
5
6
7
Botsw
ana
Eritre
aG
ambi
aLi
beria
Mal
awi
Seych
elle
sSie
rra L
eone
Swaz
iland
Zambi
a
Nu
mb
er/
day
Mean number of days fruit consumed
Mean number of servings of fruit consumed on average per day

Joint FAO/WHO Workshop on promotion of the production and consumption of
fruits and vegetables | Arusha, 201113 |
Sou
rce
: S
TE
PS
Da
ta
What does the data show ?What does the data show ?
Percentage who ate less than 5 servings of fruit and/or vegetables on
average per day
0.00%
20.00%
40.00%
60.00%
80.00%
100.00%
Bot
swana
Erit
rea
Gam
bia
Libe
ria
Mal
awi
Sey
chel
les
Sie
rra L
eone
Sw
azila
nd
Zambi
a

Joint FAO/WHO Workshop on promotion of the production and consumption of
fruits and vegetables | Arusha, 201114 |
Fruit ConsumptionFruit Consumption
WomenWomen
Sou
rce
: S
TE
PS
Da
ta
0
1
2
3
4
5
6
7
Botswana
Eritre
aGam
bia
Libe riaM
alaw iSeyc
helles
Sierra L
eoneSwaz ila
ndZam
bia
Nu
mb
er/
da
y
Mean number of days fruit consumed
Mean number of servings of fruit consumed on average per day
MenMen
0
1
2
3
4
5
6
7
Botswana
Eritre
aGam
bia
Libe ria
Malaw i
Seychelle
sSierra
Leone
Swaziland
Zambia
Nu
mb
er/
da
y
Mean number of days fruit consumed
Mean number of servings of fruit consumed on average per day

Joint FAO/WHO Workshop on promotion of the production and consumption of
fruits and vegetables | Arusha, 201115 |
0
1
2
3
4
5
6
7
Botswana
Eritre
aGam
bia
Libe ria
Malaw i
Seychelle
sSierra
Leone
Swaz iland
Zambia
Nu
mb
er/
da
y
Mean number of days vegetables consumed
Mean number of servings of vegetables consumed on average per day
Vegetable ConsumptionVegetable Consumption
Sou
rce
: S
TE
PS
Da
ta
0
1
2
3
4
5
6
7
Botswana
Eritre
aGam
bia
Libe ria
Malaw i
Seychelle
sSierra
LleoneSwaz ila
ndZam
bia
Nu
mb
er/
da
y
Mean number of days vegetables consumed
Mean number of servings of vegetables consumed on average per day
MenMen WomenWomen

Joint FAO/WHO Workshop on promotion of the production and consumption of
fruits and vegetables | Arusha, 201116 |
Percentage who ate less than 5 a DayPercentage who ate less than 5 a Day
Sou
rce
: S
TE
PS
Da
ta
MenMen WomenWomen
Percentage who ate less than 5 servings of fruit and/or vegetables on
average per day
70.00%
75.00%
80.00%
85.00%
90.00%
95.00%
100.00%
Botswa na
Eritrea
GambiaLibe riaM
alaw iSeyc
helles
S ierra L
eoneSwaz ila
ndZam
bia
Percentage who ate less than 5 servings of fruit and/or vegetables on
average per day
70.00%
75.00%
80.00%
85.00%
90.00%
95.00%
100.00%
Botswa na
Eritrea
GambiaLibe riaM
alaw iSeyc
helles
S ierra L
eoneSwaz ila
ndZam
bia

Joint FAO/WHO Workshop on promotion of the production and consumption of
fruits and vegetables | Arusha, 201117 |

Joint FAO/WHO Workshop on promotion of the production and consumption of
fruits and vegetables | Arusha, 201118 |

Joint FAO/WHO Workshop on promotion of the production and consumption of
fruits and vegetables | Arusha, 201119 |

Joint FAO/WHO Workshop on promotion of the production and consumption of
fruits and vegetables | Arusha, 201120 |
The Floor is Yours !The Floor is Yours !The Floor is Yours !The Floor is Yours !The Floor is Yours !The Floor is Yours !The Floor is Yours !The Floor is Yours !
http://www.who.int/dietphysicalactivity/en/