fsm national minimum competency standard …national.doe.fm/publicdocuments/nmct...
TRANSCRIPT
Department of Education Division of Basic Education
P.O. BOX PS 87 Palikir, Pohnpei FM 96941
January 29, 2014
FSM National Minimum Competency Standard-Based Test (NMCT) 2013
Reading and Mathematics Test
Welson W. Nedlic Curriculum, Assessment & Research Specialist
Author

FSM National Minimum Competency Standard-Based Test (NMCT) 2013
2
EXECUTIVE SUMMARY
The first part of the report provides a comprehensive discussion on the reading standards and benchmarks for grades 6th, 8th and 10th. It further provides a detail discussion on the mathematics standards and benchmarks for the 4th, 6th, 8th and 10th grades. Following the discussion on the standards and benchmarks is a short discussion on the number of students who participated in the standardized test for the 2013 school year.
The report further discuss the Adequate Yearly Progress trends based on the comparison of the results of the NMCT 2012 and 2013 test scores in math and reading. The National Department of Education sets an ambitious goal of achieving 5% increase in students’ performance in the NMCT every year. The 6th grade test results in reading shows a disappointing decrease of 2% for the 2013 as compare to the 2012 test performance. In the 8th grade reading, we note an increase of 7%. In the 10th grade, a meager increase of 2% is noted.
The NMCT Math results for the nation for grades 4th, 6th, 8th and 10th shows increase in performance level for grades 6th (5%), 8th (2%) and 10th (4%). There is decrease of 1% in 4th grade.
The States performance trends in the NMCT Math and Reading results for the 2012 and 2013 is discussed.
The summary of the report provides some advice to students, teachers, educators and leaders both on the hardship of tests and the self-confidence that come with good performance in tests.
The adequate yearly progress percentage points are shown for most if not all of the schools in the FSM in the appendices of the report.

FSM National Minimum Competency Standard-Based Test (NMCT) 2013
3
ACKNOWLEDGEMENT
We wish to recognize and express our gratefulness to many individual contributors, departments, and organizations to our 2013 work on the National Minimum Competency Test Development Project. Without your kind support and encouragement, the successful completion of the project would not have been possible. I would like to extend my sincere thanks and appreciation to all of those who assisted me and my colleagues. We are grateful to the leaders of the Executive Branch and Congress for their blessings and support to our work.
I would like to express my sincere gratefulness towards my colleagues of the National Department of Education and the States Departments of education for their kind support and encouragement which help me in the completion of this project. I would also like to express my special gratitude and thanks to Mr. David Syne for his technical assistances and time in ensuring that the NMCT 2013 raw data is thoroughly cleaned before analysis. My thanks and appreciations also go to many more individuals from the states and national education office who have willingly helped in the administration of the NMCT 2013.
The project is made possible through the US Compact of Free Association funding grant 2013. We appreciate and express our gratitude to our colleagues in the Office of Insular Affairs for your assistance in making the funding available to us.

FSM National Minimum Competency Standard-Based Test (NMCT) 2013
4
TABLE OF CONTENTS
EXECUTIVE SUMMARY ........................................................................................................................................... 1
ACKNOWLEDGEMENT ............................................................................................................................................ 3
DEFINITION OF TERMS ........................................................................................................................................... 5
INTRODUCTION ..................................................................................................................................................... 6
STANDARDS AND BENCHMARKS ........................................................................................................................... 8
I. FSM NATIONAL CURRICULUM STANDARDS AND BENCHMARKS IN READING. ................................................................... 8
II. FSM NATIONAL CURRICULUM STANDARDS AND BENCHMARKS IN MATHEMATICS. .......................................................... 10
III. NMCT 2013 PARTICIPATION ............................................................................................................................ 15
IV. STUDENT PERFORMANCE ........................................................................................................................... 16
A. National 2yrs. Trend .................................................................................................................................... 16
B. State 2yrs. Trend Reports ........................................................................................................................... 18
SUMMARY ........................................................................................................................................................... 25
APPENDICES: ADEQUATE YEARLY PROGRESS ....................................................................................................... 27

FSM National Minimum Competency Standard-Based Test (NMCT) 2013
5
DEFINITION OF TERMS
Approaching minimum competency means a level of performance slightly below grade level performance expectation with least skill.
AYP adequate yearly progress, set at certain percentage for a program, a government or a nation to show progress.
Competency refers to the level of performance exceeding grade level performance expectation with mastery skills.
Grade level performance expectation refers to the level of performance a student is expected to perform at a particular grade.
Indicator refers to the specific skills for each benchmark.
Minimum competency means a level of performance at grade level performance expectation with minimum mastery skills.
Student Learning Outcome (SLO) refers to the specific skills derived from benchmarks for specific student learning objectives for teacher lesson plans.
Well below Minimum Competency means a level of performance well below grade level

FSM National Minimum Competency Standard-Based Test (NMCT) 2013
6
INTRODUCTION
JEMCO Resolution 2012-MT-2 recognizes that the National Minimum Competency Test (NMCT) is the only standard assessment tool for the elementary and secondary student performance in the nation. The resolution resolved that the government of the FSM shall develop guidelines for the administration of the NMCT. The guidelines required the National Department of Education in collaboration with the States Department of Education to administer the National Minimum Competency Test (NMCT) in Math and Reading to all the students in the selected grades beginning in 2013. All private and public schools are included in the testing for the school year 2013. The NMCT is administered to the 6th, 8th, and 10th grades in reading and to grades 4th, 6th, 8th and 10th in math.
The relevant data for the 2013 NMCT indicates that about 94% of the schools (elementary and high schools) across the nation participated in the test. There are 192 schools in the nations and 180 of them were tested and reliable results were reported. Twelve schools either did not participate in the testing and/or participated but the reliable results were not submitted to the NDOE.
The NMCT report for the 2013 differs in many different aspects from NNCT reports of previous years. This year we highlighted our discussion in benchmark indicators of the reading and
math standards. The four math standards referred to in the report included the following:
Standard 1 is inclusive of numbers, operation and computation Standard 2: Geometry, measurements, and transformation Standard 3: Patterns and algebra Standard 4: Statistics and probability
The two reading standards referenced in the report simply included reading and literature.
One important reason for our detail discussion on the standards and benchmarks is to remind all of us that the questions on the NMCT are based on the appropriate national curriculum standards and benchmarks. The NMCT questions are designed to indentify where weaknesses and strengths are found in our curriculum standards and bench marks as they are being taught in the classrooms. Once indentified it is our hope that the NMCT results will assist administrators and teachers to provide appropriate interventions to areas of weakness in reading and math.
In previous NMCT reports the analysis of the test results shows the national and the states standings in terms of competence levels; that is, competent, minimum competency, approaching minimum competency and well below minimum competency. The levels of competency are shown in bar graphs.
FSM National Minimum Competency Standard-Based Test (NMCT) 2013
7
This year the bar graphs of students’ performance are used to show regress or progress. The bar graphs of students’ performance are generated to show the comparison of the 2012 NMCT and the 2013 NMCT results. The portrayal of quantitative achievements may not be as accurate as we would like it to be. This is because only a sample number of schools were tested in 2012 and before. During the 2013 testing almost all of the elementary and high schools in the nation are tested. The comparison of the test results for the 2013 and 2014 school years will be more accurate
We want to express our appreciation to the members of the testing teams in all four states for your assistance in the scanning and cleaning of the tests. This is the first time we work together on this and we expect challenges to occur. We will continue to do this for the 2014 school year. A better coordination of the scanning and cleaning will result in quicker completion of the NMCT results.
Those of us, who would like to have the students’ performance results to be shown on bar graphs at the competence levels, can request at our office. We will be able to provide these to you.
FSM National Minimum Competency Standard-Based Test (NMCT) 2013
8
STANDARDS AND BENCHMARKS
I. FSM NATIONAL CURRICULUM STANDARDS AND BENCHMARKS IN READING.
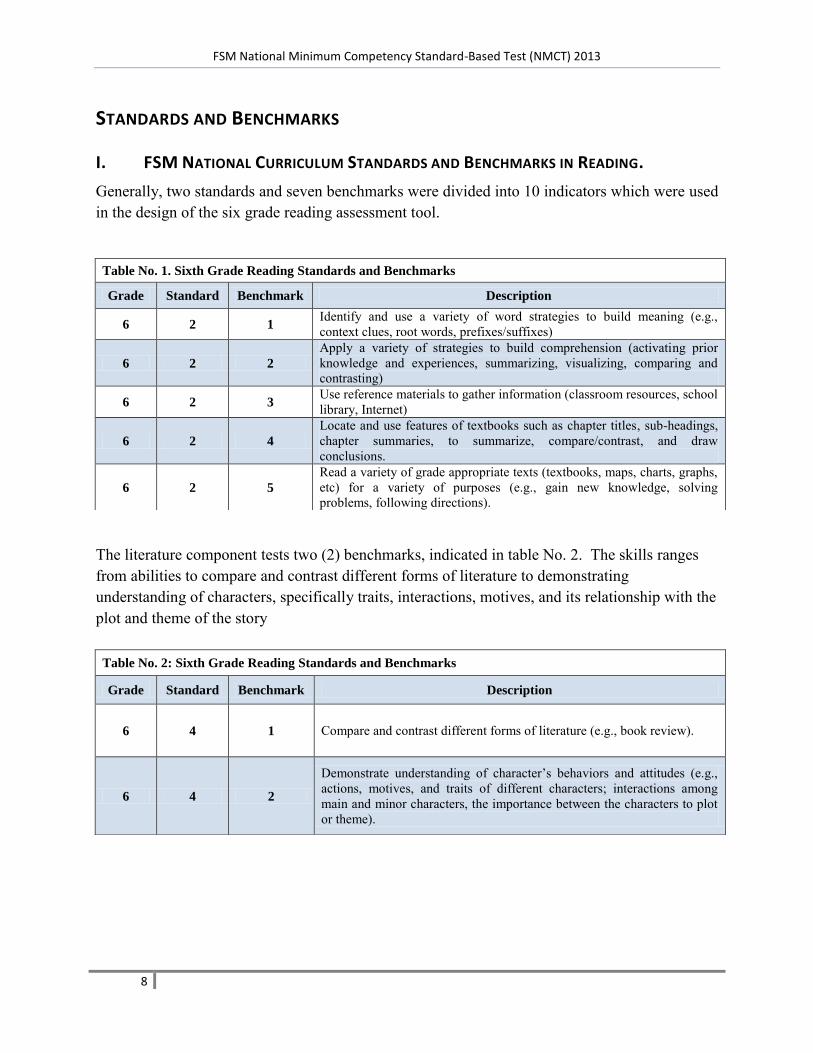
Generally, two standards and seven benchmarks were divided into 10 indicators which were used in the design of the six grade reading assessment tool.
The literature component tests two (2) benchmarks, indicated in table No. 2. The skills ranges from abilities to compare and contrast different forms of literature to demonstrating understanding of characters, specifically traits, interactions, motives, and its relationship with the plot and theme of the story
Table No. 1. Sixth Grade Reading Standards and Benchmarks
Grade Standard Benchmark Description
6 2 1 Identify and use a variety of word strategies to build meaning (e.g., context clues, root words, prefixes/suffixes)
6 2 2
Apply a variety of strategies to build comprehension (activating prior knowledge and experiences, summarizing, visualizing, comparing and contrasting)
6 2 3 Use reference materials to gather information (classroom resources, school library, Internet)
6 2 4
Locate and use features of textbooks such as chapter titles, sub-headings, chapter summaries, to summarize, compare/contrast, and draw conclusions.
6 2 5
Read a variety of grade appropriate texts (textbooks, maps, charts, graphs, etc) for a variety of purposes (e.g., gain new knowledge, solving problems, following directions).
Table No. 2: Sixth Grade Reading Standards and Benchmarks
Grade Standard Benchmark Description
6 4 1 Compare and contrast different forms of literature (e.g., book review).
6 4 2
Demonstrate understanding of character’s behaviors and attitudes (e.g., actions, motives, and traits of different characters; interactions among main and minor characters, the importance between the characters to plot or theme).

FSM National Minimum Competency Standard-Based Test (NMCT) 2013
9
Table No. 3 indicates the second standard and benchmarks used in the design of the 8th Grade Reading Test, which generally covers three (3) benchmarks ranging from identifying word strategies to reading different printed materials for different purposes.
Table No. 4 indicates the standard and benchmarks used in the design of the literature items of the reading test which cover one standard and five benchmarks. Table No. 5 indicates standards and benchmarks used in the design of the 10th Grade Reading Test, which covers one (1) standard, ten (10) benchmarks, and ten (10) indicators.
Table No. 3: Eighth Grade Reading Standards and Benchmarks
Grade Standard Benchmark Description
8 2 1
Identify and use a variety of strategies to extend word meaning. (For example, students will be able to correctly apply prefixes and suffixes in order to adapt words for different purposes.)
8 2 2
Build comprehension of texts. (For example, students will be able to ask questions, predict, identify main ideas and supporting details, analyze, summarize and draw logical conclusions.)
8 2 3 Read a variety of printed and media materials for different purposes and discuss opinion of what was read.
Table No. 4: Eighth Grade Literature Standards and Benchmarks
Grade Standard Benchmark Description
8 4 1
Listen to, read or view and respond to a narrative or poem. (For example, students will be able to make a written or oral review of a reading or theatre performance.)
8 4 2
Recognize and identify the complex elements of plot. (For example, students will be able to recognize and identify foreshadowing (the writer’s use of hints or clues about what will happen next) inciting forces (the event that triggers conflict) conflict, crisis, climax and resolution.)
8 4 3 Dramatize record and write about the effects of culture and historical periods on literature and vice-versa.
8 4 5
Apply knowledge of literal and figurative meanings to build vocabulary. (For example, students will be able to interpret metaphor and allegory to enhance their written vocabulary.)

FSM National Minimum Competency Standard-Based Test (NMCT) 2013
10
II. FSM NATIONAL CURRICULUM STANDARDS AND BENCHMARKS IN MATHEMATICS.
Generally, there are four standards used in the design of the National Minimum Competency Standard-Based Test Mathematics Component which is divided by different number of specific benchmarks which Student Learning Outcomes is developed.
Table No. 5: Tenth Grade Reading Standards and Benchmarks
Grade Standard Benchmark Indicator Description
10 2 1 1 Use new grade-appropriate vocabulary, including content area vocabulary, learned through reading and word study.
10 2 1 2 Use new grade-appropriate vocabulary, including content area vocabulary, learned through reading and word study.
10 2 2 1 Read to acquire knowledge and skills to function appropriately in daily life.
10 2 4 1
Analyze and evaluate context to see how the author’s message was influenced by real-life situations in society and culture.
10 2 4 2
Analyze and evaluate context to see how the author’s message was influenced by real-life situations in society and culture.
10 2 5 1
Demonstrate understanding those factors that commonly affect the use of language (gender, social class, family relationship, ethnic groups).
10 2 5 2
Demonstrate understanding those factors that commonly affect the use of language (gender, social class, family relationship, ethnic groups).
10 2 6 1
Compare history, form (e.g. discourse, word order, grammar) function (e.g. purpose, text type, genre), and value of the vernacular language and that of English language, depending upon state’s policies.
10 2 6 2
Compare history, form (e.g. discourse, word order, grammar) function (e.g. purpose, text type, genre), and value of the vernacular language and that of English language, depending upon state’s policies.
10 2 10 1 Ask questions as a way to broaden and enrich learning (e.g. why, how, what if, if…..then).

FSM National Minimum Competency Standard-Based Test (NMCT) 2013
11
Table No. 6 indicates the standards and benchmarks used in the design of the 4thGrade Mathematics Test, which covers four (4) standards and fourteen (14) benchmarks.
Table No. 6: Fourth Grade Mathematics Standards and Benchmarks
Grade Standard Benchma
rk Indicator Description
4 1 1 1 Understand base ten by identifying the place value of whole numbers up to 1,000 and decimal numbers down to 100ths.
4 1 2 1
Demonstrate the ability to read, write, and compare simple tractions and decimals in English and the local counting system.
4 1 3 1
Represent whole numbers, tractions, and decimals and operations involving them, in a variety of ways using physical models, diagrams, and number expressions.
4 1 4 1
Perform the basic operations to add, subtract, multiply, and divide whole numbers and decimals and add and subtract fractions with like denominators
4 1 5 1 Use a variety of methods and ways to round and estimate whole numbers, decimals and fractions.
4 1 6 1
Use a variety of strategies including the understanding of decimals and fractions to solve problems and explain the reasoning used to reach each solution.
4 2 1 1 Identify and classify two and three dimensional shapes.
4 2 2 1 Describe similarities and differences between one, two, and three dimensional geometric figures.
4 2 3 1
Demonstrate understanding of common units in the English and metric systems by choosing appropriate units to measure common objects and quantities.
4 2 4 1
Use standard and non-standard units to determine length, volume, and weight, and describe characteristics of each type of measure.
4 2 5 1
Use the understanding of geometry, measurement, and transformation to solve problems and explain reasoning used to each the solution.
4 3 1 1
Use patterns and functions to represent and solve real world situations and explain the reasoning used to reach the solution.
4 4 1 1 Collect, organize, display, and describe data systematically.
4 4 2 1 Read and interpret data using pictographs, tables, or charts.
FSM National Minimum Competency Standard-Based Test (NMCT) 2013
12
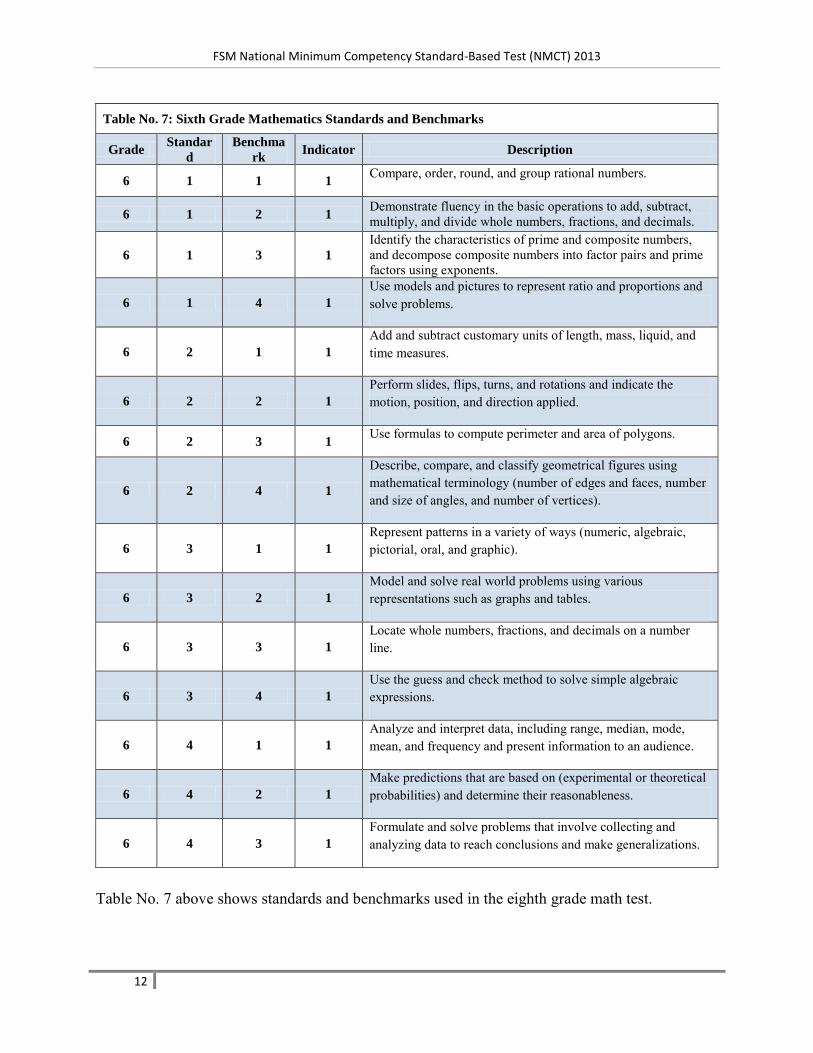
Table No. 7 above shows standards and benchmarks used in the eighth grade math test.
Table No. 7: Sixth Grade Mathematics Standards and Benchmarks
Grade Standar
d
Benchma
rk Indicator Description
6 1 1 1 Compare, order, round, and group rational numbers.
6 1 2 1 Demonstrate fluency in the basic operations to add, subtract, multiply, and divide whole numbers, fractions, and decimals.
6 1 3 1
Identify the characteristics of prime and composite numbers, and decompose composite numbers into factor pairs and prime factors using exponents.
6 1 4 1
Use models and pictures to represent ratio and proportions and solve problems.
6 2 1 1
Add and subtract customary units of length, mass, liquid, and time measures.
6 2 2 1
Perform slides, flips, turns, and rotations and indicate the motion, position, and direction applied.
6 2 3 1 Use formulas to compute perimeter and area of polygons.
6 2 4 1
Describe, compare, and classify geometrical figures using mathematical terminology (number of edges and faces, number and size of angles, and number of vertices).
6 3 1 1
Represent patterns in a variety of ways (numeric, algebraic, pictorial, oral, and graphic).
6 3 2 1
Model and solve real world problems using various representations such as graphs and tables.
6 3 3 1
Locate whole numbers, fractions, and decimals on a number line.
6 3 4 1
Use the guess and check method to solve simple algebraic expressions.
6 4 1 1
Analyze and interpret data, including range, median, mode, mean, and frequency and present information to an audience.
6 4 2 1
Make predictions that are based on (experimental or theoretical probabilities) and determine their reasonableness.
6 4 3 1
Formulate and solve problems that involve collecting and analyzing data to reach conclusions and make generalizations.

FSM National Minimum Competency Standard-Based Test (NMCT) 2013
13
Table No. 8 shows the standards and benchmarks used in the design of the 8th Grade Mathematics Test, which covers four (4) standards and eighteen (18) benchmarks, starting
Table No. 8: Eighth Grade Mathematics Standards and Benchmarks
Grade Standard Benchmark Indicator Description
8 1 1
Represent, compare, order and use numbers in a variety of forms (integer, fraction, decimal, percent, and exponents) in mathematical problem-solving situations.
8 1 2 Demonstrate fluency in computing with rational numbers (fractions, decimals, percents, and integers).
8 1 3 Square whole, rational, and integers and find square roots of perfect squares (e.g. 1, 4, 9, 16, etc).
8 1 4 Use ration, proportion, and percents in problem solving.
8 2 1
Use a compass, protractor, and straight edge to draw two- dimensional figures and do constructions (e.g. Bisecting an angle or line segment, creating a right angle, drawing a circle).
8 2 2 Identify similar and congruent figures and including lines of symmetry and diagonals.
8 2 3
Use formulas to find areas of quadrilaterals, triangles, and circles, and the surface area and volume of cylinders as prisms, including appropriate units of measure.
8 2 4 Use the Pythagorean Theorem to find lengths of sides of right triangles.
8 2 5 Solve simple problems involving rates and derived measure (e.g. Miles per hour, cost per yard )
8 2 6
Use proportional reasoning and indirect measurements to draw inferences, such as measuring the thickness of a book to estimate the thickness of one page.
8 3 1 Write and solve two-step linear equations and one-step inequalities.
8 3 2 Graph linear functions in two variables using a table of ordered pairs.
8 3 3
Use symbolic algebra and additional techniques, such as tables, guess and check, and diagrams, to represent situations and to solve problems, especially those that involve linear relationships.
8 3 4
Model and solve real-world problems using various representations, such as graphs and tables, to understand the purpose and utility of each representation.
8 4 1
Find, describe, and interpret mean, median, mode, and range and determine which measure is best to use in a particular situation.
8 4 2 Read and interpret tables, charts, and graphs, and make inferences based on the data.
8 4 3 Use sampling and other data collection tools to gather and analyze data, and make conclusions and predictions.
8 4 4
Compute simple probabilities using appropriate methods such as lists, tree diagrams, or through experimental or simulation activities.

FSM National Minimum Competency Standard-Based Test (NMCT) 2013
14
with a skill such as using numbers in various forms to using Pythagorean Theory to find length and computing probabilities using, for instance, tree diagram or experimental activities.
Table No. 9 shows that there are four (4) standards and eleven (11) benchmarks used in the design of the 10th Grade Mathematics Test, covering skills such as abilities to demonstrate inverse relationships between square numbers and square roots to solving single-variable equations.
Table No. 9: Tenth Grade Mathematics Standards and Benchmarks
Grade Standard Benchmark Description
10 1 1 Demonstrate the inverse relationship between square numbers and square roots.
10 1 2 Compare and order rational numbers and square roots using a number line.
10 1 3 Solve problems with squares and square roots, limited to square roots of square numbers.
10 1 4 Represent numbers in a variety of forms including factors, multiples, exponents, primes, composites, fractions, decimals, and percentages and change from one form to another.
10 2 1 Apply an understanding of the English and metric systems of measurement to solve problems.
10 2 2 Use formulas, including approximate units of measure, to determine the surface area and volume for selected prisms, cylinders, and pyramids.
10 2 3 Apply the Pythagorean Theorem to solve problems involving right triangles.
10 2 4 Perform transformations including reflection, rotation, and translation and describe the size, position, and orientation of the resulting shapes.
10 3 1 Represent a variety of patterns, including recursive patterns, with tables, graphs, words, and symbols.
10 3 2 Represent mathematical situations as algebraic expressions and equations and describe algebraic expressions using words.
10 3 3 Solve Single-variable equations and inequalities using rational numbers.

FSM National Minimum Competency Standard-Based Test (NMCT) 2013
15
III. NMCT 2013 PARTICIPATION
The NMCT 2013 administration is a new initiative to test all schools across the nation with a share cost with the 4 states. Although the new initiative was already in place, there are several factors directly affected the new initiative of “testing all schools.” For instance Chuuk state was not able to test 6 schools for 6th grade math and Yap State was not able to test 2 schools for the same subject and grade. Both of the states were not able to supply specific reasons for leaving the identified schools out of the NMCT 2013 administration.
Table No. 10: NMCT 2013 participation (Reading Test)
Grades Sixth Grade Eighth Grade Tenth Grade
States Reg Reg Reg
Chuuk 638 675 391
Kosrae 157 145 140
Pohnpei 835 831 627
Yap 143 249 197
National 1773 1160 1003
Table No. 10 indicates number of students participated in the NMCT 2013 reading test for grades 6, 8, and 10 for regular education students in all four states, respectively.
Table No. 11: NMCT 2013 participation (Mathematics Test)
Grades Fourth Grade Sixth Grade Eighth Grade Tenth Grade
States Reg Reg Reg Reg
Chuuk 644 641 670 392
Kosrae 161 157 145 139
Pohnpei 863 866 819 615
Yap 231 238 245 198
National 1899 1903 1879 1244
Table No. 11 indicates number of regular students actually participated in the NMCT 2013 mathematics test for grades 4, 6, 8 and 10 for regular education students in all four states, respectively.
FSM National Minimum Competency Standard-Based Test (NMCT) 2013
16
Table No. 12: NMCT 2013 Participation vs. Enrollment (Sample Mathematics Test)
States Fourth Grade Sixth Grade Eighth Grade Tenth Grade
Chuuk 1229 644 1098 641 1085 670 788 392 Kosrae 161 157 158 156 145 144 139 151 Pohnpei 863 908 866 966 830 805 615 639 Yap 231 194 238 224 245 203 198 230 National 1900 1259 1903 2525 1891 2310 1344 1869
Table No. 12 shows number of students actually participated in the NMCT 2013 out of the total enrollment for a particular grade. For instance, out of the total enrollment of 167 Kosrae fourth (4) graders, a very high percentage of 99% of the students participated in the NMCT 2013 and a similar percentage is evident for six (6) graders and for eight (8) graders. A similar interpretation can be made for the rest of the states for the same table. Evidently, Kosrae had performed the best according to ensuring student participation amongst the four states across the federation. Undoubtedly, Chuuk State continues to perform the least in ensuring compliancy in terms of NMCT 2013 administration and participation.
IV. STUDENT PERFORMANCE
A. NATIONAL 2YRS. TREND
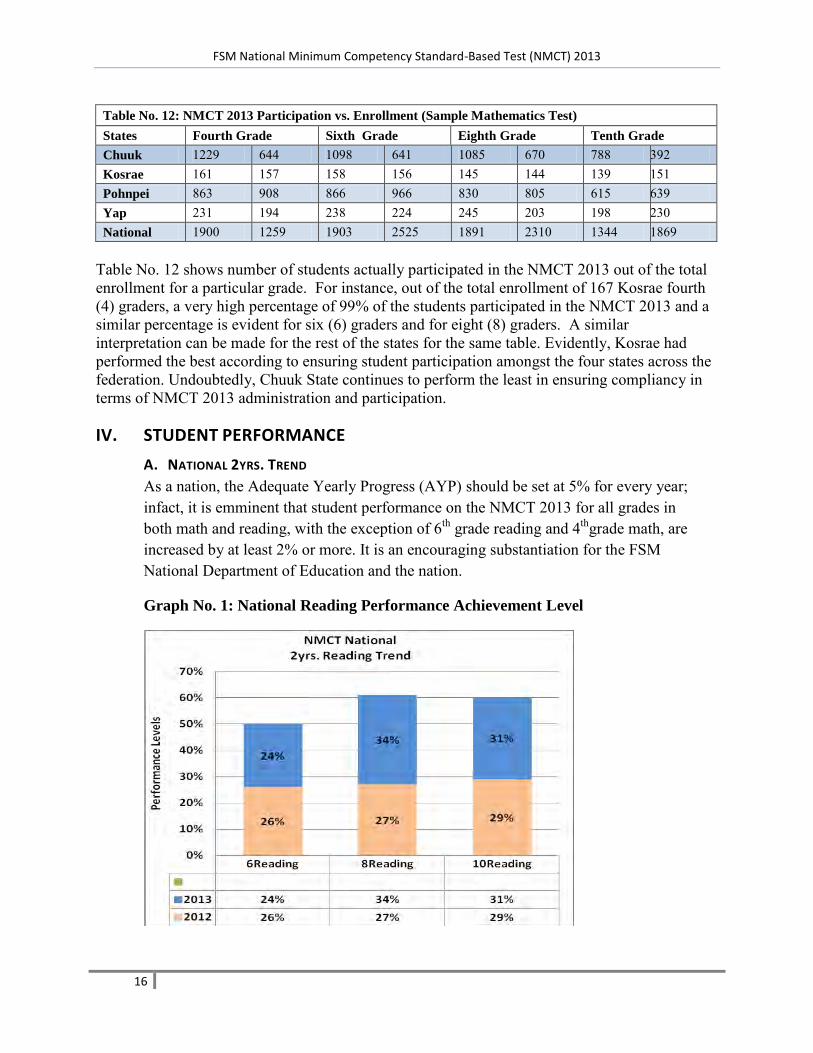
As a nation, the Adequate Yearly Progress (AYP) should be set at 5% for every year; infact, it is emminent that student performance on the NMCT 2013 for all grades in both math and reading, with the exception of 6th grade reading and 4thgrade math, are increased by at least 2% or more. It is an encouraging substantiation for the FSM National Department of Education and the nation.
Graph No. 1: National Reading Performance Achievement Level
FSM National Minimum Competency Standard-Based Test (NMCT) 2013
17
First bar indicates that within two school year period, as a nation, 6th grade student reading performance decreased by 2%. The goal for 6th grade reading for the nation is to increase the student performance level from 24% to at least 29% in 2014.
Second bar indicates the 2yrs trend for 8th grade reading for the nation. Clearly, 8th grade reading performance was increased by 7%. Although majority are still performing under expectation, a huge increased is evident at the competent and minimum competency levels, respectively. At both competent and minimum competency, 8th grade student performance was increased by 7%. The goal for 8th grade students in reading across the nation is to increase student performance level of competent and minimum competency from 34% to at least 41% in 2014.
Third bar shows the 10th grade reading performance level. It clearly indicates that the reading performance level of 10th graders across the nation is increased by 2%. That increase can be calculated from the combination of competency and minimum competency within a 2 year period.
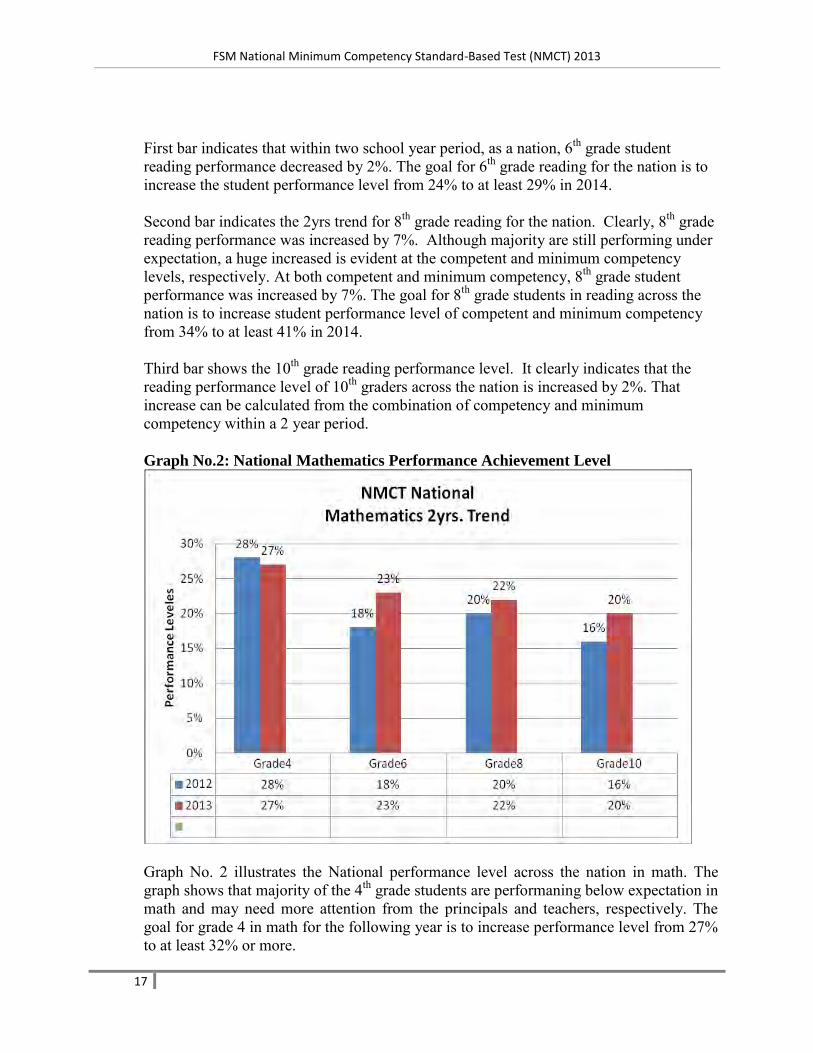
Graph No.2: National Mathematics Performance Achievement Level
Graph No. 2 illustrates the National performance level across the nation in math. The graph shows that majority of the 4th grade students are performaning below expectation in math and may need more attention from the principals and teachers, respectively. The goal for grade 4 in math for the following year is to increase performance level from 27% to at least 32% or more.

FSM National Minimum Competency Standard-Based Test (NMCT) 2013
18
Second group of bars on the graph shows the math performance level of 6th grade students across the country. It shows that the math performance level of 6th graders across the nation is increased by 5% within a 2 years period. Although the majority are still performing below expectation, there is a little increase of 5% in performance at the performance level expectation and beyond. The goal for 6th graders in math for the nation is to progress by 5% every year until 2023.
B. STATE 2YRS. TREND REPORTS
1. CHUUK STATE
Graph No.1: Chuuk Reading Performance Levels
Graph No. 1 shows Chuuk students’ achievement level in reading for all grades tested (6,8 & 1)). First bar on the graph indicates that out of all Chuuk 6th grade students who participated in the NMCT 2012 reading test, an average of 11% perform at and above performance expectation. The following year, Chuuk 6th grade students’ performance is increased by 10%.
Second bar indicates performance level of Chuuk 8th grade students in reading. Performance level in reading for grade 8 also increased by 9%.
Third bar indicates that Chuuk 10th grade performance is increased by 15%, respectively. Chuuk state reading performance goal for 2014 will be to increase student performance by at least 10%.
FSM National Minimum Competency Standard-Based Test (NMCT) 2013
19
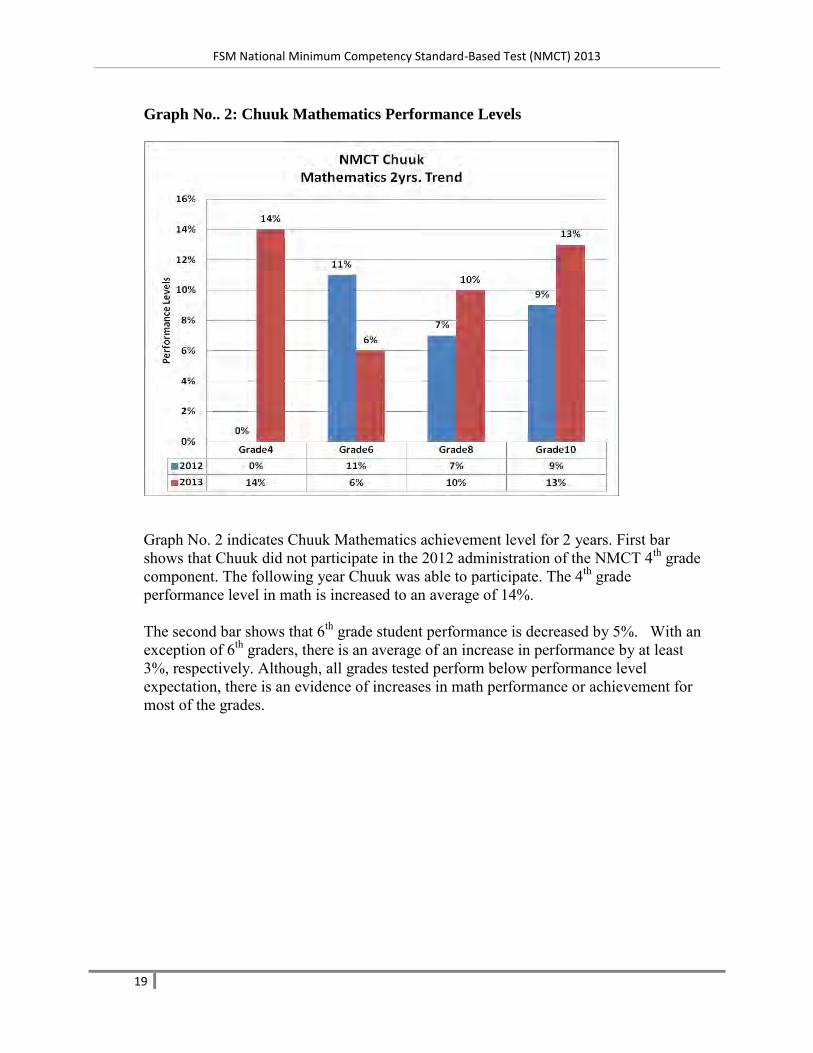
Graph No.. 2: Chuuk Mathematics Performance Levels
Graph No. 2 indicates Chuuk Mathematics achievement level for 2 years. First bar shows that Chuuk did not participate in the 2012 administration of the NMCT 4th grade component. The following year Chuuk was able to participate. The 4th grade performance level in math is increased to an average of 14%.
The second bar shows that 6th grade student performance is decreased by 5%. With an exception of 6th graders, there is an average of an increase in performance by at least 3%, respectively. Although, all grades tested perform below performance level expectation, there is an evidence of increases in math performance or achievement for most of the grades.

FSM National Minimum Competency Standard-Based Test (NMCT) 2013
20
2. YAP STATE
Graph N0.3: Yap Reading Performance Levels
Graph No. 3 indicates the Yap student reading performance level. The first bar shows that an average score of 12% increased between 2 years period is apparent for Yap 6th grade students’ performance level. In the same manner, 8th graders’ performance is increased by 3% and 10th graders’ performance is increased by an average score of 10%, respectively.

FSM National Minimum Competency Standard-Based Test (NMCT) 2013
21
Graph No 4: Yap Mathematics Performance Levels
Graph No. 4 shows Yap students’ mathematics achievement level in a 2 years period.
First bar indicates that there is an increased in performance by Yap 4th graders by an average score of 2%.
Second Bar shows that 6th graders’ performance is increased by an average score of 5% from an average score of 19% in 2012 to 24% in 2013, respectively. Third and fourth bars show an average increases in scores by 1% and 4%, correspondingly. Clearly, all scores fall below performance level expectation; however, an indication of at least some progression is obvious for all grades tested for Yap State.

FSM National Minimum Competency Standard-Based Test (NMCT) 2013
22
3. POHNPEI STATE
Graph No.5: Pohnpei Reading Performance Levels
Graph No. 5 shows Pohnpeian students’ performance in reading. Unfortunately, Pohnpei sixth graders did not do too well comparing two years period. There is a sharp decreased of an average score from 34% down to 19% with a drop of 15%. Eighth graders’ performance is increased by 6%. Tenth graders’ achievement level stood at 0% since they did not participate in the NMCT administration of 2012; however, increased by 31% in 2013.
FSM National Minimum Competency Standard-Based Test (NMCT) 2013
23
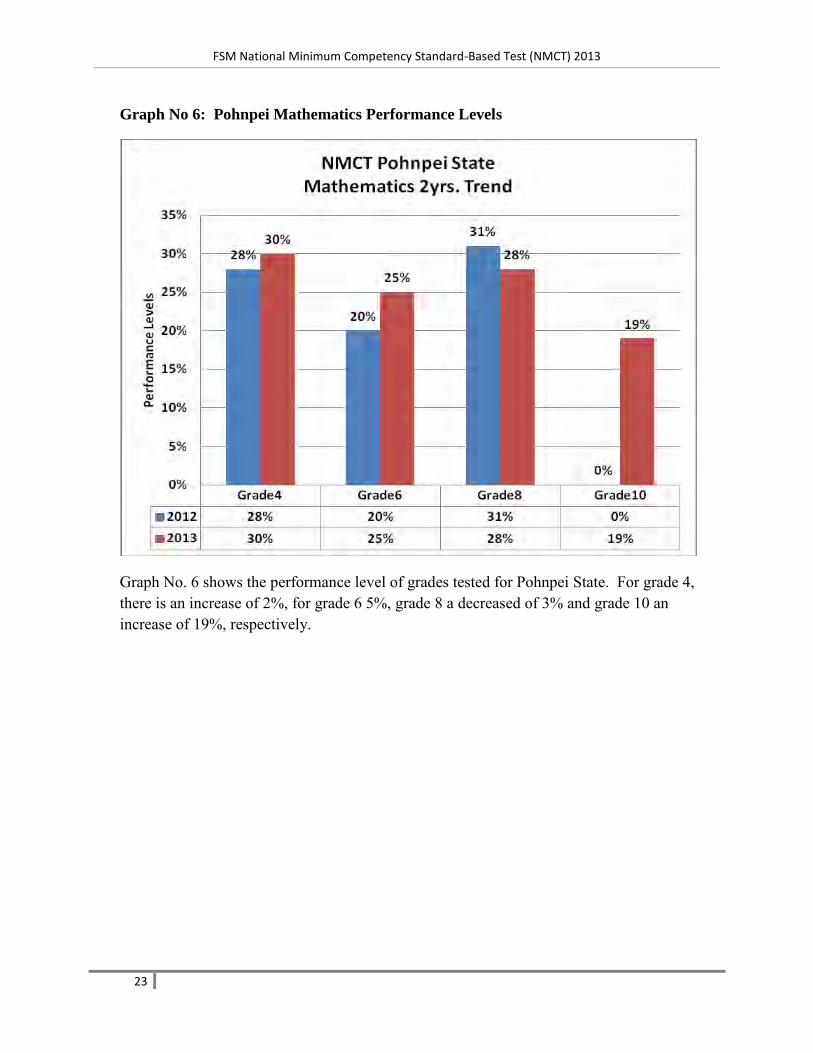
Graph No 6: Pohnpei Mathematics Performance Levels
Graph No. 6 shows the performance level of grades tested for Pohnpei State. For grade 4, there is an increase of 2%, for grade 6 5%, grade 8 a decreased of 3% and grade 10 an increase of 19%, respectively.

FSM National Minimum Competency Standard-Based Test (NMCT) 2013
24
4. KOSRAE STATE
Graph No. 7: Kosrae Reading Performance Levels
Graph No. 7 shows the performance level of Kosrae students in reading. For grade 4 there is an increase of 2%, grade 8 an increase of 48% and grade 10 2%, respectively.

FSM National Minimum Competency Standard-Based Test (NMCT) 2013
25
Graph No 8: Kosrae Mathematics Performance Levels
Graph No. 8 shows the performance level of Kosraean students in math. Clearly, there are enormous increases for all grades tested.
SUMMARY
In general, the report covers all the basic requirements of a report; however the main parts of the report, presents students’ participation and performance data. At the outset, vital information on school performance data within a 2-3 years period is given in detail as appendices.
Nonetheless, passing a test like NMCT is sometimes stressful. It can put a tremendous strain on students and teachers, but mostly students. This is because students who perform well in class can fail to pass the test if they simply do not do well on tests. Teachers who have taught everything in the curriculum and have taught it well can find that their efforts are not always reflected in student performance. A parent worries about their child doing well on one single test. Passing the test can require more than just knowing the information though and there are many things that parents can also do to help set their child up for success on tests like NMCT across the nation. They can help them mentally, emotionally and physically prepared. They should always ensure their children eat balance meal before taking a National Standardized Test and the list goes on.
FSM National Minimum Competency Standard-Based Test (NMCT) 2013
26
While National Minimum Competency-Standardized Test (NMCT) can be daunting, a positive attitude can boost confidence and improve test performance. Researchers have found that test performance is, in part, psychological. When learners receive positive messages about their ability to learn and to succeed academically, they are less likely to conform to stereotypes that they believe others have of them, and they perform significantly better on tests. So, the students and their teachers must be positive! Students need to see NMCT as an opportunity to demonstrate their ability, not evidence that they are victims of a system that cares little about them. Some students may lead stressful lives. Stress comes from family, from personal health concerns, from the times we live in, and so on. Students need to stay organized because testing time is precious, and they owe it to themselves to make the most of it. And so they need some quiet time right before taking a test. An hour or two to clear their heads of life's stresses, time to think about the challenges associated with the upcoming test. Educational Leaders and Political leaders need to think deeply about the role of NMCT in public schools. They must know how to interpret test results and how to use them to make decisions and then they can put NMCT results in perspective to get a more balanced perspective of how they judge schools, teachers, and kids.

FSM National Minimum Competency Standard-Based Test (NMCT) 2013
27
APPENDICES: ADEQUATE YEARLY PROGRESS
M04 - NMCT Minimum Competency Math Grade 4
IslandName SchoolName 2010-2011 2011-2012 2012-2013 Change
Chuuk
Amwachang Elem/Amwachang Annex School
17%
Berea Christian Elementary School
31%
Central Wonip Elementary School
94%
Chukuram/Nethon Elementary School
44%
East Wonip Elementary School
98%
Eot Elementary School
77%
Epin Elem/Epin Annex School
60%
Ettal Elementary School
9%
Fananu Elementary School
26%
Fanapanges Elementary School
32%
Fonoton Elementary School
24%
Foup Elementary School (St. Julia)
14%
Houk Elementary School
7%
Inaka Elementary School
33%
Iras Demo School
10%
Kuchu Elementary School
28%
Kuchuwa Elementary School
7%
Kukku Elementary School
13%
Kuttu Elementary School
20%
Lekinioch Elementary School
4%
Losap Elementary School
5%
Manaio Elementary School
8%
Mechitiw Elementary School
14%
Messa/Pwene Elementary School
10%
Moch Elementary School
60%
Mokur Elementary School
10%
Munien/Nechocho Elementary School
42%
Murilo Elementary School
16%
Mwan Elementary School
25%
Namoluk Elementary School
30%
Neauo Elementary School
9%
Nechap Elementary School
16%
Neirenomw Elem/Neirenomw Annex School
80%
Nema Elementary School
12%
Nomusofo Jr. High/Udot Elementary School
34%
Nomwin Elementary School
35%

FSM National Minimum Competency Standard-Based Test (NMCT) 2013
28
Nukaf/Sapota Elementary School
34%
Nukuno Elementary School
8%
Oneop Elementary School
41%
Onou Elementary School
23%
P&P Elementary School
45%
Panitiw Elementary School
22%
Parem Elementary School, Chuuk
10%
Piherarh Elementary School
9%
Piis Panew Elementary School
13%
Piisemwar Elementary School
3%
Pollap Elementary School
16%
Polowat Elementary School
29%
PPO Jr. High/Sapou Elementary School
87%
Romanum Elementary School
28%
Ruo Elementary School
11%
Sapore Elementary School
22%
Sapuk Elementary School
35%
Satowan Elementary School
30%
SDA School, Chuuk
43%
Siis Elementary School
20%
Sino Memorial School
6%
St. Cecilia School
17%
Ta Elementary School
8%
Teruo Bckuku Elementary School, Penieta
10%
UFO Elementary School
95%
Unanu Elementary School
40%
West Fefen Elementary School
7%
IslandName SchoolName 2010-2011 2011-2012 2012-2013 Change
Kosrae
Lelu Elementary School 36% 59% 54% -5.0%
Malem Elementary School 28% 30% 29% -1.7%
Sansrik Elementary School 27% 40% 31% -9.1%
SDA School, Kosrae
29% 37% 8.1%
Tafunsak Elementary School 24% 33% 27% -6.0%
Utwe Elementary School 56% 56% 58% 2.4%
Walung Elementary School 34% 42% 13% -28.7%
IslandName SchoolName 2010-2011 2011-2012 2012-2013 Change
Pohnpei
Awak Elementary School 22% 15% 48% 33.1%
Calvary Christian Academy
68%
Enpein Elementary School 20% 9% 14% 4.6%
ESDM Elementary School 18% 22% 15% -6.5%
Kapingamarangi Elementary School
13% 19% 5.8%

FSM National Minimum Competency Standard-Based Test (NMCT) 2013
29
Kolonia Elementary School 15% 39% 20% -18.8%
Lewetik Elementary School 10% 6% 25% 19.0%
Lukop Elementary School 16% 26% 24% -1.3%
Mand Elementary School
14%
Mwoakilloa Elementary School 38% 60%
Nanpei Memorial School 22% 32% 60% 28.0%
Nett Elementary School 19% 24% 39% 15.1%
Nukuoro Elementary School
11% 23% 11.6%
Ohmine Elementary School 20% 20% 18% -2.8%
Pakein Elementary School
20% 7% -13.3%
Palikir Elementary School 13% 51% 36% -14.9%
Parem (Pohnpei) Elementary School 23% 29% 14% -14.4%
Pehleng Elementary School
13% 21% 8.3%
Pingelap Elementary School 21% 68% 53% -14.6%
Pohnpei Catholic School
31%
Rohi Elementary School 20% 29% 66% 37.4%
RSP Elementary School 10% 20% 31% 11.0%
Saladak Elementary School 33% 34% 24% -10.1%
Salapwuk Elementary School 10% 18% 10% -7.5%
Sapwalap Elementary School 22% 47% 42% -5.6%
Sapwuahfik Elementary School
25% 16% -9.6%
Sapwuahfik Elementary (SDA)
30%
SDA School, Pohnpei
45%
Seinwar Elementary School 28% 25% 47% 22.3%
Sekere Elementary School
12% 16% 3.4%
Sokehs Powe Elementary School 15% 47% 30% -16.7%
Temwen Elementary School 32% 68% 21% -46.9%
Wapar Elementary School 8% 14% 24% 9.8%
Wone Elementary School 17% 29% 26% -3.0%
IslandName SchoolName 2010-2011 2011-2012 2012-2013 Change
Yap
Asor Community Elementary School
26% 30% 4.0%
Bael Community School 25% 27% 0% -27.1%
Dalipebinaw Community School 38% 27% 21% -5.4%
Eauripik Community School
13%
Elato Community School 8% 8% 7% -1.7%
Fadrai Elementary School
24%
Fais Community School
18% 11% -6.9%
Falalis Community School
18% 23% 5.8%
Falalop Ulithi Elementary School
26%
Falalop Woleai Community School
17% 9% -7.8%
Fechailap Community School 20%
Gaanelay Community School 25% 28% 19% -9.5%

FSM National Minimum Competency Standard-Based Test (NMCT) 2013
30
Gagil Community School 29% 15% 30% 15.0%
Gilman Community School 40% 21% 30% 8.9%
Ifalik Community School 17% 14% 16% 1.3%
Kanifay Community School 10%
10%
Lamotrek Community School 21% 20% 27% 7.0%
Maap Community School 14% 0% 21% 21.1%
Mogmog Community School
20% 34% 14.0%
North Fanif Community School 25% 35% 20% -15.0%
Piig Community School
10% 20% 10.0%
Rumuu Fanif Community School 13% 5% 22% 17.0%
Satawal Community School 12% 8% 12% 3.5%
SDA School, Yap 36% 29% 27% -1.4%
Seliap Community School
7%
St. Mary's School 28% 29% 36% 7.0%
Tamilang Community School 35% 24% 60% 35.7%
Tegailap Community School
15%
Wottegai Community School
13% 5% -7.5%

FSM National Minimum Competency Standard-Based Test (NMCT) 2013
31
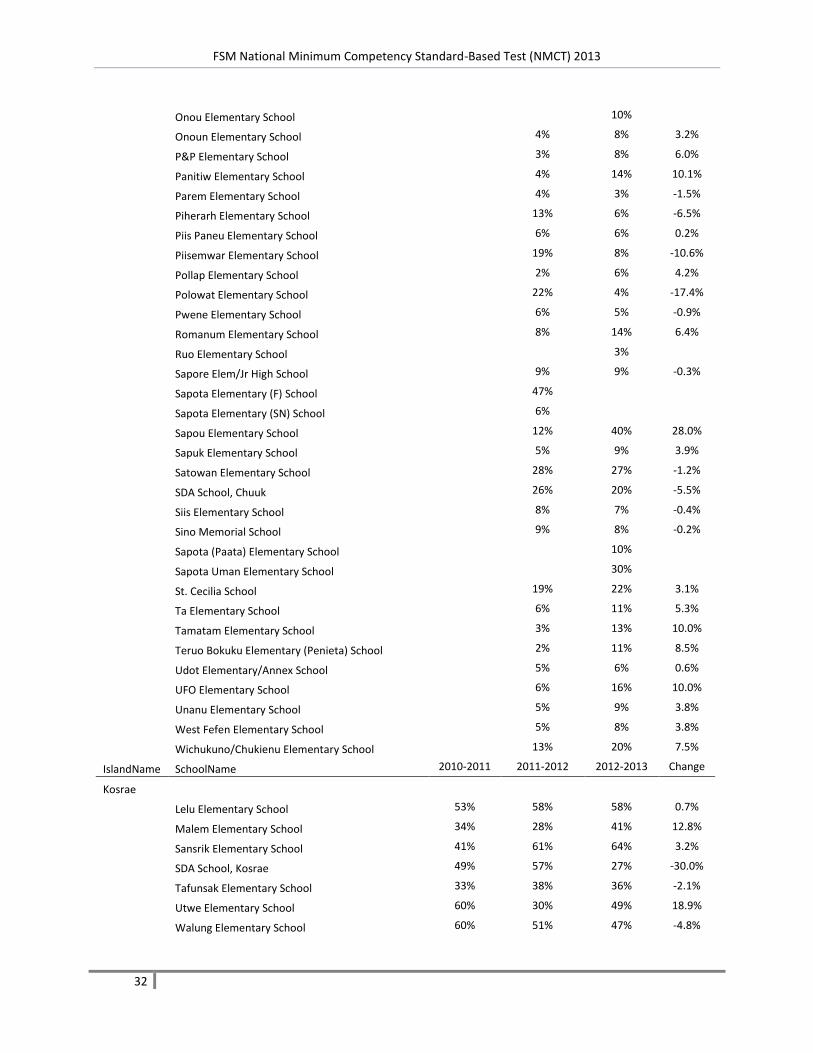
M06 - NMCT Minimum Competency Math Grade 6
IslandName SchoolName 2010-2011 2011-2012 2012-2013 Change
Chuuk
Amwachang Elementary School
6% 5% -0.6%
Berea Christian School
20% 25% 4.9%
Central/West Wonip Elem School
6% 29% 23.0%
Chukuram/Winikka/Nethon Elem School
13% 5% -7.5%
East Wonip Elementary School
25% 28% 3.0%
Eot Elementary School
23% 51% 28.4%
Epin Elementary School
8% 18% 9.2%
Ettal Elementary School
8% 17% 9.2%
Fananu Elementary School
8%
Fanapanges Elementary School
30% 0% -30.0%
Faro/Winifei Elementary School
27%
Fason Elementary School
15%
Fonoton Elementary School
7% 14% 7.3%
Foup Elementary School
20% 20% 0.0%
Houk Elementary School
7% 0% -7.0%
Inaka Elementary School
7% 5% -2.0%
Iras Demo School
9% 11% 2.3%
Kuchu Elementary School
9% 10% 1.0%
Kuchuwa Elementary School
10% 15% 5.0%
Kukku Elementary School
15% 21% 6.8%
Kuttu Elementary School
8% 12% 4.2%
Lekinioch Elementary School
14% 9% -5.8%
Losap Elementary School
11% 5% -6.3%
Manaio Elementary School
0% 18% 18.0%
Mechitiw Elementary School
14% 26% 11.3%
Messa Elementary School
0% 4% 4.3%
Moch Elementary School
46% 11% -35.1%
Mokur Elementary School
0% 3% 2.5%
Munien/Nechocho Elementary School
20% 42% 21.7%
Murilo Elementary School
5%
Mwan Elementary School
10% 7% -2.4%
Namoluk Elementary School
83% 7% -75.8%
Neauo Elementary School
4% 15% 10.6%
Nechap Elem/Annex School
8% 30% 22.1%
Nema Elementary School
15% 7% -7.7%
Nomwin Elementary School
5%
Nukaf Elementary School
5% 10% 5.0%
Nukuno Elementary School
6% 7% 1.3%
Oneop Elementary School
9% 18% 8.5%
FSM National Minimum Competency Standard-Based Test (NMCT) 2013
32
Onou Elementary School
10%
Onoun Elementary School
4% 8% 3.2%
P&P Elementary School
3% 8% 6.0%
Panitiw Elementary School
4% 14% 10.1%
Parem Elementary School
4% 3% -1.5%
Piherarh Elementary School
13% 6% -6.5%
Piis Paneu Elementary School
6% 6% 0.2%
Piisemwar Elementary School
19% 8% -10.6%
Pollap Elementary School
2% 6% 4.2%
Polowat Elementary School
22% 4% -17.4%
Pwene Elementary School
6% 5% -0.9%
Romanum Elementary School
8% 14% 6.4%
Ruo Elementary School
3%
Sapore Elem/Jr High School
9% 9% -0.3%
Sapota Elementary (F) School
47%
Sapota Elementary (SN) School
6%
Sapou Elementary School
12% 40% 28.0%
Sapuk Elementary School
5% 9% 3.9%
Satowan Elementary School
28% 27% -1.2%
SDA School, Chuuk
26% 20% -5.5%
Siis Elementary School
8% 7% -0.4%
Sino Memorial School
9% 8% -0.2%
Sapota (Paata) Elementary School
10%
Sapota Uman Elementary School
30%
St. Cecilia School
19% 22% 3.1%
Ta Elementary School
6% 11% 5.3%
Tamatam Elementary School
3% 13% 10.0%
Teruo Bokuku Elementary (Penieta) School
2% 11% 8.5%
Udot Elementary/Annex School
5% 6% 0.6%
UFO Elementary School
6% 16% 10.0%
Unanu Elementary School
5% 9% 3.8%
West Fefen Elementary School
5% 8% 3.8%
Wichukuno/Chukienu Elementary School
13% 20% 7.5%
IslandName SchoolName 2010-2011 2011-2012 2012-2013 Change
Kosrae
Lelu Elementary School 53% 58% 58% 0.7%
Malem Elementary School 34% 28% 41% 12.8%
Sansrik Elementary School 41% 61% 64% 3.2%
SDA School, Kosrae 49% 57% 27% -30.0%
Tafunsak Elementary School 33% 38% 36% -2.1%
Utwe Elementary School 60% 30% 49% 18.9%
Walung Elementary School 60% 51% 47% -4.8%

FSM National Minimum Competency Standard-Based Test (NMCT) 2013
33
IslandName SchoolName 2010-2011 2011-2012 2012-2013 Change
Pohnpei
Awak Elementary School 22% 21% 21% 0.7%
Calvary Christian Academy
53%
Enpein Elementary School 23% 23% 34% 10.5%
ESDM Elementary School 9% 19% 50% 31.1%
Kapingamarangi Elementary School
5% 12% 7.7%
Kolonia Elementary School 17% 22% 21% -1.5%
Lewetik Elementary School 17% 10% 5% -5.0%
Lukop Elementary School 27% 29% 35% 6.3%
Mwoakilloa Elementary School 0% 18% 25% 7.5%
Nanpei Memorial School 26% 8% 23% 14.3%
Nett Elementary School 19% 17% 27% 10.0%
Nukuoro Elementary School
12% 9% -2.5%
Ohmine Elementary School 15%
24%
Pakein Elementary School
25% 20% -5.0%
Palikir Elementary School 10% 28% 19% -9.4%
Parem Elementary School, Pohnpei 9% 10% 18% 7.5%
Pehleng Elementary School
30% 37% 6.7%
Pingelap Elementary School 15% 13% 25% 12.5%
Pohnlangas Elementary School
22% 31% 9.7%
Pohnpei Catholic School
44%
Rohi Elementary School 15% 21% 36% 14.7%
RSP Elementary School 10% 16% 24% 8.2%
Saladak Elementary School 23% 31% 40% 9.0%
Salapwuk Elementary School 24% 8% 13% 5.0%
Sapwalap Elementary School 9% 20% 24% 4.2%
Sapwuahfik Elementary School
21% 27% 5.8%
SDA School, Pohnpei
28%
Seinwar Elementary School 38% 39% 27% -12.9%
Sekere Elementary School
6% 17% 11.6%
Sokehs Powe Elementary School 25% 21% 20% -0.9%
Wone Elementary School 24% 13% 16% 3.6%
IslandName SchoolName 2010-2011 2011-2012 2012-2013 Change
Yap
Asor Community Elementary School
33% 5% -28.3%
Bael Community School 14% 28% 15% -12.5%
Colonia Middle School 30% 22% 29% 7.5%
Dalipebinaw Community School 26% 26% 50% 24.3%
Eauripik Community School 28%
20%
Elato Community School 5% 9% 10% 1.3%
Fadraii Community School
5% 30% 25.0%
Fais Community School
13% 8% -4.5%

FSM National Minimum Competency Standard-Based Test (NMCT) 2013
34
Falalis Community School
15% 20% 5.0%
Falalop Ulithi Elementary School
18% 16% -2.2%
Falalop Woleai Community School
17% 17% 0.0%
Faraulap Elementary 7% 18%
Gagil Community School 14% 36% 28% -7.7%
Gilman Community School 26% 44% 51% 7.0%
Ifalik Community School 13% 13% 16% 3.1%
Kanifay Community School 5% 0%
Lamotrek Community School 19% 11% 38% 26.6%
Maap Community School 20% 22% 25% 3.0%
Mogmog Community School
22% 10% -12.0%
North Fanif Community School
20% 15% -5.0%
Piig Community School
0% 10% 10.0%
Rumuu Fanif Community School 23% 24% 23% -1.8%
Satawal Community School 12% 12% 20% 8.1%
SDA School, Yap 53% 37% 43% 6.3%
Seliap Community School
20% 10% -10.0%
St. Mary's School 24%
33%
Tamilang Community School 25% 29% 34% 5.1%
Tegailap Community School
10% 20% 10.0%
Wottegai Community School
14% 37% 22.7%

FSM National Minimum Competency Standard-Based Test (NMCT) 2013
35
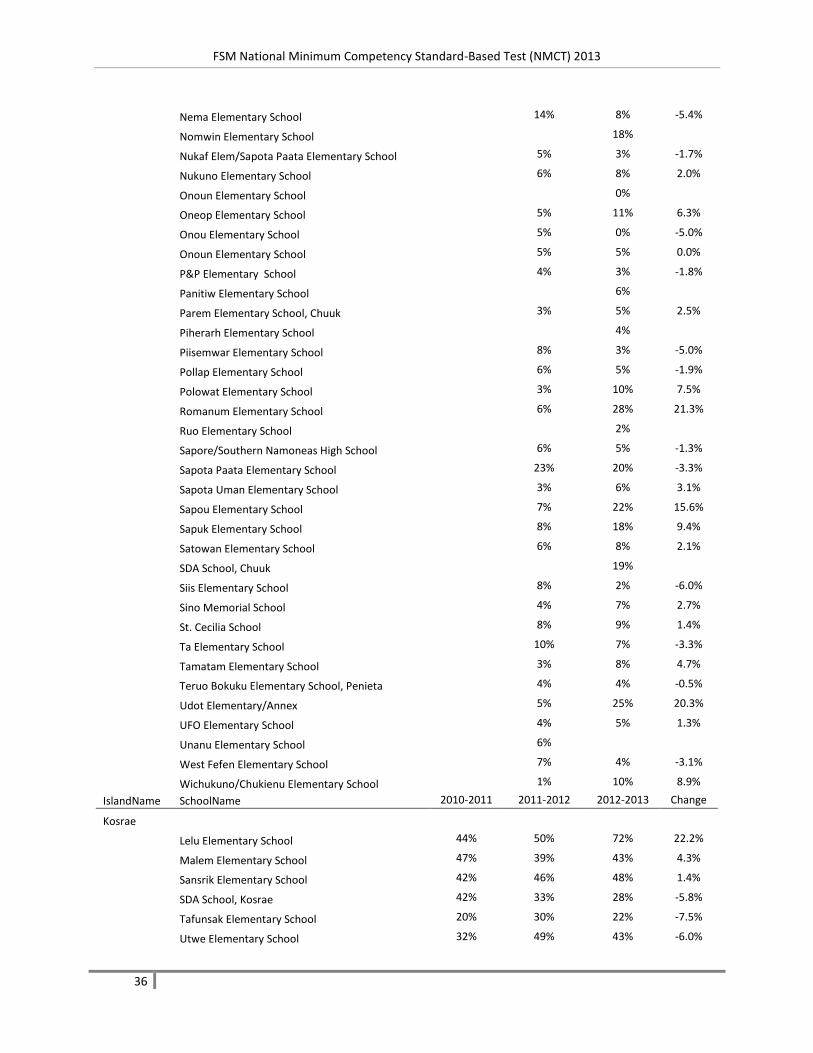
M08 - NMCT Minimum Competency Math Grade 8
IslandName SchoolName 2010-2011 2011-2012 2012-2013 Change
Chuuk
Amwachang Elementary School
10% 2% -8.0%
Berea Christian Elementary School
15%
Central/West Wonip Elementary School
8% 23% 14.2%
Chukuram Elem/Nethon Elementary School
30%
Chukuram/Winikka Elementary School
4%
East Wonip Elementary School
5% 22% 16.7%
Eot Elementary School
9% 29% 20.0%
Epin Elementary School
2% 4% 2.4%
Ettal Elementary School
15% 3% -11.7%
Fananu Elementary School
2%
Fanapanges Elementary School
4% 0% -4.3%
Faro/Winifei Elementary School
6%
Fason Elementary School
4%
Fason Elementary/Faichuk High School
69%
Fonoton Elementary School
2% 2% 0.6%
Foup Elementary School
5% 2% -2.5%
Foupo Elementary School
4%
Houk Elementary School
2% 8% 6.0%
Inaka Elementary School
14% 0% -14.4%
Iras Demo School
9% 9% -0.3%
Kuchu Elementary School
4% 11% 7.0%
Kuchuwa Elementary School
5% 3% -1.7%
Kukku Elementary School
6% 9% 3.3%
Kuttu Elementary School
15% 16% 0.6%
Lekinioch Elementary School
8% 4% -3.2%
lnaka Elementary School
5%
Losap Elementary School
10% 0% -10.0%
lras Demo School
14%
Manaio Elementary School
3%
Mechitiw Elementary School
4% 9% 4.3%
Messa Elem/Pwene Elementary School
7% 5% -2.1%
Moch Elementary School
11% 9% -1.7%
Mokur Elementary School
7% 3% -4.6%
Munien/Nechocho Elementary School
6% 33% 26.3%
Murilo Elementary School
8%
Mwan Elementary School
6% 7% 0.8%
Namoluk Elementary School
6% 23% 16.3%
Neauo Elementary School
8% 7% -0.5%
Nechap Elementary School
6%
FSM National Minimum Competency Standard-Based Test (NMCT) 2013
36
Nema Elementary School
14% 8% -5.4%
Nomwin Elementary School
18%
Nukaf Elem/Sapota Paata Elementary School
5% 3% -1.7%
Nukuno Elementary School
6% 8% 2.0%
Onoun Elementary School
0%
Oneop Elementary School
5% 11% 6.3%
Onou Elementary School
5% 0% -5.0%
Onoun Elementary School
5% 5% 0.0%
P&P Elementary School
4% 3% -1.8%
Panitiw Elementary School
6%
Parem Elementary School, Chuuk
3% 5% 2.5%
Piherarh Elementary School
4%
Piisemwar Elementary School
8% 3% -5.0%
Pollap Elementary School
6% 5% -1.9%
Polowat Elementary School
3% 10% 7.5%
Romanum Elementary School
6% 28% 21.3%
Ruo Elementary School
2%
Sapore/Southern Namoneas High School
6% 5% -1.3%
Sapota Paata Elementary School
23% 20% -3.3%
Sapota Uman Elementary School
3% 6% 3.1%
Sapou Elementary School
7% 22% 15.6%
Sapuk Elementary School
8% 18% 9.4%
Satowan Elementary School
6% 8% 2.1%
SDA School, Chuuk
19%
Siis Elementary School
8% 2% -6.0%
Sino Memorial School
4% 7% 2.7%
St. Cecilia School
8% 9% 1.4%
Ta Elementary School
10% 7% -3.3%
Tamatam Elementary School
3% 8% 4.7%
Teruo Bokuku Elementary School, Penieta
4% 4% -0.5%
Udot Elementary/Annex
5% 25% 20.3%
UFO Elementary School
4% 5% 1.3%
Unanu Elementary School
6%
West Fefen Elementary School
7% 4% -3.1%
Wichukuno/Chukienu Elementary School
1% 10% 8.9%
IslandName SchoolName 2010-2011 2011-2012 2012-2013 Change
Kosrae
Lelu Elementary School 44% 50% 72% 22.2%
Malem Elementary School 47% 39% 43% 4.3%
Sansrik Elementary School 42% 46% 48% 1.4%
SDA School, Kosrae 42% 33% 28% -5.8%
Tafunsak Elementary School 20% 30% 22% -7.5%
Utwe Elementary School 32% 49% 43% -6.0%
FSM National Minimum Competency Standard-Based Test (NMCT) 2013
37
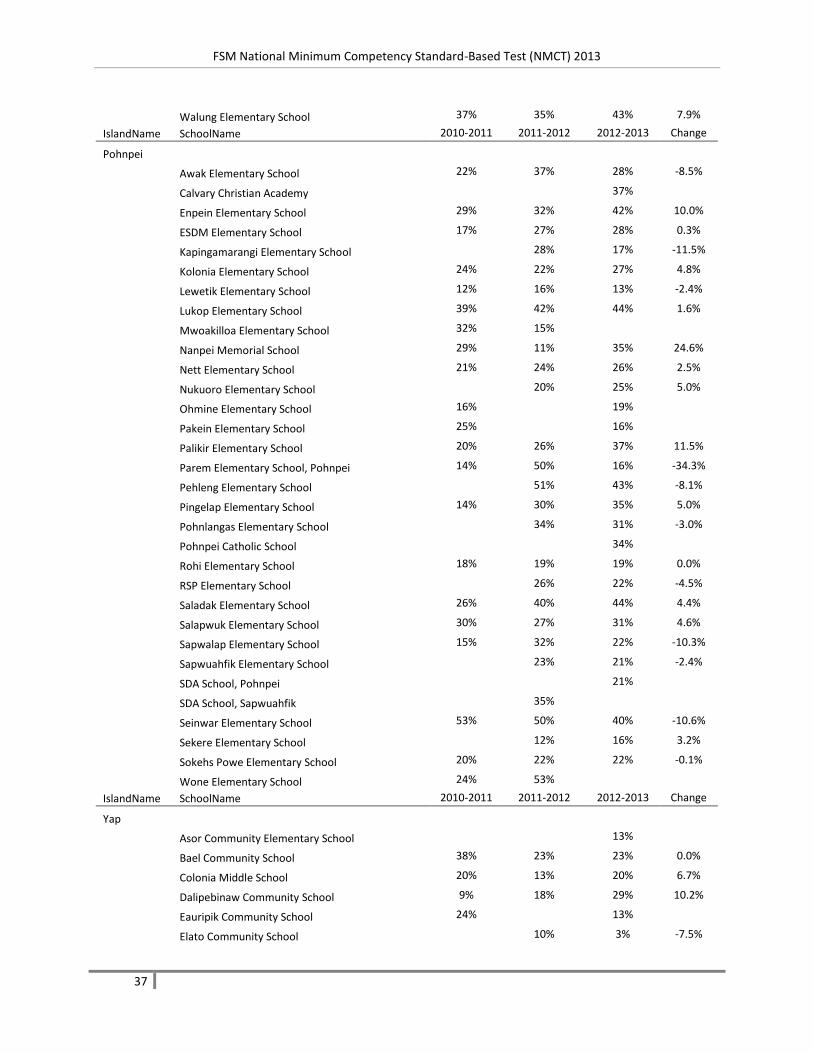
Walung Elementary School 37% 35% 43% 7.9%
IslandName SchoolName 2010-2011 2011-2012 2012-2013 Change
Pohnpei
Awak Elementary School 22% 37% 28% -8.5%
Calvary Christian Academy
37%
Enpein Elementary School 29% 32% 42% 10.0%
ESDM Elementary School 17% 27% 28% 0.3%
Kapingamarangi Elementary School
28% 17% -11.5%
Kolonia Elementary School 24% 22% 27% 4.8%
Lewetik Elementary School 12% 16% 13% -2.4%
Lukop Elementary School 39% 42% 44% 1.6%
Mwoakilloa Elementary School 32% 15%
Nanpei Memorial School 29% 11% 35% 24.6%
Nett Elementary School 21% 24% 26% 2.5%
Nukuoro Elementary School
20% 25% 5.0%
Ohmine Elementary School 16%
19%
Pakein Elementary School 25%
16%
Palikir Elementary School 20% 26% 37% 11.5%
Parem Elementary School, Pohnpei 14% 50% 16% -34.3%
Pehleng Elementary School
51% 43% -8.1%
Pingelap Elementary School 14% 30% 35% 5.0%
Pohnlangas Elementary School
34% 31% -3.0%
Pohnpei Catholic School
34%
Rohi Elementary School 18% 19% 19% 0.0%
RSP Elementary School
26% 22% -4.5%
Saladak Elementary School 26% 40% 44% 4.4%
Salapwuk Elementary School 30% 27% 31% 4.6%
Sapwalap Elementary School 15% 32% 22% -10.3%
Sapwuahfik Elementary School
23% 21% -2.4%
SDA School, Pohnpei
21%
SDA School, Sapwuahfik
35%
Seinwar Elementary School 53% 50% 40% -10.6%
Sekere Elementary School
12% 16% 3.2%
Sokehs Powe Elementary School 20% 22% 22% -0.1%
Wone Elementary School 24% 53%
IslandName SchoolName 2010-2011 2011-2012 2012-2013 Change
Yap
Asor Community Elementary School
13%
Bael Community School 38% 23% 23% 0.0%
Colonia Middle School 20% 13% 20% 6.7%
Dalipebinaw Community School 9% 18% 29% 10.2%
Eauripik Community School 24%
13%
Elato Community School
10% 3% -7.5%

FSM National Minimum Competency Standard-Based Test (NMCT) 2013
38
Fadraii Community School
14%
Fais Community School
9%
Falalis Community School
13%
Falalop Ulithi Elementary School
13%
Falalop Woleai Community School
12% 21% 9.4%
Fechailap Community School 28% 10% 0% -10.0%
Gagil Community School 20% 35% 19% -16.0%
Gilman Community School 20%
35%
Ifalik Community School 14% 11% 6% -5.0%
Kanifay Community School 23% 10% 27% 16.7%
Lamotrek Community School
15% 34% 19.3%
Maap Community School 8% 16% 18% 2.3%
Mogmog Community School
22% 15% -7.0%
North Fanif Community School 0% 17%
Piig Community School
15%
Rumuu Fanif Community School 33% 13% 15% 2.5%
Satawal Community School 15% 17% 14% -2.5%
SDA School, Yap 20% 22% 29% 6.9%
Seliap Community School
7% 5% -2.1%
St. Mary's School 15% 15% 18% 2.3%
Tamilang Community School 28% 41% 34% -7.1%
Tegailap Community School
20% 13% -7.5%

FSM National Minimum Competency Standard-Based Test (NMCT) 2013
39
M10 - NMCT Minimum Competency Math Grade 10
IslandName SchoolName 2010-2011 2011-2012 2012-2013 Change
Chuuk
Berea Christian High School
29%
Chuuk High School/Weno High School
8% 10% 1.8%
Faichuk High School
6% 58% 52.3%
Halls Jr. High School
11%
Lukeisel Jr. High School
3%
Mizpah Christian High School
18% 10% -8.3%
Moch High School
18% 20% 1.7%
Mortlock High School
30% 6% -24.2%
Nema Jr. High School
11%
Nomusofo Jr. High School
7% 22% 15.3%
Nomwinemo Jr. High School
4% 14% 9.3%
Pattiw Jr. High School
7% 0% -6.5%
Pentecostal Light House Acedamy
15% 6% -9.1%
Pollap/Tamatam Jr. High School
9% 9% 0.6%
PPO High School
5% 45% 39.8%
Sapore Elementary/Southern Namoneas High School
10% 9% -1.1%
Saramen Chuuk Academy
17% 31% 13.1%
SDA High School, Chuuk
14% 17% 3.0%
Southern Namoneas High School, Tonoas
11% 3% -8.5%
Weipat High School
7% 8% 1.4%
Weno High School
17%
IslandName SchoolName 2010-2011 2011-2012 2012-2013 Change
Kosrae
Kosrae High School 54% 44% 56% 11.2%
IslandName SchoolName 2010-2011 2011-2012 2012-2013 Change
Pohnpei
Calvary Christian Academy
62%
Madolenihmw High School 38%
24%
Nahnpei Memorial High School
38%
Ohwa Christian High School
3%
Our Lady Of Mercy Catholic High School
27%
Pohnpei Island Central School
21%
SDA High School, Pohnpei
12%
IslandName SchoolName 2010-2011 2011-2012 2012-2013 Change
Yap
NIHS High School
36%
OIHS High School
19% 19% 0.5%
SDA High School, Yap
41%
St. Mary's School 36%
Yap Catholic High School
55% 52% -3.0%
Yap High School 27% 25% 26% 1.2%

FSM National Minimum Competency Standard-Based Test (NMCT) 2013
40
R06 - NMCT Minimum Competency Reading Grade 6 IslandName SchoolName 2010-2011 2011-2012 2012-2013 Change
Chuuk
Amwachang Elementary School
9% 5% -4.1%
Berea Christian School 36% 15% 51% 35.7%
Central/West Wonip Elementary School 42% 11% 77% 65.2%
Chukuram/Winikka/Nethon Elementary School
6% 6% 0.4%
East Wonip Elementary School 36% 20% 75% 55.0%
Eot Elementary School 56% 3% 35% 32.1%
Epin Elementary School 23% 10% 25% 15.0%
Ettal Elementary School 8% 3% 25% 22.5%
Fananu Elementary School 7%
3%
Fanapanges Elementary School 42% 29% 40% 11.0%
Faro/Winifei Elementary School
14%
Fason Elementary School 14% 16%
Fonoton Elementary School 16% 58% 6% -51.8%
Foup Elementary School
26% 24% -2.5%
Houk Elementary School 11% 6% 20% 13.6%
Inaka Elementary School 30% 4% 24% 20.0%
Iras Demo School 40% 9% 17% 8.0%
Kuchu Elementary School 11% 7% 12% 5.1%
Kuchuwa Elementary School 38% 2% 7% 4.4%
Kukku Elementary School 6% 5% 10% 5.4%
Kuttu Elementary School 26% 6% 14% 8.4%
Lekinioch Elementary School 9% 5% 3% -1.4%
lnaka Elementary School
10%
Losap Elementary School 42% 4% 5% 1.3%
Manaio Elementary School
3% 8% 4.7%
Mechitiw Elementary School 13% 8% 29% 21.1%
Messa Elementary School 25% 13% 7% -5.6%
Moch Elementary School 37% 8% 13% 5.2%
Mokur Elementary School 8% 0%
Munien/Nechocho Elementary School 10% 11% 53% 42.7%
Murilo Elementary School 5%
5%
Mwan Elementary School 23% 6% 43% 37.6%
Namoluk Elementary School 27% 13% 18% 5.8%
Neauo Elementary School 25% 8% 31% 22.2%
Nechap Elem/Annex School 29% 3% 9% 5.2%
Nechocho Elementary School 20%
Nema Elementary School 43% 8% 15% 6.2%
Nomwin Elementary School 27%
16%
Nukaf/Sapota Paata Elementary School 40% 5%

FSM National Minimum Competency Standard-Based Test (NMCT) 2013
41
Nukuno Elementary School 6% 6% 14% 8.2%
Oneop Elementary School 13% 7% 19% 11.8%
Onou Elementary School 25% 6% 13% 7.3%
Onoun Elementary School 8% 6% 6% 0.4%
P&P Elementary School 3% 10% 6% -3.8%
Panitiw Elementary School 18% 6% 5% -0.9%
Parem Elementary School 16% 10% 5% -5.0%
Piherarh Elementary School 23% 3% 12% 9.5%
Piis Paneu Elementary School 2% 59% 54% -4.6%
Piisemwar Elementary School 35% 10% 27% 16.7%
Pollap Elementary School 9%
5%
Polowat Elementary School 10% 30% 11% -18.6%
Pwene Elementary School
11% 8% -3.3%
Romanum Elementary School 55% 8% 16% 8.1%
Ruo Elementary School 8%
8%
Sapore Elem/Southern Namoneas High School, Fefen
28% 15% 0% -15.5%
Sapota Paata Elementary School 32% 3% 17% 13.3%
Sapota Uman Elementary School 15% 1% 44% 42.9%
Sapou Elementary School 8% 2% 0% -2.0%
Sapuk Annex (Nukanap) School
Sapuk Elementary School 11% 9% 21% 11.9%
Satowan Elementary School 29% 16% 8% -8.0%
SDA School, Chuuk 39% 11% 43% 32.3%
Siis Elementary School 8% 13% 6% -6.5%
Sino Memorial Elementary School 14% 12% 29% 17.5%
St. Cecilia School 10% 7% 48% 40.3%
Ta Elementary School 6% 2% 8% 5.5%
Tamatam Elementary School 8% 10% 7% -2.9%
Teruo Bokuku Elem (Penieta) School 39% 30% 25% -5.0%
Udot Elem/Annex School 5% 3% 41% 38.6%
UFO Elementary School 29% 15% 26% 11.0%
Unanu Elementary School 10% 8% 8% -0.8%
West Fefen Elementary School 43% 5% 10% 4.7%
Wichukuno/Chukienu Elementary School 16% 13% 12% -0.5%
IslandName SchoolName 2010-2011 2011-2012 2012-2013 Change
Kosrae
Lelu Elementary School 34% 45% 40% -5.1%
Malem Elementary 51% 54% 51% -2.6%
Sansrik Elementary 52% 55% 58% 3.4%
SDA School, Kosrae 60% 70% 60% -10.0%
Tafunsak Elementary 55% 51% 55% 4.0%
Utwe Elementary 40% 36% 45% 8.6%
Walung Elementary 51% 51% 40% -11.4%

FSM National Minimum Competency Standard-Based Test (NMCT) 2013
42
IslandName SchoolName 2010-2011 2011-2012 2012-2013 Change
Pohnpei
Awak Elementary School 38% 24% 4% -20.6%
Calvary Christian Academy
78%
Enpein Elementary School 21% 34% 52% 18.4%
ESDM Elementary School 15% 21% 19% -1.7%
Kapingamarangi Elementary School
13% 15% 2.3%
Kolonia Elementary School 43% 33% 28% -5.9%
Lewetik Elementary School 10% 13% 9% -3.8%
Lukop Elementary School 14% 29% 5% -24.1%
Mwoakilloa Elementary School 40% 16% 20% 3.8%
Nanpei Memorial School 32% 27% 35% 7.6%
Nett Elementary School 28% 16% 29% 12.8%
Nukuoro Elementary School
19% 19% 0.2%
Ohmine Elementary School 28% 44% 23% -21.3%
Pakein Elementary School 30% 32% 5% -26.7%
Palikir Elementary School 18% 41% 19% -21.5%
Parem (Pohnpei) Elementary School 10% 14% 13% -1.5%
Pehleng Elementary School
39% 6% -33.1%
Pingelap Elementary School 7%
37%
Pohnlangas Elementary School 28% 29% 4% -24.1%
Pohnpei Catholic School
3%
Rohi Elementary School 24% 37% 4% -32.5%
RSP Elementary School 15% 15% 29% 14.2%
Saladak Elementary School 24% 42% 36% -6.2%
Salapwuk Elementary School 24% 44% 12% -31.9%
Sapwalap Elementary School 11% 66% 6% -59.5%
Sapwuahfik Elementary School
18% 16% -2.6%
SDA School, Pohnpei
4%
Seinwar Elementary School 74% 85% 4% -80.8%
Sekere Elementary School 28% 17% 18% 1.4%
Sokehs Powe Elementary School 44% 30% 6% -24.0%
Wone Elementary School 20% 15% 4% -11.6%
IslandName SchoolName 2010-2011 2011-2012 2012-2013 Change
Yap
Asor Community Elementary School
20% 25% 5.0%
Bael Community School 42% 28% 10% -17.5%
Colonia Middle School 37% 43% 35% -8.2%
Dalipebinaw Community School 34% 44% 57% 12.4%
Eauripik Community School 26%
33%
Elato Community School 23% 4% 3% -0.4%
Fadraii Community School
20% 43% 22.5%
Fais Community School
3% 7% 3.8%

FSM National Minimum Competency Standard-Based Test (NMCT) 2013
43
Falalis Community School
25% 40% 15.0%
Falalop Ulithi Elementary School
25% 31% 6.3%
Falalop Woleai Community School
21% 17% -3.8%
Faraulap Elementary
30%
Gagil Community School 19% 48% 48% 0.5%
Gilman Community School 46%
57%
Ifalik Community School 31% 19% 14% -4.8%
Kanifay Community School 20%
Lamotrek Community School
13% 25% 12.1%
Maap Community School 29% 32% 13% -18.7%
Mogmog Community School
25% 18% -7.5%
North Fanif Community School
43% 35% -8.3%
Piig Community School
12%
PUES-Fechailap
Rumuu Fanif Community School 23% 7% 10% 2.9%
Satawal Community School 10% 8% 22% 14.5%
SDA School, Yap 69% 62% 71% 8.9%
Seliap Community School
22% 10% -12.0%
St. Mary‘s School 60% 53% 48% -5.2%
Tamilang Community School
33% 36% 3.5%
Tegailap Community School
0% 13% 13.3%
Wottegai Community School
20% 20% 0.0%
FSM National Minimum Competency Standard-Based Test (NMCT) 2013
44
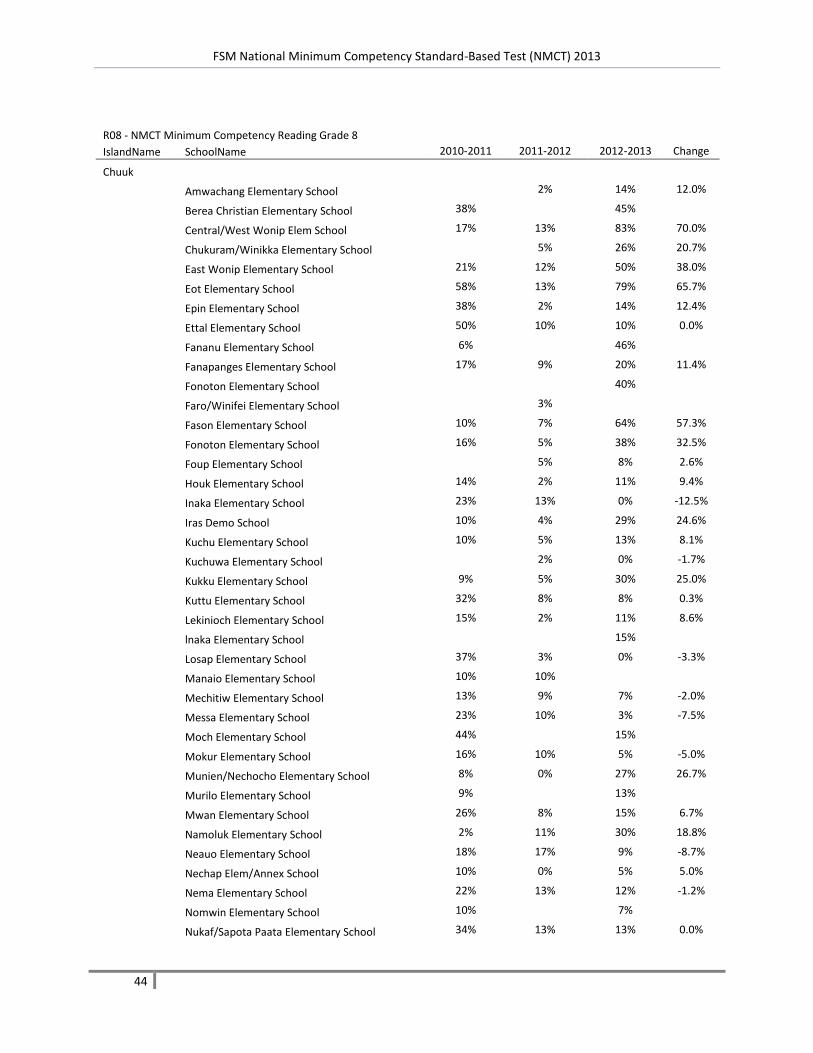
R08 - NMCT Minimum Competency Reading Grade 8 IslandName SchoolName 2010-2011 2011-2012 2012-2013 Change
Chuuk
Amwachang Elementary School
2% 14% 12.0%
Berea Christian Elementary School 38%
45%
Central/West Wonip Elem School 17% 13% 83% 70.0%
Chukuram/Winikka Elementary School
5% 26% 20.7%
East Wonip Elementary School 21% 12% 50% 38.0%
Eot Elementary School 58% 13% 79% 65.7%
Epin Elementary School 38% 2% 14% 12.4%
Ettal Elementary School 50% 10% 10% 0.0%
Fananu Elementary School 6%
46%
Fanapanges Elementary School 17% 9% 20% 11.4%
Fonoton Elementary School
40%
Faro/Winifei Elementary School
3%
Fason Elementary School 10% 7% 64% 57.3%
Fonoton Elementary School 16% 5% 38% 32.5%
Foup Elementary School
5% 8% 2.6%
Houk Elementary School 14% 2% 11% 9.4%
Inaka Elementary School 23% 13% 0% -12.5%
Iras Demo School 10% 4% 29% 24.6%
Kuchu Elementary School 10% 5% 13% 8.1%
Kuchuwa Elementary School
2% 0% -1.7%
Kukku Elementary School 9% 5% 30% 25.0%
Kuttu Elementary School 32% 8% 8% 0.3%
Lekinioch Elementary School 15% 2% 11% 8.6%
lnaka Elementary School
15%
Losap Elementary School 37% 3% 0% -3.3%
Manaio Elementary School 10% 10%
Mechitiw Elementary School 13% 9% 7% -2.0%
Messa Elementary School 23% 10% 3% -7.5%
Moch Elementary School 44%
15%
Mokur Elementary School 16% 10% 5% -5.0%
Munien/Nechocho Elementary School 8% 0% 27% 26.7%
Murilo Elementary School 9%
13%
Mwan Elementary School 26% 8% 15% 6.7%
Namoluk Elementary School 2% 11% 30% 18.8%
Neauo Elementary School 18% 17% 9% -8.7%
Nechap Elem/Annex School 10% 0% 5% 5.0%
Nema Elementary School 22% 13% 12% -1.2%
Nomwin Elementary School 10%
7%
Nukaf/Sapota Paata Elementary School 34% 13% 13% 0.0%
FSM National Minimum Competency Standard-Based Test (NMCT) 2013
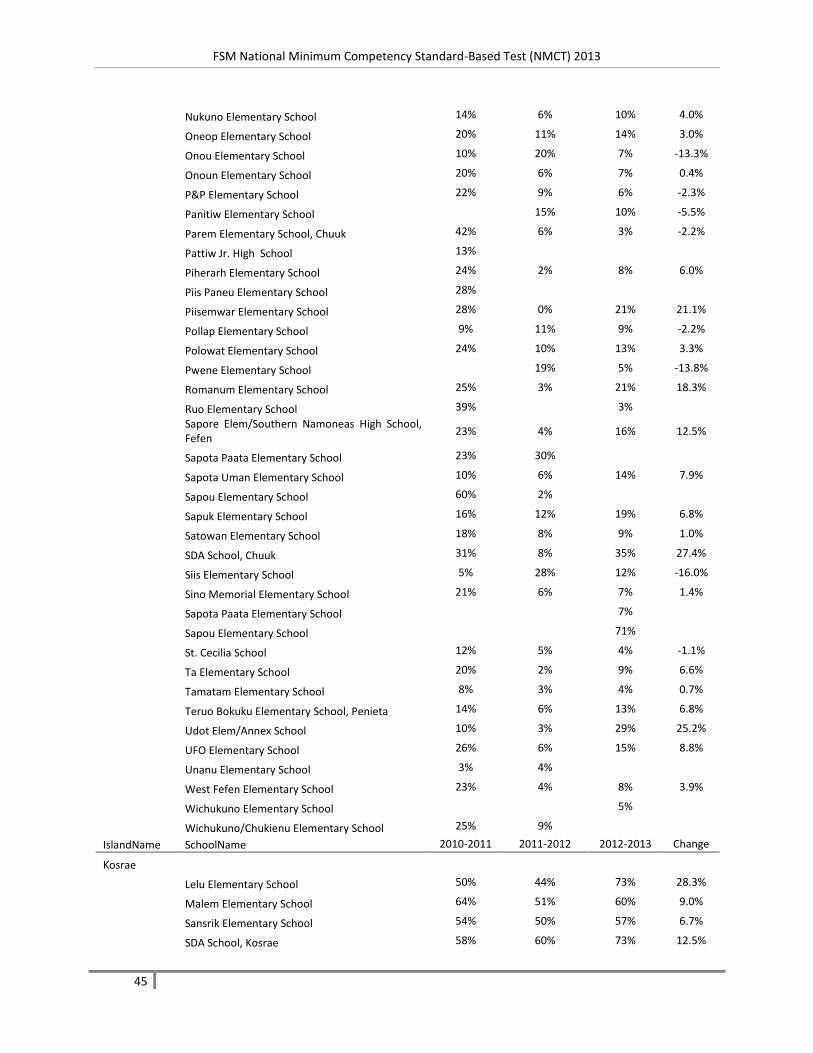
45
Nukuno Elementary School 14% 6% 10% 4.0%
Oneop Elementary School 20% 11% 14% 3.0%
Onou Elementary School 10% 20% 7% -13.3%
Onoun Elementary School 20% 6% 7% 0.4%
P&P Elementary School 22% 9% 6% -2.3%
Panitiw Elementary School
15% 10% -5.5%
Parem Elementary School, Chuuk 42% 6% 3% -2.2%
Pattiw Jr. High School 13%
Piherarh Elementary School 24% 2% 8% 6.0%
Piis Paneu Elementary School 28%
Piisemwar Elementary School 28% 0% 21% 21.1%
Pollap Elementary School 9% 11% 9% -2.2%
Polowat Elementary School 24% 10% 13% 3.3%
Pwene Elementary School
19% 5% -13.8%
Romanum Elementary School 25% 3% 21% 18.3%
Ruo Elementary School 39%
3%
Sapore Elem/Southern Namoneas High School, Fefen
23% 4% 16% 12.5%
Sapota Paata Elementary School 23% 30%
Sapota Uman Elementary School 10% 6% 14% 7.9%
Sapou Elementary School 60% 2%
Sapuk Elementary School 16% 12% 19% 6.8%
Satowan Elementary School 18% 8% 9% 1.0%
SDA School, Chuuk 31% 8% 35% 27.4%
Siis Elementary School 5% 28% 12% -16.0%
Sino Memorial Elementary School 21% 6% 7% 1.4%
Sapota Paata Elementary School
7%
Sapou Elementary School
71%
St. Cecilia School 12% 5% 4% -1.1%
Ta Elementary School 20% 2% 9% 6.6%
Tamatam Elementary School 8% 3% 4% 0.7%
Teruo Bokuku Elementary School, Penieta 14% 6% 13% 6.8%
Udot Elem/Annex School 10% 3% 29% 25.2%
UFO Elementary School 26% 6% 15% 8.8%
Unanu Elementary School 3% 4%
West Fefen Elementary School 23% 4% 8% 3.9%
Wichukuno Elementary School
5%
Wichukuno/Chukienu Elementary School 25% 9%
IslandName SchoolName 2010-2011 2011-2012 2012-2013 Change
Kosrae
Lelu Elementary School 50% 44% 73% 28.3%
Malem Elementary School 64% 51% 60% 9.0%
Sansrik Elementary School 54% 50% 57% 6.7%
SDA School, Kosrae 58% 60% 73% 12.5%
FSM National Minimum Competency Standard-Based Test (NMCT) 2013
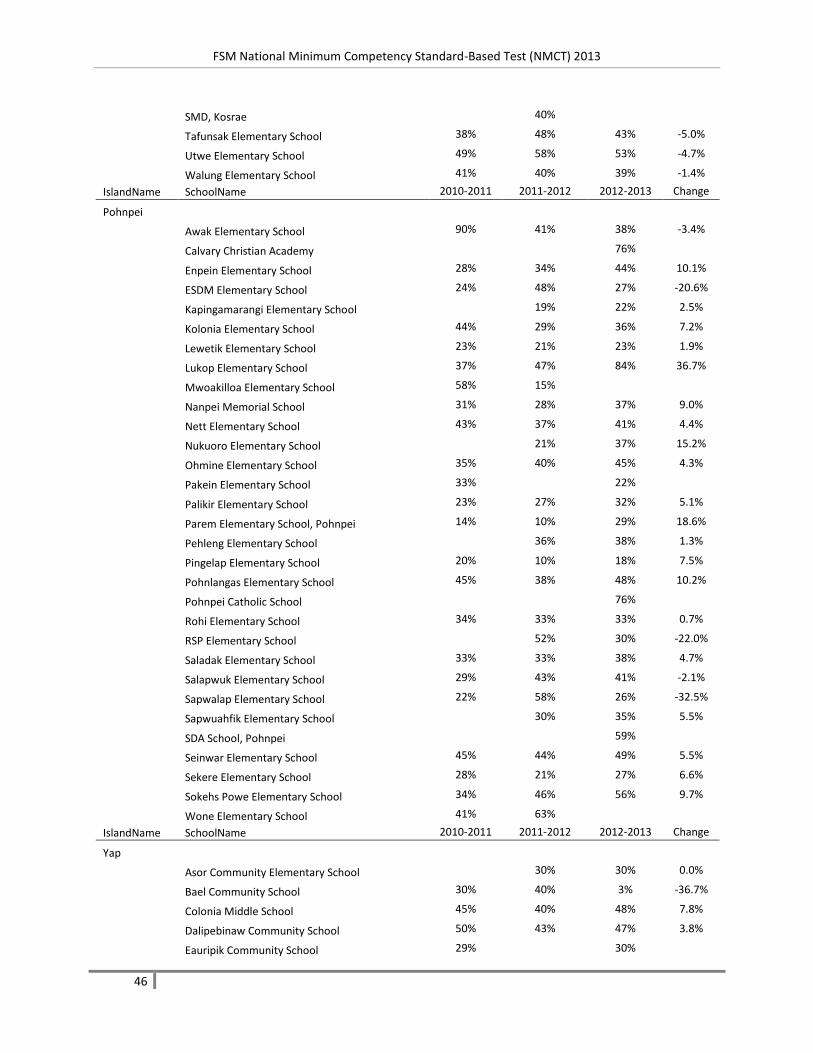
46
SMD, Kosrae
40%
Tafunsak Elementary School 38% 48% 43% -5.0%
Utwe Elementary School 49% 58% 53% -4.7%
Walung Elementary School 41% 40% 39% -1.4%
IslandName SchoolName 2010-2011 2011-2012 2012-2013 Change
Pohnpei
Awak Elementary School 90% 41% 38% -3.4%
Calvary Christian Academy
76%
Enpein Elementary School 28% 34% 44% 10.1%
ESDM Elementary School 24% 48% 27% -20.6%
Kapingamarangi Elementary School
19% 22% 2.5%
Kolonia Elementary School 44% 29% 36% 7.2%
Lewetik Elementary School 23% 21% 23% 1.9%
Lukop Elementary School 37% 47% 84% 36.7%
Mwoakilloa Elementary School 58% 15%
Nanpei Memorial School 31% 28% 37% 9.0%
Nett Elementary School 43% 37% 41% 4.4%
Nukuoro Elementary School
21% 37% 15.2%
Ohmine Elementary School 35% 40% 45% 4.3%
Pakein Elementary School 33%
22%
Palikir Elementary School 23% 27% 32% 5.1%
Parem Elementary School, Pohnpei 14% 10% 29% 18.6%
Pehleng Elementary School
36% 38% 1.3%
Pingelap Elementary School 20% 10% 18% 7.5%
Pohnlangas Elementary School 45% 38% 48% 10.2%
Pohnpei Catholic School
76%
Rohi Elementary School 34% 33% 33% 0.7%
RSP Elementary School
52% 30% -22.0%
Saladak Elementary School 33% 33% 38% 4.7%
Salapwuk Elementary School 29% 43% 41% -2.1%
Sapwalap Elementary School 22% 58% 26% -32.5%
Sapwuahfik Elementary School
30% 35% 5.5%
SDA School, Pohnpei
59%
Seinwar Elementary School 45% 44% 49% 5.5%
Sekere Elementary School 28% 21% 27% 6.6%
Sokehs Powe Elementary School 34% 46% 56% 9.7%
Wone Elementary School 41% 63%
IslandName SchoolName 2010-2011 2011-2012 2012-2013 Change
Yap
Asor Community Elementary School
30% 30% 0.0%
Bael Community School 30% 40% 3% -36.7%
Colonia Middle School 45% 40% 48% 7.8%
Dalipebinaw Community School 50% 43% 47% 3.8%
Eauripik Community School 29%
30%

FSM National Minimum Competency Standard-Based Test (NMCT) 2013
47
Elato Community School
20% 25% 5.0%
Fadraii Community School
22%
Fais Community School
25%
Falalis Community School
25% 23% -1.7%
Falalop Ulithi Elementary School
16%
Falalop Woleai Community School
19% 26% 7.1%
Fechailap Community School 54% 70% 10% -60.0%
Gagil Community School 40% 41% 33% -8.4%
Gilman Community School 24% 70% 50% -20.0%
Ifalik Community School 41% 12% 28% 15.7%
Kanifay Community School 46% 23% 23% 0.0%
Lamotrek Community School
26% 26% -0.7%
Maap Community School 22% 46% 39% -6.7%
Mogmog Community School
36% 34% -2.3%
North Fanif Community School 15% 61%
Piig Community School
15% 0% -15.0%
Rumuu Fanif Community School 38% 23% 25% 2.5%
Satawal Community School 28% 22% 27% 5.1%
SDA School, Yap 61% 65% 58% -8.0%
Seliap Community School
16% 25% 9.3%
St. Mary's School 62% 73% 75% 2.6%
Tamilang Community School 38% 36% 45% 9.3%
Tegailap Community School
25% 15% -10.0%
Wottegai Community School
10%
FSM National Minimum Competency Standard-Based Test (NMCT) 2013
48
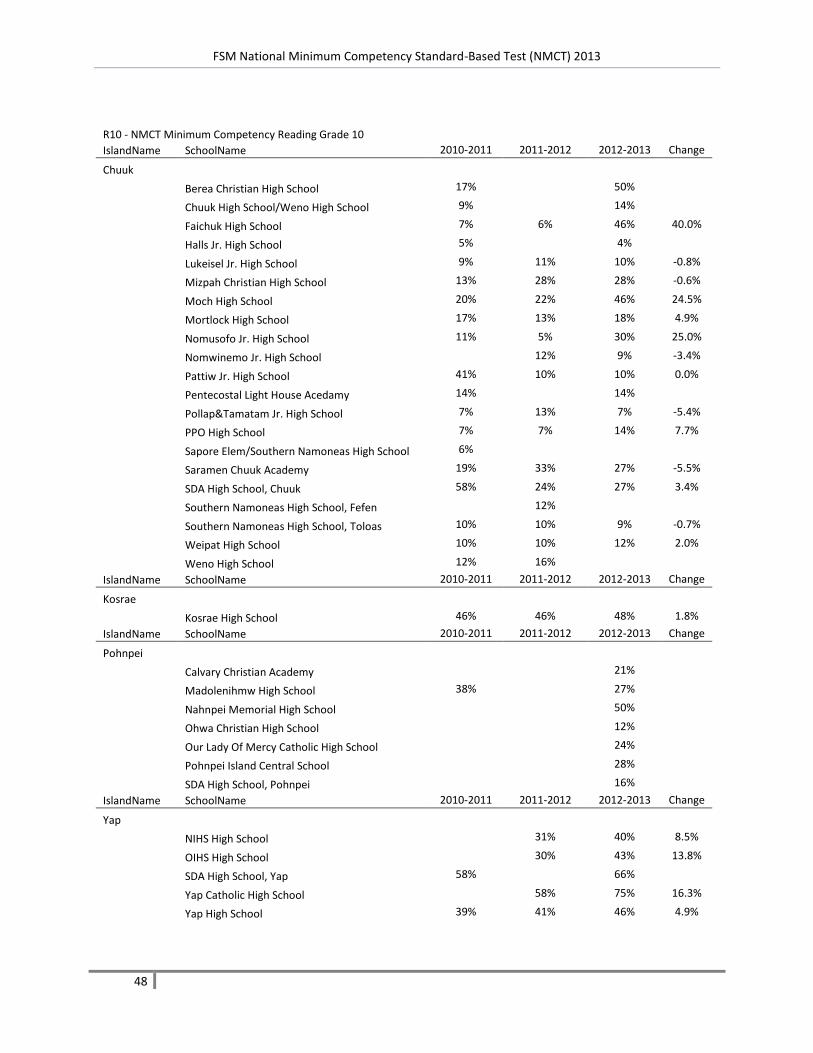
R10 - NMCT Minimum Competency Reading Grade 10 IslandName SchoolName 2010-2011 2011-2012 2012-2013 Change
Chuuk
Berea Christian High School 17%
50%
Chuuk High School/Weno High School 9%
14%
Faichuk High School 7% 6% 46% 40.0%
Halls Jr. High School 5%
4%
Lukeisel Jr. High School 9% 11% 10% -0.8%
Mizpah Christian High School 13% 28% 28% -0.6%
Moch High School 20% 22% 46% 24.5%
Mortlock High School 17% 13% 18% 4.9%
Nomusofo Jr. High School 11% 5% 30% 25.0%
Nomwinemo Jr. High School
12% 9% -3.4%
Pattiw Jr. High School 41% 10% 10% 0.0%
Pentecostal Light House Acedamy 14%
14%
Pollap&Tamatam Jr. High School 7% 13% 7% -5.4%
PPO High School 7% 7% 14% 7.7%
Sapore Elem/Southern Namoneas High School 6%
Saramen Chuuk Academy 19% 33% 27% -5.5%
SDA High School, Chuuk 58% 24% 27% 3.4%
Southern Namoneas High School, Fefen
12%
Southern Namoneas High School, Toloas 10% 10% 9% -0.7%
Weipat High School 10% 10% 12% 2.0%
Weno High School 12% 16%
IslandName SchoolName 2010-2011 2011-2012 2012-2013 Change
Kosrae
Kosrae High School 46% 46% 48% 1.8%
IslandName SchoolName 2010-2011 2011-2012 2012-2013 Change
Pohnpei
Calvary Christian Academy
21%
Madolenihmw High School 38%
27%
Nahnpei Memorial High School
50%
Ohwa Christian High School
12%
Our Lady Of Mercy Catholic High School
24%
Pohnpei Island Central School
28%
SDA High School, Pohnpei
16%
IslandName SchoolName 2010-2011 2011-2012 2012-2013 Change
Yap
NIHS High School
31% 40% 8.5%
OIHS High School
30% 43% 13.8%
SDA High School, Yap 58%
66%
Yap Catholic High School
58% 75% 16.3%
Yap High School 39% 41% 46% 4.9%