ft iop i3 i - apps.dtic.mil · ru-tr-172-mae-f afo"brts' 8 -j 13 ;jt:4 name of performing...
TRANSCRIPT
IOp ft IF6 IX I3 i
Department of Mechanical and Aerospace Engineering00Rutgers - The State University of New Jerseylog New Brunswick, NJ 08903
C)4
Report RU-TR-172-MAE-F
Theoretical Investigation of3-D Shock Wave-Turbulent Boundary Layer Interactions
Part VII
Doyle D. Knight
Interim Report for Period 1 October 1987 to 30 September 1988Approved for Public Release - Distribution Unlimited
Air Force Office of Scientific ResearchBuilding 410Bolling AFB
Washington, DC 20332 D T ICELECTE
November 1988 S FEB 1 9qH Cf
UTMI T YON STATEMF2NT A
Approved for public relas; 917
=, mted I

SE(ktTY riCLASSIF ICA TION OP TMO '"AL,
REPORT, DOCUMENTATION PAGEia REPORET SECURITY CLASSIFICATION it) RESTRICTIVE MARXINGS
,a. SECURITY CLASSIFICATION AUTHORITY 3 DISTRIBUTION I AVAILABILITY OF REPORT
2b OECLASSIFICATION/OOWNGRADING SCHEDULE Approved for Public ReleaseDistribution Unlimited
4 PERFORMING ORGANIZATION REPORT NUMBER(S 5 MON~ITQRINC, ORGANIZATION REPORT NUMBER(S)-
RU-TR-172-MAE-F AFO"bRTS' 8 - J 13 ;Jt
:4 NAME OF PERFORMING ORGANIZATION 6b OFFICE SYMBOL 7a NAME OlF MONITORING ORGANIZATION
Dept. Mech. Aero. Eng. Ifa~litible) Air Force Office of ScientificRutgers University ResearchADDRESS (City. State. and ZIP Code) 7b ADDRESS (City, State. arid ZIP Code)
P.O. Box 909, MAE Building 410
Piscataway, NJ 08855-0909 Bolling AFB____________________________ Washington, DC_20332
*NAME OF FUNDING!'SPONSORING Rh OFFICE SYMBOL 9 PROCUREMENT INSTRUMENT IDENTIFICATION NUMB8ERORGANIZATION (if applicable)
Air Force Of f. Scien. Re AFOSR/NA AFOSR-86-0266*ADDRESS (City State. and ZIP Code) 10 SOURCE OF FUNDING NUMBERS
Building 410, Bolling AFB PROGRAM PROJECT T
ASK WORK UNITMell N.NO ACCESSION NO.
Washington, DC 20332 EL0 5 ~ N 71 TITLE (include Security Classication)
Theoretical Investigation of 3-D Shock-Wave-Turbulent Boundary LayerInteractions -- Part VII
,PERSONAL AUTHOR(S)
Doyle Knight13a TYPE OF REPO T 1Wb TIME COVERED (71.DT FRPR Year.F.MonthOsy) TS. PAGECOUN
1161 FROM TO , 14 AEOFRPR
11, UPPLEMFNTARY 'NOTATION
17 COSATI CODES 1I1. t1JECT TERMS (Continue on reverse I I n ces-ap and Identify by blocir numvber)FIE D . GROUP SUB-GROUP -IHigh speed flows; viscous,inviscid interactions)
a20. Boundary layer interactions; computational fluiddynamics; Navier rStokes ecuations; turbulence. AAt;Z~l
19 AB T N F (Continue on revei e if nlece sa y and den tif by block num be r)j0This research describes continuing efforts in the analysis of 3-D shock waveiturbulent boundary layer interations.
A significant research activity in 3-D hypezsoinic shock turbulent interactions is initiated to further develop andvalidate the theoretical model. The quasiconical free interaction principle is examined by simulation of two geometries- 17.5 deg sharp fin and (30,60) swept compression corner (Mach 3) - selected to obtain similar shock strengths. Thecomparison with experimental data is good. It is confirmed that the differences caused by the particular geometryof the model appear only behind the inviscid shock wave. Continuing research on 3-D turbulent interaction controlis focused on the effect of bleed and the simulation of flows past the double-fin configuration. The effect of suctionis examined on a strong (ft angle=20 deg, Mach 3) and a weak interaction (8 deg, Mach 3). The overall effect ofbleed is remarkably modest. Two double-fin configurations (4yx 4rand St'x 84", Mach 3) are simulated. A studyof the computed flowfleld indicates that the first is a weak interaction. In contrast, the 8 x 8 configuration displaysan interesting separated Iowfield. An analysis of viscous and inviscid effects in a sharp fin and a swept corner flowindicates that the physics of both geometries are governed primarily by inviscid (pressure) effects. Viscous effectsare of lower magnitude but are not restricted to the sublayer region.
20r OiSTRIBUTIONiAVAILASILITY Of ABSTRACT 121 ABSTRACT SECURITY CLASSIFICATION.MUNCLASSIFIEOINLIMITE0 0 SAME AS RPT CO TIC USERS I tncla-g-gi fi,-d
224. NAME OF RESPONSIBLE INDOIVIDUAL 2?b TELEPHONE (InclUde Area Coe 2c OFFICE SYMBOLt-&-YJ 5f0K.EL-L >0)4 71o741 S- ;7 IVA-
0O FORM 1473. 84 MAR 83 APR eaaton mnay be usqq untoi exitausted SECURITY CLASSIFICATION OF THIS PAGE
All tmorediionsare o~oUnclassified

U Preface
IThis report presents the research accomplishments for FY881 (1 October 1987 to 30 Septem-ber 1988) of the investigation entitled "Theoretical Investigation of Three-Dimensional Shock-Wave Turbulent Boundary Layer Interactions".
The research has benefited from the assistance of several individuals, including Drs. JamesWilson, Jim McMichael and Len Sakell (Air Force Office of Scientific Research) and Dr.C.Horstman (NASA Ames Research Center). The interactions with S. Bogdonoff, D.Dolling,A. Ketchum and G. Settles are acknowledged.
I!.
ri
r .
U Uj.0
L. C) ,
3 'Fiscal Years (FY) refer to the Federal fiscal year
2
I

Contents
I Objectives 4I-1 Develop and Validate Theoretical Model(s) for 3-D Shock Wave-Turbulent
Boundary Layer Interaction ................................. 41-2 Determine the Physical Structure of 3-D Turbulent Interactions for Selected
Geometries ........ ..................................... 41-3 Investigate Methods of Control and Modification of 3-D Turbulent Interactions 51 1-4 Examination of Inviscid and Viscous Effects in 3-D Turbulent Interactions 5
I1 Research Accomplishments for FY88 a11-1 Research Task No. 1: Develop and Validate Theoretical Models for the 3-D
Shock Wave-Turbulent Boundary Layer Interactions .................. 611-2 Research Task No. 2: Determination of Physical Structure of 3-D Turbulent
Interactions for Specific Geometries ...... ....................... 711-2.1 Results for the 17.5 deg Fin........................811-2.2 Results for the (30,60) Swept Compression Corner .............. 811-2.3 Comments on Quasiconical Similarity ..... .................. 9
11-3 Research Task No. 3: Investigate Methods of Control and Modification of 3-DTurbulent Interactions ....... ............................... 1011-3.1 Effect of Bleed ... ............................... 103 11-3.2 Double shock interactions ......................... 12
11-4 Research Task No. 4: Examination of inviscid and viscous effects in 3-Dturbulent interactions ....... ............................... 12
IIIResearch Program for FY89 (1 October 1988 - 30 September 1989) 1411I-1 Research Task No. 1: Develop and Validate Theoretical Models for 3-D Shock
n Wave-Turbulent Boundary Layer Interactions ....................... 1411-2 Research Task No. 3: Investigate Methods for Control and Modification of
3-D Turbulent Interactions ....... ............................ 14111-3 Research Task No. 4: Examination of Inviscid and Viscous Effects in 3-D
Turbulent Interactions ....... ............................... 15
IV Publications and Scientific Interactions 16IV-1 Written Publications - Cumulative Chronological List ................ 16
V List of Personnel and Degrees Awarded 18V-1 Personnel: 1 October 1987 - 30 September 1988 ..................... 18V-2 Degrees Awarded: 1 October 1987 - 30 September 1988 ................ 18
VI References___ ____ 1I Acoesslon For 1
VIIPapers NTIS GRA&I 38DTV'C TA1 El
J"'., . . , . .. ,)
'V," copy
K.. .... fCT-
C'','' . c JI a l "
I Objectives
The research program for FY88 is characterized by two major themes, namely, i) the contin-uation of the research effort in supersonic shock wave-turbulent boundary layer interaction,and ii) the initiation of a significant research activity in 3-D hypersonic shock wave-turbulentboundary layer interaction. The basic four objectives, outlined in the original proposal [1]and described below are pertinent for both supersonic as well a hypersonic research activity.
I-1 Develop and Validate Theoretical Model(s) for 3-D Shock Wave-Turbulent Boundary Layer Interaction
One of the fundamental steps in the understanding of complex 3-D shock wave-turbulentboundary layer interactions involves the development and validation of accurate theoret-ical models. Numerical effort has progressed from the simplified calculations of the pre-supercomputer years [2,31 to the current complex simulation requiring significantly moreI computer resources. The Reynolds-averaged full three-dimensional compressible Navier-Stokes equations [4] are typically utilized with turbulence incorporated through a modelsuch as the two-equation Jones-Launder [5] or the algebraic Baldwin-Lomax [6] model Thiscomplexity is necessary to adequately resolve the several fluid dynamic effects that play crit-ical roles in 3-D turbulent interactions including boundary layers, shock waves, turbuk~nceand viscos-inviscid interactions. Recently published results utilizing the above two eddyviscosity models have shown overall good agreement with experimental observations on sim-plified 3-D geometries such as the sharp fin [7] and the swept compression corner [8,9]. Thisvalidation, achieved by comparison with experimental observations, is a continuous elementof the research.
The success of the theoretical approach has led to the inception of a new activity, thatof modeling three-dimensional hypersonic shock wave-turbulent boundary layer interaction3 ('3-D hypersonic turbulent interactions') in FY88. This represents an extension of previousactivity which was focused on supersonic flows.
1-2 Determine the Physical Structure of 3-D Turbulent Interactions for
Selected Geometries
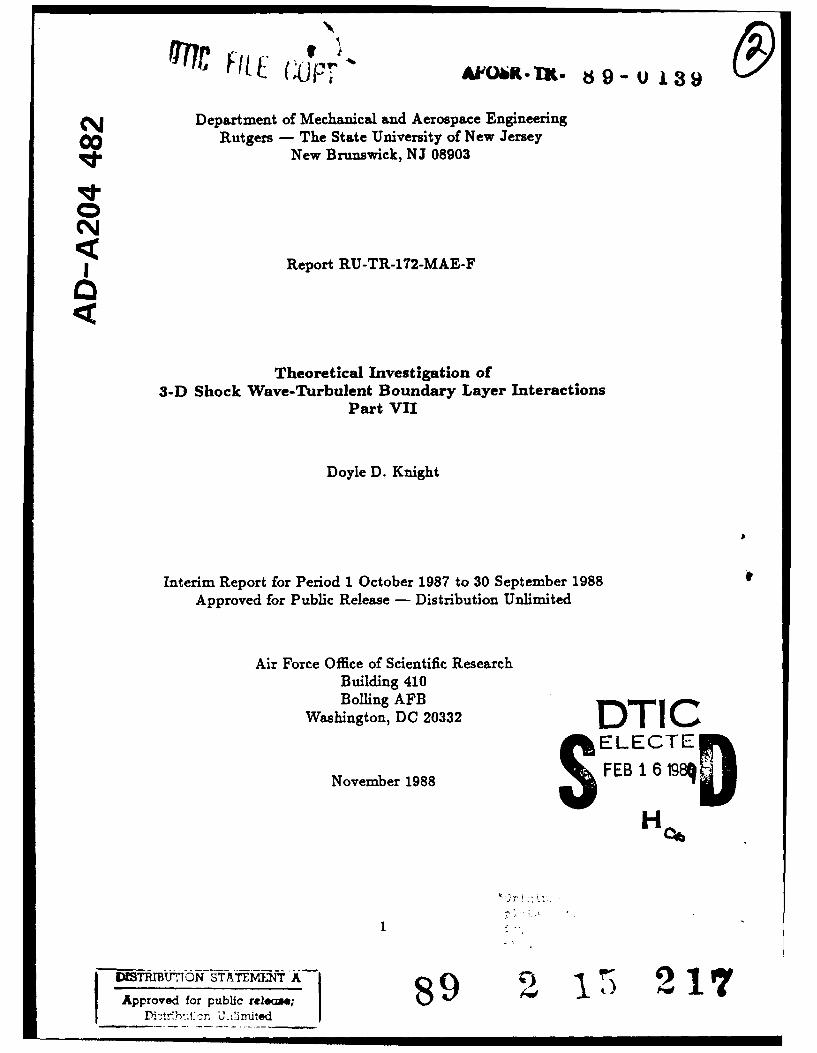
Closely related to the task of developing and validating the theoretical model is that ofdetermining the structure of such flow fields. Over the past several years, significant progresshas been achieved in obtaining an overall picture of the flowfield for the sharp fin and theswept corner. The author has collaborated with C.C. Horstman (NASA Ames Research),B.Shapey and S.Bogdonoff (Princeton University) in this endeavor. Based on the analysisof flows past the sharp fin [7] and the swept corner [9], the overall flowfield is observed tobe inviscid and rotational over a major portion of the interaction domain except within anarrow region adjacent to the surface where the effects of turbulent mixing are significant.For both configurations (Figs. 1 and 2), the principal flow feature is a large vortical structurealigned with the corner in agreement with the flowfield models of Token [10 and Kubota andStollery [11). A three-dimensional surface of separation (Fig. 1) emanates from the line ofcoalescence (separation), and spirals into the vortical center. A second surface, emanating
4
U

I from upstream, intersects the plate at the line of divergence (attachment), and defines theextent of the fluid entrained into the vortical structure.3 For the current year, the primary goals are (Section H-2):
" To reaffirm the validity of the theoretical model consisting of the Reynolds-averagedthree-dimensional Navier-Stokes equation in mass averaged variables in conjunctionwith the algebraic turbulence model of Baldwin and Lomax. This aspect is closelylinked to Research Task No. 1 above.
3 * To provide three-dimensional flow visualization to explore the interaction flow structure.
" To examine numerically the validity of the quasiconical free interaction principle.
1-3 Investigate Methods of Control and Modification of 3-D TurbulentInteractions
i The understanding of the flowfield structure of 3-D turbulent interactions provides the oppor-tunity for investigation of methods for control and modification of the interaction flowfields.Specifically, large vortical structures such as those displayed in Figs. 1 and 2 are clearlyundesirable in typical applications such as inlets where 3-D turbulent interactions are com-mon. Improvements in the control of such interactions may lead, for example, to improvedaircraft performance. Continuing research efforts (Section 11-3) focus on bleed (suction) andgeneration of opposing vorticity by mounting another symmetric fin on the plate (Fig. 3).
1-4 Examination of Inviscid and Viscous Effects in 3-D Turbulent Inter-actions
Computed results have indicated that the flow structure for the sharp fin and the swept cornerare not only remarkably similar but also that the calculated flowfieldS are relatively insensitiveto the turbulence model employed. This conclusion is derived from the fact that two differentmodels successfully predicted overall flow features even though eddy viscosity values fromthe two models differed significantly in the major portion of the boundary layer outside ofthe viscous sublayer region. The fourth research task is therefore to analyse viscous-inviscideffects in such interactions to further enhance understanding of the inherent physics.
5U
SIIResearch Accomplishments for FY88
The research program follows the basic tasks outlined in the original proposal submitted toDr. James Wilson on 4 April 1986. Four specific research tasks were outlined for FY88 [12],namely, 1) Development and validation of theoretical models for 3-D shock wave-turbulentboundary layer interactions, 2) Determination of physical s,ucture of 3-D turbulent interac-tions for specific geometries, 3) Investigation of methods for control and modification of 3-Dturbulent interactions and 4) Examination of inviscid and viscous effects in 3-D turbulentinteractions.
The overall research program is closely coordinated with the computational research ofDr. C.C. Horstman (NASA Ames Research Center) and the experimental research of Prof.S. Bogdonoff (Princeton University). Drs. Knight, Horstman and Prof. Bogdonoff meetfrequently to select specific 3-D shock wave-turbulent boundary layer interactions for detailedstudy. Separate, independent computations are then performed for the configuration byDrs. Knight and Horstman, and the calculated flowfields are relatively compared with theexperimental measurements of Prof. Bogdonoff. This close collaboration between theory andexperiment is a critical element of the success of the program.
For the purposes of the following discussion, it is useful to note the general orientation ofthe physical (z, y, z) axes:
Streamwise direction: z
3 Ito plate:y
Spanwise direction: z
11-1 Research Task No. 1: Develop and Validate Theoretical Models forthe 3-D Shock Wave-Turbulent Boundary Layer Interactions
A new activity in modeling three dimensional hypersonic shock wave-turbulent boundarylayer interaction ('3-D hypersonic turbulent interactions') is initiated during FY88. Thisrepresents an extension of previous activity which was focused on supersonic flows. A princi-pal objective of this research is the determination of the sensitivity of the computed flowfieldsin 3-D hypersonic turbulent interactions to the turbulence model employed. Recent exper-imental and theoretical results at Mach 3 have shown that simple turbulence models (i.e.,zero equation and two equation eddy viscosity models) are capable of accurate simulationof a variety of 3-D turbulent interactions [7,8,91, while failing to accurately reproduce thelimiting 2-D turbulent interaction [13]. The success in analysing flows past the sharp finand the swept corner is generally attributed to the nature of the interaction. Specifically,the flowfields investigated are observed to be essentially inviscid and rotational, except in asmall fraction of the turbulent boundary layer adjacent to the surface where the effects ofturbulence are significant. The absence of reverse flow may also be a factor [14).
A combined experimental and computational research project has been initiated with Dr.C.C. Horstman (NASA Ames Research Center) to examine the 3-D hypersonic turbulent in-teraction generated by a sharp fin. The selection of this configuration is motivated by severalfactors. First, through the recent collaborative experimental and theoretical effort involvingthe principal investigator, NASA Ames Research Center and Princeton Gas Dynamics Lab-3 oratory [9] a detailed understanding of the flowfield structure of the 3-D sharp fin turbulent
6
I
interaction at Mach 3 has evolved. Second, a series of 3-D sharp fin experiments are plannedat hypersonic speeds (Mach 7 and 10) at NASA Ames Research Center in FY892. Effortsto date have focused on the determination of the grid for the calculations. The activity forFY89 is discussed in Section III.
U1-2 Research Task No. 2: Determination of Physical Structure of 3-DTurbulent Interactions for Specific Geometries
As mentioned earlier, the current understanding of the flowfield for both the sharp fin andthe swept corner is that it is inviscid and rotational over a majority of the interaction domain,except within a narrow region adjacent to the surface where the effects of turbulent mixingare significant, and dominated by a single vortical structure.
Kimmel [15] performed a series of experiments to investigate the effect of the shockgenerating geometry on the interaction. Three configurations were selected, namely, thesharp fin, swept compression corner and the semicone. The geometrical characteristics wereselected to obtain similar shock strengths. Specifically, the sharp fin angle a = 17.5 deg,the angle of compression and sweep for the swept corner a = 30 deg and A = 60deg, andthe semicon half angle -f = 20 deg generate equal strength shocks in the free stream. Eachconfiguration was examined at Reynolds numbers of 1.6 x 10⁵ and 9.1 x 10⁵ . For the lowerReynolds number, detailed surface pressure and kerosene-lampblack flow visualization wasperformed. At the higher Reynolds number, experimental data include both surface pressure3and kerosene-lampblack flow visualization, and boundary layer profiles of pitot pressure,static pressure and yaw angle.
The three configurations exhibited conical similarity, with the flow surface and flowfieldvariables exhibiting two distinct regions. The first region, extending from upstream to apoint downstream of the shock system, displayed a 'quasi-conical free interaction'. In thisregion, for example, the experimental pressure distribution, displayed along a line normal tothe inviscid shock, was virtually identical for the three configurations despite their significantgeometrical differences. A second region, downstream of the first region and denoted the'model dominated region', showed no similarity of profiles.
The explanation for the quasi-conical free interaction is not clear. It is anticipated that allthree flowfields display a large vortical structure. The sharp fin at a = 17.5 deg is intermediateto a series of computed flows (a = 10 and 20 deg) which have displayed a large vorticalstructure [7]. The swept compression corer at (a, A) = (30,60) deg is close to the previouscomputation of Knight et al [81 at (a, A) = (24,60). The semicone, however, has not beencomputed previously. It is unclear, however, why this vortical structure should yield nearlyidentical pressure distributions in the quasi-conical free interaction region.
To achieve the primary objectives of this task, both the 17.5 deg sharp fin and the (30,60)swept corner have been computed in FY88. The results are briefly described below. Further5 details may be found in [16].
2 Hotrman, Private communication
I
I

I
11-2.1 Results for the 17.5 deg Fin
The results are first compared with experiment. Boundary layer survey data is available atsixteen (16) locations exhibited in Fig. 4. The computed and experimental surface pressureare displayed in Fig. 5 at z. = 9.66.. with z. denoting the distance from the model apexalong the inviscid shock trace. Overall features of the measured aistribution are predictedby the computation. Upstream influence (determined by initial pressure rise) is underpre-dicted in the computation. The plateau region, observed by several previous investigators,between separation and attachment is adequately reproduced by the computation though the3 flatness of the plateau region is not well resolved. The computed and experimental pressurerise after the shock wave and the downstream pressure level differ by less than 7%. Theshallower computed pressure gradient is assumed largely due to inadequate grid resolution inthe interaction region.
Typical results of the experimental and computational boundary layer profiles of pitotpressure, yaw angle and static pressure at station 12 are shown in Fig. 6. Good agreement5 is observed in the boundary layer for pitot pressure, yaw angle and static pressure. Thecomputed pitot pressure does not resolve the small overshoot associated with the compressionfan outside the boundary layer. The computed static pressure continues to increase towardthe inviscid region while the measured data slightly decreases.
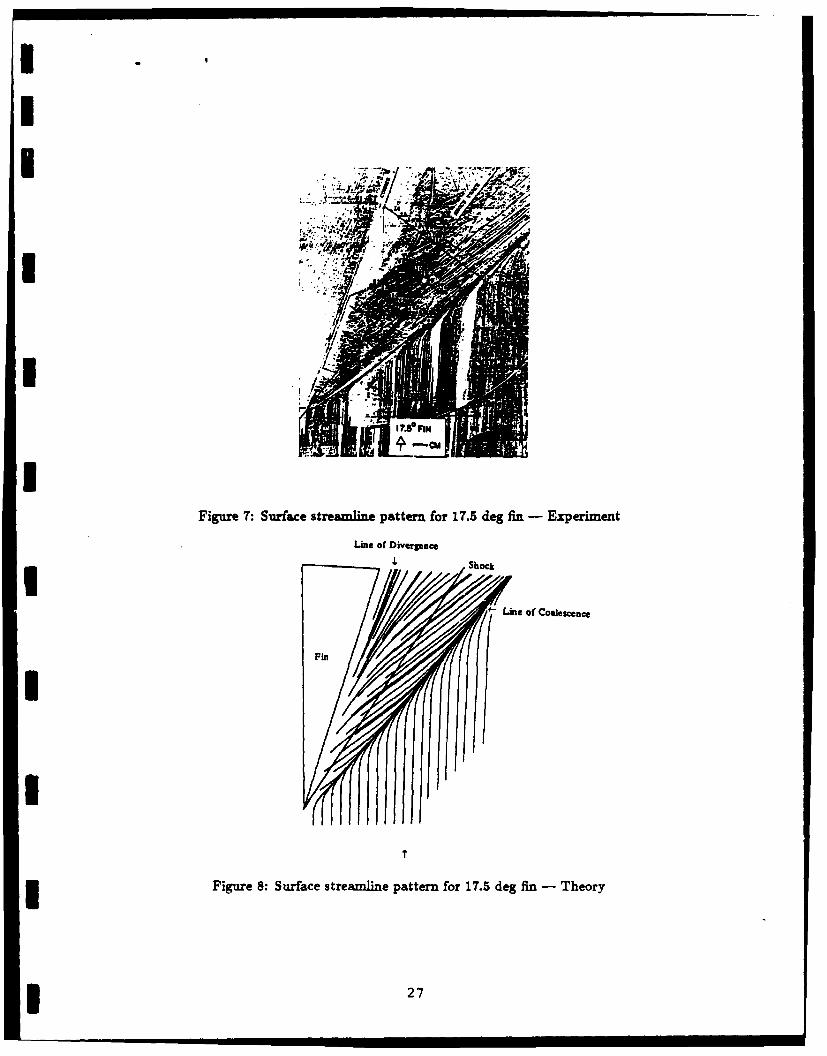
The measured surface streamline patterns for the 17.5 deg fin are displayed in Fig. 7.The computed result is shown in Fig. 8. The computation predicts qualitatively all of theU main features revealed by the experiment. A line of coalescence is formed outside of theinception zone near the model apex. The lines of upstream influence and coalescence areapproximately straight rays from a virtual origin. The computation underpredicts the angleof the line of upstream influence and line of coalescence by 14.5% and 15.5% respectively.This underprediction has also been observed previously [7] for other fin angles. A divergenceline is seen near the fin which divides the fluid flowing over to that being entrained into thevortical structure. The surface streamlines between the line of coalescence and the line ofdivergence (attachment) converge asymptotically with the line of coalescence. No secondaryseparation [17] is observed.
The flow structure is examined with exhaustive sets of particle traces. For the purpose ofbrevity, only a few are selected for presentation. Fig. 9 displays traces of particles released atthe upstream end of the computed domain at y = 0.58,,. For illustration, the line of coales-cence is also displayed. The streamlines roll into a large vortical structure with particles near
the fin surface pitching down and away from the fin beneath the vortical core. The orienta-tion of the vortical structure is counterclockwise as viewed from the base of the fin leadingedge. Particles released from upstream at y = 1.16.0 are displayed in Fig. 10 with the lineof coalescence. The fluid particles at this height are not entrained into the vortical structureand simply flow over the interaction. Additional extensive particle traces are consistent with
i these features.
11-2.2 Results for the (30,60) Swept Compression Corner
The surface pressure at z, = l0,, of the (30,60) swept comer is displayed in Fig. 11. Thecomputed results underpredict upstream influence. The plateau pressure level, the rapid pres-sure rise after the shock wave and the sharp peak ("comer pressure") near the model comer
8
I'
I
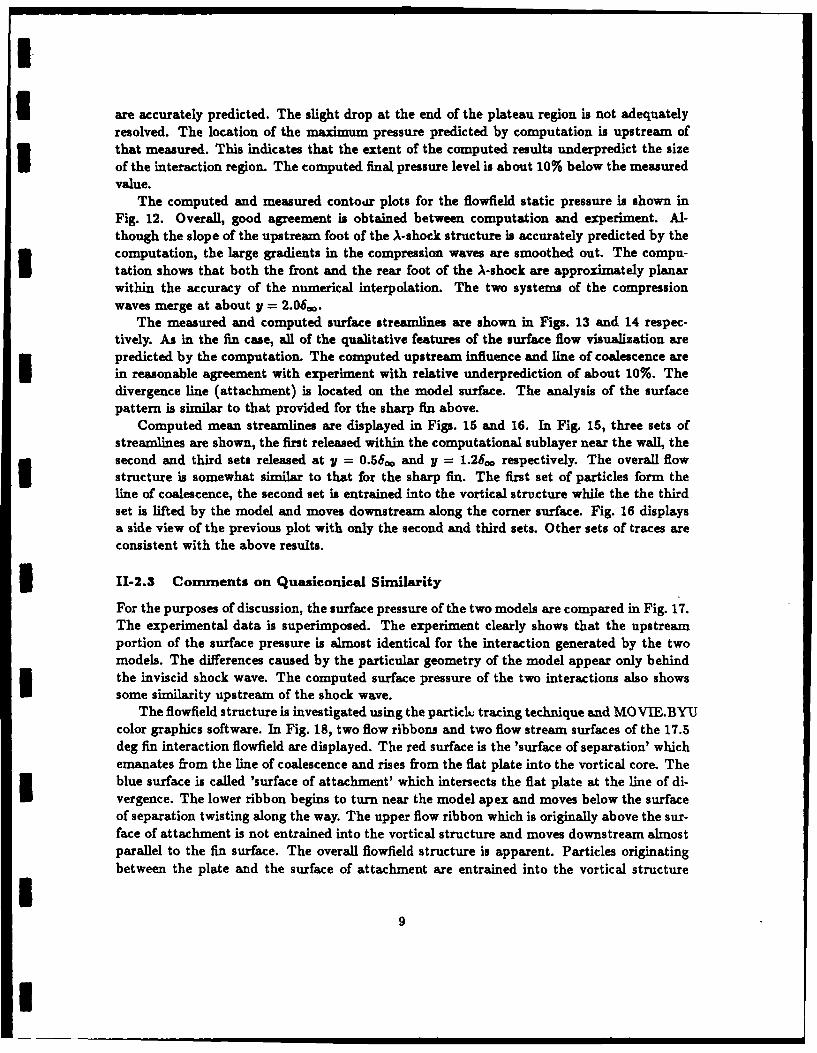
are accurately predicted. The slight drop at the end of the plateau region is not adequatelyresolved. The location of the maximum pressure predicted by computation is upstream ofthat measured. This indicates that the extent of the computed results underpredict the sizeof the interaction region. The computed final pressure level is about 10% below the measuredvalue.
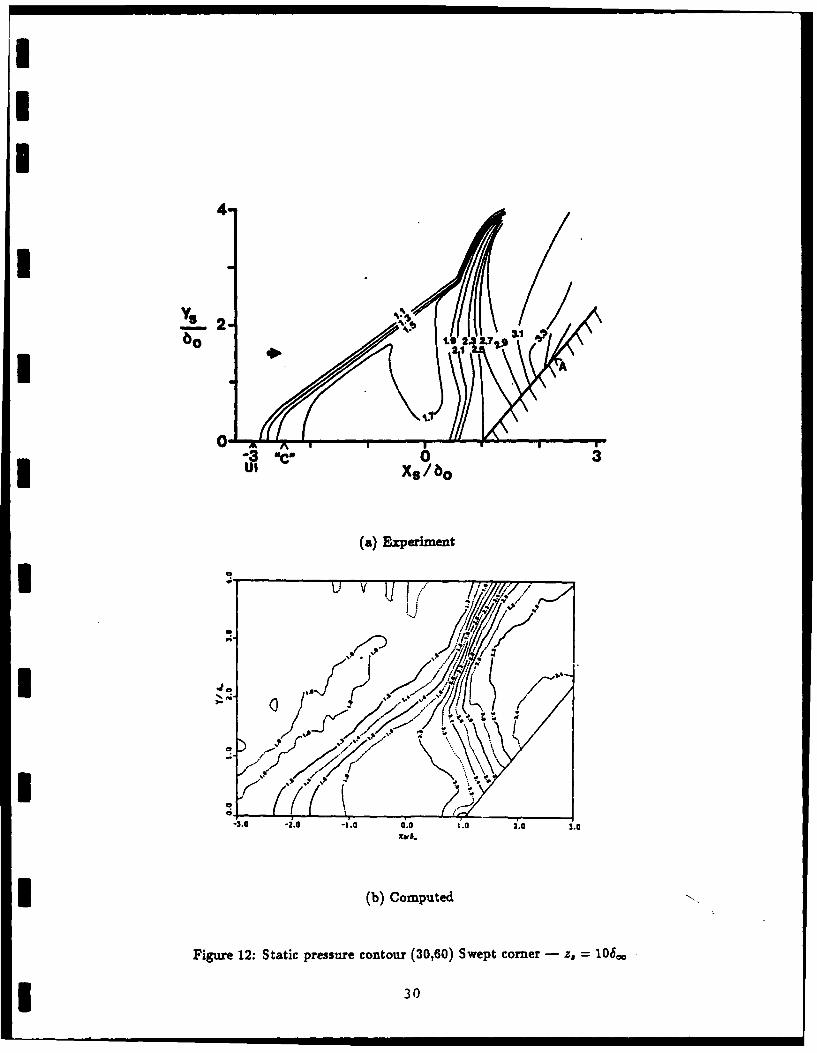
The computed and measured contour plots for the flowfield static pressure is shown inFig. 12. Overall, good agreement is obtained between computation and experiment. Al-though the slope of the upstream foot of the A-shock structure is accurately predicted by thecomputation, the large gradients in the compression waves are smoothed out. The compu-tation shows that both the front and the rear foot of the A-shock are approximately planarwithin the accuracy of the numerical interpolation. The two systems of the compressionwaves merge at about y = 2.06o.
The measured and computed surface streamlines are shown in Figs. 13 and 14 respec-tively. As in the fin case, all of the qualitative features of the surface flow visualization arepredicted by the computation. The computed upstream influence and line of coalescence arein reasonable agreement with experiment with relative underprediction of about 10%. Thedivergence line (attachment) is located on the model surface. The analysis of the surfacepattern is similar to that provided for the sharp fin above.
Computed mean streamlines are displayed in Figs. 15 and 16. In Fig. 15, three sets ofstreamlines are shown, the first released within the computational sublayer near the wall, thesecond and third sets released at y = 0.56.. and y = 1.26, respectively. The overall flowstructure is somewhat similar to that for the sharp fin. The first set of particles form theline of coalescence, the second set is entrained into the vortical structure while the the third
set is lifted by the model and moves downstream along the corner surface. Fig. 16 displaysa side view of the previous plot with only the second and third sets. Other sets of traces areconsistent with the above results.
3 11-2.3 Comments on Quasiconical Similarity
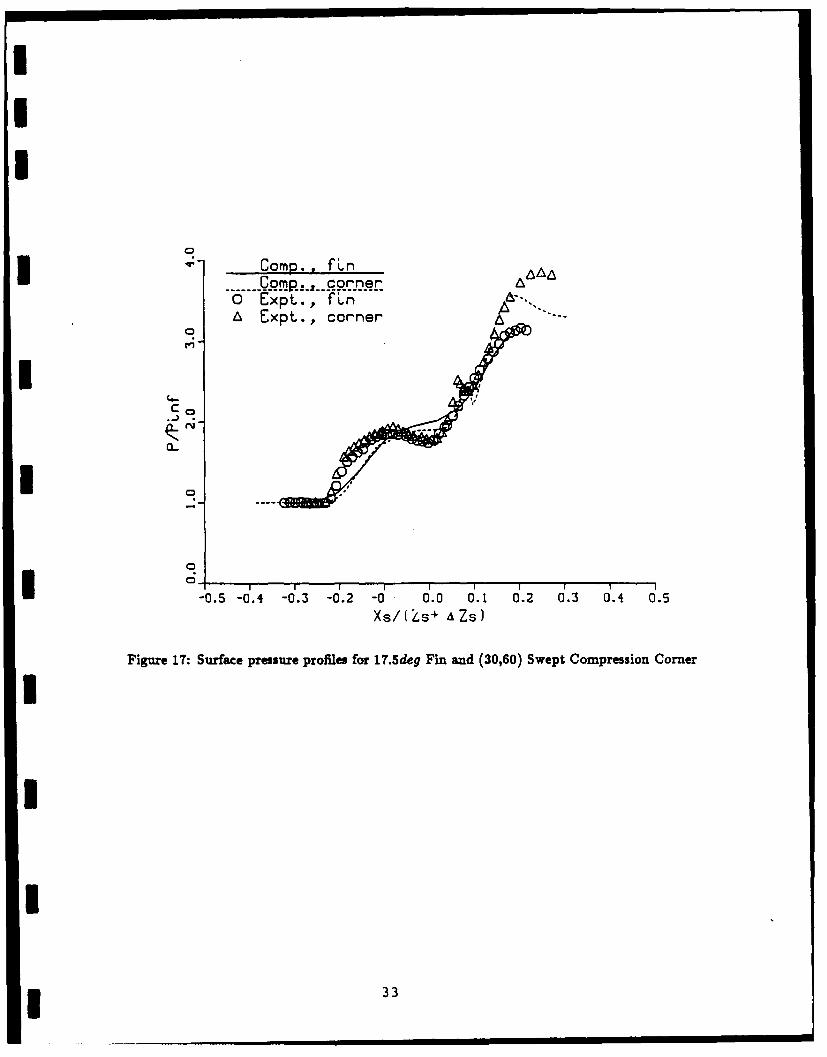
For the purposes of discussion, the surface pressure of the two models are compared in Fig. 17.The experimental data is superimposed. The experiment clearly shows that the upstreamportion of the surface pressure is almost identical for the interaction generated by the twomodels. The differences caused by the particular geometry of the model appear only behindthe inviscid shock wave. The computed surface pressure of the two interactions also showssome similarity upstream of the shock wave.
The flowfield structure is investigated using the partick tracing technique and MOVIE.BYUcolor graphics software. In Fig. 18, two flow ribbons and two flow stream surfaces of the 17.5deg fin interaction flowfield are displayed. The red surface is the 'surface of separation' whichemanates from the line of coalescence and rises from the flat plate into the vortical core. Theblue surface is called 'surface of attachment' which intersects the flat plate at the line of di-vergence. The lower ribbon begins to turn near the model apex and moves below the surfaceof separation twisting along the way. The upper flow ribbon which is originally above the sur-face of attachment is not entrained into the vortical structure and moves downstream almostparallel to the fin surface. The overall flowfield structure is apparent. Particles originatingbetween the plate and the surface of attachment are entrained into the vortical structure
9
I

while those originating above the surface of attachment flow over the vortical structure.
11-3 Research Task No. 3: Investigate Methods of Control and Modifi-cation of 3-D Turbulent Interactions
As indicated previously, the motivation for this research task lies in the existence of anundesirable large vortical structure in 3-D turbulent interactions. Several techniques may beappropriate for flow control including 1) bleed (suction) to remove low energy fluid in theboundary layer, 2) generation of vorticity of opposite sign (e.g., with the symmetric doublewedge configuration (Mee and Stalker [18])), 3) blowing (normal or wall-jet) to enhance thekinetic energy of particles in the boundary layer, and 4) geometrical modifications such asraising the sharp fin a finite distance above the surface.
The focus the present research is two-fold:
" Bleed (suction): Bleed has been traditionally employed in high speed aircraft inletsto prevent boundary layer separation. Conventional theory dictates that the effect ofsuction is to remove the low speed fluid in the boundary layer before it separates fromthe surface.
" Shock-shock Intersections: Mee and St ilker [18] have concluded from experimentalobservations that intersecting shocks can produce a given overall pressure rise with lesserlikelihood of separation than an equivalent strength single shock interaction. Theirexperiments were restricted to weak interactions. This concept is unproven, however,and additional computational and experimental research is required to determine itsvalidity.
11-3.1 Effect of Bleed
A series of computations on the 20* single fin configuration (SFC) with Mach and Reynoldsnumbers 3 and 9 x 10r, with porous suction over a triangular region extending from theline of upstream influence to the theoretical inviscid shock location (Region I in Fig. 19) hasbeen described in previous literature [19]. The maximum bleed corresponded to removal ofapproximately 25 % of the upstream boundary layer. The computed streamline structurewas observed to be essentially independent of the surface bleed flow rate, although the lineof coalescence moved downstream toward the theoretical inviscid shock footprint (TISF)and upstream influence was reduced. The effect of bleed was focused principally in a smallfraction of the boundary layer. This represents a significant and surprising result and bringsinto question the efficacy of boundary layer bleed for sidewall interactions in high speedinlets. Numerical simulation of bleed on a different area - the region on the plate betweenthe TISF and the base of the fin (Region II in Fig. 19) and performed in FY88 are described.Approximately 8% of the incoming boundary layer is bled off from the region on the flat plateextending between the theoretical inviscid shock line and the surface of the sharp fin. Theinfluence of bleed in this region on the vortical structure is also found to be insignificant. Adetailed description of the results may be found in Gaitonde and Knight [20]4 .
3 S Bogdonoff, Private communication'See Section VII
10
I

I
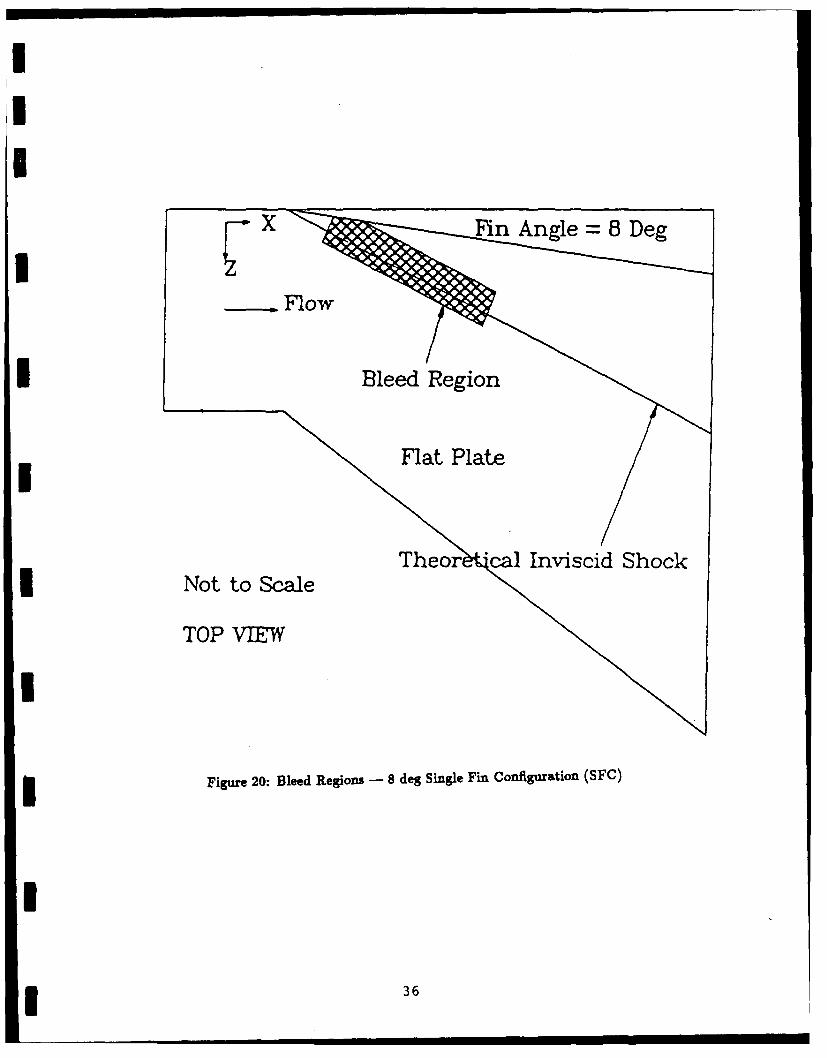
U The recent experiment of Barnhart et a [211 with suction on a roughly rectangular areacovering a strip on eithL. side of the theoretical shock footprint (Fig. 20) on an incipientlyseparated configuration (80 SFC, Mach 3, Re 6m = 6.5 x 10s) is not extensive enough toprovide general guidelines. Nevertheless, their observation of beneficial effects of suctionwarrants numerical investigation. This computation is complete and results are describedin [20]. Briefly, comparison with experimental data and analysis of computed results indicatesthat the effect of bleed is primarily to reduce the surface angularity and upstream influence.The major portion of the flow is not influenced by suction.
The overall effect of suction, based on the above computations on the strong (20 deg) andweak (8 deg) configurations, may be summarized as follows:
" Effect on surface streamlines: For the stronger interaction, the effect of bleed upstreamof the shock footprint (Region I) is to reduce the surface angularity of the flow. Theline of coalescence observed in the absence of bleed [7] persists although its angle withthe shock footprint is significantly reduced. This reduction is proportional to bleed3 magnitude. Region i bleed has no effect on surface streamlines which resemble thosein the absence of suction. For the weaker interaction, surface yaw angles also displaylower values in presence of suction. A general statement about the effect of bleedon separation cannot be made for the weaker configuration since it is only incipientlyseparated even in the absence of bleed.
" Effect on surface variables: Region I bleed results in lower upstream influence andhigher rate of pressure rise in the interaction although the total pressure rise remainsthe same. Region II bleed does not display any effect on surface pressure rise. Forthe weak interaction, the results are similar to those for Region I bleed on the stronginteraction. In the absence of further computation, it is not possible to distinguishbetween the effects of upstream and downstream (of the shock footprint) bleed. Theeffect of all regions of bleed considered (on both the strong and the weak configuration)is to increase local skin friction drastically. It is evident that a significant drag penaltyis associated with bleed.
" Effect on shock structure: Region I bleed results in a tightening of the upstream legof the X-shock structure as a result of reduced displacement thickness of the interac-tion. This reduction is evident also by the elimination of the pitot pressure overshootobserved in the interaction in the absence of bleed. Region II bleed has no effect oneither the upstream or the downstream compression fans. For the weak interaction, theupstream compression fan is seen to disappear completely. This is probably due to acombination of the relatively high values of bleed utilized and the inherent weakness ofthe interaction.
" Effect on vortical structure: Neither bleed region has any significant effect on thevortical structure observed in the strong interaction although larger portions of theincoming boundary layer are ingested with increased bleed magnitude. Only particleswhose no bleed trajectories pass close to the bleed region are ingested. Although nostatement can be made about the effect of bleed on the vortical structure for the weakerinteraction, it is observed, that particles escaping the influence of bleed follow pathssimilar to those in the no bleed configuration.
11
I
I
11-3.2 Double shock interactions
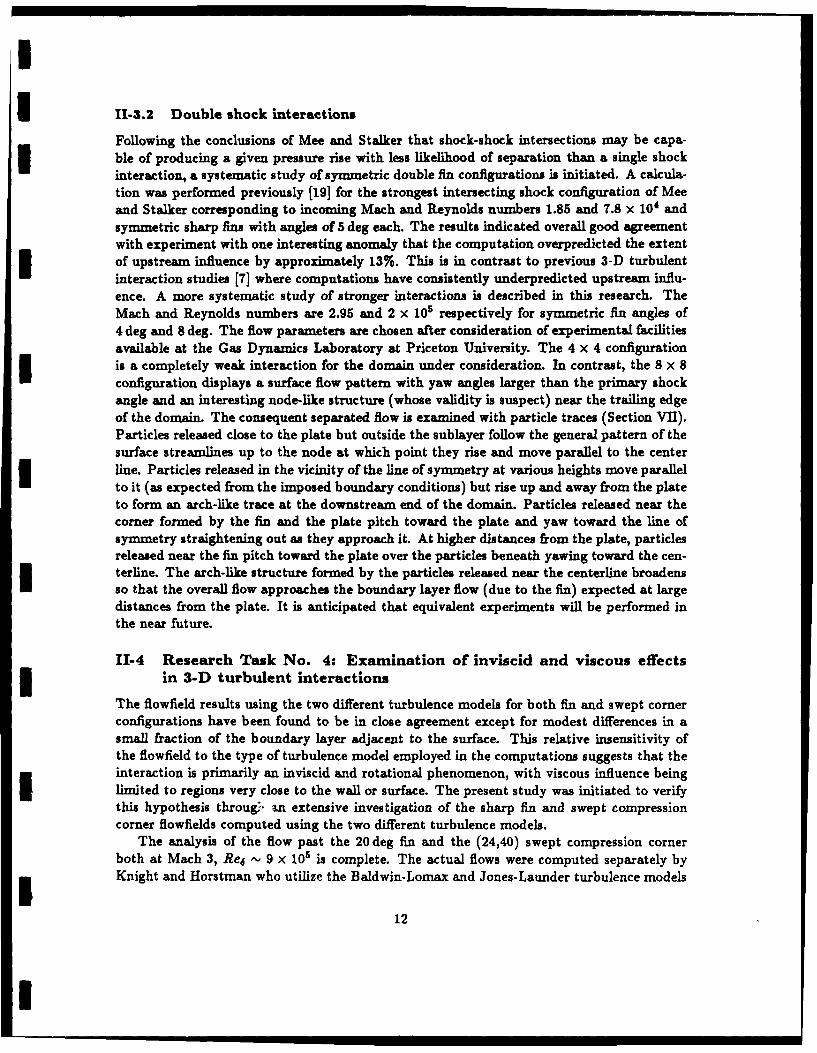
Following the conclusions of Mee and Stalker that shock-shock intersections may be capa-3 ble of producing a given pressure rise with less likelihood of separation than a single shockinteraction, a systematic study of symmetric double fin configurations is initiated. A calcula-tion was performed previously (19] for the strongest intersecting shock configuration of Meeand Stalker corresponding to incoming Mach and Reynolds numbers 1.85 and 7.8 x 10⁴ andsymmetric sharp fins with angles of 5 deg each. The results indicated overall good agreementwith experiment with one interesting anomaly that the computation overpredicted the extentof upstream influence by approximately 13%. This is in contrast to previous 3-D turbulentinteraction studies [7] where computations have consistently underpredicted upstream influ-ence. A more systematic study of stronger interactions is described in this research. TheMach and Reynolds numbers are 2.95 and 2 X 10⁵ respectively for symmetric fin angles of4 deg and 8 deg. The flow parameters are chosen after consideration of experimental facilitiesavailable at the Gas Dynamics Laboratory at Priceton University. The 4 x 4 configurationis a completely weak interaction for the domain under consideration. In contrast, the 8 x 8configuration displays a surface flow pattern with yaw angles larger than the primary shockangle and an interesting node-like structure (whose validity is suspect) near the trailing edgeof the domain. The consequent separated flow is examined with particle traces (Section VII).Particles released close to the plate but outside the sublayer follow the general pattern of thesurface streamlines up to the node at which point they rise and move parallel to the centerline. Particles released in the vicinity of the line of symmetry at various heights move parallelto it (as expected from the imposed boundary conditions) but rise up and away from the plateto form an arch-like trace at the downstream end of the domain. Particles released near thecorner formed by the fin and the plate pitch toward the plate and yaw toward the line ofsymmetry straightening out as they approach it. At higher distances from the plate, particlesreleased near the fin pitch toward the plate over the particles beneath yawing toward the cen-terline. The arch-like structure formed by the particles released near the centerline broadensso that the overall flow approaches the boundary layer flow (due to the fin) expected at largedistances from the plate. It is anticipated that equivalent experiments will be performed inthe near future.
11-4 Research Task No. 4: Examination of inviscid and viscous effectsI in 3-D turbulent interactions
The flowfield results using the two different turbulence models for both fin and swept cornerconfigurations have been found to be in close agreement except for modest differences in asmall fraction of the boundary layer adjacent to the surface. This relative insensitivity ofthe flowfield to the type of turbulence model employed in the computations suggests that theinteraction is primarily an inviscid and rotational phenomenon, with viscous influence beinglimited to regions very close to the wall or surface. The present study was initiated to verifythis hypothesis throug. an extensive investigation of the sharp fin and swept compressioncorner flowfields computed using the two different turbulence models.
The analysis of the flow past the 20 deg fin and the (24,40) swept compression cornerboth at Mach 3, Re6 -. 9 X 10⁵ is complete. The actual flows were computed separately byKnight and Horstman who utilize the Baldwin-Lomax and Jones-Launder turbulence models
12
I

I
I respectively.The following approach is adopted in the analysis of the flowfields:
1. A numerical code is developed to integrate the mean kinetic energy equation alongstreamlines in the flow and to compute the contributions to the rate of change ofmean kinetic energy by viscous and inviscid terms. Using this code, several streamlinesoriginating at various y-locations within and outside the boundary layer are examined.The results for both sharp fin and swept compression corner flows indicate that althoughinviscid effects in general govern the dynamics of the interaction along the streamlines,viscous influence remains significant even at points considerably distant from the plateor surface.
2. A 'planewise' investigation of the interaction flowfields is carried out in order to directlydetermine the relative importance of viscous and inviscid contributions in various re-gions of the flow. The magnitudes of the viscous and inviscid terms (of the mean kinetic
energy equation) are compared directly at points lying on various y - z planes (for thesharp fin) and at points lying on various z - I planes (for the swept compression corner).It is observed that although the interaction is governed primarily by inviscid effects,viscous influence is significant even in regions of the flow distant from the surface.
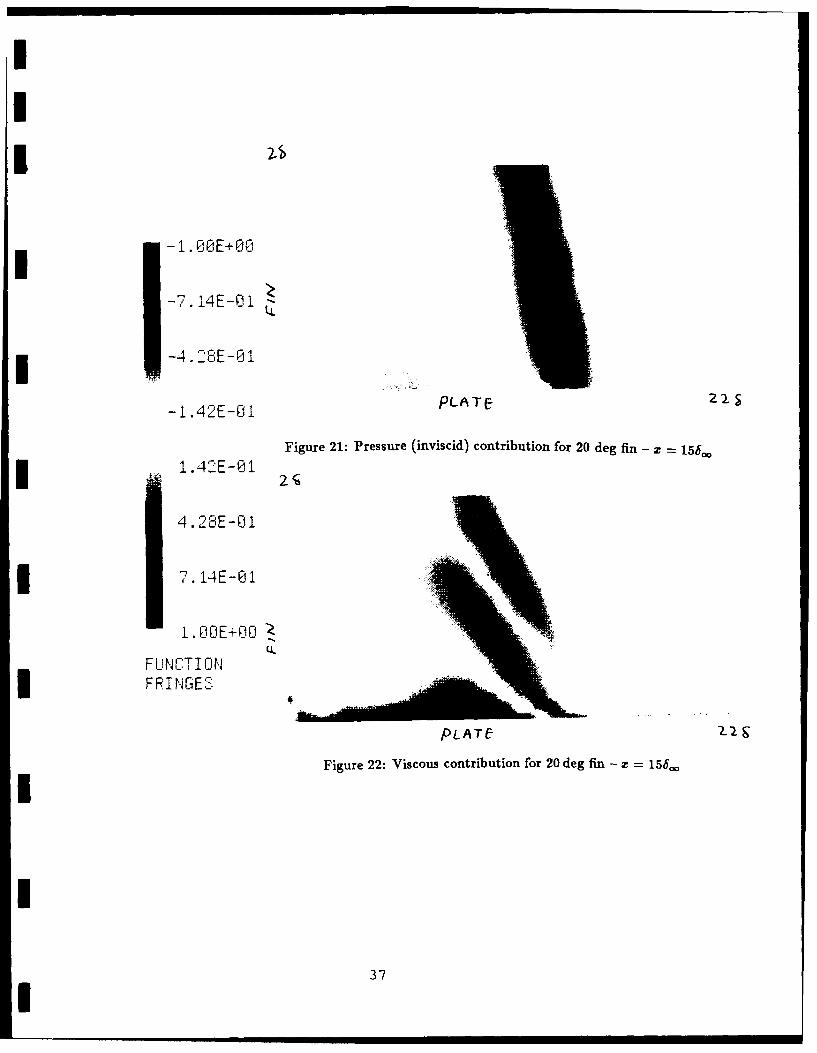
Color graphics is extensively utilized to visualize the results of this 'planewise' analysis.Figs. 21 and 22 display the magnitudes of the inviscid and viscous terms respectively forthe sharp fin interaction (a = 20 deg, Mach 3, Res = 9 x 10'), computed with the theBaldwin-Lomax turbulence model, on a y - z plane (normal to the streamwise direction)and at a location x = 158.w. The inviscid (pressure) influence is concentrated towards thefreestream side of the interaction (i.e. away from the fin surface). The viscous effects areconcentrated to the immediate left of the region of inviscid influence. Sinilar results havebeen observed for other y - z planes at various x locations. The flowfield computed usingthe Jones-Launder model shows similar results with regard to the concentration of inviscidinfluence in the flow but viscous influence is observed to be concentrated in a fraction of theboundary layer adjacent to the surfaces of the fin and the plate.
The results for the swept corner interaction computed using the Baldwin-Lomax modelparallel those for the sharp fin for both viscous and inviscid terms. The flowfield computedusing the Jones-launder model for this interaction agrees as far as the inviscid terms are
concerned but differs with respect to the region of concentration of viscous influence.A more complete discussion of the approach to the problem and the results of this research
task is included in the attached paper titled "Viscous/Inviscid Influence in 3D Shock Wave-Turbulent Boundary Layer Interactions", submitted for the AIAA Meeting in January, 1989and included in Section VII.
I
I13
I
III Research Program for FY89 (1 October 1988 - 30 Septem-ber 1989)
I11-1 Research Task No. 1: Develop and Validate Theoretical Modelsfor 3-D Shock Wave-Turbulent Boundary Layer Interactions
A series of computations will be performed during FY89 for the 3-D sharp fin configurationat Mach 7 at fixed Reynolds number for several fin angles a. Additional computations maybe performed at Mach 10. The flow conditions will be selected to agree with the plannedexperiments at NASA Ames. Although the precise requirements for the number of grid pointsand CPU time depends on the specific case, experience has indicated that typically 100,000grid points and 10 CYBER 205 CPU hours are required [71 for each case.
The computed results will be compared with experimental data. Present plans includemeasurements of surface pressure and heat transfer, surface oil film visualization, and bound-ary layer profiles of pitot and static pressure, velocity and turbulence fluctuations. The dataIand graphics postprocessing will be performed at the Rutgers College of Engineering Super-computer Remote Access and Graphics Facility.
111-2 Research Task No. 2: Investigate Methods for Control and Modi-fication of 3-D Turbulent Interactions
The proposed research activity is strongly dependent on the availability of experimental dataand will focus on the double fin configuration and the lifted fin configuration (consisting of afin slightly separated from the flat plate thus permitting flow bleed through the corner). Thecomputations on the double-fin configuration utilized parameters chosen in anticipation ofexperiments to be performed at the Princeton Gas Dynamics Laboratory. In particular, thelengths of the fins and the spanwise separation (Fig. 3) were tentatively based on dimensionsof the wind tunnel to be employed. The experimental apparatus to be actually utilized iscurrently in advanced stages of calibration [221. The apparatus differs from the configurationemployed in two ways:
* Model Structure: The experimental setup exhibits both vertical and horizontal planes ofsymmetry thus resembling more closely an inlet configuration. Horizontal symmetry isachieved by utilizing a top plate symmetric with the bottom plate. The physical domainemployed for double shock interactions in Section 11-3 does not possess a horizontalplane of symmetry and, consequently asymptotic 2-D boundary conditions are enforcedat the top boundary.
* Dimensions: The actual dimensions of the model are currently being redeterminedbased on practical wind-tunnel operation constraints.
The systematic series of experiments initiated in FY87 will be continued in FY89 with closecollaboration with Prof. Bogdonoff of Princeton University.
A preliminary experimental investigation into the effect of corner bleed (231 has beenrecently completed at the Princeton Gas Dynamics Laboratory.s . Although lifting the fin off
6S. Bogdonoff, Private communication.
I14
I
I the plate does not alter the components of the physical model (fin and plate) in any drasticfashion, significant complexities in grid generation and boundary conditions (e.g., under thefin) may arise. An initial investigation into the feasibility of such a computation will becarried out.
111-3 Research Task No. 3: Examination of Inviscid and Viscous Effectsin 3-D Turbulent Interactions
Efforts will continue on the quantitative analysis of inviscid and viscous effects for the 3-Dswept compression corner and the 3-D sharp fin flowflelds. These activities will include:
" Examination of the error in the evaluation of the mean kinetic energy for the sweptcompression corner for (a, A) = (24,40) deg at Reynolds number 2.6 x 10⁶.
* The flowfields computed to investigate the quasiconical free interaction principle (Sec-tion H-2) will be analysed for viscous-inviscid effects
* Other flow equations (e.g., the mean vorticity equation) will be examined
High resolution color graphics visualization will be employed for presentation of the re-sults.
I
I
I
I
I15
I

IV Publications and Scientific Interactions
IV-1 Written Publications - Cumulative Chronological List
1. 1 October 1981 - 30 September 1982
(a) Knight, D., "Application of Curvilinear Coordinate Generation Techniques to theComputation of Internal Flows", in Numerical Grid Generation - Proceedings ofa Symposium on the Numerical Generation of Curvilinear Coordinates and theirUse in the Numerical Solution of Partial Differential Equations, North-Holland,New York, 1982, pp. 357-384.6
(b) Knight, D., "A Hybrid Explicit - Implicit Numerical Algorithm for the Three-Dimensional Compressible Navier-Stokes Equations", AIAA Paper No. 83-0223,AIAA 21st Aerospace Sciences Meeting, January 10-13, 1983. Published in AIAAJ., Vol. 22, Aug 1984, pp. 1056-1063. ¢
(c) Visbal, M., and Knight, D., "Generation of Orthogonal and Nearly OrthogonalCoordinates with Grid Control Near Boundaries", AIAA J. Vol 20, No. 3, March1982, pp. 305-306. 8
2. 1 October 1982 - 30 September 1983
(a) Knight, D., "Calculation of a Simulated 3-D High Speed Inlet Using the Navier-Stokes Equations", AIAA Paper No. 83-1165, AIAA/SAE/ASME 19th JointPropulsion Conference, Seattle, Washington, June 27-29, 1983.9
(b) Visbal, M., and Knight, D., "Evaluation of the Baldwin-Lomax Turbulence Modelfor Two-Dimensional Shock Wave Boundary Layer Interactions", AIAA Paper No.83-1697, AIAA 16th Fluid and Plasma Dynamics Conference, Danvers, Mass., July12-14, 1983. Published in AIAA J., Vol, 22, July 1984, pp. 921-928.10
3. 1 October 1983 - 30 September 1984
(a) Knight, D., "Numerical Simulation of Three-Dimensional Shock-Turbulent Bound-ary Layer Interaction Generated by a Sharp Fin", AIAA Paper No. 84-1559, AIAA17th Fluid Dynamics, Plasmadynanics and Lasers Conference, June 25-27, 1984.Published in the AIAA J., VoL 23, December 1985, pp. 1885-1891.11
(b) York, B., and Knight, D., "Calculation of Two-Dimensional Turbulent BoundaryLayers Using the Baldwin-Lomax Model", AIAA 23rd Aerospace Sciences Meeting,Jan 14-17, 1984. Published in the AIAA J., Vol. 23, Dec 1985, pp. 1849-1850.
4. 1 October 1984 - 30 September 1985
Research sponsored by APOSE. Grant 82-0040 and 80-0072?Research sponsored by AFOSR Grant 82-0040 and 80-0072'Research sponsored by AFOSR Grant 80-0072 and AF Contract F-33615-C-30089Research sponsored by AFOSR Grant 82-0040
10Research sponsored by AFOSR Grant 82-0040"Research sponsored by AFOSR Grant 82-0040
16
II

I (a) Knight, D., "Modeling of Three Dimensional Shock Wave .'urb-'ent BoundaryLayer Interactions", in Macroscopic Modeling of Turbulent Flows, Lecture Notesin Physics, VoL 230, Springer-Verlag, NY, 1985, pp. 177-201.
(b) Knight, D., Horstman, C., Shapey, B. and Bogdonoff, S., "The Flowfield Struc-ture of the 3-D Shock Wave-Boundary Layer Interaction Generated by a 20 degSharp Fin at Mach 3", AIAA Paper No. 86-0343, AIAA 24th Aerospace SciencesMeeting, January 6-9, 1986. Published in the AIAA J., VoL 25, Oct 1987, pp.1331-1337.
(c) Ong, C., and Knight, D., "A Comparative Study of the Hybrid MacCormack andImplicit Beam-Warming Algorithms for a Two-Dimensional Supersonic Compres-sion Corner", AIAA Paper No. 86-0204. Published in the AIAA J., VoL 25, Mar1987, pp. 401-407.
5. 1 October 1985 - 30 September 1986
(a) Knight, D., Horstman, C., Ruderich, R., Mao, M.-F., and Bogdonoff, S., "Super-sonic Flow Past a 3-D Swept Compression Corner at Mach 3", ALAA Paper No.87-0551, AIAA 25th Aerospace Sciences Meeting, January 12-15, 1987.
6. 1 October 1986 - 30 September1987
I (a) Gaitonde, D., and Knight, D., "Numerical Experiments on the 3-D Shock Wave-Boundary Layer Interaction Generated by a Sharp Fin", AIAA Paper No. 88-0309,AIAA 26th Aerospace Sciences Meeting, January, 11-14, 1988.
(b) Knight, D., Raufer, D., Horstman, C., Ketchum, A., and Bogdonoff, S., "Su-personic Turbulent Flow Past a Swept Compression Corner at Mach 3: Part Ir1,AIAA Paper No. 88-0310, AIAA 26th Aerospace Sciences Meeting, January 11-14,1988.
7. 1 October 1987 - 1 September 1988
(a) Gaitonde, D., and Knight, D., "Numerical Investigation of Some Control Methodsfor 3-D Turbulent Interactions Generated by Sharp Fins", To be presented at theI!27th Aerospace Sciences Meeting, Reno, Jan. 9-12 1989.
(b) Narayanswami, N., and Knight, D., "Viscous/Inviscid Effects in 3-D Shock Wave-Turbulent Boundary Layer Interactions", To be presented at the 27th AerospaceSciences Meeting, Reno, Jan. 9-12 1989.
I
I17
I
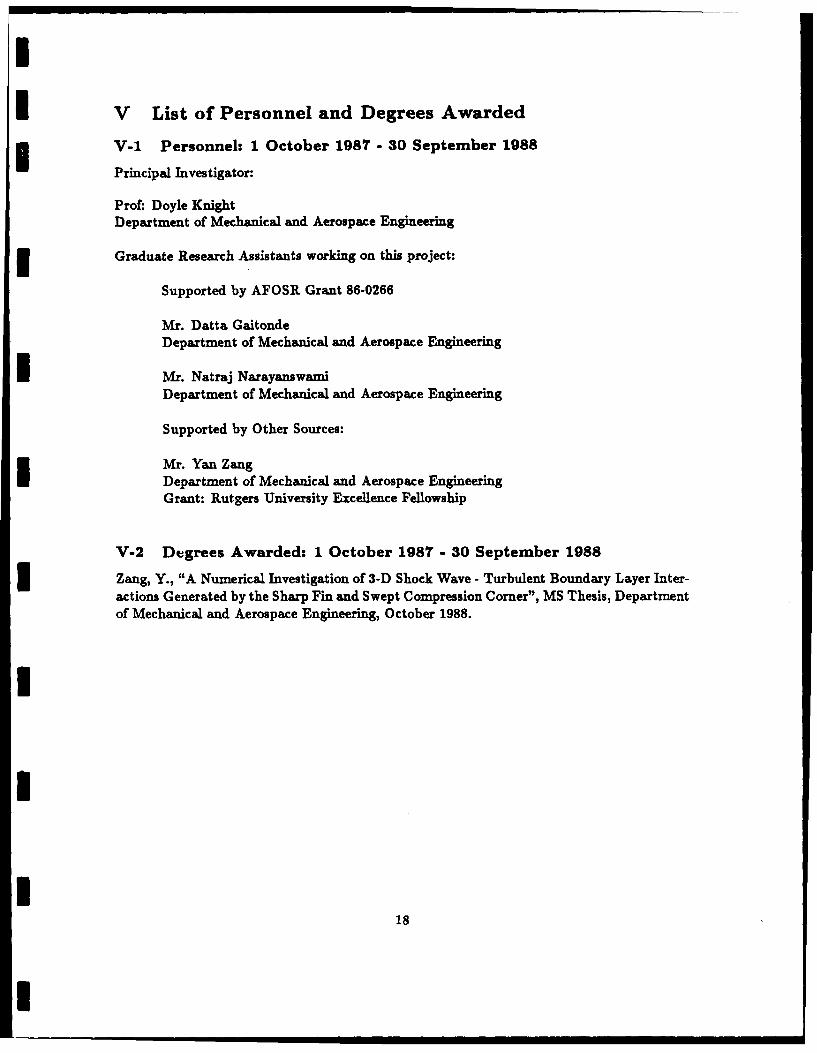
U V List of Personnel and Degrees Awarded
3 V-1 Personnel: 1 October 1987 - 30 September 1988
Principal Investigator:
Prof: Doyle KnightDepartment of Mechanical and Aerospace Engineering
3 Graduate Research Assistants working on this project:
Supported by AFOSR Grant 86-0266
Mr. Datta GaitondeDepartment of Mechanical and Aerospace Engineering
I Mr. Natraj NarayanswamiDepartment of Mechanical and Aerospace Engineering
Supported by Other Sources:
Mr. Yan ZangDepartment of Mechanical and Aerospace EngineeringGrant: Rutgers University Excellence Fellowship
V-2 Degrees Awarded: 1 October 1987 - 30 September 1988
3 Zang, Y., "A Numerical Investigation of 3-D Shock Wave - Turbulent Boundary Layer Inter-actions Generated by the Sharp Fin and Swept Compression Corner", MS Thesis, Departmentof Mechanical and Aerospace Engineering, October 1988.I
I
I18
I
VI References
[1] D. Knight. Theoretical Investigations of 3-D Shock Wave-Turbulent Boundary Layer In-teractions: Part VII. Technical Report, A three Year Proposal for the Period Beginning1 October 1986, New Brunswick, New Jersey, 4 April 1986.
[2] T. Reyhner and Hickcox. T. Combined Viscous-Inviscid Analysis of Supersonic InletFlowfields. Journal of Aircraft, 9:589-595, August 1972.
[3] S. Lubard and W. Helliwell. Calculation of the Flow on a Cone at High Angle of Attack.AIAA Journal, 12:965-974, July 1974.
[4] M. Rubesin and W. Rose. The Turbulent Mean-Flow, reynolds-Stress and Heat-FluxEquations in Mass Averaged Dependent Variables. NASA TMX 62248, March 1973.
(5] W. Jones and B. Launder. The Prediction of Laminarization with a Two-EquationU Model of Turbulence. Int. J. Heat and Mass Transfer, 15:301-304, 1972.
[6] B. Baldwin and H. Lomax. Thin Layer Approximation and Algebraic Model for Sepa-rated Flows. AIAA Paper 78-257, 1978.
[7] D. Knight, C. Horstman, B. Shapey, and S. Bogdonoff. Structure of Supersonic Turbu-lent Flow Past a Sharp Fin. AIAA Journal, 25:1331-1337, October 1987.
[8] D. Knight, C. Horstman, IL Ruderich, M-F. Mao, and S. Bogdonoff. Supersonic Tur-bulent Flow Past a 3-D Swept Compression Comer at Mach 3. AIAA Paper 87-0551,1987.
[91 D. Knight, D. Raufer, C. Horstman, A. Ketchum, and S. Bogdonoff. Supersonic Turbu-lent Flow Past a Swept Compression Comer. AIAA Paper 88-0310, 1988.
[10] K. Token. Heat Transfer Due to Shock Wave/Turbulent Boundary Layer Interactionsin High Speed Weapons Systems. Technical Report TR-74-77, AFFDL, 1974.
[1 H. Kubota and J. Stollery. An Experimental Study of the Interaction Between a GlancingShock Wave and a Turbulent Boundary Layer. J. Fluid Mech., 116:431-458, 1982.
3 [12] D. Knight. Theoretical Investigations of 3-D Shock Wave-Turbulent Boundary LayerInteractions: Part VI. Technical Report RU-TR-171-MAE-F, Department of Mechanicaland Aerospace Engineering, Rutgers University, New Brunswick, New Jersey, 1988.
[13] C. Ong and D. Knight. Hybrid Maccormack and Implicit Beam-Warming Algorithmsfor a Supersonic Compression Corner. AIAA Journal, 25:401-407, March 1987.
[14] C. Horstman and C. Hung. Computation of Three-Dimensional Turbulent SeparatedFlows at Supersonic Speeds. AIAA Paper 79-0002, 1979.
[15] I. Kimmel. An Ezperimental Investigation of Quasi-Conical Shock Wave / Turbu-lent Boundary Layer Interactions. PhD thesis, Aerospace and Mechanical Engineering,Princeton University, 1987.
19
I

I [16] Y. Zang. A Numerical Investigation of S-D Shock Wave-Turbulent Boundary Layer In-teractions Generated by the Sharp Fin and Swept Compression Corner. Master's thesis,Mechanical and Aerospace Engineering, Rutgers University, 1988.
[17] A. Zheltovodov. Regimes and Properties of Three-Dimensional Separation Flows Initi-ated by Skewed Compression Shocks. Zhurnal Prikladnoi Meekhaniki i TekhnicheskoiFziki, 3:116-123, May-June 1982.
[18] D. Mee and R. Stalker. Investigation of Weak Shock-Shock and Shock-Expansion Inter-section in the Presence of a Turbulent Boundary Layer. AIAA Paper 87-0549, 1987.
[19] D. Gaitonde and D. Knight. Numerical Experiments on the 3-D Shock Wave - BoundaryLayer Interactiou Generated by a Sharp Fin. AIAA Paper 88-0309, 1988.
[20] D. Gaitonde and D. Knight. Numerical Investigation of Some Control Methods for 3-D Turbulent Interactions due to Sharp Fins. To be presented at the 27th AerospaceSciences Meeting, Reno, Nevada, 1989.
[21] P.J. Barnhart, I. Greber, and W.R. Hingst. Glancing Shock Wave-Turbulent BoundaryLayer Interaction with Boundary Layer Suction. AIAA Paper 88-0308, 1988.
[22] P. Batcho, A. Ketchum, and S. Bogdonoff. Preliminary Study of the Interactions CausedBy Crossing Shock Waves and a Turbulent Boundary Layer. To be presented at the 27thAerospace Sciences Meeting, Reno, Nevada, 1989.
[23] S. Bogdonoff and A. Toby. An Exploratory Study of Corner Bleed on a Three-Dimensional Shock Wave Turbulent Boundary Layer Interaction. To be presented atthe 27th Aerospace Sciences Meeting, Reno, Nevada, 1989.
I,I
U
I20
I

LieoDiegec
Figure 1: Suraed mo . 2hr i
4e"at to Scale
Figure : Flowield fr sep corn
* 21

UK
A
Figure 3: Double fin configuration
z
10
Loseso ODwCtgOSMom
3 Figure 4: Location of experimental surveys - 17.5 deg fin
3 22

III
I
Zs - 9.6.0 Expt.-Pr~nceton
Co
U -
00
-8.0 -4.0 0.0 4.0 8.0Xs/OeL toLnf
Figure 5: Surface Pressure for 17.5 deg Fin (z. = 9.66.)
I
I
* 23

0
C. Q ExptPr/nceto
Fiue a ( f )pittprsue tStto 1 1..de i
C.24
0MNEMMD

I9
StatLon 12
0Exp.-PrLncetonComputatLon
Cr\
a
1~~~ 0 ______
0.0 1.24036.0 48.0 60.0
Yaw AnqLe (deg)
U Figure 6 (b) (2 of 3): Yaw angles at Station 12 - 17.5 deg fm
* 25

I
StatLon 120 Exp.-Prtnceton
ComputotLon
C.'
M
4.)
I C
0.0 0.8 1.6 2.4 3.2 4.0Ps/PsLnfI
Figure 6: Static pressure comparison at Station 12 - 17.5 deg fin (3 of 3)
2
I
26
I
*c
Figure 7: Surface streamline pattern for 17.5 deg fin - Experiment
Line of Diverpace7 Shock
/ ~ Line of Cooalesce
Fin
Figure 8: Surface streamline pattern for 17.5 deg fin - Theory
* 27

Fiue9Iatcetae o 75dgfn-y 0ad056
Figure 9: Particle traces for 17.5 deg fin - y = 0 and 0.5 6 .
28

00
0 Exp.Pr/neton~n
Fiueo1 Somurfctt ar a .=10.fr 3,0)cre
I.29
II
4-I
ys
I tA, /-.
3 U3
(a) Experiment
U v.
XI..
I (b) Computed
Figue 12: Static pressure contour (30,60) Swept comer - z, 106,,.
-30
• • ' ' , I, I I

Figure 13: Surface streamline pattern for (30,60) corner - ExperimentLine of Divergence
4 Corner
Shock
4-Line of Coalescence
Flow
Figure 14: Surface streamline pattern for (30,60) corner - Theory
* 31

ILine afto etm
Figure 15: Particle traces for (30,60) Swept Corrz (front 'view) 0 v/~ 00.5,1.2
Figre 6:Parice taces for (3,6) SwePt Corner (side view) - =0.5,1.2
I 32
I I I I | I ,
IIII
I0
3 Comp.. , in
0Expt., f LnA Expt., corner
4-
Co
0'!~
I€: I I I IIIII
-0.5 -0.4 -0.3 -0.2 -O 0.0 0.1 0.2 0.3 0.4 O.sXs/( ,s+ A Zs )
Figure 17: Surface pressure profiles for 17.5deg Fin and (30,60) Swept Compression Corner
3
I
I- - 33.,mn, i ll

I0
I3

II
I Theoretical Inviscid Shock\ Line of;Upstream Influence
F i
m Bleed Region I0 Bleed Region II
1 INot to Scale
Flow
* TOP VIEW
Figure 19: Bleed Regions - 20 deg Single Fin Configuration (SFC)
I
* 3
I i nl eno
BleIRgo
FltPlt
Figure 20: Bleed Regions - 8 deg Single Fin Configuration (SFC)
3 36
-i1 88E+@8
-7. 14E-01I
-4. E-01
-142E-,PA 22.5
Figure 21: Pressure (inviscid) contribution for 20 deg fin - x 156oo
1.42E-01
4. 28E-01
7 14E-8i
I OOE+O0J
L-FUNCTI ONFRI NGES
PLATE
Figure 22: Viscous contribution for 20 deg fin - z = 156
3
I
37I

S VII Papers
Paper A.
Numerical Investigation of Some Control Methods for3-D Turbulent Interactions due to Sharp Fins
D. Gaitonde 2
D. Knight13
I Paper B.
Viscous/Inviscid Effects in 3-D Shock Wave-Turbulent Boundary Layer Interactions
N. Narayanswami14
D. Knight"5
I
To be presented at the AIAA 27th Aerospace Sciences MeetingReno NV
"Graduate Student, MAE Dept, Rutgers University13Professor, MAE Dept, Rutgers University"Graduate Student, MAE Dept, Rutgers University"'Professor, MAE Dept, Rutgers University
38I
Numerical Investigation of Some Control Methods for 3-D TurbulentInteractions due to Sharp Fins
Datta GaitondelDoyle Knight'
Department of Mechanical and Aerospace EngineeringRutgers University
P.O. 909, MAEPiscataway, NJ 08855
Abstract are presented in the form of surface streamlines, surface
This paper describes continuing numerical re- pressures and particle traces. The 4 x 4 configurationsarchies o e odficotinind cnrl - is a completely weak interaction for the domain under
search efforts on the modification and control of 3-D consideration. In contrast, the 8 x 8 configuration dis-
shock wave-turbulent boundary layer interactions due plays surface flow turning angles larger than the primaryto supersonic flow past a sharp fin mounted on a flat shock angle. The consequent separated flow is examined
plate. In supplement to previous numerical experiments with particle traces.
(20* fin, Mach 3, Res = 9 x 101), the effect of bleeding
off roughly 5% & 8% of the incoming boundary layer 1 Introductionfrom two distinct bleed regions is studied. Region Icovers the area on the flat plate between the line of Research on 3-D shock wave - turbulent boundaryupstream influence (as determined by computed initial layer interactions ("3-D turbulent interactions") findspressure rise) and the theoretical inviscid shock foot- utility in a number of high speed aerodynamic applica-print (TISF) while Region II covers the r maining por- tions such as aircraft components. A supersonic inlettion on the plate between the TISF and tLte base of the flowfield, for example, is characterized by a pattern offin. Numerical pitot pressure and yaw ang-les are com- oblique shocks formed by the general curvilinear shapepared with experimental data obtained in the absence of the ramp and cowl surfaces, that interact with turbu-of bleed. The results indicate that the influence of both lent boundary layers on the walls. Dimensionless geome-suction schedules on the overall flowfleld and the previ- tries such as the 3-D sharp fin (as in this research) andously observed vortical strunture is remarkably modest the 3-D swept compression corner are often employed towith significant effects restricted to the region adjacent isolate the physics of such interactions from the geomet-to the plate near the bleed region. In a separate com- rical complexity. The principal parameters for the sharpputation, for an incipiently separated configuration (81 fin (Fig. 1) configuration are the Mach number M., thefin, Mach 3, Re# = 6.5 x 10'), 23% suction is applied Reynolds number, Re#. based upon the boundary layeron an area across the shock corresponding to the ex- thickness 6. at the leading edge of the fin, the thermalperimental configuration of Barnhart et aL Comparison boundary conditions and the fin angle cf.with experimental data and analysis of computed results Progress has been achieved in analysing 3-D tur-indicates that the effect of bleed is primarily to reduce bulent interactions with analytic, experimental and nu-surface angularity and upstream influence. The major merical techniques applied separately or in conjunctionportion of the flow is not influenced by suction, with each other. Analytical investigations have been
Following the conclusions of Mee and Stalker that restricted primarily to weak interactions in which, byshock-shock intersections may be capable of producing definition, there is no separation [1, 2, 3, 4]. Such stud-a given pressure rise with less likelihood of separation, ies have provided valuable insight into the various scalesa systematic study of symmetric double fin configura- involved in complex interactions resulting in better un-tions is initiated. Two configurations with fin angles derstanding of required resolution for numerical and ex-4 deg x 4 deg and 8 deg x 8 deg respectively at Mach 2.95 perimental effort.and Reynolds number 2 x 10⁵ are simulated. Results Experimental results in the form of surface pres-
sures and surface flow visualizations have been available1 Grmduate Student, Student Member AIAA for over two decades[5, 6, 7, 8, 9, 101. In recent years,2Professor, Assocate Fellow AIAA improvements in instrumentation have made it possibleCopyright @American Institute of Aeronautics and to measure flow variables (such as pitot pressure and
Astronautics, Inc., 19SO. All rights reserved yaw angles) in the boundary layer as well [11, 12, 13,
!1
I mmi
14]. Measurements of skin friction by laser interferom- it separates from the surface. In inlets, suction is
etry [15] have helped compare the accuracy of different traditionally employed on the ramp, cowl and side-eddy viscosity models. In addition to providing results walls to prevent How separation in the vicinity ofof practical value, experimental observations provide a the intersection of the shock waves and walls.valuable benchmark for code validation. e Blowing: Experimental results [12] at several Mach
The objective of current research efforts is to numbers indicate that tangential blowing is benefi-achieve the ability to not only predict variables of prac- cial in retarding separation. The effect of blowingtical interest (surface pressures, skin friction and heat is to enhance the energy of the retarded boundarytransfer rates), but also overall flow characteristics such layer fluid.as upstream influence, symmetricity (conical or cylin- e Shock-shock Interaction: Mee and Stalker [4] havedrical (16]), existence of separation and flow structures theorized from an experimental study of weakon various scales. With the advent of relatively eas- shock-shock interactions with a turbulent bound-ily accessible high-speed computers, computational re- aholy-sh at interctinsh a r u e asearch efforts have become a very cost-efficient means to ary layer that intersecting shocks can produce a"reduce the required [experimental] test matrix to the given overal pressure rise with less likelihood ofsmallest number of configurations [17]". separation than an equivalent strength single shock
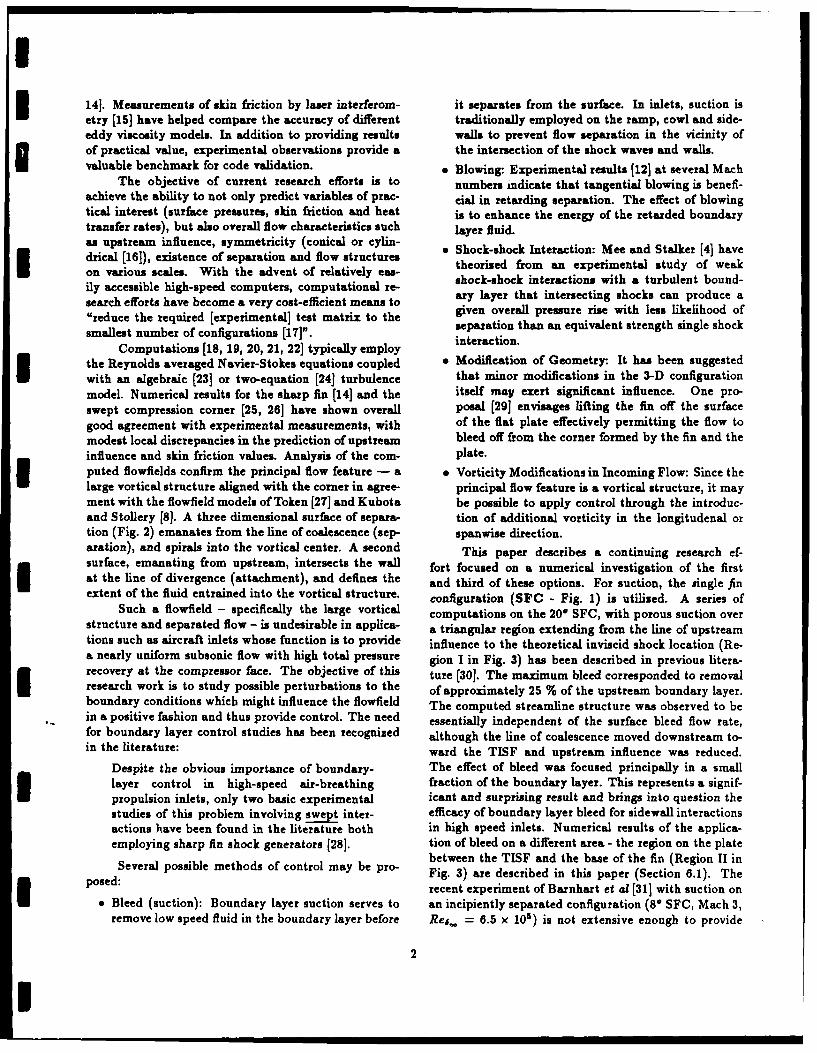
Computations [18, 19, 20, 21, 22] typically employthe Reynolds averaged Navier-Stokes equations coupled * Modification of Geometry: It has been suggestedwith an algebraic (23] or two-equation [24] turbulence that minor modifications in the 3-D configurationmodel. Numerical results for the sharp fin [14] and the itself may exert significant influence. One pro-swept compression corner [25, 26] have shown overall posal [29] envisages lifting the fin off the surfacegood agreement with experimental measurements, with of the fiat plate effectively permitting the flow tomodest local discrepancies in the prediction of upstream bleed off from the corner formed by the fin and theinfluence and skin friction values. Analysis of the com- plate.puted flowfields confirm the principal flow feature - a e Vorticity Modifications in Incoming Flow: Since thelarge vortical structure aligned with the corner in agree- principal flow feature is a vortical structure, it mayment with the flowfield models of Token [27] and Kubota be possible to apply control through the introduc-and Stollery [8]. A three dimensional surface of separa- tion of additional vorticity in the longitudenal ortion (Fig. 2) emanates from the line of coalescence (sep- spanwise direction.aration), and spirals into the vortical center. A second This paper describes a continuing research ef-surface, emanating from upstream, intersects the wall fort focused on a numerical investigation of the firstat the line of divergence (attachment), and defines the and third of these options. For suction, the single Jinextent of the fluid entrained into the vortical structure, configuration (SFC - Fig. 1) is utilized. A series of
Such a flowfield - specifically the large vortical computations on the 20* SFC, with porous suction overstructure and separated flow - is undesirable in applica- a triangular region extending from the line of upstreamtions such as aircraft inlets whose function is to provide influence to the theoretical inviscid shock location (Re-a nearly uniform subsonic flow with high total pressure gion I in Fig. 3) has been described in previous litera-recovery at the compressor face. The objective of this ture [30]. The maximum bleed corresponded to removalresearch work is to study possible perturbations to the of approximately 25 % of the upstream boundary layer.boundary conditions which might influence the flowfield The computed streamline structure was observed to be
in a positive fashion and thus provide control. The need essentially independent of the surface bleed flow rate,for boundary layer control studies has been recognized although the line of coalescence moved downstream to-in the literature: ward the TISF and upstream influence was reduced.
Despite the obvious importance of boundary- The effect of bleed was focused principally in a smalllayer control in high-speed air-breathing fraction of the boundary layer. This represents a signif-propulsion inlets, only two basic experimental icant and surprising result and brings into question thestudies of this problem involving swept inter- efficacy of boundary layer bleed for sidewall interactionsactions have been found in the literature both in high speed inlets. Numerical results of the applica-employing sharp fin shock generators [28]. tion of bleed on a different area - the region on the plate
between the TISF and the base of the fin (Region II inSeverad possible methods of control may be pro- Fig. 3) are described in this paper (Section 6.1). The
Iposed: recent experiment of Barnhart et al [31] with suction on
e Bleed (suction): Boundary layer suction serves to an incipiently separated configuration (8° SFC, Mach 3,remove low speed fluid in the boundary layer before Res. = 6.5 x 101) is not extensive enough to provide
2
I

Igeneral guidelenes. Nevertheless, their observation of than 1% of the boundary layer) adjacent to solid sur-beneficial effects of suction warrants numerical investi- faces. The sublayer approximation has been validatedgation (Section 6.2). for both 2-D (38] and 3-D [30] applications. The ex-
The second set of computations deals with crossed plicit algorithm of MacCormack [39] is applied to theshock wave - turbulent boundary layer interactions, full Navier-Stokes equations on grid points exterior toThe concept of employing intersecting shocks (produced the computational sublayer. This includes nearly all ofby the symmetric double fin configuration (SDFC) in the boundary layer and the external inviscid region. TheFig. 4) is based on the experimental observation that code has been employed successfully to predict turbulentthe limiting streamline deflection angles downstream of interactions for the 3-D sharp fin [14], swept compres-the reflected shocks are less than the angles downstream sion corner [25, 26] and the double fin configuration [30].of the primary shock [32]. This concept is unproven, Computations described in this paper were performed
- however, and additional computational and experimen- either on the now decommissioned 4-pipe CYBER 205tal research is required to determine its validity. It is at the NASA Ames Research Center or on the 2-pipeemphasized that suction in not imposed in the double VPS-32 machine at NASA Langley Research Center.fin configurations. A calculation was performed previ-ously [30] for the strongest intersecting shock configura- 3 Classification of Computationstion of Mee and Stalker corresponding to incoming Mach Two configurations are utilized in this research -
and Reynolds numbers 1.85 and 7.8 X 10⁴ and symmetric the SFC (Fig. 1) and the SDFC (Fig. 4).The single-finsharp fins with angles of 5 deg each. The results indi- configuration (SFC) is employed to study the effects ofcated overall good agreement with experiment with one suction on the flowfield. None of the computations oninteresting anomaly that the computation overpredicted the symmetric double-fin configuration (SDFC) incor-the extent of upstream influence by approximately 13%. porate suction. The attempt at control arises ratherThis is in contrast to previous 3-D turbulent interac- from the geometry itself since the vorticity generatedtion studies [14] where computations have consistently by the two fins tends to counteract. For the purposes ofunderpredicted upstream influence. A more systematic the following discussion, the z-axis points in the generalstudy of stronger interactions is described in this paper. streamwise direction, i is plate normal and z is the span-The Mach and Reynolds numbers are 2.95 and 2 x 10⁵ wise axis. Also, the theoretical boundary layer thick-respectively for symmetric fin angles of 4 deg and 8 deg. ness is utilized to scale distances for Cases A, B, C, FIt is anticipated that equivalent experiments will be per- and G (see below). The ezperimental value is utilizedformed at the Princeton Gas Dynamics Laboratory in for Cases D and E (Table 1).the future.
2 Governing Equations and Numerical Model 3.1 Suction on SFCIn each case, a particular area (see below) is de-
The governing equations are the full mean com- markated and the mass flux at each grid point in thepressible Navier-Stokes equations using mass averaged area is specified as a ratio of the upstream freestreamvariables and strong conservation form [33]. The molec- mass flux. The bleed parameter, B.P. I,defined as fol-ular and turbulent Prandtl numbers are 0.73 and 0.9 re- lows:spectively. Turbulence is modeled through the inclusion Bleed Parameter (B.P.) I = Pw3 (1)of the two-layer algebraic turbulent eddy viscosity model Pocmof Baldwin and Lomax [23] with the mixing length (J) is utilized to characterize the magnitude of suction. In
as specified by the formula of Buleev [34]. The effect of this equation, p is the density, u and v are the Cartesianbleed is incorporated through the bleed correction fac- components of the velocity in the streamwise and platetor of Cebeci [35] as described in [30]. This turbulence normal directions and subscripts u; and oo indicate wallmodel has been validated for a variety of boundary layer and freestream respectively. The implementation corre-flows [36] with zero, favorable and adverse pressure gra- sponds to porous bleed as opposed to slot bleed. Thedients in the presence of suction. parameter B.P. I does not incorporate the area of bleed
A 3-D coordinate transformation is employed as and therefore, provides only a local estimate of bleedin [14] to facilitate the application of the numerical magnitude. A more physical value may be computed byalgorithm and the boundary conditions. The hybrid approzimating the percentage of fluid in the incomingexplicit-implicit algorithm of Knight [331 is employed boundary layer bled off. This requires an estimate of theto solve the governing equations. The implicit algo- amount of incoming flow that actually "sees" the bleedrithm employs Keller's Box scheme (37] and is applied region. This guess may be made in a simple mannerto the asymptotic form of the Navier-Stokes equations by simply projecting the ray indicating start of suction(the sublayer equations) in a thin region (typically less on the upstream end of the domain. For example, for
3
I

Case A B C D I E F I GConfiguration SFC SDFCFin Angle (deg) 20 8 4x4 8x 8Bleed Region I (Fig.3 II Fig. 3 -- IFig5
61 tha, (cm.) 1.3 3.1 0.461ai* (cm.) 1.40 3.11 0.38B.P. I 0.00 0.01 0.01 0.00 0.04 0.00B.P. 11 0.00 0.05 0.08 0.00 0.23 0.00Reoxth x 10' 8.8 5.6 2.6Reaj., x 106 9.8 6.5 --
M _ 2.95Pt (kPa) 690 276 690zK) 251 300 251T. (K) 280 299 239
Grid DetailsIL,JL,KL 32,48,32 40,48,32 75,48,32NSLI 8
NSL1 8Computer Resources
Computer SYS I SYS H SYS ICPU(hrs) 4.2 3.6 6.7 10.5 1 12.5 24.9 28.3Flow Time TT 3.5 4.2 4.9 4.6 3.5 4.9 5.1
Legend: 6 - Boundary layer thickness B.P. - Bleed Parameter
IL,JL,KL - Points in a, y, z directions M - Mach numberNSL 1 - Grid points in fin sublayer NSL 2 - Grid points in plate sublayerRe - Reynolds number Pt - Total pressureSFC - Single fin configuration SYS I - 4-Pipe CYBER 205 (Ames)SYS II - 2-Pipe VPS-32 (Langley) T. - Characteristic time (= L/U..)Tt - Total temperature T. - Wall temperature (fin and plate)
Table 1: Classification of Computations
Requirement z> < 3 z N<3 L= 1 z 60 NPBLAvg. Max Avg. [ME_ Avg. Max Avg. Max
Case A 1.47 3.03 1.47 3.03 0.00 0.00 47.4 97.4 16Case B 1.47 3.01 1.46 3.01 0.30 0.41 50.4 97.0 16Case C 1.99 4.21 1.62 3.03 0.37 0.41 59.3 135.3 16Case D 0.89 2.10 0.89 2.10 0.0 0.0 28.6 69.4 16Case E 1.10 5.02 0.91 2.18 1.42 1.44 35.26 161.6 16Case F 0.91 1.01 0.91 1.01 0.0 0.0 19.1 21.2 16Case G 1.05 1.20 1.05 1.20 0.0 0.0 19.4 24.3 16
Legend: zt - First grid point from boundary in wall unitsN - Bleed correction factor of Cebeciih - Local bleed magnitudep. - Molecular viscosity at wall
z - Height of sublayer in wall unitsNPBL - Points in boundary layer
Table 2: Grid resolution requirements
4
I

Region I in Fig. 3, the boundary layer in distance Lz computational domain is achieved with a computational
may be assumed to "see" the bleed region. B.P. II may grid described briefly in Section 5 and in detail in [40].be expressed as: * Upstream boundary [ABHG]: The flow at this
f iboundary (located 56 upstream of the fin leadingB.P. f11p.d. = - (6")pA (2) edge for Cases A,B,C,F & G, 4.66 for Cases D
0( & E)is assumed to be two-dimensional and is gen-erated with a separate 2-D compressible boundary
where 6 is the boundary layer thickness, V is the a ois- layer code [36] utilizing the Baldwin-Lomax turbu-placement thickness, Ab is the area of bleed and L is lent eddy viscosity model. For the SFC computa-the approprite upstream distance. Two fin angles are tions, the momentum thickness is matched while forutilized for bleed computations: the SDFC computations, the anticipated boundary
20 deg SFC layer thickness is matched.
Case A corresponds to flow past the 20 SFC wit Plane of symmetry upstream of fin leading edge
out bleed. For Cases B and C, 1% (= B.P. I) is imposed [AFLG]: Symmetry boundary conditions are ap-
on Regions I and I (Fig. 3) respectively. The first re- plied at this boundary i.e., the normal component
gion (Region I in Fig. 3) extends between the line of of the velocity and the normal derivatives of the re-
upstream influence and the TISF. The second region maining flow quantities are set to zero. For both
(Region II)extends between the TISF and the fin base. the SFC and the SDFC,
The bleed and flow parameters are presented in Table 1.1. O(u, WP, T)Note that Cases A and B have already been described t0; 0 (3)in [30] (identified there as the "no bleed" and "1% bleed" where, p is the density, u, i and w are the a,V, andcases) and are included here only for comparison with z components of the velocity vector (= {u, v, w}),Case C. f is the normal to the boundary, p and T are the
8 deg SEC pressure and temperature respectively.
The recent experimental investigation by Barn- e Fin surface [LFKE]: Since this is a solid surface, the
hart et al [31] on the effect of suction on supersonic velocity vector and the normal pressure gradientflow past an 8 ° SPC is numerically investigated in this are assumed zero and a fixed surface temperature
research. The flow parameters are summarized in Ta- is specified i.e.,
ble 1. Two computations are performed on this geom- -petry, a no bleed case (Case D) and a case incorporating pn= 0; T = T , =0 (4)suction on the area displayed in Fig. 5 (Case E). As for where the subscript w refers to wall conditions. Thethe 20* SFC, bleed is imposed by specifying the bleed thermal boundary conditions employed for all casesmass flux on the plate at each grid point in the bleed are presented in Table 1.region. The relevant bleed parameters are provided inTable 1. * Flat plate [ABCDEF]: The two components of the
velocity vector along the flat plate are specified3.2 Flow past the SDFC zero. Bleed is applied in the appropriate areas
Computations are performed on two distinct SD- for Cases B, C and E by specifying the quantity
FCs (Fig. 4) with fin angles 4 x 4 (Case F) and a x 8 sur1pa.en (B.P. I in Table 1). The normal pres-
(Case G). The overall flow parameters are listed in Ta- sure qradient is assumed zero and the surface tem-
ble 1. The SDFC has two geometrical length scales - perature is fixed as for the fin surface (Table 1).
the separation between the fins (L,. in Fig. 4) and the p(5)length of the fins (Lfi). L, is chosen to be 33.336 in On = n; u = w =0; T = T; -0accordance with experimental considerations. The value Downstream boundary [EKJD]: In every case, theof Lj, (696) is chosen such that for Case F, the inviscid streamwise length of the physical domain is re-secondary shock hits the fin at the trailing edge of the stricted so that the outgoing flow is supersonic (ex-domain. cept close to the flat plate, of course) and as such,
4 Boundary Conditions the zero gradient extrapolation condition (8/8z =0) is applied. For Cases A,B and C, this boundary
The boundary conditions employed for both con- is located 266 downstream of the fin leading edge.figurations are described together with reference to For Cases D and E this distance is 17.756 and forFigs. 1 and 4. The precise mapping from physical to Cases F and G, the value is 696.
5
I

Right boundary [BCDJLH]: This boundary condi- station Station
tion is treated separately for the SFC and the 1 -5.4 .81 8 1.2 6.81
SDFC: 2 -4.4 5.81 9 2.6 5.81- SFC: The boundary is assumed to be sufll- 3 -3.4 5.81 10 3.4 5.81
ciently far from the fin to ensure that the 4 -2.4 5.81 11 -0.14 4.81boundary layer is locally two-dimensional and 5 -1.4 5.81 12 -2.67 6.81therefore a simple gradient boundary condition 6 -0.4 5.81 13 -3.94 7.818/z = 0 is employed. This requires that the 7 0.8 5.81 14 1.13 3.81shock wave pass out the downstream boundary[EKJD]. Table 3: Location of Experimental Surveys
- SDFC: This is a symmetry boundary and thesame conditions are applied as at the planeof symmetry upstream of the fin leading edge locally. Previous computations with similar values have[AFLG]. compared well with experiment [33].
" Top Boundary [HIJKLG]: This boundary is lo- 6 Resultscated far enough (roughly 86) away from the corner(formed by the plate and the fin) to permit the as- For the purpose of brevity, several results are pre-sumption of two-dimensional flow in planes parallel sented without figures. A more detailed description ofto the boundary. The boundary conditions applied this work may be found in [40].are therefore:
au-U=0 (8) 6.1 Suction on 20 deg. SFC
Computed results are first formally compared withAll boundary derivatives are implemented in single- available experimental data in the form of boundarysided first order accurate form. layer pitot pressure and yaw angle profiles and surface
pressures. Since no bleed is imposed in the experiments,5 Computational Details direct comparison with theory is limited to Case A (no
Non-uniform Cartesian grids are employed in all bleed). In the following discussion, the upstream bound-calculations. The 3-D grid is composed of a set of ary layer thickness 6,, (theoretical) is utilized to scalestreamwise (x = constant) planes (equally spaced with distances (cE [13] for alternate scales). Streamwise dis-A = 6 for all cases except D and E). Within each tances (a), unless otherwise mentioned, are measuredplane, two separate grid systems are employed - the relative to the location of the inviscid shock (a.) at the"ordinary" and the "sublayer" grid [33]. The ordinary relevant spanwise (z) position. The distance normal togrid points adjacent to the plate and the fin are dis- the flat plate is denoted i . Flow variables are normal-tributed using a combination of geometrically-stretched ised by their freestream values upstream of the interac-and uniform spacings in the general fashion of [20]. The tion.number of grid points utilized, CPU and correspondingflow development time required for each case are pre- Effect of suction on Flow Variables
sented in Table 1. The fourteen experimental stations of Shapey andAdequate resolution of different regions of the flow Bogdonoff [14] are located in the general shape of a cross
impose various constraints on permissible grid sizes. A (Fig. 6) with stations 1 and 2 located upstream of thecomplete set of criteria for judging the acceptability of a interaction, 3 and 13 at about the line of upstream in-grid system do not exist at present, except perhaps for fluence, stations 4, 5, 6 and 12 lie in Region I, whilethe process of successive grid refinement which is gener- 7 through 11 and 14 lie in Region II. The coordinatesally not feasible for 3-D Navier Stokes calculations. The of these stations are provided in Table 3. Experimen-determination of the acceptability of a given grid sys- tal and numerical results available in the form of pitottem, must be based on experience and previous numer- pressure and yaw angle boundary layer surveys are com-ical computations [33]. The characteristics of the grids pared at each of the above stations, although, for theemployed for every case satisfy constraints described in purpose of brevity, only some plots (stations 3, 5, and 8)the literature in the average sense (see Table 2). The are presented here.maximum values are localized in a few locations such as At stations 1 and 2 located upstream of the in-in bleed regions and at the fin leading edge, where the lo- teraction, the pitot pressure and yaw angle profiles (notcal skin friction -,. shows steep increases (see Fig. 11 for shown - see [40]) are unaffected by suction in either re-example), making it unfeasible to satisfy all constraints gion and resemble profiles for 2-D boundary layer flows
6
I.. .nini mlnINlm l li l I
as expected. The pitot pressure and yaw angles at sta- (V/6 >3) indicate the existence of the inviscid shocktion 3 are shown in Fig. 7 where the ordinate (V/6) is the which is smeared over roughly three (3) grid points atdistance normal to the flat plate and the abscissa is the this section. Near the plate, the shock wave forms twopitot pressure (Fig. 7 (a)), normalised by the freestream compression fans - an upstream (left) and a downstreampitot pressure, or yaw angle in degrees (Fig. 7 (b)). A (right) fan. The effect of bleed in Region I is evidentlyperceptible drop in pitot pressure because of bleed is ev- to reduce the size of the upstream fan. Region II bleed,ident at about y/6 = 0.1 for Region I bleed in contrast on the other hand, has no significant effect on either fan.to Region II bleed which shows negligible influence atthis station. A similar conclusion may be drawn from Effect of Suction on Flowfleld Structurethe yaw angle profile. Region I bleed displays reduced The computed solutions are utilised to examineyaw angles up to about y/6. = 0.8 while Region H the effect of bleed on the flow structure. Fig. 13 dis-bleed has no significant effect. This general behavior plays surface skin friction lines (often denoted "surfaceis also seen at stations 4 (not shown) and 5 (Fig. 8) streamlines") for Cases A, B and C respectively. Theseboth of which lie upstream of Region IL At both these are generated with a particle tracing code with the ap-stations, whereas Region II bleed has no influence, Re- propriate surface stresses replacing velocities. The loca-gion I bleed exhibits a "cross-over" point, i.e., near the tion of the inviscid shock is indicated in each figure. Theflat plate (up to about y/6,. = 0.7 for station 5) the line of coalescence clearly persists for all cases. Whereaspitot pressure increases above its no bleed value while, Region I suction (Fig. 13(b)) tends to align the line ofat larger distances from the plate, the pitot pressure coalescence with the theoretical inviscid line, Region IIis slightly lower. The yaw angles at both stations (4 suction (Fig. 13(b)) has no significant influence despiteand 5) are lower for Region I bleed with no effect of Re- the previously discussed steep local increase in skin fric-gion II bleed. At station 8 (Fig. 9), the pitot pressure for tion values. This is another manifestation of the con-Region II bleed is larger very close to the flat plate ac- clusion derived from the surface pressure plots, viz., Re-centuating the previously observed s shaped structure. gion II bleed has no effect on upstream influence.In the major portion of the boundary layer however, the A further analysis of the computed flowfield is car-pitot pressure closely parallels the no bleed profile. Yaw ried out with particle traces employing a 3-D code [41].angles for Region II bleed show no significant deviation Particles are "released" at various heights above the flatfrom no bleed (Case A) values except in the free stream. plate at the upstream boundary and their paths are plot-
The computed wall pressure is compared with the ted to study gross flow features. Fig. 14 shows tracesexperimental data of Goodwin [10] in Fig. 10 at the of particles released at y/6.. = 0.0001, within the sub-spanwise location z/b = 5. The ordinate is the static layer. For Case A, these particles coalesce to form thepressure normalised by the freestream static pressure. line of coalescence observed in the surface streamlines.The abscissa is the~streamwise distance (measured rela- For Case B, the particles are ingested by the plate in thetive to the inviscid shock) normalized with 6. . Com- region of bleed. Particles for Case C follow trajectoriesparison of Case A with experimental data indicates good similar to those for Case A. Fig. 15 shows traces of par-agreement with regard to upstream influence. The ex- ticles released at y1/6.o = 0.6. For both Cases A and B,perimental data indicates a plateau region at about the particles are entrained in the vortical structure. For(M - a. - 0) which is not adequately reproduced in the Case C, those particles originating near the leading edgecomputation perhaps for reasons of grid resolution. The of the fin at the upstream boundary (small values of thetotal pressure rise equals the expected theoretical value spanwise coordinate z), are ingested by the flat plate inin the invisced region and is independent of bleed region Region II (note the trajectories of the first seven par-and magnitude. The effect of Region I bleed (Case B) ticles from the fin leading edge). The other particlesis evidently to reduce upstream influence thus reducing are swept into the vortical structure as for the othermodestly the distance over which the pressure rise is cases. It is evident that only those particles whose noachieved. Region II bleed (Case C) does not influence bleed trajectory passes close to the flat plate (to withinthe upstream influence or the total pressure rise. a certain height whose value is difficult to estimate) are
The localized effect of bleed on skin friction co- ingested. To study the origin of the flow that is ingestedefficient is exhibited in Fig. 11 at z/6 = S. For both by the plate in Case 5, a series of particles were releasedbleed regions, local skin friction values display steep in- near the plate (in the bleed region) and their motioncreases. It is apparent that a significant drag penalty is was traced in reverse. The traces are shown in Fig. 16.associated with the employment of suction. These particles generally originate near the fin leading
Fig. 12 displays static pressure contours on the edge. In the no bleed case, they would then have thenz16 = 5.81 plane. The high concentration of static risen up and around the vortical core. The above figurespressure contours in the region away from the plate show clearly that the mean flowfield pattern continues
7
I

to be dominated by the vortical structure for both bleed in the computation. Since the effect of bleed is toregions. lower upstream influence, a higher local computed bleed
value (over experiment) may be expected to result in6.2 Suction on S deg SFC a lower upstream influence. The maximum deviation
The geometrical configuration, bleed region and (- 25%) occurs near the location of the inviscid shockother significant parameters of the two computations ((a - a,)/6 - 0) and beyond. Near the center of the(Cases D and E) on the 8* SFC are described in Fig. 5 suction region, the computed and experimental valuesand Table 1. As for the 200 SFC, results are first com- match, resulting from a higher rate of pressure rise forpared with experimental data and the flow is then ex- the former. The overall pressure rise at the spanwiseamined with particle traces, location (Z = 2.46) matches experiment and is only
slightly lower (by - 3%) than the theoretical pressureComparison with Experiment rise (P2/P1 = 1.78).
The experimental data utilized for comparison The comparison with experimental surface yawpurposes was recorded at the NASA Lewis Research values at the same spanwise locations is displayed inCenter and is reported in Barnhart et at [31]. They Fig. 18. The value a18 is plotted on the ordinate whereutilize two Mach numbers, 2.48 and 2.95. For the lat- a is the turning angle and 9 is the fin angle. Upstreamter, relevant to this research, results are published only of the interaction ((a - a,)/6 - -4), yaw angles arein the presence of bleed and include surface (static pres- roughly zero. Within the interaction (-3 < (a-z,)/6 <sures and wall flow angles) and boundary layer measure- 2), experimental values display considerable scatter andments (pitot pressure and yaw angles). Each of these is indicate a more gradual turning of the flow than doescompared below with computed results. the computation. The discrepancy is again partly at-
It is important to note one fundamental distinc- tributable to differences in local bleed rates. Computa-tion between the computed and experimental conflgu- tions predict lower turning angles at the upstream edgeration. In the experiment, suction is applied by per- of the bleed region because local bleed values are higherforations on the plate in conjunction with a vacuum than probably exist in experiment. Both computationboost pump downstream of the suction plenum. Since and experiment display maximum turning angles lower
the surface pressure increases into the interaction, the than the shock angle (corresponding to the value 3.23 inexperimental bleed rate is variable, increasing generally Fig 18) although maximum experimental values exceedin the streamwise direction at any given spanwise lo- computed by roughly 15%. Note that maximum turningcation. For lack of precise information on local bleed occurs behind the inviscid shock. Further downstream,variation on the plate, the computation assumes a uni- computed values display turning angles twice the fin an-form bleed mass rate such that the total bleed mass gle whereas experimental values approach the fin angle.rate over the entire bleed area matches experiment. It Fig. 19 exhibits the location of the nine experi-
is expected therefore, that computed bleed values ex- mental boundary layer surveys where pitot pressure andceed experimental values in the vicinity of the upstream yaw angle profiles were measured. Fig 20 displays pitotend of the bleed domain. The reverse situation may be pressure profiles at each of the nine stations. At sta-expected at the downstream end. In the following dis- tion 1, upstream of the interaction, the experimentalcussion, distances are normalized with the eaperimen- values (markers) match both the no bleed (solid line)ta upstream boundary layer thickness (6 = 3.112cm.). and bleed (dotted line) cases and resemble a 2-D pro-The term "experimental data" is assumed to imply in file similar to that existing at the upstream end of thethe presence of bleed since no data is available without domain. At station 2, the curves are generally similarsuction for this configuration. The strict comparison is to those at station I although in the region betweentherefore restricted to Case E. 0.3 < / 6 < 1, experimental values are slightly lower.
The computed (Case E only) and experimental At the upstream edge of the bleed domain (station 3),surface pressures at four spanwise locations are plot- both computed and experimental values in the presenceted in Fig. 17. Note that the profiles at all locations bleed display modestly lower values in the upper halfcollapse roughly on a single curve. Further, while the of the boundary layer. At station 4, on the shock loca-upstream pressures ((a - z.)/6 - -4) match well as tion, Case D displays a small pitot pressure overshoot.expected, the computation displays significantly lower The effect of bleed is to increase pitot pressure valuesupstream influence. Experimental pressures begin to up to about y/6 "- 0.3 compared to the no bleed case,rise at (a - x,)/6 - -1.5 whereas the initial com- beyond which the values are lower. A similar observa-puted pressure rise occurs at (a - z,)/6 - 0, at the tion was made previously for the 20 ° SFC (see Fig. 8 fortheoretical inviscid shock location. This discrepancy is example). The experimental results agree with Case Epartly attributable to the assumption of uniform bleed beyond /16 > 0.3 although closer to the plate, more
8
I I i nliluaalin mi ll
II
conformity is obtained with the no bleed case. A simi- total pressure rise remains Lhe same. Local skin frictionlar crossover of no bleed and bleed profiles is observed values (not shown) display steep increases in the bleedat station 5, the first station located downstream of the region and are not affected elsewhere. The effect of bleedtheoretical shock. Comparing Case E with experiment, on the shock structure is also similar to that observedin the region 0 < y1 < 0.8, the computed values over- for the 20" fin with Region I bleed. The effect of bleedpredict pitot pressure values. The situation is reversed is to completely eliminate the upstream fan resultinghigher into the boundary layer. At stations 6, 7, 8 and in a shock structure that appears entirely inviscid (not9, the profiles all display similar qualitative behaviour, shown). No significant influence of bleed is observed inThe "crossover" of bleed and no bleed profiles occurs the inviscid regions.successively higher into the boundary layer. In gen- The computed surface streamlines are displayederal, experimental values agree with Case E close to the in Figs. 23 and 24 for Cases D and E respectively. Forplate although higher into the boundary layer, experi- Case D, surface streamlines display maximum turningmental values match no bleed results quite closely, indi- angles roughly equal to the shock angle. No clear linecating that the effect of bleed propagates higher into the of coalesence is visible though the lines display bunch-boundary layer in the computation than in experiment. ing slightly upstream of the inviscid shock trace. For
The computed and experimental yaw angles are Case E, significant reduction in surface angularity is ob-displayed in Fig. 21. At station 1, upstream of the served in the bleed region only. Streamlines originatinginteraction, yaw angles are negligible throughout the near the fin leading edge follow trajectories similar toboundary layer as anticipated. At station 2, the effect those for Case D. Upon reaching the bleed region how-of bleed is to lower yaw angle values below the no bleed ever, they straighten out and move parallel to the up-values up to about y/6 - 0.5. At the surface, computa- stream flow for a short distance gradually obtaining thetional values exceed experimental values. At the start shock angle downstream of the bleed region. Severalof the bleed region (station 3), computed yaw angles lines passing through the furthermost upstream end offor Case E assume small values through out the bound- the bleed region form a single group of closely bunchedary layer although in the absence of bleed (Case D), lines passing out the extreme downstream end of thethe flow exhibits significant turning at this station. Ex- bleed region.perimental values lie between those for Cases D and E. The flowfleld is analysed with exhaustive sets ofDownstream of the inviscid shock (station 5), the cor- particle traces released at various heights above therespondence between Case E and experiment is good plate. For brevity, only a few sets are discussed. Parti-with the computations tending to slightly underpredict cles released within the sublayer (y/6 = 0.0001) followyaw angles. The effect of bleed is to reduce yaw angles the general trajectory of the surface streamlines as an-in the boundary layer by as much as - 50% at the sur- ticipated (see Fig. 25 (a)) for Case D. In the presenceface. Further downstream, at station 6, although Case E of bleed however, particles are ingested (Fig. 25 (b)) atdisplays lower yaw angles, experimental values paral- the leading edge of the bleed region if released appro-lel Case D more closely. At stations 7 and 8, located priately close to the fin. Particles at larger spanwisedownstream of the bleed region, the effect of suction is distances escape the influence of suction. A similar pat-more modest. The comparison between experiment and tern is observed up to about y/6 = 0.01. Further intoCase E is very good at station 7. Experimental obser- the boundary layer, at y/6 = 0.1 (Fig. 26), Case D dis-vations display lower turning at close proximity to the plays significant flow turning although the clear vorticalplate at station 8. At station 9, located far downstream structure observed for the 20* SFC does not exist. Sev-of the bleed region, the effect of bleed is restricted to eral particles originating near the fin and whose no bleedthe region 0 < i/ 6 < 0.6. The experimental values, trajectory passes over the bleed region are ingested inwhich display significantly lower values at this location, Case E roughly at the center of the bleed region. Par-are suspect since the angle obtained in the free stream ticles released further from the plate (y/6 = 0.2) areis far lower than anticipated (equal to the fin angle since ingested at the trailing edge of the bleed region (notthis station is downstream of the shock). shown). Particles released at larger spanwise distances
are not affected. At y/6 = 0.3 (Fig. 27), none of the
Analysis of Computed Flowfield particles are ingested although the traces are slightly
The overall effects of bleed are observed to be the altered by suction and display modestly lower yawing.same as for the previously discussed 200 SFC. Fig. 22 At I 6 = 1 (Fig. 28), the effect of bleed is negligible.compares surface static pressure at two spanwise loca-tions for Cases D and E. Upstream influence, determined 6.3 Flow past double fin configurationsby initial pressure rise, is reduced and the rate of pres- Both computations on the SDFC (see Table 1) aresure rise in the interaction increases with bleed. The described together. Since experimental data is unavail-
9
.. .. .. ..... ..I " - I'a unm n I Irm l l l lI m

I5 able at this time, only computed results are discussed. effec is larger near the base of the fin. As anticipated,
Note that the domain length is identical for both the this interaction does not exhibit separation.weaker (4 x 4) and the stronger (8 x 8) interactions. Fig. 32 shows traces of particles released forHence, the free stream flow passes through a larger num- Case G inside the sublayer at i/6. = 0.0001. The par-ber of shock waves for the latter case. tides follow the general behavior of the surface stream-
Fig. 29 shows computed surface pressure contours lines and form an unphysical stagnation point on theplotted after symmetrically extending the flowfield. The plate at the location corresponding to the node. Fig. 33theoretical pressure rise after each shock for both cases shows a sequence of particles released at various heightsis presented in Table 4. These figures are qualitatively in the boundary layer. Particles released close to thesimilar for the initial (primary) pressure rise though the plate but outside the sublayer (yI/6.. = 0.01) also followpressure rises faster for the larger angle as is expected. the general pattern of the surface streamlines up to theTwo types of contour lines exist - "C" and "D". Note node at which point they rise and move parallel to thethat the switch from the one type to the other occurs center line. Particles released in the vicinity of the lineat roughly the pressure ratio value associated with the of symmetry at various heights move parallel to it (as ex-relevant shock wave causing the pressure rise. The up- pected from the imposed boundary conditions) but risestream influence at the line of symmetry is - 156 for up and away from the plate to form an arch-like trace atCase F and - 12.56 for Case G. For the stronger (8 x 8) the downstream end of the domain. Particles releasedinteraction, at the centerline near the trailing edge of near the fin at small values of y/6., pitch toward theIC the domain, the pressure rise is observed to reach a uni- plate and yaw toward the line of symmetry straighten-form rate. As explained later, the flow solution in this ing out as they approach it. At higher distances fromregion exhibits strange behavior, the plate, particles released near the fin pitch toward
Fig. 30 shows computed surface streamlines for the plate over the particles beneath yawing toward theboth cases. Case F exhibits a regular pattern devoid centerline. The arch-like structure formed by the par-of any line of coalescence despite the fact that the total ticles released near the centerline broadens so that thepressure rise after two shocks is roughly equal to that overall flow approaches the boundary layer flow (due toachieved with a single 8 deg fin. Outside of the region the fin) expected at large distances from the plate.close to the fin leading edge, the minimum and maxi- 7 Conclusionsmum flow turning angles are -3.7 and 17.9 degrees re-spectively. The surface streamlines for Case G form an The effect of suction on the supersonic flow pastinteresting pattern. Near the fin leading edge, surface the SFC is investigated. Two fin angles 20 deg and 8 degturning angle roughly equal the shock angle resulting are considered, both at Mach 3. The former represents ain a dense region of bunched lines. Surface streamlines strong interaction for which the existence of the vorticalat and near the line of symmetry do not display signif- structure has been previously demonstrated. The latlericant turning. Upon approaching the line of symmetry, is an incipiently separated configuration for which ex-the densely concentrated lines straighten out and move perimental data incorporating suction is available. Forparallel to the centerline. Near the trailing edge of the the 20 deg fin, bleed is applied on two regions on thedomain, the two sets of lines from either side of the line plate jointly spanning the region between the line of up-of symmetry form a node-like structure. Due to the fi- stream influence and the base of the fin. For the 8 degnite size of the grid, it is not clear if there are one or fin, the area of suction considered is roughly rectangulartwo nodes (slightly displaced from the line of symme- and covers a strip on either side of the theoretical shock
try). We believe at this time, that this structure is a foot print.numerical artifact. The overall accuracy of the solution For both interaction strengths, surface turning an-near the trailing edge of the domain is questionable (see gles are generally lower than for the equivalent no bleedbelow) since the sublayer approximation assumes uni- case. For the stronger interaction, the line of coalesenceform mass flux within the sublayer region as imposed at persists for all suction magnitudes and areas considered.the wall (zero in this case). Since the weaker interaction does not display a clear
The computed flowfields are analysed with par- line of coalescence in the absence of bleed, an equivalentticle traces as for the single fin cases. The flowfield statement cannot be made. Detailed examination of thefor Case F exhibits a simple structure as summarized flow indicates that the width of the upstream compres-in Fig. 31 which shows traces of particles released at sion fan formed by the shock wave near the plate isy16. = 0.1 and i/6. = 0.5. At the lower distance, the significantly reduced for Region I bleed, for which up-particles near the fin yaw more toward the centerline stream influence is also reduced and the rate of pressurethan those particles emanating from higher in the up- rise on the plate is higher although the total pressurestream boundary layer i.e., the spanwise displacement rise remains roughly the same. Local skin friction val-
10
I

Upstream AfterShock 1 Shock 2 Shock 3 Shock 4
Case F/Case G F/G TF/G F/G F/GMach No 2.95/2.95 2.75/2.56 2.40/2.22 2.23/1.91 2.08/1.63
1.0/1.0 1.35T1.78 1.78/2.97 2.32 4.72 2.98/7.17
Table 4: Theoretical pressure rise after shocks - Cases F and G
ues display steep increases above no bleed values. For a Boundary Layer. In British ARC CP-555, Julythe stronger interaction, the vortical structure persists. 1960.The effect of suction is to ingest particles approaching [6] A. McCabe. The Three-Dimensional Interaction ofthe bleed area without affecting the overall flow field in a Shock-Wave with a Turbulent Boundary Layer.any significant fashion. The AeronautcalQuarterl, 17:231-252, 1966.
The flow past the symmetric double fin configu-ration is computed for a weak and a strong interaction. (7] C. Law. 7ree-Dimensional ShockThe weak interaction (4 x 4 at Mach 3) displays a rel- Wave/Turbulent Boundary Layer Interactions atatively simple flow structure without the existence of Mach 6. Technical Report TR-75-0191, ARL, 1975.separation. The flow past the 8 x 8 SDFC exhibits sep- [8] H. Kubota and J. Stollery. An Experimental Studyaration upstream of the primary shock with significant of the Interaction Between a Glancing Shock Waveflow motion away from the plate. Surface flow turning and a Turbulent Boundary Layer. J. Fluid Mech.,angles exceed the inviscid shock angle. Flow traces in-dicate that particles released at the same height at the 116:431-458, 1982.upstream end of the domain form an arch-like structure [9] D. Dolling and S.M. Bogdonoff. Upstream Influ-at the downstream end with the flow near the plane of ence in Sharp Fin Induced Shock Wave Turbu-symmetry moving furthest away from the plate. lent Boundary-Layer Interactions. AIAA Journal,
21:143-145, January 1983.Acknowledgements This research was sponsored by
the Air Force Office of Scientific Research under AF [10] S. Goodwin. An Ezploratory Investigation ofGrant # 86-0266 monitored by Dr. James McMichael Sharp-Fin Induced Shock Wave/Turbulent Bound-
and Dr. Len Sakell. The authors would like to thank ary Layer Interactions at High Strengths. Master'sDr. C.C. Horstman for many helpful discussions. The thesis, Princeton University, 1984.computations described were performed at the NASA [11] B. Oskam, I. Vas, and S. Bogdonoff. An Experi-
Research Centers at Ames and Langley. The assistance mental Study of 3-D Flowfields in an Axial Cornerof the staff at both centers is gratefully acknowledged. at Mach 3. AIAA Paper 77-689, 1977.
REFERENCES [12] D. Peake. Three-Dimensional SweptShock/Turbulent Boundary Layer Separations with
[1] G. Inger. Supersonic Viscous-Inviscid Interaction Control by Air Injection. Technical Report Aero.of a Swept Ramp with a Turbulent Boundary Report No. LR-592, National Research Council -Layer. AIAA Paper 85-1669, 1985. Canada, 1976.
[2] G. Inger. Incipient Separation and Similitude [13] W. McClure and D. Dolling. Flowfield Scaling inProperties of Swept Shock/Turbulent Boundary Sharp Fin-Induced Shock Wave Turbulent Bound-Layer Interactions. AIAA Paper 86-0345, 1986. ary Layer Interaction. AIAA Paper 83-1754, 1983.
[3] R. Stalker. Spanwise Propagation of Disturbances [14] D. Knight, C. Horstman, B. Shapey, and S. Bog-in Swept Shock Wave - Boundary Layer Interac- donoff. The Flowfield Structure of the 3-D Shocktions. AIAA Paper 82-0988, 1982. Wave - Boundary Layer Interaction Generated by
[4] D. Mee and R. Stalker. Investigation of Weak a 20 Deg. Sharp Fin at Mach 3. AIAA Journal,Shock-Shock and Shock-Expansion Intersection in 25(10):1331-1337, October 1987.the Presence of a Turbulent Boundary Layer. [15] K-S. Kim and G. Settles. Skin Friction Mea-AIAA Paper 87-0549, 1987. surements by Laser Interferometry in Swept Shock
([5 A. Stanbrook. An Experimental Study of the Wave/Turbulent Boundary Layer Interactions.Glancing Interaction Between a Shock Wave and AIAA Paper 88-0497, 1988.
11
I

[16] G. Settles and H-Y. Teng. Cylindrical and Aerodynamics, AIAA Progress in Astronautics andConical Flow Regimes of Three-Dimensional Aeronautics Series, 104:297-379, 1986.Shock/Boundary-Layer Interactions. AIAA Jour- [29] S. Bogdonoff. Private Communication. Princetonnal, 1984. University, 1987.
[17] G Paynter. Current Status of Inlet Flow Prediction [30] D. Gaitonde and D. Knight. Numerical Experi-Methods. In 12th U.S.Navy Symposium on Aer- ments on the 3-D Shock Wave - Boundary Layerobal[tics, David Taylor Naval Ship Research and Interaction Generated by a Sharp Fin. AIAA Pa-Development Center, Bethesda, Maryland, May per 88-0309, 1988.1982. [31] P.J. Barnhart, L Greber, and W.R. Hingst. Glanc-
[18] R. MacCormack. Numerical Solution of the Inter- ing Shock Wave-Turbulent Boundary Layer Inter-action of a Shock Wave with a Laminar Boundary action with Boundary Layer Suction. AIAA PaperLayer. Lecture Notes in Physics, Vol. 8 Springer- 88-0308, 1988.Verlag, pp. 151-163, 1971. [32] D.J. Mee. Experiments Involving the Interactions
[19] C. Horstman and C. Hung. Computation of Three- of a Turbulent Boundary Layer with Single andDimensional Turbulent Separated Flows at Super- Intersecting Fin-Induced Swept Shock Waves andsonic Speeds. AIAA Paper 79-0002, 1979. Swept Expansion Fans. Technical Report 11/86,
I [20] D.D. Knight. A Hybrid Explicit-Implicit Numer- Department of Mechanical Engineering, Universityical Algorithm for the Three-Dimensional Com- of Queensland, Australia, 1986.pressible Navier-Stokes Equations. AIAA Journal, [33] D. Knight. A Vectorized Three-Dimensional22:1056-1063, August 1984. Navier-Stokes Code for High Speed Inlets. Tech-
[21] D.D. Knight. Calculation of Three Dimen- nical Report RU-TR-161-MAE-F, Rutgers Univer-sional Shock/Turbulent Boundary Layer Interac- sity, New Brunswick, New Jersey, 1983.tion. AIAA Journal, 12:1885-1893, December [34] N. Buleev. Theoretical Model of the Mechanism1985. of Turbulent Exchange in Fluid Flows. Technical
[22] D.D. Knight. Modelling of Three-Dimensional Report 957, AERE, Hartnell, England, 1963.Shock Wave Turbulent Boundary Layer Interac- [351 T. Cebeci and A.M.O. Smith. Analysis of Turbu-tions. Macroscopic Modelling of Turbulent Flows, lent Boundary Layers. Academic Press, 1974.Lecture Notes in Physics, 230, Springer-Verlag, pp. [36] B. York. Evaluation of the Baldwin-Lomaz Turbu-177-201, 1985. lence Model for a Class of Boundary Layer Flows.
[23] B. Baldwin and H. Lomax. Thin Layer Approxi- Master's thesis, Rutgers University, 1984.mation and Algebraic Model for Separated Flows. [37] H. Keller. Accurate Difference Methods for Nonlin-AIAA Paper 78-257, 1978. ear Two-Point Boundary Value Problems. SIAM
[24] W. Jones and B. Launder. The Prediction of Lam- J. Numerical Analysis, 11:305-320, 1974.inarisation with a Two-Equation Model of Turbu- [38] D.D. Knight. Improved Calculation of High Speedlence. Int. J. Heat and Mass Transfer, 15:301-304, Inlet Flows - Part I: Numerical Algorithm. AIAA1972. Journal, 19:34-41, January 1981.
[25] D. Knight, C. Horstman, R. Ruderich, M-F. Mao, [39] R. MacCormack. Numerical Solution of the Inter-and S. Bogdonoff. Supersonic Turbulent Flow Past action of a Shock Wave with a Laminar Boundarya 3-D Swept Compression Corner at Mach 3. AIAA Layer. Lecture Notes in Physics, 8:151-163, 1971.Paper 8 7-0551, 1987. [40] D. Gaitonde. Numerical Investigation of Some
[26] D. Knight, D. Raufer, C. Horstman, A. Ketchum, Control Methods for 3-D Turbulent Interactionsand S. Bogdonoff. Supersonic Turbulent Flow Past due to Sharp Fins. PhD thesis, Mechanical anda Swept Compression Corner. AIAA Paper 88- Aerospace Engineering, Rutgers University, Jan-0310, 1988. uary 1989 (expected).
[271 K. Token. Heat Transfer Due to Shock [41] D. Raufer. The Development of a 3-D ParticleWave/Turbulent Boundary Layer Interactions in Tracing Algorithm and its Application to the StudyHigh Speed Weapons Systems. Technical Re- of Swept Compression Corner Boundary Layer In-port TR-74-77, AFFDL, 1974. teractions. Master's thesis, Rutgers University, De-
[28] G. Settles and D. Dolling. Swept Shock Wave cember 1987.Boundary-Layer Interactions. Tactical Missile
12
I
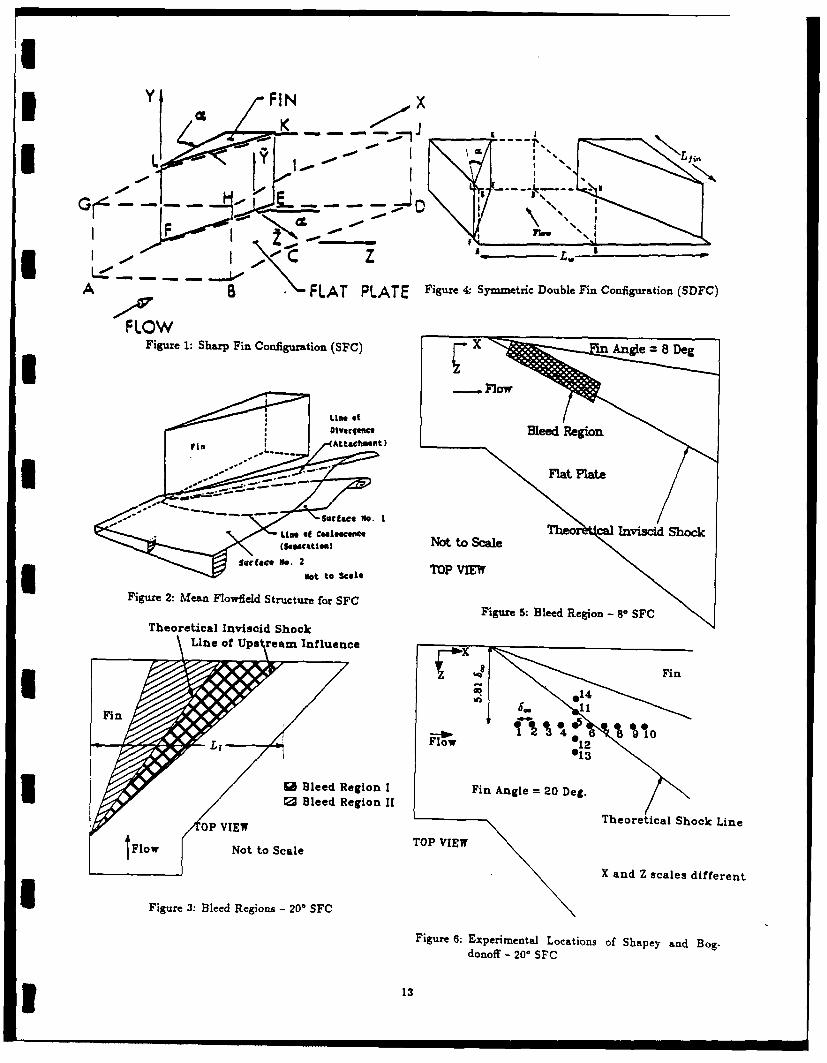
y C FIN x
L Y "Ki
F 3%H - IC -
- A BFLAT PLATE Figure 4: SYmmetric Double Fin Configuration (SDFC)
FLOWFigure 1: Sharp Fin Configuration (SFC) Anl8De
Fgr5:Bleed Region 8 F
rin AttctmFin
6.cac No. I
LiFlo ofcaecs 1: nicdSw
Bleedaia Regio Io Finale 20D.
Flowcme Not to cale TPVE
Figure~~~ and Zea scalesel dirutuerent
~Figure : Bleed Region - 8o~ SFC
Figureica 6:isi ESehenocoatokofSae adBgLine~~do
of of 20s a InlFCeJ
i
3 133

LEGEND LEGENDS Case A ! Cas A
I .__ ~......... N kI _ _ _ .. ......[ ExperinA IExpefiiU : a Experiment
I '0
0 .0- o'. 0.8 1.2 1;. ' 2'.0 0.0 0.4 0.8 L. 1'.0 2.0o(a) P,/Pp. R (a) P./P.
l I LEGEND' l ILEGEND |!Case A
• , •Case A ,1I..... .em.. .........
aCal
0. 0 0.6 1 1 -5.0 10. 05.0 40.0 55.0 70.0-5.0 1.0 5.0 .40.0 55.0 70.0 (b) Yaw angle (Deg)
(b) Yaw angle (Deg) Fig-tre 9: Pitot pressure and Yaw Angles - Station 8 (200
Figure 7: Pitot pressure ad Yaw Angles - Station 3 (20* 'R SFC)
(a) LEGEND GEN
LEGENDCsase A A
_* CaseA._ a Case,-,B 1ai Case C
ai n C si- a Experiment
5 0E
-7.5 -4.4 -1.7 1.2 4.1 7.0
-. 0 0.0.8. 4.0 8.0 7.0(bYaagl(D)(b) " Yawange (eg ,.,- e 9'.itt prss(r an Yaw Angls-Stio8(2
F e P/P p Figure 10: Surface pressure -Y a/to0 5 (20' SFCNLEGEND
LEEN Casoe A a
' • .' ... . Pas .. ......... , LEGENDI / Ca-e Aas Aase
ExperimCe EtC ease n
3" N """,
-5.0 10.0 25.0 40.0 5i.o 7 .o ..M0 Yaw angle (Deg) 6-.0 42 - . - .2 .0
Figure 8: Pitot pressure and Yaw Angles - Station 5 (20- (x - x ) /6SFC) Figure 1: Skin Friction Coeffcient z/ 5 (20* SFC)
. I mIII
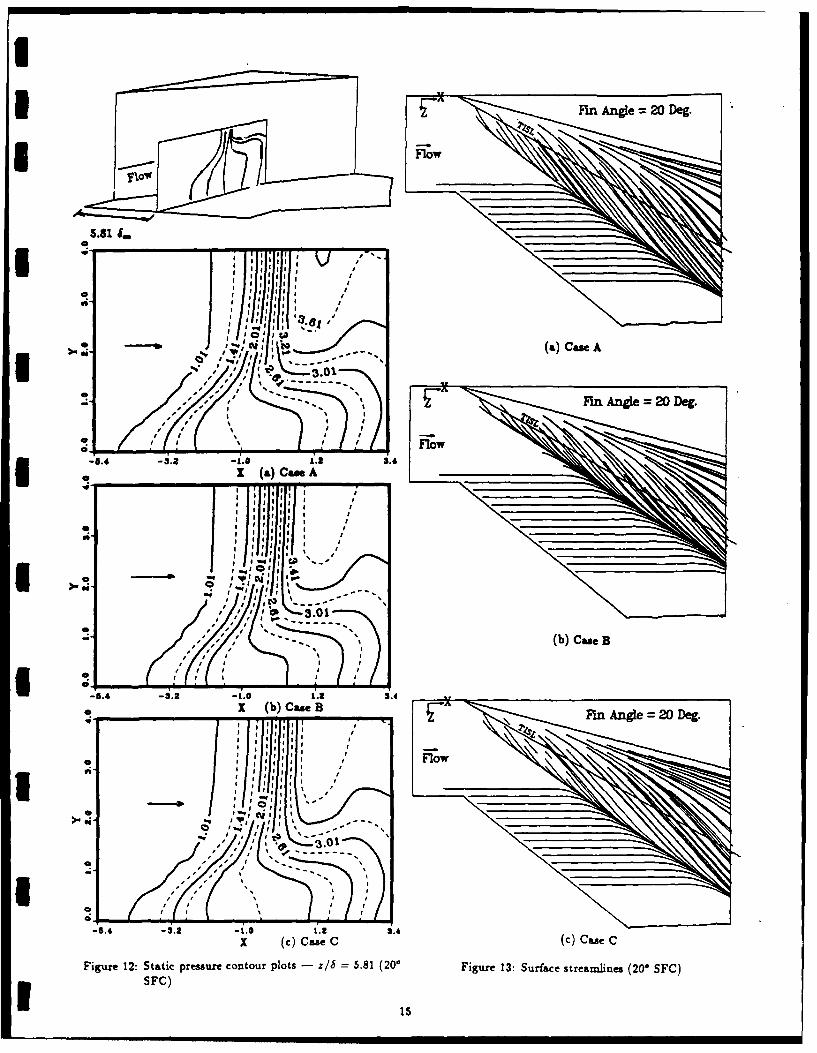
Fln Angle =20 Deg.
5.81s6.
- , ~(a) Case A
0 XK (a) Caoe A
.C.
oe*
~ 1K'; ~ - - -(b) Case B
-. -3. 3.4.0
-1.01
:115
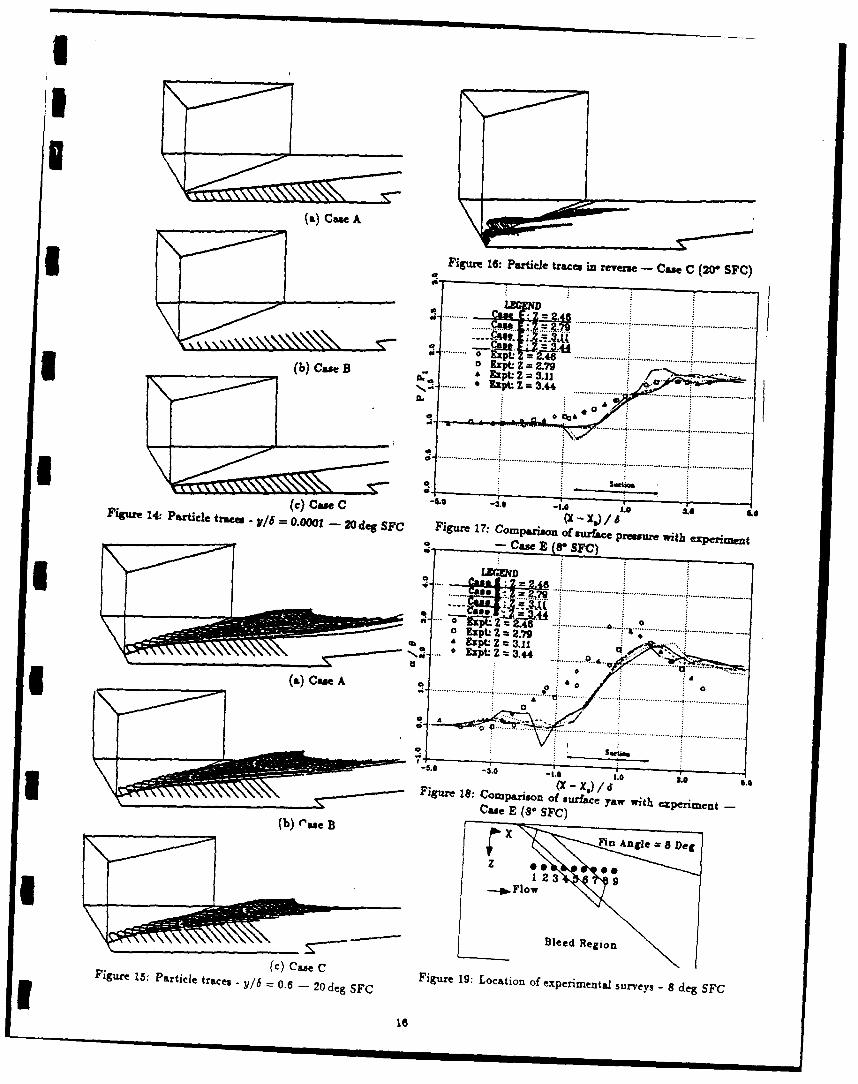
go Figure : Particle trace in reverse - Case C (200 SFC)
(baCseB 3.g
. . . . . . . . . . . . . . . . . . . ............... .......
. .............
(c) aseC 4 -1 Xd6 10 &Fig re14:Patice raes t/ 0.00 - 0 egSFC Fi ure27 C mpais n o g r~c p es urewih e
..~
30 . . .. . . . .. ................................... ..... ..
0A(c) Ca...C-....-..0 . .0....
oL Ext.2.79
-5.0~ - 3. 14 .
(X - X.) /eFigure 18: Comaparison~ of Ourface yaw with experiment-Case E (8- SFC)
(b) rae B XFin Angle = 8 Deez 91 2
-. Flow
Bleed Region
(c) Case CrFigure 15: Particle trac~es .y/b 0.6 - 20 deg SFC 16Figure 19: Location of experimental surveys - 8 deg SFC

U3.0- 0. 1.j0 jj0Station~~St 12
2.0- t
2. =xt
1.0- a=St
Station 1 2 3 4 5 6 7 8 9
Ya nlse)Figure 2 1: Comparison of yawo aressle with experient - 8 deg SFC Pa
3-1001 0
2.-CI
. 0 Suctio
Figur 22:gEfet onsuaeg preure computed)fywanl it xermn - 8 deg F
SFC F0ur 230Sufae tra70ne--Cae3-(10FC
IF 17PX nge 8Dg
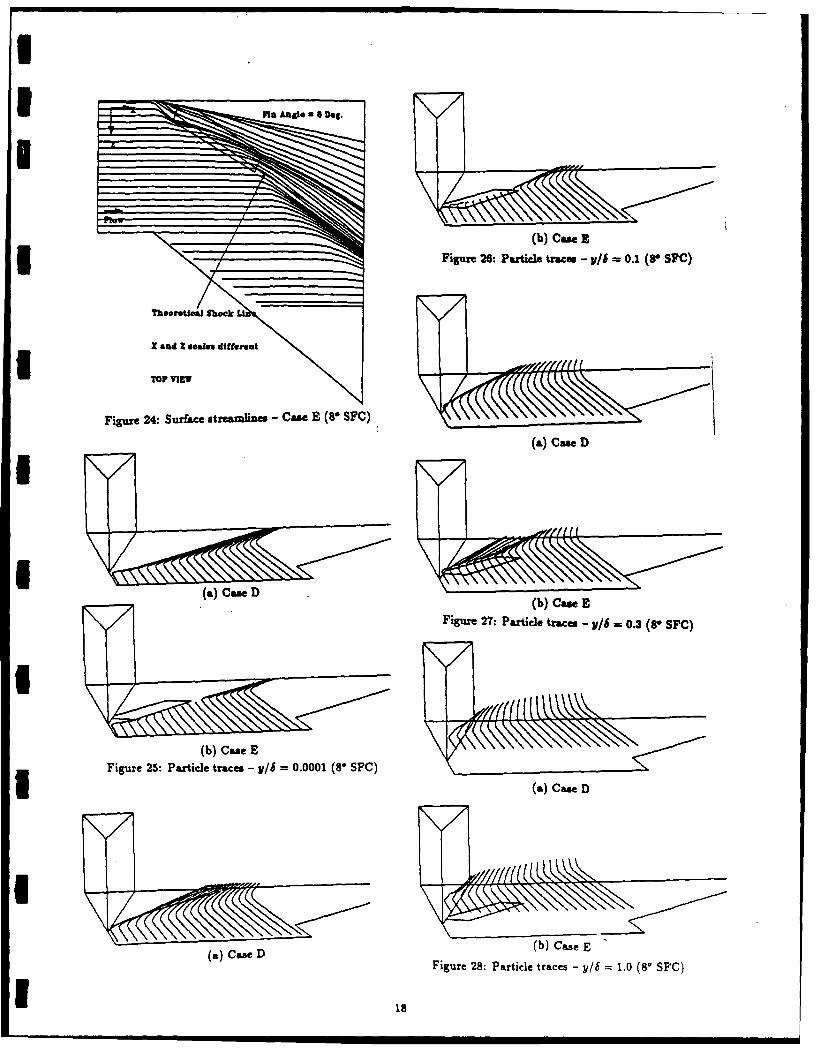
III
I
(b) Case RI Figure 26: Particle trm - V/S = 0.1 (8 SFC)
Theoretical Shock
X and Z scale different
U TOP VIXW
Figure 24: Surface tremlins - Cace E (8 SFC)
(a) Case D
(a Cam D (b) Cas E.
Figure 27: Particle traces - /S 0.3 (S SFC)
(b) Came EFigure 25: Particle traces - y/ 0.0001 (8* SFC)
(a) Case D
(a) Case D (b) Case EFigure 28: Particle traces - y/= 1.0 (80 SFC)
1 18II I I l
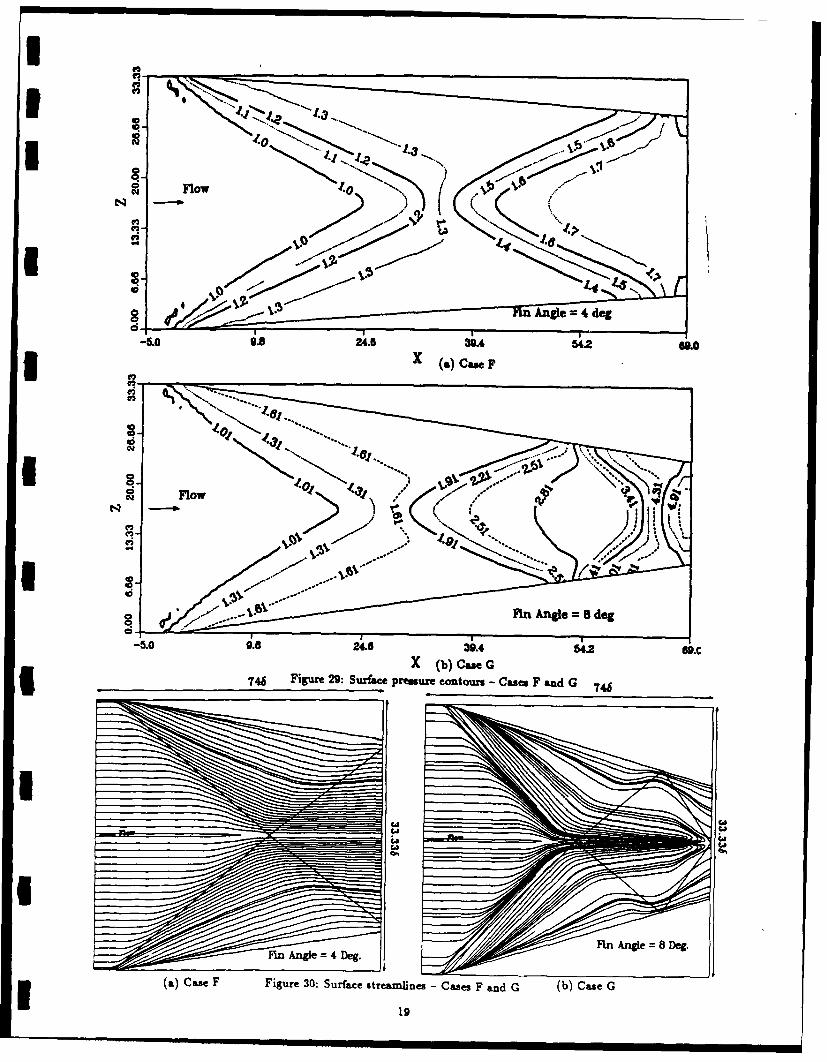
U0Flow .>4
.16.
on Ange 8deg
-5.0 9.81 24.6 39.4 54,2 69.0
0.1 N....,..X (b) CaseFG
n Angle =8 dog.
(a) Case4F Figure : Surface reluectus - Case F and G ()Cs
U ____19
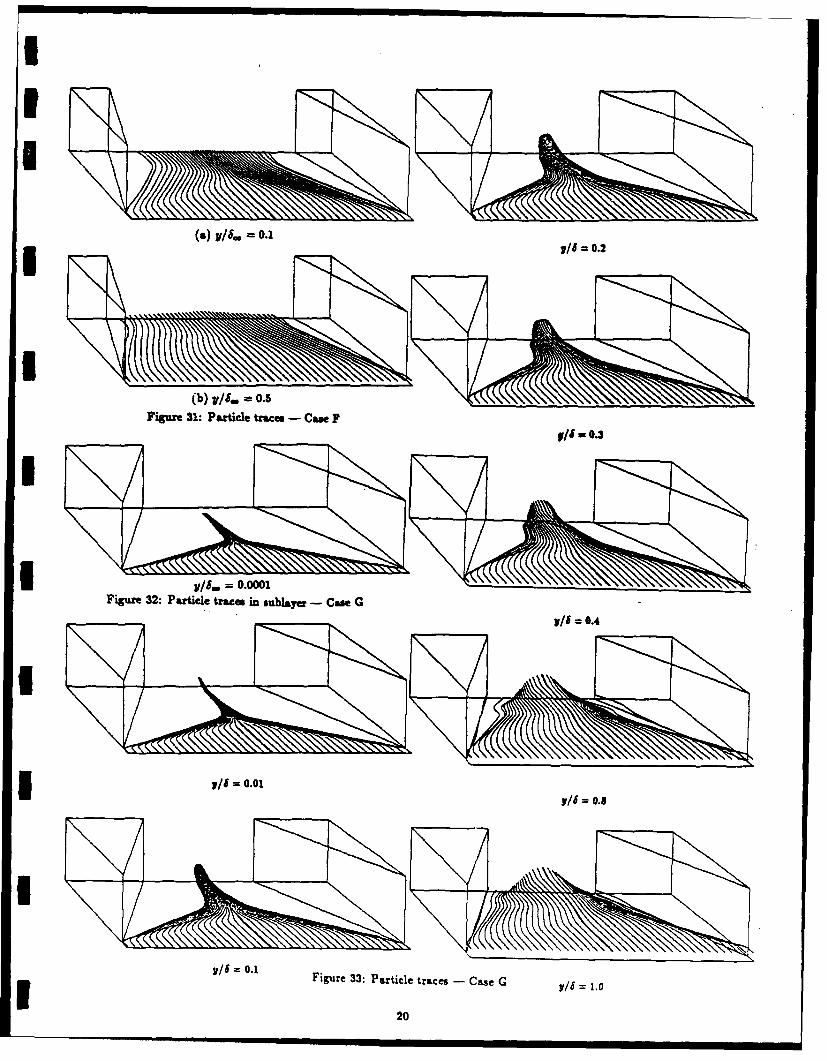
(a) V/6. -0.1
Figure 31: Particle traces - Case F
Figure 32: Particle traces in sublayer - Case G
I = 0.01 y/ 0.8
/I .1Figure 33: Particle traces - Case G =/ 1.0
1 20

Viscous/Inviscid Effects in 3-D Shock Wave-
Turbulent Boundary Layer Interactions
N.Narayanswasnit D.D.Ki~aghtlDepartment of Mechanical and Aerospace Engineering
Rutgers University, Piscataway, NJ 08855.
AbilractSignificant progress has beeni madle in the understandingof 3-D turbulent interactions in the past few years. lnter-
Adetailed analysis of viacous and iaviscid, effects in actions genert"d by dimensionless geomietries like sharp3-D shock wave - turbulent boundary layer interactions Ans (Fig.1) and swept compression corner (Fig.2) havehas been carried out, focussing on the (a,A)= (24,40*) been studied extensively using experimental techniques,swept compression corner configuration at Re.., =8.1 x101 numerical Bow simulation and analytical methods.and the a =20 sharp In configuration at )t4_ =9.0x 10⁶.Two Lowlelda, computed using different turbulence mod- Recent experimental investigations of 3-D turbulentels, awe analysed for each configuration. The mean hi- interactions for simplified geometries like sharp and bluntaetic energy equation is integrated along streamlines orig- Ans and swept compression corners have beeni carried outIinating at various y/5. locations within and outside the by a number of researchers. Experiments dealing withboundary layer and a quantitative comparison is made of surface and boundary layer measurements have been con-the contribution to the mea kinetic energy by invisaid ducted by McCabe 1 11, Law 121, Korkegi [31, Peak (4],and viscous terms in the equation. Also, the term are Kusaoy et &1 [31, Kubota and Stollery 16], Os at.quantitatively compared at points on I -s planes (normal (7,81, Dolling and Bogdono(f (9,101, McClure and Doilingto the streamwise direction) for the sharp An interaction f1111 and Settles ei s1 (12,13,14,15,16].
adat points lying on j s planes (along the streamwisedirection) for the swept compression corner interaction. Analytical studies of 3-D interactions have been madeThe results indicate that the interactions for both geome- by Myring [171, Stalker [18,19], Iuger [20,21,22] and bytries are governed primarily by invisoid (pressure) cects. Mee and Stalker (23).Viscous influence, although not of the same mnagnitude asthe inviscid elfects, is found to be significant in regions Numerical simulations using the 3-D mean comn-both near and away from the surface of the geometry and preasible Reynolds averaged Navier - Stokes equations havenot restricted to the 'viscous sublayer' region within the focussed on similar dimensionless geometries. Swept comn-boundary layer. pression corner and sharp fin generated interactions have
been studied by Hung and MacCormack [24,U5], HoratmanIntrducionand Hung [27], Horstman [28,29] and Knight [30,31,32,33].
The computations of Knight employ the Baldwin.Loaa
The problem of 3-D shock wave - turbulent bound- algebraic turbulent eddy viscosity model [36] and thoses7 layer interactions ( 3-D turbulent interactions ) oc- of Horstman incorporate the Jones-Launder (k - c) twocurs in a variety of high Mach number Rlows. Some of equation model (371 or Cebici-Smith model (381. Thes"the practical applications in which this phenomenon is computations have been. validated by comparison with en-encountered include high speed aircraft inlets and com- peziments and have been found to be in good agreement
preses, wing-body junctures and control sufcs The~ with measured values of pitot and static pressure profilescomplexity of such vicu-nicdinteractions is due to in the boundary layer, surface pressure and yaw anglesnion-inearity, compressibility effects and high gradients of [343J1flow variables, besides the difficulty arising from three-dimensionality and turbulence. The interactions awe gov- The interactions are found to be dominated by a largeerned in each ce by the freestream Mach number Mf. vortical structure (Figs. 5 and 6), in agreement with thethe Reynolds number Res. based upon the boundary lae dowfield models proposed by Token [40] and and KubotaIthickness i.., the wall thermal conditions and the geome- and Stollery [6].- Besides, the computations of Knight andtry generating the interaction. Horutman, although employing two different turbulence
models, show close agreement for both sharp An and sweptcompression corner interactions, displaying modest differ-
t Gzdes Stdet Stda Utzab ences only in a small fraction of the boundary layer ad.Filee AsemeUb AJAA jac-ent to the surface. The iseseistivity of the flowfield to
the turbulence model. employed irn the computasons a%,-geata that the flowilU is primarily rotational and mnisacid
with vscous influenice beng limited to repoas very close
to the wall or ufs.

hn order to veri this conjecture mad to further under- Governing Equation for Meanstad the dynamics of the interactions, the present study Kinetic Energyais at making a Vmantative comparison of inviscid and
viscous influence in the flow. Attention he. been focussed The mean kinetic energy equation along a stream~lineon the terms in the mea kinetic energy equation (chosen may be written as follows:for simplicity ad as a At step in this quantitative anal- D +l ~ __ysis) end a computer code has been developed to analyse Vi 2" ~ Ari hthe contuibutions to the rate of change of mea kinetic Here, juis, is the mean kinetic energy per unit mass.energy by both inviscid and viscous term, along stream- The D/Dt operator denotes the Particle derivative or thelines in the flov. In particular, this cod ha enue Substantial Derivative. p denotes the density of the fluid,to analyse the 4-D turbulent interactions generated by a pi h rsueadx i123 eoe h oriaeI s~~wept compression corner end ILaltivy siia pi- the prssr and s.(~,)dnte h oriaeteraction generated by a sharp fin geometry. Both porn- zyadatries chosmn are 'd-mensouess' and the interactions in the rij is the stress tensor (laminar + turbulent) sad is giventwo cases involve simlar incomin flow chacteristics and by the relation:pressure rise (shock strengths). Iq+CV-I .+(6+C(n
Computation of Plowfields where,The flowflelds for the sharp Ain end swept compres- ii=,.
sion corne interactions analysed in the present study havebeen computed by Knight [30,311 ad Geitonde [411 end e is the algebraic turbulent eddy viscosity given by theseparael by ROretman [28,2"1. The mea wPress turbulence =odel employed, ii is the velocity vector and pible Navies- Stokes equations coupled with the Baldwin- is the molecular dynamic viscosity obtained using Suther-Loaxe algebraic turbulent eddy viscosity model (Knight lend's law.and Geitonde) or the Jones-Launder ( - g) two equation The equations above are written in the Einstein suMEMa-I model (Horstman), form the basis of these computations. tion convention.The co)de employed by Knight uses an efficient hybrid Integration of the mean kinetic energy equation yield.:ezplicit-iznplicit algorithm (301 for solution of the govern.ing equations. The implicit algorithm is the Box Schemeof Keller (391, which is applied to the asymptotic form 1 1 + j f tj d..of the Navier-Stokes equations in the very thin 'viscous- + P Ox J + jsublayer' region of the boundary layer. The flowficld in where,the region outside the sublayer is computed using the ex- jas Ia.# denotes the mean kinetic energy at the startingplicit finite-difference algorithm of MacCormack [25,261. point at streamline fmr the fluid partcle. 'V' denotes theThe computations incorporate a body-fitted coordinate magnitude of the resultant velocity vector at the locationtransformation to permit the treatment of flow regions of of the fluid partcle sad 'ds' is the infinitesimal arclengtharbitrary shapes ad the code has been vectorised for ef- aogtesraUficient computation on vector processing supercomputers The rate of change of mean kinetic energy per Unit MAsslike the CYBER-205 and ETA-b., The code employed by i fetdb w itnttrsHorstman uses an explicit finite-difference scheme for the The afieted term -( sinc t)pOz ents: teiveido rcomputations. Tefrttr eoe h nicdo rs
The present study involves the eamination of the fol ?comie vsuantbltsthes effctcB follwi~ng hlowig dofieds i det: apartclealong a streamline and simultaneously integrat-
ing the-ean ener gMy equation along the path, the(&,A-(2*,4V Swpt omerat ej. S.IIOI magnitudes of the inviscid contribution and viscous con-
(4 and I. = 0.) i corerlx tribution to kinetic energy aft quantitatively compard.
(Flowfleld No.1: Computed using the Beidwin-Lomax It is also useful to consider the folowing two Soaps ofmodel, ad Floufleld No.2: Computed using the Jones. terms:Launder model).
2. a =20, Sharp fin at Req0 =9.0x1O', U#_=3 and S. 2 Pum n ft + P *0.5 inch. 2. !xi. Id,., + f j O.Pdo
(nddFlowfield No.: Computed using the adwn-s The firt group denotes the mea kinetic eneWp o..
m oude, and oeld gai.ed Co p t d s n t e J ne - inc ud ng both the invi cid(pv e.urv) snd eke Y".Laundr moel).cous mntegvs~ end the second group denotes the mean
kinetic enevpy obtained b, including only the pwwuure inte-
2
grafsiS The groups 1 ad 2 wfe simultaneously computed Resuilts*along the path of a particle (along the streamline) and (a,A)=(240,400) Swept Compression Corner
compared with each other. A good agreement between the Re#. = 8.14 06two results indicates that the dynamics along the stream-
line are governed principally by the invwcipreusure) d- The swept compression corner geometry and the comn-
fects, while a significant disagreement between, the two putational domain are shown in Figs.2 and 4. The shock
indicates that both presure snd viscos effects ialence generated by the presence of the swept corner interactswith the incoming turbulent boundary layer on the BAm
the flow along the streamline. Various streamlines (for plate and causes separation of the Low. The computationparticles starting at different pois in the Low) are in- of the flowfleld incorporates the same incoming flow condi-vestigated in this manner and the results analysed to ver- tions as the experiments conducted for thia configuration
ity the original conjecture about the principally rotational at the high Reynolds number wind tunnel at the Prince.
and inviacidl nature of the Gowletd. ton Gas Dynamics Laboratory. The experimesita involveda Mach numbe of 3, a total pressure of 690 kPa * 1.3%,a total temperature ot 265.4 deg IC * 1.6% , near adia-
Comptatona scemeforbatic surface temperature and a incoming 2-D turbulentComptatinal diem forboundary layer which has been studied and observed to
the mechanical eneWu equation satisfy the Law of the Wall and Wake [431. The molecular
Both the swept compressiou corner and the ahsd and turbulent Prandtl numbers are 0.72 and 0.9, respec-I geometries invle non-uniform jrid, in the 'physical' do- tively. The incoming turbulent bounday layer is a 'thick'
mains of the Bow. As mentioned earlier, in computing the layer of a height 5,. = 0.5 inch. Newe, 5.. rters to the
flowlielda, a body-fitted coordinate transformation is use height of the boundary layer at the corner line (where the
to permit treatment of these non-uniform regions. In a compression ramp meets the fAt plate), in the absence of
similar manner, the evaluation of the path integral (of the the ramp.
mean kinetic energy equation) involves the transformation Fiwwfeld No.1: 04ldtiin-Locn Turkdowae Modelof the non-uniform 'physical' grid, denoted by the (zys)coordinate system to a uniform 'computational' grid de, In order to study individual particles in the Rlow, stream-noted by the (,)coordinate system. The derivative lines were traced by releasing particles at fixed y/1.. loca-
terms in the equation are then approximated by second- tions near the upstream end of the flowfield. 10 particlesorder accurate finite-differences. The particle tracing is were released at every y/5.. location, spaced evenly in theaccomplished by an algorithm developed by Raufer[42), a-direction, between the minimum and maximums valueswhich involves location of the particle within a particlar of the grid at that location. Partcle trace for y=0.026.,'cell' of the grid, interpolation of the velocity terms at 0.036., 0.246. and 0.55,. are shown in ig.?'. The parti-the particle position and 'moremento the particle using cles released at y=0.026.. and y=0.054. are observed to
the interpolated velocities. This particle tracing code has get entrained into the vortical structure at the base of thebeen used to study the Lowfield structure of the (a, A)= compression corne and those starting at y= 0.25.. and(24,40r) swept compression corner interation 135j. The y=0.558. continue over the vortex and up the compres-meant kinetic energy equation is integrated simultaneously sion ramp.with each movement of the particle. The inviscid(pressure) The streamlines may be numbered 1 through 10, start-and viscous (laminar~iturbulent) contributions to the rate ing from the one nearest to the symmetry boundary of theof change of mean kinetic energy are computed at the par. domain. The AM streamline among these is chosen as atide position in the folowing steps: 'typical' streamline for study, for each of the four y/5.
(starting) locations. In ~S. 6-11, the kinetic energy1. Location of the particle in the unifrm (computational) evaluated by interpolating the velocities &rom the com-grid (using the particle tracing algorithm) puted ftowfield and that obtained by computing the path2. Evaluation of the inviscid and viscous terms of the integral (right hand side of the integrated mean kineticmean kinetic energy equation at the 'cell' corner* using energy equation) are shown for each ylS.. (starting) cane.finite-difirences. The results for the y. 0.025.. ,y=0.056. and y=0.341.3. Linear interpolation of these values at the particle po. can have been presented in an earlier paper [351, butIsition and are described again here for comparison with the results4. Integration of the inicid and viscous term (at the for the flowleld obtained using the different turbulenceparticle position) using simple trapesoidal method. model (Flowfield No.2). The kinetic energy profiles are
in close agreement, and the difierences in the two resultsis attributable to the truncation erors involved in theschemes employed in computing both the path integral aswell of the flowleld itselL For the streamlines originatingat y=0.26.. and y=0.55$., however, the difference in thetwo values of kinetic energy is approximately 15% in each
3
case. The reason for this erot is being investigated. The grand. The kinetic energy va.lues obtained by dowfield in-*kinetic energy, in each of the cases, rems ns unaffected terpolation and by the total path integral, although close,
till the start of the interaction, when the adverse pressure differ by about 10-15% on a-rerage. This error may begradient encountered in the region of the shock coupled attributed to the coarseness of the grid and the resultingwith viscous influence causes a sharp decline in the energy truncation errors in the computation of both the Sowfield
of the particle. The drop in energy stops at the end of the and the path integral. Consequently, no definite conclu-interaction, after which it reaiches a near asymptotic value. sion can be reached about the nature of the dow from
For the same streamline discussed above, the mean these results. It can however be noted that the path inte-
kinetic energy obtained by including both the pressure gral obtained using the inviacid term alone approuimnatesand the viscous integrnnds is compared to that obtained reasonably well, the total path integral in each of the fourby the path integral involving only the pressure integrand. came. Also, the viscous influtence is partcularly sigaid.
(i.e) the term cant for the streamline originating A y = 0.24,..
)U.,S 1i., + J-(UW/,)Sp/a*(#) +1 (VJ.P)Pr,/SSM2a hm m(e- .) ois comparedo the term jj 1.m+ J-(zp)ap/u.j(V) 30Shr nsR 4 ,= O
The first term is referre tos " KZ -P4At Integral in The sharp ain geometry and the computational do..the plats a" the second term, as A.5 P4t& Integr4 alI main, are shown in Figs. I and 3. Rere spain, the gener-uiscid Intsdrand For the y=0.020. came, the two values ated shock wave interacts with * thick' incoming bound-differ considerably, indicating that "et iuiised sad vm-. sq layer on the flA plate (S.= 0.5 inch), where S. is thecaw5 @&fCis eve Sigwifteaid for "ha Svesslises. Similar height of the boundary layer A the location at the apezI results are observed for the other nine streamlines orig- of the fin, in the abosec of the A.mnating at y=0.026.. For the 7=0.05. case, the two The computations of the flowfleld incorporate the in-
values are reasonably close and it can be inerred tha doe Bow conditions for the experiments on the 20, sharp finprsuww (inuiseid) insjheme is 4ansagaf for the stream- case at the Princeton Gas Dynamics Laboratory. Theline. Similar results are again observe for the other experiments involve non~al freetreaim Mach number ofstreamlines originating fromt the same y. lots -on. It is to 2.93, a total pressure of 680 kPa h 1% , a total temper-be noted here, that in both the y=0.026,. and y=0.0540. ature of 251 deg K + 5%, near adiabatic wall conditionscases, the particles get trapped deep within the vortical and a 2-D 'thick' incoming equilibrium boundary layer
stutr.Yet, viscous influence is more significant for the which has been thoroughaly investigated and observed toformerthntelteca.Teposfrtey02.ad ftteLwoWalad amy=0.36. sralnsso an increasing dominance of theinviscid effect on the mean kinetic energy. As remke Flowficld No.1: BaUvin-Loma Turbulence modelbefore, these particles do not get trapped within the vor- An analysis smlrto that for the swept compressiontical structure of the interaction, but continue over it and corner case is carried out for this interaction. 10 parti.al ong the ramp. The remaining nine streamlines in each cles spaced evenly between the minimumt and maximumcase exhibit similar behavior se the 'typical' streamline 4s' values of the doma upstream of the leading edge ofexamined for the two cases. the fin wre released a different y/f. locations near the
upstream boundary. Again, the %9'Mistreamline is cho-The relative importance of the viscous effct foe sen for study for each of the y-levels. The streamline for
the streamlines originating at y--0.028. and y=0.050.. is particles, released at y=0.020. ,y=0.038., y=0.24.. adalso evident from the profilet of the kinetic energy obtained y=0.56.. are shown in Fig.18. In all the four cases, theusing only the viscous integrand (refered to as 1.5 -Path streamlines are observed to get wrapped up into the vor-Inlegral, Vuscou Itlernt in the plots tical structure emanating from near the leading edge of
the fin. Figs.19-22 show the comparison between a) themean kinetic energy obtained by interpolation of the con.
FlowzeldNo.2: Zne.a-Usnde,' Torbuence Mod.' puted dowfield b) the path integral for the streamline c)the path integral involving only ins inviscid term and d)
A similar analysis is carried out foe this flowfield and the path integral involving only the viscous term, for eachthe nma kinetic energy evaluated for streamlines orig- came. The interpolated and integrated values of kinetic en-inating at y=G.02 5 ., 0.0M5., 0.25.. and 0.55.. Again, ergy agree quite closely in the fou case, and differencesthe fifth streamline from the symmetry boundary of the in the two values are attributable to the truncation errorsdomakin is chosen aw the 'typical' streamline for study. in the numerical schemes. The y=0.028.. came showsaPigs.12 and 16 show the streamlines for the particles drop in the kinetic energy at the start of the interactionoriginating at the four different y -locations. The stream- but a subsequent rise in the energy to a level above theline, are similar to that obtained fog the different Cases for value at the upstream (starting) position of the particle.Flowfield No.1. Figls-13S1 and 16-17 show a compairison i.e., the particle is 'accelerated' by the influence of the in-between thes kinetic energy obtained by a) interpolating viscid/'viscous terms. The y= 0 .050.. exhibits a similar bo.the flowfleld, b) by the path integral, c) by the path in- havior of acceleration of the particle along the streamline.
by the path integral obtained with only the viscous inte- cr57 drops at the start of the interaction and reachestga obandwtanyteivsditgadadd o h =.5.ady05. aetema iei n

near ayamptotic value thereafter. Planewise examination of in ~iscid and
It is also observed that the results obtained by comput- icu nlec ntefo
ing the full path integral (b) and the path integral involv- Case It 30' Sharp Fin InteractionI ing only the invisaid inteprand (c) differ significantly forthe streamlines starting at y=0.025.. and y=0.036.. Also, In order to identify regions of inviscid and viscous in-similar behavior is exhibited by the other nine Stream- fluence in the flow, the pressure term -(s/)p/x andlines ia the two cases. It can therefore be concluded that the viscous term (vj/p)&vn/8x1 are computed at meshbetA iaviscid and viscous effects ore aignijlcond for these ponts on M - Z planes at different 'Z/$.' locations in theStreamlines. lw
For the y=0.28. and y=0.55. cases, the path integral flwinvolving the pressure term alone, is a reasonable approx- Thfolwnaayssru tte ofedgnrtdIimation to the mea kinetic energ of the particle, iadi- uithe folowin an algueraito thebuletedy viscatecating that doe 19M sow themse "Ms is lev e uing thdel (Flowfield o.. algebrasho th mntud v ofepriiscipatig bg inswascid (pressuu) electso. Similar results th prssr and viscous term in the form of contour plotsare obtained for the other nine streenhs originating aA on the I - s plane at the location x= 156., downstreamthese two y/1.. locations, of the leading edge of the An. The minimuma s/S. value of
Figs.23 and 24 show the magnitudes of the inviscid 0.0 corresponds to a point 0.006. away from the surface(prssue) ontibuionto est kieti cargy(i-), of the Ain in the s-direction. The ainimum y/S. value of
(pressure) vicou contribution to meankiei r (e) 0.0 also corresponds to a point 0.015.. above the surface of
kinetic energy (i.e), . ipvb~# flor the 'lfth' stream- the plate. The mamimum value ofy is 2.0A.. The I and slines starting at the levels y=0.026. and y=0.034.. The musaedntda utpe f5 ohpesr nheight at the particles (froms the surface of the fA" plate) viscous term values, -(Ni/ppOst and (Ud/P)&rdf/Ojare also shown as a function of arclength. The inviacid are nomaLised by the mszzmum(abeolute) value of in-and viscous terms have been normalised by the value of viscid/viscous contribution terms on the particular I- s
the eankinticenegy t te ustram statin) lca. plane. Also as observed firomt the plot of 'pressure con-Itions of the particles. It is observed that viscous influence tus ttesm oain h rsuermdet hcontinues to remain significant even as the particle moves shock is distributed within the boundary layer and form,away from the wall, contrary to the origiali hypothesis a 'A' shapied region.that a 'decrease' in the viscous effect should be observed Acoprsnfthcnouplsofheiicdadas the distance of the particle from the wall incoraisnofteeotorpltsoehesv.cd nThis indicates L444 Luere ersat Mrn in th flo, art viscous contributions (A and B) and pressure (C) showsfrom regions adject to the plate ourjtec, whr th i. that the inviscid influence is concentrated only towards
teratio is it~f~anly iscos i Matre.the freestream side of the 'A' shaped shock structure, al-though the pressure rise continues upto the Un surface.
Flowfield Mo.2* jolnes-Zguwale, Me&I The region of viscous influence is sigificandy An@g as isFlg.25 shows the streamlines for particles released at evident from plot B and lies to the left of the region of
Y= 0.027J., 0.056. 0.21. and 0.55.. The streamlines maximum anvisaid influence. The reason for the concen-are similar to that obtained for the corresponding cases trof h ivsi nlec oarstehesrasdfor Flowfield No.1. As beforce, the 'fifth' streamline from of thshock' region, becomes evident when the inviscid
the ymmtrybouna~yis hose fo stdy i eah cse. (pressure) term -(uj/p)p18xj is exmamned more closely.symmetry boshowdthe kin ciseng fompstdy: in- Since the term involves both the directions and magni.
tg.26-27tsho the kinectics f rom putw f ed yva)uen- tudes of velocity and the pressure gradient, the two may2tepatintegvelote 3) the nowgra fie vales be combining in a way so as to result in an almost zero'
2)~ ~ ~ ~ ~ ~ ~~~* th ahitgal )tept ntga novn only iuviscd effect in the area between the observed region ofthe inviscid inteprand and d) the path integral involving
onlythevisousintgred, or te M steamineon~p*- concentrated inviscid influence and the Ain surface. Plot Dnlyn t viscous itand, fOrU The kinestreane values shows the direction of the velocity vectors on the plane as
obtained by interpolation and by the path integral are obevdfmthapxftefi.Te ulnkeocisreasonable close. The kinetic energy profile obtained by at the points on this plane are obtained firom, the velocityIemploying the the invisdid term alone provides a good ap- components tangential to a ray drawn from the apex toproximation to the value obtained by the ful path integral each grid point on the plane.in both cases. The other nine streamlines in each case ex- .The orientation of the velocity vectors clearly indicateshibit similar behavior and it can thus be concluded that the presence of the vortical structure and the rotationalthe dynamics of the interaction along these streamlines nature of the flow. In the region between a ficticious 'cen-are governed primarily by inviocidffreassve) effect.. The ter' of the vortical structure and the fin surface, the flow iscomputations for the y= 0.025,. and 0.0551. cases did not obset wed to be going 'down', towards the plate. It is to beyield a good agreement between the interpolated and path noted that at each mesh point on the yes plane, a compo.Iintegral values owing to large truncation erro in the nu- nent of velocity along the ray drawn from the apex of themerical schemes and the results for these streamlines are Rn to the grid point, exists, but is not represented in thehence not presented here.
3

I/
diagram It is conjectured that the term (see contours of'invisd term') is concentrated towardsbecomes nearly zero in this region due the fact that the the upstream side of the 'A' shock structure. As in thedirections of the velocity components are normal to that cue of the sharp fin interaction, the 'szro' inviscid infiu-o the corresponding pressure gradients in this region. ence to the lef of this region maybe due to the orien-Similr results ae obtained f or the other I-z planes anal. tation of the veloaty components and the correspondingysed as other a/$.a location in the Rlow. The region of pressure gradLients (in the 'inviscid' term) in this region.
viscous icauence is significant in each of the othe s cs, Also, a significantly viscous region lies between the regionas observed earlier for the z= 15$. plane and always lies of maximum inviscid influence and the compression rampto the immedate left of the region of concentrated invs- surface. This structure is in very close agreement withcid influence in the flow. that observed for the sharp fin configuration. The 'polar
velocity vector' plot represents the resultant velocities ofThe maximum absolute value of the viscous term is the components normal to a ray drawn fom the origin (a
approximately 40% of the maximum absolute value of the the base of the corne and at the s=0 boundary of the do.invisad effect for ponts on the z= 150, plane. Besides, main). The directions of the velocity vectors shows quitethe region of viscous infuence extends upto a height of clearly, the vortical structure al the bas of the corne.2.04. above the surface of the plate.
Flowdeld MoV.2.
The analysis for Flowield No.2 was carried out in amanner simila to that for Flowkld No.l. (results not Fig.30 shows the contours foe the inviscid and viscousshown here). It was observed that although the location of terms (A, B) and pressure (C) along with the polar velce-the region of inviscid influence was found to agree closely ity plot' (D) for the'y-x' planes at ss4.7$. and sat"7.00..with that for Flowdeld No.1, the viscous influence re, The region of inviscid influence again lies, to a large ex-mained concentrated only in the regons very cloe to the tent, towards the upstream side of the 'A' shaped regionplate or fin surface (typically upto 0.0U.)and did not ad- of pressure rise. The region of viscous influence can befed the flow higher up in the boundary layer. Again, this observed to lie along the streamwise direction at a certainresult may be a consequence ofinadequate grid resolution distance from the surface of the plate or the compressionfor this flowfield and consequently, no firm conclusions can corner. The region of maximum viscous influence lies farbe drawn regarding the viscous influence in the flow from downstream of the region of concentrated inviscid infiu-the analysis of Flowfleld No.2. ence in the flow. Again, however, it is possible that the in-
adequate grid resolution has introduced significant errorsCase 21 (aA)=(2440*) Swept Compression Co.- in the computation of the gradients of the viscous stressesnet Interaction for points lying on these planes. Hence, no firm conclu-
sions can be drawn from the analysis of this flowleld withAs observed from Fig.7, the 'vortical structure' in this regard to regions of iscous infuence in the interaction.
interaction is aligned approximately with the base of thecompression ramp. In order to study the interaction andthe nature of the vortical structure in a manner similar to The detailed investigation of the viscous and inviscidthat of the sharp fin cae, the pressure and viscous terms influence in the 3-D turbulent interactions generated byin the mean kinetic energy equation were compared quan- the sharp n and swept corner configurations yields thetitatively for points lying on 'I - a' planes in the flow. following results:Here, 'y' may be considered to be the height of a pointabove the surface of the plate/ramp. 1. The dynamics of the interactions ar obsezved to beFlowgeld No.1 governed primarily by invisad (pressure) effects.
2. Viscous influence is significant in the interactions, as
F'I.29 shows the contours for the inviscid term (A), observed from the examination of the flowdelds generatedthe viscous term (B) and the pressre (C) and velocity by the Navier-Stokes code incorporating the Baldwin.Lomaxvector (D) pl(t ) d the 'I - a' plaes a 4.6vo and algebraic turbulent eddy viscosity model. In the caev er lots rThea' planes aepresen t 'typicand ro of the sharp fin, this region extends upto approximatelysec.odela . These planes repreent two 'typical' crossh 2.04. above the plate surface.sections of the flow, inedatply ir wim the origin of the 3. The region of maximum invisadd influence in the inter.vortiea stsuctur ligned approximael y with the corer. actions is concentrated towards the fieestream side of theThe presure contours show the distribution of the pso- A shaped region of pressure rise for the sharp fin inter.
action and toward the upstream side for the swept com-interacts with the incoming turbulent boundary layer on pression corner case. This is observed to be consistent forthe flat plate, thus forming a 'A' shaped region of pressure both flowflelds (generated using different turbulence mod-rise, similar to that observed for the cae of the sharp fin els) in eah cae.interaction. The region of madmum invi aid influence
6
I
1/|/
4. The region of marimum viscous indueace lies between i'6J Kubota, H. and Stollery, J. L., An Experimentalthe region of maimum invihnd infuence and the geome- Study of the Interaction Between a Glancing Shocktry generating the interaction for the dowdelda computed Wave and a Turbulent Boundary Layer. AI. of Fluidusing the Baldwin-Lom" model. Meck. Vol 116, 1982, pp. 431-458.5. No drur conclusions can be dran regardinS region ofviscous iduence in the interactions, by the analysis of the (7j Oskam, B., Van, I and Bogdonoff, S., Mach 3 Oblique
dowfields generated using the Jones-Launder turbulence Shock Wave / Turbulent Boundary Layer Interc-
model, due to inadequate grid resolution for computation tion in Three Dimensions. AIAA Paper No. 75.$:1,
of the viscous stress grsdient term-. 1976.
[81 Oskam., B., Vas, L and Bogdonof, S., An Experi-The present study gives an indication of the complex mental Study of three-Dimensional Flowfields in an
nature of the 3-D shock wave- turbulent boundary layer Azial Corer at Mach 3. AIAA ppe No. 77-80D,interaction generated by even simple di-nsionless s- 1977.
ometries. It would be interesting to examine the flowleldawith regard to vorticity and total energ along streamlines [9J Dolli D. S. ad/ Bosdono S. M., Blunt FL In-in the Bow. It would be also worthwhile to compare the duced Shock Wave / Turlnt Boundary Layer In-results obtaind foe the sharp An and swept comer inter- teractions. AIAA Jaurn4 Vol 20, No.12, December
action to other three dimensional interactions. 1982, pp. 1674-1680.
[10J Dolling, D. S. and Bogdonof, S. M., Upstream In-fluence in Sharp Fin-Induced Shock Wave Turbulent
Acknowledgements Boundary Layer Interaction. AIAA Journal, Vol 21,No.1, Jan 1983, pp. 143-145.
This rtmarch was sponsored by the Air Force Office of [U1 McClur, W. and Doling, D., Flowfeld Scaling inScientific Research under A? Grant No. 8-0266 mon- 11 cre Wi nd Doik Wav Fuoblend Scaingriitored by Dr. James McMichaei and Dr. Len Sake. Sharp Fin Induced Shock WAe Turbulent BoundaryThe authors would like to thank Dr.C.C Hosratman of the Layer Interaction. A!AA Pepei" U-1754, 1983.NASA Ames Research Center for many helpful discussions [121 Settles, G. S.,Va, 1. E and Bogdonoff, S. M., Detailsand for the flowleld data on the sharp An and swept corner of a Shock Separated Turbulent Boundary Layer atinteractions for this study. Help fhom the Supercomputer & Compression Corner. ArAA Journal Vol 14, DecRemote Access Faclity staf at Rutgers University, is also 1970, pp. 1709-1715.gratefully acknowledged. [131 Settles, G. S, Fitxpatrick, T. J and BogdonoC,
S. M., Detailed study of attached and SeparatedReferences Compression Corner Flowfields in High Reynolds
Number Supersonic Flow. AIAA Journal, Val 17,June 1979, pp. 579-3U.
[141 Settles, G. S., Perkins, J. J. and Bosdooff,(1) McCabe, A., The Three-Dimensional Interaction of a S. M., Investigation of Three Dimensional
Shock Wave with a Turbulent Boundary Layer. Th Shock/Boundary Layer Interactions at Swept Cora-Aeronautical Quarterly Vol 17, pp. 231-252, 1966. pression Cornes. AIAA rournal, Vol 18, July 1980,
(21 Law, C., Three Dimensonal Shock Wave/Turbulent pp.779-785.Boundary Layer Interactions at Mach 6. Technic a (151 Settles, G. S and Bogdonoff, S. M., Scaling of TwoReport TR-75-0101, ARL, 1975. and Three Dimensional Shock/Turbulent Boundary
(31 Korkegi, R. K., On the Structure of Three- Layer Interactions at Compression Corners. AIAADimensional Shock-Induced Separated Flow Regions. Journa, Vol 20, June 1982, pp. 782-789.AIA Journal Vol 14, No.5, May 1976. (11 Settles, . S and Teng, H. Y., Flow Visual.
(41 Peake, D., Three Dimensional Swept Shock ization Methods for Separated Three DimensionalTurbulent Boundary Layer Separations with Control Shock Wave - Turbulent Boundary Layer Interac.by Air Lnjection. Tseanical Report Aeu. Report No. tions. AIAA Journal Vol 21, March 1983, pp. 390-ILR.50, National Researck Council - Canada, 1976. 397.
[) Kussoy, M. L, Viega, J. t and oratman, C. C., In. 1171 Myring, D. F., The Effect of Sweep on Conditions
vestigation of a Three-Dimensional Shock Wave Sep- of Separation in Turbulent Boundary -Layer/Shock
&rated Boundary Layer. AIAA Journal Vol 18, Wave Interaction. The Aeronautical quarterly, May
December 1980, pp. 1477-1484. 1977, pp. 111-122.[181 Stalker, R., Spanwise Propagation of Disturbances
in Swept Shock Wave- boundary Layer Interactions.AIAA Paper Ne. 51-0988, 1982.
I
[191 Stalker, R., A Characteristics Approach to Swept [34) Knight, D., Hortman. C., Shaper, B and Bodonoff,Shock - Wave/Boundary Layer Interactions AIAA S., The Flowfield Structure of the 3-D Shock Wave
Journa, Vol 22, No.11, November 1984. Boundary Layer Interaction Generated by a 20 des
(201 Eager, G. R., Analytical Investigation oSwept Shock Shap Fin at %fach 3. AIAA Jurn4 Vol 25, No
-Turbulent Boundary layer Interaction ian Supersonic 10, October 1987, pp. 1331-1337.Flow. AIAA Paper No. 84.155S, June 1984. 1331 Knight, D., Raiuer, D., Horstman, C. C., Ketchum, A
;211Ilger, G. f., Supessonic Viscous-nvisd Interaction and Bogdonoff. S., Supena,ic Turbulent Flow Pat
of21 Swept Ramp with a Turbulent Boundary Layer. a 3-D Swept Compresson Corner at Mach 3 - Paut
AIAA Paper Me. 85-1000, July 196 11 AIAA Paper No. J8.010, January 198.
122) luger, Q. t., Incipient Separatioa and SimiU. [361 Baldwin, B and Lomax, H., Thin Layer approzim-
tude Properties of Swept Shock/Turbulent Boundary t;on and Algebraic Model far Separated Turbulence
Lae Iteractiom. AIAA Paer No. U-091, 198. Flow. AIAA Paper No. 78.57, 1979.
(231 Mee, D. and Stalker, L., Investigation of Week [371 Jones, W ad Launder, B., The Prediction of Lam-
Shock-Shock and Shock Expansion Intersectionin the inarisao with a Two-Equation Model of Trb-
Presence of a Turbulent Boundary Layer. ALA Ps- leace. InLJ.se5t end Mass u nfiwr,Vo 15, 1972,
pet No. 87.054s, 1967. pp. 301-304.
(241 gung C. L and M&cCorwAc14 R. W., Numerical (381 Cebeci, T and Smith, A. M. 0., Analyis of Turbu-* Solution o(Three-Dimensioual Shock Wave and Tar- lest Boundary Layers. Academic Press ,0w York,
bulent Boundary Layer Interaction. AIAA Journal 1974.
Vol 16, October 1978. [(39 Keller, if., Accurate Numerical Methods for Nonulin-
(231 MacCormack, R. W., Numerical Solution of the In- ear Two-Point Boundary Vaiue Problems. SIAMJ.
teraction ofa Shock Wave with a L-miar Boundary Numerical Analyis, Vol 11, 1974, pp. 305-320.Layer. Lectur Yot in Physics, Vol 8, 1971, pp. (401 Token, K., Heat Transfer due to Shock Wave/ Bound-151-103. ary Layer Interactions on High Speed Weapons Sys-
[261 Baldwin, B. S.,and MacCormack, R. W., A Numer. tems. APFDL report No. TR-74- 77, 1974.
ical Method for Solving the Navier-Stokes Equations [411 Gatonde, D and Knight, D. D., Numerical Experi-with Application to Shock - Boundary Layer Interac- mets on the 3,D Shock Wave- Boundary Layer In-tions. AIAA Paper 75-1, 197. teraction Geuerated by a Sharp Fin. AIAA paper
[271 Horstman, C and fung, C., Computation of Three - No. Is-eseD, 1988.Dimen ional Separated Flows at Supersonic Speeds. [42) Ra.Ier, D., The Development of a 3-D Particle Trac-AL4A Paper N.. 7D-000, 1979. ing Algorithm and its application to The Study Of
[281 Horstman. C., A Computational Study of Complex Swept Compreuion Corne Boundary Layer Inter-
Three-Dimeunsio Compreoble Turbulent Flow- actions. M.$ TAetig, Rl elor Univerlit, JnuUJYfields. AL4A Paper No- 84-.l55d, 1984 loss.
(291 Hortm__, C., Computation of Shmxp-pin-[nduced [431 Sun, C. C and Chi]a, M., Wall Wake Velocity Pro-Shock Wave/ Boundlazy layer Intexaction. ArA4 file for Compressible Nonadiabatic Flows. AIAA
pop"r No. 88.10$2, May 1986. Journa4, Vol 14, 1976, pp 820-22.
n[30 i Kght, D., A Hybrid Explicit-Implicit Numerical
Algorithm for the Three-Dimensional CompressibleNavier Stokes Equations. AIAA Journal, Vol 22,1984 ,pp. 1054-1061.
(311 Knight, D., Numerical Simulation of 3.D Shock Tur.bulent Boundary Layer Interaction Generated by aSharp Fin. AIAA Journal Vol 23, December 1983,pp. 1885-1891.
(321 Knight, D., Modelling of Three-Dimensional ShockWave Turbulent Boundary Layer Interactions. Lee.tare Notes in Physics Vol 230, Springer-Verlag, NewYork, 1985, pp. ITT-201.
[331 Knight, D., Horstman, C. C., Ruderick. R., Mao,M. F and Bogdonaof S., Supersonic Turbulent Flowpast a 3-D Swept Compression Corner at Mach 3.
AIAA Paper No. 57.0SSI, January 1987.
!S
I l ss •. ..II I I-I-
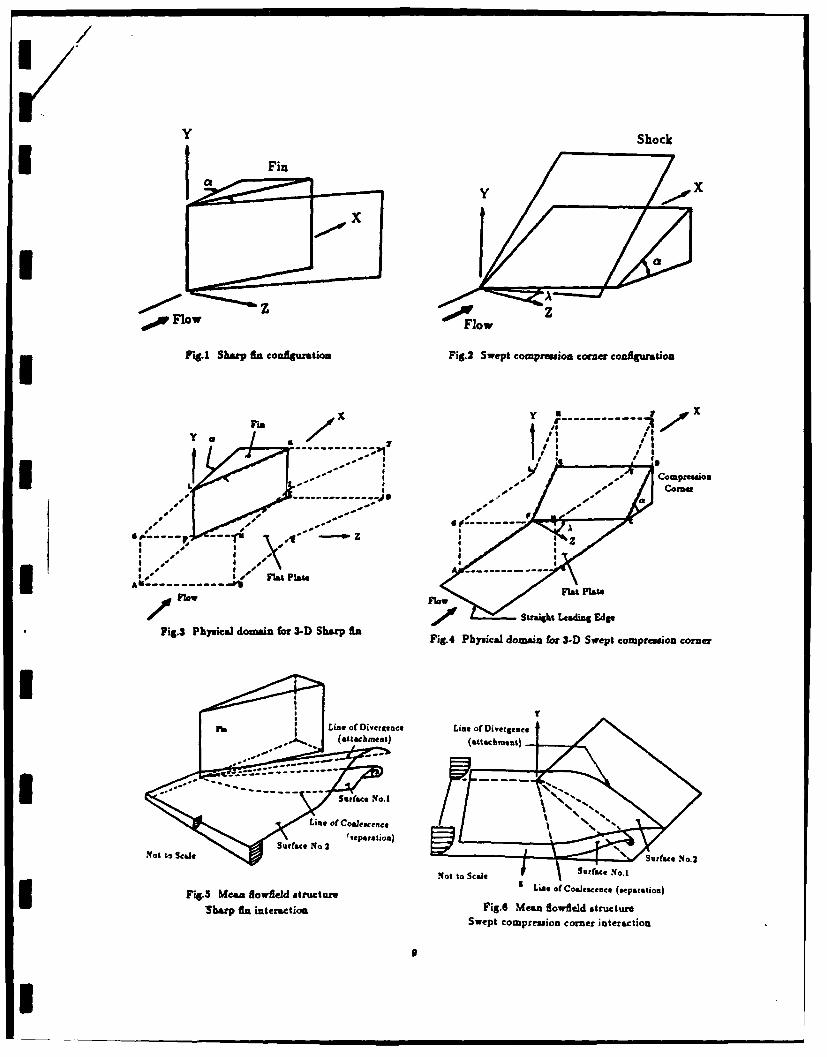
Y Shock
I Fin
I f,.fFlow Flow
Pig.1 Sharp a configuration Fig.2 Swept compresuion corer~ configuration
x yFi,II a
-- Comperm
OI. -
Line of Diversence Line of Divergence. (attachment) (atahmnt
N.ISurface No.2N
Not to ScaleSufc 101
Fi.3 Mean flowfield structure -( oCoalescence (separation)
Sharp mn interaction Fig.6 Mean Biowfield structureSwept compression corner interaction

y~~Yetr 0.26 0.2b.
= .056. Ys 4 0.56".
Fig.7 Streaml nes for Swept compression corner
(a,X)=(24,40) at Re.= S1x 10'
Flowlkeld generated using the Baldwin-Lomax algebraiceddy- riscosity model
3 0
C
0.0 2.0 4.0 6.0 8.0 10.0 12.0 14.0 16.0 0.0 2.0 4.0 6.0 8.0 10.0 12.0 14.0 16.0
Arcdength/60, Arcdength/d.
F'ig.$ Kinetic energy along streamline Fig.9 Kinetic energy along streamline
originating frcom y =0.026. originating from y =0.056.3Flowfield No.1 Flowrfeld No.1
10
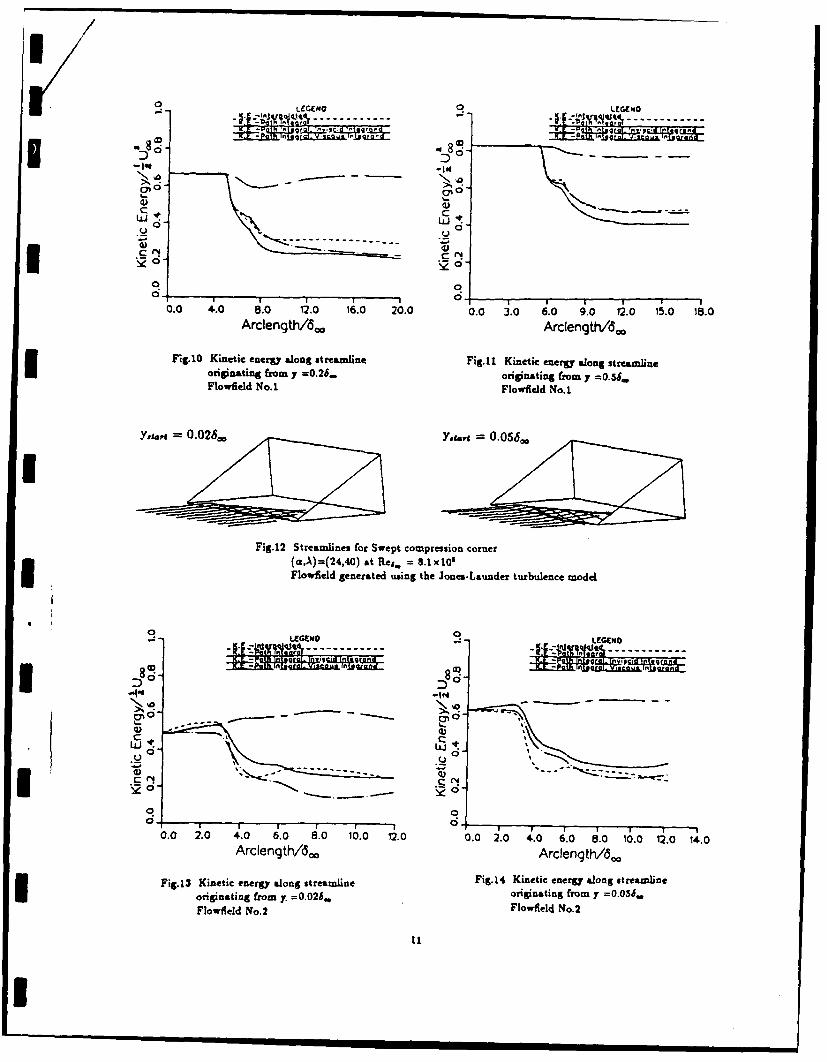
LEGENO 0 LCGENO
o" ©
ii: j 5 M.
0 0
0U
m C-
-* ~200 0
0.0 4..0 8.O 120 16.0 20.0 0.0 3.0 6.0 9.0 12.0 15.0 18.0Arcdength/d,, Arcfength/5oo
Fig.10 Kinetic energy along streamline Fig.II Kinetic energy along streaminmeoriginating rom y =0.26. originating from y =0.5$.FlowBeld No.1 Flowfield No.1
0a~ .026,, 0 .056'.
Fig.12 Streamlines for Swept compression corner(a,A)=(24,40) at Re, S. xt0'
Flowfield generated using the Jones-Launder turbulence model
8q 8qo0- D0II o No
0.- - -[O r ... GO
• U- -t ....- (U~
_ o
. 2 .4.0 6.0 8.0 10.0 1.0 0.0 2.0 4.0 6.0 8.0 10.0 12.0 14.0Arclength/6o Arcength/6.
Fig.13 Kinetic energy along streamline Fig.14 Kinetic energy along streamline
originating from y. =0.026. originating from y =0.05.Flowfield No.2 Flowfield No.2
11
I

yoga,$ 11 = 0-56,.~.,
Fig.15 Streamlines for Swept compression corner
(aA)(24,40) at Res. 8.1 x10¹¹ Flowfield generated using the Jlones-Launder turbulence model
IILLrM LEGENO
0.0 3.0 6.0 9.0 12.0 15.0 1;.0 0.0 3.0 6.0 . 12.0 5.Arcdength/do. Arclength/d.1
Fig.16 Kinetic energy along streamline Fig.17 Kinetic energy along streamline
originating from y =0.26. originating from y =0.58.
Flowfield No.2 Flowfield No.2
Ia, =O0.026
O..j .056".sar .5"
Fig.l8 Streamlines for sharp fin configuration
(a =20") at Res_ 9.OxlO1Flowfield generate using the Baldwin-Lomax turbulence model
12
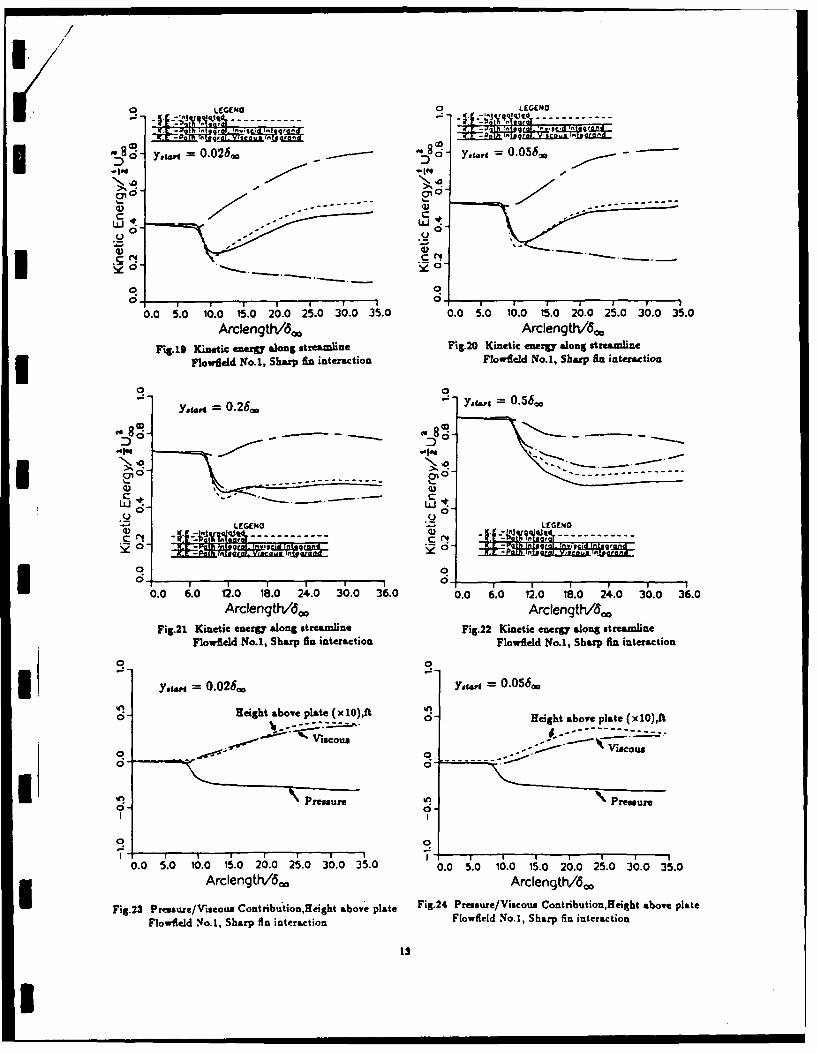
/
LENO0 LEGENDO
D0 0.210.06
CC
- ..1 ; t q , ....... .... . " 60 -- 0 l~ra
_ Ci C
0~ 0
0.0 5.0 10.0 15.0 20.0 25.0 30.0 35.0 0.0 5.0 10.0 15.0 20.0 25.0 30.0 35.0Arclengthl6c. ArcdengthV6,,
Fig.1S Kinetic energy along streamline Fig.20 Kinetic energy along streamline
Flowfleld No.1, Sharp fin interaction Flowdld No.1, Sharp Ain znteraction
0= 0
0aat .26.g 0er, .56.
.. I't.
ou
D 0-
- o
I; I ! I I I I I I ' I
Q Q
0.0 6.0 12.0 18.0 24.0 30.0 36.0 0.0 6.0 1.0 18.0 24.0 30.0 36.0Ardength/. Arcengt/ ,,
Fig.21 Kinetic energy along streamline Fg.22 Kinetic energy along streamlineFlowfeld No.1, Sharp fin interaction Flowfeld No.1, Sharp An interaction
0 0
ys., = 0.02, y,, = O0.056'
0 High abve lat (x10)t0- Height above plate (x 10),ft
qi~u -----------0 - P0- 0
I
6.0 1.0 1;O i.0 2;.0 2.0 30.0 3.0 . 5'.0 1; 1.0 2;.0 2.0 30.0 3.ArengtJV6.o Arenth/'.
Fig .21 Kinsu eicu enribu'tonHegh sramin lteFFig .22 Presueicu enri -tonHistreabveplt
Flowfleld No.1, Sharp fin interaction FlowfelddNo.1, Sharp fin interaction
I
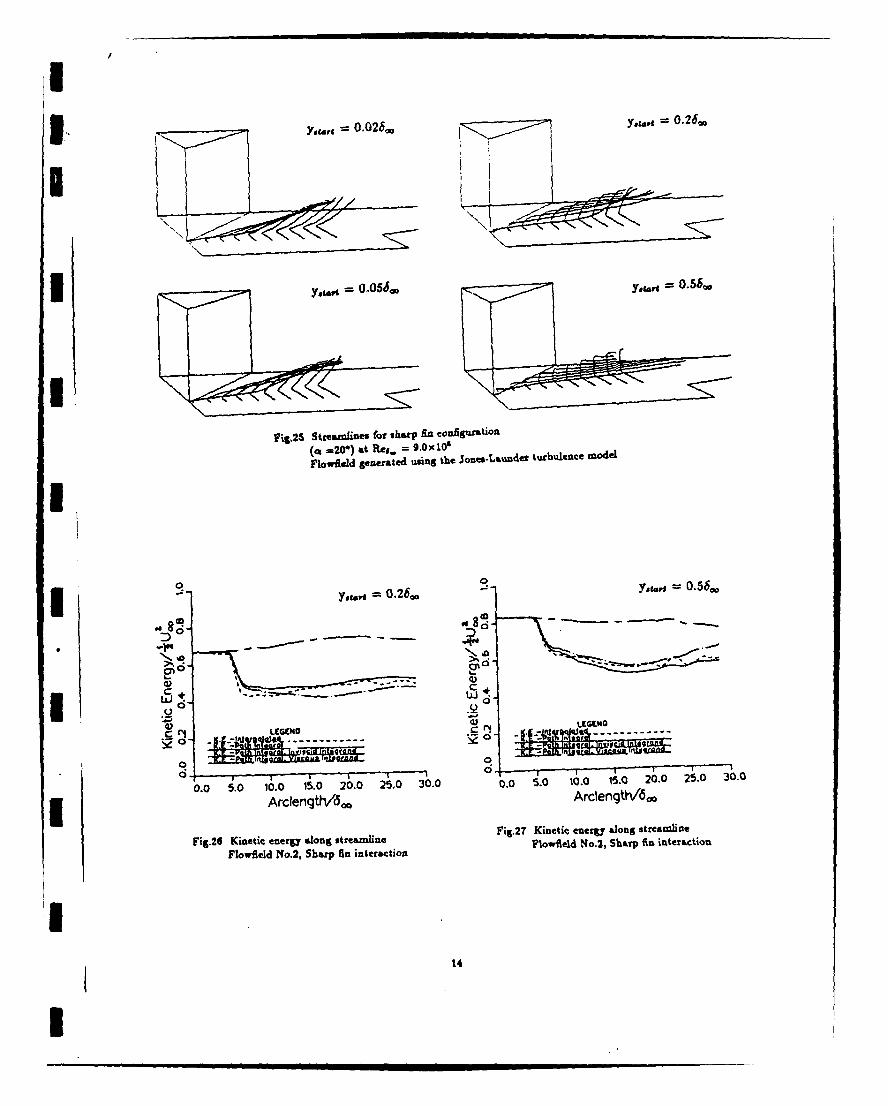
3 Yaiasi 0.026.~ 0.26'.
3 = o.056,0ua
Fig.23 Streamlines for sharp An configuration(a =20*) at Res. = 9.OxlO4Fiowdeld generated using the Jones-Lawidet turbulence model
1 0
C -
0-~ Ni -LGM
0
0-0 .0 0.0 15.0 20. 2i0 360.0 i.0 10.0 15.0 20.0 25.0 30.0
0.0 5.0 10.0 1. 2.0 2.00 Arcdength/6dm
Ii-2 Kietc eralstreamlin Fig.2T Kinetic energy along streamline
Flowfield No.2, Sharp An interaction lwedNo2Shrfiintxin
14

I.*
L% Inviscid (pressure) Contribution torate of change o( mean kinetic energy
N V L
Viscous Contribution torate of chae o( mMA kinetic enr
-C
zla
IFig.28 [tiisid, viscous contribution to rate of' changeOf me"P kinetic eergo, Preoure contours,
'Polar' velocity vectors t x = 1S m.lowfeld ,ro.1, (a = 20-) sap do interaction
is
aI*Ia aIaI aIaIa aIaIaI
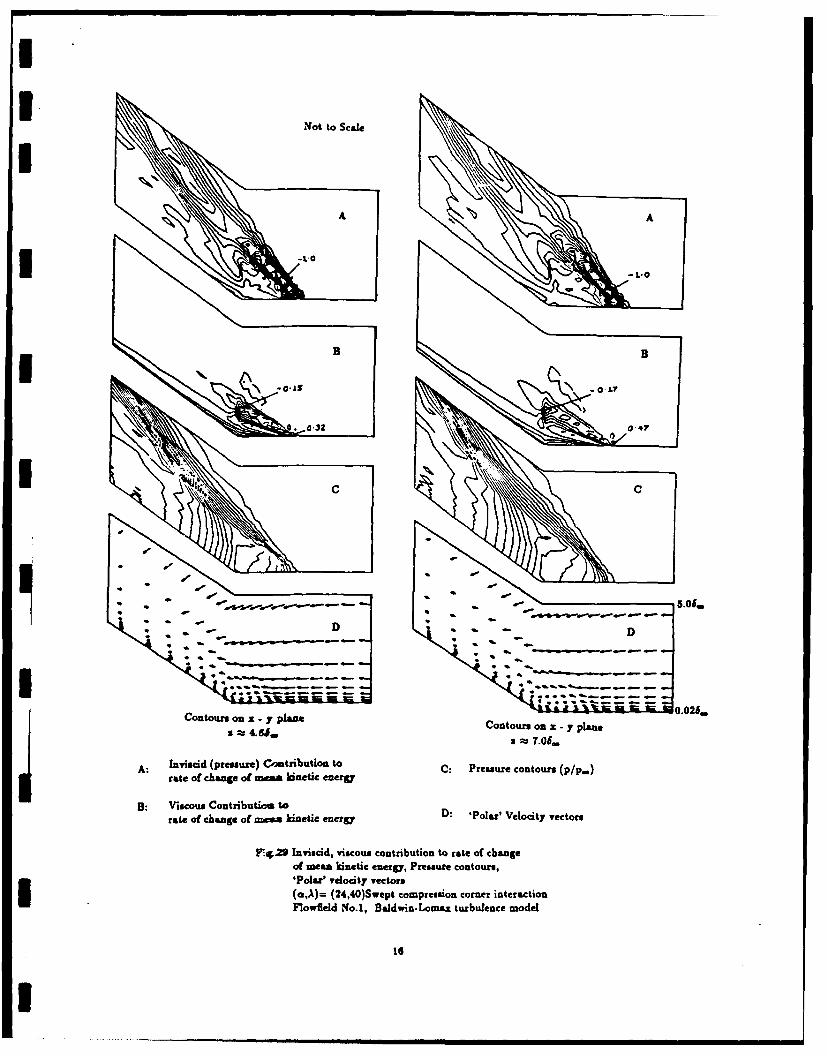
NoIo cl
AI.I. .. -
BU
NI-L
IA
Contours on x - yplane Contours on x - y plane 008
s :t 4.. a::U7.06.
A: Inviscid (pressure) Contribution to C: Pressure contours (p/p.)rate of change. of mea kinetic energy
B: Viscous Contributice torate of change of ies kinetic energy ':Polar' Velocity vectors
Fw,29 Inviscid, viscous contribution to rate of changeof mean kinetic energy, Pressure contours,'Polar' velocity vectors
(a,A)= (24,40)Swept compression comner interactionFlowfield No.1, Baldwin-Lomax turbulence model
16

NoIo cl
-C
.1~ ~ ~ .00 1326
--- - -r --D
Contour, on z y plane Contours on x - y planes -s4.64. a ms 7.06,
A: Inviscid (pressure) Contribution to C: Pressure contours (p/p.)rate of change of mean kinetic energy
rat:ofchageo en kto ceeg D: 'Polar' Velocity 'rectors
Fig.30 Inviscid, viscous contribution to rate of changeof mean kinetic energ, Pressure contours,'Polar' velocity vectors(a,A)= (24,40)Swept compression corner interaction
Flowfield Mo.2, Jones-Laundler turbulence Model
LT