fuel and food - resupplying metro miamiexcerpt from supply chain resilience and the 2017 hurricane...
TRANSCRIPT

Excerpt from Supply Chain Resilience and the 2017 Hurricane Season | 1
Fuel and Food — Resupplying Metro Miami
On Thursday, August 31, 2017 after a full week of rain, Houston’s skies finally cleared. Over 39 inches of rain—more than a typical year—had fallen. Floodwaters began to drain. Remnants of Harvey churned slowly northeast. Meanwhile west of Cape Verde, Hurricane Irma was finishing her first full day at hurricane strength, achieving Category 3 (sustained winds over 111 mph) just before midnight. Conditions favored further strengthening. Spaghetti models were widely splattered, but Miami was certainly in play.
The Miami metropolitan area is the effective terminus of a dense economic corridor that begins at Boston, 1,500 miles north. Interstate 95 is the spine of this system, with average daily traffic exceeding 72,000 vehicles and sometimes surging to more than 300,000. Average daily truck traffic is over 10,000 and daily truck-counts that are triple the average are not uncommon. [1] The five million residents of metropolitan Miami (“Metro Miami”) live near the end of a 400-plus-mile-long peninsula, clustered inside a 30-mile-wide strip between the ocean and the Florida Everglades. The city of Miami has a population density of more than 12,000 people per square mile. Getting food and other supplies to Metro Miami while most of its residents were evacuating highlights several supply chain issues, especially related to fuel.
PRE-EVENT DEMAND PULL
Given the dramatic media images out of Houston and the projections for Irma, many residents of Miami and most of South Florida spent some of their sunny Labor Day Weekend (September 2–4) stocking-up on hurricane supplies. Florida retailers—especially grocers and home improvement stores – were hard-pressed to keep up with burgeoning demand.
Truck traffic into Miami from Orlando and farther north increased throughout the first week in September. The annual average daily truck traffic for the most heavily used routes ranges between 9,000 and 12,000 trucks per day. [2-3] On Thursday, September 7, the same sensors reported truck counts three to four times the average.
A few hundred trucks delivering into metro Miami that week belonged to Cowan Systems, a third-party logistics operator headquartered in Baltimore, Maryland. Cowan’s customers in South Florida include BJ’s Wholesale Club. According to Steve Wells, Cowan’s Executive Vice
A CNA CASE STUDY IN SUPPLY CHAIN RESILIENCE
Suggested Citation: Palin, Philip J., Lars S. Hanson, Delilah Barton, Ashley Frohwein. 2018. “Fuel and Food - Resupplying Metro Miami.” Supply Chain Resilience and the 2017 Hurricane Season. CNA. IRM-2018-U-018098. October 2018.

2 | Case Study 3: Fuel and Food—Resupplying Metro Miami
President, several retail customers significantly increased deliveries starting the last week in August. “The Florida inventory build for hurricane season starts as early as May. But Harvey added urgency,” he said.[4] Water, groceries, and building materials made up most of the late August and early September loads.
Despite these preparations, consumer demand in front of Irma exceeded delivery capacity for several key products. On Tuesday, September 5, Reuters reported [5]:
Annisa Ali, 45, who just moved to Oakland Park, Florida, from New York City, said she was having a hard time finding water at local stores. “Last night, I went to Walmart. No water. I went to Target. No water. Now I’m here. No water,” Ali said at a grocery store in Wilton Manors, Florida. James Foote, a 56-year-old handyman in Fort Lauderdale, said he was unable to find any plywood to nail over windows at a local home supply store on Tuesday. He said more wood was expected to be delivered on Wednesday.
At this point, most product shortages were the result of finite trucking capacity.1 Most distribution centers had sufficient stocks of bottled water, toilet paper, batteries, and other shelf-stable product categories. But there were not enough trucks and drivers to meet surging demand. There is only so much mobile square feet available per route, only so many truck drivers, and the space between distribution centers and stores remains the same.
BJ’s Wholesale Club (with more than $11 billion in annual turnover), headquartered in Westborough, Massachusetts has 31 retail outlets in Florida, including a baker’s dozen in Metro Miami. The network is served by a 460,000-square-foot warehouse with a 173-door cross-dock near Jacksonville. Cowan Systems is co-located with its customer at this particular facility. BJ’s has a highly optimized supply chain that quickly delivers inventory to its large retail locations (typically over 100,000 square feet). Most inventory is expected to turn over within 30 days. “We don’t just have customers, we have members,” Trevor LaChapelle, Vice President for Global Transportation, explains. “They hold us to a higher standard and we want to be held to a higher standard. Demand was high both before and after Irma, especially for water. But we kept water in stock, even when we had to move it 1,200 miles from bottler to Club.”
Statistically, it can be argued that there is no “surge capacity” in US supply chains in general. Before Hurricane Harvey, the national vanload-to-truck ratio was close to five-to-one. By the time Irma was done, the ratio was more than seven-to-one. By January 1, 2018, the national ratio had hit ten-to-one.[6] Some regions have even wider ratios. What this means is that any
1 There are reports of individual suppliers being short on bottled water in early September because they had surged bottled water supplies into East Texas as part of the Harvey response.

Excerpt from Supply Chain Resilience and the 2017 Hurricane Season | 3
surge in demand is supplied by displacing previously targeted loads. Instead of surge capacity there is swapping-out how existing capacity is deployed.2 Many of these loads are carried by “foreign power”3 diverted—often at premium prices—from distributing other products to other places.
“We don’t usually carry water from Pennsylvania to Florida,” Steve Wells said. But when the supply of bottled water in Florida began to come up short, BJ’s rounded-up and we loaded-up water all across the mid-Atlantic.” Generators were also being hauled long-distance. It can take a full 24 hours or more to move a load from Scranton to Miami. While product is enroute BJ’s works with Cowan to specifically target delivery locations, depending on last-minute demand. “The lane (I-95) is the same. But loads and routes and schedule can totally flip,” Wells explains.
Similar swaps were happening across many product categories and a wide geographic area involving dozens of trucking companies and their customers. Vans originally scheduled to carry house shingles into Houston became vans carrying water into Homestead. “Foreign power” coming back empty from Houston picked up plywood in Atlanta and headed south toward Tampa. “Driving empty is a sin,” Cowan’s Steve Wells emphasizes. Dispatchers, brokers, procurement teams, store managers, and many more all work their digital and personal networks, aggregating last-minute loads to maximize all the capacity available to supply all the demand possible.
PERSISTENT UNCERTAINTY WITH PERCEIVED HIGH RISK
By Tuesday, September 5, Irma had become a Category 5 storm, with 175 mile-per-hour winds. It was the most powerful Atlantic mid-ocean hurricane ever recorded. [7] On September 7, the Caribbean islands of Barbuda, St. Martins, Saint Bart, and St. Thomas experienced horrific hits. More than one million residents of Puerto Rico lost power. [8]
The forecast map for Miami remained uncertain. Eventual impact would be determined mostly by when Irma turned north. Some computer models forecast an early turn, keeping Irma just offshore and subjecting the entire I-95 corridor—Miami to Jacksonville—to a buzz
2 In this context it may be worth remembering Churchill’s question to the French High Command early in the German Blitzkrieg. “Où est la masse de manoeuvre?” he asked in bad French. “Where is the strategic reserve?” is a possible translation. Marshall Gamelin’s reply, “Aucune!” (none) is exactly our current situation.
3 “Foreign Power” is the trucking term for actual truck-tractors (source of power) moved from their usual area or operation to an atypical area of operation

4 | Case Study 3: Fuel and Food—Resupplying Metro Miami
saw of maximum sustained winds and storm surge. Other models had Irma barreling through the Keys and slowly paralleling Florida’s Gulf Coast. In a newspaper column, Troy Moon wrote, “Hurricane Irma's Cone-Of-No-One-Has-A-Clue had the storm potentially coming our way. Or another way. Or some other way. The colorful storm models showing all the tracking predictions were as messy, looping, and entangled as one of my old Spirograph creations.” [9]
Figure CS3-1. Irma’s track shifts from a consensus Atlantic landfall on Sep 6 (left), amid considerable uncertainty in the track (center), to a Gulf Coast landfall in the Sep 8 forecast.
Sep 6, 6 p.m. Sep 7, 6 p.m. Sep 8, 11 a.m.
Sources: NCAR, NOAA, NHC
On Thursday, September 7, Miami-Dade and Monroe County (Florida Keys) announced mandatory evacuations [10]. On September 8, mandatory evacuations are expanded to include several Gulf Coast jurisdictions and areas around Lake Okeechobee [11].
EVACUATION IMPACTS RETAIL DEMAND AND SUPPLY
Eventually, more than 6.5 million Floridians were told to evacuate. Given the geographic scope of hurricane risk—and persistent uncertainty—consumption surged across the entire Florida Peninsula. As early as September 6, the Tampa Bay Times reported [12]:
Retailers across Tampa Bay are trying to replenish supplies like bottled water, plywood, and other merchandise that is flying off the shelves at stores across the region. Some Publix supermarkets are limiting bottled water to two packages per person or four per family in an effort to share supplies evenly. Some local gas stations are reportedly selling bottled water packages for $8 a pop.
"Our warehouse and distribution centers' water supply is at full capacity and stores are receiving deliveries throughout the day and night," said Dwaine Stevens, a

Excerpt from Supply Chain Resilience and the 2017 Hurricane Season | 5
spokesman for Publix. "We're monitoring the storm track and working with our warehouse and distribution centers to ensure our stores have water, batteries, hurricane supplies, and essentials to serve our customers. Supplies are ordered early so warehouses are well stocked should a storm threaten during hurricane season."
(continued) Walmart and Amazon are reporting shipping delays for online orders due to overwhelming demands. Walmart stores have suspended all grocery pick-up services at stores in Florida for the duration the storm, said Regan Dickens, a spokesman for Walmart. He added that Walmart has sent 800 truckloads of bottled water to Florida, which began arriving at local stores last night. Walmart stores are restocking shelves by the hour, with the greatest need coming from the southern areas of the state and extending north.
"While some stores may sell through product quickly, our supply chain and merchandising teams are working to ensure stores are replenished as quickly as possible," said Matt Harrigan, a spokesman for the Home Depot. "We began shipping pre-staged loads of hurricane supplies from distribution centers to stores in the potential strike zone late last week and we'll continue to do so through the end of the week."
By Thursday, September 7, congestion caused by evacuation traffic is further complicating supply chain operations. “Going south into Miami was okay, even easier than usual. But making the return was a real pain,” Steve Wells said. “I don’t understand why Florida never used contra-flow. The usual four or four-and-a-half-hour trip from Miami to Jacksonville took over seven hours by Wednesday/Thursday.” [4] On Thursday, the Florida Department of Transportation reported volume on northbound interstates at three to four times normal. [13] On Friday, it was worse. On Friday morning, Florida Governor Rick Scott says in interview after interview, “If you're in an evacuation zone, you've got to get out; you can't wait.” The governor warns that evacuees need to be out of evacuation zones by midnight Friday. After that, high winds will make it too dangerous to be on the roads. [14]
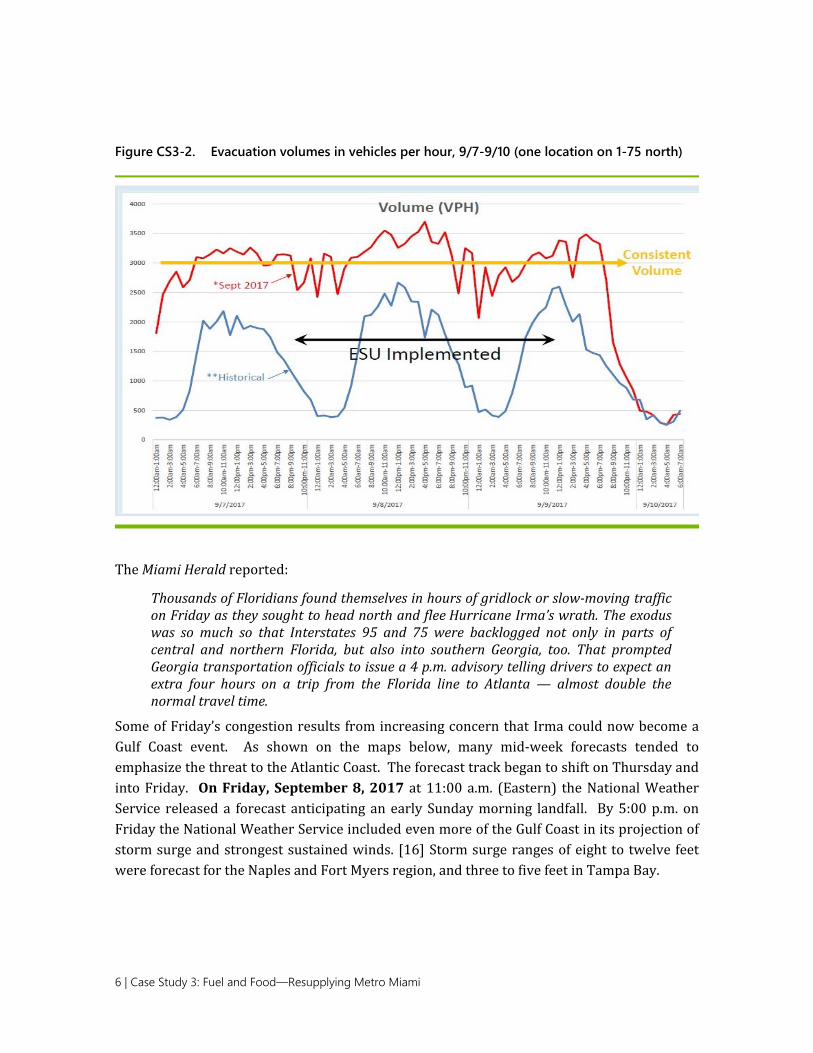
Figure CS3-2 demonstrates the evacuation volumes between September 7 and September 10, 2017, for one monitoring location on I-75. [15] The total volume of vehicles-per-hour (VPH) is indicated with the red line. The blue line is total VPH for the same location averaged over time. Emergency Shoulder Use (ESU) is when Interstate shoulders were authorized for traffic use on September 7–10.
6 | Case Study 3: Fuel and Food—Resupplying Metro Miami
Figure CS3-2. Evacuation volumes in vehicles per hour, 9/7-9/10 (one location on 1-75 north)
The Miami Herald reported:
Thousands of Floridians found themselves in hours of gridlock or slow-moving traffic on Friday as they sought to head north and flee Hurricane Irma’s wrath. The exodus was so much so that Interstates 95 and 75 were backlogged not only in parts of central and northern Florida, but also into southern Georgia, too. That prompted Georgia transportation officials to issue a 4 p.m. advisory telling drivers to expect an extra four hours on a trip from the Florida line to Atlanta — almost double the normal travel time.
Some of Friday’s congestion results from increasing concern that Irma could now become a Gulf Coast event. As shown on the maps below, many mid-week forecasts tended to emphasize the threat to the Atlantic Coast. The forecast track began to shift on Thursday and into Friday. On Friday, September 8, 2017 at 11:00 a.m. (Eastern) the National Weather Service released a forecast anticipating an early Sunday morning landfall. By 5:00 p.m. on Friday the National Weather Service included even more of the Gulf Coast in its projection of storm surge and strongest sustained winds. [16] Storm surge ranges of eight to twelve feet were forecast for the Naples and Fort Myers region, and three to five feet in Tampa Bay.

Excerpt from Supply Chain Resilience and the 2017 Hurricane Season | 7
As the Gulf Coast forecast became more foreboding, northbound traffic on I-75 north of Tampa began to reach the same concentration levels as I-95 north of Miami. Congestion was especially heavy between Wildwood and Ocala, where the Florida Turnpike connects Metro Miami to I-75 toward Atlanta.
According to the Florida Department of Transportation, between September 6 to 9, “I-75 northbound in the Ocala area experienced an hourly traffic volume with a 1,236% increase over the same day the previous year and experienced pockets of severe congestion.” [15]
By Friday afternoon, September 8, northbound traffic on both coasts was generally four to five times normal volume. At many places, long lines formed at fuel stations. On what was thought to be its last deliveries before landfall, Cowan Systems had just over 100 vanloads to deliver into Metro Miami. Less than 15 percent of products made it to their destination that Friday. Most South Florida retailers were closing at sunset to allow employees to evacuate. “Lots of bare shelves needed restocking, but traffic was so bad we could not get to receivers before dusk,” Wells remembers. “Several trucks had to be turned around full and join the crowds inching north.” [4]
EVACUATION IMPACT ON FLORIDA’S FUEL SUPPLY
Double the time it takes to travel between Miami and Jacksonville and you almost double the diesel or gasoline consumed. Even as early as Thursday night, Cowan’s carriers were no longer able to top-off their tanks in most of Miami or anywhere farther south. On Friday morning, Gas Buddy reported that 40 percent of gas stations in Miami and Palm Beach County were out of supply. Tampa was not much better, with nearly 35 percent of stations shuttered. Orlando still had more than two-thirds operating. The worst case was Gainesville, north of Orlando, where nearly 60 percent of retail fuel outlets were empty. [17] One of the reasons contraflow was not implemented was the result of an effort to resupply fuel into evacuation departure zones and northbound corridors. During a Friday news conference, Governor Scott explains, “We still need southbound lanes to get needed gas and supplies down to shelters and families that need it in southern parts of the state.… Contraflow also inhibits our ability to get emergency vehicles to people that need them.” [17]
The supply chain for fuel includes sourcing raw petroleum (crude oil), refining into motor fuels at refineries; transporting to bulk storage facilities; transporting to retail fuel distributors; and, finally, dispensing at retail stations for use by vehicles. Florida does not have any appreciable petroleum production or major refineries. As is the case in many Southeastern states, most of the fuel that Florida uses is produced at refineries along the Gulf coast of Texas and Louisiana. The fuel supply chain in Florida is also different than most

8 | Case Study 3: Fuel and Food—Resupplying Metro Miami
states because it has few pipelines, relies heavily on petroleum ports, and has relatively few petroleum product terminals.
Florida’s fuel network especially depends on three big nodes[18] (see Figure CS3-3):
• Tampa Bay Port: over 273,000 barrels per day. Fuel arrives by barge from refineries near Houston. The fuel terminal is operated by Kinder-Morgan. It includes 1.8-million-barrel storage capacity and pipeline connections to the Taft terminal near Orlando.
• Port Everglades (Near Miami): over 298,000 barrels per day. Fuel arrives by maritime means from a variety of domestic and international sources and is distributed to 12 different petroleum companies serving South Florida. In 2017, 661 petroleum ships docked at Port Everglades.
• Bainbridge (Georgia) Terminal (near Tallahassee): over 150,000 barrels per day arrives via the Colonial Pipeline from refineries near Houston.
Maritime fuel deliveries are made to other Florida ports and, especially in North Florida, fuel is sourced by truck from various out-of-state sources. But according to a 2016 report by the U.S. Energy Information Administration, these three nodes provide more than half of the transportation fuel consumed in Florida. [19] All three include commercial fuel racks located at bulk terminals (i.e., petroleum product terminals) to supply tanker trucks. Also note in Figure CS3-3 that there are relatively few bulk terminals across the state, including some major metro areas (e.g., Gainesville, Fort Myers) with none.

Excerpt from Supply Chain Resilience and the 2017 Hurricane Season | 9
Figure CS3-2. Fuel supply network in Florida. [19] Florida depends on petroleum ports and offloading from the Colonial Pipeline at Bainbridge, GA for its supply. There are relatively few pipelines to move fuel within the state.
Source: U.S. Energy Information Administration
There were sufficient fuel stocks on hand to meet demand during the Irma evacuation, but the level of “demand congestion” exceeded the delivery capacity of tanker trucks available. The number of fuel retailers and the distance of fuel retailers from fuel racks is constant. The number of fuel tankers operating on the routes between retailers and racks is mostly constant. Some increase in demand can be met by increasing hours of operation. But even this can be constrained by state and federal regulation. The wider the geographic scope of surge, the less any system can scale to serve it. A demand surge of 400 to 500 percent will drain a typical week’s worth of retail fuel storage in less than a day. Given the innate limits of the fuel distribution system in Florida, this level of surge will always result in retail points of distribution running out of fuel.
IPP-2018-U-018098

10 | Case Study 3: Fuel and Food—Resupplying Metro Miami
One locus of demand for fuel in the days before Irma’s Florida landfall was the Pilot Travel Center (Store #90) at the intersection of I-95 and the Florida Turnpike, near Fort Pierce (see Figure CS3-4). Across the street is a Love’s Travel Stop. About two miles north is the competitive tandem of another Love’s and a Flying J (owned by the same company as Pilot). This concentration of retail supply is well-suited to this junction 225 miles south of Jacksonville, 130 miles north of Miami, 150 miles east of Tampa, and about three miles west of the Atlantic Ocean. Pilot/Flying J, headquartered in Knoxville, Tennessee, is the largest retailer of diesel fuel in the United States. Pilot is also a regularly contracted source of diesel fuel for the Cowan Systems fleet.
UNCERTAINTY PERSISTS AS IRMA ARRIVES
As late as Friday evening, threat-vectors for Irma remained fungible. Just before midnight on Friday Weather.com posted the following [20]:
Key uncertainties still remain in the forecast for Irma's eventual impacts along its future path.… Irma is a large hurricane, so, despite the uncertainty in its track, impacts will be felt in a large area along its path.… Irma will remain an intense hurricane, at least Category 4, as it makes landfall in South Florida on Sunday, with potentially devastating impacts. The hurricane will then go on to affect much of the peninsula, with severe impacts extending into parts of central and northern Florida. Life-threatening storm-surge inundation will occur along coastal areas north and east of Irma's path. Hurricane-force winds (74+ mph) that are capable of causing structural damage and widespread power outages will also occur. Flooding rainfall and isolated tornadoes are threats as well. Irma has a large wind field so tropical-storm, even hurricane-force winds might reach both the west and east coasts of Florida, even outside of the cone. This includes Miami, Naples, Fort Myers, Fort Lauderdale, Tampa–St. Petersburg, and Orlando.
On Saturday, September 9, Irma became the second recorded Category 5 hurricane to ever hit Cuba. At least ten people were killed and over a half-billion dollars damage was done.
Figure CS3-4. Critical fueling station – Pilot Store 90

Excerpt from Supply Chain Resilience and the 2017 Hurricane Season | 11
About one hundred miles east of Havana, Irma finally made her long-anticipated right turn, angling sharply northwest.
In Florida, the highways were packed as tens of thousands continued to move north. A Tallahassee newspaper reported on the Governor’s Saturday morning news conference[21]:
With a sense of urgency in his voice, Gov. Rick Scott bluntly told millions of Floridians in a mammoth evacuation zone to leave or take shelter immediately today, as Hurricane Irma’s high winds began battering the Keys.
“The storm is here,” Scott said at a briefing in the Sarasota Emergency Operations Center. “This is a deadly storm and our state has never seen anything like it. Millions of Floridians will see major hurricane impacts with deadly storm surge and life-threatening winds.”
The governor said 25,000 south Floridians had already lost electricity when he held his 9 a.m. briefing.
Irma weakened to a Category 4 hurricane after striking northern Cuba overnight, but was forecast to strengthen back to Category 5 — with winds of more than 150 miles an hour — in the warm Straits of Florida waters as it curves north to the Keys... “You need to leave now,” Scott said, enunciating each word slowly for emphasis. “Do not wait, evacuate — not tonight, not in an hour, you need to leave now.”
“I want to be clear,” Scott said, “we are under a state of emergency. This is a catastrophic storm. It’s bigger than our state.”
At the Pilot Travel Center near Ft. Pierce, Floridians had been following their Governor’s advice. On Wednesday and Thursday, September 6 and 7, Store 90 experienced demand volume four to five times normal. Each day the store sold as much gasoline as is usually sold some weeks, supporting the evacuation north from Miami. Diesel volumes were about triple daily averages. Fuel was being delivered by multiple vendors from various locations as quickly as it could be procured.
On Friday morning, September 8, Store 90 was not refueled. By early afternoon it was out of gasoline. By late afternoon it was out of diesel.
Friday evening the Pilot Travel Center closed. It had no fuel and few shelf-products remained. McLane, the store's principal shelf-products vendor, had cancelled its Friday delivery. McLane did not resupply Store 90 until Friday, September 15. The store manager had secured five rooms at the Fairfield Inn, walking distance from the store, where the manager, assistant manager, and three employees rode out the storm.

12 | Case Study 3: Fuel and Food—Resupplying Metro Miami
At the BJ’s/Cowan terminal near Jacksonville, 124 trucks were loaded and had their gas tanks full. On Saturday, crews stayed out of harm’s way. But depending on conditions, the plan was to begin making runs into Metro Miami as early as Sunday night, trying to resupply stores that had not received their scheduled deliveries on Friday. BJ’s had more than 100 “Hurricane Trailers” preloaded and staged with all the supplies typically needed after a storm and when the power is off. For this purpose, BJ’s maintains a trailer pool in its Jackson freight yard. The BJ’s cross-dock is designed to push product forward fast. There is very little space to hold inventory. “We shed our congestion risk by quick transfer of inbound to outbound or outbound-ready,” Trevor LaChapelle explained. “We don’t have much room at the cross-dock. If we can’t get to our Clubs or our Clubs are unable to receive, we move product into outbound trailers. Our trailer pool is not efficient, but it is the least inefficient of relief valves available to keep flow moving or ready to move.”
On Sunday morning, September 10, Irma made landfall on Cudjoe Key, 100 miles southwest of Miami, as a Category 4 hurricane (see Figure CS3-5). On Sunday afternoon at 3:35 p.m. the hurricane makes a second landfall at Marco Island and tracks north, again with 130-mile-per-hour winds. According to the National Weather Service, “Sustained hurricane force winds extended well inland over the southern Florida Peninsula. At Government Cut off of Miami Beach sustained winds of 65 knots at an elevation of 23 meters occurred, and a wind gust of 97 knots was measured at Deerfield Beach. Nearly all of the inland observations in the Miami-Dade and Broward County metro area reported sustained winds just below hurricane force.”[22]
Storm surge near landfall was recorded at up to 10 feet above ground level. But elsewhere on the Gulf Coast surge ranged mostly between three and six feet. Extensive flooding in Miami was not all surge related. More than eight inches of rain fell in Miami, with some places totaling 15 inches over September 9–11.
According to the National Oceanic and Atmospheric Administration [22] :
Cudjoe Key
Marco Island
Figure CS3-3. Path of Hurricane Irma

Excerpt from Supply Chain Resilience and the 2017 Hurricane Season | 13
The combined effect of storm surge and the tide produced maximum inundation levels of 4 to 6 ft above ground level for portions of Miami-Dade County in southeastern Florida, especially along Biscayne Bay. A [U.S. Geological Survey] USGS storm- tide sensor at Matheson Hammock Park in Miami measured a peak water level of 5.75 ft NAVD88 (5.6 ft MHHW), consistent with a high water mark of 5.1 ft above ground level which was surveyed in the park. The NOS (National Ocean Service) tide gauge on Virginia Key recorded a peak water level of 3.7 ft MHHW. Significant flooding occurred in downtown Miami; however, the flooding was likely caused by a combination of heavy rainfall and urban runoff, wave overwash becoming trapped behind seawalls, and seawater coming up from below through the city’s drainage systems.
Note: NAVD88 – North American Vertical Datum of 1988. MHHW – Mean Higher High Water.
By Sunday night, at least four million electric customers had lost power, including more than three-quarters of those living in the Metro Miami area. (see Figure CS3-6). More than 20,000 Florida Power & Light (FPL) utility workers with equipment had been predeployed for the restoration process. [23] Still, for many residents, it took more than a week for their grid access to be restored.
Figure CS3-4. Four million customers in Florida lost power by September 11th, including over 1.5 million in Miami-Dade and Broward County.
Source: US Energy Information Administration, National Hurricane Center, Florida DEP

14 | Case Study 3: Fuel and Food—Resupplying Metro Miami
The Pilot Travel Center near Ft. Pierce lost electricity around noon on Saturday, presumably from downed power lines. The possibility of quick restoration disappeared when the electrical substation serving Pilot’s Store 90 lost grid connection at 7:15 p.m. The store is prewired with a transfer switch to quickly connect to a portable generator, but there is no permanently installed power generator.
Store 90 is connected to the electrical grid through the Fort Pierce Utilities Authority (FPUA), whose electric service area encompasses roughly 35 square miles and serves approximately 28,000 customers; the utility delivers roughly 45,000 MWh of power per month. This power is sources through three 138 kV interconnections with Florida Power & Light and one 138 kV interconnection with Vero Beach Utilities. FPUA owns and maintains approximately 266 miles of overhead lines, 151 miles of underground electric circuits, and over 20,000 poles and 5,600 transformers. Store 90’s manager had never been contacted by county or state emergency management or utility officials regarding priority restoration of power, nor had he ever contacted them.
Fueling stations have three essential needs in order to operate: fuel delivery, power to run pumps, and a method of processing payments. During hurricanes, power often goes out, and without backup generators, stations cannot run their pumps. Less than 5 percent of Florida gas stations have backup generation capability, though generator prevalence varies by county. Fueling stations are also vulnerable when deliveries are interrupted.
According to the National Weather Service, Hurricane Irma hit the Ft. Pierce area especially hard Saturday night and into the early morning hours of Sunday, September 10 with wind gusts of 100 miles per hour and sustained winds of over 70 miles per hour. More than 21 inches of rain was recorded at the Ft. Pierce water plant. When the store manager returned shortly after dawn on Sunday, water was near knee-deep in most of the truck bays, and some water had penetrated the store (despite baffles and other protective measures). Store personnel focused on clearing debris from retention pond intakes and cleaning the interior of the store. While significant draining occurred on Sunday, a few inches of standing water continued to cover the truck lot until mid-week. There was no significant wind-damage at the store. Cellular telephones continued to operate as usual. The Pilot Travel Center remained disconnected from the electrical grid on Monday, September 11. Yet there was progress: at 3:52 p.m. on Monday, the area’s substation was reconnected.
A snapshot of the various power challenges facing Florida is provided in Figure CS3-7—specifically, generator prevalence at retail gas stations by county (top left); mean distance from nearest petroleum product terminal by U.S. Census Bureau block group (top right); percent of gas stations out of service by metro area after Irma’s landfall on September 10

Excerpt from Supply Chain Resilience and the 2017 Hurricane Season | 15
(bottom left); and percent of gas stations out of service two days later, on September 12 (bottom right). [3, 24-26]
Figure CS3-7. Florida's retail fuel network experienced shortages because some areas had few stations with generators (top left), many stations are far from bulk terminals (top right). The outages by metro area are shown for Sep 10th and 12th.
Sources: CNA, EIA, FL DEP, GasBuddy. [3, 24-26]
Percent of Gas Stations closed due to fuel or power outage
Percent of Gas Stations closed due to fuel or power outage
Generator Availability Distance to nearest fuel supply terminal

16 | Case Study 3: Fuel and Food—Resupplying Metro Miami
On Sunday, there had also been heavy rain over Jacksonville and most of northeast Florida, but shortly after midnight Cowan Systems dispatched 20 trucks for Miami, 350 miles down I-95. This was a reconnaissance operation: Depending on what was discovered, more than a hundred trucks were ready to head south before dawn on Monday. Cowan was not the only carrier probing Metro Miami.
The drivers found the roads in good shape and the BJ’s Wholesale Clubs in Miami were ready to receive, even though all depended on backup electrical generation. Yet the drivers were unable to find any refueling locations. Many of the truck stops had been drained of fuel before landfall and had not been refilled since. On Sunday night, none of the truck stops on I-95 between Jacksonville and Miami were reconnected to the grid and not all had backup generators.
In well-moving traffic most heavy-duty trucks will get 6.8 to 7.2 miles-per-gallon (mpg). 300-gallon tanks on each truck are typical. This gives each truck roughly 2100 miles between fill-ups. But during the week before Irma’s landfall, traffic congestion had reduced mileage to as low as 4 mpg, or only 1,200 miles between fill-ups. A round-trip between Jacksonville and Miami is 700 miles. Because Cowan had topped-off tanks before Irma, its fleet could confidently complete one roundtrip to Miami, but nothing more would be possible until refueling was assured.
Monday morning, September 11, arrived with no observable change related to grid restoration or fuel availability along the I-95 corridor (see Figure CS3-8). During Harvey, Cowan EVP Steve Wells had started sharing information with a supply chain analyst volunteering at FEMA headquarters. Late that morning, he sent an email outlining his concerns in Florida:
Figure CS3-8. FPUA Facebook post from 5:42 p.m. on September 11, 2017.
Excerpt from Supply Chain Resilience and the 2017 Hurricane Season | 17
Appears we are in the worst shape in Jacksonville and Orlando. No power, flooding.
Surprisingly, Miami and Tampa—we are in good shape so far. Nothing major to speak of in terms of damage.
No word from the Fort Myers area, or south of Miami (Homestead). This area is of concern.
Some drivers (I’ll estimate about 50% of the workforce) are able to come to work later today; but we have no fuel source at this point. All trucks are full of fuel but will only last about 1,000 miles of transit. We’ll chew that up in 1-1/2 days.
Therefore, because fuel is an uncertainty—we are holding back inbound trucks (in North & South Carolina, destined for Florida) and delaying start up until tomorrow sometime—once we can determine that we have good access to fuel. Fuel seems to be the only thing holding back reactivating operations at this point.
According to the U.S. Energy Information Administration, “Power outages in Florida rose slowly on September 10, but they increased rapidly overnight as Hurricane Irma traveled up the state. About 15% of customers were without power at noon on September 10, and power outages peaked at 3:00 p.m. on September 11, affecting 64% of customers.”[27] Along the I-95 corridor, outage percentages of over 80 percent were common.
On Monday afternoon, mutual aid utility crews on their way to support FPUA ran out of fuel in northern Florida. FPUA employees and equipment were sent to refuel the Michigan-based mutual aid trucks.
At FEMA’s National Response Coordination Center (NRCC) in Washington DC, observations, information-exchange, and priority-setting discussions with Florida officials continued Monday afternoon. BJ’s Wholesale Club is not the only distributor with major nodes between Jacksonville and Lake City, where less than 60 miles separate I-75 and I-95. Many of the long-haul truck fleets serving Metro Miami had been pulled back to Orlando or Jacksonville. All were facing fuel limitations similar to those on Cowan’s fleet. At 8:15 p.m. on Monday evening, the following analysis was distributed inside FEMA headquarters:
We perceive that a significant proportion of private fleets are staged near Jacksonville or farther north to avoid Irma. We have specific and first-person reports from operators of these private fleets that they are delaying resupply of metro Miami and other locations because of the lack of fuel between Jacksonville and Miami…
We are concerned that unless resupply of metro-Miami begins in earnest tomorrow (Tuesday) or Wednesday at the latest that demand will far exceed supply in the metropolitan region.... potentially re-initiating hoarding behavior that will diminish existing supplies even more quickly. A similar situation may exist in Ft. Myers and Naples. In prior disasters, public foraging has sometimes unfolded into civil unrest.
At the intersection of I 95 and Florida 70 there is a Pilot Truck Stop and Love's Truck Stop. There is a Gator Truck stop a few miles north. Can these locations be rapidly

18 | Case Study 3: Fuel and Food—Resupplying Metro Miami
prioritized for power restoration? Can these locations be rapidly re-energized using mobile generators? Are there other locations with existing truck stops that are better suited for rapid restoration of power?
If one of these efforts to re-energize is effective, is there enough capacity in federal and state fuel reserves to support a private sector refueling depot at these locations? For how many trucks?
There are considerable uncertainties here. But the threat of insufficient supply of the metro areas will grow more and more dire the longer re-fueling is not available.… If we can get the power restarted somewhere appropriate, THEN we can seriously tackle fuel ... if the ports and fuel distributors have not already solved the problem.
About 30 minutes after the Monday night note was distributed inside FEMA headquarters, Cowan’s Steve Wells wrote to his FEMA contact:
I have 25% of my Florida-based drivers willing to work tonight. Tomorrow, I have commitments that the number will increase to 50–60% attendance. However,… I can’t send them too deep into Florida … because there is nowhere to fuel.
So they are in a holding pattern right now and limited to only deliver to select locations (which have power and are able to receive goods) in North Florida and Georgia. We have reluctantly abandoned any hope of sending trucks south of I-4 tonight.
I am sitting on 124 loads of supplies in Jacksonville as we speak, with another 50+/- loads in route. I am holding the 50+/- loads in route in Atlanta GA, and just outside Fayetteville NC.
Until I have certainty on the ability to get fuel, I won’t move these trucks—it’s too much of a risk right now. We have a 6 a.m. internal discussion planned, and may release those trucks at that point.
One plan we have is for the drivers staged in GA and NC to run into our terminal in Jacksonville switch trucks – dump theirs off low on fuel, and hop into others which are full of fuel (I fueled all my trucks in JAX [Jacksonville]/ topped off prior to the storm).
Then we will run until we exhaust fuel supplies. We have loaded these trucks up with water and food in the bunks so the drivers can survive on the road for 3-4 days if they get stuck. This is the current plan to service South Florida tomorrow night maybe. Not the #1 choice for me.
I spent the whole afternoon searching for vendors who could deliver fuel to our fleet in Jacksonville or if we could go to them to fuel up. No luck.
If I could just get about 8000 gallons of fuel in Jacksonville, it would be golden to move a ton of freight—gives me about 50,000 miles of run time. I am sitting on generators, water, batteries, food, tarps … etc. What I would consider critical items.
In my opinion – tomorrow [Tuesday, September 12] is a do-or-die day for the Feds. Either they jump in and problem-solve this or the wheels will come off the cart

Excerpt from Supply Chain Resilience and the 2017 Hurricane Season | 19
because we are going to have a bunch of parked trucks by tomorrow night when we run out of fuel. And the supply chain comes to a grinding halt.
Monday night, September 11, NRCC staff did “jump in” to ensure truck stops along I-95 were re-energized and refueled. This involved working closely with the State of Florida’s Emergency Operations Center on power restoration and with the Defense Logistics Agency on making sure federal fuel supplies could be available if necessary. But even as Tuesday morning dawned there remained several broken links—and considerable uncertainty—between Jacksonville and Miami.
The I-95 corridor in Florida gets its fuel primarily from Port Everglades near Miami, Taft Terminal near Orlando, Port Canaveral on the Atlantic Coast east of Orlando, and the Port of Jacksonville. All these locations were hit hard by Irma. The Coast Guard closed Port Everglades to maritime traffic on Friday. Canaveral and JAX were closed on Saturday. Taft Terminal is supplied via pipeline from Port Tampa Bay, which was also closed on Saturday [28].
Port Canaveral is the smaller piece of the I-95 Corridor’s fuel capacity, handling about half the fuel flow of JAX, about 25 percent of Taft, and only about 10 percent of Everglades. But to fill the gap between Jacksonville and Miami on Tuesday, September 12, the terminal and racks at Port Canaveral were crucial.4 Tanker trucks began queuing at Canaveral early on September 12. The racks opened at dawn. Over the next 48 hours, more than 750 fuel tankers were filled.5 It was a big help that in May 2017 the racks had been expanded from six bays to ten. At Tuesday noon the Coast Guard opened Port Canaveral to restricted commercial vehicle traffic, specifically to receive an incoming fuel vessel. [29]
On most days Pilot Store 90 at Ft. Pierce, 90 miles south of Port Canaveral, sells more diesel than any other Pilot or Flying J in Florida. Sitting at the intersection of I-95 and the Florida Turnpike, the truck stop is typically very busy. But Tuesday at dawn Store 90 was still dark and empty.
From Labor Day forward, Pilot’s headquarters in Knoxville, Tennessee was in constant contact with tanker truck operators at every rack in Florida and across the Southeast to refill its operations. In normal times, Pilot/Flying J serves its stores with its own fleet of more than 900 tanker trucks. But in the days before and immediately after Irma, Knoxville was procuring and dispatching fuel wherever and however it could. From Monday night into
4 Port Canaveral is unique among Florida ports in importing a majority of its fuel from non-US sources.
5 Florida Ports Council, Hurricane Preparedness. The tanker truck throughput was about 10 percent above normal days.

20 | Case Study 3: Fuel and Food—Resupplying Metro Miami
Tuesday morning, FEMA, the Florida Division of Emergency Management, the Defense Logistics Agency, and Foster Fuels (the DLA fuel contractor) were engaged in parallel efforts focused on the I-95 corridor. Early Tuesday morning an intergovernmental plan was ready to be executed for tanker trucks to be dispatched from a staging area in Alabama late in the morning. FEMA was also working to locate and transport generators necessary to pump the fuel.
On Tuesday morning, September 12, the Flying J Truck stop, two miles north of Store 90, was reconnected to the grid at about 8:00 a.m. Flying J shares the same main feeder line as the local hospital and jail. Shortly after the Flying J was re-energized it received a fuel delivery from a Pilot fuel tanker. The same tanker truck delivered fuel to Store 90 even before it had power. Other tankers followed. By about 2:00 p.m. on Tuesday, September 12, Store 90 was reconnected to the electrical grid and reopened. The FPUA Director of Operations says that both reconnections were scheduled in accordance with pre-storm priority plans focusing entirely on immediate life-safety issues. The strategic importance of Store 90 was not locally known. Supply chain resilience was not part of local decisions.
Mid-morning on Tuesday at Cowan’s Baltimore offices, Steve Wells got a call from a Pilot executive in Knoxville: fuel had just become available at Ft. Pierce. Steve called BJ’s headquarters in Massachusetts and the Cowan team at the BJ’s cross-dock outside Jacksonville. Over 100 trucks full of water and food started moving south on I-95.
There were still plenty of problems. Trucks were not allowed to deliver to BJ’s in Ft. Lauderdale because of curfew. The traffic southbound on I-95 was crowded with returning evacuees, reducing the average mpg by nearly 30 percent. “We had one truck run out of fuel and practically coast into the Ft. Pierce Pilot. Really close calls,” Steve Wells recalls. Resupply of the Tampa region was delayed until Wednesday by continuing lack of fuel on the Gulf Coast.
But by Tuesday afternoon, most Miami-area BJ’s and most other grocery retailers—supplied out of Orlando or Jacksonville or wherever—were well stocked and ready for customers.
PRELIMINARY ANALYSIS
The risk to resupplying Metro Miami on Tuesday, September 12, 2017, was much greater than generally recognized. Extraordinary measures by several decision-makers were necessary to avoid a possible shortfall. Most of these measures were taken independently of one another and were unknown to the decision-makers involved. The failure of any single measure could have resulted in resupply being further delayed. The consequences of such a delay cannot be confidently projected.

Excerpt from Supply Chain Resilience and the 2017 Hurricane Season | 21
Every day—disaster or not—supply chains consist of many moving parts. No matter how well calibrated the various system components are, there is friction, failure, and surprise. Disasters multiply uncertainty. Uncertainty amplifies the system’s dissonance. Thousands of independent, rather random choices made to reduce uncertainty accumulate to produce the reality then experienced. Taken together, these individual choices are difficult to undo and can sometimes cascade unpredictably.
Nonetheless, pre-existing networks do tend to persist. Roads and, especially, bridges are difficult to replace quickly. Supply nodes—ports, warehouses, distribution centers, truck stops—emerge over time in relationship with the transportation network. Supply nodes, together with transportation links, establish the system’s capacity and—often unintentionally—impose constraints on capacity.
Congestion exposes constraints. Demand congestion, as when millions are evacuated up a peninsula, will expose otherwise hidden constraints on road, fuel, and other networks. Supplying five times the normal demand for bottled water will expose rate-limiting factors that are not usually obvious in system operations on ordinary days. Supply congestion—as when inbound product accumulates faster than outbound product can be distributed—can be as complicating.
When there is more pull (demand) than usual, contemporary supply chains stimulate equal or greater push (supply). Suddenly increased volumes moving through finite time and space will find—sometimes even create—impediments to flow. In worst cases, such impediments can debilitate entire networks. Reducing or removing emergent bottlenecks is much of what supply chain management does on the best days, and this skill is even more valuable on the worst days. Doing this in a disaster—with the grid down, telecommunications disrupted, populations on the move, and dealing with deep uncertainty—is a significant challenge.
In many cases, the emerging constraint is not recognized until too late. During September 10–12, 2017, the lack of fuel on I-95 and its supply chain implications were recognized in time. A possible mitigation measure—refueling and re-energizing Store 90—was recognized late on September 11, but it was not too late. Several separate mitigation paths coincided over about six hours on September 12.
In Washington, Tallahassee, and Knoxville, several people and different organizations were pushing to secure fuel for Store 90. Pilot/Flying J were calling all their regular and several new vendors. FEMA was working federal sources. At Canaveral, Everglades, and Taft, hundreds of truckers—who were also storm survivors—queued up. Emergency electrical generators were turned on. Purchase orders were processed. Trucks filled with fuel were able to travel open roads. Would the tanker that filled Store 90 have been there in time if the fuel racks at Canaveral had not been expanded their capacity by two-thirds in May?
22 | Case Study 3: Fuel and Food—Resupplying Metro Miami
In Washington, Tallahassee, and Ft. Pierce, several people and organizations were pushing to reconnect Store 90 to the grid or get a generator in place. Would Store 90 have been re-energized on September 12 if the Michigan mutual aid crew had not been able to arrive on September 11? Would the system have been restored in time if, since 2006, FPUA had not invested in significant storm hardening of its distribution network?
In Baltimore, Westborough, Jacksonville, Miami, and many other places, several people and organizations were pushing to dispatch trucks full of food and water south on I-95. They needed open roads and fuel. They got what they needed just in the nick of time. Is it meaningful that in this one case the fuel arrived thanks to pre-existing commercial arrangements and the power to pump the fuel was reconnected through the SOPs established well in advance by the local electric utility?
Does this suggest that effective SOPs are more likely to impact network outcomes than the best crisis response? If so, does this raise the question of whether the single largest distributor of an essential commodity in an essential network should be quite so vulnerable to a predictable disaster? Can systemic constraints—strategically important constraints—be identified in advance and, if so, how can these constraints be mitigated in advance?
The questions are authentic and the answers are not obvious. But this case and the preponderance of evidence from similar cases emerging from Hurricanes Harvey, Irma, and Maria do strongly suggest the following:
Essential network characteristics are knowable. Fuel terminals and racks, logistics clusters, and other dense nodes of supply and demand can be identified in advance. High-volume links, lanes, and junctions are usually well known. Knowing before a crisis emerges the laydown of channels and places by which and through which food, fuel, pharmaceuticals, and other key “lifelines” flow can be helpful.
Critical points in networks are knowable. Working ahead of a crisis, the network can be assessed for critical points. These are often likely candidates to become systemic constraints. Once identified, mitigation measures can be implemented or prepared or, at least, prioritized.
Complex systems are susceptible to influence. A complex adaptive system—such as a large demand and supply network—cannot be “controlled,” especially in a crisis. But with sufficient awareness of the network and its crucial features, network participants can collaborate to reduce risk and enhance system throughput, especially to address pre-identified vulnerabilities or opportunities.
To be a less abstract, Pilot Store 90, at the intersection of I-95 and the Florida Turnpike, is a rather obvious candidate to be either a system constraint or a system enabler. In any large system there will be several such candidates. At the very least, they can be mapped to enable

Excerpt from Supply Chain Resilience and the 2017 Hurricane Season | 23
visual comprehension of their place in a network. Once they have been mapped some effort can be made to prioritize. Once they have been prioritized, measures can be considered to mitigate the risk. In the specific case of Pilot Store 90, a permanent backup generator is not out of the question. The truck stop is not currently on the list of FPUA’s “Essential Customers.” It would be conspicuous on a list consisting mostly of medical facilities. Should the other three truck stops in the FPUA service territory be given equal attention? Again, the answers are not obvious, but given the place of Pilot Store 90 as set out in this case, surely the questions are worth persistently asking.
This case study was developed by the Institute for Public Research at CNA, a not-for-profit research organization that serves the public interest by providing in-depth analysis and result-oriented solutions to help government leaders choose the best course of action in setting policy and managing operations.
Additional case studies related to issues of Supply Chain Resilience emerging from the 2017 Hurricane Season are available at: www.cna.org/supplychainresilience

24 | Case Study 3: Fuel and Food—Resupplying Metro Miami
CASE STUDY 3 APPENDIX: MAPS AND FIGURES
Figure CS3-9. Hurricane Irma’s wandering track. Source: TheWeatherChannel
Figure CS-10. Florida Census Profile including population density. Source: US Census Bureau.

Excerpt from Supply Chain Resilience and the 2017 Hurricane Season | 25
Figures CS3-11. Florida’s Strategic Intermodal System (SIS) highways.
Figure CS3-12. Major Commodity Flows by Truck To, From, and Within Florida.
Source: US Department of Transportation, Federal Highway Administration, Office of Freight Management and Operations. Freight Analysis Framework Version 4.3 (2017)

26 | Case Study 3: Fuel and Food—Resupplying Metro Miami
Figure CS3-13. BJ’s BJ’s Wholesale Club warehouse, cross-dock, and freight yard near Jacksonville, Florida. Cowan Systems is co-located at this complex. (top) BJ’s Wholesale Club locations in south Florida (bottom).

Excerpt from Supply Chain Resilience and the 2017 Hurricane Season | 27
References
[1] FHWA. 2012. “Corridors of the Future: Factsheet.” Briefing Room, Federal HighwayAdministration, U.S. Department of Transportation. 14 Sep 2012.https://www.fhwa.dot.gov/pressroom/fsi95.cfm.
[2] Florida Department of Transportation. 2017. “Florida Traffic Online.” FDOT.https://tdaappsprod.dot.state.fl.us/fto/.
[3] Florida Department of Transportation. 2018. geodatabase. Florida Transportation GeospatialData. https://gis-fdot.opendata.arcgis.com/datasets.
[4] Wells, Steve, Interview with Cowan Executive Vice President.[5] Woodall, Bernie. 2017. “Florida prepares for powerful Hurricane Irma.” Reuters. 5 Sep 2017.
https://www.reuters.com/article/us-storm-irma-florida/florida-prepares-for-powerful-hurricane-irma-idUSKCN1BG33L.
[6] DAT. 2018. “National Van Demand and Capacity.” DAT Trendlines.https://www.dat.com/industry-trends/trendlines/van/demand-and-capacity.
[7] CBS News. 2017. “Hurricane Irma becomes most powerful storm ever recorded in AtlanticOcean.” CBS News. 6 Sep 2017https://www.cbsnews.com/news/hurricane-irma-record-atlantic-ocean-category-5-track-forecast-path/.
[8] Johnson, Alex, Daniel Arkin, Jason Cumming, and Bill Karins. 2017. “Hurricane Irma SkirtsPuerto Rico, Leaves 1 Million Without Power.” NBC News. 7 Sep 2017.https://www.nbcnews.com/storyline/hurricane-irma/hurricane-irma-skirts-puerto-rico-lashing-it-powerful-winds-flooding-n799086.
[9] Moon, Troy. 2017. “Moon: Be prepared — but don't panic — as Florida braces for HurricaneIrma.” Pensacola News Journal. 8 Sep 2017.https://www.pnj.com/story/news/2017/09/08/troy-moon-hurricane-irma-be-prepared/643519001/.
[10] Scott, Rick, and Florida Governor's Press Office. 7 Sep 2017. Gov. Scott Issues Updates onHurricane Irma Preparedness. Subject: News Releases.https://www.flgov.com/2017/09/07/gov-scott-issues-updates-on-hurricane-irma-preparedness-5/.
[11] Scott, Rick, and Florida Governor's Office. 8 Sep 2017. Gov. Scott Issues Updates on HurricaneIrma Preparedness. Subject: News Releases.http://floridasturnpike.com/content/documents/news_release/NEWS%20RELEASE%20Gov.%20Scott%20Issues%20Updates%20on%20Hurricane%20Irma%20Preparedness.pdf.
[12] Griffin, Justine. 2017. “Hurricane Irma makes it tough to stock up, find a hotel or even book aflight.” Tampa Bay Times. 6 Sep 2017.http://www.tampabay.com/news/business/retail/hurricane-irma-makes-it-tough-to-stock-up-find-a-hotel-or-even-book-a/2336464.
[13] Ellis, Ralph, and Eric Levenson. 2018. “Floridians jam highways to flee wrath of HurricaneIrma.” CNN. 8 Sep 2017 https://www.cnn.com/2017/09/07/us/hurricane-irma-evacuation-florida/index.html.

28 | References
[14] Winsor, Morgan. 2017. “Florida governor urges residents ahead of Hurricane Irma: 'You've gotto get out; you can't wait'.” ABC News. 8 Sep 2017 https://abcnews.go.com/US/florida-governor-urges-residents-ahead-hurricane-irma-youve/story?id=49698869.
[15] FDOT. 2018. Hurricane Irma Emergency Evacuation Report and Recommendations. FloridaDepartment of Transportation.http://www.fdot.gov/info/CO/news/newsreleases/020118_FDOT-Evacuation-Report-Appendix.pdf.
[16] Key Messages on Hurricane #Irma as of 5:00 PM EDT: Fri Sep 08, 2017. 2017. National WeatherService, @NWS. Twitter message.https://twitter.com/NWS/status/906281439431462912/photo/1?ref_src=twsrc%5Etfw&ref_url=https%3A%2F%2Fheavy.com%2Fnews%2F2017%2F09%2Fmiami-irma-latest-hurricane-update-path-forecast-weather-map-dade-county%2F.
[17] Bomey, Nathan, Alexandra Glorioso, USA TODAY, and Naples (Fla.) Daily News. 2017.“Hurricane Irma triggers gas shortages as panicking Florida motorists evacuate.” USA Today. 8Sep 2017https://www.usatoday.com/story/money/2017/09/08/hurricane-irma-gas-shortages-florida/645747001/.
[18] Intek Inc., and AOC Petroleum Support Services LLC. 2014. United States Fuel ResiliencyVolume I - US Fuels Supply Infrastructure Characterization. Office of Energy Policy and SystemsAnalysis, U.S. Department of Energy. September 2014.https://www.energy.gov/sites/prod/files/2015/04/f22/QER%20Analysis%20-%20United%20States%20Fuel%20Resiliency%20Volume%20I.pdf.
[19] EIA, and ICF International. 2016. East Coast and Gulf Coast Transportation Fuels Markets. U.S.Energy Information Administration, U.S. Department of Energy. February 2016.https://www.eia.gov/analysis/transportationfuels/padd1n3/pdf/transportation_fuels_padd1n3.pdf.
[20] Dolce, Chris. 2017. “Hurricane Irma's Track Forecast: Here's What to Expect in Florida,Georgia, and the Carolinas.” The Weather Channel. 8 Sep 2017.https://weather.com/storms/hurricane/news/hurricane-irma-florida-georgia-south-carolina-north-carolina-forecast-path.
[21] Cotterell, Bill. 2017. “Rick Scott on Hurricane Irma: 'Our state has never seen anything like it'.”Tallahassee Democrat. 9 Sep 2017.https://www.tallahassee.com/story/news/hurricane/2017/09/09/hurricane-irma-rick-scott-the-storm-here/649312001/.
[22] Cangialosi, John P., Andrew S. Latto, and Robbie Berg. 2018. NATIONAL HURRICANE CENTERTROPICAL CYCLONE REPORT: HURRICANE IRMA (AL112017) - 30 August–12 September 2017.National Hurricane Center, National Weather Service, National Oceanographic andAtmospheric Administation. 30 June 2018.https://www.nhc.noaa.gov/data/tcr/AL112017_Irma.pdf.
[23] Florida Power and Light. “FPL's massive Hurricane Irma restoration effort is underway with arecord workforce of nearly 19,500 responding to the largest number of outages in companyhistory.” FPL Newsroom. 11 Sep 2017 http://newsroom.fpl.com/2017-09-11-FPLs-massive-Hurricane-Irma-restoration-effort-is-underway-with-a-record-workforce-of-nearly-19-500-responding-to-the-largest-number-of-outages-in-company-history.
[24] EIA. Geospatial data. "Petroleum Product Terminals" and "Petroleum Ports (≥ 200 short tons)".Shapefile. U.S. Energy Information Administration. https://www.eia.gov/maps/layer_info-m.php.
[25] US Census Bureau. 2016. American Community Survey.[26] GasBuddy. “IRMA LIVE UPDATES: FUEL AVAILABILITY & STATION OUTAGES.” 11 Sep 2017
https://business.gasbuddy.com/hurricane-irma-live-updates-fuel-availability-station-outages/.
Excerpt from Supply Chain Resilience and the 2017 Hurricane Season | 29
[27] EIA. “Hurricane Irma cut power to nearly two-thirds of Florida's electricity customers.” Todayin Energy, U.S. Energy Information Administration 20 Sep 2017.https://www.eia.gov/todayinenergy/detail.php?id=32992.
[28] US Department of Energy. Hurricane Irma & Hurricane Harvey Event Summary InfrastructureSecurity and Energy Restoration, US Department of Energy. (Report #26).https://www.energy.gov/sites/prod/files/2017/09/f36/hurricanes-irma-and-harvey-event-summary-26.pdf.
[29] Port Canaveral. “Port Canaveral Resumes Operations - Port opened by U.S. Coast Guard withoperating restrictions; prepares for vessel arrivals scheduled for today and tomorrow.” RecentNews. 12 Sep 2017. https://www.portcanaveral.com/About/Recent-News/Port-Canaveral-Resumes-Operations-Port-opened-by.