fuel cell technologies office webinar - energy.gov · plate design parameters a (mm) h (mm) arc...
TRANSCRIPT

Fuel Cell Technologies Office | 1Fuel Cell Technologies Office Webinar
Manufacturing Competitiveness and Supply Chain Analyses for Hydrogen Refueling Stations
Presenter: Ahmad MayyasAnalyst - Clean Energy SystemsNational Renewable Energy Laboratory
05/011/2017

Fuel Cell Technologies Office | 2Question and Answer
• Please type your questions into the question box
2

CEMAC – Clean Energy Manufacturing Analysis Center 3
Manufacturing Competitiveness and Supply Chain Analyses for Hydrogen Refueling Stations
Ahmad Mayyas National Renewable Energy Laboratory

CEMAC – Clean Energy Manufacturing Analysis Center 4
Agenda
Introduction
International HRS Status
Analysis of HRS Capital Cost
Manufacturing of HRS components
Concluding Remarks
I.
III.
II.
IV.
V.

CEMAC – Clean Energy Manufacturing Analysis Center 5
IntroductionI

CEMAC – Clean Energy Manufacturing Analysis Center 6
Relevance & Goals
• Provide a platform for manufacturing cost analysis for major hydrogen refueling station (HRS) systems– Identify cost drivers of major parts in the HRS– Investigate effect of learning experience and
availability of part suppliers on the cost of some HRS systems
• Study supply chain and evaluate U.S. manufacturing competitiveness in the international market

CEMAC – Clean Energy Manufacturing Analysis Center 7
Approach Global Assumptions(e.g. capital, tool life,
building life)
Local Assumptions by Country
(e.g. labor, energy cost, building cost)
Manufacturing Cost Model(compressor, storage tanks, dispenser,
chiller, and heat exchanger)
Benchmark with Existing/Future
Commercial Products
Compare to Other Cost Studies
(HRSAM, H2FIRST, California, Japan, Europe)
HRS Rollouts 2005-2016
(PNNL, CEC, NEDO, HySUT, NOW, CEP)
HRS Trade Flows(HRS developers, part
suppliers)
Supply Chain MapsHRS technology
(gaseous, liquid, onsite) system components
Future HRS Rollouts2016-2030
Minimum Sustainable Price(manufacturing cost, profit
margin, transportation)
Qualitative Factors(e.g. skilled labor, existing supply chain, regulations,
tax policy)
Quantifying These Factors
Key Outputs1) HRS system manufacturing costs and minimum sustainable prices2) International trade flows and supply chain maps (U.S. supply chain)3) Estimation of future HRS technologies cost and effects on H2 price

CEMAC – Clean Energy Manufacturing Analysis Center 8
Hydrogen Delivery to the HRS
Truck delivery Compressed H2Tube storage
CompressorHigh pressure
hydrogen storage/cooling
Dispenser
A configuration of a hydrogen station with gaseous hydrogen delivery
Truck delivery Liquid H2 Tank Cryogenic Pump
A configuration of a hydrogen station with Liquid hydrogen delivery
Evaporator
Liquid Hydrogen
Storage/ buffer tanks
Dispenser

CEMAC – Clean Energy Manufacturing Analysis Center 9
Gaseous HRS ComponentsHydrogen Refueling
Station (HRS)
Storage System Dispensing System Electrical System
Compressor
Compression System
Cooler
Bleed Valves
Tubing
Pressure Safety Valve
Tubing and Fittings
Nozzles (35MPa/70MPa)
Bulk Pressure Storage
Utility Feed
Air Operated
Valves
PLC(card reader, digital
display, etc. )
Heat Exchanger
IR Flame Detectors
PLC/ Solenoid Valves
Position Switch
Check Valves Check Valves
Bleed Valves
Air Operated
Valves
Fittings
Pressure Safety Valve
Hydrogen Receiving
Compressor
Valves
HosesCascade Storage
Modeled
Motors and Transmitters

CEMAC – Clean Energy Manufacturing Analysis Center 10
FCEV Sales 2015-2030• 2020 sales/production
estimate >30,000 FCEVs • 2030 sales/production
estimates >250,000 FCEVs on roads
• Is hydrogen infrastructure ready to support this number of FCEVs?
Pratt et al., 2015
UkH2Mobility
FCEV number between 2014-2028

CEMAC – Clean Energy Manufacturing Analysis Center 11
International HRS Status II

CEMAC – Clean Energy Manufacturing Analysis Center 12
International HRS Rollouts
HRS: Hydrogen Refueling StationData Sources: PNNL, CEC, NEDO, HySUT, NOW, CEP

CEMAC – Clean Energy Manufacturing Analysis Center 13
HRS Trade Flows Map
Data Sources: PNNL, CEC, HySUT, H2Stations.org

CEMAC – Clean Energy Manufacturing Analysis Center 14
International Manufacturers
This map can be accessed from: https://maphub.net/mayyas111/HRS

CEMAC – Clean Energy Manufacturing Analysis Center 15
Analysis of HRS Capital CostIII

CEMAC – Clean Energy Manufacturing Analysis Center 16
HRS Capital Cost
Mossa, 2013
Elgowainy et al., 2015
Other Expenses include site engineering, permitting, commissioning, and constructionPratt et al., 2015
Shinka, 2014Suzauki, 2014
Liquid H2 Stations

CEMAC – Clean Energy Manufacturing Analysis Center 17
Manufacturing of HRS componentsIV

CEMAC – Clean Energy Manufacturing Analysis Center 18
Assumptions- Compressor Manufacturing• 1 stage compressor• Compression ratio < 6:1• Pin= 150-200 bar, Pout= 350-420 bar (5,000-6,000 psi)• Manufacturing cost model for compressor case and internal
parts only• Balance of system was added to the direct manufacturing
cost of the compressor case &internal parts• Profit margin was estimated using weighted average cost of
capital (WACC) method• 70 MPa HRS might need a hydrogen booster besides the
compressor to increase the pressure from 350-420 bar (35-42 MPa) to about 700-900 bar for direct filling or storage in the cascade/buffer system

CEMAC – Clean Energy Manufacturing Analysis Center 19
Process Flow Diagram- Piston Compressor

CEMAC – Clean Energy Manufacturing Analysis Center 20
Manufacturing Cost Analysis
• Compressor frame and internal parts
• Not including balance of system

CEMAC – Clean Energy Manufacturing Analysis Center 21
www.PDCMachines.com
H2 Compressor -Balance of System

CEMAC – Clean Energy Manufacturing Analysis Center 22
Minimum Sustainable Price - Compressor• Compressor capacity= 92
Nm3/hr or 200 kg/day (1 stage)• Pin= 150-200 bar, Pout= 350-420
bar• Shipping cost is assumed for
shipping compressors from East Coast to West Coast in this example
• Margin was calculated using WACC

CEMAC – Clean Energy Manufacturing Analysis Center 23
Sensitivity Analysis
Input parameters were varied by +/- 10% (relative) from base values to identify the modeled price sensitivities to various input assumptions

CEMAC – Clean Energy Manufacturing Analysis Center 24
Minimum Sustainable Price - Compressor• United States advantages are lower
shipping and interest rates and longer experience in this field
• China’s advantage relative to the U.S. is driven by lower labor (including assembly), low material cost, building and energy costs
• Mexico’s advantage relative to the U.S. is driven by lower labor (including assembly), and building costs

CEMAC – Clean Energy Manufacturing Analysis Center 25
Hydrogen Dispenser
HyTReC

CEMAC – Clean Energy Manufacturing Analysis Center 26
Dispenser Cost Analysis
Parts & Assembly Cost (assuming 20% discount per 10X increase in purchased quantity)
Parts Only

CEMAC – Clean Energy Manufacturing Analysis Center 27
Minimum Sustainable Price - Dispenser
• United States advantages are lower shipping and interest rates and longer experience in this field
• Mexico’s advantage relative to the U.S. is driven by lower labor, and building costs

CEMAC – Clean Energy Manufacturing Analysis Center 28
Advance Heat Exchanging Technology
DCHE: Diffusion Bonded Compact Heat Exchanger
Images for: NREL HRS and Kobelco DCHE

CEMAC – Clean Energy Manufacturing Analysis Center 29
Plate cleaning Chemical etching
Cold & Hot plate stacking
Vacuum diffusion bonding
Welding nozzles to the stack
Quality check (profilometer)
Adding housing Pressure testing
Microchannel Heat Exchanger - Process Flow
Mask (Ferric Chloride)
• Chemical etching can be replaced by laser grooving.• Laser grooving speed= 300mm/min
Image Source: Heatric.com

CEMAC – Clean Energy Manufacturing Analysis Center 30
Parabolic Channels
Square Channels
Plate Design Parameters
a (mm) h (mm)Arc Length
(mm)
Plate Thickness
(mm)
Transfer Area of Individual
Channel (mm2)a (mm) b (mm)
Plate Thickness
(mm)
Square Channel- Transfer Area of
Individual Channel (mm2)
0.125 0.20 0.897 0.500 458.97 0.25 0.25 0.500 400.00
Individual Plate Size= 400*300 mm2=375,000 mm2
Distance between Individual Channels= 750 μm
Parabolic Channel DesignChannel Parameters
Square Channel DesignChannel Parameters
Chosen Design
a
b
CEMAC – Clean Energy Manufacturing Analysis Center 31
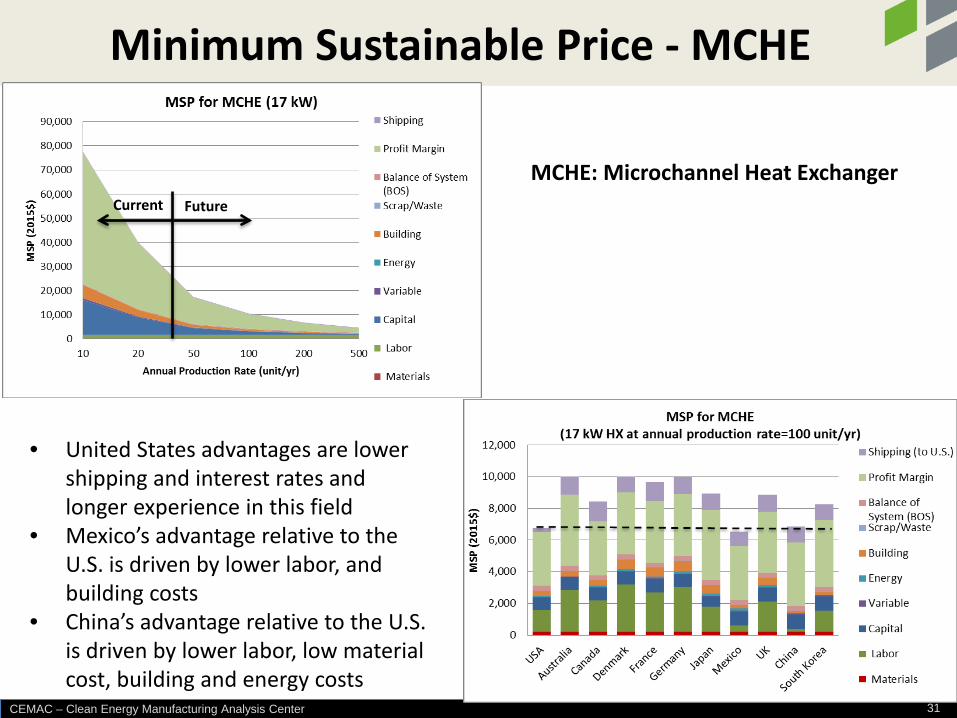
Minimum Sustainable Price - MCHE
• United States advantages are lower shipping and interest rates and longer experience in this field
• Mexico’s advantage relative to the U.S. is driven by lower labor, and building costs
• China’s advantage relative to the U.S. is driven by lower labor, low material cost, building and energy costs
Current Future
MCHE: Microchannel Heat Exchanger

CEMAC – Clean Energy Manufacturing Analysis Center 32
Concluding RemarksV

CEMAC – Clean Energy Manufacturing Analysis Center 33
HRS Capital Cost and Hydrogen Price
Ways of reducing hydrogen cost• Economies of scale for HRS
systems can reduce hydrogen cost more than 5-10% (~20 of CSD cost)
• Standardization can do similar thing (e.g. compressors, chillers, heat exchangers, etc.)
• Installing liquid hydrogen station. Depends on number of FCEV and utilizations of HRS
1 kg H2 ≈ 1 gallon of gasoline equivalent (gge)
Actual Cost (X$1,000)Capital Cost
FirstElement HRS
Future Cost (X$1,000)
@ 10 units/yr
Future Cost (X$1,000)
@ 100 units/yrInstallation cost, O&M and
Feedstock n/a n/a n/aCompressor 270 145 46Ground Storage Tanks 370 320 176Dispenser 270 87 82Chiller 150 120 96Other Systems 547 450 400Installation Cost 408 408 408HRS Installed Cost 2,015 1,530 1,208

CEMAC – Clean Energy Manufacturing Analysis Center 34
Conclusions
• Lack of standardization may result in higher manufacturing cost
• U.S.-based manufacturers have advantages of longer experience in the field and low energy cost
• Future technologies and economies of scale will have great impact on the HRS cost and H2 prices

CEMAC – Clean Energy Manufacturing Analysis Center 35
Thank youAhmad Mayyas ([email protected])
www.manufacturingcleanenergy.org

Fuel Cell Technologies Office | 36Question and Answer
• Please type your questions into the question box
36

Fuel Cell Technologies Office | 37
Thank you
hydrogenandfuelcells.energy.gov
Nancy Garland([email protected])
Ahmad Mayyas([email protected])

CEMAC – Clean Energy Manufacturing Analysis Center 38
References• Seiji Maeda. IPHE Workshop on Commercial-Ready HRS –design and social acceptance. Nov. 2013. Fukuoka, Japan.• Takahiko Suzuki. Market Update & Business Opportunities: Japan’s Fuel Cell & Hydrogen Market. U.S. Commercial
Service – Tokyo• Masaaki Kawatsuki. The spread plan of fuel cell vehicles in Japan, future issues, and JPEC’s role of in the creation of
hydrogen society. October 29th, 2014. • Paris, 4/18/2013 l MOSSA Jean-Baptiste l ALH2E.
(http://www.afhypac.org/images/documents/ecartec_20130417.pdf).• Amgad Elgowainy et al., 2015. Overview of Station Analysis Tools Developed in Support of H2USA
http://energy.gov/sites/prod/files/2015/05/f22/Fcto_webinarslides_h2usa_station_analysis_tools_051215.pdf• Yoshihiro Shinka. Hydrogen and Fuel cell utilization in Japan and NEDO’s R&D activity for Hydrogen and Fuel cell
technology. 5th IPHE H2igher Educational Rounds. December 1st , 2014 Rome, Italy. • Dr. U. Bünger, H. Landinger, E. Pschorr-Schoberer, P. Schmidt, W. Weindorf, J. Jöhrens, U. Lambrecht, K. Naumann, A.
Lischke. Power-to-Gas (PtG) in transport. Status quo and perspectives for development. Munich, Heidelberg, Leipzig, Berlin, 11 June 2014.
• UKH2Mobility. http://www.theregister.co.uk/2013/02/04/hydrogen_could_be_mainstream_car_fuel_by_2030/• http://autogreenmag.com/tag/india/page/6/• Joseph Pratt, Danny Terlip, Chris Ainscough, Jennifer Kurtz, Amgad Elgowainy. H2FIRST Reference Station Design
Task Project Deliverable. Technical Report NREL/TP-5400-64107 SAND2015-2660 R April 2015.• Tatsunu Dispenser image: hydrogenius.kyushu-u.ac.jp/cie/event/ihdf2013/pdf/2-6watanabe13.pdf• Pierre-Etienne Franc (Air Liquide vice president). IPHE Workshop on Commercial-Ready HRS –design and social
acceptance. November 2013. Fukuoka, Japan• California Energy Commission (CEC). Joint Agency Staff Report on Assembly Bill 8: Assessment of Time and Cost
Needed to Attain 100 Hydrogen Refueling Stations in California. December 2015. http://www.energy.ca.gov/2015publications/CEC-600-2015-016/CEC-600-2015-016.pdf
• Joaquim Oliveira Martins, Stefano Scarpetta and Dirk Pilat. 1996. “MARK-UP RATIOS IN MANUFACTURING INDUSTRIES Estimates for 14 OECD Countries”. http://www.oecd.org/fr/eco/reforme/35135088.pdf
• Bruce Hedman and Ken Darrow. CHP Technology Characterizations. July 2010

CEMAC – Clean Energy Manufacturing Analysis Center 39
Backup Slides

CEMAC – Clean Energy Manufacturing Analysis Center 40
Dispenser Cost Analysis
Part No. Part Supplier 1Required
Units
p Dispenser
($)1 SOLENOID VALVE Omega 1 7152 Flow Meter Alicate 1 10000
3Pressure checking/Regulating Valves
Tescom 1 4771
4Pressure Relief Valve
High Pressure Equipment Company
1 658
5 Breakaway valve Oasis 1 39536 Hydrogen Leak Sensor SBS 1 695
7 IR flame detector 2 3000
8 Pressure sensors Sensor Solutions
2 600
9 Temperature sensors TempSensing 1 50
10 Hydrogen filter 1 100011 Piping (10 m required) Zoro 10 250
12Tubing and Fittings (10 units estimated)
Swagelok 15 750
13 Air Actuated valve Valworx 1 16014 Control Unit Siemens 1 100015 Hose (single/double) NanoSonic 1 10016 Nozzle OPW 1 453117 Nozzle Boot 1 20018 Power Supply iGem 1 27519 Digital Display Wayne 1 34720 Card Reader Ovation 1 14921 Console/keypad Wayne 1 58022 Console printer Wayne 1 38523 Fueses (3A; 5A; 10A) Mersen 3 6024 Relays (3A; 5A; 10A) Releco 3 7525 k-type thermocouples Autocalve 2 20426 Enclosure n/a 1 500
27Shut-down emergency Button VanTech 1 40Total 35,048
Single Hose Dispenser H35
Part No. Part Supplier 1Required
UnitsCost per
Dispenser ($)1 SOLENOID VALVE Omega 2 14302 Flow Meter Alicate 2 20000
3Pressure checking/Regulating Valves
Tescom 2 9542
4Pressure Relief Valve
High Pressure Equipment
2 1316
5 Breakaway valve Oasis 2 79066 Hydrogen Leak Sensor SBS 1 695
7 IR flame detector 2 3000
8 Pressure sensors Sensor Solutions
4 1200
9 Temperature sensors TempSensing 2 100
10 Hydrogen filter 2 200011 Piping (20 m required) Zoro 20 500
12Tubing and Fittings (20 units estimated)
Swagelok 20 1000
13 Air Actuated valve Valworx 1 16014 Control Unit Siemens 1 100015 Hose (single/double) NanoSonic 2 20016 Nozzle OPW 2 1453117 Nozzle Boot 2 40018 Power Supply iGem 1 27519 Digital Display Wayne 1 34720 Card Reader Ovation 1 14921 Console/keypad Wayne 1 58022 Console printer Wayne 1 38523 Fueses (3A; 5A; 10A) Mersen 3 6024 Relays (3A; 5A; 10A) Releco 3 7525 k-type thermocouples Autocalve 2 20426 Enclosure n/a 1 500
27Shut-down emergency Button
VanTech 1 40Total 67,595
Dual Hose Dispenser H35/H70

CEMAC – Clean Energy Manufacturing Analysis Center 41
Double Tube Heat ExchangerHX Design
Process Flow

CEMAC – Clean Energy Manufacturing Analysis Center 42