fuel model mapping and fire simulation modeling paul t ... · fuel model mapping and fire...
TRANSCRIPT

Fuel Model Mapping and Fire Simulation Modeling
Paul T. Tueller, Karl Krauter, Kevin Hill, Tzutai Cheng and Erin Noonan
Department of Environmental and Resource Sciences, University of Nevada Reno
100 Valley Road, Reno, Nevada 89512 [email protected]
KEY WORDS: Wildfire, vegetation mapping, satellite imagery, fuel models
ABSTRACT
IRS 6m satellite images have been used to map the vegetation of range and forest landscapes inwestern Nevada and the eastern Sierra Nevada, California. Vegetation is being mapped by 7.5minute topographical quadrangle sheets. These maps are being reinterpreted and new mapsprepared of U.S. Forest Service NFFL Fire Fuel Models. A supervised stepwise linearclassification algorithm combining three multispectral bands, slope , aspect and one or morevegetation indices and filters give classification accuracies between 50 and 70 percent based onsatellite data. A third map of each quad is also being prepared showing fire hazard (high, moderateand extreme) based on three general vegetation classes (grass, shrub and tree) and three slopeclasses ((0-20 percent, 21-40 percent and >40 percent). The FARSITE fire simulation model isbeing used to describe wildfire scenarios of interest to fire suppression professionals. Based on thebehavior characteristics of the various fuel models determinations were made of potential fire spreadrates for selected sites and weather patterns.
1 Introduction
Natural landscapes are covered with soil and vegetation. The soils are relatively permanent unlessextreme accelerated erosion takes place. The vegetation, on the other hand, is much less permanentand is influenced by numerous perturbations over time and forms the basis for wildfire fuels. Theseperturbations include logging, grazing and browsing, flooding, disease and wildfire. This paper brieflydescribes the vegetation along the eastern Sierra Front in eastern California and western Nevada(Fig. 1)and discusses the vegetation in terms of fire fuel models and their associated fire behaviorcharacteristics. The area includes the east side of the Sierra Nevada from the ridge top down to theeast and extends out into the Great Basin to include all areas where urban encroachment makeswildfire and the natural vegetation of concern. The paper also discusses the mapping of thevegetation from the Indian Remote Sensing ((RS) 5 m satellite images, the reinterpretation of thesemaps into fuel model maps and the preparation of hazard maps for the same areas. Maps of the fuelcharacteristics provide a valuable tool to fire suppression professionals as they attempt to understandfire behavior and contend with the many wildfires that occur in this part of the world.
Tueller, Paul
International Archives of Photogrammetry and Remote Sensing. Vol. XXXIII, Part B7. Amsterdam 2000. 1551

Fig. 1 Study site along the boundary between California and Nevada north and south of Lake Tahoe.
Tueller, Paul
International Archives of Photogrammetry and Remote Sensing. Vol. XXXIII, Part B7. Amsterdam 2000.1552

2 The Vegetation
The natural and sometimes man-made vegetation along with the topography and the weather definefire behavior in any particular situation. Predicting fire behavior requires relatively accuratedescriptions of the vegetation and the topography. The often unknown element is the specificweather characteristics at the time of ignition and throughout the duration of the fire. Here we brieflydescribe the vegetation of the eastside of the Sierra Nevada extending eastward into the Great Basin. In addition we have attempted to instruct the reader to identify the fuel model that is relevant when atype of vegetation with certain dominant species are present.
A place to begin is at the ridge top. The east side of the Sierra Nevada is essentially in the rainshadow of this auspicious mountain range. As one moves downward into the Great Basin the rainfalldecreases substantially. At the ridge line the precipitation amounts may vary from 20- to 25 inchesannually, much of it in the form of snow. As we continue downslope we find that the long termaverage annual precipitation at Reno is only 7.8 inches and even less as one moves further eastward. This, of course, profoundly influences the kind and amount of vegetation and the potential wildfirebehavior characteristics.
At the highest elevations the vegetation is rather sparse and is characterized by various species oftrees often growing on granite. These are often referred to as subalpine forests or subalpine mixedforests. The plant communities are characterized by dwarf trees sometimes referred to askrummholz by plant ecologists. A prominent tree species is whitebark pine (Pinus albicaulis). Anadditional tree species is Sierra Juniper (Juniperus occidentalis var australis). A number of dwarfshrubs are also found there and a few grasses and forbs. Normally there is little fuel to carry a fire.
Then just lower in elevation the vegetation can best be described as mixed conifer woodland. Thedominant tree species in this mixed conifer woodland area are red fir (Abies magnifica), Californiawhite fir (Abies concolor var. lowiana), western white pine (Pinus monticola), sugar pine (Pinuslambertiana) and incense-cedar (Calocedrus decurrens). On drier sites the vegetation isdominated with big or low sagebrush (Artemisia tridentata or A. arbuscula) and often by standswhere bitterbrush (Purshia tridentata) becomes important. At elevations above about 6,000 feetmountain big sagebrush (Artemisia tridentata var vaseyana) is the common sagebrush taxa. Manyof the rocky dry sites are dominated with curlleaf mountain mahogany (Cercocarpus ledifolius). This, often highly dissected topography, has dramatic changes in plant species composition over veryshort distances. This often leads to a spotty fire distribution.
Much of the mixed conifer woodland and the lower elevation forest vegetation has been burned andis now dominated by the eastern Sierra Nevada fire types characterized by the dominance of certainchaparral species. The three most common ones are Tobacco brush (Ceanothus velutinus),greenleaf manzanita (Arctostaphylos patula) and Squaw Carpet (Ceanothus prostratus). Huckleberry oak (Quercus vaccinifolia) is also common in certain areas.
At still lower elevations below the mixed conifer vegetation the forest vegetation is dominated by
Tueller, Paul
International Archives of Photogrammetry and Remote Sensing. Vol. XXXIII, Part B7. Amsterdam 2000. 1553
yellow pine. Three species of yellow pine are involved. These are Ponderosa Pine (Pinusponderosae), Jeffrey Pine (Pinus jeffreyi) and in some instances Washoe Pine (Pinus washoensis). Washoe pine is usually found at higher elevatons than the other two species. Many of these areashave burned over the years forming areas of chaparral.
At lower elevations still the understory of yellow pine is dominated by big sagebrush and/orbitterbrush. As the pine becomes scarce large areas are found that are dominated by these twoshrubs. The bitterbrush is often a large columnar form. On drier areas the big sagebrush is dominantby itself or one of the shorter sagebrush species, sometimes called low sagebrush become dominant. These might be low sagebrush (Artemisia arbuscula) or Lahontan sagebrush (Artemisia arbusculassp.longicaulis). Other shrubs such as rabbitbrushes (Chrysothamnus naseosus and C.viscidiflorus) can add to the fuel load along with cheat grass and a number of perennial grasses andforbs adding to the fine fuel load.
Moving outward farther into the Great Basin to the east the lowest elevations areas and valleybottoms are dominated with salt desert shrub species. The most important species are Bailey’sGreasewood (Sarcobatus baileyi), black greasewood (Sarcobatus vermiculatus), shadscale(Atriplex confertifolia) and four-wing salt bush (Atriplex canescens). In past years these typeshave not presented a high hazard for wildfire but with an increasing abundance of cheat grass andother weeds such as Russian thistle or tumble weed (Salsola tragus) and the mustards (Sysimbriumsp and Descurainia sp) the spread of fire after wet years can be significant. In addition urban areaswith small ranchettes are spring up all over these areas.
Another important fuel type is the pinyon/juniper woodland. The dominant trees are the single needlepinyon (Pinus monophylla) and the Utah juniper (Juniperus osteosperma). This vegetation oftenburns under conditions of low humidity and when there is ample understory cover to provide finefuels. The common understory species consist of several of the shrubs already mentioned such as bigand low sagebrushes, rabbitbrush, horse brushes (Tetradymia spp.) and a number of grasses,including the annual cheat grass, and a variety of forbs. When this type has a sparse understory itusually means that the trees are close together occupying the site totally and thus allowing a fire tospread easily from tree to tree after ignition.
Spread throughout the area are the riparian vegetation types including mountain meadows that maybe dominated by herbaceous species alone or have an overstory or partial overstory of willows(Salix spp.), cottonwoods, e.g. the black cottonwood (Populus trichocarpa) and other riparianshrubs. In the fall when the herbaceous and woody material matures these areas can present a firehazard. Often in the spring they are quite wet and difficult to burn. At higher elevations these sitesare dominated by aspen (Populus tremuloides), alder (Alnus sp.), river hawthorne (Craetagus sp.)and a number of willow species.
3 Fuel Models and Fire Behavior
There are certain biological and physical components to a description of fire behavior. These arecommonly called fuel models (Anderson 1982). The surface litter layer, the duff, dead woody
Tueller, Paul
International Archives of Photogrammetry and Remote Sensing. Vol. XXXIII, Part B7. Amsterdam 2000.1554

material, grasses and forbs, living woody shrubs and trees (including the canopies), and treereproduction are all rather easily discernible components with the fuel complex. Depending on whattype of vegetation that dominates the site, the fuel may be divided into five general groups: grassesand grass-like plants, forbs, shrubs, timber and slash. Each cover type is characterized by aparticular rate of fire spread, a value loosely determined through field trials, observations and firereports. Basically two systems are used to define the fuel models, the Northern Forest FireLaboratory (NFFL) with 13 fuel models and the National Fire danger Rating (NFDR) system with20 fuel models. This paper uses the NFFL fuel models. Each of these 13 has been defined as a kindof wildland fire fuel situation with specific characteristics of fire behavior. Emphasis is given to howthese fuel model descriptions can be applied to the eastside Sierra Nevada. These fuel models arelisted in Table 1 where you can find one or more examples of the kind of vegetation that might beplaced in each of the fuel models for our area. The first three of the 13 are grass types, models 4, 5,6 and 7 are shrub dominated, models 8, 9 and 10 are timber types and models 11, 12 and 13 havetheir fire behavior mostly influenced by timber slash (Anderson 1982). .
It must be remembered that the vegetation and dominant species may suggest one fuel model butgiven certain weather, fuel moisture and other parameters may act as an entirely different fuel model,one of the 13. For example, just because it is a big sagebrush dominated plant community it may notbe a fuel model five. In fact in the study area big sagebrush generally falls into a fuel model #2. Inaddition it should be noted that the 13 fuel models refer only to ground spread of fire but not forcrown fires. Procedures for inventorying surface and biomass in the field are available (Brown et al1982)
4 MAPPING
To understand a landscape it is necessary to have a vegetation map (Fig. 3). However, even with ahigh quality accurate vegetation map you are only part way there. Such a map requires completereinterpretation into fire fuel models. This interpretation requires that each vegetation map must bedescribed in terms of the fuel models they likely represent. There is not a one-to-one relationshipbetween plant communities and fuel models. Several plant communities each with their specificdominant species and species composition make up may all act very similar as to their fire behaviorand thus would each be placed into a single fuel model in a fuel model map (Fig. 4). The need is tohave a map of fuel models where each polygon accurately represents how a fire will behave givenand ignition and specified weather characteristics. Generally we develop maps and weatherscenarios that are worst case. Once the fuel models are mapped, where each polygon accuratelyrepresents how a fire will behave given specific weather characteristics, this information can assist infire suppression efforts, land use planning and in other manners.
The importance of assessing the accuracy of Land-use and Land-cover including the vegetationclasses derived from remotely sensed data has long been recognized (Stehman 1992). Traditionally,pixels are the fundamental units of satellite images and are used in the analysis of spatial data (Steeleet al 1998). Our vegetation mapping was completed using image processing classificationprocedures on the IRS 6m fuse blend satellite data (Fig.2). A stepwise linear algorithm was usedwith the following raster files: blue, green, infrared, and slope and aspect from DEMs and the
Tueller, Paul
International Archives of Photogrammetry and Remote Sensing. Vol. XXXIII, Part B7. Amsterdam 2000. 1555

Transformed Vegetation Index (TVI). Training sites were selected to represent areas for estimatingtypical spectral values for each class (Verbyla 1995). The vegetation map included 15 classes: lake,snow, barren, crop, alpine, dy meadow, rabbitbrush/sagebrush/bitterbrush, high sierra shrubland,mixed shrubland, riparian shrubland/woodland with wet meadows and aspen forest, mountainmahogany woodland, pinyon/juniper woodland, mixed forest (shaded), mixed forest and ephedrashrubland.
Vegetation classification accuracy was checked with ground mapping portions of the landscapesstudied (Congalton 1991). After classification noise or speckling was reduced by using a 7X7 highpass filter. Such a filter allows for the presentation of polygons that have greater homogeneity.Accuracies varied from 50 to 70 percent which is rather common using satellite imagery. The vegetation maps where then reinterpreted into fuel model maps (Fig. 4) to be used with theFARSITE fire simulation model which we have used to assist in determining the fire behavior to beexpected when a fire is ignited and given certain weather and landscape factors such as wind speedand direction, temperature, humidity, slope and aspect.
Prior to a classification for fuel models sub-samples of the study site were used to determinemethodology that would produce the most accurate results over the entire study area. We determinethat Thematic Mapper (TM) data produce slightly more accurate fuel model classifications (Fig.4) than the IRS images, although there was no statistical difference when comparing percent accuracyand that results in a t-test at alpha is equal to 0.05. We decided with these results to use TMimagery in our classification of the study area because TM as a higher spectral resolution than theIRS data. The TM scene also had covered the entire study area were as with the IRS imagery wehad complete coverage but full coverage was an assembly of 7.5’ quadrangles with 2 different dates. We also found in our sub-sample results that using all of the TM bands, linearly stretched NDVI, andcategorized slope and aspect produced the highest percent accuracy values when using the stepwiselinear classification algorithm. In our final fuel model classification of the study area we include theaforementioned data layers plus an annual precipitation layer. We found that with the annualprecipitation layer included we could more accurately decipher pinyon-juniper woodlands (generallya fuel model 5) from adjacent mountain ranges which were dominated by yellow pine species(considered one of the 3 forest fuel models).
Once the final classification was completed a 3x3 window modal noise-reducing filter was applied tothe results to remove pixel clusters that were smaller than our 1 hectare minimum mapping unit. Accuracy assessment on portions of our final results ranged from 60 – 75%.
4.1 Creation of FARSITE data layers
Five landscape layers are necessary to run the fire simulation program Farsite, slope, aspect,elevation, fuel model, and forest canopy cover. In Arc/Info we derived slope and aspect from aUSGS DEMs (digital elevation model)and the converted them to Arc/Info ASCII grid file formats. The fuels layers is also converted to a asci grid format. To create the forest canopy we manuallydigitize forested areas delineating them into 4 cover classes (i.e., 0-25, 25-50, etc..) and then
Tueller, Paul
International Archives of Photogrammetry and Remote Sensing. Vol. XXXIII, Part B7. Amsterdam 2000.1556

conveted the vector coverage to a ASCII grid file. Farsite is a public domain software and can beobtained from http://www.montana.com/sem/
4.2Fuel Hazard map creation
The fuel hazard rating criteria we used (Table 1) were developed by the Sierra Front WildfireCooperators a group of fire agencies based in Minden Nevada. The hazard rating was completedby grouping the fuel models into there appropriate classes (i.e., fuel models 1-3 are grouped into thegrass fuel class, etc…) and reclassify the slope layer into the 3 slope categories as depicted in table1. A simple GIS analysis of multiplying the fuel class grid by the slope category raster resulted in afuel hazard rating map for the study area (Fig. 5).
Table 1------------------------ % Slope --------------
----------Fuel Class 0-20 21-40 > 40Grass Moderate High HighShrub High Extreme ExtremeForest Moderate High Extreme
5 Ecological Response to Wildfire
What happens to the ecology of the area when a wildfire occurs? The ecological effects of fire canbe extremely complex. This is often a function of the time of year the fire occurs, the intensity of thefire and the duration of the fire. In many cases the fire may be catastrophic relative to the vegetationand most of the vegetation is removed. Root sprouting shrubs are often the first species to return. Insome cases grasses and perennial forbs that are not killed in the fire are the first to reoccupy theburned site. Most of the non-sprouting species will be killed in wildfire and must return to the siteonly from a seed source. Some species are resistant to fire and others are very susceptible todamage. Because of the relative dry conditions of the ecosystems found on the eastside of the SierraNevada recovery vegetation recovery after wildfire can be very slow.
The influence of fire on the vegetation can be long-lasting even though the disturbance itself passesvery rapidly. This is especially true of the shrubs which after resprouting on a burned site will maintainthemselves for long periods of time. For example, the east side chaparral may last for decadesbefore the yellow pine or mixed conifer forest trees begin to reoccupy the site and a century or moremay pass before the trees once again become dominant on the site. Successive fires may beespecially detrimental and cause populations of plants and their seed sources to be lost from the
Tueller, Paul
International Archives of Photogrammetry and Remote Sensing. Vol. XXXIII, Part B7. Amsterdam 2000. 1557

ecosystem. So in many situations after a wildfire several generations may pass before a similarprefire vegetation returns.
Of concern on many sites in the shrub dominated vegetation at the lower elevations along the easternSierra is the introduced annual cheat grass (Bromus tectorum). This grass now occupies manyacres at the lower elevations around Reno and other urban areas where wildfires have been rathercommon. This grass competes with the perennial grasses for spring moisture and tends to precludetheir return to the burned sites. At some locations, e.g., the Belli Ranch fire, the annual grass medusahead rye (Taeniatherum caput-medusae) is dominant.
Low intensity fire facilitates cycling of some nutrients, may help control certain plant pathogens, andgenerally will not increase soil erosion. However, intense fire tends to volatilize excessive amounts ofnitrogen and other essential nutrients, destroy organic matter and can disrupt soil structure and mayinduce water repellancy. The intensity of a fire, its duration and the time of year all govern whether afire has positive or negative effects. Generally, low and moderate-intensity fires have good effectsand high-intensity fires have bad effects. A high-intensity wildfire burning in dry weather and withheavy fuels can remove nearly all the ground cover exposing bare mineral soil to the pounding forceof raindrops. This can lead to increased runoff and soil erosion and is why many wildfires areseeded as soon after the fire a possible often with an annual grain seeds to protect the soil surfacefrom fire-induced accelerated erosion. Damage to animal, bird and reptiles is usually related tochanges in habitat brought about by the fire. In some instances the alteration of the vegetation willprofoundly affect the status of specific populations of mammals, birds and insects.
One way to control wildfire or ameliorate the effects is to modify the fuels. This can be done invarious ways but usually always involves some involvement with vegetation. One way is the idea, soprominently promoted, to create defensible space by removing or altering the vegetation near landimprovements. Other ways include the ecological manipulation of the fire fuels on the landscapes ofinterest by removing or altering the vegetation over larger land areas. Grasses and forbs can beremoved in various ways, e.g, by grazing or prescribed fire to remove fine fuels. Most other waysare prohibitively expensive.
The reader should be aware of the Fire Effects Information System (FEIS) which is an up-to-dateinformation on fire effects on plant and animals. It was developed at the USDA Forest ServiceIntermountain Research Station’s Fire Sciences Laboratory (IFSL) in Missoula, Montana. The website (http://www.fs.fed.us/database/feis/) provides a wealth on information for those interested in fireeffects and can be easily and frequently accessed to determine the fire effects on your organisms ofinterest. For example, for a large number of plant species you will find information listed under anumber of topics: introductory, distribution and occurrence, value and use, botanical and ecologicalcharacteristics, fire ecology, fire effects, fire case studies and a list of reference.
6 Conclusions and Concerns
Tueller, Paul
International Archives of Photogrammetry and Remote Sensing. Vol. XXXIII, Part B7. Amsterdam 2000.1558

As fire suppression folks and planners work on plans for land use and management the question offire behavior is one that is always of concern. An understanding of the natural vegetation and thedominant species and how the vegetation, topography and weather influence fire behavior in thoseareas with wildfire potential will allow fire suppression professionals and land use planners to betterplan for wildfire problems. A knowledge of the kind of vegetation and the associated fuel model andpotential fire behavior along with a knowledge of fire hazard and fire risks will allow theseprofessionals to better understand how to plan for the advent of wildfire on their areas of interest.The improvement of maps depicting fuels and their fire behavior along with a landscaperepresentation of areas with different degrees of wildfire hazard is an important part of this process. In addition, when a wildfire occurs there can be a better understanding of what both the long termand short-term environmental consequences will be if the fuel models and associated ecosystemeffects are understood.
REFERENCES
Stehman, S.V. 1992. Comparison of systematic and random sampling for estimating the accuracy ofmaps generated from remotely sensed data. Photogrammetric Engineering & Remote Sensing.vol.58 pp.1343- 1350.
Verbyla, D. L. 1995. Satellite remote sensing of natural resources. pp.134, 158-159.
Congalton, R.S. 1991. A review of assessing the accuracy of classification of remote sensed data. Remote sensing of Environment. vol.37 pp.35-46. Brown, J.K., Oberheu R.D., Johnston C.M.. 1982. Handbook for Inventorying Surface Fuels andBiomass in the Interior West. General Technical Report INT-129 pp.1-48
Anderson H.E. 1982. Aids to Determining Fuel Models for Estimating Fire Behavior GeneralTechnical Report INT-122 pp. 1-22.
Table 2. The thirteen Northern Forest Fire Laboratory fuel models and with examples of eastsideSierra Nevada vegetation corresponding to these fire fuel models (Adapted from Anderson, H.1982. Aids in determining fuel Models For Estimating Fire Behavior. USDA Forest Service,Intermountain Research Station General Technical Report INT-122)
Fuel Model Description Common Species Fire Behavior
Tueller, Paul
International Archives of Photogrammetry and Remote Sensing. Vol. XXXIII, Part B7. Amsterdam 2000. 1559

#1 Short Grass Fire spreads by fine herbaceous fuels that havecured; very few trees andshrubs; fuel bed depth 1foot or less
Cheat grass or drymeadow
Surface fires that canburn very rapidly butare short lived
#2 Timber (grassand understory)
Fire spread is primarilythrough fine herbaceousfuels. Litter from shrubs ortimber overstory contributesto fire intensity; up to two-thirds cover can be timberor shrub
Open yellow pinewith grass or shrubunderstory; someopen growth pinyon/juniper standsand often sagebrushstands
Surface fires canspread rapidly; fuelsclumps can producefirebrands anduneven burning
#3 Tall Grass (2.5feet or higher)
Fire spreads in tall stands ofgrass usually over 3 feetconstituting fine fuels
Stands of perennialgrasses; possiblybluebunchwheatgrass or greatBasin wildrye;cattails and tuleswhen dry in wetlands
Can have high ratesof spread under theinfluence of wind;most intense fires inthe grass group
#4 Chaparral (to6 feet)
Intense fast spreading fires,involving the foliage and liveand dead fine woodymaterial in the crowns of anearly continuous shrublayer; dead woody materialand often a deep litter layercontributes significantly tothe fire intensity.
Stands of eastsidechaparral species orsagebrush andbitterbrush 6 feet ormore in height; thisfule type is found inthe foothills andalluvial fans on theeast side of theSierras; makes upmuch of the criticalurban interface
Very high to extremerates of spread maybe experienced.Control effort may bedifficult
#5 Brush (2 feetor less)
Fire generally carried in thesurface fuels of litter fromshrubs, grasses and forbs;shrubs usually not tall buthave high cover
Eastside chaparraland possiblyMountain Mahoganyand big sagebrush
Low intensity fireswith low fuel loads;shrubs are youngwith little dead or lowvolatile materials inthe foliage
Tueller, Paul
International Archives of Photogrammetry and Remote Sensing. Vol. XXXIII, Part B7. Amsterdam 2000.1560

#6 IntermediateBrush -Hardwood Slash
Brush is taller than in #5,but less height and fuel than#4. Foliage generallyflammable althoughmoderate to strong windsmay be required to carryfire in the crowns
Chaparral, some bigsagebrush andbitterbrush andstands of mountainmahogany; pinyonand juniperwoodlands
Fire carries throughthe shrub layer withmoderate winds, butdrops to the groundat low wind speedsor openings in thestand
#7 Southern rough Not found in the eastsideSierra Nevada
Usually burns underconditions of highhumidity not oftenfound on the eastside
Fire in othervegetation types mayact like #7 undercertain conditions.
#8 Closed timberlitter
Closed canopy stands ofhealthy, short-needledconifers that support fire inthe compact litter layer ofmainly needles, leaves andtwigs
Primarily stands oflodgepole pine, whitepine, and red fir; alsomixed stands ofyellow pine and fir
Slow burning surfacefires with low flameheights are typicalalthough thickets cancause flareups.
#9 HardwoodLitter
In our area primarily long-needle conifers with fasterburning fires with longerflame lengths than for fuelmodel #8
Stands of yellow pine Fires run through thesurface litter andpossibly torch outtrees, spot andcrown whereconcentration ofdead-down woodymaterials areencountered.
#10 Timber (litter) Fire spreads through highloadings of dead and downwoody fuels beneathovermature timber stands
Heavy amounts ofslash under a goodtree overstory; oftenthese may be beetlekilled stands; thesecould be yellow pineor mixed coniferdepending upon theamount of slash
Torching of individualtrees and spotting isfrequent; fire intensityis highest of thetimber models;
Tueller, Paul
International Archives of Photogrammetry and Remote Sensing. Vol. XXXIII, Part B7. Amsterdam 2000. 1561

#11 Light LoggingSlash
Slash and herbaceousmaterial carry an active fire;fuel spacing rather than lightfuel can contribute tolowering fire potential. The>3-inch material is less that12 tons/acre. The greaterthan 3-inch material isrepresented by not morethan 10 pieces, 4-inches indiameter along a 50 foottransect
May be very similarto #10 under pine;but usually referenceslogged areas.
Surface fires ofmoderate rates ofspread and moderateto high intensities canbe expected wherefuels are continuous.
#12 MediumLogging Slash
Slash loadings where theless than 3-inch material isless than 35 tons/acre; mostneedles have fallen and theslash is somewhat compact.The greater than 3-inchmaterial is represented by11 or more pieces, 6 inchesin diameter along a 50-footdiameter transect
After logging ofmixed conifer oryellow pine; may alsoinclude drainagebottom sites of aspen
Rapidly spreadingfire with highintensities capable ofgenerating firebrands;when fire starts, itgenerally sustainsitself until a fuel breakor change in fuelmodel occurs
#13 HeavyLogging Slash
Found in avalanchedeposition zones and areasthat have been recentlylogged; loading isdominated by greater than3-inch diameter material. The total load may exceed200 tons/acre but the 3-inchmaterial is generally 30percent or less of total load
If found they wouldbe either mixedconifer or yellowpine stands
Fires spread quicklythrough the fine fuels,but intesity builds upmore slowl asthelarger fuels start;active flaming can besustained for longerperiods and spottingcan occur
Tueller, Paul
International Archives of Photogrammetry and Remote Sensing. Vol. XXXIII, Part B7. Amsterdam 2000.1562

Fig. 2 IRS image of the 7.5" USGS topographical quadrangle named Carson City one of 74 mappedin our study area.
Tueller, Paul
International Archives of Photogrammetry and Remote Sensing. Vol. XXXIII, Part B7. Amsterdam 2000. 1563

Fig. 3 Vegetation map of the Carson City Quad
Tueller, Paul
International Archives of Photogrammetry and Remote Sensing. Vol. XXXIII, Part B7. Amsterdam 2000.1564
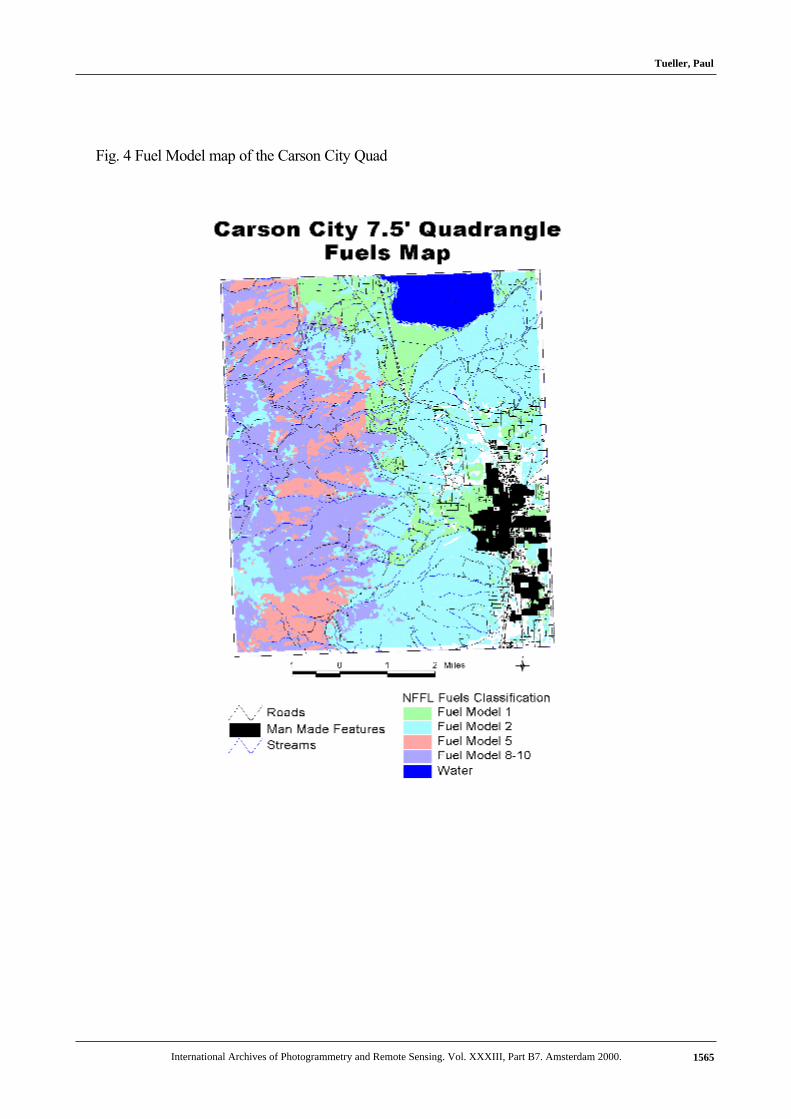
Fig. 4 Fuel Model map of the Carson City Quad
Tueller, Paul
International Archives of Photogrammetry and Remote Sensing. Vol. XXXIII, Part B7. Amsterdam 2000. 1565

Fig. 5 Fire Hazard map of the Carson City Quad.
Tueller, Paul
International Archives of Photogrammetry and Remote Sensing. Vol. XXXIII, Part B7. Amsterdam 2000.1566