fuel processing technology - tu delft
TRANSCRIPT

Fuel Processing Technology 100 (2012) 16–29
Contents lists available at SciVerse ScienceDirect
Fuel Processing Technology
j ourna l homepage: www.e lsev ie r .com/ locate / fuproc
Tar formation in a steam-O2 blown CFB gasifier and a steam blown PBFB gasifier(BabyHPR): Comparison between different on-line measurement techniques and theoff-line SPA sampling and analysis method
Xiangmei Meng a,⁎, Panagiotis Mitsakis b, Matthias Mayerhofer b, Wiebren de Jong a, Matthias Gaderer b,Adrian H.M. Verkooijen a, Hartmut Spliethoff b
a Delft University of Technology / Process & Energy Laboratory, Leeghwaterstraat 44, 2628 CA Delft, the Netherlandsb Technical University Munich / Institute of Energy Systems, Boltzmannstrasse 15, 85747 Garching, Germany
⁎ Corresponding author. Tel.: +31 15 27 86 987.E-mail address: [email protected] (X. Meng).
0378-3820/$ – see front matter © 2012 Elsevier B.V. Alldoi:10.1016/j.fuproc.2012.03.002
a b s t r a c t
a r t i c l e i n f oArticle history:Received 15 November 2011Accepted 3 March 2012Available online 1 April 2012
Keywords:Circulating fluidized bed (CFB) gasifierPressurized bubbling fluidized bed (PBFB)gasifier BabyHPR (Heatpipe Reformer)””Solid phase adsorption (SPA)Laser induced fluorescence spectroscopy(LIFS)On-line tar analyzer (OTA)
Two on-line tar measurement campaigns were carried out using an atmospheric pressure 100 “”kWth steam-O2
blown circulating fluidized bed (CFB) gasifier at the Delft University of Technology (TUD) and a 30–40kWth
steam blown pressurized bubbling fluidized bed (PBFB) gasifier BabyHPR (Heatpipe Reformer) at the TechnicalUniversity Munich (TUM). Agrol, willow and Dry Distiller's Grains with Solubles (DDGS) were used. An FID basedon-line tar analyzer (OTA), an induced fluorescence spectroscopy (LIFS) based on-line laser instrument, and off-line solid phase adsorption (SPA) were used to quantify tar content.In general, there was a fairly good agreement between the measured results of the 10 corresponding individualtar compounds obtained from Agrol and willow CFB and PBFB atmospheric pressure tests using the SPA andLIFS methods. The measured tar concentration difference between these two methods was less than 10%. How-ever, a higher difference (up to 30%) was observed for fluoranthene and pyrene obtained from DDGS CFB testas well as those obtained from willow PBFB under pressure test. The total tar concentration measured by theLIFS, SPA and OTA methods varied in a comparable way with changing process parameters. Both the LIFS andOTA methods can be used as indicators to observe gasifier's performance change in real time, but a regular cali-bration of the OTA analyzer is required to achieve good and reliable results.
© 2012 Elsevier B.V. All rights reserved.
1. Introduction
Syngas produced from biomass gasification is an economically andtechnologically feasible alternative to traditional fossil fuel for heatand electric generation as well as transportation fuel production [1].The major problem of the syngas in the practical applications isformed by the contaminants present in it such as tar and sulphur.Tar is one of the most problematic compound classes which can resultin various problems associated with condensation, aerosol formationand polymerization to form more complex depositing structures.Probably due to its complexity, tar has been defined differently by dif-ferent research groups working on biomass gasification. Milne et al.[2] defined tar in their report as “the organics produced under thermalor partial-oxidation regimes of any organic material and generally as-sumed to be largely aromatic”. The European Committee for Standardi-zation (CEN) defined tar as “all organic compounds present in thegasification product gas with molecular weight higher than benzene”[3]. Tar removal is considered as one of the greatest technical challenges
rights reserved.
to overcome for the successful development of commercially advancedgasification technologies. Great efforts have been dedicated in this fieldand detailed information is available in several extensive review papers[4-7]. Since tar composition offers quantitative and qualitative informa-tion about the gasification conditions, quantitative measurement of tarin the product gas is decisively important to assess the effectiveness ofcleanup and conditioning processes and to verify the suitability of thecleaned product gas for its final downstream use [2,8].
A large variety of off-line and on-line tar sampling andmeasurementmethods is currently available to determine the amount of the tar in theproduct gas produced from biomass gasification. Cold solvent trapping(CST) is the conventional off-line method for integral tar samplingbased on cold trapping using water condensers and cooling traps; occa-sionally combinedwith solvent absorption in impinger bottles and finaldetermination byweight or gas chromatography (GC). The CSTmethodhas been improved several times by different organizations [9-12]. TheBiomass Gasification Task Working Group of the International EnergyAgency (IEA) has completed an impinger-based, standardized interna-tional CEN Technical Specification “Biomass gasification—Tar and Particlesin Producer Gases—Sampling and Analysis”, which is based on “TarGuideline” to assist developers and end-users of biomass gasificationtechnologies in measuring tar in the product gas [13]. The solid phase

17X. Meng et al. / Fuel Processing Technology 100 (2012) 16–29
adsorption (SPA) method was developed by the Royal Institute ofTechnology (KTH) to quantify tar species ranging in molecular weightfrom benzene to coronene, prevailing in product gas produced from bio-mass gasification within the temperature range from 700 to 1000 °C[8,14]. The favorable features that distinguish the SPA method from theCST method include reliability, speed of sampling, simplicity, accuracy,reproducibility and specificity.
In order to monitor tar concentration as well as the real timeperformance of the gasifier, several research institutions have developeddifferent on-line/semi-online tar sampling and measurement methods,such as the molecular beam mass spectrometry (MBMS) [15,16], anon-line laser spectroscopic technique based on laser induced fluores-cence spectroscopy (LIFS) [17-19], on-line tar analysis based on aphoto ionization detector (PID) [20], and on-line tar analysis based onflame ionization detector (FID) [21,22]. A comparison of these methodsis presented in Table 1.
One of the objectives of the EU framework 7 “GREENSYNGAS” Pro-ject was to develop fast advanced characterization techniques tomeasure emissions from biomass gasification processes in a realtime. Therefore, on-line tar measurement using different techniqueswas suggested as one of the main focuses in the project. The aim ofthis paper is to compare some current on-line measurement tech-niques and standard tar measurements based on experimental resultsachieved from two tar measurement campaigns, which have beencarried out using an atmospheric pressure “”100kWth steam-oxygenblown circulating fluidized bed (CFB) gasifier at the Delft Universityof Technology (TUD) and a 30–40kWth steam blown pressurized bub-bling fluidized bed (PBFB) gasifier BabyHPR (Heatpipe Reformer) atthe Technical University Munich (TUM), respectively. The accuracyand reliability of two on-line tar measurement techniques was vali-dated and compared with the standard SPA method.
2. Materials and methods
2.1. Experimental setup
The experimental setup at TUD is an atmospheric pressure100kWth steam-oxygen blown CFB gasifier, while at TUM it is anallothermal 30–40kWth steam blown PBFB gasifier BabyHPR (Heat-pipe Reformer). The schematic diagrams of the CFB and PBFB gasifica-tion systems are shown in Fig. 1. The CFB gasifier has a riser length of5.5 m with an inner diameter of 83 mm and a down-comer with aninner diameter of 54 mm. The CFB gasifier test-rig consists of flowme-ters, thermocouples, differential pressuremeters andweighing devices.There are two high temperature filters (ceramic tissue candle filter(BWF, Germany) and a Si-SiC ceramic candle filter (Pall Filter systems–Werk Schumacher, Germany)) which can be switched during
Table 1Comparison between on-line and off-line tar sampling and measurement methods.
Name Developer On/off-line Detected tar species Ad
Tar protocol IEA Off-line gravimetric tar and GC detectable tar simneop
SPA KTH Off-line GC detectable tar Shan
MBMS NREL On-line GC detectable tar qum
PID KTH, BTG On-line the global volatile aromatic compounds Cath
LIFS TUM, TUB On-line GC detectable tar Care
OTA IVD On-line the global non condensable hydrocarbon Cath
Remarks:IEA: International Energy AgencyNREL: National Renewable Energy LaboratoryBTG: Biomass Technology Group BV
operation. The PFPB gasifier is 1.5 m high with an internal diameter of154 mm and it mainly consists of four parts: the reactor and pressurevessel, electrical radiation heater, high temperature heatpipes and apressurized screw conveyer with lock hopper cycle for biomass supply.The axial temperature profile is monitored with thermocouples every100 mm. A very uniform profile can be observed inside the fluidizedbed which has a height of ~700 mm. A detailed description of the twoaforementioned facilities is available in other already published papers[23-25].
2.2. Materials and operational parameters
Two woody biomass fuels, Agrol and willow, and one agriculturalresidue, Dry Distiller's Grains with Solubles (DDGS) obtained fromLantmännen (Sweden) have been used for the conducted experiments.Four different bedmaterials have been applied during gasification test atTUD,which include untreated Scandinavian olivine, fresh as well as pre-treated Austrian olivines, and a mixture of quartz sand and pre-treatedolivine with a mass ratio of approximately 50:50. Kaolin was added asan additive to prevent agglomeration especially during DDGS gasifica-tion. On the other hand, only olivine with a Fe2O3 content of 9.8 wt.%was used during gasification test at TUM. Two important gasificationparameters have been applied. The equivalence ratio ER (oxygen tobiomass stoichiometric ratio) was calculated as the mass ratio ofsupplied oxygen to the oxygen required for the complete stoichiometriccombustion of the biomass on a daf (dry ash free) basis. SBR (steam tobiomass mass ratio) was calculated as the mass ratio of steam suppliedto biomass supplied on an a.r. (as received) basis. For a summaryconcerning the experimental conditions (e.g., SBR, ER and temperature)and bed materials we refer to previously published papers [23,26].
2.3. Product gas and tar measurement equipments
The product gas composition produced from the CFB gasifier at TUDwas analyzed by using different analytical instruments, which include aVarian CP4900 μ-GC (benzene, toluene, xylenes (BTX) and CO2, CO, H2,N2, CH4), a Varian GC 450 (same components as CP4900 μ-GC plus H2S,COS andmethylmercaptan) and a Fourier transform infrared (FTIR) an-alyzer (mainly CH4, C2H4, C2H2, NH3, H2O). The product gas composition(CO, CO2, H2, CH4) derived from the PBFB gasifier at TUMwasmeasuredon-line by Infrared (IR) spectroscopy using an S700 analyzer from SICK/MAIHAK. The tar concentration produced from both gasifiers was mea-sured using three different techniques: a quasi-continuous TA120-3 on-line tar analyzer (OTA), which is commercially available (RatfischGmbH, Germany) and originally developed by the University of Stuttgart(IVD, Germany), an on-line laser instrument based on LIFS developed byTUM and the off-line SPA method developed by KTH.
vantages Drawbacks
ple, inexpensive equipment andar-universal applicability to gasifiererating conditions
Time consuming and handling of organicsolvents requires special skills andextra attention
ort sampling time, simple, accurated reproducible
Off-line, cannot determine heavy tar andBTX is not reliable
antitative, continuous, and real-timeonitoring of tar concentration in gasifier
Sensitivity is affected by differences inelectron ionization cross-sections etc.
n measure global tar concentration ine real-time
Needs calculation method to link tarconcentration to PID signal
n measure individual tar species in theal-time.
Can be affected by adding fuel to thegasifier, reactor pressure
n measure global tar concentration ine real-time
Can not measure individual tar speciesand needs frequent calibration
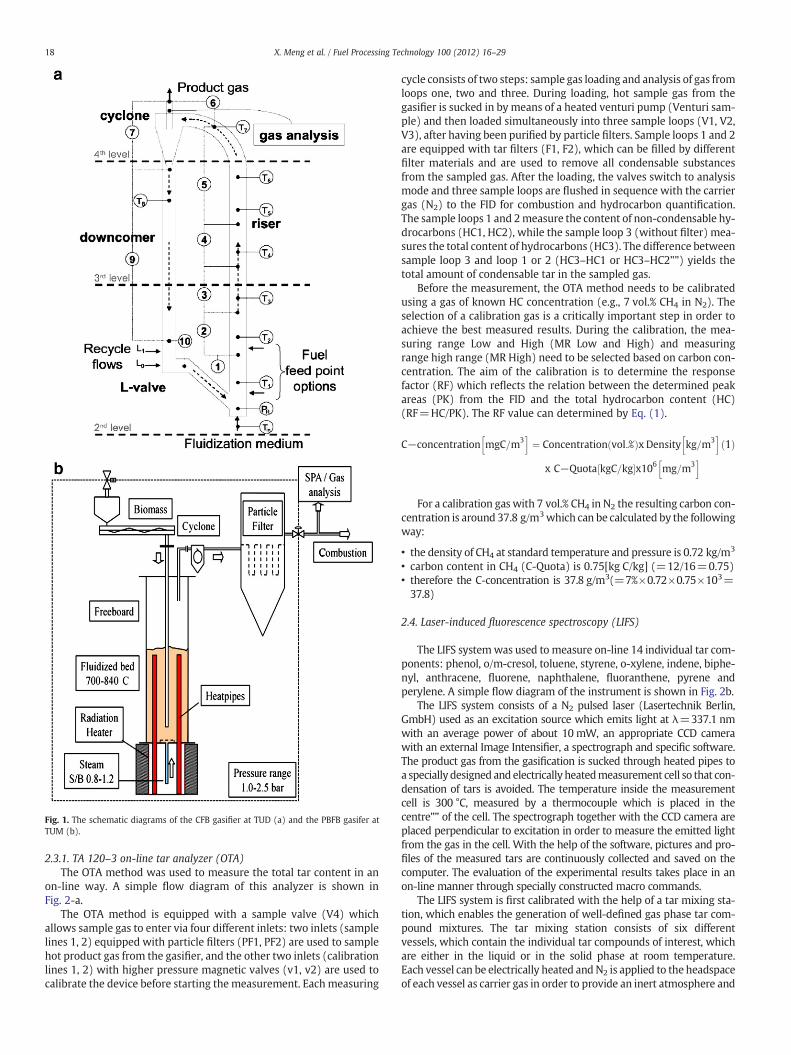
Fig. 1. The schematic diagrams of the CFB gasifier at TUD (a) and the PBFB gasifer atTUM (b).
18 X. Meng et al. / Fuel Processing Technology 100 (2012) 16–29
2.3.1. TA 120–3 on-line tar analyzer (OTA)The OTA method was used to measure the total tar content in an
on-line way. A simple flow diagram of this analyzer is shown inFig. 2-a.
The OTA method is equipped with a sample valve (V4) whichallows sample gas to enter via four different inlets: two inlets (samplelines 1, 2) equipped with particle filters (PF1, PF2) are used to samplehot product gas from the gasifier, and the other two inlets (calibrationlines 1, 2) with higher pressure magnetic valves (v1, v2) are used tocalibrate the device before starting the measurement. Eachmeasuring
cycle consists of two steps: sample gas loading and analysis of gas fromloops one, two and three. During loading, hot sample gas from thegasifier is sucked in by means of a heated venturi pump (Venturi sam-ple) and then loaded simultaneously into three sample loops (V1, V2,V3), after having been purified by particle filters. Sample loops 1 and 2are equipped with tar filters (F1, F2), which can be filled by differentfilter materials and are used to remove all condensable substancesfrom the sampled gas. After the loading, the valves switch to analysismode and three sample loops are flushed in sequence with the carriergas (N2) to the FID for combustion and hydrocarbon quantification.The sample loops 1 and 2measure the content of non-condensable hy-drocarbons (HC1, HC2), while the sample loop 3 (without filter) mea-sures the total content of hydrocarbons (HC3). The difference betweensample loop 3 and loop 1 or 2 (HC3–HC1 or HC3–HC2””) yields thetotal amount of condensable tar in the sampled gas.
Before the measurement, the OTA method needs to be calibratedusing a gas of known HC concentration (e.g., 7 vol.% CH4 in N2). Theselection of a calibration gas is a critically important step in order toachieve the best measured results. During the calibration, the mea-suring range Low and High (MR Low and High) and measuringrange high range (MR High) need to be selected based on carbon con-centration. The aim of the calibration is to determine the responsefactor (RF) which reflects the relation between the determined peakareas (PK) from the FID and the total hydrocarbon content (HC)(RF=HC/PK). The RF value can determined by Eq. (1).
C−concentration mgC=m3h i
¼ Concentration vol:%ð Þx Density kg=m3h i
x C−Quota kgC=kg½ �x106 mg=m3h i
ð1Þ
For a calibration gas with 7 vol.% CH4 in N2 the resulting carbon con-centration is around 37.8 g/m3which can be calculated by the followingway:
• the density of CH4 at standard temperature and pressure is 0.72 kg/m3
• carbon content in CH4 (C-Quota) is 0.75[kg C/kg] (=12/16=0.75)• therefore the C-concentration is 37.8 g/m3(=7%×0.72×0.75×103=37.8)
2.4. Laser-induced fluorescence spectroscopy (LIFS)
The LIFS systemwas used to measure on-line 14 individual tar com-ponents: phenol, o/m-cresol, toluene, styrene, o-xylene, indene, biphe-nyl, anthracene, fluorene, naphthalene, fluoranthene, pyrene andperylene. A simple flow diagram of the instrument is shown in Fig. 2b.
The LIFS system consists of a N2 pulsed laser (Lasertechnik Berlin,GmbH) used as an excitation source which emits light at λ=337.1 nmwith an average power of about 10 mW, an appropriate CCD camerawith an external Image Intensifier, a spectrograph and specific software.The product gas from the gasification is sucked through heated pipes toa specially designed and electrically heatedmeasurement cell so that con-densation of tars is avoided. The temperature inside the measurementcell is 300 °C, measured by a thermocouple which is placed in thecentre”” of the cell. The spectrograph together with the CCD camera areplaced perpendicular to excitation in order to measure the emitted lightfrom the gas in the cell. With the help of the software, pictures and pro-files of the measured tars are continuously collected and saved on thecomputer. The evaluation of the experimental results takes place in anon-line manner through specially constructed macro commands.
The LIFS system is first calibrated with the help of a tar mixing sta-tion, which enables the generation of well-defined gas phase tar com-pound mixtures. The tar mixing station consists of six differentvessels, which contain the individual tar compounds of interest, whichare either in the liquid or in the solid phase at room temperature.Each vessel can be electrically heated and N2 is applied to the headspaceof each vessel as carrier gas in order to provide an inert atmosphere and
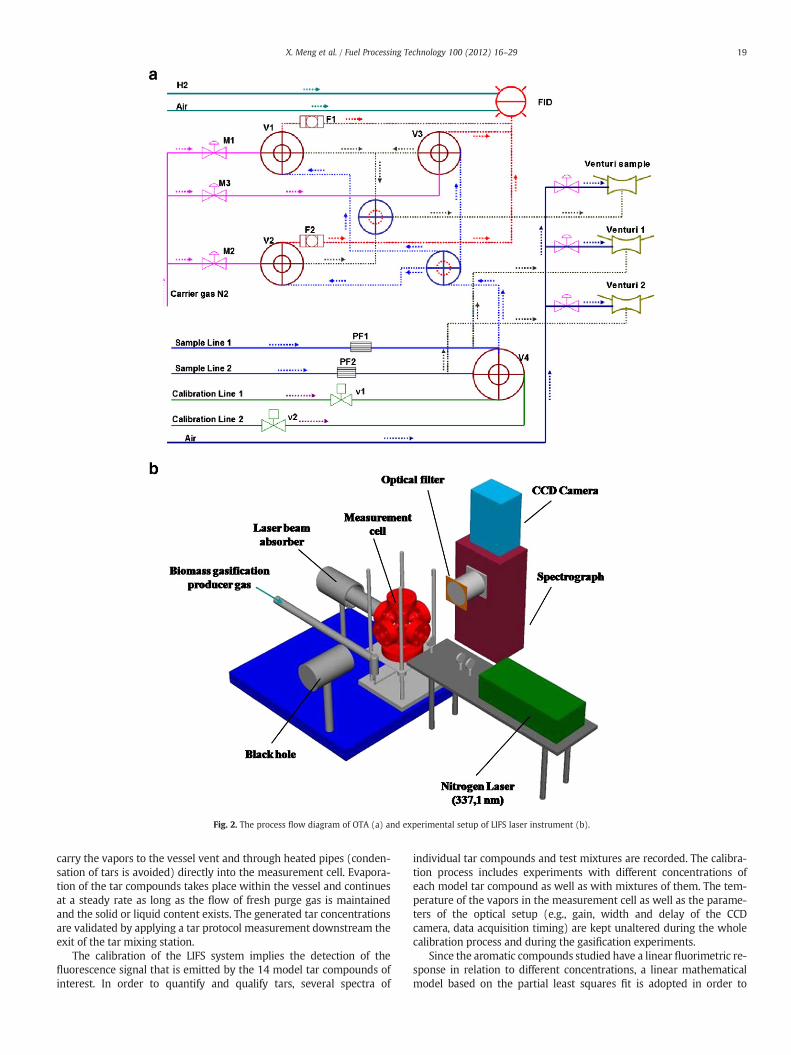
Fig. 2. The process flow diagram of OTA (a) and experimental setup of LIFS laser instrument (b).
19X. Meng et al. / Fuel Processing Technology 100 (2012) 16–29
carry the vapors to the vessel vent and through heated pipes (conden-sation of tars is avoided) directly into the measurement cell. Evapora-tion of the tar compounds takes place within the vessel and continuesat a steady rate as long as the flow of fresh purge gas is maintainedand the solid or liquid content exists. The generated tar concentrationsare validated by applying a tar protocol measurement downstream theexit of the tar mixing station.
The calibration of the LIFS system implies the detection of thefluorescence signal that is emitted by the 14 model tar compounds ofinterest. In order to quantify and qualify tars, several spectra of
individual tar compounds and test mixtures are recorded. The calibra-tion process includes experiments with different concentrations ofeach model tar compound as well as with mixtures of them. The tem-perature of the vapors in the measurement cell as well as the parame-ters of the optical setup (e.g., gain, width and delay of the CCDcamera, data acquisition timing) are kept unaltered during the wholecalibration process and during the gasification experiments.
Since the aromatic compounds studied have a linear fluorimetric re-sponse in relation to different concentrations, a linear mathematicalmodel based on the partial least squares fit is adopted in order to
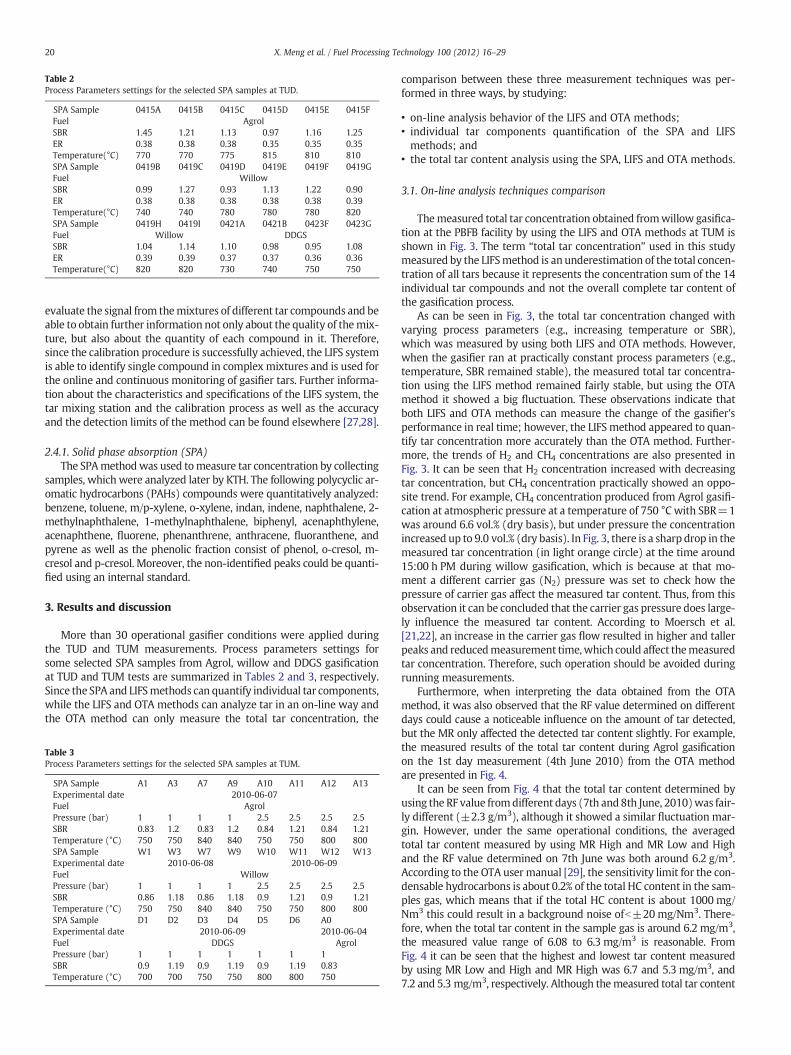
Table 2Process Parameters settings for the selected SPA samples at TUD.
SPA Sample 0415A 0415B 0415C 0415D 0415E 0415FFuel AgrolSBR 1.45 1.21 1.13 0.97 1.16 1.25ER 0.38 0.38 0.38 0.35 0.35 0.35Temperature(°C) 770 770 775 815 810 810SPA Sample 0419B 0419C 0419D 0419E 0419F 0419GFuel WillowSBR 0.99 1.27 0.93 1.13 1.22 0.90ER 0.38 0.38 0.38 0.38 0.38 0.39Temperature(°C) 740 740 780 780 780 820SPA Sample 0419H 0419I 0421A 0421B 0423F 0423GFuel Willow DDGSSBR 1.04 1.14 1.10 0.98 0.95 1.08ER 0.39 0.39 0.37 0.37 0.36 0.36Temperature(°C) 820 820 730 740 750 750
20 X. Meng et al. / Fuel Processing Technology 100 (2012) 16–29
evaluate the signal from themixtures of different tar compounds and beable to obtain further information not only about the quality of themix-ture, but also about the quantity of each compound in it. Therefore,since the calibration procedure is successfully achieved, the LIFS systemis able to identify single compound in complex mixtures and is used forthe online and continuous monitoring of gasifier tars. Further informa-tion about the characteristics and specifications of the LIFS system, thetar mixing station and the calibration process as well as the accuracyand the detection limits of the method can be found elsewhere [27,28].
2.4.1. Solid phase absorption (SPA)The SPAmethodwas used tomeasure tar concentration by collecting
samples, which were analyzed later by KTH. The following polycyclic ar-omatic hydrocarbons (PAHs) compounds were quantitatively analyzed:benzene, toluene, m/p-xylene, o-xylene, indan, indene, naphthalene, 2-methylnaphthalene, 1-methylnaphthalene, biphenyl, acenaphthylene,acenaphthene, fluorene, phenanthrene, anthracene, fluoranthene, andpyrene as well as the phenolic fraction consist of phenol, o-cresol, m-cresol and p-cresol. Moreover, the non-identified peaks could be quanti-fied using an internal standard.
3. Results and discussion
More than 30 operational gasifier conditions were applied duringthe TUD and TUM measurements. Process parameters settings forsome selected SPA samples from Agrol, willow and DDGS gasificationat TUD and TUM tests are summarized in Tables 2 and 3, respectively.Since the SPA and LIFSmethods can quantify individual tar components,while the LIFS and OTA methods can analyze tar in an on-line way andthe OTA method can only measure the total tar concentration, the
Table 3Process Parameters settings for the selected SPA samples at TUM.
SPA Sample A1 A3 A7 A9 A10 A11 A12 A13Experimental date 2010-06-07Fuel AgrolPressure (bar) 1 1 1 1 2.5 2.5 2.5 2.5SBR 0.83 1.2 0.83 1.2 0.84 1.21 0.84 1.21Temperature (°C) 750 750 840 840 750 750 800 800SPA Sample W1 W3 W7 W9 W10 W11 W12 W13Experimental date 2010-06-08 2010-06-09Fuel WillowPressure (bar) 1 1 1 1 2.5 2.5 2.5 2.5SBR 0.86 1.18 0.86 1.18 0.9 1.21 0.9 1.21Temperature (°C) 750 750 840 840 750 750 800 800SPA Sample D1 D2 D3 D4 D5 D6 A0Experimental date 2010-06-09 2010-06-04Fuel DDGS AgrolPressure (bar) 1 1 1 1 1 1 1SBR 0.9 1.19 0.9 1.19 0.9 1.19 0.83Temperature (°C) 700 700 750 750 800 800 750
comparison between these three measurement techniques was per-formed in three ways, by studying:
• on-line analysis behavior of the LIFS and OTA methods;• individual tar components quantification of the SPA and LIFSmethods; and
• the total tar content analysis using the SPA, LIFS and OTA methods.
3.1. On-line analysis techniques comparison
Themeasured total tar concentration obtained fromwillow gasifica-tion at the PBFB facility by using the LIFS and OTA methods at TUM isshown in Fig. 3. The term “total tar concentration” used in this studymeasured by the LIFSmethod is an underestimation of the total concen-tration of all tars because it represents the concentration sum of the 14individual tar compounds and not the overall complete tar content ofthe gasification process.
As can be seen in Fig. 3, the total tar concentration changed withvarying process parameters (e.g., increasing temperature or SBR),which was measured by using both LIFS and OTA methods. However,when the gasifier ran at practically constant process parameters (e.g.,temperature, SBR remained stable), the measured total tar concentra-tion using the LIFS method remained fairly stable, but using the OTAmethod it showed a big fluctuation. These observations indicate thatboth LIFS and OTA methods can measure the change of the gasifier'sperformance in real time; however, the LIFS method appeared to quan-tify tar concentration more accurately than the OTA method. Further-more, the trends of H2 and CH4 concentrations are also presented inFig. 3. It can be seen that H2 concentration increased with decreasingtar concentration, but CH4 concentration practically showed an oppo-site trend. For example, CH4 concentration produced from Agrol gasifi-cation at atmospheric pressure at a temperature of 750 °C with SBR=1was around 6.6 vol.% (dry basis), but under pressure the concentrationincreased up to 9.0 vol.% (dry basis). In Fig. 3, there is a sharp drop in themeasured tar concentration (in light orange circle) at the time around15:00 h PM during willow gasification, which is because at that mo-ment a different carrier gas (N2) pressure was set to check how thepressure of carrier gas affect the measured tar content. Thus, from thisobservation it can be concluded that the carrier gas pressure does large-ly influence the measured tar content. According to Moersch et al.[21,22], an increase in the carrier gas flow resulted in higher and tallerpeaks and reducedmeasurement time,which could affect themeasuredtar concentration. Therefore, such operation should be avoided duringrunning measurements.
Furthermore, when interpreting the data obtained from the OTAmethod, it was also observed that the RF value determined on differentdays could cause a noticeable influence on the amount of tar detected,but the MR only affected the detected tar content slightly. For example,the measured results of the total tar content during Agrol gasificationon the 1st day measurement (4th June 2010) from the OTA methodare presented in Fig. 4.
It can be seen from Fig. 4 that the total tar content determined byusing the RF value fromdifferent days (7th and 8th June, 2010)was fair-ly different (±2.3 g/m3), although it showed a similar fluctuation mar-gin. However, under the same operational conditions, the averagedtotal tar content measured by using MR High and MR Low and Highand the RF value determined on 7th June was both around 6.2 g/m3.According to the OTA user manual [29], the sensitivity limit for the con-densable hydrocarbons is about 0.2% of the total HC content in the sam-ples gas, which means that if the total HC content is about 1000 mg/Nm3 this could result in a background noise ofb±20mg/Nm3. There-fore, when the total tar content in the sample gas is around 6.2 mg/m3,the measured value range of 6.08 to 6.3 mg/m3 is reasonable. FromFig. 4 it can be seen that the highest and lowest tar content measuredby using MR Low and High and MR High was 6.7 and 5.3 mg/m3, and7.2 and 5.3 mg/m3, respectively. Although themeasured total tar content
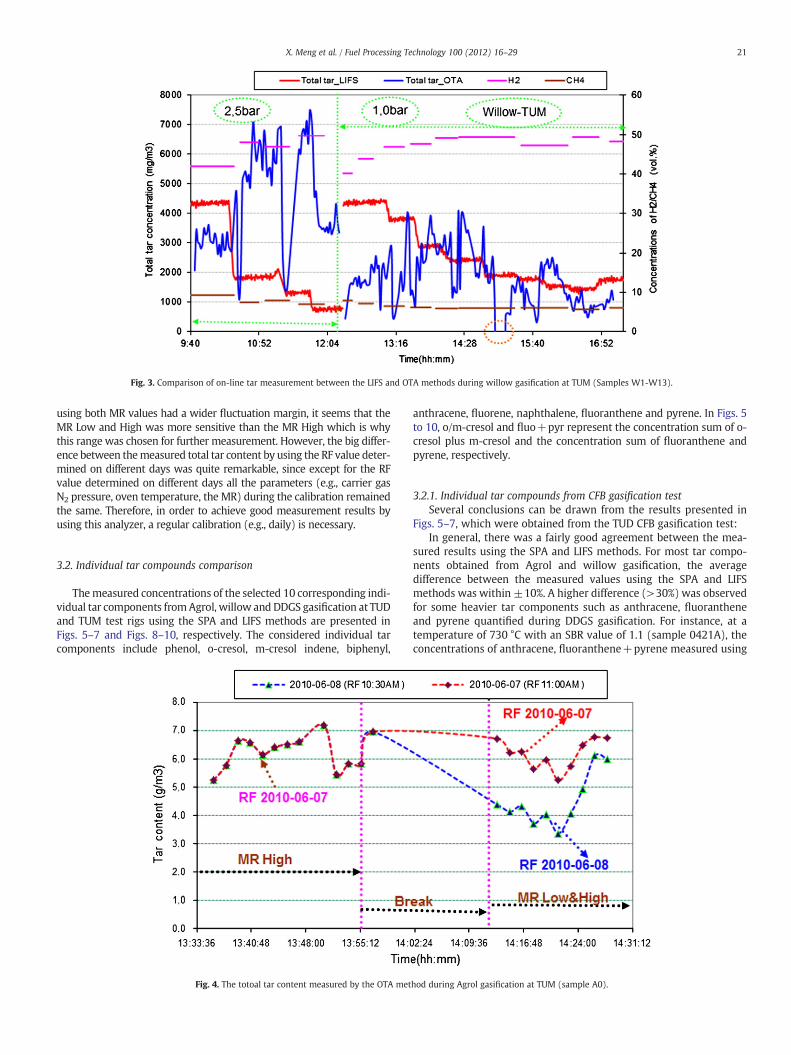
Fig. 3. Comparison of on-line tar measurement between the LIFS and OTA methods during willow gasification at TUM (Samples W1-W13).
21X. Meng et al. / Fuel Processing Technology 100 (2012) 16–29
using both MR values had a wider fluctuation margin, it seems that theMR Low and High was more sensitive than the MR High which is whythis range was chosen for further measurement. However, the big differ-ence between themeasured total tar content by using the RF value deter-mined on different days was quite remarkable, since except for the RFvalue determined on different days all the parameters (e.g., carrier gasN2 pressure, oven temperature, the MR) during the calibration remainedthe same. Therefore, in order to achieve good measurement results byusing this analyzer, a regular calibration (e.g., daily) is necessary.
3.2. Individual tar compounds comparison
Themeasured concentrations of the selected 10 corresponding indi-vidual tar components fromAgrol, willow and DDGS gasification at TUDand TUM test rigs using the SPA and LIFS methods are presented inFigs. 5–7 and Figs. 8–10, respectively. The considered individual tarcomponents include phenol, o-cresol, m-cresol indene, biphenyl,
Fig. 4. The totoal tar content measured by the OTA met
anthracene, fluorene, naphthalene, fluoranthene and pyrene. In Figs. 5to 10, o/m-cresol and fluo+pyr represent the concentration sum of o-cresol plus m-cresol and the concentration sum of fluoranthene andpyrene, respectively.
3.2.1. Individual tar compounds from CFB gasification testSeveral conclusions can be drawn from the results presented in
Figs. 5–7, which were obtained from the TUD CFB gasification test:In general, there was a fairly good agreement between the mea-
sured results using the SPA and LIFS methods. For most tar compo-nents obtained from Agrol and willow gasification, the averagedifference between the measured values using the SPA and LIFSmethods was within ±10%. A higher difference (>30%) was observedfor some heavier tar components such as anthracene, fluorantheneand pyrene quantified during DDGS gasification. For instance, at atemperature of 730 °C with an SBR value of 1.1 (sample 0421A), theconcentrations of anthracene, fluoranthene+pyrene measured using
hod during Agrol gasification at TUM (sample A0).
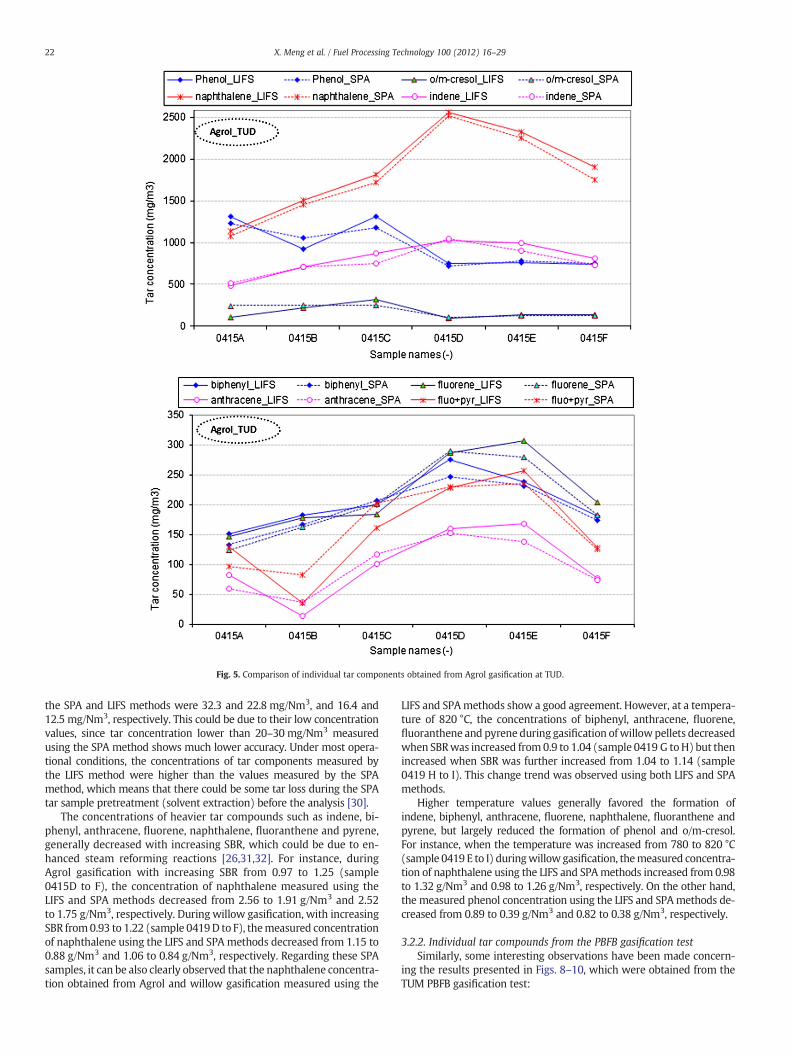
Fig. 5. Comparison of individual tar components obtained from Agrol gasification at TUD.
22 X. Meng et al. / Fuel Processing Technology 100 (2012) 16–29
the SPA and LIFS methods were 32.3 and 22.8 mg/Nm3, and 16.4 and12.5 mg/Nm3, respectively. This could be due to their low concentrationvalues, since tar concentration lower than 20–30 mg/Nm3 measuredusing the SPA method shows much lower accuracy. Under most opera-tional conditions, the concentrations of tar components measured bythe LIFS method were higher than the values measured by the SPAmethod, which means that there could be some tar loss during the SPAtar sample pretreatment (solvent extraction) before the analysis [30].
The concentrations of heavier tar compounds such as indene, bi-phenyl, anthracene, fluorene, naphthalene, fluoranthene and pyrene,generally decreased with increasing SBR, which could be due to en-hanced steam reforming reactions [26,31,32]. For instance, duringAgrol gasification with increasing SBR from 0.97 to 1.25 (sample0415D to F), the concentration of naphthalene measured using theLIFS and SPA methods decreased from 2.56 to 1.91 g/Nm3 and 2.52to 1.75 g/Nm3, respectively. During willow gasification, with increasingSBR from0.93 to 1.22 (sample 0419D to F), themeasured concentrationof naphthalene using the LIFS and SPA methods decreased from 1.15 to0.88 g/Nm3 and 1.06 to 0.84 g/Nm3, respectively. Regarding these SPAsamples, it can be also clearly observed that the naphthalene concentra-tion obtained from Agrol and willow gasification measured using the
LIFS and SPAmethods show a good agreement. However, at a tempera-ture of 820 °C, the concentrations of biphenyl, anthracene, fluorene,fluoranthene and pyrene during gasification ofwillowpellets decreasedwhen SBRwas increased from0.9 to 1.04 (sample 0419 G toH) but thenincreased when SBR was further increased from 1.04 to 1.14 (sample0419 H to I). This change trend was observed using both LIFS and SPAmethods.
Higher temperature values generally favored the formation ofindene, biphenyl, anthracene, fluorene, naphthalene, fluoranthene andpyrene, but largely reduced the formation of phenol and o/m-cresol.For instance, when the temperature was increased from 780 to 820 °C(sample 0419 E to I) duringwillowgasification, themeasured concentra-tion of naphthalene using the LIFS and SPAmethods increased from 0.98to 1.32 g/Nm3 and 0.98 to 1.26 g/Nm3, respectively. On the other hand,the measured phenol concentration using the LIFS and SPAmethods de-creased from 0.89 to 0.39 g/Nm3 and 0.82 to 0.38 g/Nm3, respectively.
3.2.2. Individual tar compounds from the PBFB gasification testSimilarly, some interesting observations have been made concern-
ing the results presented in Figs. 8–10, which were obtained from theTUM PBFB gasification test:
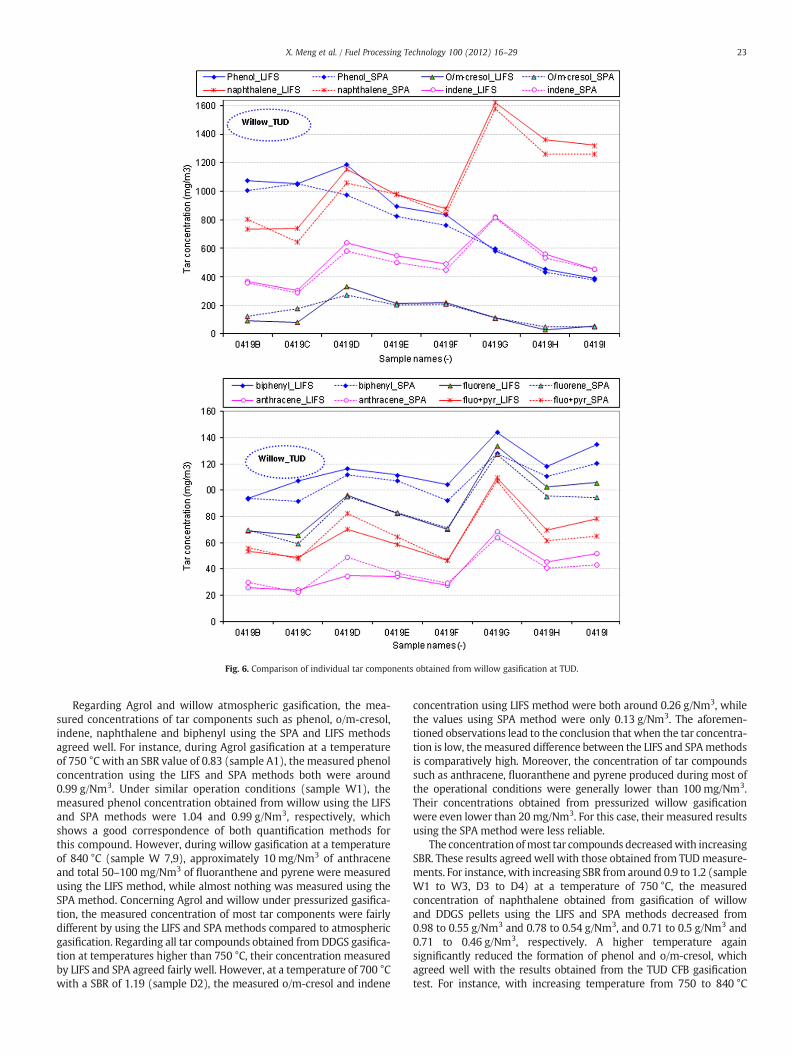
Fig. 6. Comparison of individual tar components obtained from willow gasification at TUD.
23X. Meng et al. / Fuel Processing Technology 100 (2012) 16–29
Regarding Agrol and willow atmospheric gasification, the mea-sured concentrations of tar components such as phenol, o/m-cresol,indene, naphthalene and biphenyl using the SPA and LIFS methodsagreed well. For instance, during Agrol gasification at a temperatureof 750 °C with an SBR value of 0.83 (sample A1), the measured phenolconcentration using the LIFS and SPA methods both were around0.99 g/Nm3. Under similar operation conditions (sample W1), themeasured phenol concentration obtained from willow using the LIFSand SPA methods were 1.04 and 0.99 g/Nm3, respectively, whichshows a good correspondence of both quantification methods forthis compound. However, during willow gasification at a temperatureof 840 °C (sample W 7,9), approximately 10 mg/Nm3 of anthraceneand total 50–100 mg/Nm3 of fluoranthene and pyrene were measuredusing the LIFS method, while almost nothing was measured using theSPA method. Concerning Agrol and willow under pressurized gasifica-tion, the measured concentration of most tar components were fairlydifferent by using the LIFS and SPA methods compared to atmosphericgasification. Regarding all tar compounds obtained from DDGS gasifica-tion at temperatures higher than 750 °C, their concentration measuredby LIFS and SPA agreed fairly well. However, at a temperature of 700 °Cwith a SBR of 1.19 (sample D2), the measured o/m-cresol and indene
concentration using LIFS method were both around 0.26 g/Nm3, whilethe values using SPA method were only 0.13 g/Nm3. The aforemen-tioned observations lead to the conclusion that when the tar concentra-tion is low, themeasured difference between the LIFS and SPAmethodsis comparatively high. Moreover, the concentration of tar compoundssuch as anthracene, fluoranthene and pyrene produced during most ofthe operational conditions were generally lower than 100 mg/Nm3.Their concentrations obtained from pressurized willow gasificationwere even lower than 20 mg/Nm3. For this case, their measured resultsusing the SPA method were less reliable.
The concentration ofmost tar compounds decreasedwith increasingSBR. These results agreed well with those obtained from TUDmeasure-ments. For instance, with increasing SBR from around 0.9 to 1.2 (sampleW1 to W3, D3 to D4) at a temperature of 750 °C, the measuredconcentration of naphthalene obtained from gasification of willowand DDGS pellets using the LIFS and SPA methods decreased from0.98 to 0.55 g/Nm3 and 0.78 to 0.54 g/Nm3, and 0.71 to 0.5 g/Nm3 and0.71 to 0.46 g/Nm3, respectively. A higher temperature againsignificantly reduced the formation of phenol and o/m-cresol, whichagreed well with the results obtained from the TUD CFB gasificationtest. For instance, with increasing temperature from 750 to 840 °C
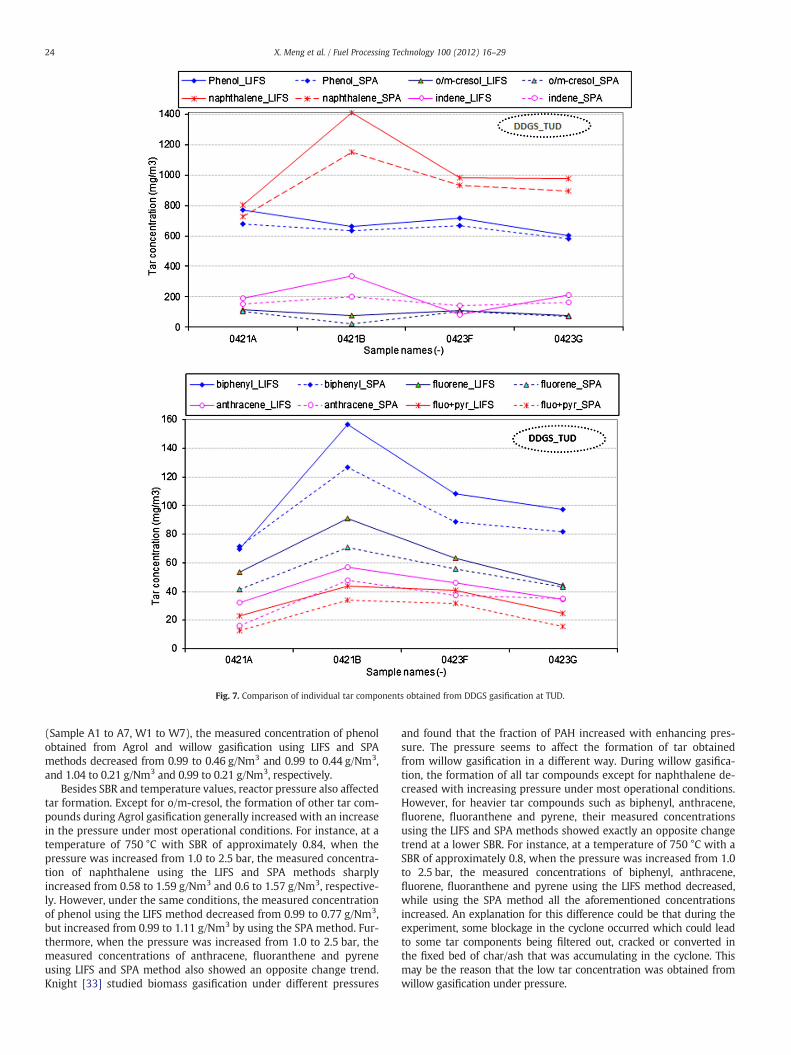
Fig. 7. Comparison of individual tar components obtained from DDGS gasification at TUD.
24 X. Meng et al. / Fuel Processing Technology 100 (2012) 16–29
(Sample A1 to A7, W1 to W7), the measured concentration of phenolobtained from Agrol and willow gasification using LIFS and SPAmethods decreased from 0.99 to 0.46 g/Nm3 and 0.99 to 0.44 g/Nm3,and 1.04 to 0.21 g/Nm3 and 0.99 to 0.21 g/Nm3, respectively.
Besides SBR and temperature values, reactor pressure also affectedtar formation. Except for o/m-cresol, the formation of other tar com-pounds during Agrol gasification generally increased with an increasein the pressure under most operational conditions. For instance, at atemperature of 750 °C with SBR of approximately 0.84, when thepressure was increased from 1.0 to 2.5 bar, the measured concentra-tion of naphthalene using the LIFS and SPA methods sharplyincreased from 0.58 to 1.59 g/Nm3 and 0.6 to 1.57 g/Nm3, respective-ly. However, under the same conditions, the measured concentrationof phenol using the LIFS method decreased from 0.99 to 0.77 g/Nm3,but increased from 0.99 to 1.11 g/Nm3 by using the SPA method. Fur-thermore, when the pressure was increased from 1.0 to 2.5 bar, themeasured concentrations of anthracene, fluoranthene and pyreneusing LIFS and SPA method also showed an opposite change trend.Knight [33] studied biomass gasification under different pressures
and found that the fraction of PAH increased with enhancing pres-sure. The pressure seems to affect the formation of tar obtainedfrom willow gasification in a different way. During willow gasifica-tion, the formation of all tar compounds except for naphthalene de-creased with increasing pressure under most operational conditions.However, for heavier tar compounds such as biphenyl, anthracene,fluorene, fluoranthene and pyrene, their measured concentrationsusing the LIFS and SPA methods showed exactly an opposite changetrend at a lower SBR. For instance, at a temperature of 750 °C with aSBR of approximately 0.8, when the pressure was increased from 1.0to 2.5 bar, the measured concentrations of biphenyl, anthracene,fluorene, fluoranthene and pyrene using the LIFS method decreased,while using the SPA method all the aforementioned concentrationsincreased. An explanation for this difference could be that during theexperiment, some blockage in the cyclone occurred which could leadto some tar components being filtered out, cracked or converted inthe fixed bed of char/ash that was accumulating in the cyclone. Thismay be the reason that the low tar concentration was obtained fromwillow gasification under pressure.
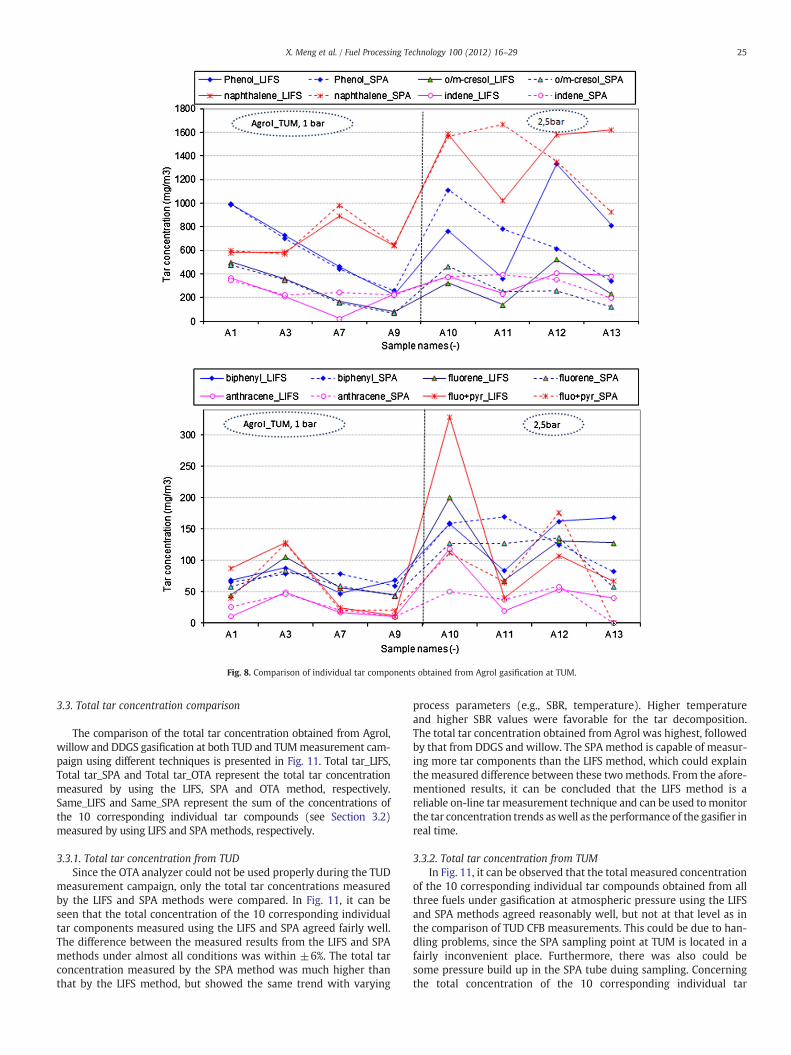
Fig. 8. Comparison of individual tar components obtained from Agrol gasification at TUM.
25X. Meng et al. / Fuel Processing Technology 100 (2012) 16–29
3.3. Total tar concentration comparison
The comparison of the total tar concentration obtained from Agrol,willow and DDGS gasification at both TUD and TUMmeasurement cam-paign using different techniques is presented in Fig. 11. Total tar_LIFS,Total tar_SPA and Total tar_OTA represent the total tar concentrationmeasured by using the LIFS, SPA and OTA method, respectively.Same_LIFS and Same_SPA represent the sum of the concentrations ofthe 10 corresponding individual tar compounds (see Section 3.2)measured by using LIFS and SPA methods, respectively.
3.3.1. Total tar concentration from TUDSince the OTA analyzer could not be used properly during the TUD
measurement campaign, only the total tar concentrations measuredby the LIFS and SPA methods were compared. In Fig. 11, it can beseen that the total concentration of the 10 corresponding individualtar components measured using the LIFS and SPA agreed fairly well.The difference between the measured results from the LIFS and SPAmethods under almost all conditions was within ±6%. The total tarconcentration measured by the SPA method was much higher thanthat by the LIFS method, but showed the same trend with varying
process parameters (e.g., SBR, temperature). Higher temperatureand higher SBR values were favorable for the tar decomposition.The total tar concentration obtained from Agrol was highest, followedby that from DDGS and willow. The SPA method is capable of measur-ing more tar components than the LIFS method, which could explainthe measured difference between these twomethods. From the afore-mentioned results, it can be concluded that the LIFS method is areliable on-line tarmeasurement technique and can be used tomonitorthe tar concentration trends aswell as the performance of the gasifier inreal time.
3.3.2. Total tar concentration from TUMIn Fig. 11, it can be observed that the total measured concentration
of the 10 corresponding individual tar compounds obtained from allthree fuels under gasification at atmospheric pressure using the LIFSand SPA methods agreed reasonably well, but not at that level as inthe comparison of TUD CFB measurements. This could be due to han-dling problems, since the SPA sampling point at TUM is located in afairly inconvenient place. Furthermore, there was also could besome pressure build up in the SPA tube duing sampling. Concerningthe total concentration of the 10 corresponding individual tar
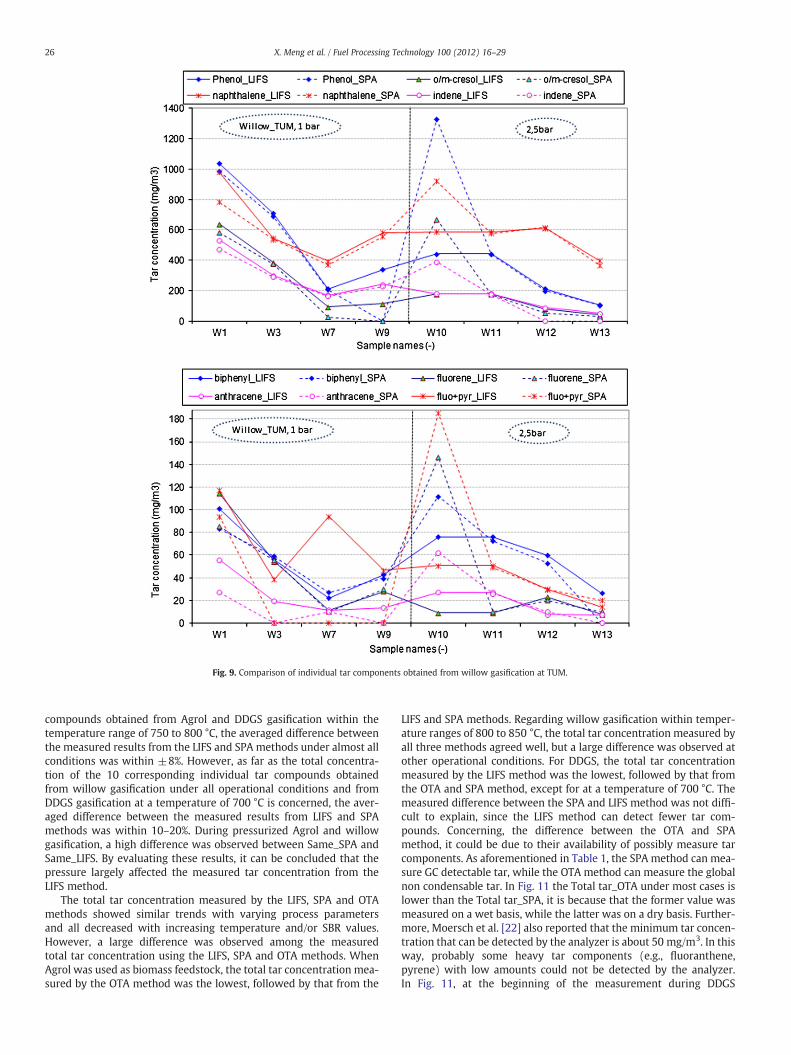
Fig. 9. Comparison of individual tar components obtained from willow gasification at TUM.
26 X. Meng et al. / Fuel Processing Technology 100 (2012) 16–29
compounds obtained from Agrol and DDGS gasification within thetemperature range of 750 to 800 °C, the averaged difference betweenthe measured results from the LIFS and SPA methods under almost allconditions was within ±8%. However, as far as the total concentra-tion of the 10 corresponding individual tar compounds obtainedfrom willow gasification under all operational conditions and fromDDGS gasification at a temperature of 700 °C is concerned, the aver-aged difference between the measured results from LIFS and SPAmethods was within 10–20%. During pressurized Agrol and willowgasification, a high difference was observed between Same_SPA andSame_LIFS. By evaluating these results, it can be concluded that thepressure largely affected the measured tar concentration from theLIFS method.
The total tar concentration measured by the LIFS, SPA and OTAmethods showed similar trends with varying process parametersand all decreased with increasing temperature and/or SBR values.However, a large difference was observed among the measuredtotal tar concentration using the LIFS, SPA and OTA methods. WhenAgrol was used as biomass feedstock, the total tar concentration mea-sured by the OTA method was the lowest, followed by that from the
LIFS and SPA methods. Regarding willow gasification within temper-ature ranges of 800 to 850 °C, the total tar concentration measured byall three methods agreed well, but a large difference was observed atother operational conditions. For DDGS, the total tar concentrationmeasured by the LIFS method was the lowest, followed by that fromthe OTA and SPA method, except for at a temperature of 700 °C. Themeasured difference between the SPA and LIFS method was not diffi-cult to explain, since the LIFS method can detect fewer tar com-pounds. Concerning, the difference between the OTA and SPAmethod, it could be due to their availability of possibly measure tarcomponents. As aforementioned in Table 1, the SPA method can mea-sure GC detectable tar, while the OTA method can measure the globalnon condensable tar. In Fig. 11 the Total tar_OTA under most cases islower than the Total tar_SPA, it is because that the former value wasmeasured on a wet basis, while the latter was on a dry basis. Further-more, Moersch et al. [22] also reported that the minimum tar concen-tration that can be detected by the analyzer is about 50 mg/m3. In thisway, probably some heavy tar components (e.g., fluoranthene,pyrene) with low amounts could not be detected by the analyzer.In Fig. 11, at the beginning of the measurement during DDGS

Fig. 10. Comparison of individual tar components obtained from DDGS gasification at TUM.
27X. Meng et al. / Fuel Processing Technology 100 (2012) 16–29
gasification, the total tar concentration measured by the OTA methodwas fairly high which was due to the fact that the measured tar con-tent was quantified using the RF value determined later. Therefore,this part of data showed less accuracy and reliability.
However, varying the pressure, the measured total tar concentra-tion using all three methods showed different trends. Regarding Agrolgasification, when the pressure was increased from 1.0 to 2.5 bar at atemperature of 750 °C with SBR of approximately 0.83 (Sample A1 to10), the total tar concentration using the LIFS and SPA methods in-creased from 3.45 to 4.45 g/Nm3 and 5.55 to 7.27 g/Nm3, respectively,while it decreased from 4.45 to 1.4 g/m3, when using the OTA meth-od. However, when a slightly higher SBR of around 0.9 was appliedunder similar operational conditions, the total tar concentrationobtained from willow gasification using the LIFS method decreasedfrom 4.36 to 1.84 g/Nm3, while it increased from 6.94 to 8.0 g/Nm3
and from 1.83 to 3.09 g/m3, respectively, when measuring with theSPA and OTA methods. Based on these observations, it can be con-cluded that the measured results by the OTA method are also largelyaffected by the pressure. Furthermore, the different tar formationbehaviors during Agrol and willow gasification under pressurizedconditions need to be further investigated.
4. Conclusion
The analyzed results from on-line tar measurement campaignshowed that the measured concentration of the 10 correspondingindividual tar compounds obtained from steam-oxygen blown CFBand steam blown PBFB atmospheric pressure biomass gasificationtests using the off-line SPA and the on-line LIFS methods agreedreasonably well. The total tar concentration measured by the LIFS,SPA and OTA methods showed similar trends with varying processparameters. The LIFS method is a reliable on-line tar measurementtechnique as its measured results agreed well with that from theSPA method. Both the on-line LIFS and OTA methods can be usedas an indicator to monitor the change of the gasifier performancein real time. However, in order to achieve good and reliable tarmeasurement results, a regular calibration of the OTA method isvery important. The settings of the OTA analyzer used for themeasurement should remain the same as those used during thecalibration procedure. Since the RF value is very sensitive to allparameters (e.g., carrier gas pressure, MR selection), a change ofany of these parameters could lead to a significant influence on theactual measurement results.
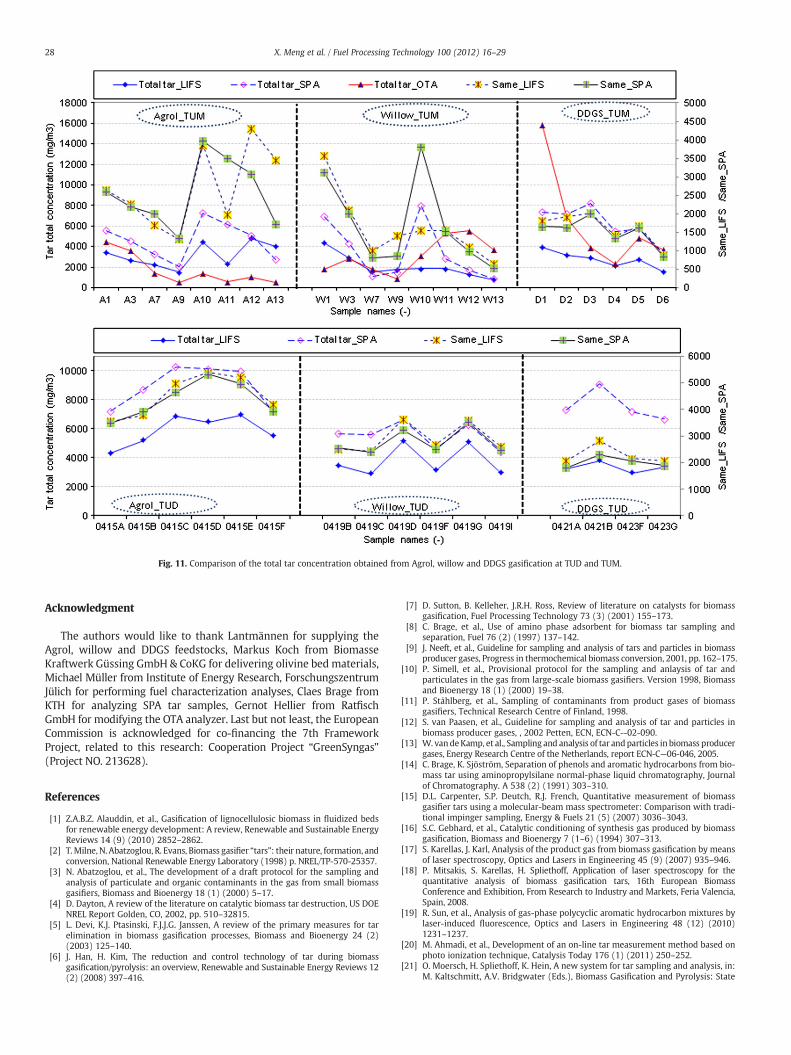
Fig. 11. Comparison of the total tar concentration obtained from Agrol, willow and DDGS gasification at TUD and TUM.
28 X. Meng et al. / Fuel Processing Technology 100 (2012) 16–29
Acknowledgment
The authors would like to thank Lantmännen for supplying theAgrol, willow and DDGS feedstocks, Markus Koch from BiomasseKraftwerk Güssing GmbH & CoKG for delivering olivine bed materials,Michael Müller from Institute of Energy Research, ForschungszentrumJülich for performing fuel characterization analyses, Claes Brage fromKTH for analyzing SPA tar samples, Gernot Hellier from RatfischGmbH for modifying the OTA analyzer. Last but not least, the EuropeanCommission is acknowledged for co-financing the 7th FrameworkProject, related to this research: Cooperation Project “GreenSyngas”(Project NO. 213628).
References
[1] Z.A.B.Z. Alauddin, et al., Gasification of lignocellulosic biomass in fluidized bedsfor renewable energy development: A review, Renewable and Sustainable EnergyReviews 14 (9) (2010) 2852–2862.
[2] T.Milne, N. Abatzoglou, R. Evans, Biomass gasifier “tars”: their nature, formation, andconversion, National Renewable Energy Laboratory (1998) p. NREL/TP-570-25357.
[3] N. Abatzoglou, et al., The development of a draft protocol for the sampling andanalysis of particulate and organic contaminants in the gas from small biomassgasifiers, Biomass and Bioenergy 18 (1) (2000) 5–17.
[4] D. Dayton, A review of the literature on catalytic biomass tar destruction, US DOENREL Report Golden, CO, 2002, pp. 510–32815.
[5] L. Devi, K.J. Ptasinski, F.J.J.G. Janssen, A review of the primary measures for tarelimination in biomass gasification processes, Biomass and Bioenergy 24 (2)(2003) 125–140.
[6] J. Han, H. Kim, The reduction and control technology of tar during biomassgasification/pyrolysis: an overview, Renewable and Sustainable Energy Reviews 12(2) (2008) 397–416.
[7] D. Sutton, B. Kelleher, J.R.H. Ross, Review of literature on catalysts for biomassgasification, Fuel Processing Technology 73 (3) (2001) 155–173.
[8] C. Brage, et al., Use of amino phase adsorbent for biomass tar sampling andseparation, Fuel 76 (2) (1997) 137–142.
[9] J. Neeft, et al., Guideline for sampling and analysis of tars and particles in biomassproducer gases, Progress in thermochemical biomass conversion, 2001, pp. 162–175.
[10] P. Simell, et al., Provisional protocol for the sampling and anlaysis of tar andparticulates in the gas from large-scale biomass gasifiers. Version 1998, Biomassand Bioenergy 18 (1) (2000) 19–38.
[11] P. Ståhlberg, et al., Sampling of contaminants from product gases of biomassgasifiers, Technical Research Centre of Finland, 1998.
[12] S. van Paasen, et al., Guideline for sampling and analysis of tar and particles inbiomass producer gases, , 2002 Petten, ECN, ECN-C--02-090.
[13] W. vandeKamp, et al., Sampling and analysis of tar andparticles in biomass producergases, Energy Research Centre of the Netherlands, report ECN-C—06-046, 2005.
[14] C. Brage, K. Sjöström, Separation of phenols and aromatic hydrocarbons from bio-mass tar using aminopropylsilane normal-phase liquid chromatography, Journalof Chromatography. A 538 (2) (1991) 303–310.
[15] D.L. Carpenter, S.P. Deutch, R.J. French, Quantitative measurement of biomassgasifier tars using a molecular-beam mass spectrometer: Comparison with tradi-tional impinger sampling, Energy & Fuels 21 (5) (2007) 3036–3043.
[16] S.C. Gebhard, et al., Catalytic conditioning of synthesis gas produced by biomassgasification, Biomass and Bioenergy 7 (1–6) (1994) 307–313.
[17] S. Karellas, J. Karl, Analysis of the product gas from biomass gasification by meansof laser spectroscopy, Optics and Lasers in Engineering 45 (9) (2007) 935–946.
[18] P. Mitsakis, S. Karellas, H. Spliethoff, Application of laser spectroscopy for thequantitative analysis of biomass gasification tars, 16th European BiomassConference and Exhibition, From Research to Industry and Markets, Feria Valencia,Spain, 2008.
[19] R. Sun, et al., Analysis of gas-phase polycyclic aromatic hydrocarbon mixtures bylaser-induced fluorescence, Optics and Lasers in Engineering 48 (12) (2010)1231–1237.
[20] M. Ahmadi, et al., Development of an on-line tar measurement method based onphoto ionization technique, Catalysis Today 176 (1) (2011) 250–252.
[21] O. Moersch, H. Spliethoff, K. Hein, A new system for tar sampling and analysis, in:M. Kaltschmitt, A.V. Bridgwater (Eds.), Biomass Gasification and Pyrolysis: State

29X. Meng et al. / Fuel Processing Technology 100 (2012) 16–29
of the Art and Future Prospects, CPL Scientific Limited, Newbury, UK, 1997,pp. 228–234.
[22] O. Moersch, H. Spliethoff, K. Hein, Tar quantification with a new online analyzingmethod, Biomass and Bioenergy 18 (1) (2000) 79–86.
[23] M. Mayerhofer, et al., Influence of operational parameters on tar formation andmain gas components during allothermal steam gasification, Proceeding of 19thEuropean Biomass Conference and Exhibition from Research to Idustry andMarkets, 2011, Berlin, Germany.
[24] X. Meng, et al., Primary results of dried distillers grains with solubles gasificationin a 100kWth steam-oxygen blown circulating fluidized bed gasifier, the 8th In-ternational Symposium on Gas Cleaning at High Temperatures, 2010, 2010,Taiyuan, Shanxi, China.
[25] M. Siedlecki, et al., Effect of Magnesite as Bed Material in a 100 kWth Steam- OxygenBlown Circulating Fluidized-Bed Biomass Gasifier on Gas Composition and TarFormation, Energy & Fuels 23 (11) (2009) 5643–5654.
[26] X. Meng, et al., Biomass gasification in a 100 kWth steam-oxygen blowncirculating fluidized bed gasifier: Effects of operational conditions on product
gas distribution and tar formation, Biomass and Bioenergy 35 (7) (2011)2910–2924.
[27] P. Mitsakis, Online analysis of the tar content of biomass gasification producergas, Germany, Technische Universität München, 2011.
[28] P. Mitsakis, M. Mayerhofer, H. Spliethoff, Qualitative and quantitative analysis ofbiomass gasification tars by means of laser spectroscopy, 17th European BiomassConference and Exhibition. From Research to Industry and Markets,29 June-3 July2009, Hamburg, Germany, 2009, pp. 639–645.
[29] Ratfisch, Tar analyser TA120-3 user manual.[30] C. Brage, et al., Tar evolution profiles obtained from gasification of biomass and
coal, Biomass and Bioenergy 18 (1) (2000) 87–91.[31] X. Li, et al., Biomass gasification in a circulating fluidized bed, Biomass and
Bioenergy 26 (2) (2004) 171–193.[32] S. Rapagna, et al., Steam-gasification of biomass in a fluidised-bed of olivine
particles, Biomass and Bioenergy 19 (3) (2000) 187–197.[33] R.A. Knight, Experience with raw gas analysis from pressurized gasification of
biomass, Biomass and Bioenergy 18 (1) (2000) 67–77.