fueling the future with green economy: an integration of
TRANSCRIPT

Fueling the Future With Green Economy: AnIntegration of Its Determinants From RenewableSourcesWeiqing Li
Zhejiang International Studies UniversityAbdul Razzaq Khan
Shaheed Zul�kar Ali Bhutto Institute of Science and TechnologyShahid Bashir
Namal InstituteWasim Iqbal
Shenzhen UniversityMaryam Khokhar ( [email protected] )
Yanshan University
Research Article
Keywords: Multi-Stage model, Renewable energy, Pakistan, DEA, Green Hydrogen Production (GHP),Fuzzy-AHP
Posted Date: April 19th, 2021
DOI: https://doi.org/10.21203/rs.3.rs-404527/v1
License: This work is licensed under a Creative Commons Attribution 4.0 International License. Read Full License

Fueling the Future with Green Economy: An Integration of Its 1
Determinants from Renewable Sources 2
3
Weiqing Li 1, Abdul Razzaq Khan 2, Shahid Bashir 3, Wasim Iqbal 4, Maryam Khokhar 5 4
5 1 School of International Economics and Tourism Management, Zhejiang International 6
Studies University, Hangzhou 310023, China 7
2 Department of Social Sciences, SZABIST-Islamabad. 8
3 Business Studies Department, Namal Institute Mianwali, Pakistan 9
4 Department of Management Science, College of Management, Shenzhen University, Shenzhen, 10
China 11
5 College of Economics and Management, Yanshan University, Qinhuangdao 066004, 12
China 13
[email protected]; [email protected]; [email protected]; 14
[email protected]; [email protected] 15
Abstract 16
Green hydrogen energy is a clean alternative fuel that can help developing economies to 17
increase energy security. This study assesses possible solutions for Pakistan's energy scarcity 18
based on a renewable source of green hydrogen generated through wind, solar, biomass, and 19
geothermal energy. For this purpose, four main criteria: economic, commercialization, 20
environmental, and social acceptance, have been assessed. The study used two-step models, the 21
Fuzzy-analytical hierarchal process, and the Data Envelopment Analysis techniques to evaluate 22
hydrogen energy production through available renewable energy sources. According to the fuzzy-23
led analysis's empirical results, wind energy source optimization is best suited to produce hydrogen 24
energy in Pakistan for all four criteria (economic benefit, environmental impacts, commercial 25
potential, and social acceptance). At the same time, solar is the second-best option in all the given 26
criteria. The DEA-led analysis also considers wind energy as the most efficient source to produce 27
hydrogen energy in Pakistan. This study can help policymakers develop fact-based hydrogen 28
energy projects in their respective areas, especially in developing economies, as most share the 29
same characteristics. 30

Keywords: Multi-Stage model; Renewable energy; Pakistan; DEA; Green Hydrogen Production 31
(GHP); Fuzzy-AHP 32
1. Introduction 33
The energy demand is expected to increase by around 30% globally during the next 34
twenty-five year between 2015 to 2040, while developing Asia may demand 50% more energy 35
sources than currently. Nearly 13% of the world population (940 million) are suffering from 36
finding necessary energy consumption (electricity), and Sub-Saharan Africa and South Asia 37
account for 89% (840million) of the total electricity shortage (Iqbal et al., 2019). It has been 38
estimated that 40% (more than three billion) of the world population must bear the health cost of 39
indoor air pollution due to dirty energy sources for cooking and heating. The consumption of solid 40
fuel for this purpose has been reported very high in sub-Saharan Africa (77%) and South Asia 41
(61%). Therefore, increasing energy demand has become the primary reason to invests in safe, 42
green, efficient, and sustainable energy sources (Hou et al., 2019). The world is spending sufficient 43
time and money on renewable energy sources. There is a 28% share of renewables in global 44
electricity generation in the first quarter of 2020 against 26% in 2019 (Iqbal et al., 2020). The 45
primary sources are hydropower, wind, and solar. However, this renewable energy production is 46
taking place in high economic growth countries. Most developing economies (except China) suffer 47
from converting dirty energy sources into clean and green ones due to some similar constraints. 48
These constraints' most common characteristics are lack of finance, innovative technologies, 49
and unskilled human capital at labor and policymaking levels. Like other developing countries of 50
the South Asian region, Pakistan is also facing the issues of high energy demand, the high share 51
of fossil fuel-based energy consumption, the high share of import-based energy consumption, and 52
high environmental and economic cost in term of health issues due to solid & dirty energy usage 53

for commercial and domestic use. Pakistan's per capita energy consumption reported 460.23kg oil 54
equivalent in 2014, out of which 61.59% is fossil fuel- based energy and 24.12% imported (Wu et 55
al., 2020). Only 43.32% of the total population has access to clean fuel and technologies for 56
cooking and heating. Thus, during the last two decades, Pakistan has been facing an energy crisis, 57
where more than 145 million people suffer from accessing electricity. Still, 28.91% population has 58
no access to electricity in Pakistan, while the electricity deficit was nearly 6500 MW in 2018. Due 59
to this, there were 6-9 hours per day average load shedding has been observed. It is exceptionally 60
high in the rural areas (12 to 14 hours daily power shutdowns), and it has the worst implications 61
on the country’s economic growth (Akhtar et al., 2018). For example, due to this calamity, almost 62
five million daily paid workers have lost their jobs. 63
Pakistan is considered one of the least renewable energy-producing countries (only 4.2% out 64
of 26 GW of total energy), while hydrogen energy production is near to none (Akombi et al., 2017). 65
The world has shifted towards hydrogen production due to high fuel cell technologies, and it is 66
likely to replace fossil fuel as a source of energy. Technology innovation is expected to replace 67
oil-based vehicles soon with hydrogen fuel-based vehicles (Klitkou et al., 2015). In this context, 68
hydrogen energy is the best option to boost the country’s economy and reduce the energy crisis on 69
an emergency basis. Pakistan has sufficient hydrogen energy resources to drip water and fuel from 70
renewable energy, produce the hydrogen energy system, and meet various sectors' energy needs, 71
such as transport, agriculture, and electricity. Furthermore, the production process uses chemical 72
energy from hydrogen and converts it into electricity without burning any fuel. Therefore, it is 73
termed the green hydrogen energy economy. This study aims to establish a structure for the choice 74
of the best viable hydrogen production in Pakistan. 75

The recent literature survey emphasized that green renewable provides the best alternative to 76
fossil fuel energy in a better environment for human health (Khan et al., 2020). A potential 77
agreement of 81 countries in 2020 focuses on increasing the green hydrogen economy for 78
globalization and energy transition to boost the hydrogen fuel cell industry. Sectors, such as 79
transportation, are already using this source of energy fueling (Rehman Khan et al., 2018) . 80
Various hydrogen energy resources provide higher efficiency as compared to fossil fuel sources. 81
Furthermore, sustainable and efficient hydrogen production from clean energy sources is a few 82
renewable energy approaches such as wind, biomass, and solar. An increase in global warming 83
and environmental degradation gives rise to a need for sustainable and environmentally friendly 84
alternative energy sources, such as renewable energy sources. Several technological innovations 85
for hydrogen production have been studied in the literature. Categorized hydrogen energy as a 86
sustainable and clean energy source like solar, biomass, wind, wastages, and small hydro energy. 87
Environment friendly and economically sustainable with higher technical and social benefits is a 88
few of the reimbursements of hydrogen energy (Diriba Guta, 2012) . In this context, developed an 89
intuitionistic fuzzy set theory for optimizing hydrogen energy by using wind, nuclear, coal, and 90
natural gas energy to determine socio-economic performance and government support. It 91
suggested that nuclear energy is the best approach to optimize electricity for hydrogen production. 92
Similarly, (Khan et al., 2020) used the multiple-choice decision analysis (MCDA) technique to 93
develop performance-based sustainability indexing for economic, social, and market factors by 94
applying four hydrogen systems, such as feedstock, H2 consumption and production, and electrical 95
energy. Furthermore, (Turcanu et al., 2007) used the MCDA with a fuzzy multiplication actor to 96
measure wind power potential feasibility. For this purpose, the study developed criteria based on 97
the approach's economic, environmental, social-political, and technological aspects. 98

It proposed the possibilities to contain conventional gasification, pyrolysis, fermentative, and 99
supercritical gasification. (Dasappa, 2011) proposed a fuzzy- analytical hierarchal process (F-100
AHP) method for Turkey's hydrogen production. According to this study, two (wind and solar) 101
renewable energy sources were efficient for hydrogen production. (Avikal et al., 2021) proposed 102
the MCDA methods and F-AHP methods to assess the hydrogen production process, including 103
gird, solar PV system, wind, and nuclear energy. It was studied based on four main criteria: social, 104
economic, environmental, and technical criteria, and it found that gird sustainability is more 105
efficient than the other production processes. The literature mentioned above suggested that the 106
multi-criteria decision analysis technique for selecting the best hydrogen generation among the 107
available energy recourses can be the right decision. On the same note, (Shukla et al., 2014) applied 108
the AHP method to analyze the hydrogen production source selection from alternatives, such as 109
biomass, coal, steam methane reforming, and partial oxidation for the hydro-carbons combination 110
of wind energy, hydro energy, and solar PV system. It has been observed that most of the above 111
literature carried out one or two primary objectives to view the possible production of hydrogen 112
energy in different countries. We applied two-step MCDA, F-AHP, and DEA to evaluate four 113
criteria: environmental impacts, commercial potential, social acceptance, and economic benefits. 114
It suggested that the implementation of renewable energy for the production process of hydrogen 115
is the clean option. 116
From a decision-making perspective, this study has several contributions to the evidence 117
based on exploring the least cost and an uninterrupted system that supplies 100% renewable energy 118
by focusing on developing economies. For this purpose, this study used a Fuzzy TOPSIS 119
simulation model based on renewable energy sources. Further, the paper contributes to integrated 120
modeling to assess renewable energy and deep decarburization targets collectively for the 121

methodological purpose. Without the analytical framework, the analysis of renewable energy may 122
be inconsistent and limited due to the scenario of deep decarburization, which leads to suboptimal 123
policy decisions. Governments and decision-makers of developing economies face difficulties 124
selecting the optimum electricity sources among the renewable energies (wind, solar, biomass, 125
solid municipal wastages, small hydropower, and geothermal energy). In this context, this study 126
aims to provide an MCDA-based approach for measuring the optimum renewable energy through 127
green hydrogen production. 128
The weights criteria of F-AHP are considered the output of the DEA method with the 129
development cost as its input. The relative efficiency of the given renewable energy source for 130
hydrogen energy is calculated based on their respective ranks. This study's outcomes can be 131
generalized for policymaking in developing economies, mostly from South Asia, which owned the 132
same environment, climate, economic, and energy characteristics. As there is a considerable gap 133
in the literature of hydrogen energy feasibilities for developing economies, the current study will 134
fill the literature gap regarding methods, techniques, and evaluation processes of hydrogen energy 135
project feasibility from different angles. The study is organized as follows: section two highlights 136
the background of renewable energy sources with context to Pakistan, followed by methodological 137
issues in the third section. The fourth section presents the results with discussion, while the final 138
section briefly describes the study's conclusion and policy implication. 139
Rest of this paper as follows: Section 2 Discusses the Background. Section 3 The 140
methodology. Section 4 Results and analysis. Section 5 discusses the results. Section 6 Discussion 141
and final Section 7 conclusion and policy implication. 142
2. Background 143

The possible renewable energy sources for green hydrogen generation in Pakistan are wind, 144
solar, biomass, small hydro, geothermal, and municipal solid waste energy. These renewable 145
energy resources are vital for the green economy in Pakistan with innovative conversing 146
technologies. 147
2.1 Solar energy 148
According to the report of the Pakistan meteorologist department, Pakistan is an ideal country 149
for solar energy due to its long summer season sunny days nearly three hundred days in a year (Xu 150
et al., 2019). Many solar energies are planning resource-based projects running with the help of 151
the United States, World Bank(The World Bank, 2015a) and Asian development banks(Haas, 152
1974). The USA based laboratory (NREL) and Aerospace Center Institute (ACI) German 153
department shows its report that Pakistan has long hour sunshine of between 8 to 10 hours a day. 154
Which are annual equals to the solar radiation of 15×1014 kilowatt-hours? These radiations 155
produce a maximum of 1600 Giga solar energy (Solangi et al., 2019). The World Bank launches 156
the assessment program called Energy Sector Management Assistance Program, which is the main 157
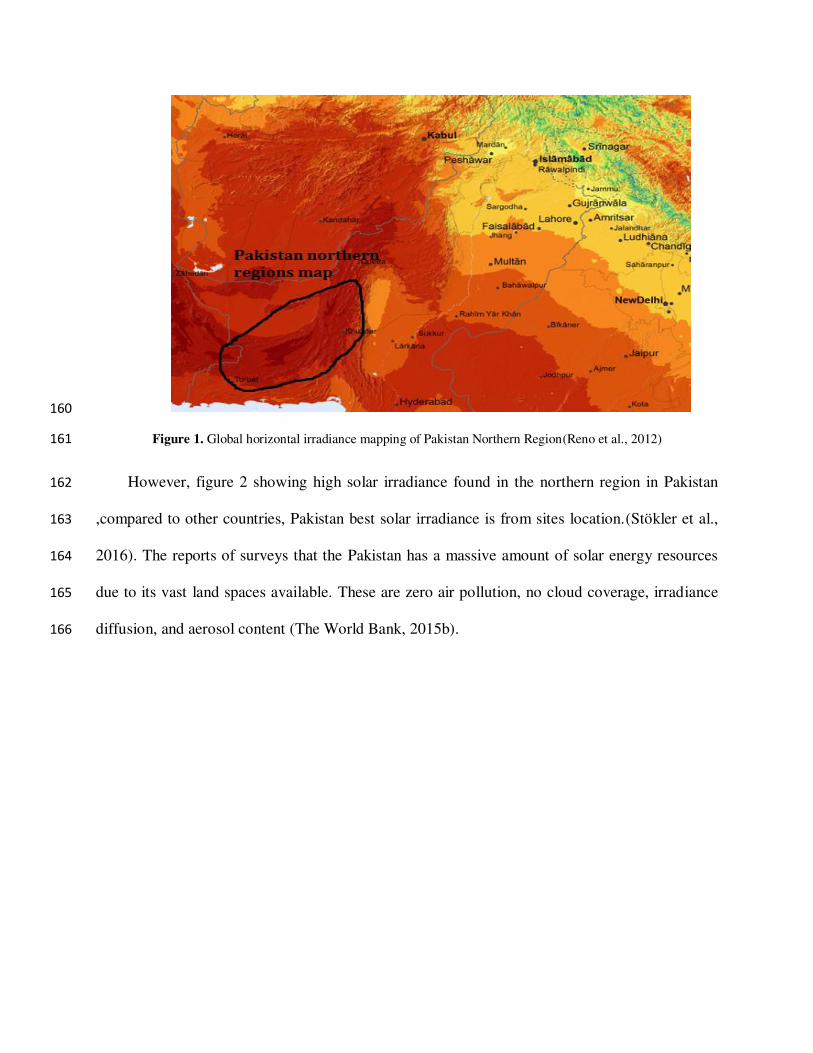
goal to assess a solar resource mapping in Pakistan. In Figure 1. Shows the solar assessment results, 158
which is total annually globally horizontal irradiance 2000 kWh/m2 it is (90 %) in Pakistan areas. 159
160
Figure 1. Global horizontal irradiance mapping of Pakistan Northern Region(Reno et al., 2012) 161
However, figure 2 showing high solar irradiance found in the northern region in Pakistan 162
,compared to other countries, Pakistan best solar irradiance is from sites location.(Stökler et al., 163
2016). The reports of surveys that the Pakistan has a massive amount of solar energy resources 164
due to its vast land spaces available. These are zero air pollution, no cloud coverage, irradiance 165
diffusion, and aerosol content (The World Bank, 2015b). 166

167
Figure 2. RES-based hydrogen production and supply 168
Pakistan has a variety of renewable energy sources including wind, solar, biomass, and 169
geothermal energy. Such RES sources can be very suitable inputs for green hydrogen production 170
using the new conversion processes. Therefore, this paper complete reviews and estimates 171
potential of the renewable energy sources for hydrogen production from available RES resources. 172
Our main objective of estimation to the select optimal renewable energy sources (RES) for increase 173
the green hydrogen production for country wide. Table 1. Represent minimum and maximum solar 174
radiation values, and also Table 2, the area-wise Solar radiation %, these data collected from 175
NASA atmospheric and meteorology center. 176
Table 1. Show the values of minimum and maximum solar radiation (Tahir and Asim, 2018). 177
Mini or Max Solar radiation Values (kWh/m2/day)

Minimum 5.2275
Maximum 7.0016
In Table 2. Statistics show the accessibility of solar radiation of 150,000 square kilometer 178
area, and these are best for maximum green hydrogen production. Based on the above estimate, 179
less than 2 percent site available for the one hundred solar plant installation, from these small areas 180
generated 20GW energy in the system (Duffie and Beckman, 2013). Moreover, the statics of green 181
hydrogen production more according to solar energy availability (Melaina et al., 2013). These 182
studies suggested that one-megawatt solar energy generation needs nearly 20.5 to 20.7 acres aera 183
(Gondal et al., 2018). Therefore, we need to advance renewable technologies more to generate 184
more green energy in the system. 185
Table 2. Solar irradiation in Pakistan areas (Tahir and Asim, 2018). 186
Solar Insolation (kWh/m2/day) %
5 to 6 69.31
> 6.0 30.69
2.2 Wind energy 187
Pakistan has abundant wind power energy resources, also has a high energy generation ability 188
for hydrogen production. United states-based departments NREL, AEDB, and Pakistan 189
Meteorological Department (PMD) assessment of the Pakistan wind power sources to create the 190
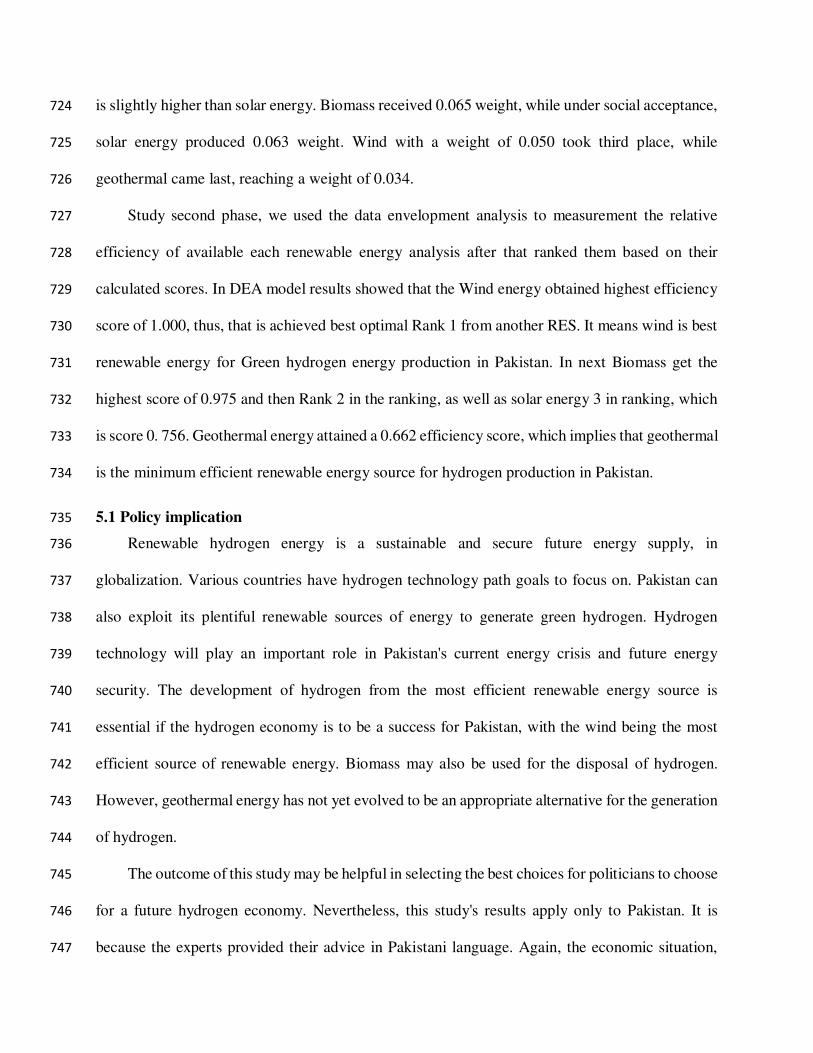
wind energy mapping of the country. In Figure 3. Show the Map of the potential wind sites in 191
Pakistan regions. The Sindh and Baluchistan region are more suitable for wind energy production, 192
and only some areas of country have favorable wind energy potential for hydrogen generation. 193
According to assessment, we will be able to utilizable more wind energy from high potential wind 194
sites are as nearly 346 gigawatts. Pakistan has many suitable sites for wind power production 195
connection projects. In between other sites, the Sindh region namely Gharo and Keti Bandar, was 196
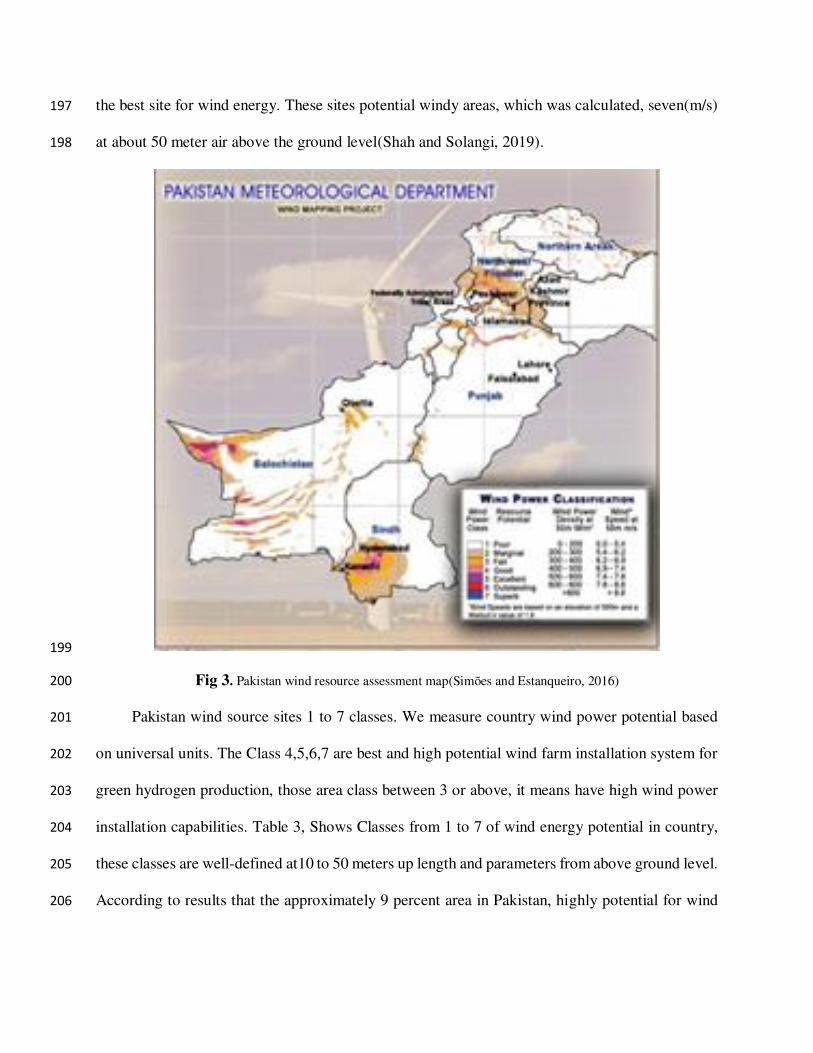
the best site for wind energy. These sites potential windy areas, which was calculated, seven(m/s) 197
at about 50 meter air above the ground level(Shah and Solangi, 2019). 198
199
Fig 3. Pakistan wind resource assessment map(Simões and Estanqueiro, 2016) 200
Pakistan wind source sites 1 to 7 classes. We measure country wind power potential based 201
on universal units. The Class 4,5,6,7 are best and high potential wind farm installation system for 202
green hydrogen production, those area class between 3 or above, it means have high wind power 203
installation capabilities. Table 3, Shows Classes from 1 to 7 of wind energy potential in country, 204
these classes are well-defined at10 to 50 meters up length and parameters from above ground level. 205
According to results that the approximately 9 percent area in Pakistan, highly potential for wind 206

energy installation. Derives class 4 to 7 levels that can provide economic and practical wind power 207
production. 208
Table 3. The wind energy potential resources in Pakistan (Shah and Solangi, 2019). 209
Wind energy
class
Wind
potential
10 meters 50 meters
Wind speed Wind
Energy density
Wind speed Wind
Energy density
Class 1 Very Poor 0–4.4(m/s) 0–100(W/m2) 0–5.4(m/s) 0–200(W/m2)
Class 2 Marginal 4.45.1(m/s) 100–150(W/m2) 5.46.2(m/s) 200–300(W/m2)
Class 3 Moderate 5.15.6(m/s) 150–200(W/m2) 6.26.9(m/s) 300–400(W/m2)
Class 4 Good 5.66.0(m/s) 200–250(W/m2) 6.97.4(m/s) 400–500(W/m2)
Class5 Excellent 6.06.4(m/s) 250–300(W/m2) 7.47.8(m/s) 500–600(W/m2)
Class 6 Outstanding 6.47.0(m/s) 300–400(W/m2) 7.88.6(m/s) 600–800(W/m2)
Class 7 Superb >7.0(m/s) >400(W/m2) >8.6(m/s) >800(W/m2)
210
See Table 4 Provides the potential of hydrogen energy from wind recourse in Pakistan. Based 211
on the estimation, we produce (45,000 tons) of hydrogen energy, which is equals to 53,Kwh per 212
kilogram. (Ivy, 2004). Pakistan was producing a total 900 MW wind energy that can be the ability 213
to produce 360 tons of hydrogen energy. 214
Table 4. Estimated hydrogen generation using wind energy(Ivy, 2004). 215
Potential Unit Ten h - Aval Conversion Unit (rate of 53)
86,875 MW 868,750 16,610898 (KWh/kg)
87752.5 MW 877525 16,778680 (KWh/kg)

60812 MW 608,120 11,627533 (KWh/kg)
235,439.5 MW 45,017112 (KWh/kg)
2.3. Biomass energy 216
Pakistan has been categorized fifth-biggest sugarcane producer worldwide. The residual 217
from this crop (sugarcane) can produce 18 Mt of biogas per year, which could be a good source of 218
hydrogen energy production. The livestock sector is another source of biomass energy in Pakistan, 219
where the animal population is growing at around 8 % annually. More than 35 million rural people 220
are generating their 30%-40% income from livestock. Between, 2012-2013, Pakistan generated 221
1140 Mt of muck and 338 Mt of urine from its 72 million livestock. This considerable quantity of 222
musk and urine objects can produce around 19,125 million cubic meters (m3) of biofuel every day. 223
Moreover, bio-fertilizer and nitrogen-enriched produce nearly 57.4 Mkg per day [20]. 23 kg of a 224
dry crop can produce one kilogram of hydrogen energy. Therefore, Pakistan has a total potential 225
of 6633 thousand tons of hydrogen power from biomass energy resources. Table 5 presents the 226
estimated hydrogen energy production from numerous varieties of crop residue in the country. 227
Table 5. Show each crop residue estimation for hydrogen energy production. 228
Kind of Crop Crop residues Existing Residue (1000 MT) Potential of Hydrogen generation
(1000 tones)
1.Cotton Stalks 3300 254
Cobs 11,900 915
Husk 3300 254
2.Barley Stalks 110 8
3.Bajra Husks 152 12
Cobs 950 73
Stalks 142 11
4.Dry Chilly Stalks 285 22
5.Wheat Stalks 7200 554
Husks 36,000 2,769
6.Maize Stalks 600 46
Husk 90 7
7.Rice Boll Shell 10,400 800
Stalks 1400 108
Straw 10,400 800
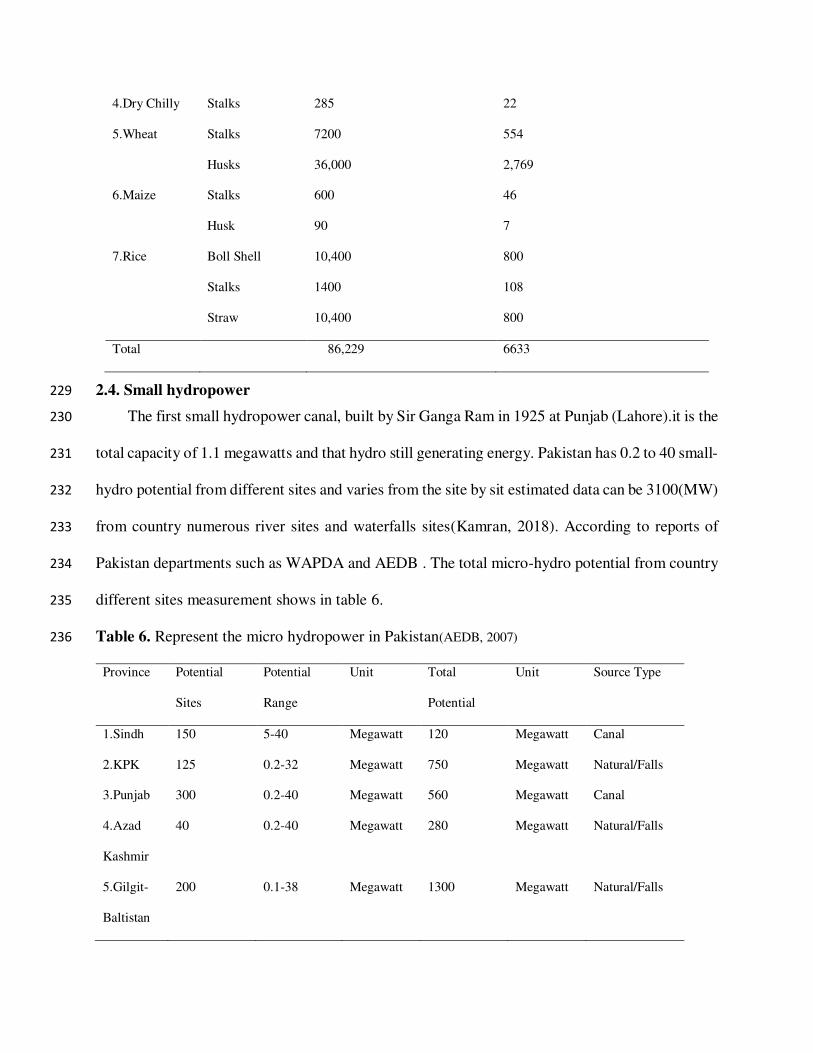
Total 86,229 6633
2.4. Small hydropower 229
The first small hydropower canal, built by Sir Ganga Ram in 1925 at Punjab (Lahore).it is the 230
total capacity of 1.1 megawatts and that hydro still generating energy. Pakistan has 0.2 to 40 small-231
hydro potential from different sites and varies from the site by sit estimated data can be 3100(MW) 232
from country numerous river sites and waterfalls sites(Kamran, 2018). According to reports of 233
Pakistan departments such as WAPDA and AEDB . The total micro-hydro potential from country 234
different sites measurement shows in table 6. 235
Table 6. Represent the micro hydropower in Pakistan(AEDB, 2007) 236
Province Potential
Sites
Potential
Range
Unit Total
Potential
Unit Source Type
1.Sindh 150 5-40 Megawatt 120 Megawatt Canal
2.KPK 125 0.2-32 Megawatt 750 Megawatt Natural/Falls
3.Punjab 300 0.2-40 Megawatt 560 Megawatt Canal
4.Azad
Kashmir
40 0.2-40 Megawatt 280 Megawatt Natural/Falls
5.Gilgit-
Baltistan
200 0.1-38 Megawatt 1300 Megawatt Natural/Falls

All operational small-hydro projects under provincial administration are taking with the help 237
of the Asian Development Bank (AEDB).In 2018, the KPK government had announced the new 238
six small hydro projects with a total volume of 118 megawatts.(AEDB, 2007). Additionally, with 239
the capability of provinces, start various renewed hydro projects with the capacity of 2500 240
megawatt in different stages. Likewise, the Government of Punjab has started four hydro projects 241
with a capacity of 20 megawatts (see table 7). After completed, these projects then the country will 242
be getting more hydrogen production in the system. 243
Table 7. Represent entire small-hydro projects in Pakistan and these maximum generating power 98.41MW. 244
S. No Site Province/District Volume
1 Daragai, Malakand Khyber-Pakhtunkhwa province 20
2 Pehur, HES, Swabi Khyber-Pakhtunkhwa province 18
3 Reshun, HES, Chitral Khyber-Pakhtunkhwa province 4.2
4 Rsishi, HES, Chitral Khyber-Pakhtunkhwa province 1.2
5 Nandipur, Upper Chenab Canal Punjab province 13.8
6 Rasul, Upper Jhelum Canal Punjab province 13.8
7 Shadiwal, Upper Jhelum Canal Punjab province 13.5
8 Cichocki, Upper Chenab Canal Punjab province 13.2
9 Renala, Lowr Bari Doab Canal Punjab province 1.1
2.5. Municipal solid wastage energy 245
Municipal solid wastage too viable and affordable with renewable hydrogen production in 246
Pakistan. Countries' main cities yearly produce 30 million tons of municipal solid wastage (Korai 247
et al., 2017). Municipal solid wastage is increasing with the high rate this could, Speedy increasing 248
urban population of country. But still, developing country Pakistan not proper management to 249
recycling method of municipal solid wastage to convert as the valuable material. When, use the 250
conventional way of wastage disposable this can affect the environment, socio-economic and 251
public health (Khan et al., 2012), (Korai et al., 2016). It is promoting waste to energy on time. It 252
is helpful for the government to tackle the challenge. This could be managed by increasing 253
municipal solid wastage in the country. The municipal solid wastage increasing amount is 254
beneficial for the production of hydrogen. Modern technologies are municipal soil wastages to 255
hydrogen technologies that can be techno-economic viable amount of hydrogen energy producing. 256
Energy from wastage with high population density areas. Mostly urban areas of Pakistan, whereas 257
urban areas highly densely populated where a waste convert to hydrogen can be reached 1 million 258
tones. Only Karachi city produces 13,000 tons of municipal solid wastage reaches per day. 259
Moreover, rural areas generate more municipal solid waste; it is also beneficial for municipal 260
solid wastage to hydrogen energy. As estimate, the rural areas can produce about 814 million 261
kilograms of hydrogen energy per day (Zuberi and Ali, 2015). the biochemical method used for 262
energy production of solid waste. Pakistan can reduce energy imports by 70 percent. Another 263
essential process called the thermochemical process can generate enough energy that can 264
completely replace imported energy. The thermochemical process of waste also decreases 1.86 265
percent burden from primary energy. 266
2.6. Geothermal energy 267
Pakistan is also suitable for geothermal energy due to the high number of tectonic plates available. 268
According to the map, Pakistan can generate 100,000 MW of economical and clean electricity with its 269
available geothermal resource. Table 8 presents the temperature of the potential hydrogen production areas 270
from geothermal energy. Mostly urban areas, industrial zones of Sindh province, and dry rocks are the 271

binding sites for hydrogen energy production. Based on the above-mentioned renewable energy source in 272
Pakistan, the following figure 4 presents hydrogen energy through given resources. 273
274
Figure 4. Map of hydro-geothermal resources in Pakistan(Yousefi et al., 2010) 275
Pakistan will generate 100,000 megawatts economical and clean electricity, with the 276
following available geothermal resource. Table 8 present the temperature of the area with potential 277
hydrogen production from geothermal energy in these mentioned areas. Mostly , urban areas 278
industrial zones of Sindh province produce significant amount of hot, dry rock (Zaigham and 279
Nayyar, 2010) which should provide high hydrogen energy production from these areas. 280
Table 8. Represent the Temperature. Areas and Application of geothermal energy in Pakistan 281
Areas Maximum Temperature Application
1. Karachi city 70 to 145 °C Green housing
Vegetable and fruits drying process

Food processing site
Pulp and paper processing
Soft drink carbonation
Concrete Block curing
2.Muzaffarabad 185 o 230 °C Production of ethanol and Biofuels
Binary Power plant
3.Chagai 200 to 300 °C Hydrogen Production
Dry and flesh steam power plan
4.Chakwal 60 to 90 °C Heat Pump
Aquaculture
Biogas production
Mushroom culture
5. Kolte, Tatta Pani, and Tato 100 to 200 °C Binary power plant
Fabric Dyeing
Refrigeration & Ice making
Cement & Aggregate Drying
Pulp drying
HVAC
Lumber drying
3. Research Framework 282
In this section, we describe the research framework, which contains research methodologies. 283
We are using the two-step proficient MCDA methods. Step 1, used Fuzzy-AHP, and step 2, used 284
data envelopment analysis (DEA), to assess the optimal Renewable energy for hydrogen 285
generation, based on different criteria. Firstly, we selected these criteria and further divided into 286
the input and output criteria. These are the following: Four Output criteria contain (1. Technical 287
potential,2. Economic benefits,3. Environmental implication and4.Social acceptance.), and Only 288
One Input criteria include (renewable electricity production cost. Figure 5 below shows the 289

research framework. Secondly, we obtain weights of Criteria using Fuzzy-AHP with the help of 290
10 experts. These experts including researchers, energy investors and academic professors. Later, 291
we measure the efficiency score of renewable energy sources using input and output data criteria 292
weights in the DEA model. Finally, ranked renewable energy sources with their efficiency scores. 293
294
Figure 5. A Research Framework Diagram 295
4. Methods Description and Validation 296
4.1. Fuzzy Set Theory 297
It is tough to solve real-world problems without using appropriate measurement values. 298
Therefore, decision-makers use crisp values because linguistic values have uncertainty data. The 299
Fuzzy set theory potent tool to remove uncertainties, while decision-makers used for assessment 300
decision-making when crisp values absent, as well as useful for linguistic feedback into crisp data 301
for the decision making. In 1965, Zadeh developed a Fuzzy set theory, which is to minimize 302
ambiguity into linguistic values with the help of the fuzzy triangular numbers (TFNs). We used 303
the triangular fuzzy number (TFN) to rank Renewable Energy Sources (RES), which is best for 304

ranking. Construct the Triangular fuzzy number Fij = (𝑎ij, bij, cij); where middle number bij and 305 aij,cij are left -side and right-side number of in TFN. Let’s Suppose a fuzzy number divide in two 306
numbers. Where Fuzzy1= 𝑎1, 𝑏1, 𝑐1, and Fuzzy2 = 𝑎2, 𝑏2, 𝑐2. We apply different math operation 307
on fuzzy numbers, will be as follow: 308
Add :(𝑎1, 𝑏1, 𝑐1) + (𝑎2, 𝑏2, 𝑐2) = (𝑎1 + 𝑎2, 𝑏1 + 𝑏2, 𝑐1 + 𝑐2) (1) 309
Multiply :(a1, b1, c1) × (a2, b2, c2) = (a1 × a2, b1 × b2, c1 × c2) (2) 310
Divide:(𝑎1, 𝑏1, 𝑐1)−1 = (1 𝑐1⁄ , 1 𝑏1⁄ , 1 𝑎1⁄ ) (3) 311
4.2. Fuzzy-AHP 312
Analytical hierarchal process (AHP) is a multiple-choice decision analysis (MCDA) method, which 313
compares specific choices or alternatives and assigns weights to the criteria. The analytical hierarchal 314
process levels are useful for converting complex problems into sub problems. Each sub-problem level 315
contains the criteria and attribute. However, these criteria offer according to their relative importance and 316
additive weighting process. Also, the AHP has been used in different areas for ranking purposes, which 317
uses a pairwise comparison for calculating the importance of criteria in a hierarchical method. However, 318
the AHP method has the following shortcomings: 319
Unstable decisions 320
Decision-making ambiguity judgments 321
Inaccurate ranking subjectivity in judgment 322
Decision-makers based on the AHP model results. 323
According to AHP limitations, its qualitative analysis produces an absolute magnitude of decided 324
evaluation while these linguistic outcomes cannot be converted into mathematical form. Due to these 325
limitations, it is proposed to convert the linguistic outcomes of AHP into fuzzy numbers. Table 9 presents 326
the Fuzzy measurement scale. Considering this, we applied each linguistic value as a fuzzy number as the 327
reciprocal of each generic verbal value [23]. Thus, there are the following advantages of using fuzzy 328
methodology: 329

The Fuzzy set theory is a potent tool to remove uncertainties 330
it equips decision-makers to apply this to assess better decision-making options in the absence of crisp 331
values. 332
The fuzzy set theory minimizes ambiguity into linguistic values with fuzzy triangular numbers (TFNs) 333
[24]. 334
It is applied to rank renewable energy sources. 335
Table 9. Represent the Fuzzy measurement scale(Hu et al., 2010) 336
Measurement Scale Classification Description
(1, 1, 1) All Equivalent preference Two elements make equal contribution
(2/3, 1, 3/2) Reasonable preference One variable is significantly more favorable than others
(3/2, 2, 5/2) Robust preference One variable is extremely favorable
(5/2, 3, 7/2) Quite robust preference A variable is very highly favorable
(7/2, 4, 9/2) Highest preference One variable is the most favorable variable than others
This matrix represents the Fuzzy pairwise comparison as follow: 337 B = (bij)n×m . Let's have a say Triangular fuzzy number (TFN): Rij = (xij, yij , zij). 338
A Fuzzy AHP also contains the following procedures: 339
1. Using Triangular fuzzy number (TFN) to build pairwise compression through pair according 340
to hierarchical structure. 341
2. The value of ith Fuzzy synthetic set is as follows: 342
𝑆𝐸𝑖 = ∑ 𝑅𝑖𝑗𝑚𝑗=1 ⊗ [∑ ∑ 𝑅𝑖𝑗𝑚𝑗=1𝑛𝑖=1 ]−1 (4) 343
s.t ∑𝑅𝑖𝑗𝑚𝑗=1 = (∑𝑥𝑖𝑗𝑚
𝑗=1 , ∑𝑦𝑖𝑗𝑚𝑗=1 , ∑𝑧𝑖𝑗𝑚
𝑗=1 ) for 𝑖 = 1,2,… , 𝑛 (𝟓) 344
∑∑𝑅𝑖𝑗𝑚𝑗=1
𝑛
𝑖=1= (
∑∑𝑥𝑖𝑗𝑚𝑗=1
𝑛
𝑖=1,∑∑𝑦𝑖𝑗𝑚
𝑗=1𝑛
𝑖=1,∑∑𝑧𝑖𝑗𝑚
𝑗=1𝑛
𝑖=1 ) (𝟔) 345

[ ∑∑𝑅𝑖𝑗𝑚
𝑗=1𝑛
𝑖=1 ] −1 = ( 1∑ ∑ 𝑧𝑖𝑗𝑚𝑗=1𝑛𝑖=1
, 1∑ ∑ 𝑦𝑖𝑗𝑚𝑗=1𝑛𝑖=1, 1∑ ∑ 𝑥𝑖𝑗𝑚𝑗=1𝑛𝑖=1
) (𝟕) 346
The equation number 4,5,6 and 7 measure the SEi = (xi, yi, zi). 347
3. Comparison of 𝑆𝐸𝑖 values and Calculate what's possible degree of 𝑆𝐸𝑗 = (𝑥𝑗, 𝑦𝑗, 𝑧𝑗) ≥ 𝑆𝐸𝑖 =348 (𝑥𝑖, 𝑦𝑖 , 𝑧𝑖). 349
The formulation equivalent is as follows: 350 V (SEj ≥ SEi) = height (SEi ∩ SEj) = zsj(d)= { 1, if yj ≥ yi0, if xi ≥ zjxi − zj(yj − zj) − (yi − xi) , otherwise
(𝟖) 351
Where 𝑑 shows the intersection between 𝑧𝑠𝑗 and 𝑧𝑠𝑖; A comparison between the values is required 352
of 𝑉 (𝑆𝐸𝑖 ≥ 𝑆𝐸𝑗) and 𝑉 (𝑆𝐸𝑗 ≥ 𝑆𝐸𝑖) with the values of 𝑆𝐸𝑖 and 𝑆𝐸𝑗 . 353
4. This step calculates minimum chances degree 𝑑(𝑖) of 𝑉 (𝑆𝐸𝑗 ≥ 𝑆𝐸𝑖): where 𝑖𝑗 = 1,2, … , 𝑘. 354
355
V(SE ≥ SE1, SE2, SE3, … , SEk),for i = 1,2,3, … , k= V[(SE ≥ SE1) and (SE ≥ SE2) and …(SE ≥ SEk)] = minV (SE ≥ SEi)for i = 1,2,3, … , k (𝟗) 356
Assume 357 d′(Bi) = min V(SEj ≥ SEi), for i = 1,2,3,… , k 358
We then define this latter vector as 359
W′ = (d′(B1), d′(B2),… , d′(Bn))T (𝟏𝟎) 360
where 𝐵1 (𝑖 = 1,2,3, … , 𝑛) represents 𝑛 elements: This last step norms the weight of the vectors 361
as follows: 362

W = (d(B1), d(B2),… , d(Bn))T (𝟏𝟏) 363
Here is a non-fuzzy number indicating W. 364
4.3. Traditional data analysis model 365
DEA is very (Tone and Tsutsui, 2009) famous MCDA approach used to measure the optimal 366
efficiency of DMus, which is used the multiple inputs and multiple outputs. This approach has 367
many applications from the 1978.For example, evaluation the performance of banks, education 368
departments, airlines, health departments. (LaPlante and Paradi, 2015) , Sustainability assessment 369
of networks supply chain (Tajbakhsh and Hassini, 2015), (Krmac and Djordjević, 2019), Techno-370
economic Solar Stills Assessment (Rufuss et al., 2018), assessment of energy efficiency 371
improvement. 372
Data envelopment analysis (DEA) is a practical MCDA approach used to measure the 373
decision-making unit (DMUs), which uses multiple inputs and outputs. Different researchers have 374
applied this approach to measure the efficiency of different departments. For instance, (Wang et 375
al., 2019), evaluated the performance of banks, (Peng Zhou et al., 2008), for education 376
departments, and (P. Zhou et al., 2008), for airlines, health departments. (Cook et al., 2019) used 377
this method for the sustainability assessment of the network supply chain. Simultaneously, 378
(Kahraman et al., 2003) applied it for techno-economic assessment of solar stills, and (IRENA, 379
2014) utilized it to assess energy efficiency, improvement in environmental performance analysis, 380
and benchmarking performance evaluation, respectively. Thus, fuzzy-AHP criteria weights are 381
considered the DEA model's output data, and development cost is considered the input data. 382
Charnes, Cooper, and Rhodes (CCR) planned DEA to assess the comparative efficiency or 383
competence of specific DMUs [31]. It has the following generalized form: A set of “N” decision-384
making units will be examined with 𝑚 outputs and 𝑙 inputs. Thus let (𝑘 = 1,2,3, … , 𝑛) represent 385

a DMU. In principle, the CCR model is categorized into two further models (i.e., CCR-I - input-386
oriented model and CCR-O - output-oriented model). CCR-I aims to minimize the input data for 387
a given output data. Conversely, CCR-O models maximize the outputs at a given level of inputs. 388
Since the objective of this study is to maximize the outputs, the following output oriented CCR 389
model is proposed. Figure 6 provide the working of CCR model. 390
391
Figure 6. Output oriented CCR model 392
Charnes, Cooper, and Rhodes (CCR) proposed DEA for the first time in 1978. CCR designed 393
DEA as a measure to compute relative productivity or efficiency of a particular DMUs (Charnes 394
et al., 1978). we analyze a set of ns DMUs, and each DMU uses 𝑙 inputs and 𝑚 outputs. The 395
formulation of DEA is as below: 396
Let (𝑘 = 1,2,3,… , 𝑛) represents a DMU, and the aim is to maximize the efficiency of that 397
DMU then 398
Max hk = ∑ vrkYrkmr=1∑ uikXikli=1 (𝟏𝟐) 399
s.t∑ vrkYrkmr=1∑ uikXikli=1 ≤ 1, forj = 1,… , n (𝟏𝟑) 400
Goal
Level 1
Alternatives
Relative efficiency of RES-based hydrogen production
Commercial potential
PV electrolysisBiomass
gasificationGeothermal electrolysis
Wind electrolysis
Environmental Impacts
Economic Benefits
Social Acceptance
Development Cost (Input)

𝑣𝑟𝑘 > 0, for 𝑟 = 1,… ,𝑚 (𝟏𝟒) 401 𝑢𝑖𝑘 > 0, for 𝑖 = 1,… , 𝑙 (𝟏𝟓) 402
Where , 𝑣𝑟𝑘represents the output weight, which is given to the rth 𝐷𝑀𝑈𝑘 , 𝑢𝑖𝑘 show the input 403
weight allocated to the ith 𝐷𝑀𝑈𝑘 , 𝑣𝑟𝑘 , and 𝑢𝑖𝑘 these variables use to evaluate the relative 404
efficiency of kth DMU, 𝑌𝑟𝑗 shows the rth output of the jth DMU, and 𝑋𝑖𝑗 represents the ith input 405
of the jth DMU. Here, 𝑌𝑟𝑗 and 𝑋𝑖𝑗 both variables are positive value. ℎ𝑘 donates the efficiency 406
score. Additionally, the value of ℎ𝑘 is less than or equal to one. If the value of ℎ𝑘 = 1, that is 407
proved the decision-making unit (DMU) is performing on an efficient frontier. 408
Basically, CCR model further two categories models such as CCR-I, it means input-oriented 409
model and CCR-O, it means output-oriented model. Input-oriented aims to minimize the inputs 410
data for a given outputs data. Conversely, the output-oriented models maximize the outputs at a 411
given level of inputs. The focus of this study is to maximize the outputs. Therefore, we used the 412
below-given output-oriented CCR model: 413
min 𝑝𝑥0 (𝟏𝟔) 414
s.t 𝑞𝑦0 = 1 (𝟏𝟕) 415 qY − pX ≤ 0 (𝟏𝟖) 416 p, q. (𝟏𝟗) 417
Here, 𝑥0 and 𝑦0 are respective inputs and outputs vectors of 𝐷𝑀𝑈0. 𝑋 and 𝑌 variables, in Eq. 18 418
refers to separate inputs and outputs matrices. Let (𝑢∗, 𝑣∗) be an optimal solution for 𝐿𝑃0. Then, 419
we can obtain the optimal solution from 420 p∗ = u θ∗⁄ , q∗ = v∗ θ∗⁄ (20) 421
It is clear that (p∗, q∗) is feasible for an optimal solution 𝐿𝑃0. Equation 21 computes the 422
optimal solution as follows: 423 p∗x0 = u∗x0 θ∗⁄ = η∗ (𝟐𝟏) 424

x̂0 = x0 − g−∗ (𝟐𝟐) 425 �̂�0 = 𝜂∗𝑦0 + 𝑔+∗ (𝟐𝟑) 426
Here, 𝑔−∗ and 𝑔+∗ are respective input and output slack variables of 𝐷𝑀𝑈0. 427
Now, 𝑔 +∗ and 𝑔 −∗ are output and input slack variables of 𝐷𝑀𝑈0. Thus, a first-order engineering 428
model is used to measure gasoline consumption for each province of Pakistan. The prior studies 429
found that by increasing the population density function, fuel consumption by transportation 430
decreases sub-linearly. Consequences of geographical classification (e.g., urban vs. rural) have 431
been scrutinized in-vehicle petrol consumption studies. Water electrolysis having an efficiency of 432
65 to 85%, use electricity from renewable energy generated from wind, and it has a more 433
significant potential between various technologies that generate hydrogen, 434
𝐴𝐻2 = 𝜂𝑒𝑙𝐸𝐿𝐻𝑉𝐻2 (24) 435
Where 𝐴𝐻2 indicates the produced hydrogen quantity. E shows the input of wind electricity to the 436
electrolyzer to produce hydrogen, ηel is the efficiency of the electrolysis process, and LHVH2 is 437
the value of lower hydrogen heating. This study quantified the demand for renewable hydrogen 438
generated by the wind for nationwide light-duty vehicles. The numbers of comparable units of 439
electrolyzer are essential. Over an electrolysis system, the renewable hydrogen quantity 𝐻𝑖𝑡 440
(kg/period) in the given period is measured as follows: 441 𝐻𝑖𝑡 = 𝑀𝑡𝑁𝐽𝑡𝑒𝑙𝐻𝐽𝑡𝑒𝑙∀𝐽∈ 𝐽𝑒𝑙 𝑡 = 1,… , 𝑛 (25) 442
Where the elements electrolyzed in the system is denoted by 𝑁𝐽𝑡𝑒𝑙 although Mt is the hours that 443
measure in the electrolyzed system. Resultantly, by using this method, oxygen is formed for 444
breathing and hydrogen for fuel. Both the electrodes are of metal (e.g., platinum) and are connected 445
to electricity in water [32]. We have considered [33]as a base case study for cost evaluation. As 446
we argued, annual wind-generated renewable hydrogen production is a function of marginal 447
hydrogen prices and the electrolyzer system’s energy efficiency. As the marginal price of the wind-448
generated renewable hydrogen increases, there will be an increase in hydrogen production until it 449
levels off. 450
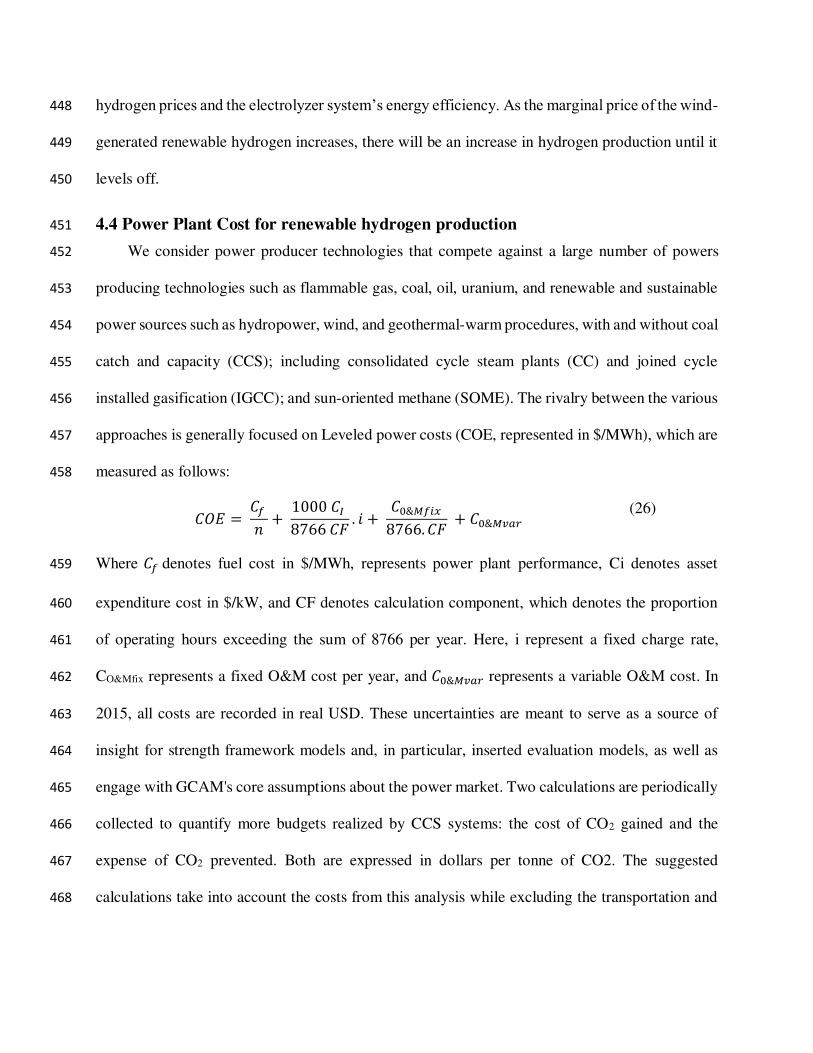
4.4 Power Plant Cost for renewable hydrogen production 451
We consider power producer technologies that compete against a large number of powers 452
producing technologies such as flammable gas, coal, oil, uranium, and renewable and sustainable 453
power sources such as hydropower, wind, and geothermal-warm procedures, with and without coal 454
catch and capacity (CCS); including consolidated cycle steam plants (CC) and joined cycle 455
installed gasification (IGCC); and sun-oriented methane (SOME). The rivalry between the various 456
approaches is generally focused on Leveled power costs (COE, represented in $/MWh), which are 457
measured as follows: 458
𝐶𝑂𝐸 = 𝐶𝑓 𝑛 + 1000 𝐶𝐼 8766 𝐶𝐹 . 𝑖 + 𝐶0&𝑀𝑓𝑖𝑥8766. 𝐶𝐹 + 𝐶0&𝑀𝑣𝑎𝑟 (26)
Where 𝐶𝑓 denotes fuel cost in $/MWh, represents power plant performance, Ci denotes asset 459
expenditure cost in $/kW, and CF denotes calculation component, which denotes the proportion 460
of operating hours exceeding the sum of 8766 per year. Here, i represent a fixed charge rate, 461
CO&Mfix represents a fixed O&M cost per year, and 𝐶0&𝑀𝑣𝑎𝑟 represents a variable O&M cost. In 462
2015, all costs are recorded in real USD. These uncertainties are meant to serve as a source of 463
insight for strength framework models and, in particular, inserted evaluation models, as well as 464
engage with GCAM's core assumptions about the power market. Two calculations are periodically 465
collected to quantify more budgets realized by CCS systems: the cost of CO2 gained and the 466
expense of CO2 prevented. Both are expressed in dollars per tonne of CO2. The suggested 467
calculations take into account the costs from this analysis while excluding the transportation and 468

power costs from GCAM. The cost of CO2 capture is estimated by dividing the maintenance cost 469
of generating energy by the volume of CO2 generated by a CCS-ready office ($/kWh). 470 costcapt=COE(CCS) − COE(noCCS) CO2−capt (27)
Where COECCS denotes the power expense of a CCS-prepared plant in dollars per kilowatt-hour. 471
COECCS relates to the cost of electricity delivered by a plant without CCS invention, with CO2 472
per capita as the limit. In order to generate energy, it is important to develop a strategy of strategic 473
petroleum reserves. In reality, renewables are one of the most important replacements for liquefied 474
petroleum output in the first and second biofuel cohorts. Oil supply curves regulate how quickly 475
they are disseminated. The market share of biofuels increases as oil prices rise at each point, 476
capturing the rivalry between oil-based liquid fuels and biofuels in a clear way. 477
The operational cost per unit of energy generated by a wind energy conversion device is often 478
assessed using a variety of methods. The ratio of cumulative net present value of total costs (PVC) 479
to total energy (E tot) produced by the device is used to calculate the per unit cost (C W) of wind 480
energy in this analysis. 481 CW = 𝑃𝑉𝐶𝐸𝑡𝑜𝑡 (28) 482
The electrolyzer capital cost is determined by the necessary rate of hydrogen supply. The efficient 483
electrolyzer performance and the average real capital cost per kWh at nominal output are calculated 484
as. 485 𝐶𝑒𝑙𝑒,𝑢 = 𝑀𝐻2𝐾𝑒𝑙,𝑡ℎ8760.𝑓𝜂𝑢 (29) 486
𝐶𝑒𝑙𝑒,𝑢 = 𝑀𝐻2𝐾𝑒𝑙,𝑡ℎ8760.𝑓𝜂𝑢 (30) 487
where (𝐶𝑒𝑙𝑒,𝑢) is the electrolyzer unit rate, f is the power factor, and 𝐾𝑒𝑙,𝑡ℎ is the electrolyser's energy 488
requirement. The comparison case assumes that the electrolyzer unit cost is $368/kWh, which is 489

the goal amount. We believe that annual maintenance costs and repair costs are equal to 2% and 490
25% of the initial cell expenditure, respectively, and that the electrolyzer has a seven-year 491
operating period. 492
5. Analysis and results 493
5.1 Priority Weights of Criteria 494
The initial step in finding relative involves is the construction of the pairwise comparison 495
matrix. The construction of the pairwise comparison matrix helps to find a relative relationship 496
[34]. Therefore, the criteria' priority weights have been performed, and its pairwise comparison 497
matrix is shown in table 10. 498
Table 10. The results of the fuzzy evaluation criteria. 499
Commercial
potential
Environmental
impacts
Economic benefits Social acceptance
Commercial
potential
1, 1, 1 1.09, 1.57, 2.13 0.46, 0.65, 0.95 0.58, 0.81, 1.2
Environmental
impacts
0.47, 0.64, 0.92 1, 1, 1 0.88, 1.27, 1.76 0.83, 1.23, 1.72
Economic benefits 1.05, 1.53, 2.18 0.57, 0.79, 1.13 1, 1, 1 1.22, 1.77, 2.34
Social acceptance 0.83, 1.23, 1.72 0.58, 0.81 ,1.2 0.43, 0.56, 0.82 1, 1, 1
CR = 0.06
The obtained results of priority weights of criteria can be used to estimate the TFN against the 500
values of each criterion as follow: 501
We used these obtained results to calculate the TFN values of each criterion as follows: 502 𝑆𝐸1(𝐂𝐨𝐦𝐦𝐞𝐫𝐜𝐢𝐚𝐥 𝐩𝐨𝐭𝐞𝐧𝐭𝐢𝐚𝐥) = (3.13, 4.03, 5.28) ⊗ (1/22.07, 1/16.86,1/12.99) 503

= (3.13 ∗ 1/22.07, 4.03 ∗ 1/16.86, 5.28 ∗ 1/12.99) 504 = (0.142, 0.239, 0.406) 505 𝑆𝐸2(𝐄𝐧𝐯𝐢𝐫𝐨𝐧𝐦𝐞𝐧𝐭𝐚𝐥 𝐢𝐦𝐩𝐚𝐜𝐭𝐬) = (3.18, 4.14, 5.4) ⊗ (1/22.07, 1/16.86, 1/12.99) 506 = (3.18 ∗ 1/22.07, 4.14 ∗ 1/16.86, 5.4 ∗ 1/12.99) 507 = (0.144, 0.246, 0.416) 508 𝑆𝐸3(𝐄𝐜𝐨𝐧𝐨𝐦𝐢𝐜 𝐛𝐞𝐧𝐞𝐟𝐢𝐭𝐬) = (3.84, 5.09, 6.65) ⊗ (1/22.07,1/16.86,1/12.99) 509 = (3.84 ∗ 1/22.07, 5.09 ∗ 1/16.86, 6.65 ∗ 1/12.99) 510 = (0.174, 0.302, 0.512) 511 𝑆𝐸4(𝐒𝐨𝐜𝐢𝐚𝐥 𝐚𝐜𝐜𝐞𝐩𝐭𝐚𝐧𝐜𝐞) = (2.84, 3.6, 4.74) ⊗ (1/22.07, 1/16.86,1/12.99) 512 = (2.84 ∗ 1/22.07, 3.6 ∗ 1/16.86, 4.74 ∗ 1/12.99) 513 = (0.129, 0.214, 0.365) 514
After calculated the values of 𝑆𝐸𝑖 , we compared them and computed possibility degree of 𝑆𝐸𝑗 =515 (𝑥𝑗, 𝑦𝑗 , 𝑧𝑗) ≥ 𝑆𝐸𝑖 = (𝑥𝑖, 𝑦𝑖 , 𝑧𝑖) by solving Eq. 8. Table 11 presents the values of 𝑉(𝑆𝐸𝑗 ≥ 𝑆𝐸𝑖). We 516
have now obtained the TFNs of four main indicators. After obtaining the 𝑆𝐸𝑖 values, the possible 517
degree of 𝑆𝐸𝑗 = (𝑥 , 𝑦𝑗 , 𝑧𝑗) ≥ 𝑆𝐸𝑖 = (𝑥𝑖 , 𝑦𝑖 , 𝑧𝑖) is computed and compared by explaining equation 518
8. As mentioned earlier, the respective indicator results based on the process are presented in table 519
11. 520
Table 11. Values of 𝑉(𝑆𝐸𝑗 ≥ 𝑆𝐸𝑖) 521 𝑽(𝑺𝑬𝟏 ≥ 𝑺𝑬𝒊) Value 𝑽(𝑺𝑬𝟐 ≥ 𝑺𝑬𝒊) Values 𝑉(𝑆𝐸1 ≥ 𝑆𝐸2) 0.97 𝑉(𝑆𝐸2 ≥ 𝑆𝐸1) 1.00
𝑉(𝑆𝐸1 ≥ 𝑆𝐸3) 0.79 𝑉(𝑆𝐸2 ≥ 𝑆𝐸3) 0.81
𝑉(𝑆𝐸1 ≥ 𝑆𝐸4) 1.00 𝑉(𝑆𝐸2 ≥ 𝑆𝐸4) 1.00
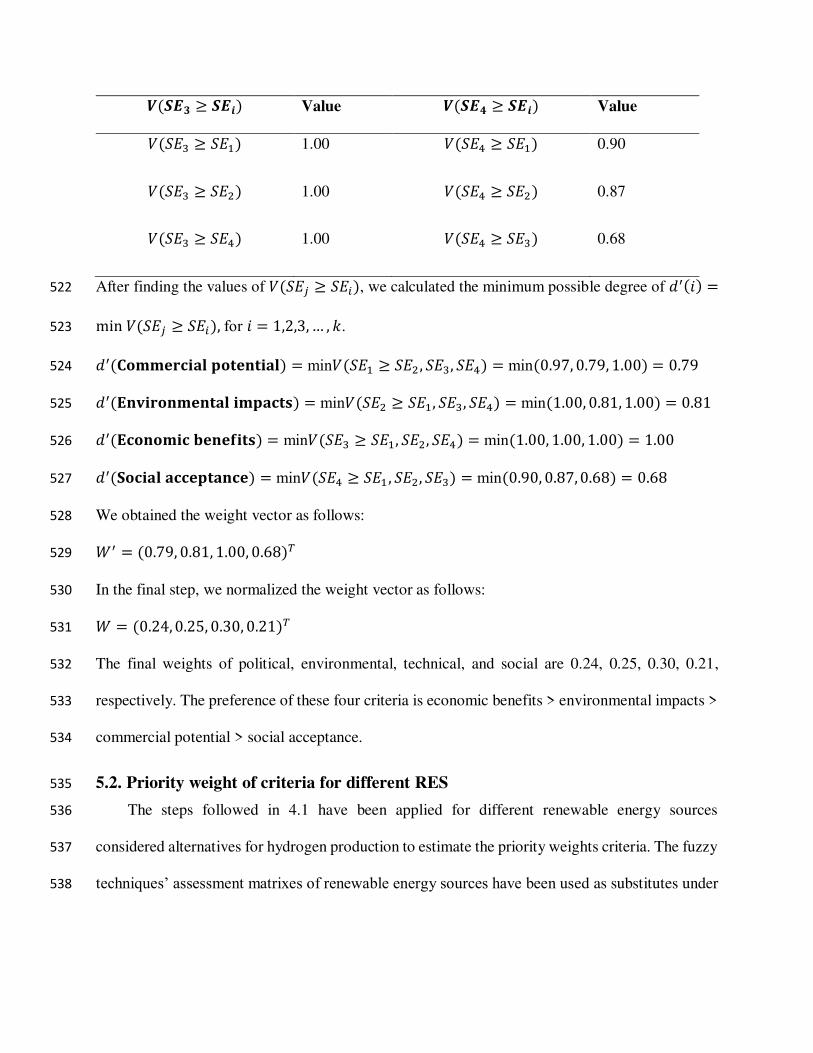
𝑽(𝑺𝑬𝟑 ≥ 𝑺𝑬𝒊) Value 𝑽(𝑺𝑬𝟒 ≥ 𝑺𝑬𝒊) Value 𝑉(𝑆𝐸3 ≥ 𝑆𝐸1) 1.00 𝑉(𝑆𝐸4 ≥ 𝑆𝐸1) 0.90
𝑉(𝑆𝐸3 ≥ 𝑆𝐸2) 1.00 𝑉(𝑆𝐸4 ≥ 𝑆𝐸2) 0.87
𝑉(𝑆𝐸3 ≥ 𝑆𝐸4) 1.00 𝑉(𝑆𝐸4 ≥ 𝑆𝐸3) 0.68
After finding the values of 𝑉(𝑆𝐸𝑗 ≥ 𝑆𝐸𝑖), we calculated the minimum possible degree of 𝑑′(𝑖) =522 min 𝑉(𝑆𝐸𝑗 ≥ 𝑆𝐸𝑖), for 𝑖 = 1,2,3,… , 𝑘. 523 𝑑′(𝐂𝐨𝐦𝐦𝐞𝐫𝐜𝐢𝐚𝐥 𝐩𝐨𝐭𝐞𝐧𝐭𝐢𝐚𝐥) = min𝑉(𝑆𝐸1 ≥ 𝑆𝐸2 , 𝑆𝐸3, 𝑆𝐸4) = min(0.97, 0.79, 1.00) = 0.79 524 𝑑′(𝐄𝐧𝐯𝐢𝐫𝐨𝐧𝐦𝐞𝐧𝐭𝐚𝐥 𝐢𝐦𝐩𝐚𝐜𝐭𝐬) = min𝑉(𝑆𝐸2 ≥ 𝑆𝐸1, 𝑆𝐸3, 𝑆𝐸4) = min(1.00, 0.81, 1.00) = 0.81 525 𝑑′(𝐄𝐜𝐨𝐧𝐨𝐦𝐢𝐜 𝐛𝐞𝐧𝐞𝐟𝐢𝐭𝐬) = min𝑉(𝑆𝐸3 ≥ 𝑆𝐸1, 𝑆𝐸2, 𝑆𝐸4) = min(1.00, 1.00, 1.00) = 1.00 526 𝑑′(𝐒𝐨𝐜𝐢𝐚𝐥 𝐚𝐜𝐜𝐞𝐩𝐭𝐚𝐧𝐜𝐞) = min𝑉(𝑆𝐸4 ≥ 𝑆𝐸1 , 𝑆𝐸2, 𝑆𝐸3) = min(0.90, 0.87,0.68) = 0.68 527
We obtained the weight vector as follows: 528 𝑊′ = (0.79, 0.81, 1.00, 0.68)𝑇 529
In the final step, we normalized the weight vector as follows: 530 𝑊 = (0.24,0.25, 0.30, 0.21)𝑇 531
The final weights of political, environmental, technical, and social are 0.24, 0.25, 0.30, 0.21, 532
respectively. The preference of these four criteria is economic benefits > environmental impacts > 533
commercial potential > social acceptance. 534
5.2. Priority weight of criteria for different RES 535
The steps followed in 4.1 have been applied for different renewable energy sources 536
considered alternatives for hydrogen production to estimate the priority weights criteria. The fuzzy 537
techniques’ assessment matrixes of renewable energy sources have been used as substitutes under 538

specific criteria Table 12 presents the results of the fuzzy evaluation matrix and shows the priority 539
weights of RES alternatives under each criterion. 540
Table 12. Fuzzy assessment of renewable energy sources alternatives within commercial Criteria 541
Wind Solar Biomass Geothermal
Wind 1, 1, 1 0.77, 1.09, 1.5 0.9, 1.32, 1.8 1.01, 1.37, 1.8
Solar 0.66, 0.92, 1.3 1, 1, 1 0.88, 1.27, 1.76 1, 1.46, 1.96
Biomass 0.56, 0.76, 1.12 0.57, 0.79, 1.13 1, 1, 1 1.22, 1.77, 2.34
Geothermal 0.56, 0.73, 0.99 0.51, 0.68, 1 0.43, 0.56, 0.82 1, 1, 1
CR = 0.01
This study compares four main criteria (commercial potential, environmental impact, 542
economic benefit, and social acceptance) under the different criteria condition to see the second 543
level's decision procedure. The outcomes of this procedure have been depicted in Table 13, 14,15 544
and 16. 545
Table 13. Fuzzy assessment of RES alternatives inside environmental impacts criteria 546
Wind Solar Biomass Geothermal
Wind 1, 1, 1 0.94, 1.33, 1.82 0.65, 0.94, 1.35 0.81, 1.09, 1.43
Solar 0.55, 0.75, 1.06 1, 1, 1 0.76, 1.1, 1.57 0.86, 1.26, 1.75
Biomass 0.74, 1.06, 1.54 0.64, 0.91, 1.32 1, 1, 1 0.6, 0.81, 1.16
Geothermal 0.7, 0.92, 1.24 0.57, 0.79, 1.16 0.86, 1.23, 1.66 1, 1, 1
CR = 0.01
Table 14. Fuzzy assessment of renewable energy sources alternatives within economic benefits criteria 547
Wind Solar Biomass Geothermal
Wind 1, 1, 1 0.77, 1.15, 1.72 0.59, 0.89, 1.35 0.9, 1.38, 1.98

Solar 0.58, 0.87, 1.3 1, 1, 1 0.68, 1, 1.48 1, 1.64, 2.46
Biomass 0.74, 1.12, 1.69 0.68, 1, 1.48 1, 1, 1 1.1, 1.64, 2.34
Geothermal 0.51, 0.72, 1.11 0.41, 0.61, 1 0.43, 0.61, 0.91 1, 1, 1
CR = 0.00
Table 15. Fuzzy assessment of renewable energy sources alternatives within social acceptance criteria 548
Wind Solar Biomass Geothermal
Wind 1, 1, 1 0.61, 0.91, 1.37 0.49, 0.72, 1.1 0.9, 1.23, 1.65
Solar 0.73, 1.1, 1.63 1, 1, 1 0.68, 1.06, 1.62 1.1, 1.74, 2.46
Biomass 0.91, 1.38, 2.05 0.62, 0.94, 1.48 1, 1, 1 1.2, 1.84, 2.56
Geothermal 0.61, 0.81, 1.11 0.41, 0.57, 0.91 0.39, 0.54, 0.83 1, 1, 1
CR = 0.00
Table 16. Priority weight of criteria for various renewable energy sources RES 549
RES Commercial potential Environmental impacts Economic benefits Social acceptance
Wind 0.29 0.27 0.27 0.24
Solar 0.29 0.26 0.27 0.30
Biomass 0.26 0.23 0.28 0.31
Geothermal 0.16 0.24 0.17 0.16
550
5.3. Alternatives criteria final weights for Renewable energy sources 551
Here, we multiplied the priority weights of criteria by priority weight of criteria for various 552
Renewable energy sources to obtain the final weights of each renewable energy sources. 553
Table 17. Provides the criteria weights of RES 554

RES Commercial potential Environmental impacts Economic benefits Social acceptance
Wind 0.29(0.24) equal to (0.070) 0.27(0.25) equal to 0.068 0.27(0.30) equal to 0.081 0.24(0.21) equal to 0.050
Solar 0.29(0.24) equal to (0.070) 0.26(0.25) equal to 0.065 0.27(0.30) equal to 0.081 0.30(0.21) equal to 0.063
Biomass 0.26(0.24) equal to (0.062) 0.23(0.25) equal to 0.058 0.28(0.30) equal to 0.084 0.31(0.21) equal to 0.065
Geothermal 0.16(0.24) equal to (0.038) 0.24(0.25) equal to 0.060 0.17(0.30) equal to 0.051 0.16(0.21) equal to 0.034
Table 17 explains the four leading indicators (commercial potential, economic impacts, 555
economic benefits, and social acceptance) score of renewable energy sources (Wind, Solar, 556
Biomass, and Geothermal) based on the criteria' priority weight. Here, the value of commercial 557
potential for wind and solar energy is 0.29, biomass 0.26, and geothermal 0.16. Thus, wind and 558
solar sources are equally crucial for the commercial potential of hydrogen energy in Pakistan. 559
Wind energy scores highest (0.27), followed by solar energy (0.26) from the environmental 560
perspective. Geothermal energy source scores 0.24, while biomass holds the last position in this 561
lineup for environmental impact with a 0.23 score. The economic benefit of renewable energy 562
sources by utilizing hydrogen energy led by biomass (0.28), followed by solar and wind energy 563
for a 0.27 score. Here, geothermal secures the last position for economic benefit with just a 0.17 564
score. Biomass is the leading source of conversion into hydrogen energy for social acceptance 565
after securing 0.31 points, followed by solar (0.30) energy sources. The wind and geothermal 566
energy sources are relatively less important for social acceptance as both attained 0.24 and a 0.16 567
score. Here, the overall wind energy source of renewable energy is relatively more suitable for Pakistan's 568
hydrogen energy production, followed by solar and biomass considering the four main aspects. 569
5.4. Renewable Energy Sources Ranking 570
In second stage, we assess the relative efficiency scores with help of DEA of renewable energy sources 571
for hydrogen generation, after efficiency scores to rank available renewable energy sources. The final 572
weights obtained by multiplying each renewable energy source (RES) with criteria priority weights are 573

presented in table 18. According to the DEA results presented in table 18, the wind is ranked as one to be 574
converted into hydrogen energy as it has a score of one efficiency level. Biomass is the second efficient 575
energy source for hydrogen energy with 0.975 DEA efficiency, while solar is the third efficient (0.756) 576
source for hydrogen energy conversion. The geothermal energy source is the least efficient for hydrogen 577
production as it has a 0.662 efficiency score and is ranked four. According to DEA results, the wind is a 578
highly efficient renewable energy source to be converted into hydrogen energy due to its efficient cost and 579
benefit outcomes. Here, biomass is the second-best available option for this purpose. 580
Table 18. Presents ranking and relative efficiency scores of various renewable energy sources. 581
RES Inputs Output Efficiency score Final Ranking
RE generation cost
($/kWh)
CP EI EB SA
Wind 0.06 0.070 0.068 0.081 0.050 1.000 1
Solar 0.10 0.070 0.065 0.081 0.063 0.756 3
Biomass 0.08 0.062 0.058 0.084 0.065 0.975 2
Geothermal 0.08 0.038 0.060 0.051 0.034 0.662 4
5.4 Techno-economic analysis of wind-generated renewable hydrogen production 582
There is no zero-emission vehicle in Pakistan when it has increased hydrogen demand for a vehicle of 583
zero-emission. In contrast, all the provinces in Pakistan aggregate the rural and urban intensities of gasoline 584
consumption. Table 19 shows a total demand of 14.6 billion kg of gasoline for all the provinces. 585
Alternatively, the H2-demand (in billion kg) 4.88 billion kg renewable hydrogen is needed to the fleet the 586
equivalent amount of vehicles fleet by 14.6 billion kg of gasoline in the country. Similarly, 6.63 billion kg 587
is needed for LDV H2 Demand (kg/Annually). The price of renewable hydrogen fluctuates between 588
USD0/kg to USD5/kg, having a growth of USD0.1/kg. There is an increase in hydrogen prices when there 589
is an increase in renewable hydrogen production when the minimum price of hydrogen goes above the 590
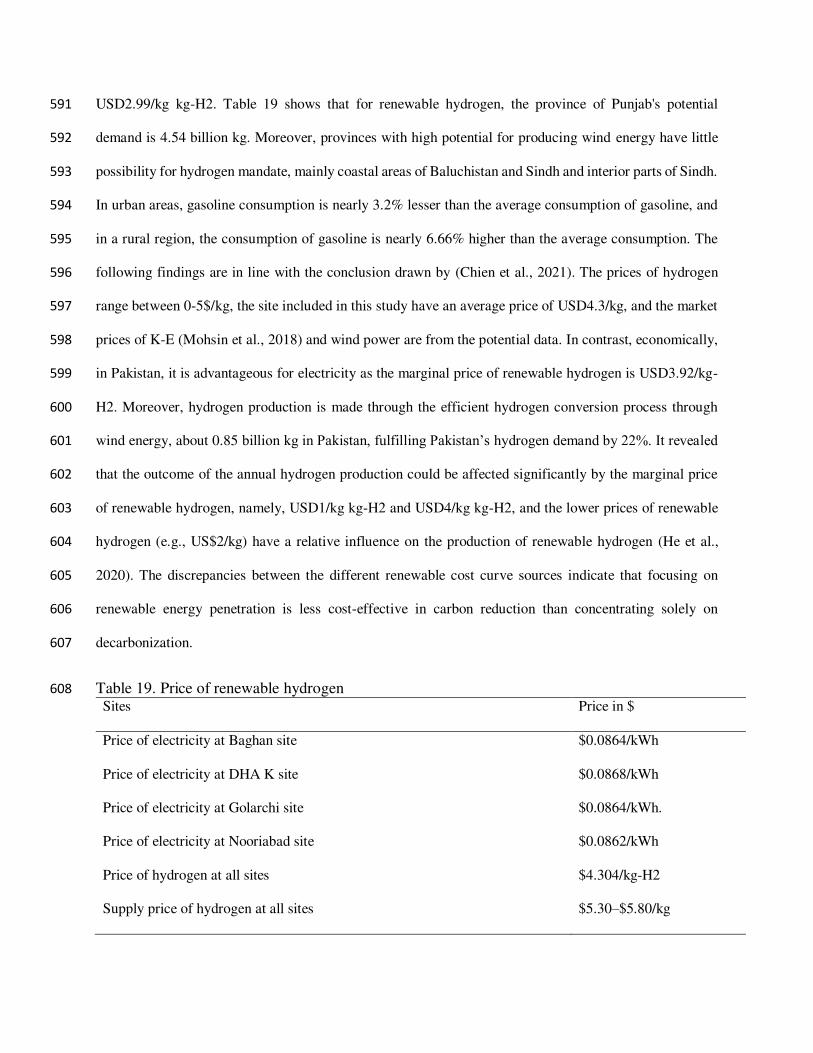
USD2.99/kg kg-H2. Table 19 shows that for renewable hydrogen, the province of Punjab's potential 591
demand is 4.54 billion kg. Moreover, provinces with high potential for producing wind energy have little 592
possibility for hydrogen mandate, mainly coastal areas of Baluchistan and Sindh and interior parts of Sindh. 593
In urban areas, gasoline consumption is nearly 3.2% lesser than the average consumption of gasoline, and 594
in a rural region, the consumption of gasoline is nearly 6.66% higher than the average consumption. The 595
following findings are in line with the conclusion drawn by (Chien et al., 2021). The prices of hydrogen 596
range between 0-5$/kg, the site included in this study have an average price of USD4.3/kg, and the market 597
prices of K-E (Mohsin et al., 2018) and wind power are from the potential data. In contrast, economically, 598
in Pakistan, it is advantageous for electricity as the marginal price of renewable hydrogen is USD3.92/kg-599
H2. Moreover, hydrogen production is made through the efficient hydrogen conversion process through 600
wind energy, about 0.85 billion kg in Pakistan, fulfilling Pakistan’s hydrogen demand by 22%. It revealed 601
that the outcome of the annual hydrogen production could be affected significantly by the marginal price 602
of renewable hydrogen, namely, USD1/kg kg-H2 and USD4/kg kg-H2, and the lower prices of renewable 603
hydrogen (e.g., US$2/kg) have a relative influence on the production of renewable hydrogen (He et al., 604
2020). The discrepancies between the different renewable cost curve sources indicate that focusing on 605
renewable energy penetration is less cost-effective in carbon reduction than concentrating solely on 606
decarbonization. 607
Table 19. Price of renewable hydrogen 608
Sites Price in $
Price of electricity at Baghan site $0.0864/kWh
Price of electricity at DHA K site $0.0868/kWh
Price of electricity at Golarchi site $0.0864/kWh.
Price of electricity at Nooriabad site $0.0862/kWh
Price of hydrogen at all sites $4.304/kg-H2
Supply price of hydrogen at all sites $5.30–$5.80/kg

Other sites: DHA Karachi, Baghan and Golarchi.
In Pakistan, fuel rates vary from $3.27 to $4.80 per gallon (the maximum fuel prices are in 609
Norway, at $7.08 per gallon), and the world's average gasoline price is $6.44 per gallon 610
(www.globalpetrolprices.com) Though hydrogen supply costs range from $5.30/kg to $5.80/kg. 611
Thanks to rising procurement costs, the average cost of green hydrogen has risen. Hydrogen can 612
cost between $4 and $5 per kilogram in order to be a competitive fuel for electric cars. About the 613
fact that owing to extreme electricity shortages and the most fragile atmosphere in the world, 614
hydrogen use in Pakistan is possible at a higher cost ($5.30/kg to $5.80/kg). 615
According to table 19, when there is an increase in carbon reduction levels, the gap between 616
the cost curves widens. In carbon mitigation, concentrating exclusively on renewable energy goals 617
is more than 20% less cost-effective than focusing on high-ambition emissions reduction goals. 618
For a different energy system costing equal to 1% of GDP, emissions under CO2 targets are 619
decreased by 72%, but only by 45% when concentrating on renewable energy goals. Similarly, by 620
relying on Hydrogen P MR HydrogenMC Qpc Qm Pcont Qc MRcontro sustainable targets, the 621
energy system costs 80% carbon mitigation scenario lowers pollution by 55%. The environmental 622
analysis shows that a CO2 emission of 645g is considered per kWh of electricity from the grid. In 623
the national grid scenario, 3218 kg/year of CO2 emissions would raise the cost per kWh of energy 624
and kg of hydrogen by considering the pollution penalty payments. In this scenario, there is no 625
excess energy because the grid is accessible when needed. In the national grid/wind turbine 626
situation, the highest excess electricity is generated by a wind turbine, which accounts for 35.2% 627
of the total excess electricity produced and prevents 883 kg of CO2 emissions annually [38]. The 628
renewable hydrogen and electrification pathways have comparable energy cost system. In 2050, 629
both paths' overall cost will be around 29% higher than the national energy cost system's situation, 630
and the gap between these paths is less than 1%. However, in these cases, the cost structure is 631

substantially different. The pathway's dependence on crude oil is heavily dependent on the import 632
of crude oil. Pakistan’s import dependency remained around 70%–72% until 2016. It fell to 70% 633
in 2016 and 69% in 2017 due to the new gas field and wind energy increases. The system efficiency 634
analysis at rated stack current showed that the electrolyzer system had 57% efficiency while the 635
maximum alkaline system efficiency reached 41%. It noted that the hydrogen production was 636
about 20% lower than the manufacturer’s rated flow rate, and if the rated flow were achieved, 50% 637
system efficiency would be realized. Moreover, Pakistan is an oil-importing country and has a 638
total oil import of 25% compared to total imports. If Pakistan’s energy imports become one-fourth 639
($7.13 billion) of the total imports ($27.34billion), it will save $5 billion per annum. This selection 640
is justified by the comparative research results on alternative green hydrogen generation 641
technologies focusing on their impacts on costs and the environment. In terms of greenhouse gas 642
emissions, the differences become more noticeable. Only hydrogen production using solar energy 643
offers similar GHG reduction potential to the water electrolysis, while the biomass-based methods 644
generate significant emission levels. The paper covers the most actual initiatives addressing the 645
combination of renewable hydrogen production with the possibility of hydrogen implementations 646
for energy storage, transportation, and stationary applications such as combined heat and power 647
(CHP) plants or fuel cell electric generators. 648
5.5 Discussion 649
This study is based on four criteria (commercial potential, economic impacts, economic 650
benefits, and social acceptance) to identify optimal renewable energy sources (RES) for hydrogen 651
production in developing economies such as Pakistan. The Fuzzy-AHP MCDA and DEA 652
techniques used to measure the criteria weight and efficiency give renewable energy sources for 653
hydrogen energy production. Empirical results based on fuzzy-AHP suggest that for economic 654
benefit and commercial potential criterion, wind and solar are leading (equal) sources of renewable 655

energy. At the same time, biomass is the third option in this regard. However, geothermal is not 656
suitable for both the economic and commercial purposes of hydrogen energy production in 657
Pakistan. The wind is the leading source for the environmental impacts to be converted into 658
hydrogen energy, followed by a solar energy source. Here, biomass is the third suitable source, 659
while geothermal is the least renewable energy source again. According to social acceptance, 660
biomass is the leading source to be converted into hydrogen energy, while solar is the second-best 661
option in this lineup. Here, the wind is the third suitable renewable energy source for hydrogen 662
energy production, while geothermal is the last choice also here as well. These outcomes have also 663
been found in recent studies [40], [41] The DEA model results showed that wind energy had the 664
highest efficiency score of 1,000, the best optimum rank 1 for another RES like [42]. Therefore, 665
Pakistan's wind sources are the predictable best renewable energy for Pakistan's green hydrogen 666
energy production. 667
Next, biomass has the second-highest score of 0.975, while solar energy ranked third with a 668
score of 0.756, which is consistent with (Mokhtari and Hasani, 2017). The efficiency score of 669
geothermal energy in Pakistan was 0.662, indicating that it has the minimum efficiency as RES 670
for hydrogen production. 5 Conclusion and policy implication Based on F-AHP, MCDA, and DEA 671
method techniques, this study evaluates the possible sources for producing hydrogen energy in a 672
developing country like Pakistan. Renewable hydrogen energy is a sustainable and secure future 673
energy supply in the era of globalization, and various countries have hydrogen energy 674
technological objectives on their horizon. According to F-AHP, MCDA results, Pakistan has 675
enormous potential for renewable energy sources to generate green hydrogen, which can be 676
necessary for current energy and future energy security. For this purpose, Wind energy sources 677
consider the best choice for hydrogen energy production in Pakistan. Solar and biomass are the 678
second and third available energy sources based on the preference criteria mentioned above. 679
However, geothermal can be considered the least choice for this purpose. These results are verified 680
with the DEA method, where wind energy has been considered the leading source for hydrogen 681
energy production in Pakistan. Again, biomass is the second option for DAE outcomes, while solar 682
is the third position in this lineup. The overall gasoline demand is 14.6billion kilograms in 683
Pakistan, equal to 4.88 billion kg of renewable hydrogen. Similarly, 6.64 billion kg is needed for 684
LDV H2 Demand (kg/Annually). The marginal prices of renewable hydrogen fluctuate from 685
US$0/kg to US$5/kg, with growth of US$0.1 per kg. Thus, there is a need to fix the most efficient 686
RES like the wind for a successful hydrogen energy intervention in Pakistan. Biomass may use 687
hydrogen as the second-best option in this regard. This study's outcome may help select the best 688
options for the future hydrogen economy for available renewable energy sources. This study is 689
based on Pakistan's empirical data, and the experts provided their advice in the local language. 690
Again, the economic situation, resource capacity, and socio-political conditions vary significantly 691
between countries. However, this can be extended to similar studies of other regions or countries. 692
This work may also help conduct specific technological-based techno-economic assessment or 693
find out the best available alternative ways to develop RES base hydrogen energy. 694
An efficiency score of 1.000 indicates that the origins of renewable energy source at the 695
efficient frontier. In other terms, the concept of cost-benefit analysis is optimal efficiency score of 696
1.000 or above. For example, optimal efficiency score of wind renewable energy is 1.000, therefore 697
no need to increase the input data and output data in system. While, biomass efficiency score in 698
our paper is 0.975 that need to increases and decreases the inputs and outputs until achieved an 699
efficiency score of 100.The efficiency scores acquired provided the basis for the overall ranking 700

of RES for hydrogen production. Based on current findings that the wind energy is feasible 701
renewable energy source for future hydrogen production in Pakistan. 702
6. Conclusion and Policy Implications 703
This study based on 4 criteria (1. market opportunity, 2. economic benefits, 3. environmental 704
impacts, and 4. Social acceptance) choosing the optimum renewable energy sources RES for 705
hydrogen production in Pakistan. In Start, used the Fuzzy-AHP MCDA approach to measure the 706
weight of all criteria. Based on fuzzy-AHP approach results, we found financial benefit criterion 707
obtain weight of 0.30 highest value. The financial benefit criterion got the maximum weight of 708
0.30. Whereas social acceptance criteria received the lowest weight of 0.21. The environmental 709
impacts get weights of criteria 0.25, and the commercial potential obtain 0.24 weights. In fact, the 710
wind energy and solar energy get criterion equals weights 0.070, under commercial potential 711
criterion. 712
While the Biomass energy was given the 2nd highest criteria weight of 0.062, and geothermal 713
energy get lowest weighted, which was 0.038. The final results identified that the wind energy has 714
been as optimal and best renewable energy source for green hydrogen production, according to 715
environmental impacts point views. 716
While, solar energy source was identified to have very low effects on the environment. The 717
Wind energy and solar energy resources get weights of 0.068 and 0.065 respectively. Geothermal 718
energy obtained 0.060, while Biomass with a weight of 0.058 was the least environmentally 719
friendly energy source. Conversely, it was observed that biomass energy has more economic 720
benefits than other RES. Biomass gained weight of 0,084 under the criteria of economic benefit. 721
Solar and wind power each received the same weight of 0.081. Geothermal earned a 0.051 722
minimum weight. Biomass social acceptance is significantly higher than wind and geothermal but 723
is slightly higher than solar energy. Biomass received 0.065 weight, while under social acceptance, 724
solar energy produced 0.063 weight. Wind with a weight of 0.050 took third place, while 725
geothermal came last, reaching a weight of 0.034. 726
Study second phase, we used the data envelopment analysis to measurement the relative 727
efficiency of available each renewable energy analysis after that ranked them based on their 728
calculated scores. In DEA model results showed that the Wind energy obtained highest efficiency 729
score of 1.000, thus, that is achieved best optimal Rank 1 from another RES. It means wind is best 730
renewable energy for Green hydrogen energy production in Pakistan. In next Biomass get the 731
highest score of 0.975 and then Rank 2 in the ranking, as well as solar energy 3 in ranking, which 732
is score 0. 756. Geothermal energy attained a 0.662 efficiency score, which implies that geothermal 733
is the minimum efficient renewable energy source for hydrogen production in Pakistan. 734
5.1 Policy implication 735
Renewable hydrogen energy is a sustainable and secure future energy supply, in 736
globalization. Various countries have hydrogen technology path goals to focus on. Pakistan can 737
also exploit its plentiful renewable sources of energy to generate green hydrogen. Hydrogen 738
technology will play an important role in Pakistan's current energy crisis and future energy 739
security. The development of hydrogen from the most efficient renewable energy source is 740
essential if the hydrogen economy is to be a success for Pakistan, with the wind being the most 741
efficient source of renewable energy. Biomass may also be used for the disposal of hydrogen. 742
However, geothermal energy has not yet evolved to be an appropriate alternative for the generation 743
of hydrogen. 744
The outcome of this study may be helpful in selecting the best choices for politicians to choose 745
for a future hydrogen economy. Nevertheless, this study's results apply only to Pakistan. It is 746
because the experts provided their advice in Pakistani language. Again, the economic situation, 747

resource capacity, and socio-political conditions vary greatly among countries. Nevertheless, the 748
two-stage MCDM framework developed in this study that extend for such kinds of studies in other 749
countries or regions. This work can also be used to conduct a techno-economic assessment of 750
specific technologies or to identify the best alternative solutions centered on RES for the 751
development of hydrogen. 752
Ethical Approval and Consent to Participate: The authors declare that they have no known 753
competing financial interests or personal relationships that seem to affect the work reported in this 754
article. We declare that we have no human participants, human data or human tissues. 755
Consent for Publication: 756
N/A 757
Weiqing Li 1, Abdul Razzaq Khan 2, Shahid Bashir 3, Wasim Iqbal 4, Maryam Khokhar 5 758
759
Author Contribution: Conceptualization, Data curation, Methodology, Writing - original draft. 760
Weiqing Li: Data curation, Visualization, supervision Abdul Razzaq Khan: Visualization, editing. 761
Shahid Bashir: review & editing. Wasim Iqbal: Writing - review & editing, and software: Maryam 762
Khokhar. 763
Funding: This research did not receive any specific grant from funding agencies in the public, 764
commercial, or not-for-profit sectors. 765
Competing interest statement: The authors declare no conflict of interest. 766
Availability of data and materials: The data can be available on request 767
References 768
AEDB, 2007. Alternative Energy Development Board Yearbook [WWW Document]. 769
Akhtar, S., Hashmi, M.K., Ahmad, I., Raza, R., 2018. Advances and significance of solar 770
reflectors in solar energy technology in Pakistan. Energy Environ. 771

https://doi.org/10.1177/0958305X18758487 772
Akombi, B., Agho, K., Hall, J., Wali, N., Renzaho, A., Merom, D., 2017. Stunting, Wasting and 773
Underweight in Sub-Saharan Africa: A Systematic Review. Int. J. Environ. Res. Public 774
Health 14, 863. https://doi.org/10.3390/ijerph14080863 775
Avikal, S., Kumar Singh, A., Nithin Kumar, K.C., Kumar Badhotiya, G., 2021. A fuzzy-AHP 776
and TOPSIS based approach for selection of metal matrix composite used in design and 777
structural applications. Mater. Today Proc. 778
https://doi.org/https://doi.org/10.1016/j.matpr.2021.02.161 779
Charnes, A., Cooper, W.W., Rhodes, E., 1978. Measuring the efficiency of decision making 780
units. Eur. J. Oper. Res. 2, 429–444. https://doi.org/10.1016/0377-2217(78)90138-8 781
Chien, F.S., Kamran, H.W., Albashar, G., Iqbal, W., 2021. Dynamic planning, conversion, and 782
management strategy of different renewable energy sources: A Sustainable Solution for 783
Severe Energy Crises in Emerging Economies. Int. J. Hydrogen Energy. 784
https://doi.org/10.1016/j.ijhydene.2020.12.004 785
Cook, W.D., Ramón, N., Ruiz, J.L., Sirvent, I., Zhu, J., 2019. DEA-based benchmarking for 786
performance evaluation in pay-for-performance incentive plans. Omega 84, 45–54. 787
Dasappa, S., 2011. Potential of biomass energy for electricity generation in sub-Saharan Africa. 788
Energy Sustain. Dev. 15, 203–213. https://doi.org/10.1016/j.esd.2011.07.006 789
Diriba Guta, D., 2012. Assessment of Biomass Fuel Resource Potential And Utilization in 790
Ethiopia: Sourcing Strategies for Renewable Energies, INTERNATIONAL JOURNAL of 791
RENEWABLE ENERGY RESEARCH Dawit Diriba Guta. 792
Duffie, J.A., Beckman, W.A., 2013. Solar Engineering of Thermal Processes: Fourth Edition, 793
Solar Engineering of Thermal Processes: Fourth Edition. Wiley Online Library. 794

https://doi.org/10.1002/9781118671603 795
Gondal, I.A., Masood, S.A., Khan, R., 2018. Green hydrogen production potential for developing 796
a hydrogen economy in Pakistan. Int. J. Hydrogen Energy 43, 6011–6039. 797
https://doi.org/10.1016/J.IJHYDENE.2018.01.113 798
Haas, M., 1974. Asian development bank. Int. Organ. 28, 281–296. 799
https://doi.org/10.1017/S0020818300006032 800
He, W., Abbas, Q., Alharthi, M., Mohsin, M., Hanif, I., Vinh Vo, X., 2020. Integration of 801
renewable hydrogen in light-duty vehicle: Nexus between energy security and low carbon 802
emission resources. Int. J. Hydrogen Energy. https://doi.org/10.1016/j.ijhydene.2020.06.177 803
Hou, Y., Iqbal, W., Shaikh, G.M., Iqbal, N., Solangi, Y.A., Fatima, A., 2019. Measuring energy 804
efficiency and environmental performance: A case of South Asia. Processes 7, 325. 805
https://doi.org/10.3390/pr7060325 806
Hu, H.Y., Lee, Y.C., Yen, T.M., 2010. Service quality gaps analysis based on Fuzzy linguistic 807
SERVQUAL with a case study in hospital out-patient services. TQM J. 22, 499–515. 808
https://doi.org/10.1108/17542731011072847 809
Iqbal, W., Fatima, A., Yumei, H., Abbas, Q., Iram, R., 2020. Oil supply risk and affecting 810
parameters associated with oil supplementation and disruption. J. Clean. Prod. 255. 811
https://doi.org/10.1016/j.jclepro.2020.120187 812
Iqbal, W., Yumei, H., Abbas, Q., Hafeez, M., Mohsin, M., Fatima, A., Jamali, M.A., Jamali, M., 813
Siyal, A., Sohail, N., 2019. Assessment of wind energy potential for the production of 814
renewable hydrogen in Sindh Province of Pakistan. Processes 7. 815
https://doi.org/10.3390/pr7040196 816
IRENA, 2014. Renewable Power Generation Costs in 2014. 817

Ivy, J., 2004. Summary of Electrolytic Hydrogen Production Milestone Completion Report, 818
Small. National Renewable Energy Lab., Golden, CO (US). 819
Kahraman, C., Cebeci, U., Ulukan, Z., 2003. Multi‐criteria supplier selection using fuzzy AHP. 820
Logist. Inf. Manag. 16, 382–394. https://doi.org/10.1108/09576050310503367 821
Kamran, M., 2018. Current status and future success of renewable energy in Pakistan. Renew. 822
Sustain. Energy Rev. https://doi.org/10.1016/j.rser.2017.09.049 823
Khan, A.A., Ahmed, Z., Siddiqui, M.A., 2012. Issues with solid waste management in South 824
Asian countries: A situational analysis of Pakistan. J. Environ. Occup. Sci. 1, 129–131. 825
Khan, S.A.R., Zhang, Y., Kumar, A., Zavadskas, E., Streimikiene, D., 2020. Measuring the 826
impact of renewable energy, public health expenditure, logistics, and environmental 827
performance on sustainable economic growth. Sustain. Dev. 28, 833–843. 828
https://doi.org/10.1002/sd.2034 829
Klitkou, A., Bolwig, S., Hansen, T., Wessberg, N., 2015. The role of lock-in mechanisms in 830
transition processes: The case of energy for road transport, in: Environmental Innovation 831
and Societal Transitions. Elsevier B.V., pp. 22–37. 832
https://doi.org/10.1016/j.eist.2015.07.005 833
Korai, M.S., Mahar, R.B., Uqaili, M.A., 2017. The feasibility of municipal solid waste for 834
energy generation and its existing management practices in Pakistan. Renew. Sustain. 835
Energy Rev. 72, 338–353. 836
Korai, M.S., Mahar, R.B., Uqaili, M.A., 2016. Optimization of waste to energy routes through 837
biochemical and thermochemical treatment options of municipal solid waste in Hyderabad, 838
Pakistan. Energy Convers. Manag. 124, 333–343. 839
Krmac, E., Djordjević, B., 2019. A New DEA Model for Evaluation of Supply Chains: A Case 840

of Selection and Evaluation of Environmental Efficiency of Suppliers. Symmetry (Basel). 841
11, 565. 842
LaPlante, A.E., Paradi, J.C., 2015. Evaluation of bank branch growth potential using data 843
envelopment analysis. Omega 52, 33–41. 844
Melaina, M., Penev, M., Heimiller, D., 2013. Resource Assessment for Hydrogen Production: 845
Hydrogen Production Potential from Fossil and Renewable Energy Resources. National 846
Renewable Energy Lab.(NREL), Golden, CO (United States). 847
Mohsin, M., Rasheed, A.K., Saidur, R., 2018. Economic viability and production capacity of 848
wind generated renewable hydrogen. Int. J. Hydrogen Energy. 849
https://doi.org/10.1016/j.ijhydene.2017.12.113 850
Mokhtari, H., Hasani, A., 2017. A multi-objective model for cleaner production-transportation 851
planning in manufacturing plants via fuzzy goal programming. J. Manuf. Syst. 44, 230–242. 852
https://doi.org/10.1016/j.jmsy.2017.06.002 853
Rehman Khan, S.A., Zhang, Y., Anees, M., Golpîra, H., Lahmar, A., Qianli, D., 2018. Green 854
supply chain management, economic growth and environment: A GMM based evidence. J. 855
Clean. Prod. 185, 588–599. https://doi.org/10.1016/j.jclepro.2018.02.226 856
Reno, M.J., Hansen, C.W., Stein, J.S., 2012. Global Horizontal Irradiance Clear Sky Models: 857
Implementation and Analysis. SANDIA Rep. SAND2012-2389 Unltd. Release Print. March 858
2012. https://doi.org/10.2172/1039404 859
Rufuss, D.D.W., Kumar, V.R., Suganthi, L., Iniyan, S., Davies, P.A., 2018. Techno-economic 860
analysis of solar stills using integrated fuzzy analytical hierarchy process and data 861
envelopment analysis. Sol. Energy 159, 820–833. 862
Shah, S.A.A., Solangi, Y.A., 2019. A sustainable solution for electricity crisis in Pakistan: 863

opportunities, barriers, and policy implications for 100% renewable energy. Environ. Sci. 864
Pollut. Res. 26, 29687–29703. https://doi.org/10.1007/s11356-019-06102-0 865
Shukla, R.K., Garg, D., Agarwal, A., 2014. An integrated approach of Fuzzy AHP and Fuzzy 866
TOPSIS in modeling supply chain coordination. Prod. Manuf. Res. 2, 415–437. 867
https://doi.org/10.1080/21693277.2014.919886 868
Simões, T., Estanqueiro, A., 2016. A new methodology for urban wind resource assessment. 869
Renew. Energy 89, 598–605. https://doi.org/10.1016/j.renene.2015.12.008 870
Solangi, Y.A., Shah, S.A.A., Zameer, H., Ikram, M., Saracoglu, B.O., 2019. Assessing the solar 871
PV power project site selection in Pakistan: based on AHP-fuzzy VIKOR approach. 872
Environ. Sci. Pollut. Res. https://doi.org/10.1007/s11356-019-06172-0 873
Stökler, S., Schillings, C., Kraas, B., 2016. Solar resource assessment study for Pakistan. Renew. 874
Sustain. Energy Rev. https://doi.org/10.1016/j.rser.2015.12.298 875
Tahir, Z.R., Asim, M., 2018. Surface measured solar radiation data and solar energy resource 876
assessment of Pakistan: A review. Renew. Sustain. Energy Rev. 877
https://doi.org/10.1016/j.rser.2017.06.090 878
Tajbakhsh, A., Hassini, E., 2015. A data envelopment analysis approach to evaluate 879
sustainability in supply chain networks. J. Clean. Prod. 105, 74–85. 880
https://doi.org/10.1016/j.jclepro.2014.07.054 881
The World Bank, 2015a. World Development Indicators | DataBank [WWW Document]. 882
DataBank. 883
The World Bank, 2015b. Solar Resource Mapping in Pakistan by The World Bank [WWW 884
Document]. 885
Tone, K., Tsutsui, M., 2009. Network DEA: A slacks-based measure approach. Eur. J. Oper. 886

Res. 197, 243–252. https://doi.org/10.1016/j.ejor.2008.05.027 887
Turcanu, C., Professeur, P.:, Vincke, P., 2007. MULTI-CRITERIA DECISION AIDING 888
MODEL FOR THE EVALUATION OF AGRICULTURAL COUNTERMEASURES 889
AFTER AN ACCIDENTAL RELEASE OF RADIONUCLIDES TO THE 890
ENVIRONMENT. 891
Wang, L.-W., Le, K.-D., Nguyen, T.-D., 2019. Assessment of the Energy Efficiency 892
Improvement of Twenty-Five Countries: A DEA Approach. Energies 12, 1535. 893
Wu, H., Hao, Y., Ren, S., 2020. How do environmental regulation and environmental 894
decentralization affect green total factor energy efficiency: Evidence from China. Energy 895
Econ. 91. https://doi.org/10.1016/j.eneco.2020.104880 896
Xu, L., Wang, Y., Solangi, Y.A., Zameer, H., Shah, S.A.A., 2019. Off-grid solar PV power 897
generation system in Sindh, Pakistan: A techno-economic feasibility analysis. Processes 7, 898
308. https://doi.org/10.3390/pr7050308 899
Yousefi, H., Noorollahi, Y., Ehara, S., Itoi, R., Yousefi, A., Fujimitsu, Y., Nishijima, J., Sasaki, 900
K., 2010. Developing the geothermal resources map of Iran. Geothermics. 901
https://doi.org/10.1016/j.geothermics.2009.11.001 902
Zaigham, N.A., Nayyar, Z.A., 2010. Renewable hot dry rock geothermal energy source and its 903
potential in Pakistan. Renew. Sustain. Energy Rev. 904
https://doi.org/10.1016/j.rser.2009.10.002 905
Zhou, Peng, Ang, B.W., Poh, K.-L., 2008. A survey of data envelopment analysis in energy and 906
environmental studies. Eur. J. Oper. Res. 189, 1–18. 907
Zhou, P., Ang, B.W., Poh, K.L., 2008. Measuring environmental performance under different 908
environmental DEA technologies. Energy Econ. 30, 1–14. 909

https://doi.org/10.1016/j.eneco.2006.05.001 910
Zuberi, M.J.S., Ali, S.F., 2015. Greenhouse effect reduction by recovering energy from waste 911
landfills in Pakistan. Renew. Sustain. Energy Rev. 44, 117–131. 912
913

Figures
Figure 1
Global horizontal irradiance mapping of Pakistan Northern Region(Reno et al., 2012) Note: Thedesignations employed and the presentation of the material on this map do not imply the expression ofany opinion whatsoever on the part of Research Square concerning the legal status of any country,territory, city or area or of its authorities, or concerning the delimitation of its frontiers or boundaries. Thismap has been provided by the authors.

Figure 2
RES-based hydrogen production and supply
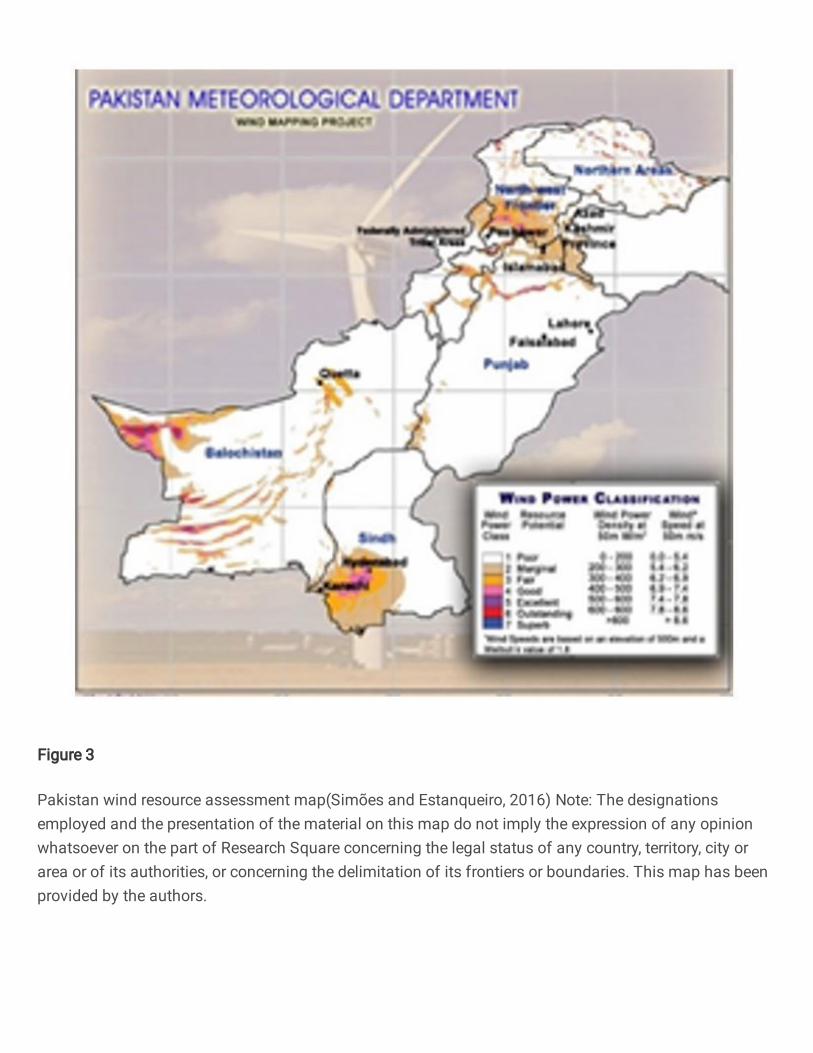
Figure 3
Pakistan wind resource assessment map(Simões and Estanqueiro, 2016) Note: The designationsemployed and the presentation of the material on this map do not imply the expression of any opinionwhatsoever on the part of Research Square concerning the legal status of any country, territory, city orarea or of its authorities, or concerning the delimitation of its frontiers or boundaries. This map has beenprovided by the authors.

Figure 4
Map of hydro-geothermal resources in Pakistan(Youse� et al., 2010) Note: The designations employedand the presentation of the material on this map do not imply the expression of any opinion whatsoeveron the part of Research Square concerning the legal status of any country, territory, city or area or of itsauthorities, or concerning the delimitation of its frontiers or boundaries. This map has been provided bythe authors.

Figure 5
A Research Framework Diagram
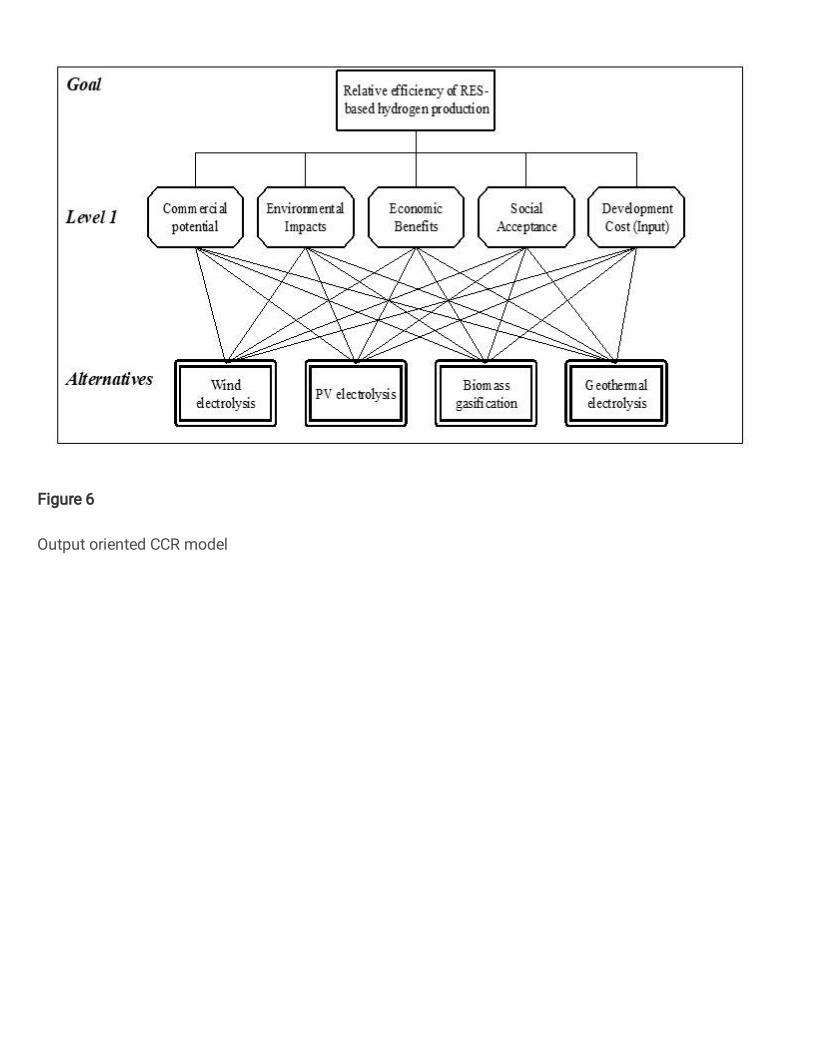
Figure 6
Output oriented CCR model