fuels, quality standards, and emissions durability · 100 samples taken between 03/19/2015 and...
TRANSCRIPT
Fuels, Quality Standards, and Emissions Durability
Michael G. Ross
June 13, 2017
1

2
PERC Fuel Quality Survey
3
National Fuel Quality Survey
(PERC Docket 20064)
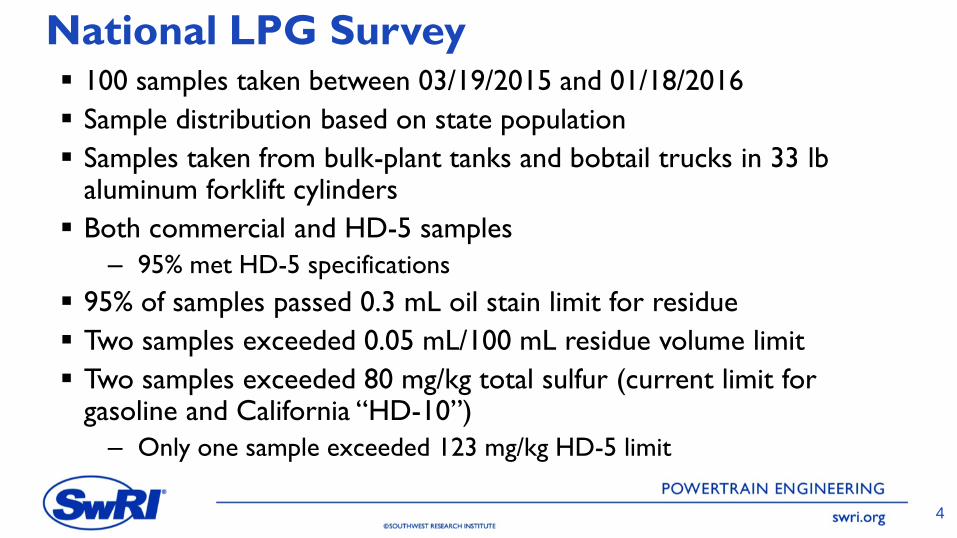
National LPG Survey 100 samples taken between 03/19/2015 and 01/18/2016
Sample distribution based on state population
Samples taken from bulk-plant tanks and bobtail trucks in 33 lb aluminum forklift cylinders
Both commercial and HD-5 samples
– 95% met HD-5 specifications
95% of samples passed 0.3 mL oil stain limit for residue
Two samples exceeded 0.05 mL/100 mL residue volume limit
Two samples exceeded 80 mg/kg total sulfur (current limit for gasoline and California “HD-10”)
– Only one sample exceeded 123 mg/kg HD-5 limit
4

LPG Sample Locations
5

LPG Composition Statistics Hydrocarbon Composition
(D2163) Unit Mean 1σ Min Max
methane vol% 0.06 0.07 0.00 0.38
ethane vol% 3.83 2.26 0.38 10.55
ethylene vol% 0.00 0.01 0.00 0.04
propane vol% 94.49 2.33 86.68 98.77
propylene vol% 0.61 1.44 0.00 10.99
isobutane vol% 0.82 0.37 0.17 2.17
n-butane vol% 0.16 0.14 0.01 0.67
trans-2-butene vol% 0.00 0.00 0.00 0.01
1-butene vol% 0.00 0.01 0.00 0.03
isobutene vol% 0.00 0.01 0.00 0.05
cis-2-butene vol% 0.00 0.00 0.00 0.01
isopentane vol% 0.00 0.01 0.00 0.05
n-pentane vol% 0.01 0.01 0.00 0.07
1,3-butadiene vol% 0.00 0.01 0.00 0.06
butane and heavier vol% 1.00 0.46 0.34 2.88
pentane and heavier vol% 0.01 0.02 0.00 0.12
6
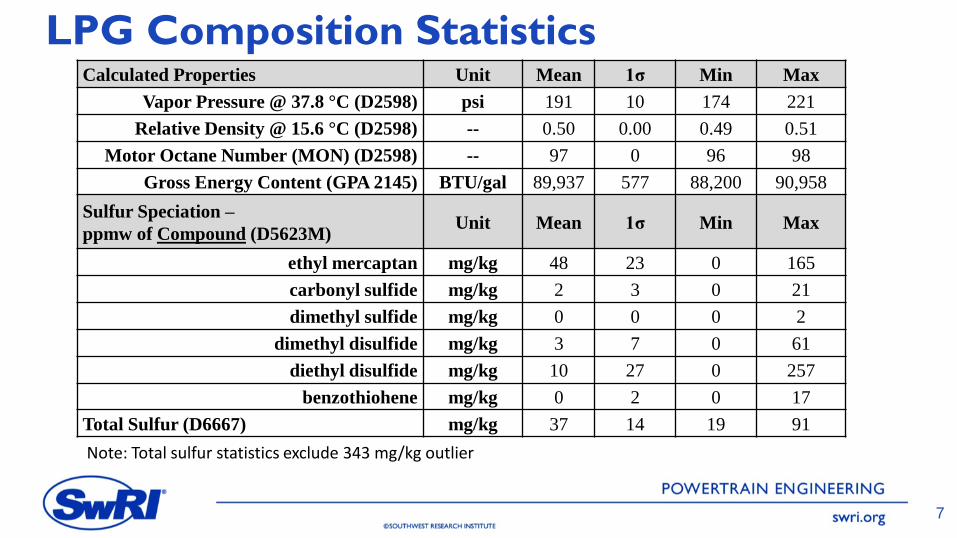
LPG Composition Statistics Calculated Properties Unit Mean 1σ Min Max
Vapor Pressure @ 37.8 °C (D2598) psi 191 10 174 221
Relative Density @ 15.6 °C (D2598) -- 0.50 0.00 0.49 0.51
Motor Octane Number (MON) (D2598) -- 97 0 96 98
Gross Energy Content (GPA 2145) BTU/gal 89,937 577 88,200 90,958
Sulfur Speciation –
ppmw of Compound (D5623M) Unit Mean 1σ Min Max
ethyl mercaptan mg/kg 48 23 0 165
carbonyl sulfide mg/kg 2 3 0 21
dimethyl sulfide mg/kg 0 0 0 2
dimethyl disulfide mg/kg 3 7 0 61
diethyl disulfide mg/kg 10 27 0 257
benzothiohene mg/kg 0 2 0 17
Total Sulfur (D6667) mg/kg 37 14 19 91
7
Note: Total sulfur statistics exclude 343 mg/kg outlier
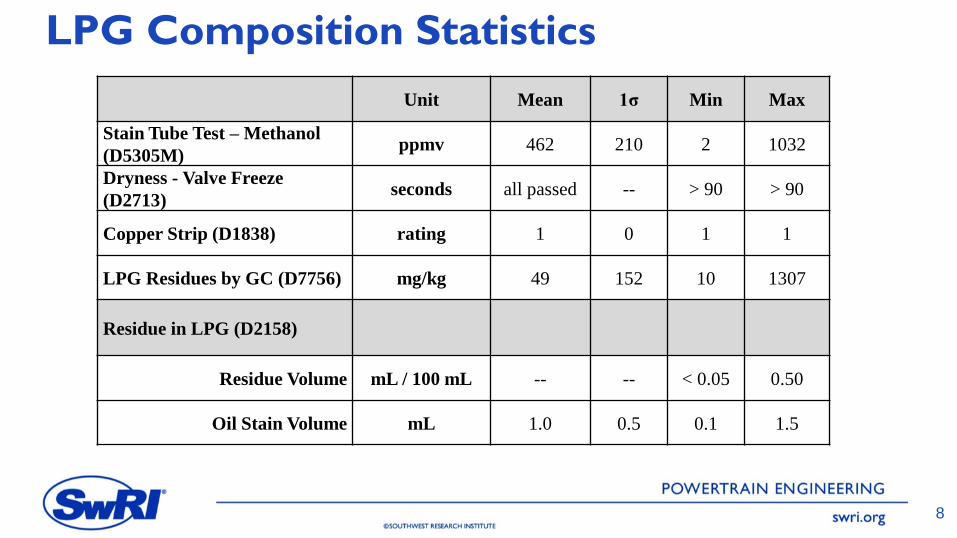
LPG Composition Statistics
Unit Mean 1σ Min Max
Stain Tube Test – Methanol
(D5305M) ppmv 462 210 2 1032
Dryness - Valve Freeze
(D2713) seconds all passed -- > 90 > 90
Copper Strip (D1838) rating 1 0 1 1
LPG Residues by GC (D7756) mg/kg 49 152 10 1307
Residue in LPG (D2158)
Residue Volume mL / 100 mL -- -- < 0.05 0.50
Oil Stain Volume mL 1.0 0.5 0.1 1.5
8

2017 PERC Fuel Quality Survey Plan
Tentative plan, pending PERC Council approval
Approximately 70 samples will be collected and tested – ASTM D1657 Density by Pressure Hydrometer
– ASTM D1267 Vapor Pressure
– ASTM D1838 Copper Corrosion
– ASTM D2158 Residue in LPG
– ASTM D2163 Composition by GC
– ASTM D2598 Relative density, vapor pressure, MON • Calculated from D2163
– ASTM D2713 Moisture Content
– ASTM D5623 Sulfur Speciation
– ASTM D6667 Total Sulfur
9

10
3-Way Catalyst Light-Off Performance
on LPG and the Feasibility of Achieving
Near-Zero NOx

Baseline Data – Cold Start Engine Out Emissions
11
• HD Otto-Cycle FTP Cold Start Engine Out Emissions Obtained from 2016
MY Propane-Fueled Engine
Gas Mixtures Used for Bench Testing Mixture based on average concentrations during 30 – 125 seconds of cold FTP cycle
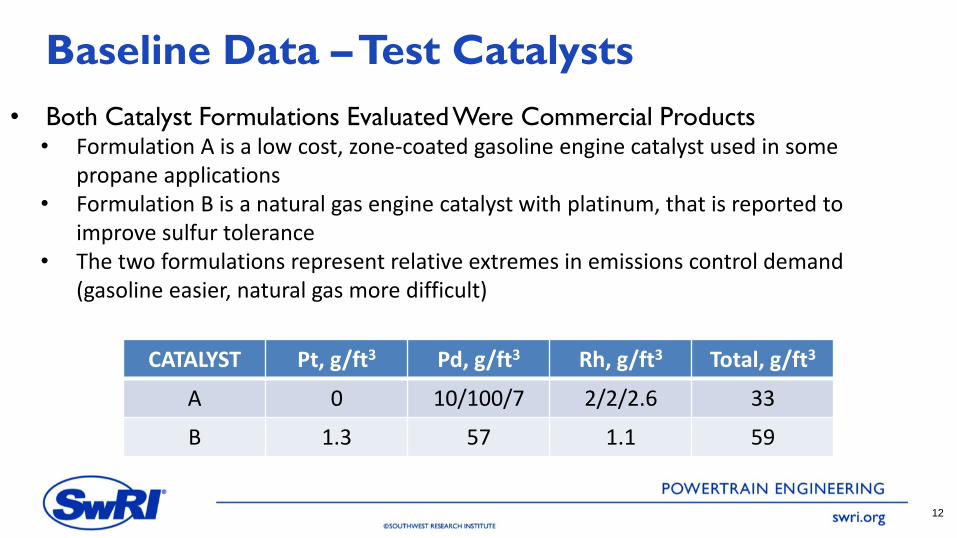
Baseline Data – Test Catalysts
12
• Both Catalyst Formulations Evaluated Were Commercial Products • Formulation A is a low cost, zone-coated gasoline engine catalyst used in some
propane applications • Formulation B is a natural gas engine catalyst with platinum, that is reported to
improve sulfur tolerance • The two formulations represent relative extremes in emissions control demand
(gasoline easier, natural gas more difficult)
CATALYST Pt, g/ft3 Pd, g/ft3 Rh, g/ft3 Total, g/ft3
A 0 10/100/7 2/2/2.6 33
B 1.3 57 1.1 59

Synthetic Gas Reactor Bench Core Testing
13
• SwRI’s Universal Synthetic
Gas Reactor (USGR®)
Catalyst Core Testing
System

Fresh Catalyst Performance
14
• Example of Processed Test Result
• T50 used to Compare Catalysts
and Conditions
• Four Fuel Sulfur Equivalent
Conditions Tested
• 11 mg/kg S • 22 mg/kg S • 45 mg/kg S (field average + 20%) • 90 mg/kg S 11 mg/kg S
level

Comparison of Two Formulations Sensitivity to
Fuel Sulfur Content
15
• Both Formulations are Sensitive to Sulfur Level for NO, Propane and Ethane
Control
• Formulation B Exhibited Lower Light-Off Temperatures than Formulation A
Formulation A Formulation B
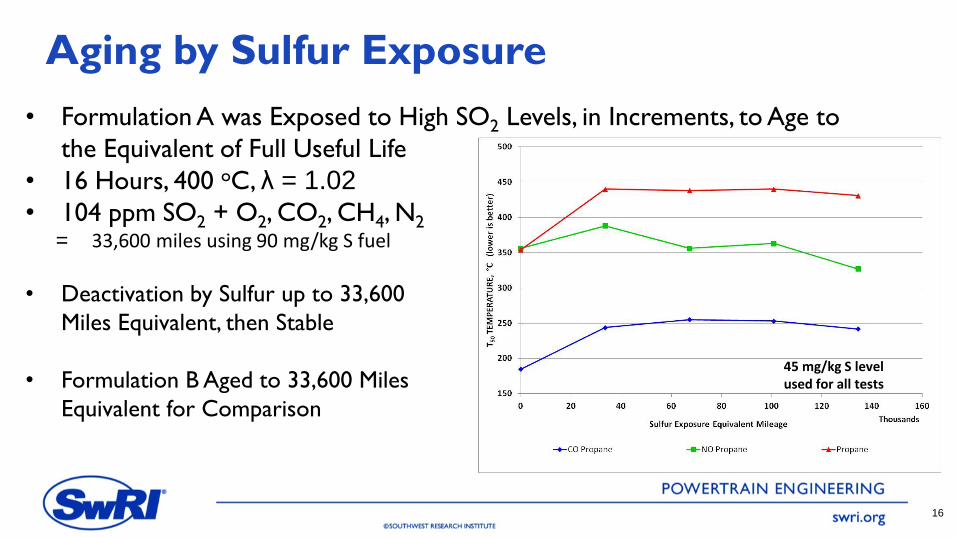
Aging by Sulfur Exposure
16
• Formulation A was Exposed to High SO2 Levels, in Increments, to Age to
the Equivalent of Full Useful Life
• 16 Hours, 400 oC, λ = 1.02
• 104 ppm SO2 + O2, CO2, CH4, N2 = 33,600 miles using 90 mg/kg S fuel
• Deactivation by Sulfur up to 33,600
Miles Equivalent, then Stable
• Formulation B Aged to 33,600 Miles
Equivalent for Comparison
45 mg/kg S level used for all tests
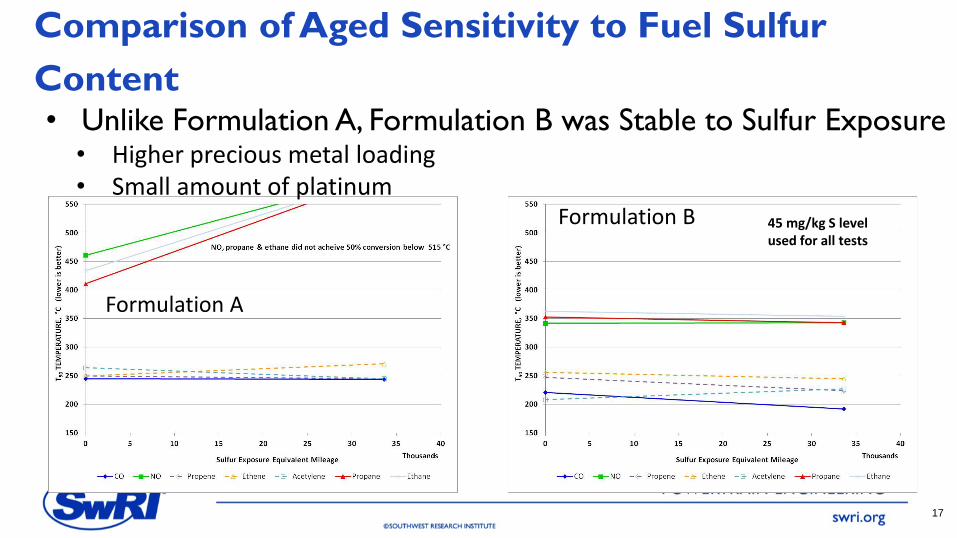
Comparison of Aged Sensitivity to Fuel Sulfur
Content
17
• Unlike Formulation A, Formulation B was Stable to Sulfur Exposure • Higher precious metal loading • Small amount of platinum
Formulation A
Formulation B 45 mg/kg S level used for all tests
Desulfation
18
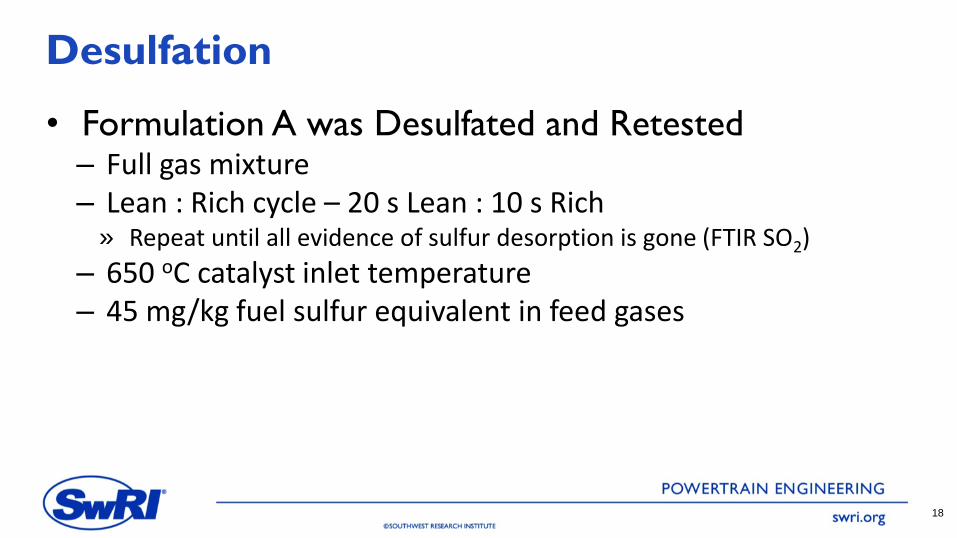
• Formulation A was Desulfated and Retested – Full gas mixture – Lean : Rich cycle – 20 s Lean : 10 s Rich
» Repeat until all evidence of sulfur desorption is gone (FTIR SO2)
– 650 oC catalyst inlet temperature – 45 mg/kg fuel sulfur equivalent in feed gases
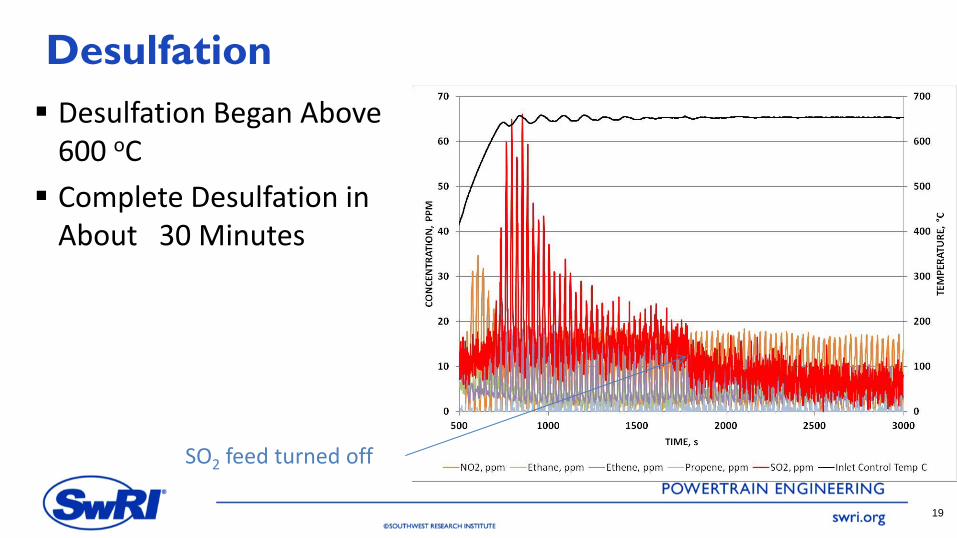
Desulfation Began Above 600 oC
Complete Desulfation in About 30 Minutes
Desulfation
19
SO2 feed turned off

Formulation A was Effectively Regenerated by Desulfation
Effectiveness of Desulfation
20
45 mg/kg S level used for all tests

Rich Biasing of Cold Start
21
Does a rich bias reduce light-off temperatures (especially NOx)?
Tests Were Performed Using Formulation A at 45 mg/kg Fuel Sulfur Equivalent With Rich:Lean Perturbations of 3:1, 2:1 and 3:2

Rich Biasing of Cold Start
22
• Nitric oxide, Propane, Ethane Temperatures Decrease (good)
• Acetylene Temperatures Increase (worse)
• Applying a Rich Bias During Cold Start Can Significantly Improve Cold Start Emissions Performance • Even a small bias (R:L 3:2)
is sufficient

Conclusions
23
• Both Formulations Exhibited Increased Light Off Temperatures for NO,
Propane and Ethane (saturated hydrocarbons) as a Function of Sulfur
Concentration – CO and unsaturated hydrocarbons were unaffected
• The Palladium/Rhodium Formulation A was Adversely Affected by Sulfur
Exposure Aging
• The Platinum/Palladium/Rhodium Formulation B was Unaffected by Sulfur
Exposure Aging
• Sulfur Poisoning was Reversible for Formulation A with a Desulfation
• Cold Start Emissions Performance Could be Improved by Employing a Slight
Rich Bias

Questions?
24
Contact:
Michael G. Ross
Program Manager
Southwest Research Institute
210-522-2690