fujitsu software serverviewmanuals.ts.fujitsu.com/file/12429/sv-intpack-scom-lin-en.pdfuser guide -...
TRANSCRIPT
User Guide - English
FUJITSU Software ServerView Linux Server Integration Pack V8.4 for MS SCOM
January 2018 Edition
User Guide
Copyright 2018 FUJITSU LIMITED
All hardware and software names used are trademarks of their respective manufacturers.
All rights, including rights of translation, reproduction by printing, copying or similar methods,
in part or in whole, are reserved.
Offenders will be liable for damages.
All rights, including rights created by patent grant or registration of a utility model or design,
are reserved.
Delivery subject to availability. Right of technical modification reserved.
User Guide
Contents
1 Introduction ......................................................................................................... 1 1.1 Purpose and target groups .................................................................................... 1 1.2 Changes since the last edition ............................................................................... 2 1.3 ServerView Suite link collection ............................................................................. 2 1.4 Documentation for ServerView Suite ...................................................................... 4 1.5 Notational Conventions ......................................................................................... 4
2 Integration requirements .................................................................................... 5 2.1 ServerView Agent events ....................................................................................... 6 2.2 SCOM Run As accounts and profiles ........................................................................ 6 2.2.1 Unix/Linux Run As account and profile ................................................................... 6 2.2.2 SNMP Run As account ............................................................................................ 7 2.3 Updating ServerView Agents .................................................................................. 7
3 Installation and uninstallation ............................................................................ 8 3.1 Installing ServerView Integration Pack ................................................................... 8 3.1.1 Installed files ......................................................................................................... 8 3.1.2 Importing Management Packs ............................................................................... 9 3.2 Update to a new version ...................................................................................... 10 3.3 Updating the ServerView Library Management Packs .......................................... 10 3.4 Uninstalling ServerView Integration Pack ............................................................ 11
4 Properties of the ServerView Linux Server Integration Pack ............................. 12 4.1 Management Packs ............................................................................................. 12 4.2 PRIMERGY server computer groups ...................................................................... 14 4.3 Discovering and monitoring PRIMERGY servers .................................................... 15 4.3.1 Displayed properties of recognized PRIMERGY servers .......................................... 15 4.3.2 Health state of a PRIMERGY server ....................................................................... 16 4.4 Discovering and monitoring server components .................................................. 16 4.4.1 Discovering subsystems and components ............................................................ 17 4.4.1.1 Processors ............................................................................................................ 17 4.4.1.2 Memory ............................................................................................................... 18 4.4.1.3 Storage ................................................................................................................ 19 4.4.1.4 Network Adapters ................................................................................................ 19 4.4.1.5 iRMC (integrated Remote Management Controller) ............................................. 20 4.4.1.6 Fans (Cooling) ..................................................................................................... 20
Contents
User Guide
4.4.1.7 Temperature Sensors ........................................................................................... 21 4.4.1.8 Power Supplies ..................................................................................................... 22 4.4.1.9 Power Consumption ............................................................................................. 22 4.4.1.10 Voltage Sensors ................................................................................................... 23 4.4.1.11 RAID Subsystem ................................................................................................... 23 4.4.1.12 Other Components ............................................................................................... 25 4.4.1.13 Communication Monitor ...................................................................................... 26 4.4.2 Updating the state of the subsystems .................................................................. 27 4.4.3 Discovering the required services ......................................................................... 27 4.4.3.1 ServerView Linux Agents (EECD) .......................................................................... 27 4.4.3.2 Linux CIMOM (SFCB or OpenPegasus) .................................................................. 28 4.4.3.3 Linux SNMP daemon ............................................................................................ 28 4.4.3.4 ServerView RAID ................................................................................................... 29 4.4.4 Monitoring components ....................................................................................... 29 4.4.5 Monitoring services .............................................................................................. 30 4.4.5.1 ServerView Linux Agents (EECD) .......................................................................... 30 4.4.5.2 Linux CIMOM (SFCB or OpenPegasus) .................................................................. 30 4.4.5.3 Linux SNMP daemon ............................................................................................ 31 4.4.5.4 ServerView RAID Manager .................................................................................... 31 4.5 Performance Data Collection ................................................................................ 31 4.5.1 Temperature Performance Data ........................................................................... 32 4.5.2 Power Consumption Performance Data ................................................................ 33 4.6 Performance Data Collection for OMS ................................................................... 33 4.7 Views ................................................................................................................... 34 4.7.1 Views defined by the Fujitsu ServerView Core Library MP ..................................... 34 4.7.2 Views defined by the Fujitsu AddOnViews MP ...................................................... 35 4.7.3 Views defined by the Fujitsu PRIMERGY Linux Servers MP .................................... 37 4.7.4 Active Alerts View ................................................................................................. 38 4.7.5 Diagram View ...................................................................................................... 39 4.7.6 Servers Health View ............................................................................................. 40 4.7.7 Health Monitoring Views ...................................................................................... 40 4.7.8 Alerts per Server View (from optional AddOnViews MP) ....................................... 41 4.7.9 Components per Server View (from optional AddOnViews MP) ............................. 42 4.7.10 Views defined by the Performance Monitoring MP ............................................... 43 4.8 Health Explorer .................................................................................................... 44 4.9 Fujitsu PRIMERGY Linux Server Tasks .................................................................... 45 4.9.1 Delete PRIMERGY Server Component Inventory .................................................... 45 4.9.2 Remote Terminal ................................................................................................. 46 4.9.3 ServerView RAID Manager .................................................................................... 46 4.9.4 ServerView Remote Management iRMC ................................................................ 46 4.9.5 ServerView Remote Management MMB ............................................................... 46
Contents
User Guide
4.9.6 ServerView System Monitor.................................................................................. 46 4.10 Events and alerts ................................................................................................. 47 4.10.1 Enabling and disabling alerts .............................................................................. 47 4.11 Knowledge Base .................................................................................................. 48
5 Working with the ServerView Linux Server Integration Pack............................ 49 5.1 Monitoring – Active Alerts ................................................................................... 49 5.1.1 Displaying properties of an alert .......................................................................... 49 5.1.2 Executing tasks .................................................................................................... 49 5.2 Monitoring – Servers Health ................................................................................ 50 5.2.1 Executing tasks .................................................................................................... 50
6 Working with the Performance Monitoring Management Pack ....................... 51 6.1 Create additional Performance Monitoring Views ................................................ 51 6.1.1 Create a Performance View based on specific rules .............................................. 51 6.1.2 Create a Performance View based on specific performance objects and counters . 52 6.1.3 Create a Dashboard View containing a State and a Performance Widget ............. 53 6.1.3.1 Define the dashboard layout ............................................................................... 53 6.1.3.2 Configure the State Widget .................................................................................. 53 6.1.3.3 Configuring the Performance Widget ................................................................... 54 6.1.4 24 Hour Performance Dashboard View ................................................................. 55
7 Appendix............................................................................................................. 57 7.1 Supported PRIMERGY servers ............................................................................... 57 7.2 Creating log files .................................................................................................. 57 7.2.1 Log files on the SCOM server ................................................................................ 57 7.2.2 Log files on the Linux target server ...................................................................... 58 7.2.3 Currentness of log files ........................................................................................ 58 7.3 Troubleshooting .................................................................................................. 59 7.3.1 Use ServerView System Monitor to examine a PRIMERGY Server .......................... 59 7.3.2 Discovery does not start for Linux servers ............................................................ 59 7.4 Hints and known issues ....................................................................................... 60

Introduction
User Guide 1
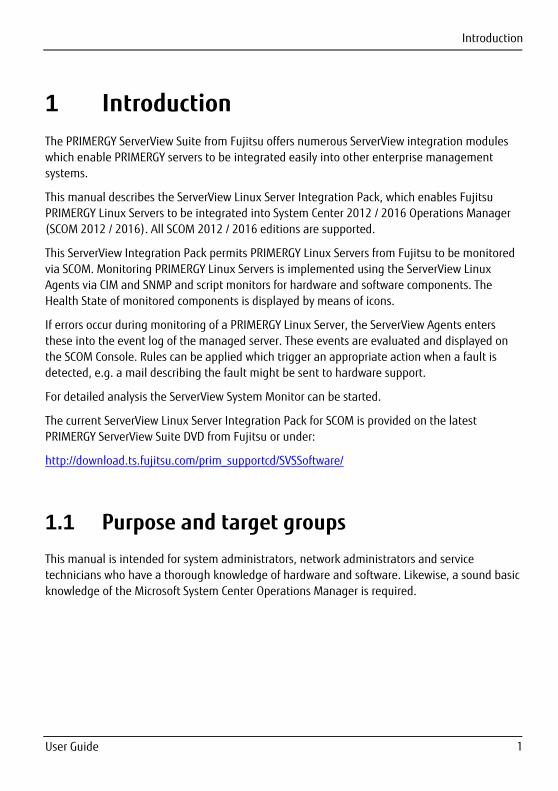
1 Introduction
The PRIMERGY ServerView Suite from Fujitsu offers numerous ServerView integration modules
which enable PRIMERGY servers to be integrated easily into other enterprise management
systems.
This manual describes the ServerView Linux Server Integration Pack, which enables Fujitsu
PRIMERGY Linux Servers to be integrated into System Center 2012 / 2016 Operations Manager
(SCOM 2012 / 2016). All SCOM 2012 / 2016 editions are supported.
This ServerView Integration Pack permits PRIMERGY Linux Servers from Fujitsu to be monitored
via SCOM. Monitoring PRIMERGY Linux Servers is implemented using the ServerView Linux
Agents via CIM and SNMP and script monitors for hardware and software components. The
Health State of monitored components is displayed by means of icons.
If errors occur during monitoring of a PRIMERGY Linux Server, the ServerView Agents enters
these into the event log of the managed server. These events are evaluated and displayed on
the SCOM Console. Rules can be applied which trigger an appropriate action when a fault is
detected, e.g. a mail describing the fault might be sent to hardware support.
For detailed analysis the ServerView System Monitor can be started.
The current ServerView Linux Server Integration Pack for SCOM is provided on the latest
PRIMERGY ServerView Suite DVD from Fujitsu or under:
http://download.ts.fujitsu.com/prim_supportcd/SVSSoftware/
1.1 Purpose and target groups
This manual is intended for system administrators, network administrators and service
technicians who have a thorough knowledge of hardware and software. Likewise, a sound basic
knowledge of the Microsoft System Center Operations Manager is required.
Changes since the last edition
User Guide 2
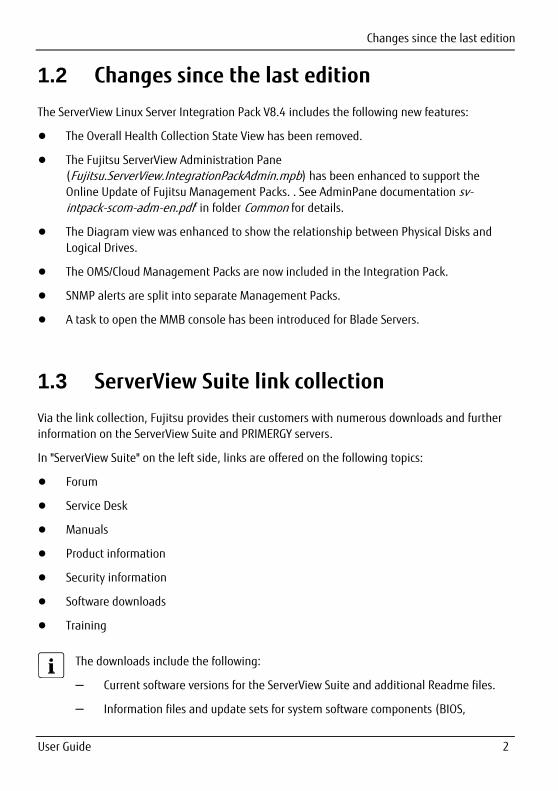
1.2 Changes since the last edition
The ServerView Linux Server Integration Pack V8.4 includes the following new features:
● The Overall Health Collection State View has been removed.
● The Fujitsu ServerView Administration Pane
(Fujitsu.ServerView.IntegrationPackAdmin.mpb) has been enhanced to support the
Online Update of Fujitsu Management Packs. . See AdminPane documentation sv-intpack-scom-adm-en.pdf’ in folder Common for details.
● The Diagram view was enhanced to show the relationship between Physical Disks and
Logical Drives.
● The OMS/Cloud Management Packs are now included in the Integration Pack.
● SNMP alerts are split into separate Management Packs.
● A task to open the MMB console has been introduced for Blade Servers.
1.3 ServerView Suite link collection
Via the link collection, Fujitsu provides their customers with numerous downloads and further
information on the ServerView Suite and PRIMERGY servers.
In "ServerView Suite" on the left side, links are offered on the following topics:
● Forum
● Service Desk
● Manuals
● Product information
● Security information
● Software downloads
● Training
The downloads include the following:
– Current software versions for the ServerView Suite and additional Readme files.
– Information files and update sets for system software components (BIOS,
ServerView Suite link collection
User Guide 3
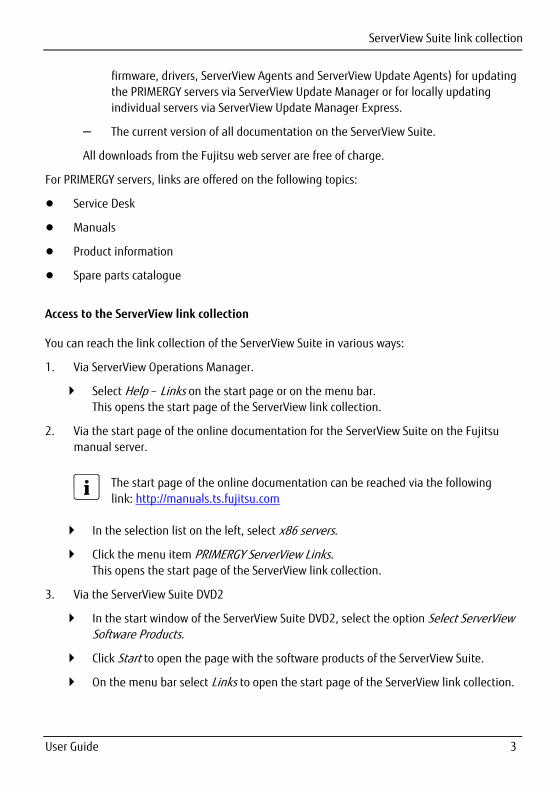
firmware, drivers, ServerView Agents and ServerView Update Agents) for updating
the PRIMERGY servers via ServerView Update Manager or for locally updating
individual servers via ServerView Update Manager Express.
– The current version of all documentation on the ServerView Suite.
All downloads from the Fujitsu web server are free of charge.
For PRIMERGY servers, links are offered on the following topics:
● Service Desk
● Manuals
● Product information
● Spare parts catalogue
Access to the ServerView link collection
You can reach the link collection of the ServerView Suite in various ways:
1. Via ServerView Operations Manager.
Select Help – Links on the start page or on the menu bar.
This opens the start page of the ServerView link collection.
2. Via the start page of the online documentation for the ServerView Suite on the Fujitsu
manual server.
The start page of the online documentation can be reached via the following
link: http://manuals.ts.fujitsu.com
In the selection list on the left, select x86 servers.
Click the menu item PRIMERGY ServerView Links.
This opens the start page of the ServerView link collection.
3. Via the ServerView Suite DVD2
In the start window of the ServerView Suite DVD2, select the option Select ServerView Software Products.
Click Start to open the page with the software products of the ServerView Suite.
On the menu bar select Links to open the start page of the ServerView link collection.
Documentation for ServerView Suite
User Guide 4
1.4 Documentation for ServerView Suite
The documentation can be downloaded free of charge from the Internet. You will find the
online documentation at http://manuals.ts.fujitsu.com under the link x86 servers.
For an overview of the documentation to be found under ServerView Suite as well as the filing
structure, see the ServerView Suite sitemap (ServerView Suite -Site Overview).
1.5 Notational Conventions
The following notational conventions are used in this manual:
Warning
This symbol is used to draw attention to risks which may represent a health
hazard or which may lead to data loss or damage to the hardware
Information
This symbol highlights important information and tips.
This symbol refers to a step that you must carry out in order to continue
with the procedure.
italics Commands, menu items, names of buttons, options, file names and path
names are shown in italics in descriptive text.
<variable> Angle brackets are used to enclose variables which are replaced by values.
Screen Output
Please note that the screen output shown in this manual may not correspond to the output
from your system in every detail. System-related differences between the menu items available
can also arise.
Notational Conventions
User Guide 5
2 Integration requirements
The requirements specified below must be satisfied for integration.
Management station
● Microsoft System Center 2012 / 2016 Operations Manager
● Windows Server 2008 R2 / 2012 / 2012 R2 / 2016.
See the requirements for the relevant SCOM version
● SQL Server 2008 / 2012 / 2014 / 2016.
See the requirements for the relevant SCOM version
● SCOM 2012 SP1 UR6, SCOM 2012 R2 UR2 or SCOM 2016 for additional dashboard views
On SCOM 2012 SP1 with UR6
Microsoft.SystemCenter.Visualization.Component.Library version 7.0.9538.1109
is required.
On SCOM 2012 R2 with UR2
Microsoft.SystemCenter.Visualization.Component.Library version
7.1.10226.1015 is required.
● PowerShell >= 3.0
● Unix/Linux Run As accounts configured as required by Microsoft
● SNMP Run As account within SCOM (optional)
See chapter 2.2 SCOM Run As accounts and profiles
Managed PRIMERGY servers
● Red Hat Enterprise Linux (6.5 – 7) or SUSE Linux Enterprise Server (11 – 12)
● ServerView Linux Agents >= V6.31.10
● ServerView CIM Provider >= 7.20
● CIMOM (Sfcb or OpenPegasus) service
● SNMP service
ServerView Agent events
User Guide 6
● Python >= 2.6
● Management controller iRMC (integrated Remote Management Controller) (for power
consumption)
● ServerView RAID for RAID monitoring (ServerView CIM Provider >= 8.00 for CIM RAID
monitoring)
● Linux Monitoring user configured with home directory
● Installed SCOM agent
2.1 ServerView Agent events
To permit ServerView Agent events to be displayed in SCOM, they must be written to
/var/log/messages. Since ServerView Agents logs events via the syslog daemon, its
configuration must point to /var/log/messages.
If the syslog daemon is configured to log to another location, the ServerView Linux
Server Management Pack is not able to evaluate ServerView Agent events.
2.2 SCOM Run As accounts and profiles
2.2.1 Unix/Linux Run As account and profile
Fujitsu PRIMERGY Linux Server Management Pack needs to have the Unix/Linux Run As
accounts and profiles set up as required by Microsoft for the discovery and monitoring
processes.
For details about configuring Linux server discovery in SCOM refer to “How to Configure
Run As Accounts and Profiles for UNIX and Linux Access” at
https://technet.microsoft.com/en-us/library/hh212926.aspx
The user account configured for the Unix/Linux Monitoring account must have a home directory
configured for the Management pack to store component tracking data and additional Python
modules.
Updating ServerView Agents
User Guide 7
The Linux monitoring user should also have access to WBEM (CIMOM) from localhost and to the
following SNMP OID’s:
– 1.3.6.1.2.1.2.2.1
– 1.3.6.1.2.1.25.3
– 1.3.6.1.4.1.231.2.49.1
All SNMP protocol versions are supported and are used only locally on the target server. The
management pack will try to use SNMPv3, SNMPv2c and SNMPv1 (in this order). If SNMPv3 is
configured on the target server the SNMPv3 user should be configured to be the SCOM Linux
monitoring user for this server (SNMPv3 user should have the same credentials as Linux
monitoring user).
For more information about SNMPv2c and SNMPv1 see 2.2.2 SNMP Run As account.
2.2.2 SNMP Run As account
The ServerView Linux Server Integration Pack adds a Run As profile named Fujitsu PRIMERGY Linux Servers SNMP Account to SCOM to support an easy adaption of the SNMP v1 and v2c
community string for monitored Fujitsu Linux Servers. The default SNMP community string is
public.
If the SNMP community string for monitored servers is other than public, create a SNMP
account in SCOM with the expected community string and associate it with the Fujitsu PRIMERGY Linux Servers SNMP Account.
2.3 Updating ServerView Agents
When updating the ServerView Agents set the relevant PRIMERGY server in Maintenance Mode
during this action.
Failure to set target servers where ServerView Agents are to be updated in maintenance
mode may lead to an incomplete installation of ServerView Agents.
This may impact the monitoring capabilities of the ServerView Agents and the
ServerView Linux Server Integration Pack.
Installing ServerView Integration Pack
User Guide 8
3 Installation and uninstallation
3.1 Installing ServerView Integration Pack
The installation program SVISCOM-Lin.exe is located on the ServerView Suite DVD at
<DVDroot>\SVSSoftware\Software\Integration_Solutions\SCOM
or as a download on the website at
http://download.ts.fujitsu.com/prim_supportcd/SVSSoftware/
The installation program first runs some basic checks then starts the Installation Wizard. Follow
the instructions displayed during the installation process.
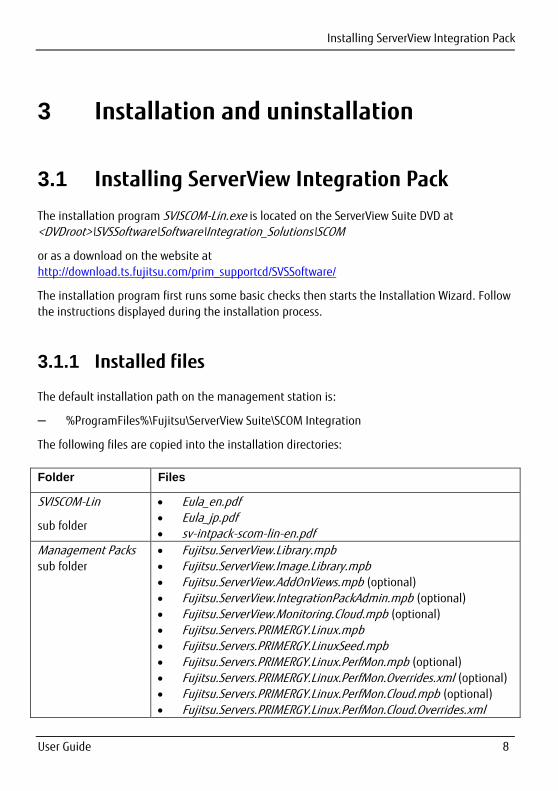
3.1.1 Installed files
The default installation path on the management station is:
– %ProgramFiles%\Fujitsu\ServerView Suite\SCOM Integration
The following files are copied into the installation directories:
Folder Files
SVISCOM-Lin
sub folder
Eula_en.pdf Eula_jp.pdf sv-intpack-scom-lin-en.pdf
Management Packs sub folder
Fujitsu.ServerView.Library.mpb Fujitsu.ServerView.Image.Library.mpb Fujitsu.ServerView.AddOnViews.mpb (optional) Fujitsu.ServerView.IntegrationPackAdmin.mpb (optional) Fujitsu.ServerView.Monitoring.Cloud.mpb (optional) Fujitsu.Servers.PRIMERGY.Linux.mpb Fujitsu.Servers.PRIMERGY.LinuxSeed.mpb Fujitsu.Servers.PRIMERGY.Linux.PerfMon.mpb (optional) Fujitsu.Servers.PRIMERGY.Linux.PerfMon.Overrides.xml (optional) Fujitsu.Servers.PRIMERGY.Linux.PerfMon.Cloud.mpb (optional) Fujitsu.Servers.PRIMERGY.Linux.PerfMon.Cloud.Overrides.xml
Installing ServerView Integration Pack
User Guide 9
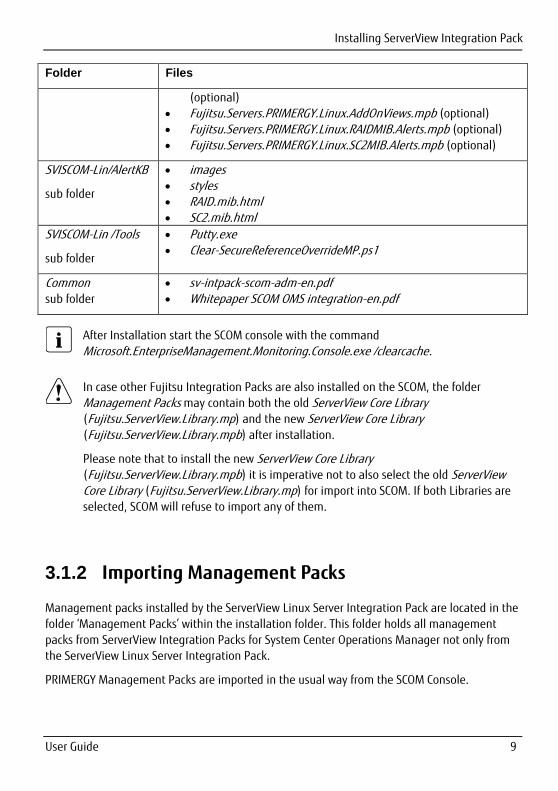
Folder Files
(optional) Fujitsu.Servers.PRIMERGY.Linux.AddOnViews.mpb (optional) Fujitsu.Servers.PRIMERGY.Linux.RAIDMIB.Alerts.mpb (optional) Fujitsu.Servers.PRIMERGY.Linux.SC2MIB.Alerts.mpb (optional)
SVISCOM-Lin/AlertKB
sub folder
images styles RAID.mib.html SC2.mib.html
SVISCOM-Lin /Tools
sub folder
Putty.exe Clear-SecureReferenceOverrideMP.ps1
Common
sub folder
sv-intpack-scom-adm-en.pdf Whitepaper SCOM OMS integration-en.pdf
After Installation start the SCOM console with the command
Microsoft.EnterpriseManagement.Monitoring.Console.exe /clearcache.
In case other Fujitsu Integration Packs are also installed on the SCOM, the folder
Management Packs may contain both the old ServerView Core Library
(Fujitsu.ServerView.Library.mp) and the new ServerView Core Library
(Fujitsu.ServerView.Library.mpb) after installation.
Please note that to install the new ServerView Core Library
(Fujitsu.ServerView.Library.mpb) it is imperative not to also select the old ServerView Core Library (Fujitsu.ServerView.Library.mp) for import into SCOM. If both Libraries are
selected, SCOM will refuse to import any of them.
3.1.2 Importing Management Packs
Management packs installed by the ServerView Linux Server Integration Pack are located in the
folder ‘Management Packs’ within the installation folder. This folder holds all management
packs from ServerView Integration Packs for System Center Operations Manager not only from
the ServerView Linux Server Integration Pack.
PRIMERGY Management Packs are imported in the usual way from the SCOM Console.
Update to a new version
User Guide 10
Not all Management Packs of the ServerView Linux Server Integration Pack must be imported,
some Management Packs are optional. See chapter 3.1.1 Installed files for details. All
Management Packs can be installed at one time.
Close the SCOM Console once after importing management packs.
3.2 Update to a new version
Update installation is not supported by the ServerView Linux Server Integration Pack. The
process is an uninstallation of the old version followed by the installation of the new version.
The Management Packs of the ServerView Linux Server Integration Pack themselves are
usually update-compatible. New management packs can be imported on top of the old
management packs.
You can do this either manually or use the Fujitsu ServerView Administration Page.
See sv-intpack-scom-adm-en.pdf for its usage.
Use Windows’ un-installation feature to un-install the old ServerView Linux Server Integration
Pack.
Follow chapter 3.1 Installing ServerView Integration Pack to install the new ServerView Linux
Server Integration Pack.
3.3 Updating the ServerView Library Management Packs
The ServerView Library Management Pack and the ServerView Image Library Management Pack
are used and referenced by all Fujitsu ServerView Integration Packs for System Center
Operations Manager.
If a ServerView Integration Pack contains a newer version of one of the ServerView
Library Management Packs this new version can usually be imported into SCOM without
impact to any other Fujitsu ServerView Integration Management Packs.
In the rare case that a new version of one of the ServerView Library Management Packs
is not compatible with the old version, it is necessary to uninstall all Fujitsu
Management Packs including their Override Management Packs and reinstall all Fujitsu
Uninstalling ServerView Integration Pack
User Guide 11
Management Packs from the folder 'Management Packs' together with the updated
ServerView Library and ServerView Image Library Management Packs.
You can do this either manually or use the Fujitsu ServerView Administration Page.
See sv-intpack-scom-adm-en.pdf for its usage.
3.4 Uninstalling ServerView Integration Pack
The ServerView Linux Server Integration Pack is uninstalled via the following steps:
● Remove the corresponding override management packs, if any, from SCOM. To keep
existing override settings, e.g. to re-use in a new version, the override management
packs should be exported and saved.
● If any SNMP accounts have been associated with Fujitsu PRIMERGY Linux Servers SNMP Account profile run the Clear-SecureReferenceOverrideMP.ps1 script from the Tools folder
or manually perform these actions:
– Remove all associated Run As Accounts from the Fujitsu PRIMERGY Linux Servers
SNMP Account profile.
– Remove all references to any Fujitsu PRIMERGY Management Pack from the
Manifest section of the Microsoft.SystemCenter.SecureReferenceOverride.
– You need to export the Microsoft.SystemCenter.SecureReferenceOverride
management pack, delete the references and re-import it again.
● Remove the Fujitsu PRIMERGY Linux Server Management Packs from SCOM.
If other ServerView Integration Packs for System Center Operations Manager have
been installed, the ServerView Library Management Packs cannot be uninstalled.
● Uninstall the ServerView Linux Server Integration Pack from Windows.
To remove the Management Packs you need SCOM administrator rights.
The ServerView Integration Pack should also be removed from all SCOM Remote
Consoles.
For an update-installation removing the old installer package is sufficient.
Management Packs
User Guide 12
4 Properties of the ServerView Linux Server Integration Pack
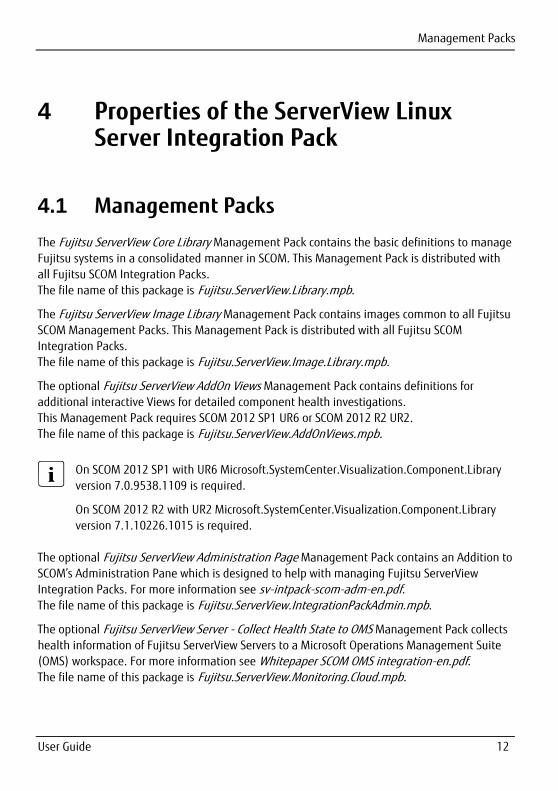
4.1 Management Packs
The Fujitsu ServerView Core Library Management Pack contains the basic definitions to manage
Fujitsu systems in a consolidated manner in SCOM. This Management Pack is distributed with
all Fujitsu SCOM Integration Packs.
The file name of this package is Fujitsu.ServerView.Library.mpb.
The Fujitsu ServerView Image Library Management Pack contains images common to all Fujitsu
SCOM Management Packs. This Management Pack is distributed with all Fujitsu SCOM
Integration Packs.
The file name of this package is Fujitsu.ServerView.Image.Library.mpb.
The optional Fujitsu ServerView AddOn Views Management Pack contains definitions for
additional interactive Views for detailed component health investigations.
This Management Pack requires SCOM 2012 SP1 UR6 or SCOM 2012 R2 UR2.
The file name of this package is Fujitsu.ServerView.AddOnViews.mpb.
On SCOM 2012 SP1 with UR6 Microsoft.SystemCenter.Visualization.Component.Library
version 7.0.9538.1109 is required.
On SCOM 2012 R2 with UR2 Microsoft.SystemCenter.Visualization.Component.Library
version 7.1.10226.1015 is required.
The optional Fujitsu ServerView Administration Page Management Pack contains an Addition to
SCOM’s Administration Pane which is designed to help with managing Fujitsu ServerView
Integration Packs. For more information see sv-intpack-scom-adm-en.pdf. The file name of this package is Fujitsu.ServerView.IntegrationPackAdmin.mpb.
The optional Fujitsu ServerView Server - Collect Health State to OMS Management Pack collects
health information of Fujitsu ServerView Servers to a Microsoft Operations Management Suite
(OMS) workspace. For more information see Whitepaper SCOM OMS integration-en.pdf. The file name of this package is Fujitsu.ServerView.Monitoring.Cloud.mpb.
Management Packs
User Guide 13
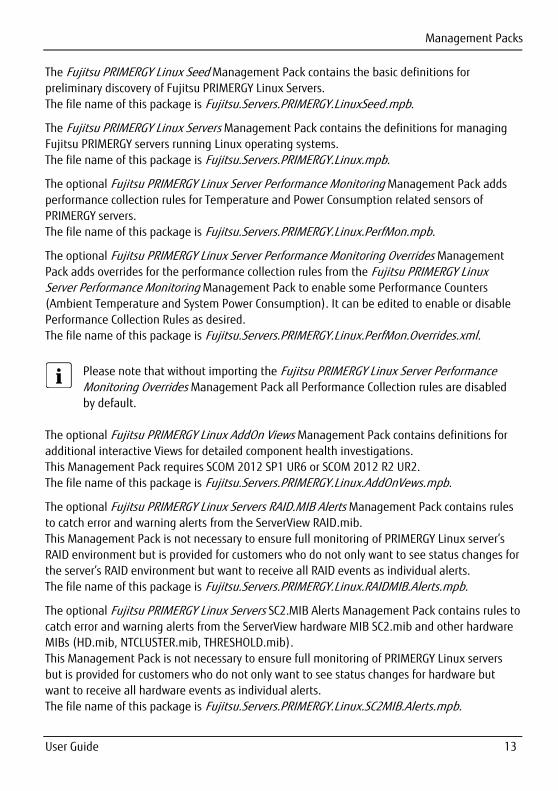
The Fujitsu PRIMERGY Linux Seed Management Pack contains the basic definitions for
preliminary discovery of Fujitsu PRIMERGY Linux Servers.
The file name of this package is Fujitsu.Servers.PRIMERGY.LinuxSeed.mpb.
The Fujitsu PRIMERGY Linux Servers Management Pack contains the definitions for managing
Fujitsu PRIMERGY servers running Linux operating systems.
The file name of this package is Fujitsu.Servers.PRIMERGY.Linux.mpb.
The optional Fujitsu PRIMERGY Linux Server Performance Monitoring Management Pack adds
performance collection rules for Temperature and Power Consumption related sensors of
PRIMERGY servers.
The file name of this package is Fujitsu.Servers.PRIMERGY.Linux.PerfMon.mpb.
The optional Fujitsu PRIMERGY Linux Server Performance Monitoring Overrides Management
Pack adds overrides for the performance collection rules from the Fujitsu PRIMERGY Linux Server Performance Monitoring Management Pack to enable some Performance Counters
(Ambient Temperature and System Power Consumption). It can be edited to enable or disable
Performance Collection Rules as desired.
The file name of this package is Fujitsu.Servers.PRIMERGY.Linux.PerfMon.Overrides.xml.
Please note that without importing the Fujitsu PRIMERGY Linux Server Performance Monitoring Overrides Management Pack all Performance Collection rules are disabled
by default.
The optional Fujitsu PRIMERGY Linux AddOn Views Management Pack contains definitions for
additional interactive Views for detailed component health investigations.
This Management Pack requires SCOM 2012 SP1 UR6 or SCOM 2012 R2 UR2.
The file name of this package is Fujitsu.Servers.PRIMERGY.Linux.AddOnVews.mpb.
The optional Fujitsu PRIMERGY Linux Servers RAID.MIB Alerts Management Pack contains rules
to catch error and warning alerts from the ServerView RAID.mib.
This Management Pack is not necessary to ensure full monitoring of PRIMERGY Linux server’s
RAID environment but is provided for customers who do not only want to see status changes for
the server’s RAID environment but want to receive all RAID events as individual alerts.
The file name of this package is Fujitsu.Servers.PRIMERGY.Linux.RAIDMIB.Alerts.mpb.
The optional Fujitsu PRIMERGY Linux Servers SC2.MIB Alerts Management Pack contains rules to
catch error and warning alerts from the ServerView hardware MIB SC2.mib and other hardware
MIBs (HD.mib, NTCLUSTER.mib, THRESHOLD.mib).
This Management Pack is not necessary to ensure full monitoring of PRIMERGY Linux servers
but is provided for customers who do not only want to see status changes for hardware but
want to receive all hardware events as individual alerts.
The file name of this package is Fujitsu.Servers.PRIMERGY.Linux.SC2MIB.Alerts.mpb.
PRIMERGY server computer groups
User Guide 14
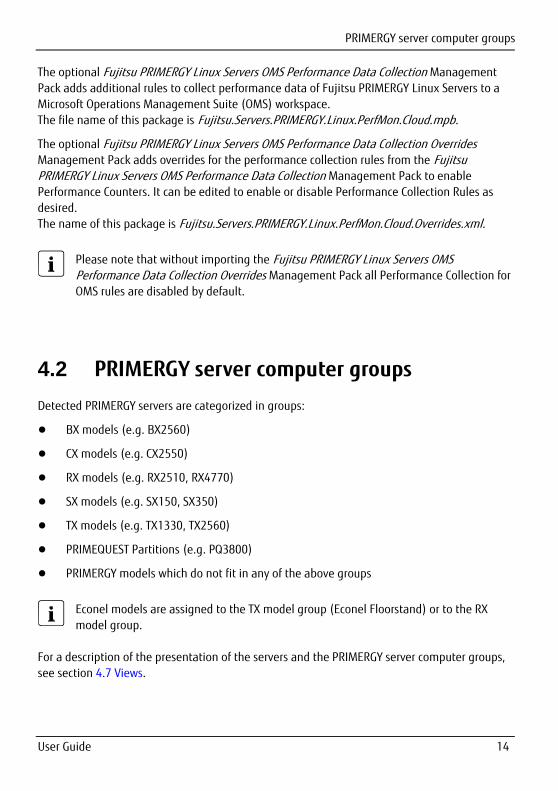
The optional Fujitsu PRIMERGY Linux Servers OMS Performance Data Collection Management
Pack adds additional rules to collect performance data of Fujitsu PRIMERGY Linux Servers to a
Microsoft Operations Management Suite (OMS) workspace.
The file name of this package is Fujitsu.Servers.PRIMERGY.Linux.PerfMon.Cloud.mpb.
The optional Fujitsu PRIMERGY Linux Servers OMS Performance Data Collection Overrides
Management Pack adds overrides for the performance collection rules from the Fujitsu PRIMERGY Linux Servers OMS Performance Data Collection Management Pack to enable
Performance Counters. It can be edited to enable or disable Performance Collection Rules as
desired.
The name of this package is Fujitsu.Servers.PRIMERGY.Linux.PerfMon.Cloud.Overrides.xml.
Please note that without importing the Fujitsu PRIMERGY Linux Servers OMS Performance Data Collection Overrides Management Pack all Performance Collection for
OMS rules are disabled by default.
4.2 PRIMERGY server computer groups
Detected PRIMERGY servers are categorized in groups:
● BX models (e.g. BX2560)
● CX models (e.g. CX2550)
● RX models (e.g. RX2510, RX4770)
● SX models (e.g. SX150, SX350)
● TX models (e.g. TX1330, TX2560)
● PRIMEQUEST Partitions (e.g. PQ3800)
● PRIMERGY models which do not fit in any of the above groups
Econel models are assigned to the TX model group (Econel Floorstand) or to the RX
model group.
For a description of the presentation of the servers and the PRIMERGY server computer groups,
see section 4.7 Views.
Discovering and monitoring PRIMERGY servers
User Guide 15
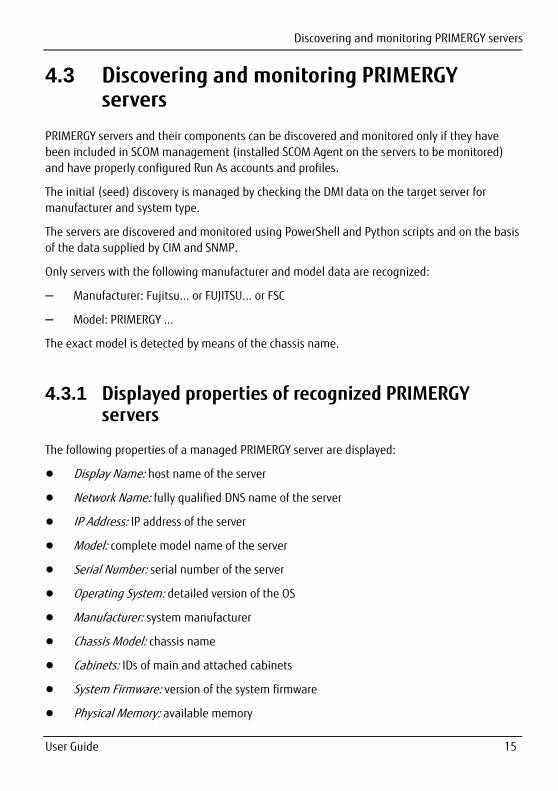
4.3 Discovering and monitoring PRIMERGY servers
PRIMERGY servers and their components can be discovered and monitored only if they have
been included in SCOM management (installed SCOM Agent on the servers to be monitored)
and have properly configured Run As accounts and profiles.
The initial (seed) discovery is managed by checking the DMI data on the target server for
manufacturer and system type.
The servers are discovered and monitored using PowerShell and Python scripts and on the basis
of the data supplied by CIM and SNMP.
Only servers with the following manufacturer and model data are recognized:
– Manufacturer: Fujitsu... or FUJITSU... or FSC
– Model: PRIMERGY ...
The exact model is detected by means of the chassis name.
4.3.1 Displayed properties of recognized PRIMERGY servers
The following properties of a managed PRIMERGY server are displayed:
● Display Name: host name of the server
● Network Name: fully qualified DNS name of the server
● IP Address: IP address of the server
● Model: complete model name of the server
● Serial Number: serial number of the server
● Operating System: detailed version of the OS
● Manufacturer: system manufacturer
● Chassis Model: chassis name
● Cabinets: IDs of main and attached cabinets
● System Firmware: version of the system firmware
● Physical Memory: available memory
Discovering and monitoring server components
User Guide 16
● Disk Size: total capacity of the partitions configured as logical disks
● Monitoring Agents: name and version of the ServerView Agents
● BMC Address: IPv4 address of the iRMC (if available)
● BMC DNS name: Fully Qualified Domain Name (if available and if DNS enabled on iRMC)
The properties of a server which are discovered are displayed in the Detail View below a Status
or a Diagram view.
4.3.2 Health state of a PRIMERGY server
The health state of a PRIMERGY server is determined by the state of its hardware and software
components. The component with the most severe error determines the final health state of
the PRIMERGY server. This means component redundancy is not supported.
This state is also passed on to the model group and the PRIMERGY server group (roll-up
monitor).
4.4 Discovering and monitoring server components
The server components are discovered and monitored with scripts on the basis of data retrieved
via the ServerView Agents’ CIM providers, via ServerView RAID and SNMP.
Only components which exist are discovered and monitored. If, for example, no fans can be
detected (e.g. in a blade server where fans are managed by the chassis), the fan subsystem is
not displayed in the Diagram View. Component groups which do not contain components with
a usable state at discovery time are not displayed, either.
Instances of the same type are combined in groups (collections) and displayed together (e.g.
all CPUs of a server belong to the processors group). In the case of an error the faulty
component is displayed with Critical or Warning state and its health can be examined in the
Health Explorer. The instance with the severest error determines the overall state of the group.
By default events with the severity Critical generate an alert and events with the severity
Warning and Informational do not generate an alert. This default setting can be overridden.
Discovering and monitoring server components
User Guide 17
4.4.1 Discovering subsystems and components
The subsystems and components of a PRIMERGY server which are listed below can be
discovered and monitored.
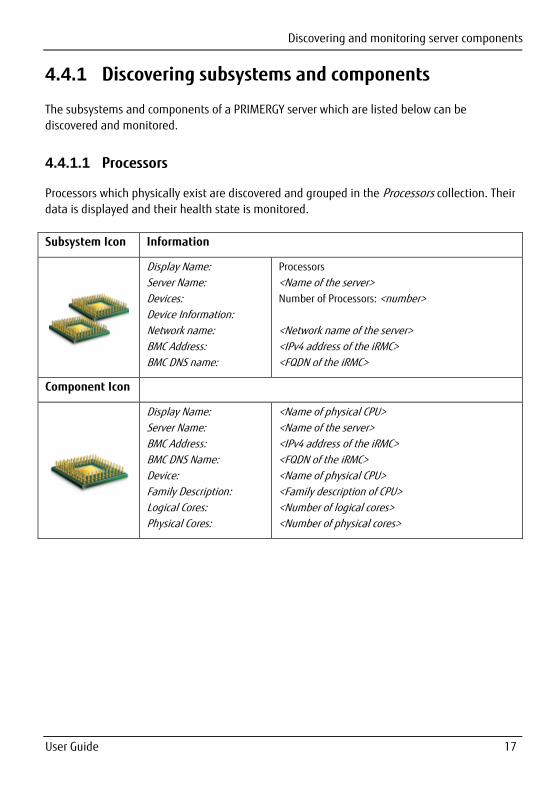
4.4.1.1 Processors
Processors which physically exist are discovered and grouped in the Processors collection. Their
data is displayed and their health state is monitored.
Subsystem Icon Information
Display Name:
Server Name:
Devices:
Device Information:
Network name:
BMC Address:
BMC DNS name:
Processors
<Name of the server>
Number of Processors: <number>
<Network name of the server>
<IPv4 address of the iRMC>
<FQDN of the iRMC>
Component Icon
Display Name:
Server Name:
BMC Address:
BMC DNS Name:
Device:
Family Description:
Logical Cores:
Physical Cores:
<Name of physical CPU>
<Name of the server>
<IPv4 address of the iRMC>
<FQDN of the iRMC>
<Name of physical CPU>
<Family description of CPU>
<Number of logical cores>
<Number of physical cores>
Discovering and monitoring server components
User Guide 18
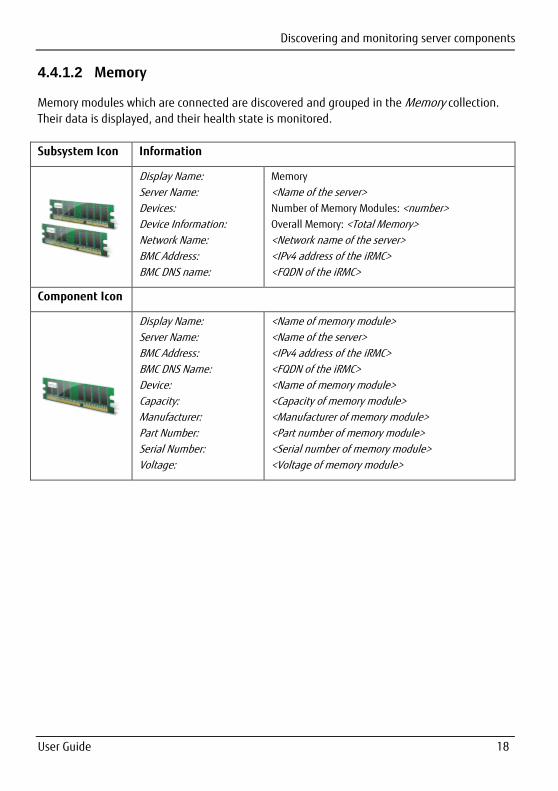
4.4.1.2 Memory
Memory modules which are connected are discovered and grouped in the Memory collection.
Their data is displayed, and their health state is monitored.
Subsystem Icon Information
Display Name:
Server Name:
Devices:
Device Information:
Network Name:
BMC Address:
BMC DNS name:
Memory
<Name of the server>
Number of Memory Modules: <number>
Overall Memory: <Total Memory>
<Network name of the server>
<IPv4 address of the iRMC>
<FQDN of the iRMC>
Component Icon
Display Name:
Server Name:
BMC Address:
BMC DNS Name:
Device:
Capacity:
Manufacturer:
Part Number:
Serial Number:
Voltage:
<Name of memory module>
<Name of the server>
<IPv4 address of the iRMC>
<FQDN of the iRMC>
<Name of memory module>
<Capacity of memory module>
<Manufacturer of memory module>
<Part number of memory module>
<Serial number of memory module>
<Voltage of memory module>
Discovering and monitoring server components
User Guide 19
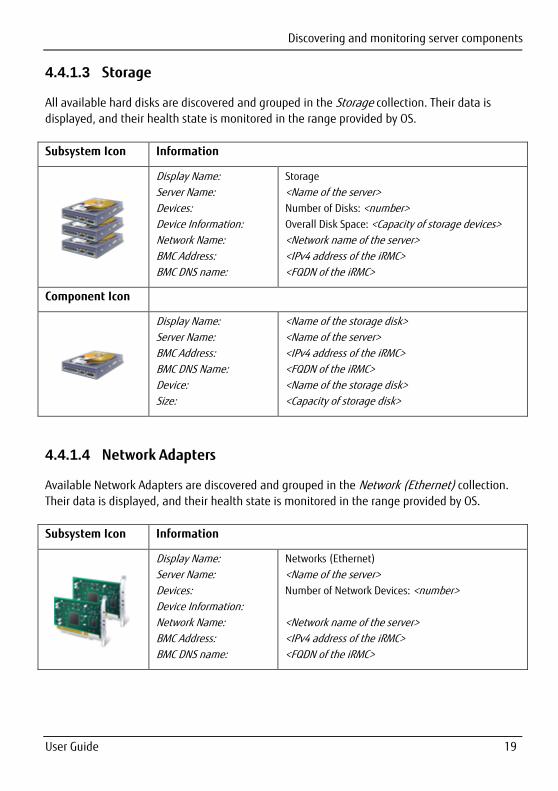
4.4.1.3 Storage
All available hard disks are discovered and grouped in the Storage collection. Their data is
displayed, and their health state is monitored in the range provided by OS.
Subsystem Icon Information
Display Name:
Server Name:
Devices:
Device Information:
Network Name:
BMC Address:
BMC DNS name:
Storage
<Name of the server>
Number of Disks: <number>
Overall Disk Space: <Capacity of storage devices>
<Network name of the server>
<IPv4 address of the iRMC>
<FQDN of the iRMC>
Component Icon
Display Name:
Server Name:
BMC Address:
BMC DNS Name:
Device:
Size:
<Name of the storage disk>
<Name of the server>
<IPv4 address of the iRMC>
<FQDN of the iRMC>
<Name of the storage disk>
<Capacity of storage disk>
4.4.1.4 Network Adapters
Available Network Adapters are discovered and grouped in the Network (Ethernet) collection.
Their data is displayed, and their health state is monitored in the range provided by OS.
Subsystem Icon Information
Display Name:
Server Name:
Devices:
Device Information:
Network Name:
BMC Address:
BMC DNS name:
Networks (Ethernet)
<Name of the server>
Number of Network Devices: <number>
<Network name of the server>
<IPv4 address of the iRMC>
<FQDN of the iRMC>
Discovering and monitoring server components
User Guide 20
Component Icon
Display name:
Server Name:
BMC Address:
BMC DNS Name:
Device:
MAC Address:
<Name of the network device>
<Name of the server>
<IPv4 address of the iRMC>
<FQDN of the iRMC>
<Name of the network device>
<MAC address>
4.4.1.5 iRMC (integrated Remote Management Controller)
The iRMC Management Controller is discovered, its data is displayed and its health state is
monitored.
Subsystem Icon Information
Display Name:
Server Name:
Devices:
Device Information:
BMC Address:
BMC DNS name:
Firmware Version:
Management Controller
<Name of the server>
<Type>
Firmware Version: <Version>
<IPv4 address of the iRMC>
<FQDN of the iRMC>
<Version>
4.4.1.6 Fans (Cooling)
Connected fan modules of PRIMERGY servers and their connected extension modules are
discovered and grouped in the Fans (Cooling) collection. Their data is displayed and their
health state is monitored.
Subsystem Icon Information
Display Name:
Server Name:
Devices:
Device Information:
Network Name:
BMC Address:
BMC DNS name:
Fans (Cooling)
<Name of the server>
Number of Fans: <number>
<Network name of the server>
<IPv4 address of the iRMC>
<FQDN of the iRMC>
Discovering and monitoring server components
User Guide 21
Component Icon
Display Name:
Server Name:
BMC Address:
BMC DNS Name:
Device:
Active Cooling:
Variable Speed:
<Name of the fan>
<Name of the server>
<IPv4 address of the iRMC>
<FQDN of the iRMC>
<Name of the fan>
<True/False>
<True/False>
4.4.1.7 Temperature Sensors
Temperature sensors which physically exist are discovered and grouped in the Temperatures
collection. Their data is displayed, and their health state is monitored.
Subsystem Icon Information
Display Name:
Server Name:
Devices:
Device Information:
Network Name:
BMC Address:
BMC DNS name:
Temperatures
<Name of the server>
Number of Temperature Sensors: <number>
<Network name of the server>
<IPv4 address of the iRMC>
<FQDN of the iRMC>
Component Icon
Display Name:
Server Name:
BMC Address:
BMC DNS Name:
Device:
<Name of the temperature sensor>
<Name of the server>
<IPv4 address of the iRMC>
<FQDN of the iRMC>
<Name of the temperature sensor>
Discovering and monitoring server components
User Guide 22
4.4.1.8 Power Supplies
Power supply modules which physically exist are discovered and grouped in the Power Supplies
collection. Their data is displayed, and their health state is monitored.
Subsystem Icon Information
Display Name:
Server Name:
Devices:
Device Information:
Network Name:
BMC Address:
BMC DNS name:
Power Supplies
<Name of the server>
Number of PowerSupplies: <number>
<Network name of the server>
<IPv4 address of the iRMC>
<FQDN of the iRMC>
Component Icon
Display Name:
Server Name:
BMC Address:
BMC DNS Name:
Device:
<Name of the power supply>
<Name of the server>
<IPv4 address of the iRMC>
<FQDN of the iRMC>
<Name of the power supply>
4.4.1.9 Power Consumption
Power Consumption is monitored if the iRMC supports power consumption monitoring and if
the iRMC Power Control Mode is set to Power Limit.
Subsystem Icon Information
Display Name:
Server Name:
Devices:
Device Information:
Network Name:
BMC Address:
BMC DNS name:
Power Consumption
<Name of the server>
<Name of devices>
<Sensor names>
<Network name of the server>
<IPv4 address of the iRMC>
<FQDN of the iRMC>
Discovering and monitoring server components
User Guide 23
4.4.1.10 Voltage Sensors
Voltage sensors which physically exist are discovered and grouped in the Voltages collection.
Their data is displayed, and their health state is monitored.
Subsystem Icon Information
Display Name:
Server Name:
Devices:
Device Information:
Network Name:
BMC Address:
BMC DNS name:
Voltages
<Name of the server>
Number of Voltage Sensors: <number>
<Network name of the server>
<IPv4 address of the iRMC>
<FQDN of the iRMC>
Component Icon
Display Name:
Server Name:
BMC Address:
BMC DNS Name:
Device:
<Name of the voltage sensor>
<Name of the server>
<IPv4 address of the iRMC>
<FQDN of the iRMC>
<Name of the voltage sensor>
4.4.1.11 RAID Subsystem
If ServerView RAID Agent is installed and configured the RAID Subsystem collection is
discovered. It contains Adapters, Logical Drives and Physical Disks. Their data is displayed, and
their health state is monitored.
Subsystem Icon Information
Display Name:
Server Name:
Devices:
Device Information:
Network Name:
BMC Address:
BMC DNS name:
RAID Subsystem
<Name of the server>
Number of Raid Controllers: <number>
<Network name of the server>
<IPv4 address of the iRMC>
<FQDN of the iRMC>
Discovering and monitoring server components
User Guide 24
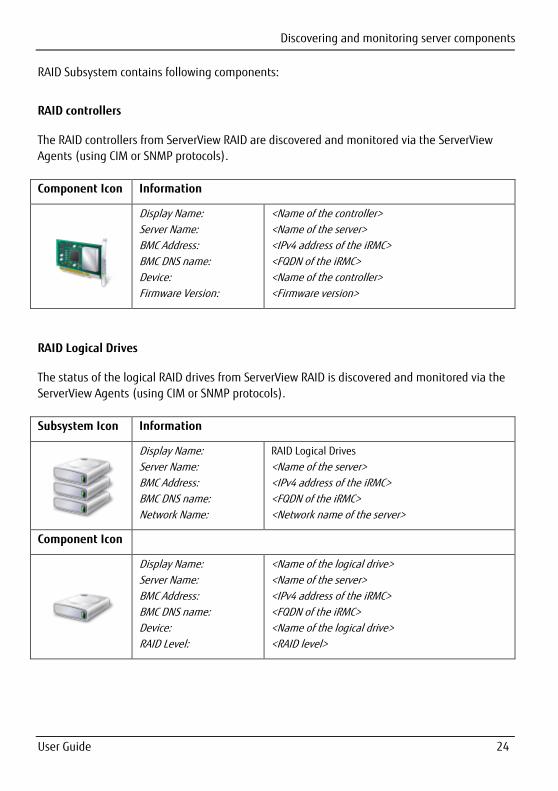
RAID Subsystem contains following components:
RAID controllers
The RAID controllers from ServerView RAID are discovered and monitored via the ServerView
Agents (using CIM or SNMP protocols).
Component Icon Information
Display Name:
Server Name:
BMC Address:
BMC DNS name:
Device:
Firmware Version:
<Name of the controller>
<Name of the server>
<IPv4 address of the iRMC>
<FQDN of the iRMC>
<Name of the controller>
<Firmware version>
RAID Logical Drives
The status of the logical RAID drives from ServerView RAID is discovered and monitored via the
ServerView Agents (using CIM or SNMP protocols).
Subsystem Icon Information
Display Name:
Server Name:
BMC Address:
BMC DNS name:
Network Name:
RAID Logical Drives
<Name of the server>
<IPv4 address of the iRMC>
<FQDN of the iRMC>
<Network name of the server>
Component Icon
Display Name:
Server Name:
BMC Address:
BMC DNS name:
Device:
RAID Level:
<Name of the logical drive>
<Name of the server>
<IPv4 address of the iRMC>
<FQDN of the iRMC>
<Name of the logical drive>
<RAID level>
Discovering and monitoring server components
User Guide 25
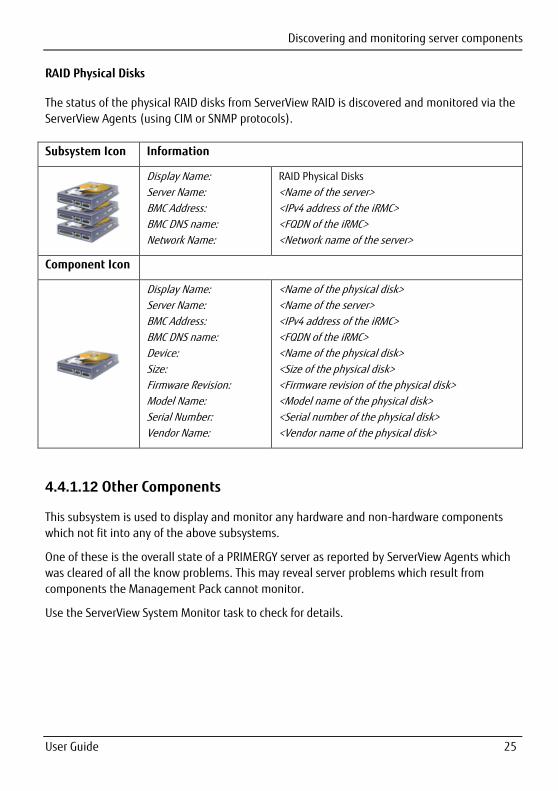
RAID Physical Disks
The status of the physical RAID disks from ServerView RAID is discovered and monitored via the
ServerView Agents (using CIM or SNMP protocols).
Subsystem Icon Information
Display Name:
Server Name:
BMC Address:
BMC DNS name:
Network Name:
RAID Physical Disks
<Name of the server>
<IPv4 address of the iRMC>
<FQDN of the iRMC>
<Network name of the server>
Component Icon
Display Name:
Server Name:
BMC Address:
BMC DNS name:
Device:
Size:
Firmware Revision:
Model Name:
Serial Number:
Vendor Name:
<Name of the physical disk>
<Name of the server>
<IPv4 address of the iRMC>
<FQDN of the iRMC>
<Name of the physical disk>
<Size of the physical disk>
<Firmware revision of the physical disk>
<Model name of the physical disk>
<Serial number of the physical disk>
<Vendor name of the physical disk>
4.4.1.12 Other Components
This subsystem is used to display and monitor any hardware and non-hardware components
which not fit into any of the above subsystems.
One of these is the overall state of a PRIMERGY server as reported by ServerView Agents which
was cleared of all the know problems. This may reveal server problems which result from
components the Management Pack cannot monitor.
Use the ServerView System Monitor task to check for details.
Discovering and monitoring server components
User Guide 26
Subsystem Icon Information
Display Name:
Server Name:
Devices:
Device Information:
Network Name:
BMC Address:
BMC DNS name:
Other Components
<Name of the server>
Number of Components: <number>
<Network name of the server>
<IPv4 address of the iRMC>
<FQDN of the iRMC>
Component Icons
Display Name:
Server Name:
BMC Address:
BMC DNS name:
Device:
BIOS Selftest
<Name of the server>
<IPv4 address of the iRMC>
<FQDN of the iRMC>
BIOS Selftest
Display Name:
Server Name:
BMC Address:
BMC DNS name:
Device:
ServerView Overall State
<Name of the server>
<IPv4 address of the iRMC>
<FQDN of the iRMC>
ServerView Overall State
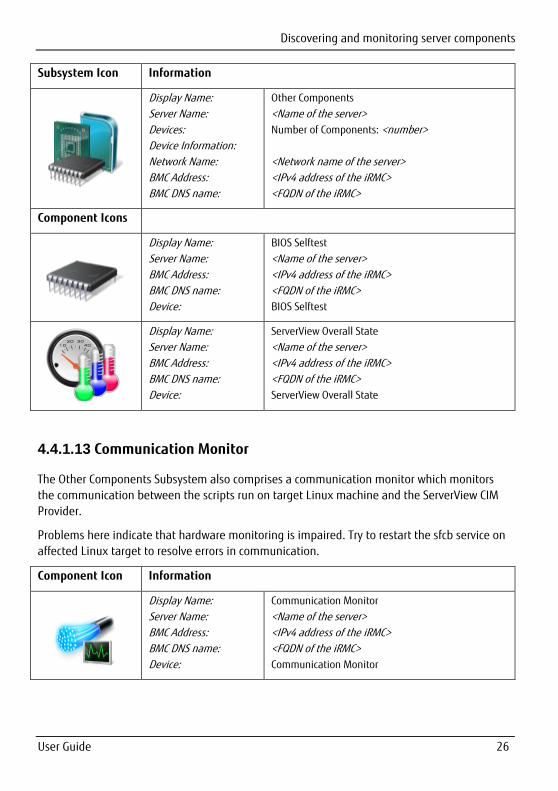
4.4.1.13 Communication Monitor
The Other Components Subsystem also comprises a communication monitor which monitors
the communication between the scripts run on target Linux machine and the ServerView CIM
Provider.
Problems here indicate that hardware monitoring is impaired. Try to restart the sfcb service on
affected Linux target to resolve errors in communication.
Component Icon Information
Display Name:
Server Name:
BMC Address:
BMC DNS name:
Device:
Communication Monitor
<Name of the server>
<IPv4 address of the iRMC>
<FQDN of the iRMC>
Communication Monitor
Discovering and monitoring server components
User Guide 27
4.4.2 Updating the state of the subsystems
By default, the configuration of the components of a PRIMERGY server is discovered
automatically every 4 hours. To change the component discovery interval force an update by
performing a (temporary) override.
Alternatively put the server in maintenance mode for a brief period. Once the maintenance
mode has elapsed, SCOM automatically discovers the hardware components again.
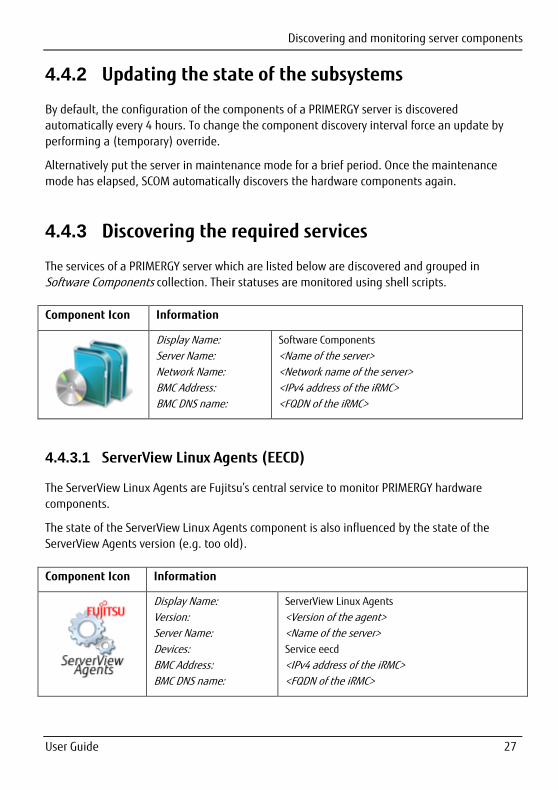
4.4.3 Discovering the required services
The services of a PRIMERGY server which are listed below are discovered and grouped in
Software Components collection. Their statuses are monitored using shell scripts.
Component Icon Information
Display Name:
Server Name:
Network Name:
BMC Address:
BMC DNS name:
Software Components
<Name of the server>
<Network name of the server>
<IPv4 address of the iRMC>
<FQDN of the iRMC>
4.4.3.1 ServerView Linux Agents (EECD)
The ServerView Linux Agents are Fujitsu’s central service to monitor PRIMERGY hardware
components.
The state of the ServerView Linux Agents component is also influenced by the state of the
ServerView Agents version (e.g. too old).
Component Icon Information
Display Name:
Version:
Server Name:
Devices:
BMC Address:
BMC DNS name:
ServerView Linux Agents
<Version of the agent>
<Name of the server>
Service eecd
<IPv4 address of the iRMC>
<FQDN of the iRMC>
Discovering and monitoring server components
User Guide 28
Version Icon Information
Display Name:
Server Name:
BMC Address:
BMC DNS name:
Device:
Version:
ServerView Agents Version
<Name of the server>
<IPv4 address of the iRMC>
<FQDN of the iRMC>
ServerView Agents Version
<ServerView Linux Agents Version>
4.4.3.2 Linux CIMOM (SFCB or OpenPegasus)
The CIMOM service (SFCB or OpenPegasus) is used to query Fujitsu’s CIM Provider.
Component Icon Information
Display Name:
Version:
Server Name:
Devices:
BMC Address:
BMC DNS name:
Linux CIMOM (SFCB or OpenPegasus)
<SFCB or OpenPegasus version if available>
<Name of the server>
Service sfcbd/cimserver
<IPv4 address of the iRMC>
<FQDN of the iRMC>
4.4.3.3 Linux SNMP daemon
SNMP service is used to monitor all other Fujitsu components that are not available through
CIM Provider.
Component Icon Information
Display Name:
Version:
Server Name:
Devices:
BMC Address:
BMC DNS name:
SNMP daemon
<Version>
<Name of the server>
Service snmpd
<IPv4 address of the iRMC>
<FQDN of the iRMC>
Discovering and monitoring server components
User Guide 29
4.4.3.4 ServerView RAID
ServerView RAID manages and monitors all RAID controllers of PRIMERGY servers.
The state of the ServerView RAID component is also influenced by the state of the ServerView
RAID version (e.g. too old).
Component Icon Information
Display Name:
Version:
Server Name:
Devices:
BMC Address:
BMC DNS name:
ServerView RAID daemon
<Version>
<Name of the server>
Service amDaemon
<IPv4 address of the iRMC>
<FQDN of the iRMC>
Version info Icon Information
Display Name:
Server Name:
BMC Address:
BMC DNS name:
Device:
Version:
ServerView RAID Version
<Name of the server>
<IPv4 address of the iRMC>
<FQDN of the iRMC>
ServerView RAID Version
<ServerView RAID Version>
4.4.4 Monitoring components
Components are monitored by means of PowerShell and Python scripts. The monitoring scripts
are called at regular intervals (every 300 seconds; settable) and check the state of the
components. Each component is monitored by its own monitor using the same script at the
same interval.
This enables SCOM to cook down the monitoring process to a single script call and collect all
component health states by executing the monitoring script only once for each Linux target
server.
Script calls place a considerable load on SCOM.
If the monitoring intervals of single components are changed to different values this
breaks down SCOMs CookDown feature and results in script calls in various intervals.
Discovering and monitoring server components
User Guide 30
Keep this in mind when considering changing the monitoring intervals.
4.4.5 Monitoring services
The required services are monitored by two-state monitors. The health state of the services is
displayed in the Health Explorer.
4.4.5.1 ServerView Linux Agents (EECD)
The state of this software component is determined by the following service:
– Environment Enclosure Control Daemon
If this service is not running the state of the ServerView Linux Agents component is set to
Critical and a corresponding alert is generated. After that a recovery task, which tries to start
the failed service, is automatically run.
If the ServerView Linux Agents are in Critical state, Fujitsu PRIMERGY server monitoring
is no longer possible.
When the component returns to the OK state, the alert is resolved and no longer displayed in the Active Alerts view (see 4.7.4 Active Alerts View).
4.4.5.2 Linux CIMOM (SFCB or OpenPegasus)
The state of this software component is determined by one of the following services:
– Small Footprint CIM Broker (SFCB)
– OpenPegasus
If this service is not running or not responding, the state of the CIMOM component is set to
Critical.
If the monitoring function reports the Critical state, a corresponding alert is generated and a
recovery task, which tries to start the failed service, is automatically run.
If the Linux CIMOM service is in Critical state, Fujitsu PRIMERGY server monitoring is
limited to SNMP components.
Performance Data Collection
User Guide 31
When the component returns to the OK state, the alert is resolved and no longer displayed in the Active Alerts view (see 4.7.4 Active Alerts View).
4.4.5.3 Linux SNMP daemon
The state of this software component is determined by the following service:
– Simple Network Management Protocol
If the monitoring function reports the Critical state, a corresponding alert is generated. After
that a recovery task, which tries to start the failed service, is automatically run.
If the SNMP daemon is in Critical state, monitoring the PRIMERGY server is limited to
CIM components.
When the component returns to the OK state, the alert is resolved and no longer displayed in the Active Alerts view (see 4.7.4 Active Alerts View).
4.4.5.4 ServerView RAID Manager
The state of this software component is determined by the following service:
– amDaemon
If the monitoring function reports the Critical state, a corresponding alert is generated. After
that a recovery task, which tries to start the failed service, is automatically run.
If the amDaemon is in Critical state, monitoring the RAID Subsystem is no longer
possible.
When the component returns to the OK state, the alert is resolved and no longer displayed in the Active Alerts view (see 4.7.4 Active Alerts View).
4.5 Performance Data Collection
The Fujitsu PRIMERGY Linux Server Performance Monitoring Management Pack adds various
data collection rules to SCOM which are by default disabled. To enable the most interesting
performance collection rules (Ambient Temperature and System Power Consumption) the
Fujitsu PRIMERGY Linux Server Performance Monitoring Overrides Management Pack must be
installed. It can be edited to enable or disable Performance Collection Rules as desired.
Performance Data Collection
User Guide 32
Please note that without importing the Fujitsu PRIMERGY Linux Server Performance Monitoring Overrides Management Pack all Performance Collection rules are disabled
by default.
When enabled the rules collect performance data by means of Python scripts. The collected
performance data are then visualized and filtered using standard SCOM Performance Views
supplied with the Management Pack.
While the sensors themselves are evaluated by the main management pack’s health state
monitors, collecting and storing current sensor readings can be useful for long time trend
analysis and similar scenarios, e.g. finding peak or weekly re-occurring workload areas within a
data center and proactive actions such as cooling adjustments. Another scenario might be
finding temperature hot spot locations within the data center by comparing performance data
from multiple servers in different locations of the data center.
4.5.1 Temperature Performance Data
The Fujitsu Servers PRIMERGY Linux Server Performance Monitoring Management Pack imports
the following temperature collection rules:
● Fujitsu Linux Server 'Ambient' Temperature Performance Data Collection Rule
This rule collects data from the server’s ‘Ambient’ or ‘Air Inlet’ temperature sensor.
● Fujitsu Linux Server 'Processor' Temperature Performance Data Collection Rule
This rule collects data from all available ‘Processor’ temperature sensors of the server.
● Fujitsu Linux Server 'Memory' Temperature Performance Data Collection Rule
This rule collects data from all available ‘Memory’ temperature sensors of the server.
● Fujitsu Linux Server 'Power Supply' Temperature Performance Data Collection Rule This rule collects data from all available ‘Power Supply’ temperature sensors of the server.
● Fujitsu Linux Server 'System Board' Temperature Performance Data Collection Rule This rule collects data from all available temperature sensors on the server’s ‘system
board.
● Fujitsu Linux Server 'Other' Temperature Performance Data Collection Rule This rule collects data from all other available temperature sensors of the server.
Performance Data Collection for OMS
User Guide 33
4.5.2 Power Consumption Performance Data
The Fujitsu Servers PRIMERGY Linux Server Performance Monitoring Management Pack imports
the following power consumption collection rules:
● Fujitsu Linux Server 'Total' Power Consumption Performance Data Collection Rule
This rule collects data from the main power consumption sensors of the server.
● Fujitsu Linux Server 'System Chassis' Power Consumption Performance Data Collection
Rule for Multi Node Systems
This rule collects data from the main power consumption sensors of the chassis the server
is housed in. The rule applies to BX and CX servers.
● Fujitsu Linux Server 'Processor' Power Consumption Performance Data Collection Rule This rule collects data from the available ‘Processor’ power consumption sensors of the
server.
● Fujitsu Linux Server 'Power Supply' Power Consumption Performance Data Collection Rule This rule collects data from the available 'Power Supply' power consumption sensors of
the server.
● Fujitsu Linux Server 'Other' Power Consumption Performance Data Collection Rule This rule collects data from the all other available power consumption sensors of the
server.
4.6 Performance Data Collection for OMS
The Fujitsu PRIMERGY Linux Servers OMS Performance Data Collection adds various data
collection rules for OMS to SCOM which are by default disabled. It requires the Fujitsu ServerView Server - Collect Health State to OMS Management Pack to be installed.
To enable any performance collection rules the Fujitsu PRIMERGY Linux Servers Performance Monitoring Overrides Management Pack must be installed. It can be edited to enable or disable
Performance Collection Rules as desired.
For more information about forwarding data to an OMS work space see Whitepaper SCOM OMS integration-en.pdf.
Views
User Guide 34
4.7 Views
The health state in all views is displayed by the usual health state icons of the Operations Manager.
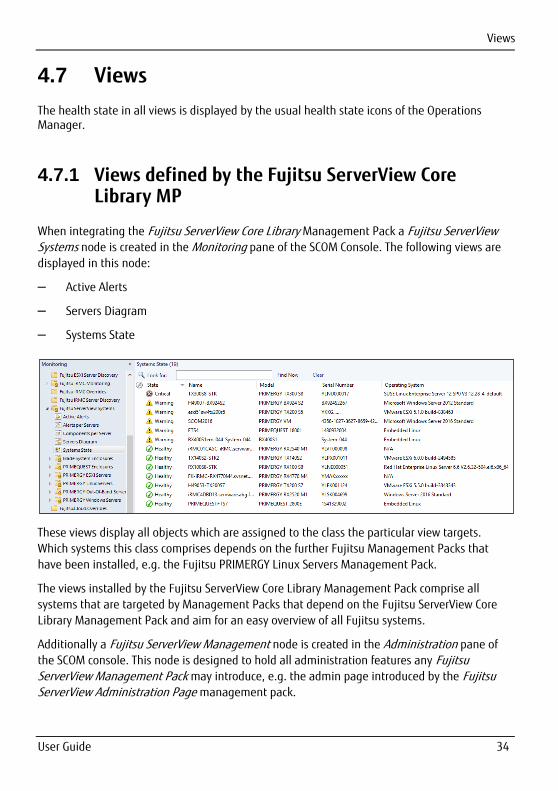
4.7.1 Views defined by the Fujitsu ServerView Core Library MP
When integrating the Fujitsu ServerView Core Library Management Pack a Fujitsu ServerView Systems node is created in the Monitoring pane of the SCOM Console. The following views are
displayed in this node:
– Active Alerts
– Servers Diagram
– Systems State
These views display all objects which are assigned to the class the particular view targets.
Which systems this class comprises depends on the further Fujitsu Management Packs that
have been installed, e.g. the Fujitsu PRIMERGY Linux Servers Management Pack.
The views installed by the Fujitsu ServerView Core Library Management Pack comprise all
systems that are targeted by Management Packs that depend on the Fujitsu ServerView Core
Library Management Pack and aim for an easy overview of all Fujitsu systems.
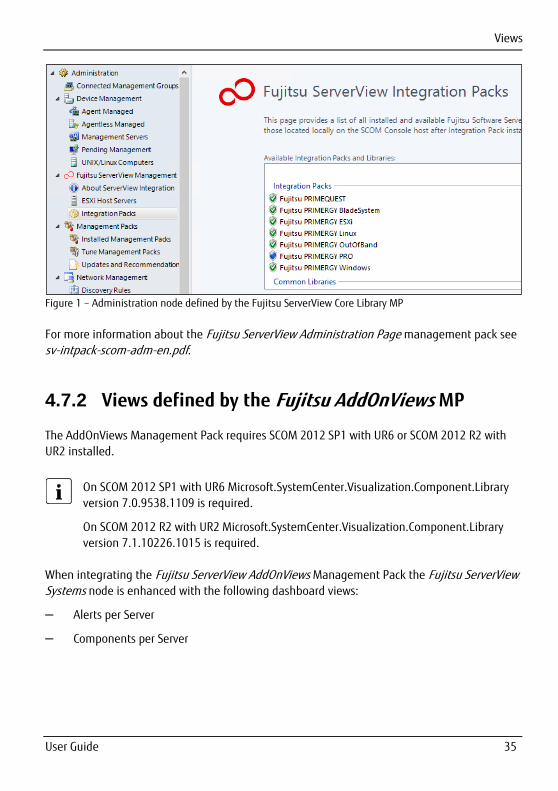
Additionally a Fujitsu ServerView Management node is created in the Administration pane of
the SCOM console. This node is designed to hold all administration features any Fujitsu ServerView Management Pack may introduce, e.g. the admin page introduced by the Fujitsu ServerView Administration Page management pack.
Views
User Guide 35
Figure 1 – Administration node defined by the Fujitsu ServerView Core Library MP
For more information about the Fujitsu ServerView Administration Page management pack see
sv-intpack-scom-adm-en.pdf.
4.7.2 Views defined by the Fujitsu AddOnViews MP
The AddOnViews Management Pack requires SCOM 2012 SP1 with UR6 or SCOM 2012 R2 with
UR2 installed.
On SCOM 2012 SP1 with UR6 Microsoft.SystemCenter.Visualization.Component.Library
version 7.0.9538.1109 is required.
On SCOM 2012 R2 with UR2 Microsoft.SystemCenter.Visualization.Component.Library
version 7.1.10226.1015 is required.
When integrating the Fujitsu ServerView AddOnViews Management Pack the Fujitsu ServerView Systems node is enhanced with the following dashboard views:
– Alerts per Server
– Components per Server
Views
User Guide 36
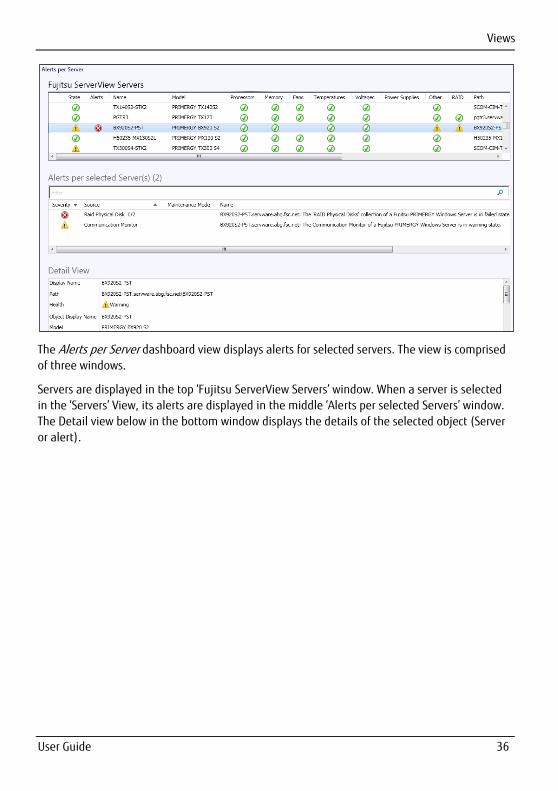
The Alerts per Server dashboard view displays alerts for selected servers. The view is comprised
of three windows.
Servers are displayed in the top ‘Fujitsu ServerView Servers’ window. When a server is selected
in the ‘Servers’ View, its alerts are displayed in the middle ‘Alerts per selected Servers’ window.
The Detail view below in the bottom window displays the details of the selected object (Server
or alert).
Views
User Guide 37
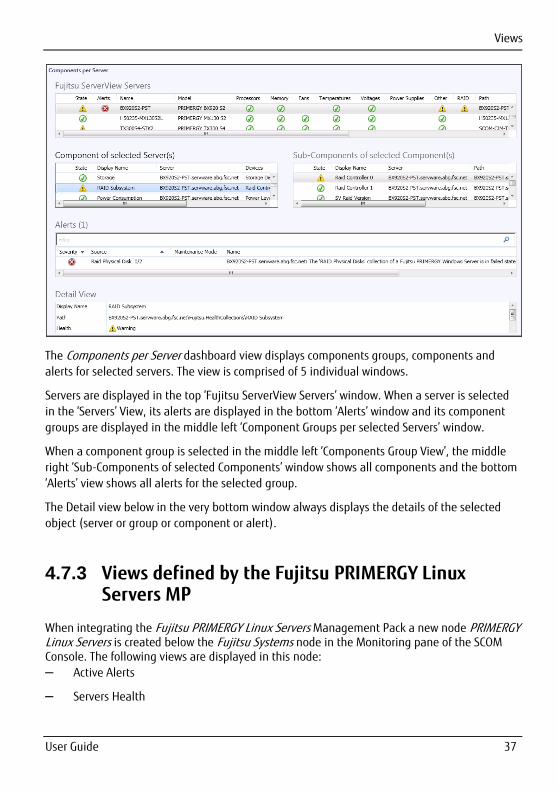
The Components per Server dashboard view displays components groups, components and
alerts for selected servers. The view is comprised of 5 individual windows.
Servers are displayed in the top ‘Fujitsu ServerView Servers’ window. When a server is selected
in the ‘Servers’ View, its alerts are displayed in the bottom ‘Alerts’ window and its component
groups are displayed in the middle left ‘Component Groups per selected Servers’ window.
When a component group is selected in the middle left ‘Components Group View’, the middle
right ‘Sub-Components of selected Components’ window shows all components and the bottom
‘Alerts’ view shows all alerts for the selected group.
The Detail view below in the very bottom window always displays the details of the selected
object (server or group or component or alert).
4.7.3 Views defined by the Fujitsu PRIMERGY Linux Servers MP
When integrating the Fujitsu PRIMERGY Linux Servers Management Pack a new node PRIMERGY Linux Servers is created below the Fujitsu Systems node in the Monitoring pane of the SCOM Console. The following views are displayed in this node:
– Active Alerts
– Servers Health
Views
User Guide 38
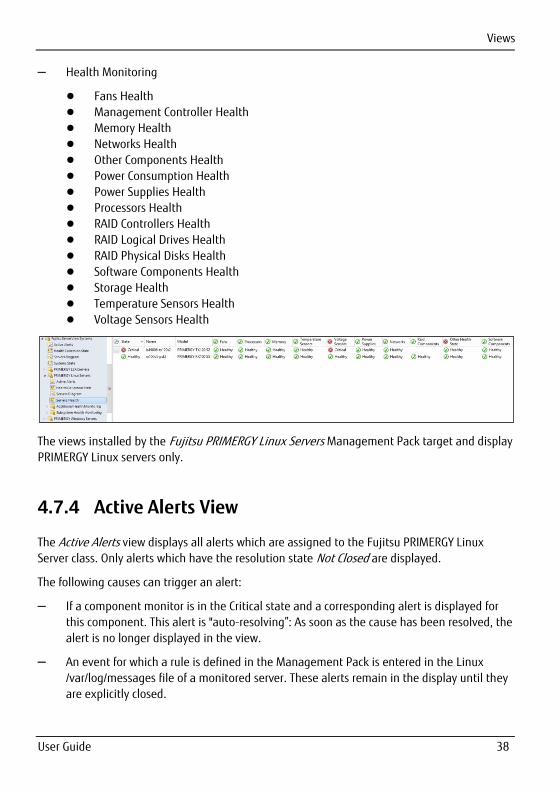
– Health Monitoring
● Fans Health
● Management Controller Health
● Memory Health
● Networks Health
● Other Components Health
● Power Consumption Health
● Power Supplies Health
● Processors Health
● RAID Controllers Health
● RAID Logical Drives Health
● RAID Physical Disks Health
● Software Components Health
● Storage Health
● Temperature Sensors Health
● Voltage Sensors Health
The views installed by the Fujitsu PRIMERGY Linux Servers Management Pack target and display
PRIMERGY Linux servers only.
4.7.4 Active Alerts View
The Active Alerts view displays all alerts which are assigned to the Fujitsu PRIMERGY Linux
Server class. Only alerts which have the resolution state Not Closed are displayed.
The following causes can trigger an alert:
– If a component monitor is in the Critical state and a corresponding alert is displayed for
this component. This alert is "auto-resolving”: As soon as the cause has been resolved, the
alert is no longer displayed in the view.
– An event for which a rule is defined in the Management Pack is entered in the Linux
/var/log/messages file of a monitored server. These alerts remain in the display until they
are explicitly closed.
Views
User Guide 39
– An error for which a rule is defined in the Management Pack occurs in either a PowerShell
or a Python script. These alerts remain in the display until they are explicitly closed.
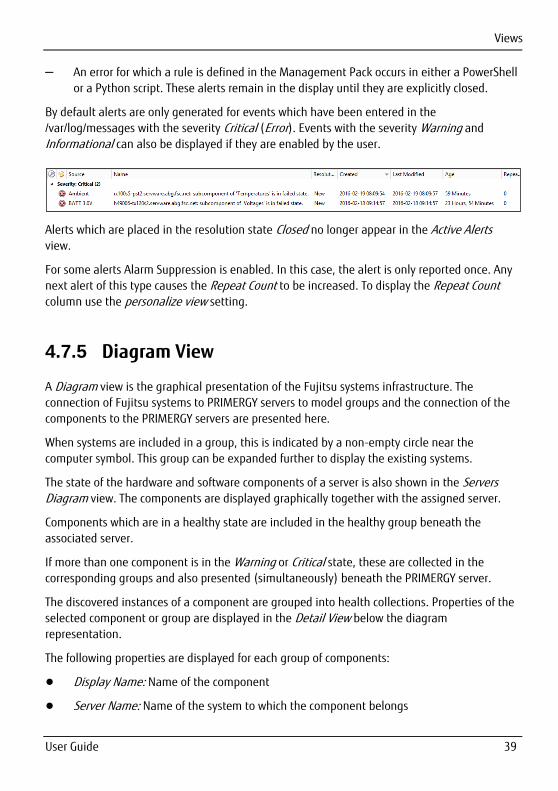
By default alerts are only generated for events which have been entered in the
/var/log/messages with the severity Critical (Error). Events with the severity Warning and
Informational can also be displayed if they are enabled by the user.
Alerts which are placed in the resolution state Closed no longer appear in the Active Alerts
view.
For some alerts Alarm Suppression is enabled. In this case, the alert is only reported once. Any
next alert of this type causes the Repeat Count to be increased. To display the Repeat Count column use the personalize view setting.
4.7.5 Diagram View
A Diagram view is the graphical presentation of the Fujitsu systems infrastructure. The
connection of Fujitsu systems to PRIMERGY servers to model groups and the connection of the
components to the PRIMERGY servers are presented here.
When systems are included in a group, this is indicated by a non-empty circle near the
computer symbol. This group can be expanded further to display the existing systems.
The state of the hardware and software components of a server is also shown in the Servers Diagram view. The components are displayed graphically together with the assigned server.
Components which are in a healthy state are included in the healthy group beneath the
associated server.
If more than one component is in the Warning or Critical state, these are collected in the
corresponding groups and also presented (simultaneously) beneath the PRIMERGY server.
The discovered instances of a component are grouped into health collections. Properties of the
selected component or group are displayed in the Detail View below the diagram
representation.
The following properties are displayed for each group of components:
● Display Name: Name of the component
● Server Name: Name of the system to which the component belongs
Views
User Guide 40
● Devices: Information of amount of discovered device instances
● Device Information: Additional information for the group if available
● BMC Address: IPv4 address of the integrated Remote Management Controller
● BMC DNS name: Fully Qualified Domain Name, if available and DNS enabled on iRMC
The following properties are displayed for each component:
● Display Name: Name of the component
● Server Name: Name of the system to which the component belongs
● BMC Address: IPv4 address of the integrated Remote Management Controller
● BMC DNS name: Fully Qualified Domain Name, if available and DNS enabled on iRMC
● Device: Name of discovered device instance
● Device Info: Additional information for the device if available
● Additional properties: if information available
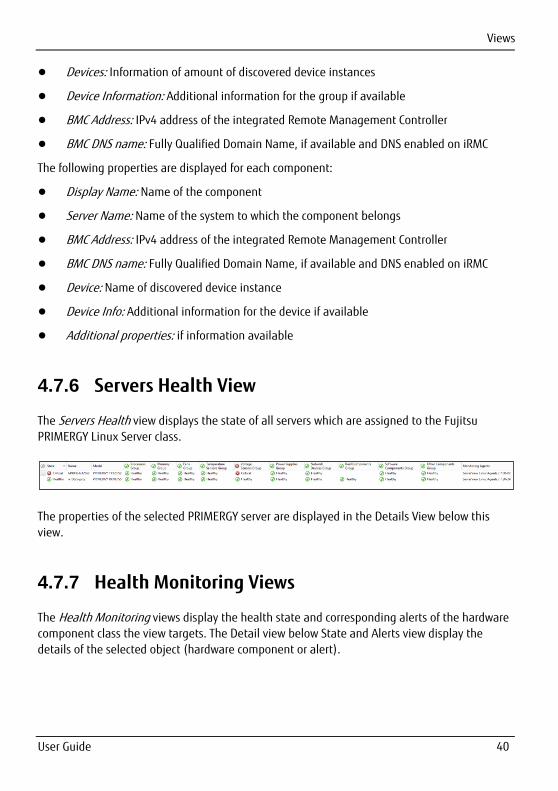
4.7.6 Servers Health View
The Servers Health view displays the state of all servers which are assigned to the Fujitsu
PRIMERGY Linux Server class.
The properties of the selected PRIMERGY server are displayed in the Details View below this
view.
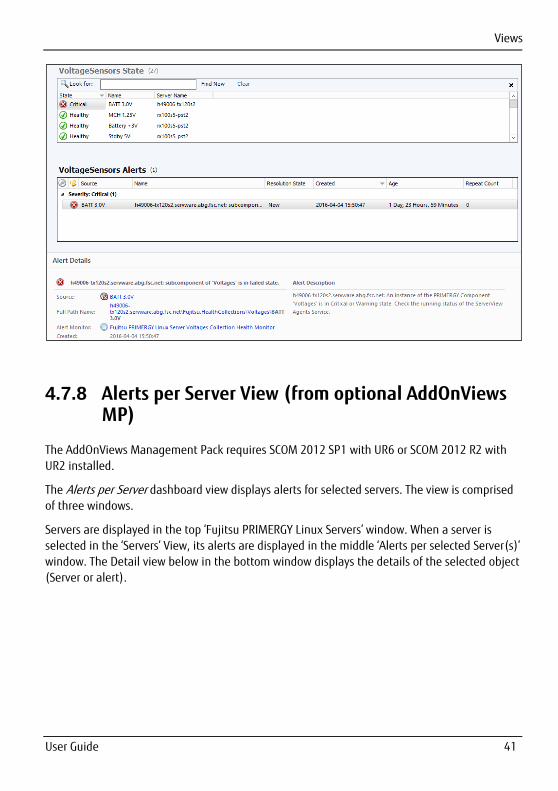
4.7.7 Health Monitoring Views
The Health Monitoring views display the health state and corresponding alerts of the hardware
component class the view targets. The Detail view below State and Alerts view display the
details of the selected object (hardware component or alert).
Views
User Guide 41
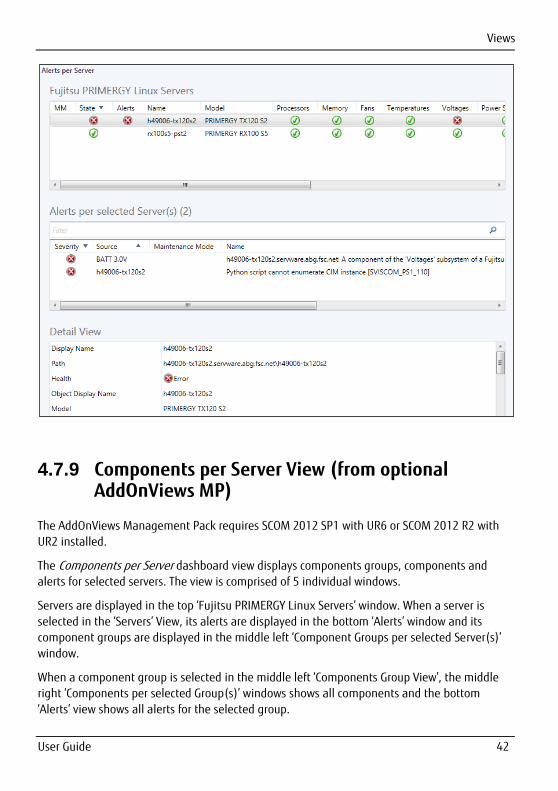
4.7.8 Alerts per Server View (from optional AddOnViews MP)
The AddOnViews Management Pack requires SCOM 2012 SP1 with UR6 or SCOM 2012 R2 with
UR2 installed.
The Alerts per Server dashboard view displays alerts for selected servers. The view is comprised
of three windows.
Servers are displayed in the top ‘Fujitsu PRIMERGY Linux Servers’ window. When a server is
selected in the ‘Servers’ View, its alerts are displayed in the middle ‘Alerts per selected Server(s)’
window. The Detail view below in the bottom window displays the details of the selected object
(Server or alert).
Views
User Guide 42
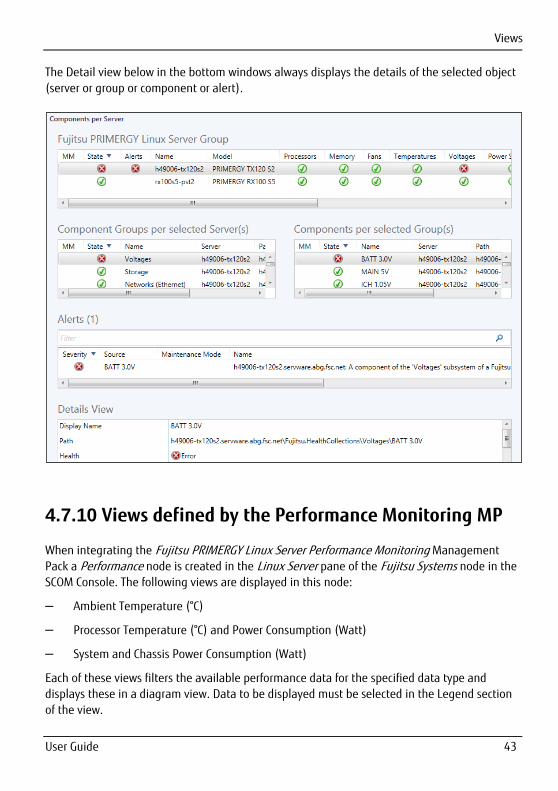
4.7.9 Components per Server View (from optional AddOnViews MP)
The AddOnViews Management Pack requires SCOM 2012 SP1 with UR6 or SCOM 2012 R2 with
UR2 installed.
The Components per Server dashboard view displays components groups, components and
alerts for selected servers. The view is comprised of 5 individual windows.
Servers are displayed in the top ‘Fujitsu PRIMERGY Linux Servers’ window. When a server is
selected in the ‘Servers’ View, its alerts are displayed in the bottom ‘Alerts’ window and its
component groups are displayed in the middle left ‘Component Groups per selected Server(s)’
window.
When a component group is selected in the middle left ‘Components Group View’, the middle
right ‘Components per selected Group(s)’ windows shows all components and the bottom
‘Alerts’ view shows all alerts for the selected group.
Views
User Guide 43
The Detail view below in the bottom windows always displays the details of the selected object
(server or group or component or alert).
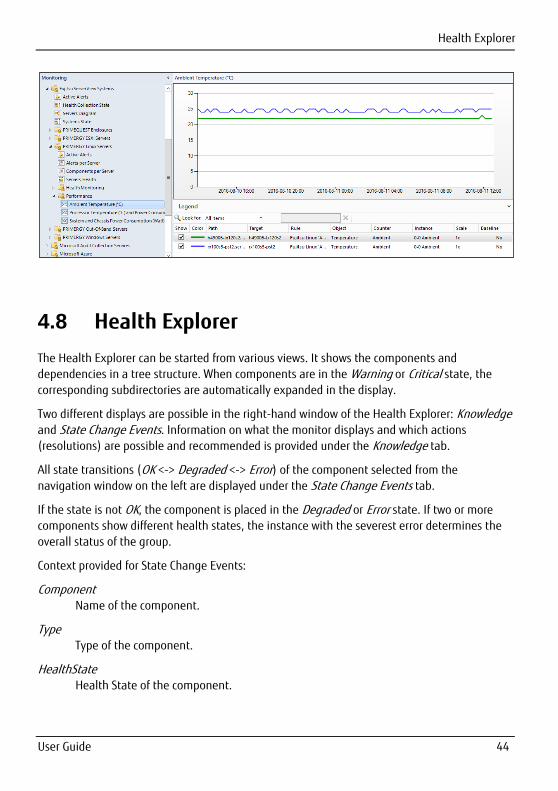
4.7.10 Views defined by the Performance Monitoring MP
When integrating the Fujitsu PRIMERGY Linux Server Performance Monitoring Management
Pack a Performance node is created in the Linux Server pane of the Fujitsu Systems node in the
SCOM Console. The following views are displayed in this node:
– Ambient Temperature (°C)
– Processor Temperature (°C) and Power Consumption (Watt)
– System and Chassis Power Consumption (Watt)
Each of these views filters the available performance data for the specified data type and
displays these in a diagram view. Data to be displayed must be selected in the Legend section
of the view.
Health Explorer
User Guide 44
4.8 Health Explorer
The Health Explorer can be started from various views. It shows the components and
dependencies in a tree structure. When components are in the Warning or Critical state, the
corresponding subdirectories are automatically expanded in the display.
Two different displays are possible in the right-hand window of the Health Explorer: Knowledge
and State Change Events. Information on what the monitor displays and which actions
(resolutions) are possible and recommended is provided under the Knowledge tab.
All state transitions (OK <-> Degraded <-> Error) of the component selected from the
navigation window on the left are displayed under the State Change Events tab.
If the state is not OK, the component is placed in the Degraded or Error state. If two or more
components show different health states, the instance with the severest error determines the
overall status of the group.
Context provided for State Change Events:
Component Name of the component.
Type Type of the component.
HealthState Health State of the component.
Fujitsu PRIMERGY Linux Server Tasks
User Guide 45
Reason Reason of the degraded Health State if available.
4.9 Fujitsu PRIMERGY Linux Server Tasks
Tasks are actions which can be displayed and executed in different views. They are displayed in
the Actions window when a PRIMERGY server is highlighted or when PRIMERGY hardware
components are selected.
Tasks of the Fujitsu PRIMERGY Linux Servers and server components:
● Delete PRIMERGY Server Component Inventory
● Remote Terminal
● ServerView RAID Manager
● ServerView Remote Management iRMC
● ServerView Remote Management MMB (Blade Servers only)
● ServerView System Monitor
4.9.1 Delete PRIMERGY Server Component Inventory
The Fujitsu PRIMERGY Linux Servers Management Pack keeps track of the amount of
components that have been discovered for a server in the home directory of monitoring user.
If new components are added to a server, the component inventory is increased and an
informational alert is raised.
If components are missing, an alert is raised every time the component discovery script runs
again (default: every 4 hours).
This task resets the server components inventory data. The next component discovery cycle
generates new inventory data without raising any alerts.
Use this task if components have been removed from a server.
Fujitsu PRIMERGY Linux Server Tasks
User Guide 46
4.9.2 Remote Terminal
This task is used to start a remote terminal (using the external tool PuTTY) in order to be able
to log on to the Fujitsu PRIMERGY Linux Server.
4.9.3 ServerView RAID Manager
This task is used to call the console of the ServerView RAID Manager.
4.9.4 ServerView Remote Management iRMC
This task is used to call the console of the integrated Remote Management Controller (iRMC). If
a DNS name has been found for the iRMC, the DNS name is called. Otherwise the IPv4 address
of the iRMC is used.
4.9.5 ServerView Remote Management MMB
This task is only available for blade servers.
It is used to call the console of the Management Board (MMB) of the corresponding BX400 or
BX900 chassis.
4.9.6 ServerView System Monitor
This task is used to start the web-based ServerView System Monitor, which can be used to
examine PRIMERGY Server in detail.
The web-based System Monitor is only available for PRIMERGY servers where ServerView
Agents V7.01 or later are installed.
Events and alerts
User Guide 47
4.10 Events and alerts
This section applies only to alerts for which rules are defined in the Management Pack(s). Other reasons why an alert can be triggered are described in section 4.7.4 Active Alerts View.
Alerts remain visible in the Active Alerts view until they are explicitly closed (assigned the
resolution state Closed).
Alerts are independent of monitors and have no influence on the health state of the server.
They are used only to display an event.
The following event groups are integrated in the main Management Pack:
● Event Log entries of PowerShell and Python scripts in the Management Pack
All alerts have alert suppression enabled.
The following alerts have been moved to separate Management Packs for customers who want
to receive even these alerts even though the component health states are fully covered by
individual health state monitors.
● SC2.MIB
● RAID.MIB
Only events with the severity Warning or Critical are integrated with all Warning alerts disabled
by default.
4.10.1 Enabling and disabling alerts
By default all the events with the severity Critical generate an alert, and all the events with the
severity Warning generate no alert.
To change the default settings override them in the Authoring section of the SCOM Console. The
overrides must then be stored in a custom Management Pack which is writable.
Knowledge Base
User Guide 48
4.11 Knowledge Base
A Knowledge Base is provided for the events and alerts. Depending on the alert various
possible resolutions / actions after error are displayed.
There are several external Knowledge Base documents provided with Integration Pack which
can be accessed from a corresponding alert. These files contain additional resolutions and
problem descriptions.
Monitoring – Active Alerts
User Guide 49
5 Working with the ServerView Linux Server Integration Pack
5.1 Monitoring – Active Alerts
All generated alerts which are assigned to the PRIMERGY servers and their components are
displayed in the Active Alerts views in the Monitoring area.
5.1.1 Displaying properties of an alert
To view the properties of an alert, select the alert entry in the table.
The properties of the alert are then displayed in the Alert Details window below the table.
To view all properties of an alert, double-click the alert entry or select the menu item
Properties with the right mouse button
The Alert Properties dialog is opened.
5.1.2 Executing tasks
Select an alert to execute the following tasks for the PRIMERGY server concerned:
– Delete PRIMERGY Server Component Inventory
– Remote Terminal
– ServerView RAID Manager
– ServerView Remote Management iRMC
– ServerView System Monitor
Monitoring – Servers Health
User Guide 50
5.2 Monitoring – Servers Health
The states of all PRIMERGY servers are displayed in the Monitoring area of the Servers State
view.
5.2.1 Executing tasks
Select a server to execute the following tasks for the PRIMERGY server concerned:
– Delete PRIMERGY Server Component Inventory
– Remote Terminal
– ServerView Raid Manager
– ServerView Remote Management iRMC
– ServerView Remote Management MMB (Blade Servers only)
– ServerView System Monitor
Create additional Performance Monitoring Views
User Guide 51
6 Working with the Performance Monitoring Management Pack
6.1 Create additional Performance Monitoring Views
Make sure the Performance Data collection rules additional views are to be created for are
enabled via overrides.
All performance collection rules are disabled by default.
6.1.1 Create a Performance View based on specific rules
In the 'My Workspace' Pane or in an unsealed management pack in the 'Monitoring' Pane
create a 'Performance View' via 'Right Click' - 'New' - 'Performance View'.
Give it a descriptive name, e.g. 'Power Supply Power Consumption'.
On the 'Criteria' tab select an existing server group, e.g. 'Linux Servers Group', or create a
new group containing only the servers of interest.
Select the Checkbox 'collected by specific rules', and click the blue underlined 'specific' in
the criteria selection pane.
Select one or multiple rules, confirm all selections with 'OK'
When the view is displayed, select one or more performance counter instances of interest.
View settings can be changes later via 'Right Click' - 'Properties'.
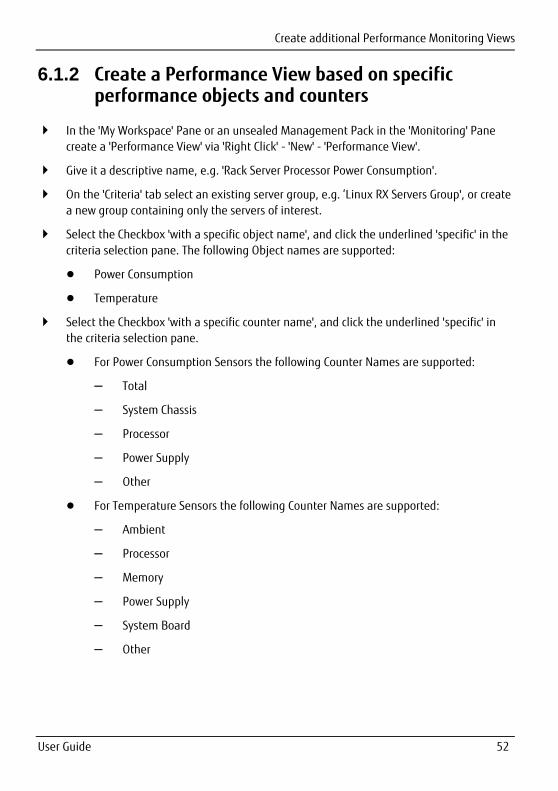
Create additional Performance Monitoring Views
User Guide 52
6.1.2 Create a Performance View based on specific performance objects and counters
In the 'My Workspace' Pane or an unsealed Management Pack in the 'Monitoring' Pane
create a 'Performance View' via 'Right Click' - 'New' - 'Performance View'.
Give it a descriptive name, e.g. 'Rack Server Processor Power Consumption'.
On the 'Criteria' tab select an existing server group, e.g. ‘Linux RX Servers Group', or create
a new group containing only the servers of interest.
Select the Checkbox 'with a specific object name', and click the underlined 'specific' in the
criteria selection pane. The following Object names are supported:
● Power Consumption
● Temperature
Select the Checkbox 'with a specific counter name', and click the underlined 'specific' in
the criteria selection pane.
● For Power Consumption Sensors the following Counter Names are supported:
– Total
– System Chassis
– Processor
– Power Supply
– Other
● For Temperature Sensors the following Counter Names are supported:
– Ambient
– Processor
– Memory
– Power Supply
– System Board
– Other
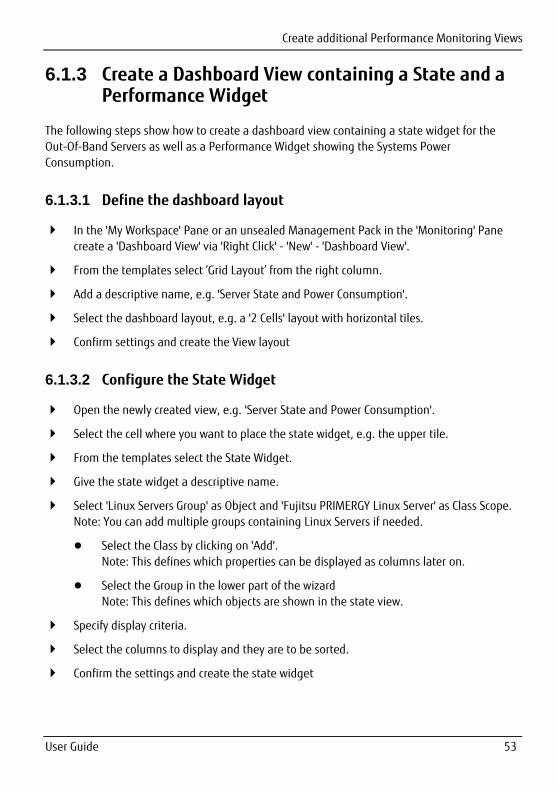
Create additional Performance Monitoring Views
User Guide 53
6.1.3 Create a Dashboard View containing a State and a Performance Widget
The following steps show how to create a dashboard view containing a state widget for the
Out-Of-Band Servers as well as a Performance Widget showing the Systems Power
Consumption.
6.1.3.1 Define the dashboard layout
In the 'My Workspace' Pane or an unsealed Management Pack in the 'Monitoring' Pane
create a 'Dashboard View' via 'Right Click' - 'New' - 'Dashboard View'.
From the templates select ‘Grid Layout’ from the right column.
Add a descriptive name, e.g. 'Server State and Power Consumption'.
Select the dashboard layout, e.g. a '2 Cells' layout with horizontal tiles.
Confirm settings and create the View layout
6.1.3.2 Configure the State Widget
Open the newly created view, e.g. 'Server State and Power Consumption'.
Select the cell where you want to place the state widget, e.g. the upper tile.
From the templates select the State Widget.
Give the state widget a descriptive name.
Select 'Linux Servers Group' as Object and 'Fujitsu PRIMERGY Linux Server' as Class Scope.
Note: You can add multiple groups containing Linux Servers if needed.
● Select the Class by clicking on 'Add'.
Note: This defines which properties can be displayed as columns later on.
● Select the Group in the lower part of the wizard
Note: This defines which objects are shown in the state view.
Specify display criteria.
Select the columns to display and they are to be sorted.
Confirm the settings and create the state widget
Create additional Performance Monitoring Views
User Guide 54
6.1.3.3 Configuring the Performance Widget
Open the newly created view, e.g. 'Server State and Power Consumption'.
Select the cell where you want to place the performance widget, e.g. the lower tile.
From the templates select the Performance Widget.
Give the performance widget a descriptive name, e.g. 'Linux Server Power Consumption'.
Select 'Linux Servers Group' as Object in the 'Specify Scope and Counters' page.
● Click '…' to start the group selection.
In the 'Specify Scope and Counters' page click 'Add' to start the performance counter
selection.
● Select 'Power Consumption' as Performance Object
● Select 'Total' as Performance Counter
● Scroll down the list of available instances and select the 'All' entry, then click 'Add'.
● Verify the selection and click 'OK'.
In the 'Specify Scope and Counters' page click 'Next'.
Select a time range for the performance data.
Select the columns you want to display in the legend area of the widget. You can re-
arrange the order as needed.
Confirm Settings and Click 'Create'
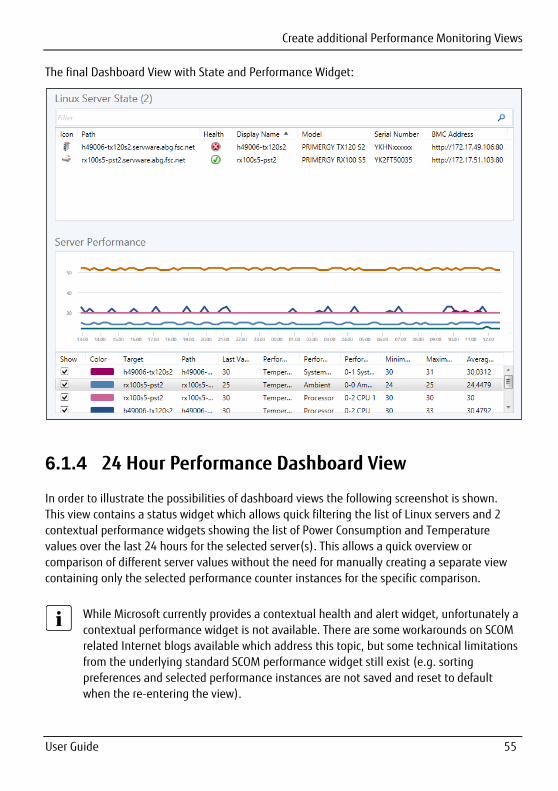
Create additional Performance Monitoring Views
User Guide 55
The final Dashboard View with State and Performance Widget:
6.1.4 24 Hour Performance Dashboard View
In order to illustrate the possibilities of dashboard views the following screenshot is shown.
This view contains a status widget which allows quick filtering the list of Linux servers and 2
contextual performance widgets showing the list of Power Consumption and Temperature
values over the last 24 hours for the selected server(s). This allows a quick overview or
comparison of different server values without the need for manually creating a separate view
containing only the selected performance counter instances for the specific comparison.
While Microsoft currently provides a contextual health and alert widget, unfortunately a
contextual performance widget is not available. There are some workarounds on SCOM
related Internet blogs available which address this topic, but some technical limitations
from the underlying standard SCOM performance widget still exist (e.g. sorting
preferences and selected performance instances are not saved and reset to default
when the re-entering the view).
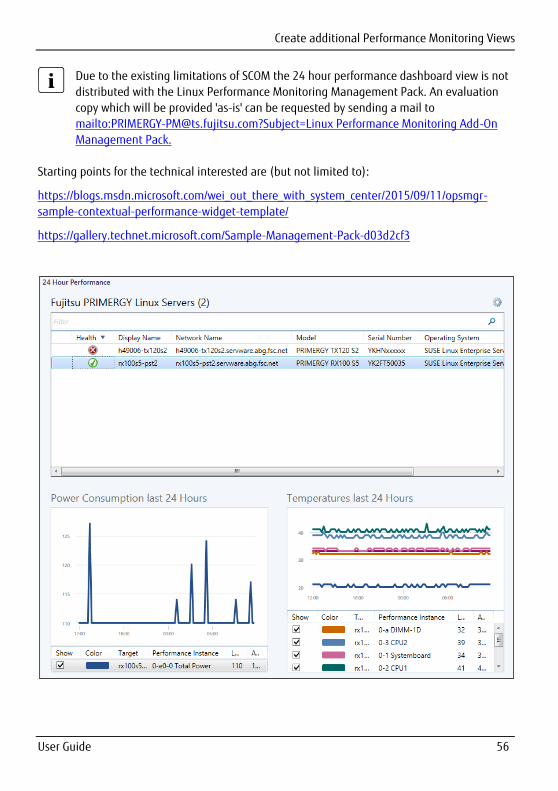
Create additional Performance Monitoring Views
User Guide 56
Due to the existing limitations of SCOM the 24 hour performance dashboard view is not
distributed with the Linux Performance Monitoring Management Pack. An evaluation
copy which will be provided 'as-is' can be requested by sending a mail to
mailto:[email protected]?Subject=Linux Performance Monitoring Add-On
Management Pack.
Starting points for the technical interested are (but not limited to):
https://blogs.msdn.microsoft.com/wei_out_there_with_system_center/2015/09/11/opsmgr-
sample-contextual-performance-widget-template/
https://gallery.technet.microsoft.com/Sample-Management-Pack-d03d2cf3
Supported PRIMERGY servers
User Guide 57
7 Appendix
7.1 Supported PRIMERGY servers
The ServerView Linux Server Integration Pack does not itself support PRIMERGY Linux Servers
but relies on ServerView Agents installed on the server to provide server hardware data.
PRIMERGY support therefore depends on the Agents installed on the monitored system.
Please refer to the ServerView Agents’ support list for detailed information on PRIMERGY
support:
http://download.ts.fujitsu.com/prim_supportcd/SVSSoftware/Software/Hints_and_readmes/Engli
sh/Agents/Released_Agents.htm
7.2 Creating log files
7.2.1 Log files on the SCOM server
Log files can be created for error analysis. The log files are stored in the subdirectory
SVISCOM\SVISCOM-Lin of the directory entered in the system environment variable TEMP.
Usually this is the C:\Windows\TEMP directory (where C: represents the system partition in this
example).
Logging options are defined in the file SVSISCOM-LinLog.xml in this folder. Sample copy of the
file with the name SVISCOM-LinLog.sample.xml is generated on each server discovery in the
%TEMP%\SVSCOM\SVISCOM-Lin folder.
SVISCOM-LinLog.sample.xml contains debug options for all discovery and monitoring features
of the management pack. See SVISCOM-LinLog.sample.xml on management station for details.
In the case of error analysis using log files proceed as follows.
Rename SVISCOM-LinLog.sample.xml to SVISCOM-LinLog.xml.
If SVISCOM-LinLog.xml already exists, check that all options of SVISCOM-LinLog.sample.xml also exist in SVISCOM-LinLog.xml.
Creating log files
User Guide 58
Check the debug options (documented in detail within the SVISCOM-LinLog.sample.xml file) for each feature to be monitored and set to the desired value.
The following log files are created as required:
– PRIMERGYServerDiscoveryTrace_<servername>.log
– PRIMERGYComponentsMonitorTrace_<servername>.log
– PRIMERGYAlertMonitorTrace_<servername>.log
– PRIMERGYLogParserTrace_<servername>.log
These files must be sent to Fujitsu Support for further analysis.
If you wish to disable the creation of log files again, delete or rename SVISCOM-LinLog.xml or
change the logging options within the file.
7.2.2 Log files on the Linux target server
To create log files for Python scripts that are executed on the target server, open the file
/<home>/<scom_user>/.sviscom/SVISCOM-LinLog.cfg and change appropriate values to yes to
enable debug mode for discovery and/or monitoring processes. The file SVISCOM-LinLog.cfg is
created automatically by the discovery script at first run.
The following log files are created as required:
– discovery.log
– monitoring.log
7.2.3 Currentness of log files
Log files are generated promptly only if the initialization file is available and the Fujitsu
Management Pack is imported at this time. If the management pack already is imported log
files are generated depending on the execution interval of the discovery or monitoring scripts.
Up to 4 hours are necessary for all log files to be generated.
The server discovery is executed by default every 4 hours.
After the discovery was successful, monitoring is run every 5 minutes.
Troubleshooting
User Guide 59
Alternatively:
To create a current set of discovery log files, put the server in maintenance mode for a short
time and let SCOM exit the maintenance mode. SCOM executes the server and component
discovery automatically after maintenance mode has ended.
7.3 Troubleshooting
7.3.1 Use ServerView System Monitor to examine a PRIMERGY Server
If a PRIMERGY server seems to have a problem (e.g. the PRIMERGY Overall State is bad) and the
cause of this problem cannot be determined via SCOM, it may help to use the System Monitor
for closer examination.
Highlight the server and use the ServerView System Monitor task to start System Monitor.
The web-based system Monitor is only available for PRIMERGY servers where ServerView
Agents V7.01 or later are installed.
7.3.2 Discovery does not start for Linux servers
If the discovery process doesn’t start for any of the Linux servers the problem is probably caused
by wrong settings of UNIX/Linux Account used in UNIX/Linux Action Account profile. Linux
management pack uses SCOM native SCXWSManProbeAction module to execute Python scripts
on monitored Linux server. If the elevation for privileged access is wrongly set in UNIX/Linux Account that is used for discovery and monitoring rules the SCXWSManProbeAction throws
unexpected exception and scripts are not run. If SCOM periodically reports these kind of error in
event log change UNIX/Linux Account to ‘Do not use elevation with this account’.
Linux management pack doesn’t need privileged root account set in UNIX/Linux Action Account profile to operate properly.

Hints and known issues
User Guide 60
7.4 Hints and known issues
-