fulfilling nigeria's gas master plan: full intergration of iocs
TRANSCRIPT

1
Chapter One
Introduction
Background Statement
Nigeria is known globally as a leading Oil producer with proven reserves
estimated at 37.2 billion barrels as of January 2011 and production rates at 4
million barrels per day. At the earlier stages of exploitation, following the 1956 oil
discovery, the oil fields bored abundant gas which was unwanted, leading to gas
flaring, an issue that endures till date. Failures of Government and the operating
International Oil companies (IOCs) on finding solutions to the problem of gas
flaring, lead to several negative multiplier effects on the nation.
The call for economic,
social and environmental stability
within the nation’s teaming
population of nearly 160 million
depends on the commitment of both
the government and the IOCs in
collectively ensuring the
transformation of the country’s
energy resources into national
wealth for economic growth with
minimal detriment to her immediate
environment.
The country’s energy reserves (Oil and gas) are mainly found in the Niger-
Delta region (Fig. 1) which lies within the south-south and south-east geo-political
zone covering an area of about 106,189 km2. However, this is also the region that
has suffered most from the negative consequences of oil exploitation. The problems
of oil spillage and gas flaring, among others, have inhibited the country from
reaching its potentials and expectations set within its membership of the
Organization of Petroleum Exporting Countries (OPEC) (Fig. 2). Even at the
domestic level, Nigeria has failed to meet her per capital consumption requirement
through absence of functional refineries, instability of distribution networks and a
viable marketing scheme.
Fortunately, the nation has made further natural gas discoveries with current
estimates of reserves (proven & unproven) of 600 trillion cubic feet, enough energy
Figure 1: Map of Niger-Delta Region of Nigeria
Source: www.nigeriamasterweb.com

2
to make significant impact on the global supply of natural gas products (LNG, GTL
etc.) if appropriate strategies are implemented in the coming years.
Overview of Nigeria’s Gas Reserves & Gas-sector
After the oil discovery and start of production in the 1960’s, Nigeria rose up
the rankings of oil producing nations eventually holding the top spot in the sub
Saharan region with the help of foreign investors (IOCs). These IOCs contributed
immensely to the growth of the oil industry with their involvement in the early
stages through Joint Ventures Projects (JVP) in the upstream oil sectors;
specifically in exploration, development and production.
Exploratory and production efforts on Nigeria’s oil fields led to further
discovery of considerable accumulation of associated natural gas, so much that the
oil fields are also the country’s gas fields (Asikhia and Orugboh, 2011). The
abundant reserve of associated and non-associated gas is estimated in the excess of
180 tcf (NLNG, 2012) currently placing the country 9th
in terms of proven natural
gas reserves worldwide. (Fig.3)
Figure 2: Overview of OPEC Members’ Share of World Crude Oil Reserve

3
This is a dip in global position from the 7th spot the country held as at
2007/2008 (Adumugbo, 2010). As luck would have it apart from the proven natural
gas reserve, there are yet to be found gas reserves in Nigeria, estimated at 600
trillion cubic feet, if companies deliberately explore for gas as opposed to finding it
while in search for oil (NLNG, 2012).
While the potential of natural gas, in the reduction of heavy dependency on
oil in Nigeria’s energy mix is quite great, the infrastructures for delivering natural
gas in her domestic market are very limited (Omission, 2011). Such lacks of
infrastructures lead to problematic issue of gas-flaring which has continued since
the inception of oil production; with cost of gas-flaring estimated to be around $2.5
billion per year (E.I.A, 2011). The unwholesome development prompted Nigerian
Government intervention, which began to work hard with the help of IOC’s to
revolutionize the crippled gas-sector, through the implementation of a Gas-Master
plan (est. 2008).
The Nigerian gas revolution is aimed at harnessing the nation’s vast gas
reserves plus undiscovered potential of gas to drive a transformation of the nation’s
economy under the outline defined in the Gas Master Plan unveiled in 2008. The
key objectives of the gas revolution include the monetization of Nigeria’s gas
reserves through reduction and ultimate stoppage of gas flaring and raising
domestic gas supply from the current level of 1.0bcf/d to over 10bcf/d by 2020.
This is basically targeted at feeding the domestic power sector, which has
a multi-billion dollar investment blueprint based on the sector’s privatisation plan,
among other critical sectors like agriculture and industry. It is also expected to
Fig 3: Top 10 Natural Gas Reserves in the World
Source: i www.eia.doe.gov

4
enable private participation in the gas value chain and position Nigeria as the
regional hub for gas-based industrialization by adding value to its natural gas.
Other objectives of the plan, amongst other things, include improvement in
the distribution of gas domestically and increased global market share of the natural
gas market. The socio-economic impact on fulfilling this master-plan will be
analysed in greater details in this report, incorporating the critical role of IOC’s in
efforts to reform the Gas-sector in Nigeria.
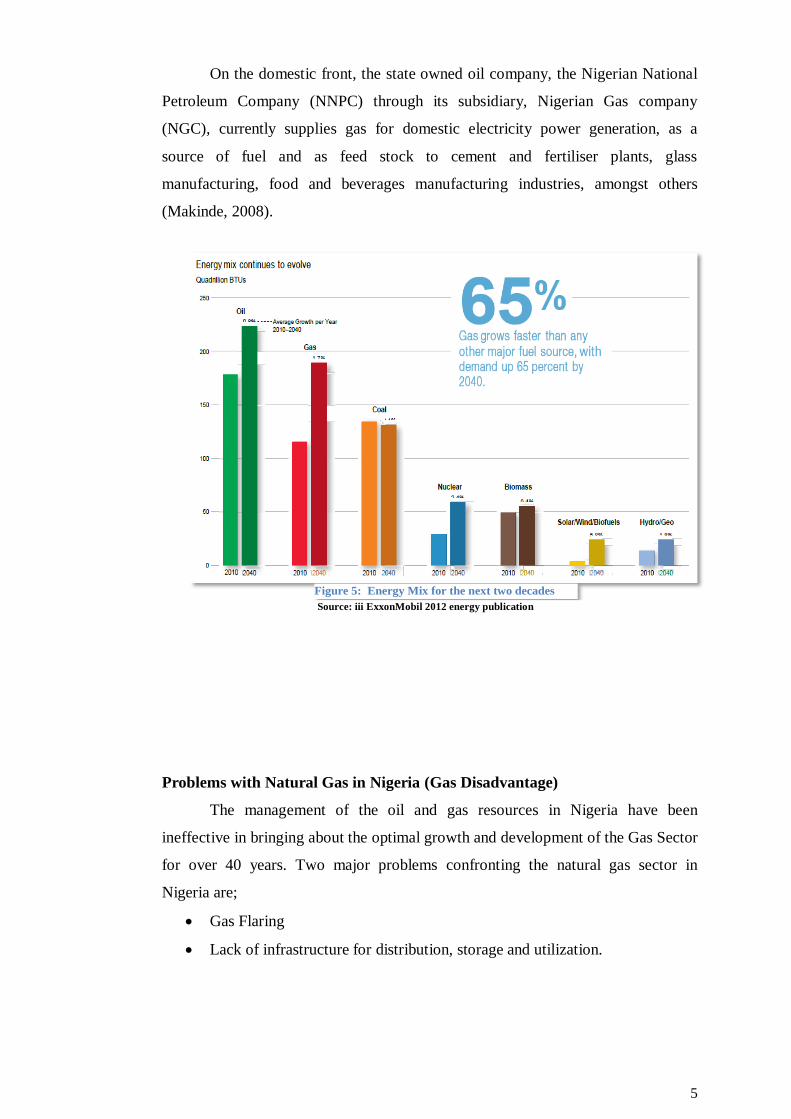
Why Natural Gas? (The Gas Advantage)
With natural gas being a cleaner and more environmentally favourable
energy source, Odumugbo (2010) described the nation’s gas sector as having the
potential to become a key player in the emergent global natural gas market, with
projected growth rate of over 70% by 2025 (NLNG, 2012). This growth would be
partially due to the expected domestic gas demand that is set to aggressively grow
from 500 mmcfd to 1800 mmcfd by 2010 and almost 4800 mmcfd by the year 2020
both nationally and globally (Stanley, 2009) (Fig 4).
70% growth
Figure 4: Project increase in demand domestically and globally Source: ii after NGMP review 2007
5
On the domestic front, the state owned oil company, the Nigerian National
Petroleum Company (NNPC) through its subsidiary, Nigerian Gas company
(NGC), currently supplies gas for domestic electricity power generation, as a
source of fuel and as feed stock to cement and fertiliser plants, glass
manufacturing, food and beverages manufacturing industries, amongst others
(Makinde, 2008).
Problems with Natural Gas in Nigeria (Gas Disadvantage)
The management of the oil and gas resources in Nigeria have been
ineffective in bringing about the optimal growth and development of the Gas Sector
for over 40 years. Two major problems confronting the natural gas sector in
Nigeria are;
Gas Flaring
Lack of infrastructure for distribution, storage and utilization.
Figure 5: Energy Mix for the next two decades
Source: iii ExxonMobil 2012 energy publication

6
Gas Flaring and Its Effect on the Region
Gas flaring was described by a World Bank sponsored study (2012), as an
anthropogenic activity that involves the wasteful emission of greenhouse gases
(GHGs) that causes global warming, disequilibrium of the earth, unpredictable
weather changes and major natural disasters through its delivery of benzene and
other toxic substances that are harmful to humans, animals, plants and the entire
physical environment.
Despite being a gas-rich nation, a large fraction (about 63%) of the
associated gas produced during the production of crude oil is currently being flared.
(Ahmed et al, 2012). This accounts for an annual loss of nearly $2.5billion (EIA,
2011) making Nigeria one of the top flaring nations in the world. Estimates show
that Nigeria represented nearly 11% of global gas flares with only Russia flaring
about three times more gas (Ahmed et al, 2012).
Fig 6: Nigeria’s Domestic Gas-Reserve Requirement in TCF (2000-2029)
Source: iv NGMP publication 2007

7
Irrespective of the nation’s gas reserves estimated to last for the next 100
years, at the current daily production rate of 3.5(bcf/d) and the problems associated
with gas flaring, the activity still occurs in Nigeria due to some geographical
factors. These include:
Limited numbers of appropriate reservoirs conducive for gas re-
injection/storage and the economics of doing so;
The huge cost of developing major and inter-connecting networks of gas
pipelines and processing facilities;
Low technological and industrial base for energy consumption in the
country;
Limited regional and international gas market; and
Inadequate fiscal and pricing policies to encourage investment (Odumugbo,
2010).
In a recent scientific research publication on Gas-flaring, Umukoro (2012)
described gas flaring as a process commonly used during petroleum refining and
chemical processing for safe disposal of waste gases responsible for one of the
most challenging energy and environmental problem facing the world, he noted
that Nigeria flared almost 76% of its natural gas from the lack of technology to
harness such energy.
Gas Flaring contributes to the greenhouse gases emissions (GHGs), which
has negative effects on the environment. The process emits CO2, methane and other
forms of gases which contribute to global warming causing climate change and rise
in sea level. These emitted gases of C02, methane and other gases (sulphur diode,
Fig. 7: Top 10 Gas Flaring Nations in the World
Source: v www.eia.doe.gov

8
nitrogen dioxides) all contribute to the negative impact on human lives, especially
those within the gas-flaring areas. Recent study in the Niger Delta Area shows that
gas flaring is being investigated to cause pre-mature deaths and leukaemia, with
estimates reaching 13,700,000 m3/day of gas flared from flow stations within the
area; a substantial amount of people would be exposed to these emissions (ERA
2005). According to World Bank (2012), these human exposures are likely to cause
respiratory illnesses, asthma attacks, premature deaths and even cancer.
Flaring also causes acid rain in the delta regions, evident on the high rate of
corrosion of infrastructure in the area. The primary causes of the acid rain are
emissions of sulphur dioxide (SO2) and nitrogen oxides (NO2) which combine with
atmospheric moisture to form sulphuric acid and nitric acid, respectively (ERA,
2005).
Lack of Infrastructure for Gas Distribution, Storage and Utilization
The current structure of the Nigerian Gas sector is not robust enough to
cope with the foreseen explosive increase in demand (NLNG, 2012). Over the
years, inadequate development in the supply and storage of gas has hampered the
Nigerian Gas sector. This is as a result of lack of commitment from the government
in the building of adequate processing facilities. Similarly because of the low
demand and sub-commercial gas prices domestically, IOC’s involved in the Gas-
sector have been more favourable towards export of gas products for returns on
their investment, leading to the delay in execution of domestic gas distribution
projects. Such projects include, West African Gas-Pipeline and the National Gas
Infrastructure Pipeline blueprint proposed in the Gas-master plan. Additionally the
unattractive setting in the gas-sector also contributes to the lack of needed foreign
investment for the gas distribution phase of the sector.
Some other issues concerning the gas sector include:
The huge capital investment needed for the gas projects;
A lack of clearly stated, long term “vision” for the sector and realistic gas
pricing policy to promote and facilitate gas use; and
A lack of a clear gas sector development strategy and implementation plan
covering policies, directions and integrated investment priorities (Asikhia &
Orugbo, 2011).

9
Over the years, natural gas has become important to the global energy
market as well as to the socio-economic development of nations that successful
utilizes this resource; this makes gas more favourable to be used than wasted in
flaring. The power sector of the country is set to be the major beneficiaries from
increased supply of natural gas to the domestic market; as the power supply
infrastructure of the country have deteriorated almost to a standstill. Power
generation in 2012 is estimated at 2,400MW compared to the countries demand of
10,000MW annually.
The Nigerian government aim to build sixteen more additional natural gas
demanding power plants all of which are directed at pulling the supply of gas
towards the domestic market rather than for export. Consequentially, when natural
gas is not used domestically, re-injected for the production of more oil or flared, it
is mostly exported.
With the present domestic and international market environment, exporting
natural gas is profitable. Nigeria currently exports 3.3 tcf of natural gas both
regionally with the help of pipeline projects (West African Gas Pipeline Company
WAGPCo) and on a global scale with the help of joint venture projects; Nigerian
Liquefied Natural Gas Project (NLNG, 2012). In general, over the years, the
nation’s power sector has been bedevilled by managerial inefficiencies and
leakages, lack of transmission, lack of efficient investment in generation,
distribution, and continued increase in load demand. Meanwhile, capacity
utilization of hydro- power plants in Kainji, Jebba and Shiroro, have occasionally
dropped in terms of generation due to age. The gas turbine power plant suffered
from old age, obsolete equipment, lack of gas supply owing to government’s failure
to make fund available to joint ventures companies that produce gas, and its neglect
of the gas plants.
10
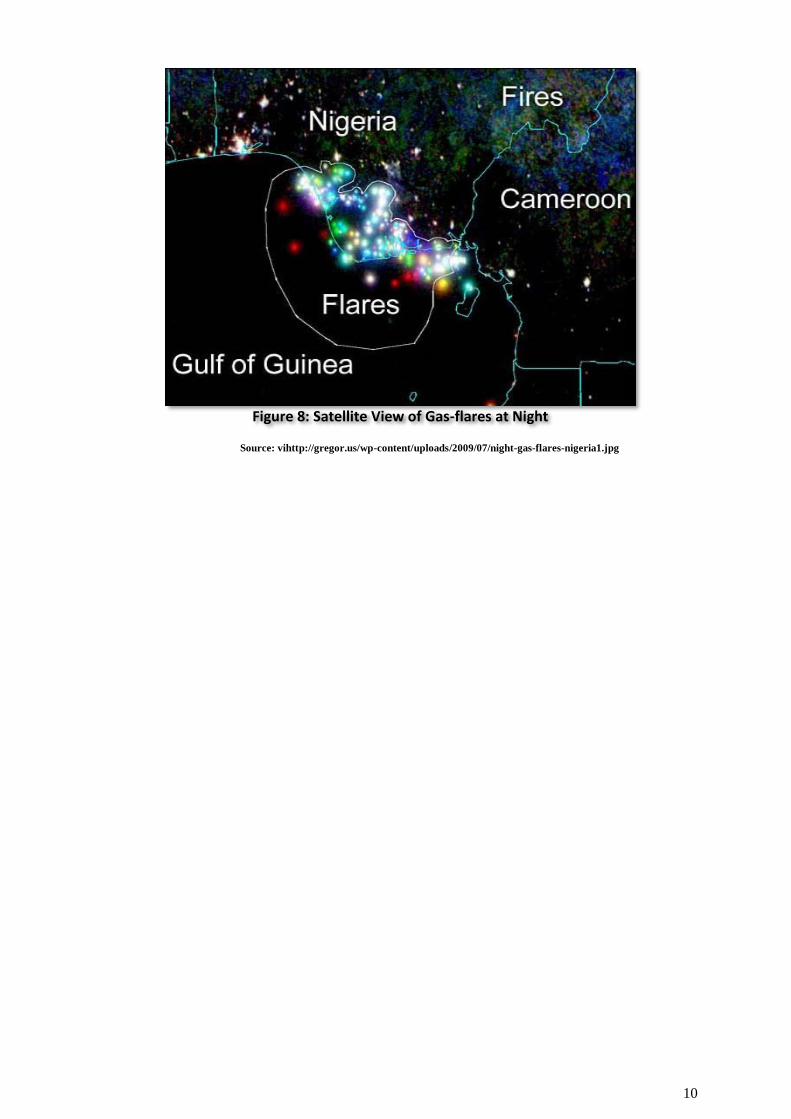
Source: vihttp://gregor.us/wp-content/uploads/2009/07/night-gas-flares-nigeria1.jpg
Figure 8: Satellite View of Gas-flares at Night

11
MOTIVATION FOR THE STUDY
The study is motivated by the several missed opportunities and failures of
the Nigerian Government in fulfilling her aim of making Nigeria a top-player in the
enterprise of natural gas globally, by means of improving her supply infrastructure
domestically, regionally and globally; developing an attractive setting through
improved gas-pricing policies for the much needed foreign investment in the sector
and most importantly, to end gas-flaring through optimal gas resources utilization
projects.
In other to combat these problems and secure the long-term availability of natural
gas for the future, in 2008 the government introduced the NIGERIAN GAS-
MASTER PLAN (NGMP). Some of its objectives include
Optimize Nigeria’s share and competiveness in high value export markets
Maximising the multiplier effect of gas in domestic economy
Obliged investment in domestic infrastructural development by IOCs
Provide much needed gas infrastructure blueprint for harnessing and
distribution of produced natural gas
Provide standard and stable gas pricing framework
Ensure supply of gas to domestic market
Create investment opportunities in the Nigerian Gas-sector
Erase completely gas-flaring
In the view of the foregoing, this study will discuss (in no particular order)
what the NGMP entails, its vision for the future and determine its actualization so
far through the industry’s downstream perspective via submitted questionnaires.
Additionally it will elaborate on what stages, since its conception, have been
achieved and what parts of the plan are yet to take place. The study will provide
knowledge on the involvement of the IOCs in Nigeria concerning NGMP by
providing statistical data and cases of participation through Joint ventures (JV) or
Production sharing contracts (PSC). Efforts made by the IOCs to end gas flaring
will also be analysed while highlighting the socio-economic benefits Nigeria stands
to gain from a successful management of its natural gas enterprise through this
NGMP by comparison with similar developing gas nations.
Before the conclusion and recommendations, issues that may negatively affect the
fulfilment of the NGMP in coming years and ways the involvement and
collaboration of IOCs can mitigate those issues and greatly improve the set out
goals in the NGMP will be outlined.

12
STATEMENT OF OBJECTIVES
To examine an Overview of the Nigerian Gas Master Plan
To discuss other objectives set out in the plan for the future
To determine the actualization of the NGMP so far though the help of
stakeholders in the Oil and gas industry via submitted questionnaires
To show the full integration needed by IOC’s to fulfil the Plan
To highlight the socio-economic benefits Nigeria could attain from a
successful management of her large natural gas resource by comparison
with other developing gas nations
To show problems facing the fulfilment of the NGMP and ways to mitigate
them.
Provide recommendations to sustain the NGMP
This study provides an opportunity to demonstrate the advantages of the
usage of natural gas over oil and display how the Nigerian government can
optimally utilize her natural gas reserves, with the help of secured polices, timely
completion of projects and strong act of commitment from all shareholders
involved in the exploration, production and distribution of Natural gas in Nigeria.

13
Chapter Two
Overview of Nigeria’s Gas-Master Plan & Involvement of IOCs
The Gas-master plan was introduced in 2008 by the Nigerian government to
support a challenging portfolio for gas utilisation and supply, arising from a
projected sudden boom in gas demand, in order to achieve national aspiration of an
aggressive GDP growth (Giddado, 2009). The plan also brings about an
opportunity to provide fiscal incentives for IOCs through the Petroleum Industrial
Bill (PIB) as well as attempt to finally end the national issue of gas-flaring.
The NGMP aims to transform the nation’s potential gas resource to improve
economic development rapidly and solidify the nation’s competiveness in the gas
markets, through viable domestic gas projects (gas-to-power), regional
development of the West African sub region (WAGP) and international
standardized export products (LNG) all of which include the involvement of IOCs
for its successful operations. In order to assure long-term gas security, an
appropriate development scheme composed of engineering concepts, technological
solutions, commercial and regulatory policies was emphasised to shape the three
(3) key components of the NGMP. These are;
A. Gas Pricing Policy
The gas-pricing policy is incorporated into the NGMP to ensure that the
framework for pricing of gas is structured and transparent within the domestic
sector in order to have a significant multiplier effect on the nation’s economy. The
task is to determine an appropriate gas pricing framework that encourages
efficiency in production for
the IOCS and consumption
by her people.
This was attained by
using the marginal cost of
supply analysis, with the
Niger Delta as the focal
point, for developing a cost
reflective pricing Fig 9: New Field Cost Curve (2006-2045)
Source: vii NGMP publication 2007

14
mechanism (NGMP, 2007). This indicated a limited volume of gas reserves that
could be developed profitably at a relatively low dry gas price.
The Government and IOCs consequentially have different mind-sets
pertained to the frame of gas pricing as the government would favour an economic
growth path while the IOCs are more profit maximization minded. The eventual
pricing strategy is aimed at enabling selective maximization of net revenues for
Nigeria gas from sectors that are most able to deliver that direct economic benefit.
Therefore the Government grouped the domestic demand into three categories with
different pricing considerations. The policy categorizes the domestic market as
follows;
Strategic domestic Sectors - This sector is supplied with the lowest
commercially sustainable price due to its great multiplier effect on the
economy via the power sector to residential and light commercial users. The
strategic intent is to facilitate rapid economic growth and development.
Strategic Industrial Sector - Composed in this sector are industries that
take gas as feedstock in the creation of new products such as fertilizers,
petrochemical and methanol. This is to ensure that value is added to
Nigerian gas before it’s exported via national projects such as Methanol
production, GTL and Fertilizers. The intent of this sector is ensuring the
feed gas available is affordable and predictable to ensure its competiveness
in spite of competition from neighbouring gas producing nations.
Strategic Commercial Sectors- This includes sectors that use gas as
industrial fuel such as LNG, Cement, and Steel etc. These are major direct
revenue earners for the Nation with their ability to bring about high gas
prices.
The resulting gas pricing framework stipulates the ‘floor price’ for each sector
that is necessary in order to discourage a disproportionate growth of one sector
relative to the other in a manner that ultimately compromises the long run
economic objective of the nation. The floor price is the lowest gas price each
categorised sector may negotiate for and will be determined on a cost-supply basis
using three different approaches. These include:
Pseudo-regulated pricing regimes (Product Net-back price basis)
Regulated pricing regime (Cost of Supply basis)
Market led regime (Alternative Fuel basis)

15
The Pseudo-Regulated Regimes: This approach is tailored to the industrial sectors
where gas is used as feedstock. Here, the floor price based on the net back of the
product price, i.e. the product price used in determining the floor price is the
assumed long run price of the product.
The Regulated pricing regimes: This regime is categorised by a floor price that is
determined by the lowest cost of supply that allows a 15% rate of return to the
IOCs, currently established as $0.1/mmbtu for a limited volume of gas reserves.
The Market led regime: This regime applies to sectors that use gas as either fuel or
in bulk for consequent resale. An indexation is mostly established between IOCs
and the consuming industry for the price of gas to be estimated. LPFO is the
alternative fuel price most consuming industry index the price of gas to.
Source: viii NGMP Publication 2007
Fig 10: Stipulated pricing mechanism for domestic obligation

16
Recent Implementation of Gas-Pricing
Projects with significant higher gas pricing thresholds lead to the
introduction via the government policy of a floor price of $0.4/mmbtu for power
plants while the price of gas to non-power consumers is to cross-subsidize resulting
in a pooled price of $1.30/mmbtu currently by gas IOCs. This pooled price is
managed by the Strategic Aggregator, an institutional arrangement that permits the
first contact point for gas trading. The power and fertilizer sectors constitute about
70% of the Gas requirement of the domestic sector, regardless, the value potential
of the remaining 30% from a price perspective is over 7-10times the $0.1/mmbtu,
but to realise this higher price, access to the aggregated price by suppliers is
required (NGMP ,2007).
The Aggregate domestic price is termed the forecasted average domestic
price from all three considered sectors.
Some of the benefits of having an Aggregated Domestic Gas price include:
Provides more acceptable gas price to suppliers
Stimulates full participation of all operators regardless of gas portfolio as
price is relatively higher
Reduces gap between domestic and export markets (IRR)
Nullifies the geographical disadvantage of some suppliers relative to
attractive domestic markets
Single point of contact for buyers (NGMP, 2007)
Fig 11: Aggregate Price of Gas for Domestic Market
Source: ix NGMP Publication 2007

17
Effect of the Gas-pricing policy on the IOCs
IOCs involved in the gas market are more willing to commit resources for gas
gathering. The worry of the IOCs is informed by the fact that the power sectors
requires about 70% of the gas produced in the country, but it cannot afford a
market driven gas price (Theresa 2010). IOCs may also be cautious to the fact that
the stipulated prices range via the standardized aggregator doesn’t take into account
possible price escalations of inflation or product prices.
B. Domestic Supply Obligation
This is a regulatory obligation resulting from the Petroleum Act in an
attempt by the Government to ensure availability of gas for domestic utilisation
projects (which would be outlined later in this report). It mandates all producers of
gas to set aside a certain pre-determined amount of gas reserves for supply to the
domestic market (Sawyerr, 2011).
The allocated reserves will be determined by the domestic requirements
needed to mitigate the export mind-set of IOCs and in turn improve its domestic
supply. This is brought about by the high level of foreign investment interests and
opportunities shown by gas based companies such as power producers and fertilizer
manufacturers which all use gas either as feedstock or fuel. This Obligatory
regulation has been implemented by other countries as well to ensure their energy
security
Nigeria’s first major attempt to refocus gas resource for domestic use also
incorporates a regulation which penalises any nonpayer with a made payment
compensation of $3.5/mcf for any losses suffered as a result of default to supply
gas in compliance with the order of the Gas aggregator (Ukpohor, 2009).
Additionally the obligation also empowers the nations honourable Minister
of Energy to stipulate the requisite amount of gas to be set aside periodically by the
IOC’s for a period between 5-7 years as well as establish a Department of Gas
within the Ministry of Energy that will oversee the execution of this regulation in
concert with the Department of Petroleum Resources (DPR) (Advocat, 2011)

18
Effects of Domestic Obligation regulation on IOCs
IOCs claim that the obligation set by the government is detriment to their
long term export contracts and in turn have failed at several points to contribute
their quotas. Kingsley sawyer (2011) is his work reports the IOCs to have already
committed their reserves into long term gas sales and purchase agreements with
“Take and Pay” clauses and to breach these contracts is to jeopardize their
business. In other words IOCs are profit-oriented and such obligation doesn’t
guarantee their returns on investment. But in as much as the IOCs display their
discordance with the obligatory domestic supply (the nations pathway to power
generation), their actions become paradoxical given that some IOCs where
involved, years before their long term contracts claims, in building power plants for
consumption of their significant gas produced as feed stock for electric generation
(Theresa, 2010)
C. Gas Infrastructure Blueprint (Domestic Oriented Gas utilisation project)
The Gas Infrastructure Blueprint was added as a component in the NGMP
to provide an opportunity for investment in dejected gas infrastructure and ensure a
more flexible supply of gas nationwide. It is expected that the infrastructure
development will be private sector led and commercially driven (Biobakwu, 2008).
Furthermore the blueprint will provide connectivity between major gas reserves
sources and the demand centres which consist of the highly populated north and
Fig 12: Natural Gas Supply Needed To Accommodate Increasing Demand
Source: x NGMP publication 2007

19
Fig 13: Gas Distribution Network Blueprint
south-east regions of the country, thus providing a roadmap that would guide future
investment in the gas sector in a bid to ensure proper utilisation of gas resources in
the key sectors of the economy and the regional market (Ukpohor, 2009). Some of
the goals intended through the addition of the Gas infrastructure blueprint into the
NGMP include;
Ensure infrastructure access to most demand centres (Kano, Kaduna,
Ajaokuta etc.)
Ensure connectivity between major gas reserve sources and the demand
centres
Opportunity to explore synergies across IOCs and reduce overall cost of
infrastructure development
Facilitate more flexibility in gas supply deliverability.
Observing the Infrastructure layout, it involves two aspects of the gas
blueprint; the Gas Gathering/Processing Facilities and Gas transmission systems.
The processing facilities are located in the Niger Delta area of the country which
has been subdivided into 3 franchise regions for setting up of a Central Processing
Facility (CPF) in each zone. That is the Warri/Forcados area, Akwa Ibom/Calabar
area and Obiafu area (Sawyerr, 2011).
Each facility involves collecting wet gas from gas fields owned by IOCs
(Shell and Mobil) into a CPF for treatment and processing in which dehydration
Source: xi Ukphor, 2009

20
occurs, removing undesirable compounds such as carbons, sulphur and mercury
(Ukpohor, 2009). Liquefied Petroleum Gas (LPG) and condensates will also be
extracted at these facilities before the residual dry gas will be fed into a gas
transmission lines, providing a solution to the problem of liquids ingress in
pipelines which has continually impacted power supply (Sawyerr, 2011).
The Blueprint further provides for the development of 3 major domestic gas
transmission systems in Nigeria as shown in the diagram namely; the Western
System comprising the existing Escravos-Lagos Pipeline System (ELPS) and a new
offshore extension to Lagos, the first South-North gas transmission line set to take
dry gas from the Akwa Ibom/Calabar facility to Ajaokuta, Abuja, Kano, Katsina
and also serve the Eastern states of Anamabra, Abia, Ebonyi, Enugu and Imo, and
an inter-connector that links the Eastern gas reserves centre with the other two
transmission systems. (Advocat, 2009)
Unfortunately this transmission systems is estimated to cost $1.2 billion to
construct, excluding the cost of its maintenance; a probable reason why this project
is still at the infant or conceptual stage with investors not buying into its innovation
for fear of lack of returns pertaining to the absent gas market and demand
domestically (CEE, 2006).
Moreover, these three franchise areas will be delineated around the CPFs,
thus only licensed IOCs within a franchise area will be allowed to develop and
operate the facility, thereby preventing proliferation (Sawyer, 2011).
The NGMP additionally provides a chance to;
Source: xii ESMAP/World bank, 2004

21
Create Investment prospects for foreign investors
End Gas Flaring in Nigeria through Utilization Projects
Intensify Nigeria’s Power producing Capacity
Increase Nigeria’s share in High value export markets.
I. Creating Investment Opportunities;
The world class policies in place within the nation’s gas commercialization agenda
and Petroleum Industry Bill (PIB), has made gas utilisation projects favourable to
foreign investment in Nigeria’s domestic regional and international gas markets.
With current innovations in technology, several development concepts and
solutions which come into play on gas utilization, bringing an added advantage for
investment. These are;
Gas re-injection/recycle: This process involves the re-injection of gas into an oil
field to help boost production. Mostly applied offshore, it helps maintain reservoir
pressure for small volumes of associated gas. This is a viable option especially in
cases where oil prospect are termed uneconomical resulting from lack of export
infrastructure.
Pipeline: The principal and most convenient method of transporting gas; either
from an offshore location to onshore for processing or to interface with existing
Fig 15: Investment Opportunities Viable In The Gas Sector
CPFs Phase Type Capacity(mmscf/d)Year
Escravos Export/Grid
Phase1 600 2012
Phase2 500 2015
Phase3 600 2018
Phase4 600 2021
2300
Phase1 700 2012
Phase2 1000 2013
1700
Calabar
Phase3 500 2012
Phase4 600 2013
Phase5 1500 2015
Phase6 500 2018
3100
Warri
Phase3 600 2013
Phase4 500 2017
Phase6 550 2023
1650
Grid
Export/Grid
Total
Total
GridOb-Ob
Total
Total
Investment Opportunities
Source: xiii NGMP Publication 2007

22
distribution grids in the country (Odumugbo, 2010). It is generally used in subsea
pipeline transportation of large gas volumes over relatively short distances, as seen
in gas utilization projects namely; West African Gas Pipeline project (WAGPCo),
National Gas Pipeline Network project & Escravo Gas Pipeline Project all of which
are attractive prospects for foreign investment in the expansions.
Liquefied Natural Gas (LNG): Where pipeline transportation technology is
unprofitable, the option of condensing gas to liquid state under specific conditions
(liquefaction) allows an easier way of conveying natural gas over longer distances
through specially built ships and highly insulated storage tanks.(NLNG 2010);
additionally the global rise in demand of LNG reported by BP (Energy Outlook,
2012) coupled with large investments characterized in liquefaction facilities and
LNG carriers (Odumugbo 2010), provides areas of investment noticeable in
Nigeria’s LNG projects. These are; Nigerian Liquefied Natural Gas (NLNG)
project expansion, Brass River LNG and the Olokola (OK) LNG.
Gas-to-liquids (GTL) diesel & synfuels: Alongside these innovations in pipeline,
LNG technology also brought about other ideas of utilisation concepts of gas. GTL
is a catalytic process which involves the chemical conversion of natural gas
(methane) into liquid hydrocarbons naphtha, diesel and waxes (Stanley 2009). This
process termed the Fischer-Tropsch has been exploited commercially for nearly
eight decades; with useful end products such as transportation fuels and base
chemical feedstock, which are in high demand both internationally and in most of
Nigeria’s industrialized sectors. The Escravos gas-to-liquids project provides a
compelling case for investment in Nigeria.
Other advances in gas utilization are, Compressed Natural Gas (CNG), Gas-
to-hydrates which also provide huge opportunities for foreign interests such as in
the “Oso Natural Gas liquids (NGLs)” extraction project.

23
II. Improve Nigeria’s Power Generating Capacity (Domestic Oriented)
In order to intensify power generation, an Electric Power Sector Reform
Bill (EPSRB) was introduced in 2003 which stripped the Government’s regulatory
authority and sole electricity supplier benefits, eventually granting distribution
licences to Independent Power Producers (IPPs) and Joint Venture Independent
Power Producers (JVIPPs) (Gujba et al, 2010). These efforts are aimed at boosting
the nation’s power generation capacity to well above 10000 MW by 2020,
surpassing current supressed demands of 6000MW which is also set to rise
accordingly (eia.gov). In this regard was the domestic supply obligation by IOCs
incorporated into the NGMP, in order to supply power generating plants with
natural gas as the major fuel for electricity generation in Nigeria because it
accounts for close to 60% of the annual new power generation installed capacity
(Odumugbo, 2010).
Fig 16: Fisher-Tropsh Model
Fig 17: Domestic Gas Demand In Nigeria
Source: xiv Stanley, 2009
Source: xv Odumugbo, 2010

24
Fig 18: Electricity Demand (peak) projection in MW
Source: xvi ESMAP/World bank, 2004

25
Chapter Three
Gas utilization Projects: Motives for Ending Gas Flaring by IOCs
The fundamental option of gas resource development is the best commercially and
economically applicable method for handling the large volume which gas occupies
at ambient temperature and pressure conditions (Odumugbo 2010). The most
successful direct profit based method is to convert natural gas to its liquid form by
cooling it (-161Oc), this reduces its volume making it easier to handle, transport and
contain (Kumar et al, 2011). This liquid state is termed Liquefied Natural Gas; the
Nigerian government on the lead by involving IOCs adopted this as one of the
methods in utilising her associated gas in order to reduce gas-flaring hence, the
creation of the NLNG- Nigeria Liquefied Natural Gas Limited, making the project
the most ambitious natural gas utilisation project presently, which aims at
harnessing the vast natural gas resources and produce LNG and NGLs for export.
Major Gas-Utilisation Projects Operational In Nigeria (Export Oriented)
Nigerian Liquefied Natural Gas Project (NLNG):
In the most recent publication of NLNG (2012), the company is described
to be a project jointly owned by the national oil company; Nigerian National
Petroleum Corporation (49%), and IOCs namely Shell (25.6%), Total LNG (15%)
Fig 19: Positions of some major gas utilisation projections in Nigeria
Source: xvii after BG licence concessions, 2008

26
and Eni International (10.4%). It was incorporated in 1989 and is located at the
south-most part of the delta on an island, called the Bonny island; since
construction commenced in 1996 costing $3,8billion, the Bonny Island NLNG
plant has experienced several developments, enabling it to currently operate six
trains with the capacity to produce 23.5 metric tonnes per annum (mtpa) of LNG,
4mtpa of LPG and 2.4mtpa of condensate from 3.5 bcf/d JV operated gas fields by
IOCs. Furthermore, plans for building Train 7 and 8 will lift the total production
capacity to surpass 30mtpa of LNG, thereby cementing its status as a reliable
supplier of LNG in the Atlantic Basin, serving the European, North American and
Far East Markets.
Figures in the publication reveal NLNG’s conversion of about 3.3 trillion
cubic feet (tcf) of associated gas to export LNG/NGL products in the span of
12years (1999-2011) making the project Nigeria’s best chance at eliminating gas-
flaring. The Brass LNG and the Olokola (OK) LNG plants at full capacity will
provide a combined additional 30mtpa of LNG ultimately maximizing utilization
capacity of Nigerians LNG sector.
Fig 20: Targeted NLG Markets For Nigeria

27
The West African Gas Pipeline Project (WAGP):
This is a regionally based gas project which incorporates the distribution of
purified natural gas ideally suited as fuel for power plants and industrial
applications from the coast of Nigeria to identified consumers along the West
African coastal regions impacting Contonu (Benin), Lome (Togo) and Tema before
finishing at Takoradi (Ghana) via a 700 kilometre gas-pipeline. This Gas utilisation
project is co-owned by participating IOCs and National companies from stated
countries in a Joint Venture agreement. These include Chevron-Texaco, Shell,
NNPC, Nigerian Gas Company (NGC), Societe Togolaise de Gas, and Ghana’s
National Petroleum Corporation (Stanley, 2009).
Accredited ultimate capacity of the pipeline currently stands at 460MMscfd
(wagpco.com) and the project is beneficial to the countries involved as it provides;
a form of economic integration of the four nations,
stimulus for increased infrastructural development through foreign
investments,
a secure and reliable energy source for nations involved
reduction of gas-flaring within the region
an opportunity to improve economic development goals of the nations,
Energy cost savings for the region from petroleum usage of nearly $500
million over a 20year period
Fig 21: Projected NLNG Increasing Capacity
Source: xviii after NLNG publication 2012

28
An opportunity to help the fulfilment of Nigeria’s Gas Master-Plan
(extended market reach).
Escravos Gas project EGP (Gas-to-liquids development)
The EGP is one of the nation’s first gas gathering and processing projects
costing $550 million on its first phase of completion (EGP-1) in 1997 (CEE, 2006).
The project has gone to expand its base in southeast Nigeria to two more phases
EGP-2 and EGP-3 in 2000 and 2009 respectively. Currently jointly ventured by
ChevronTexaco (40%) and NNPC (60%) the EGP has a cumulative gas processing
and production rate of 700mmcfd Liquefied Petroleum Gas (LPG) which is
demarcated for use domestically as feedstock for the local gas consuming
industries via pipelines and regionally via the WAPG (Malumfashi, 2007).
Assuredly the Global market made significant impact to the project through
its demand for cleaner and more environmental friendly energy, which is on the
rise yearly, as well as the possible products that could be attained from conversion
Fig 22: WAPG Project
Fig 23: Global Plants Pronounced
Source: xix www.wapgco.com
Source: xx Nadia GTL technology, 2005

29
of natural gas. These include but are not limited to Diesel, Naphtha and Waxes;
coupled with improved technology (lower CAPEX), high prices of crude oil (lower
global production annually), abundance of gas reserves nationally (187tcf) and a
global mission to end gas flaring, the expansion of the Escravos Gas project to
accommodate a Gas-to-Liquid (GTL) plant became viable in Nigeria. The Escravos
GTL project is currently owned by Chevron (75%) and NNPC (25%) with
estimated costs at $8.4 billion (Chevron, 2012). The Fisher-Tropsh technology is
the centrepiece for the project with the help of Sasol (South-African Leading GTL
Company) thereby converting over 325 million cubic feet of natural gas per day to
33,000 bpd GTL diesel and naphtha (Genovese et al, 2005). First productions are
scheduled this 2013 after its completion in 2012, a six year delay due to increased
costs, with targeted markets in Europe and Northern America (Chevron,
2012).With the ease of GTL products to be transported to the already existing
markets, it takes advantage of the national pipelines available and the WAPG.
Major drawbacks of the projects are its unavoidable high capital costs needed, the
complexity of its operations and its vulnerability to oil and gas prices. The GTL
project is planned for further expansion to produced 120,000bpd in the following
decade (Ahmed et al, 2012)
Other projects include:
Bonny Island Gas and Power Plant project (domestic oriented)
National Gas pipeline project (non-operational & domestic oriented)
The Olokola LNG project (export oriented)
Oso NGL project (export oriented)
Trans-Saharan Gas Pipeline (non-operational & export oriented)
Fig. 24: Trans-Saharan Future Gas Pipeline Blueprint Fig 25: GTL Advantage and Deliverable Distance
Source: xxihttp://i317.photobucket.com/albums/mm391/billysboss2005/GASpipeline.jpg & Nadia GTL technology, 2005

30
Source: xxii ESMAS/World bank, 2004
Analysis of the Gas sector and participating IOCs
In the terms of fulfilling NGMP, IOCs tend to follow the profit based path
which is majorly composed of export oriented projects as their rate of returns is
more guaranteed with the global market rather than the domestic as seen in the
outlined overview. Although the nations state oil company, NNPC, is averaging
roughly 60% participation and ownership of most of the projects within the gas
sector, it and the Nigerian Government have yet to transform the economic rent
received, which totals in the trillions of dollars (USD) since the inception of the oil
and gas industry (est. 1950s), into an improved socio-economic (GDP) nation as
compared to other OPEC countries. The neglect of improving the standards of the
domestic market through innovative domestic oriented projects by the IOCs is
understandably due to the lack of a viable legal gas framework, gas-pricing
structure and distribution infrastructure, regardless that the demand nationally is
high and projected to rise by 60% in 2015 (Figure3). Additionally the on-going
battle between in the government and the IOCs on a ‘balanced win-win’ petroleum
industry bill (PIB) is cumbersome on the already stressed industry. The new PIB,
released in the early fourth-quarter of 2012, aims amongst other things to;
Enhance the exploration of gas in Nigeria
Optimise gas supplies to the domestic gas market &
Reform the fiscal regime by permitting an open and transparent industry
(Ernst & Young 2012)
In a recent stakeholder’s forum held in Lagos, the Chairman of Shell
companies in Nigeria, Mr Muitui Sunmonu was critical concerning the new PIB
introduced by the government claiming that the fiscal terms involved are not viable
Fig 26: Suggested Selected Projects With Domestic Projections

31
for investors and currently doesn’t address long term industry issues in terms of
funding. A transcript of the forum quotes him;
…”As it stands right now the PIB will render all deep-water projects and all dry
gas projects, whether for domestic or export markets, non-viable. The opportunities
to monetise some of the world’s best gas reserves will be lost. The opportunity to
kick start the power sector, key to the nation’s economic growth, using easily
accessible gas will also be lost.”…
According to him, the PIB should create a level-playing field - …”one that is fair
to all investors, big, small, new or old.” “What we have seen of the draft PIB to
date does not indicate a bill that fits these criteria and this is the opinion not only
of the major players in Nigeria’s oil and gas industry, but as I mentioned earlier,
industry analysts as well (Vanguard October 1, 2012).
The provisions on taxation in the petroleum industry via the new PIB on
IOCs are seen to be unfavourable through the addition of a Nigerian Hydrocarbon
Tax (NHT tax rate of 50% for onshore and shallow-water projects and 25% for
deep-water projects). Production sharing contracts (PSC) are also termed uncertain
with respect to applicable rental and royalty rates for the PSC (Ernst & young,
2012).
A common issue is the nation’s state oil companies, NNPC, inability to
fund its share of JV costs in most operational projects leaving risks to involving
IOCs and in turn providing an unattractive setting for external investment and
partnership. With the major gas discoveries in Africa, namely the Shale gas in
South Africa (Shell, S.A, 2011) and Mozambique TCF gas capacity (ICF, 2012),
the competiveness for the global demand is increasing, making Nigeria’s
Figure 27: Current Investment incentives implemented through the new PIB 2012

32
opportunity to capture its targeted value market narrower, as much other global
prospects are equally becoming more sustainable (US and Australia).
Efforts have to be improved collectively by both parties on the sections of
the NGMP which are to certify its accomplishment .i.e. the effort to end gas flaring
completely and the establishment of integrated gas processing and transmission
infrastructure for produced excessive gas nationwide. An agreed-upon gas pricing
frame work will lead to the energy resources having a multiplier effect on the
domestic economy as desired by the Nigerian Government and the NGMP.
Some national institutional frameworks created in the monitoring, accessibility and
involvement of the Gas industry include;
Ministry of Petroleum Resources (MPR)
Niger Delta Development Commission (NDDC)
Ministry of Energy
The Federal Inland Revenue Services (FIRS)
Fig 28: 10-Year Gas Portfolio For Nigeria (evidence of reduction of gas-flaring by IOCs)

33
Chapter Four
The perspective on Fulfilling the NGMP by the Oil & Gas downstream sector
With little information known on the perspective of the downstream sector
towards the achievement of NGMP, a formative evaluation approach was
undertaken to gain this additional and useful information. With limited study on the
impact of the NGMP on the downstream sector, any resulting theories are based on
data collected through questionnaire methodology, although reactions are perceived
to be similar towards the newly implemented PIB 2012 on various documented
studies.
The approach implemented, provides a chance to affirm knowledge of the
NGMP by individuals and associates linked to Nigeria’s oil and gas industry at the
downstream level. It outlines a general perspective on the measurement of
achievement the NGMP as attained presently and also helps in identifying their
perspectives on key areas which are helpful to the successful enactment of the
NGMP as well as denoting its plausible drawbacks. Together, this selective
information serves as the platform for a calculated evaluation in the form of fixed
responses and open-ended questionnaires.
It is generally recognized that larger samples provide, statistically, a better
representation of the population from which they are selected than do smaller
samples. Based on that rule of thumb, I administered 220 questionnaires from 2nd
July 2012 to 24th
August 2012 to selected involving companies and qualified
individuals located in Abuja, Nigeria, with varying academic backgrounds that
share different levels of experience in the downstream oil and gas sector as well as
the general industry as a whole. Major targeted companies were Nigerian National
Petroleum Corporation (NNPC), Shell Petroleum Development Corporation
(SPDC) and Nigeria Liquefied Natural Gas Company (NLNG).
Research Questions
The questionnaires and oral interviews covered the following research questions:
1. Recent Study show that the high cost of gas distribution in Nigeria is the
major factor limiting the successful growth of the gas-sector – what is your level of
agreement with this statement?
2. With the Gas-Master Plan, the Nigerian Government aims, amongst other
things, to grow its share of the international market through the NLNG ltd and

34
several Gas projects. What percentage of success do you feel has been achieved so
far?
3. The Gas-Master plan obliged IOCs within the gas-sector to invest in the
development of the domestic market as well as provide infrastructure to aid its
supply chain; do such policies provide an unattractive setting for more foreign
investors?
Overall, 93 responses were received which amounted to a response rate of
42.3%. Using a Statistical Package for Social Science (SPSS); frequencies, cross
tabulations and Chi-square tests on the data were evaluated (Appendix). The
analysis is based on descriptive statistics to show the frequency of response to the
issues raised in the questionnaire. It was done section by section for clarity and can
be used to address the study in question.
Analysis:
42% of participants had job experiences of 1-5years in the industry
47% of participants involved majored in engineering degrees
22% of participants are recruited by the NNPC
Results:
Results displayed are tailored to the previously outline questions and are so
numbered respectively;
53% agree with the “high cost of distribution” statement and 30% strongly
agree with added comments.
50% of the total participants believe that the NGMP has attained a 0-25%
realised range and call for more added efforts from stakeholders involved.
But most importantly, the general perspective (60%) believes that the
policies in place hinder future investment and are perceived to be
unattractive to foreign investment. Policies noted are the Fiscal terms in the
previous PIB (2009) and the politics involved in supply obligation
regulations (NGMP).

35
Chapter Five
The future of the Global Gas Market and the effects on the NGMP
To effectively deliver a detailed outlook on the Global gas market and the
future gas trend, I took into account the Energy publication of a renowned global
company which is still a Key player in global energy production, exploration, trade
and distribution. BP’s Energy Outlook 2030 was released in London, January 2012
and most of my analysis in this chapter can be cited from the publication.
Quoting BP’s Group Chief Executive, Bob Dudley, on his introductory
statement of the publication; what he perceived as the most important aspect of the
Global outlook is that “Global energy trade continues to grow rapidly, linking the
world’s economies and driving a remarkable convergence of the relationship
between energy use and economic activity in countries around the world”.
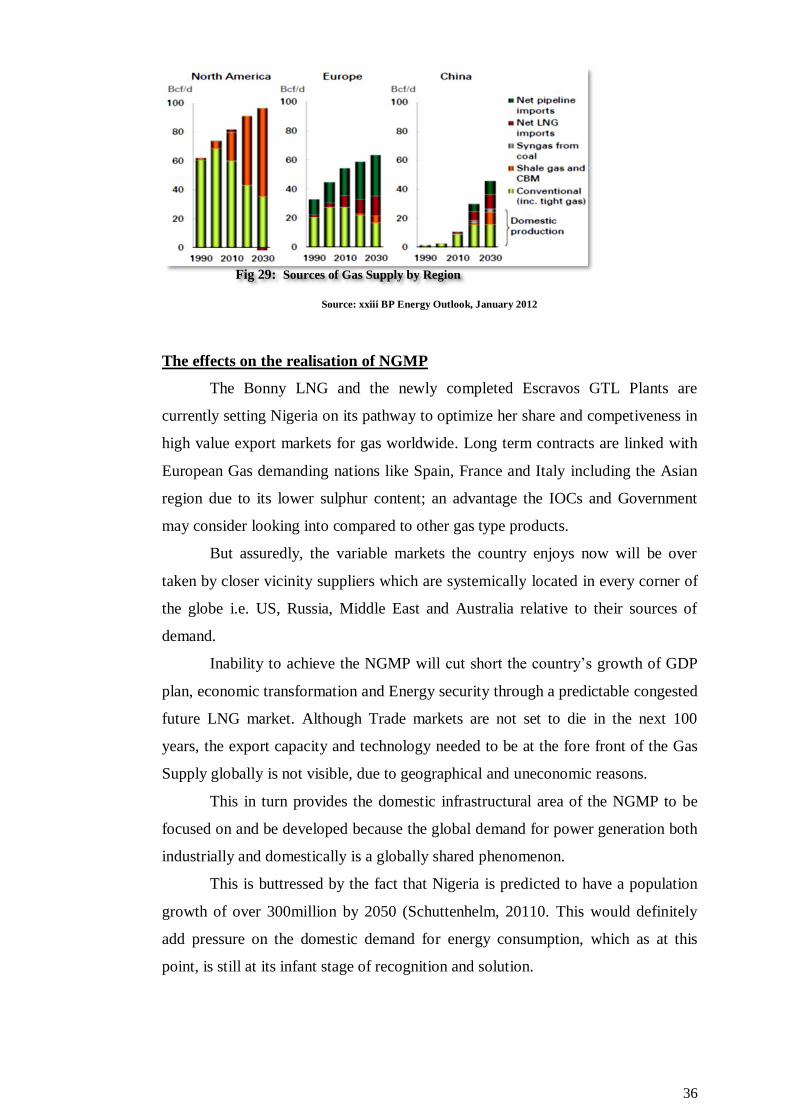
With that said, Natural gas is projected as the fastest growing fossil fuel
globally at 2.1% per annum, with LNG representing more than half of its growth by
2030. This is fuelled by its global demand increase of 50% over the next two
decades from consuming regions like China and Europe as well the increased fuel
substitution priority over coal and oil. Another major player in the Gas trend is the
North America region where their projections for unconventionals (Shale gas and
Coal bed methane) are set to transform the country into a net exporter of LNG
thereby making significant impacts across the field.
Major determinants in the next two decades still see the need for LNG trade
despite its increment in projected supply. These are China’s and India’s future
rapid economic development (industrialisation, urbanisation and motorisation)
which accounts for a net increase of 30% in gas demand for power generation with
population rising to 1.2 & 1.6 billion respectively (Schuttenhelm, 2011). Within the
periods of years analysed, the main supplier of the gas stems from the Middle East
(26%), Russian Federation (19%), North America (12%) and Australia (12%).
It is well noted that due to the lack of conventional supplies in Europe, a
growing import requirement up by 60% is on their horizon as major unconventional
exploration and production is not expected until 2020. (BP, 2012)
36
Source: xxiii BP Energy Outlook, January 2012
The effects on the realisation of NGMP
The Bonny LNG and the newly completed Escravos GTL Plants are
currently setting Nigeria on its pathway to optimize her share and competiveness in
high value export markets for gas worldwide. Long term contracts are linked with
European Gas demanding nations like Spain, France and Italy including the Asian
region due to its lower sulphur content; an advantage the IOCs and Government
may consider looking into compared to other gas type products.
But assuredly, the variable markets the country enjoys now will be over
taken by closer vicinity suppliers which are systemically located in every corner of
the globe i.e. US, Russia, Middle East and Australia relative to their sources of
demand.
Inability to achieve the NGMP will cut short the country’s growth of GDP
plan, economic transformation and Energy security through a predictable congested
future LNG market. Although Trade markets are not set to die in the next 100
years, the export capacity and technology needed to be at the fore front of the Gas
Supply globally is not visible, due to geographical and uneconomic reasons.
This in turn provides the domestic infrastructural area of the NGMP to be
focused on and be developed because the global demand for power generation both
industrially and domestically is a globally shared phenomenon.
This is buttressed by the fact that Nigeria is predicted to have a population
growth of over 300million by 2050 (Schuttenhelm, 20110. This would definitely
add pressure on the domestic demand for energy consumption, which as at this
point, is still at its infant stage of recognition and solution.
Fig 29: Sources of Gas Supply by Region

37
Source: xxiv BP energy Outlook, January 2012
Other Constraints and Challenges on the Realisation of NGMP
The large projects involved require significantly huge sums of investment
and lead time which is compounded by the instability of the Nigerian oil and gas,
as well as the political environment. These projects are therefore vulnerable to
corruption and in most cases are delayed for several years, the Escravos GTL plant
being an example. With the new PIB released, decentralised small-scale options
have become unviable which are critical in power generation whereby IOCs plans
of creating more independent power plants (IPP) may turn out to be unprofitable.
NGMP realization is becoming increasing politicised and the bigger picture of
energy security remains at the back tail of recognition.
Actions Required Mitigating negative effects on the NGMP
Full integration of IOCs required:
The domestic gas supply obligation has to be fully met by IOCs who
additionally have to understand the possible benefits of a viable domestic
infrastructure in the long term.
IOCs in the country have to converge and collaborate between each other
and prove themselves trust worthy for an enhanced and economical viable
gas distribution network as shown in the WAPG project.
Fig. 30: Natural Gas LNG and Pipeline Movement
38
IOCs are to show interest in fully exploring for gas as supposed to finding it
while in search for oil to improve energy security for the host nation’s
development.
Energy Poverty, the current energy status of Nigeria has to be addressed
comprehensively.
IOCs have to show actions of commitment through improved performance
by becoming proactive and engage meaningfully with the local
communities on issues that affect their environment.
There is the need to enforce the growing willingness to end gas flaring
which although have dropped over the decade are still on-going presently.
IOCs have to push the boundaries and engage in innovative partnerships
and take a systematic approach to social investment by taking a more
decisive role in shaping policy through energy efficient dialogues.
Why should IOCs get involved?
Provides an avenue to showcase good corporate responsibilities which leads
to favouritism as investment partners
Helps reduce gas-flaring through gas-utilisation projects thereby reducing
company’s carbon foot print
Reduces environmental damage and in turn international pressure
concerning unwanted degradation
Allows good relationship with local communities and host nations.
Maintains a positive international image and secures future investment
opportunities.
39
Chapter Six
Conclusion
The large gas potential in domestic and regional markets provides an
opportunity for gas to be utilised to stimulate economic growth and domestic
development based on the foundation envisaged in the NGMP. With access to the
increasing demand in the international and domestic gas market, provision for
much needed foreign exchange is beneficial to the entire well-being of the nation.
Increasing domestic energy availability through reducing energy waste of gas-
flaring would also be beneficial to the development of an indigenous gas
consumption culture currently limited to a few individuals in Nigeria. The visions
of NGMP can only be realised if IOCs are provided with enabling domestic
environment in terms of personnel and investment security with appropriate
package of incentives to attract investors to all phases of the Nigerian gas industry
via the Petroleum Industry Bill, in 2013 and beyond.
The International Energy Agency (IEA) projects global liquefaction
capacity to double within three years to 345m tonnes per year, with half of all new
LNG projects based in the Middle East or Africa. LNG demand is projected to rise
yearly into the next decade and African producers (notably Algeria, Egypt Libya
and Nigeria), with proximity to European, are in strategic position to meet with
worlds insatiable energy demand. Delays in implementing LNG plants in
Indonesia, Iran and Russia as well as efforts of European nations to lessen reliance
on Russia’s gas exports will be beneficial. Nigeria’s goal will be to capture one –
third of total Atlantic LNG trade by 2015.
The various on-going gas projects in the country show that Nigeria is on a
staggered journey to becoming the world’s fastest growing LNG supplier, behind
Qatar from a geographical viewpoint. Nigeria offers a simple one-stop movement
of gas to Western European markets through the Atlantic, compared to the more
tortious path for supply from the Middle East and the Persian Gulf states.
Natural gas, today, is one of the key energy drivers for growth. Particularly
the aggregate gas demand in Nigeria is forecasted to grow from the current level of
5billion scf/d to over 20billion scf/d by 2015, with the domestic market forecast to
grow to about 10 billion scf/d in the medium term.

40
The power sector revolution and the relocation of gas intensive industries
such as fertilizer and methanol industries would prompt the potential of the gas
sub-sector to surpass its crude oil growth recorded in 1970’s. NGMP is on its
desired path to accomplishment before the end of the next decade.
Recommendations
The need for the imposed Domestic supply obligation in the NGMP by the
Government should not only be understood for power generation, industrial
consumption and reduction in gas-flaring by the parties involved but instead should
be observed as a vital need for the nation’s Energy security in the coming decades.
Nigeria’s population of over 300million estimated by 2050 is paramount to why
IOCs need to be involved in all aspect of long term capital investment in gas
utilization especially in the gas distribution network nationwide as this is the
backbone to which Energy security in the country can be achieved.
Additionally IOCs seem to have succumbed towards the will the
government pertaining the already amended PIB (2012) which is still been
criticised by stakeholders. However, more proactive engagement by the IOCs
concerning the PIB and proposed gas infrastructure blueprint has to be given the
opportunity to thrive.
Finally there is the need to kick-start a Gas-Exploration Master Plan as an
essential toll for Nigeria to fully acquire the important knowledge about her
endowment and how effectively it can usher the nation into its natural gas era.
Further Research
Due to the short period of time available for this study and the
comprehensive nature of the facts that needed, it was impossible to achieve a
comprehensive coverage of the robust activities of the IOCs concerning the
utilisation projects especially their strategies and timelines to end gas-flaring under
the project guidelines.
Further research should therefore strive to dissect the IOCs involvement
with statistical data on gas production, consumption, flaring and utilisation as these
are to establish that the rate of return on their foreign direct investment in the gas
sector remains positive in the medium and long terms. More importantly the
present fiscal regime should be outlined from the IOCs perspective to help unblock
the current stagnation points in Nigeria’s Oil and Gas Industry.

41
REFERENCES:
Asikhia Olalekan, Orugboh Daniel, 2011. Marketing Cost Efficiency of Natural
Gas in Nigeria. Economic Science Series Volume 58, 1-13
The Climate Justice Programme and Earth Rights Actions (ERA)/Friends of
the Earth Nigeria, 2005. Gas Flaring in Nigeria: human rights, environmental and
economic monstrosity 1-15
British Petroleum, 2012. Natural gas section-Statistical Review of World Energy
June 2012.
Kumar Satish, Hyouk-Tae Kwon, Kwang-Ho Choi, Jae Hyun Cho, Wonsub
Lim, Il Moon, 2011. Current Status and Future Projections of LNG demand and
supplies: A global prospective. Energy Policy 39, 4097-4104
Anomohanran. 2012. Determination of greenhouse gas emission resulting from
gas flaring activities in Nigeria. Energy Policy 45. 666-670
Stanley Onuwukwe. 2009. Gas-to-liquid technology: Prospect of natural gas
utilization in Nigeria. Journal of Natural Gas Science and Engineering 1, 190-194
Odumugbo Asekhame Charles. 2010. Natural Gas utilisation in Nigeria:
Challenges and Opportunities. Journal of Natural Gas Science and Engineering 2.
310-316
Ahmed M.M, Bello A.A and Idris M.N. 2012. Natural gas utilization and the
Nigerian Gas-to-liquid Project: An Opportunity to End gas flaring. International
Journal of Emerging trends in Engineering and Development, ISSN 2249-6149,
Issue 2, Volume 2.(March), 1-17
Adenikinju Adeola. 2008. Efficiency of the Energy Sector and its Impact on the
Competitiveness of the Nigerian Economy. International Association of Energy
economics, Fourth Quarter, 27-31
Advocat Law Practice. 2009. Gas Utilization in Nigeria: Nigerian Gas Master
Plan (NGMP). Energy and Natural resources Group www.advocaat-law.com, 1-4
Nigerian National Petroleum Corporation (NNPC). 2007. The Nigerian Gas
Master-Plan. Gas Stakeholders Forum. 1-51
Sawyerr Kingsley. 2011. Nigeria’s abundant gas reserves and shortfall in
electricity; an apparent case of under-utilization.
http://works.bepress.com/kingsleysawyerr/1 1-11
42
Nigeria LNG Limited. 2012. Facts and Figures on NLNG. www.nigerialng.com
1-30
BGL financial monitor Publication, 2008. Gas master Plan: Nigeria’s potential as
a regional Power hub stymied. www.bgplc.com 34-39
Shell Publication, April 2012. Shell in Nigeria “Domestic Gas” Shell companies
in Nigeria www.static-shell.com
Centre for Energy Economics, 2006. New Era in Oil, Gas & Power Value
creation Case study: Gas Monetization in Nigeria. Bureau of Economic Geology,
Jackson School of Geosciences, The University of Texas at Austin, 1-8
Ukpohor, Excel Theophilus O, 2009. Nigerian Gas master-Plan: Strengthening
the Nigeria Gas Infrastructure Blueprint as a base for expanding regional gas
market. World gas conference technical paper. 6-19
EIA Nigeria Energy Data, Statistics and analysis, 2009, www.eia.doe.gov
Makinde Olaoye, 2008. Optimal utilization of the gas reserves in Nigeria:
Expansion of the LNG sector. University of Aberdeen. 22-30
World Bank, 2004. Strategic Gas Plan for Nigeria. Joint UNDP/World Bank
Energy sector Management Assistance Programme (ESMAP). 37-40, 57-60.
Ernst & Young. 2012. Nigeria Petroleum Industry Bill-2012. www.ey.com/nigeria
Nadia A. Genovese, Gorlani Armando & Andres H. Arroyo P., 2005. GTL
Technology & its Role in the World Energy Markets. Eni Coporate University. 1-
35
ExxonMobil, 2012. 2013-The Outlook for Energy: A View to 2040.
www.exxonmobil.com 44-48
Shaad, B. and E. Wilson. 2009. ‘Access to sustainable Energy: What role for
international oil and gas companies? Focus on Nigeria’, International Institute for
Environment and Development (IIED),London.

43
APPENDIX I
Data Collection Instrument
FULFILLING NIGERIA’S GAS-MASTER PLAN: FULL INTERGRATION
OF IOC’S
Nigerian’s Gas-Master Plan was the vision of a country rich in natural-gas
reserves yet poor in infrastructure available to them in the successful management
of the enormous gas-resources.
With the natural-reserves estimated to be 600 trillion cubic feet (tcf) within
the next 10 years and the country’s demand for gas to also double aggressively, the
tackling of envisioned problems, amongst other things, lead to the creation of the
Gas-Master Plan.
Your answer to questions in this questionnaire will assist in developing a
comprehensive report that will show the progress already attained in the Gas-
Master Plan designed for the oil and gas industry in Nigeria, the involvement of
international oil companies (IOCs) through several gas-projects, and an analysis of
requirements needed to fulfil the aim already set out to make Nigeria a top
contributor in the enterprise of natural gas, globally.
The study is part of the requirement for the award of Masters in Oil and Gas
Enterprise Management (MSc) degree programme of the University Of Aberdeen,
Scotland under the supervision of the Head of the Department of Petroleum
Geology.
1. Responder’s Age______________________________________________
2. Responder’s Gender: (Please √) Male Female
3. Responder’s Rank: (Please √)
Director
Head of Unit
Officer
Operational staff
Others (Please specify)
4. Indicate with a (√) respondent’s years of Experience in the Oil and Gas
Industry
1-5 years

44
6-10 years
11-15 years
16 & above
5. Indicate with a (√) respondent’s academic background
QUALIFICATION FIELD OF STUDY
PhD. Engineering
M.Phil. Geo-Sciences
MSc. Accounting
MBA Social sciences
BSc. Law
BEng. Economics/Marketing
BA. Political Sciences
Others (Please
Specify)
6. What is your parent company?
_______________________________________
7. What is your level of familiarity with international operating companies in
the Oil and Gas Industry?
STAKEHOLDERS/MULTIPARTY
VENTURES
HIGH MEDIUM LOW NIL
Nigerian National Petroleum Corporation
(NNPC)
Shell Gas BV ( SGBV)/ Shell Petroleum
Development Company (SPDC)
Total LNG Nigerian Limited/ Total
Exploration Production of Natural Gas(
TEPNG)
Eni International (N.A)
Nigerian Liquefied Natural Gas Limited
(NLNG)
Nigerian Agip Oil Company Limited
(NAOC)
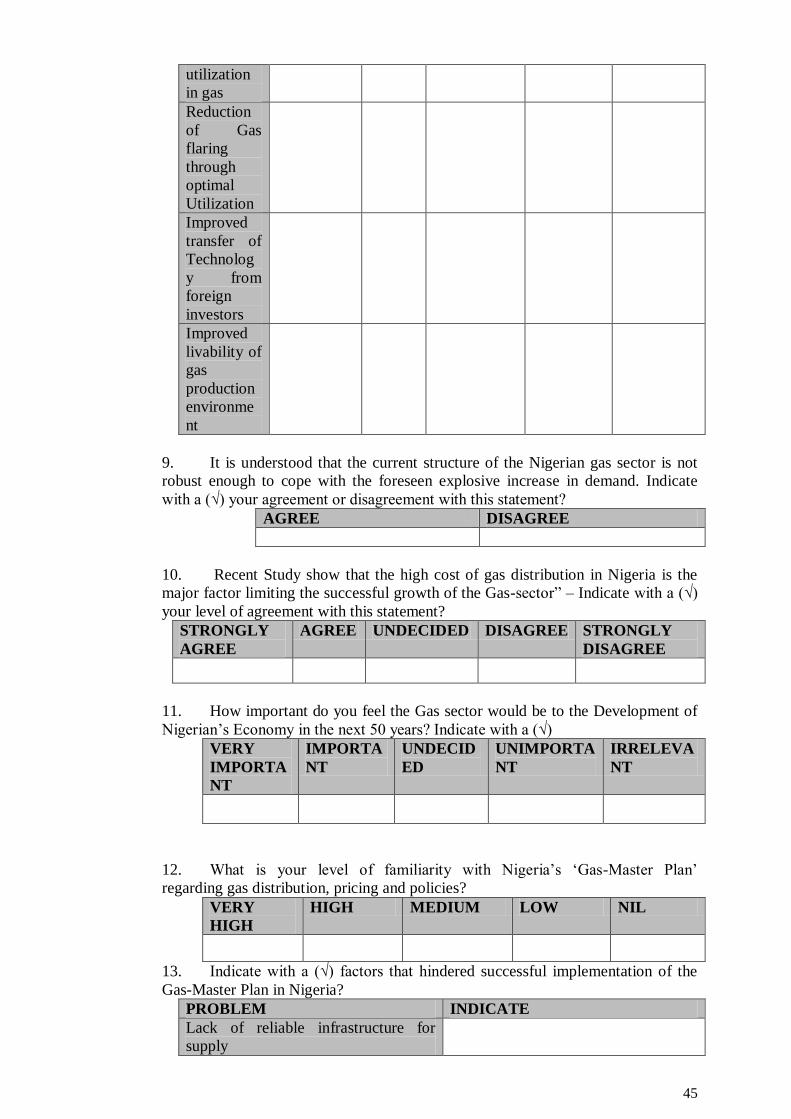
8. Indicate with a (√) the degree of your agreement with what socio-economic
benefits Nigeria could attain from a successful utilization of the Gas sector?
EXPECTE
D
BENEFIT
S
STRONGL
Y AGREE
AGRE
E
UNDECID
ED
DISAGRE
E
STRONGL
Y
DISAGRE
E
Increase in
source of
Revenue
Lower
Carbon
emissions
from
cleaner
energy
45
utilization
in gas
Reduction
of Gas
flaring
through
optimal
Utilization
Improved
transfer of
Technolog
y from
foreign
investors
Improved
livability of
gas
production
environme
nt
9. It is understood that the current structure of the Nigerian gas sector is not
robust enough to cope with the foreseen explosive increase in demand. Indicate
with a (√) your agreement or disagreement with this statement?
AGREE DISAGREE
10. Recent Study show that the high cost of gas distribution in Nigeria is the
major factor limiting the successful growth of the Gas-sector” – Indicate with a (√)
your level of agreement with this statement?
STRONGLY
AGREE
AGREE UNDECIDED DISAGREE STRONGLY
DISAGREE
11. How important do you feel the Gas sector would be to the Development of
Nigerian’s Economy in the next 50 years? Indicate with a (√)
VERY
IMPORTA
NT
IMPORTA
NT
UNDECID
ED
UNIMPORTA
NT
IRRELEVA
NT
12. What is your level of familiarity with Nigeria’s ‘Gas-Master Plan’
regarding gas distribution, pricing and policies?
VERY
HIGH
HIGH MEDIUM LOW NIL
13. Indicate with a (√) factors that hindered successful implementation of the
Gas-Master Plan in Nigeria?
PROBLEM INDICATE
Lack of reliable infrastructure for
supply

46
High Capital investment needed in the
sector
Low demand for gas locally
Federal Governments lack of
commitment
Gas-Flaring problems
Militant disruption of projects
Unattractive standards of gas policies
for IOCs
14. With the ‘Gas-Master Plan” the Nigerian Government aims, amongst other
things, to grow its share of the international market through the NLNG Ltd and
several Gas projects. What percentage of success do you feel has been achieved so
far?
PERCENTAGE Unknown 0%-
25%
26%-
50%
51%-
75%
76%-
100%
INDICATE
15. The Gas-Master Plan obliged international operating companies within the
gas-sector to invest in the development of domestic market as well as provide
infrastructure to aid its supply chain; do such policies provide an unattractive
setting for more foreign investors?
YES NO
16. Indicate with a numbering system (3, 2, 1) with 3>1 , the top three (3) areas
you consider MOST important in the implementation of the Gas-Master Plan for a
successful Gas-sector?
Increase State oil companies
participation in operations
End of Gas-Flaring
standardized domestic Gas pricing
Stable & World-class National Gas
policies
Reliable and efficient Gas
infrastructures
Increased stake of the Global Gas
Market demand through export
Adequate pipelines to supply domestic
demand through distribution
Timely fulfillment of Gas-Projects
Increased contribution of the IOCs to
the development of the domestic market
A more attractive setting for foreign
investors
Date: _________________________ Thanks for your co-operation.

47
APPENDIX II
Bio data analysis
Descriptive
Descriptive Statistics
N Minimum Maximum Mean Std. Deviation
age 93 23 58 39.44 10.040
Valid N (list wise) 93
Frequencies
Statistics
gender rank job experience qualification field of study parent company
N Valid 93 92 93 93 93 93
Missing 0 1 0 0 0 0
Frequency Table
gender
Frequency Per cent Valid Per cent Cumulative Per cent
Valid
Male 72 77.4 77.4 77.4
Female 21 22.6 22.6 100.0
Total 93 100.0 100.0
rank
Frequency Per cent Valid Per cent Cumulative Per cent
Valid
Director 4 4.3 4.3 4.3
Head of Unit 20 21.5 21.7 26.1
Officer 43 46.2 46.7 72.8
Operational Staff 21 22.6 22.8 95.7
Others 4 4.3 4.3 100.0
Total 92 98.9 100.0
Missing System 1 1.1
Total 93 100.0
job experience
Frequency Per cent Valid Per cent Cumulative Per cent
Valid 1-5 yrs. 39 41.9 41.9 41.9
6-10 yrs. 19 20.4 20.4 62.4

48
11-15 yrs. 19 20.4 20.4 82.8
16 yrs. & above 16 17.2 17.2 100.0
Total 93 100.0 100.0
qualification
Frequency Per cent Valid Per cent Cumulative Per cent
Valid
PhD 1 1.1 1.1 1.1
MSc 27 29.0 29.0 30.1
MBA 6 6.5 6.5 36.6
BSc 32 34.4 34.4 71.0
BEng 18 19.4 19.4 90.3
BA 4 4.3 4.3 94.6
Others 5 5.4 5.4 100.0
Total 93 100.0 100.0
field of study
Frequency Per cent Valid Per cent Cumulative Per cent
Valid
Engineering 44 47.3 47.3 47.3
Geo-Sciences 16 17.2 17.2 64.5
Accounting 7 7.5 7.5 72.0
Social Sciences 14 15.1 15.1 87.1
Law 4 4.3 4.3 91.4
Economics/Marketing 4 4.3 4.3 95.7
Political Science 4 4.3 4.3 100.0
Total 93 100.0 100.0
parent company
Frequency Per cent Valid Per cent Cumulative Per cent
Valid
NLNG 8 8.6 8.6 8.6
Shell BV 9 9.7 9.7 18.3
Eni International 4 4.3 4.3 22.6
Nigerian Agip Oil Co 12 12.9 12.9 35.5
Total LNG 5 5.4 5.4 40.9
PPMC 10 10.8 10.8 51.6
Oil World Ltd 8 8.6 8.6 60.2
Zacklion Construction 5 5.4 5.4 65.6
Nigerian Gas Company 6 6.5 6.5 72.0
Dar Oil Ltd 6 6.5 6.5 78.5
NNPC 20 21.5 21.5 100.0
Total 93 100.0 100.0

49
Frequencies
Statistics
NNPC Shell BV/SPDC Total LNG/TEPNG Eni International NLNG NAOC
N Valid 93 93 93 92 93 93
Missing 0 0 0 1 0 0
Frequency Table
What is your level of familiarity with international operating
companies in the Oil and Gas industry?
NNPC
Frequency Per cent Valid Per cent Cumulative Per cent
Valid
Nil 3 3.2 3.2 3.2
Low 10 10.8 10.8 14.0
Medium 19 20.4 20.4 34.4
High 61 65.6 65.6 100.0
Total 93 100.0 100.0
Shell BV/SPDC
Frequency Per cent Valid Per cent Cumulative Per cent
Valid
Nil 7 7.5 7.5 7.5
Low 30 32.3 32.3 39.8
Medium 27 29.0 29.0 68.8
High 29 31.2 31.2 100.0
Total 93 100.0 100.0
Total LNG/TEPNG
Frequency Per cent Valid Per cent Cumulative Per cent
Valid
Nil 7 7.5 7.5 7.5
Low 28 30.1 30.1 37.6
Medium 37 39.8 39.8 77.4
High 21 22.6 22.6 100.0
Total 93 100.0 100.0
Eni International
Frequency Per cent Valid Per cent Cumulative Per cent
Valid Nil 17 18.3 18.5 18.5
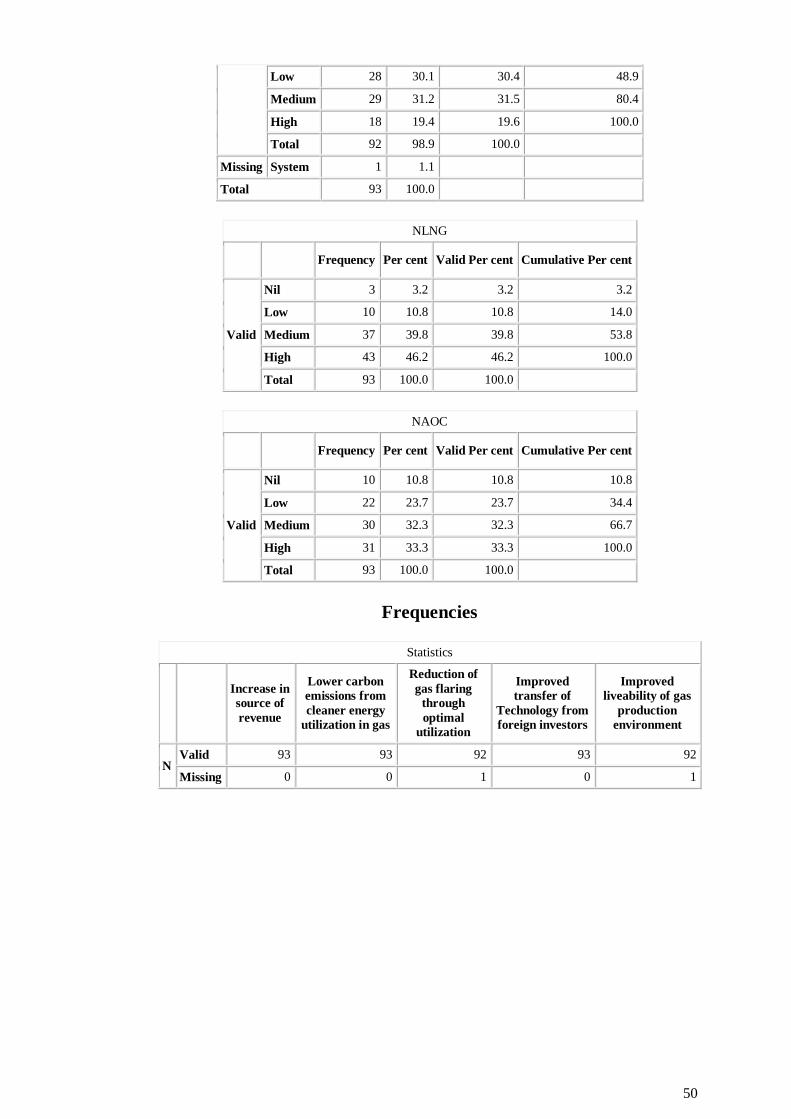
50
Low 28 30.1 30.4 48.9
Medium 29 31.2 31.5 80.4
High 18 19.4 19.6 100.0
Total 92 98.9 100.0
Missing System 1 1.1
Total 93 100.0
NLNG
Frequency Per cent Valid Per cent Cumulative Per cent
Valid
Nil 3 3.2 3.2 3.2
Low 10 10.8 10.8 14.0
Medium 37 39.8 39.8 53.8
High 43 46.2 46.2 100.0
Total 93 100.0 100.0
NAOC
Frequency Per cent Valid Per cent Cumulative Per cent
Valid
Nil 10 10.8 10.8 10.8
Low 22 23.7 23.7 34.4
Medium 30 32.3 32.3 66.7
High 31 33.3 33.3 100.0
Total 93 100.0 100.0
Frequencies
Statistics
Increase in
source of
revenue
Lower carbon
emissions from
cleaner energy
utilization in gas
Reduction of
gas flaring
through
optimal
utilization
Improved
transfer of
Technology from
foreign investors
Improved
liveability of gas
production
environment
N Valid 93 93 92 93 92
Missing 0 0 1 0 1

51
Frequency Table
What socio-economic benefits could Nigeria attain from a
successful utilization of the gas sector?
Increase in source of revenue
Frequency Per cent Valid Per cent Cumulative Per cent
Valid
Undecided 1 1.1 1.1 1.1
Agree 45 48.4 48.4 49.5
Strongly Agree 47 50.5 50.5 100.0
Total 93 100.0 100.0
Lower carbon emissions from cleaner energy utilization in gas
Frequency Per cent Valid Per cent Cumulative Per cent
Valid
Disagree 1 1.1 1.1 1.1
Undecided 7 7.5 7.5 8.6
Agree 45 48.4 48.4 57.0
Strongly Agree 40 43.0 43.0 100.0
Total 93 100.0 100.0
Reduction of gas flaring through optimal utilization
Frequency Per cent Valid Per cent Cumulative Per cent
Valid
Undecided 5 5.4 5.4 5.4
Agree 33 35.5 35.9 41.3
Strongly Agree 54 58.1 58.7 100.0
Total 92 98.9 100.0
Missing System 1 1.1
Total 93 100.0
Improved transfer of Technology from foreign investors
Frequency Per cent Valid Per cent Cumulative Per cent
Valid
Disagree 1 1.1 1.1 1.1
Undecided 17 18.3 18.3 19.4
Agree 39 41.9 41.9 61.3
Strongly Agree 36 38.7 38.7 100.0
Total 93 100.0 100.0

52
Improved liveability of gas production environment
Frequency Per cent Valid Per cent Cumulative Per cent
Valid
Disagree 3 3.2 3.3 3.3
Undecided 6 6.5 6.5 9.8
Agree 45 48.4 48.9 58.7
Strongly Agree 38 40.9 41.3 100.0
Total 92 98.9 100.0
Missing System 1 1.1
Total 93 100.0
Frequencies
Statistics
... Nigerian gas
sector is not robust
enough to cope
with unforeseen
demand
... high cost of gas
distribution is the
major factor limiting
the successful growth
of the gas sector
How important is the
gas sectoring the
development of
Nigeria’s economy in
50 yrs. time?
What is your
level of
familiarity with
Nigeria’s Gas-
Master Plan ...
N Valid 92 93 93 91
Missing 1 0 0 2
Frequency Table
Que9 ... Nigerian gas sector is not robust enough to cope with unforeseen demand
Frequency Per cent Valid Per cent Cumulative Per cent
Valid
Disagree 16 17.2 17.4 17.4
Agree 76 81.7 82.6 100.0
Total 92 98.9 100.0
Missing System 1 1.1
Total 93 100.0
Que10 ... high cost of gas distribution is the major factor limiting the successful growth of the gas sector
Frequency Per cent Valid Per cent Cumulative Per cent
Valid
Strongly Disagree 3 3.2 3.2 3.2
Disagree 7 7.5 7.5 10.8
Undecided 5 5.4 5.4 16.1
Agree 50 53.8 53.8 69.9
Strongly Agree 28 30.1 30.1 100.0
Total 93 100.0 100.0
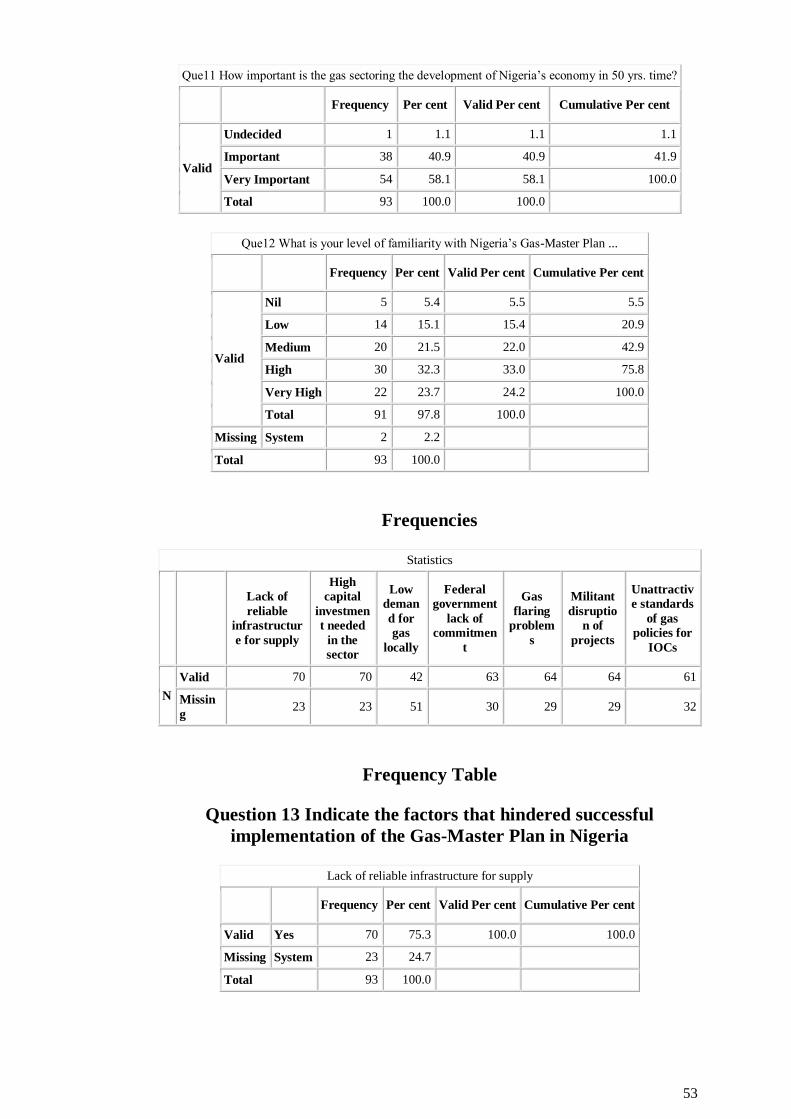
53
Que11 How important is the gas sectoring the development of Nigeria’s economy in 50 yrs. time?
Frequency Per cent Valid Per cent Cumulative Per cent
Valid
Undecided 1 1.1 1.1 1.1
Important 38 40.9 40.9 41.9
Very Important 54 58.1 58.1 100.0
Total 93 100.0 100.0
Que12 What is your level of familiarity with Nigeria’s Gas-Master Plan ...
Frequency Per cent Valid Per cent Cumulative Per cent
Valid
Nil 5 5.4 5.5 5.5
Low 14 15.1 15.4 20.9
Medium 20 21.5 22.0 42.9
High 30 32.3 33.0 75.8
Very High 22 23.7 24.2 100.0
Total 91 97.8 100.0
Missing System 2 2.2
Total 93 100.0
Frequencies
Statistics
Lack of
reliable
infrastructur
e for supply
High
capital
investmen
t needed
in the
sector
Low
deman
d for
gas
locally
Federal
government
lack of
commitmen
t
Gas
flaring
problem
s
Militant
disruptio
n of
projects
Unattractiv
e standards
of gas
policies for
IOCs
N
Valid 70 70 42 63 64 64 61
Missin
g 23 23 51 30 29 29 32
Frequency Table
Question 13 Indicate the factors that hindered successful
implementation of the Gas-Master Plan in Nigeria
Lack of reliable infrastructure for supply
Frequency Per cent Valid Per cent Cumulative Per cent
Valid Yes 70 75.3 100.0 100.0
Missing System 23 24.7
Total 93 100.0

54
High capital investment needed in the sector
Frequency Per cent Valid Per cent Cumulative Per cent
Valid Yes 70 75.3 100.0 100.0
Missing System 23 24.7
Total 93 100.0
Low demand for gas locally
Frequency Per cent Valid Per cent Cumulative Per cent
Valid Yes 42 45.2 100.0 100.0
Missing System 51 54.8
Total 93 100.0
Federal government lack of commitment
Frequency Per cent Valid Per cent Cumulative Per cent
Valid Yes 63 67.7 100.0 100.0
Missing System 30 32.3
Total 93 100.0
Gas flaring problems
Frequency Per cent Valid Per cent Cumulative Per cent
Valid Yes 64 68.8 100.0 100.0
Missing System 29 31.2
Total 93 100.0
Militant disruption of projects
Frequency Per cent Valid Per cent Cumulative Per cent
Valid Yes 64 68.8 100.0 100.0
Missing System 29 31.2
Total 93 100.0
Unattractive standards of gas policies for IOCs
Frequency Per cent Valid Per cent Cumulative Per cent
Valid Yes 61 65.6 100.0 100.0
Missing System 32 34.4
Total 93 100.0
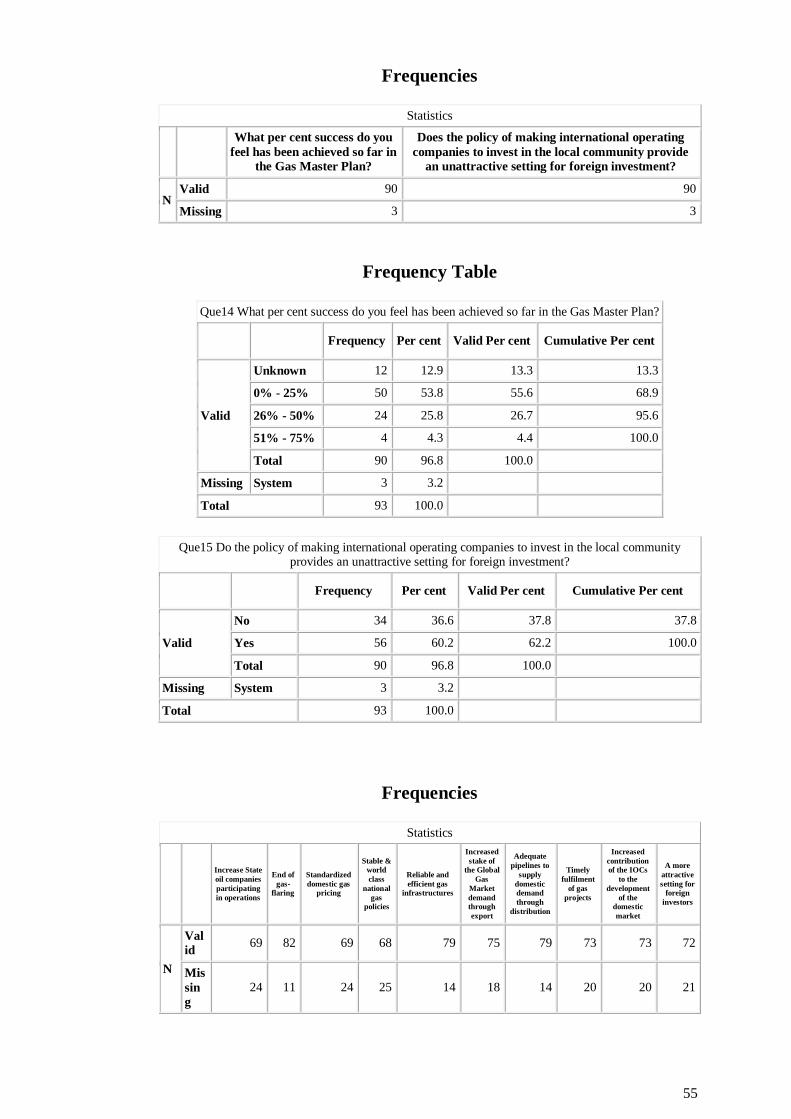
55
Frequencies
Statistics
What per cent success do you
feel has been achieved so far in
the Gas Master Plan?
Does the policy of making international operating
companies to invest in the local community provide
an unattractive setting for foreign investment?
N Valid 90 90
Missing 3 3
Frequency Table
Que14 What per cent success do you feel has been achieved so far in the Gas Master Plan?
Frequency Per cent Valid Per cent Cumulative Per cent
Valid
Unknown 12 12.9 13.3 13.3
0% - 25% 50 53.8 55.6 68.9
26% - 50% 24 25.8 26.7 95.6
51% - 75% 4 4.3 4.4 100.0
Total 90 96.8 100.0
Missing System 3 3.2
Total 93 100.0
Que15 Do the policy of making international operating companies to invest in the local community provides an unattractive setting for foreign investment?
Frequency Per cent Valid Per cent Cumulative Per cent
Valid
No 34 36.6 37.8 37.8
Yes 56 60.2 62.2 100.0
Total 90 96.8 100.0
Missing System 3 3.2
Total 93 100.0
Frequencies
Statistics
Increase State
oil companies
participating
in operations
End of
gas-
flaring
Standardized
domestic gas
pricing
Stable &
world
class
national
gas
policies
Reliable and
efficient gas
infrastructures
Increased
stake of
the Global
Gas
Market
demand
through
export
Adequate
pipelines to
supply
domestic
demand
through
distribution
Timely
fulfilment
of gas
projects
Increased
contribution
of the IOCs
to the
development
of the
domestic
market
A more
attractive
setting for
foreign
investors
N
Val
id 69 82 69 68 79 75 79 73 73 72
Mis
sin
g
24 11 24 25 14 18 14 20 20 21

56
Frequency Table
Indicate top three (3) areas you consider Most Important in the
implementation of the Gas-Master Plan for a successful Gas
sector?
Increase State oil companies participating in operations
Frequency Per cent Valid Per cent Cumulative Per cent
Valid
Important 27 29.0 39.1 39.1
Very Important 20 21.5 29.0 68.1
Most Important 22 23.7 31.9 100.0
Total 69 74.2 100.0
Missing System 24 25.8
Total 93 100.0
End of gas-flaring
Frequency Per cent Valid Per cent Cumulative Per cent
Valid
Important 21 22.6 25.6 25.6
Very Important 24 25.8 29.3 54.9
Most Important 37 39.8 45.1 100.0
Total 82 88.2 100.0
Missing System 11 11.8
Total 93 100.0
Standardized domestic gas pricing
Frequency Per cent Valid Per cent Cumulative Per cent
Valid
Important 23 24.7 33.3 33.3
Very Important 27 29.0 39.1 72.5
Most Important 19 20.4 27.5 100.0
Total 69 74.2 100.0
Missing System 24 25.8
Total 93 100.0

57
Stable & world class national gas policies
Frequency Per cent Valid Per cent Cumulative Per cent
Valid
Important 23 24.7 33.8 33.8
Very Important 23 24.7 33.8 67.6
Most Important 22 23.7 32.4 100.0
Total 68 73.1 100.0
Missing System 25 26.9
Total 93 100.0
Reliable and efficient gas infrastructures
Frequency Per cent Valid Per cent Cumulative Per cent
Valid
Important 11 11.8 13.9 13.9
Very Important 30 32.3 38.0 51.9
Most Important 38 40.9 48.1 100.0
Total 79 84.9 100.0
Missing System 14 15.1
Total 93 100.0
Increased stake of the Global Gas Market demand through export
Frequency Per cent Valid Per cent Cumulative Per cent
Valid
Important 29 31.2 38.7 38.7
Very Important 25 26.9 33.3 72.0
Most Important 21 22.6 28.0 100.0
Total 75 80.6 100.0
Missing System 18 19.4
Total 93 100.0
Adequate pipelines to supply domestic demand through distribution
Frequency Per cent Valid Per cent Cumulative Per cent
Valid
Important 18 19.4 22.8 22.8
Very Important 30 32.3 38.0 60.8
Most Important 31 33.3 39.2 100.0
Total 79 84.9 100.0
Missing System 14 15.1
Total 93 100.0
Timely fulfilment of gas projects
Frequency Per cent Valid Per cent Cumulative Per cent
Valid Important 22 23.7 30.1 30.1

58
Very Important 25 26.9 34.2 64.4
Most Important 26 28.0 35.6 100.0
Total 73 78.5 100.0
Missing System 20 21.5
Total 93 100.0
Increased contribution of the IOCs to the development of the domestic market
Frequency Per cent Valid Per cent Cumulative Per cent
Valid
Important 25 26.9 34.2 34.2
Very Important 19 20.4 26.0 60.3
Most Important 29 31.2 39.7 100.0
Total 73 78.5 100.0
Missing System 20 21.5
Total 93 100.0
A more attractive setting for foreign investors
Frequency Per cent Valid Per cent Cumulative Per cent
Valid
Important 11 11.8 15.3 15.3
Very Important 11 11.8 15.3 30.6
Most Important 50 53.8 69.4 100.0
Total 72 77.4 100.0
Missing System 21 22.6
Total 93 100.0