full company report reason: company newsflow 17 … · the strong share price performance since the...
TRANSCRIPT

Produced by: For important disclosure information, please refer to the disclaimer page of this report.
All ESN research is available on Bloomberg, “ESNR”, Thomson-Reuters, S&P Capital IQ, FactSet
Distributed by the Members of ESN (see last page of this report)
Full Company Report Reason: Company newsflow 17 May 2018
Narrowing the profitability gap to peers
The First Sensor group (FIS) is an established sensor producer with leading
market positions in clearly defined strategic target markets. During the next
years the group will benefit from various megatrends related to different
industries. Based on its outlined strategy the group will reach a sustainable,
higher level of profitability in our view. Furthermore the group will remain a
strong cash flow generator. The strong share price performance since the
beginning of 2016 already partly reflects the positive outlook. We initiate our
coverage for the First Sensor shares with an Accumulate rating and a target
price of EUR 27.00 per share.
Benefitting from some megatrends: FIS serves three strategic target markets
which are Industrial, Medical and Mobility. Industry 4.0 will change the
philosophy of production and sensors and sensor systems definitely will play an
important role. In Medical E-health applications are on the rise, while in Mobility
autonomous driving, among other factors, is in the centre of First Sensor's
interest.
Five pillar strategy: The profitable growth strategy is based on five pillars: 1)
Target Markets Industrial, Medical and Mobility where FIS will benefit from
several megatrends. Therefore more customised products and solutions will be
developed. 2) Key customers and products: The benefit will come from better
economies of scale. 3) Forward Integration: Selling more systems and solutions
which offer a higher margin potential. 4) Internationalization: Entrance and
penetration of new markets in North America and Asia. 5) Operational
excellence: Cross sectional function for better margins.
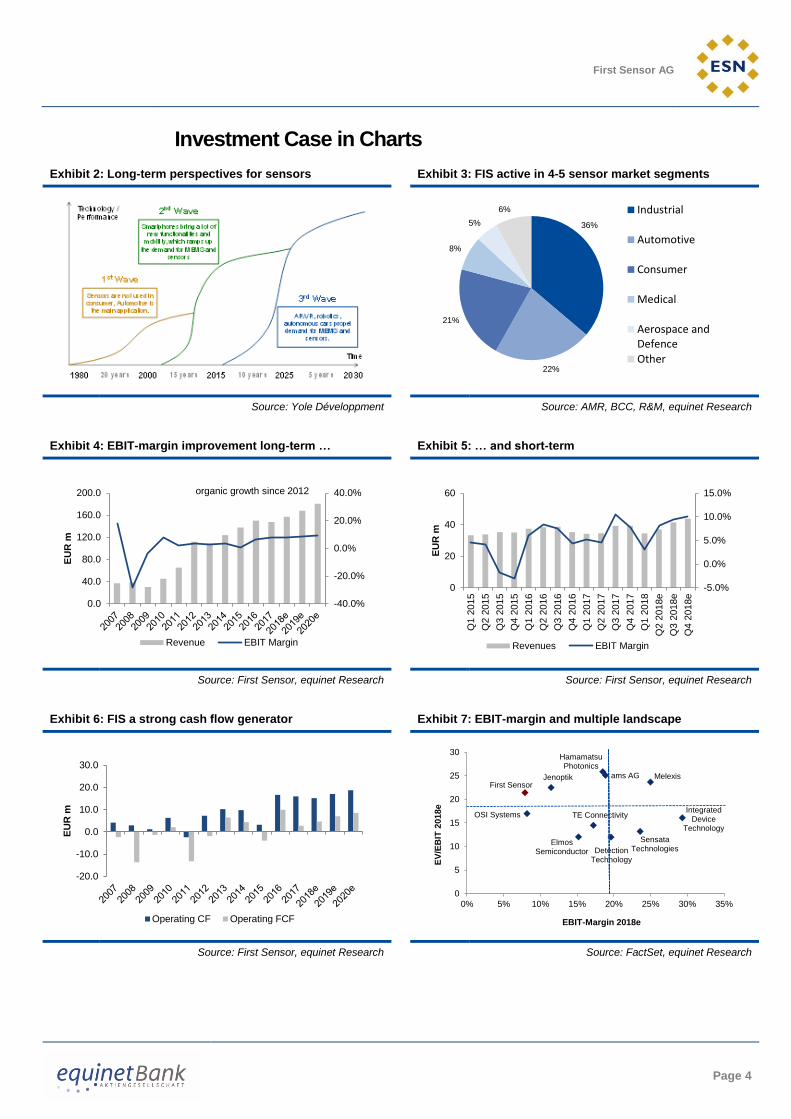
Profitability uplift: With regard to EBIT-margins FIS harvested first fruits, as
can be seen in the EBIT-margin 2016 of 6.6% (2015: 0.9%) and 2017 of 7.2%.
Mid-term we estimate a level of >9% while the company is aiming for ~10% on a
sustainable level, what is not out of reach in our view.
FIS a strong cash flow generator: The operating cash flow margin in the last
two years came out higher than 10%, combined with a favourable cash
conversion rate >"1" (2013: 3.8x). We expect this level to continue so that
financing of the growth, in addition with other financial sources, is secured in our
view.
Reopening of dividend payments: After ten years without paying dividends for
2017 the management made the proposal to the AGM to pay EUR 0.16 per
share (payout ratio of 40%). We interpret this as a sign of confidence to capital
markets that First Sensor is on the right track.
Key risks comprise among other factors: 1) FIS might not keep the speed with
regard to new, innovative products and as a result could lose market share over
time. 2) FIS will not meet timely all defined milestones of their overall strategy
plan what can result in a lower than expected profitability. 3) Hiring of new and
skilled employees could become more challenging.
First Sensor AG
Sponsored Research
Investment Research Germany | Technology Hardware & Equipment
Analyst(s)
Winfried Becker
+49 69 58997-416
Accumulate
23.90closing price as of 16/05/2018
27.00
13.0%Upside/Downside Potential
from
Target price: EUR
Share price: EUR
Reuters/Bloomberg SISG.DE/SIS GR
Market capitalisation (EURm) 244
Current N° of shares (m) 10
Free float 59%
Daily avg. no. trad. sh. 12 mth 29
Daily avg. trad. vol. 12 mth (m) 742.95
Price high/low 12 months 11.15 / 30.50
Abs Perfs 1/3/12 mths (%) -2.05/6.70/105.15
Key financials (EUR) 12/17 12/18e 12/19e
Sales (m) 148 157 168
EBITDA (m) 20 23 23
EBITDA margin 13.3% 14.4% 13.9%
EBIT (m) 11 12 14
EBIT margin 7.2% 7.9% 8.0%
Net Profit (adj.)(m) 4 7 8
ROCE 6.0% 7.0% 7.6%
Net debt/(cash) (m) 23 20 15
Net Debt Equity 0.3 0.2 0.2
Net Debt/EBITDA 1.2 0.9 0.6
Int. cover(EBITDA/Fin.int) 10.6 10.5 10.8
EV/Sales 1.7 1.7 1.5
EV/EBITDA 12.6 11.8 11.2
EV/EBITDA (adj.) 12.6 11.8 11.2
EV/EBIT 23.4 21.4 19.2
P/E (adj.) nm 35.6 31.9
P/BV 2.8 2.8 2.7
OpFCF yield 1.2% 1.9% 2.9%
Dividend yield 0.7% 0.8% 0.8%
EPS (adj.) 0.40 0.67 0.75
BVPS 7.91 8.42 8.99
DPS 0.16 0.18 0.20
Shareholders
DPE Deutsche Private Equity GmbH 36%; Teslin Capital
Management BV 5%;
10
12
14
16
18
20
22
24
26
28
30
32
Apr 17 Mai 17 Jun 17 Jul 17 Aug 17 Sep 17 Okt 17 Nov 17 Dez 17 Jan 18 Feb 18 Mrz 18 Apr 18 Mai 18
vvdsvdvsdy
FIRST SENSOR AG SDAX (Rebased)
Source: Factset

First Sensor AG
Page 2
CONTENTS
First Sensor at a glance 3
Investment case in charts 4
Investment case and SWOT analysis 5
Valuation 7
DCF valuation 7
Peer group analysis 9
Company profile 12
Company overview 12
First Sensor's strategy for growth 12
Segment Industrial 15
Segment Medical 16
Segment Mobility 17
Market environment 19
Financials 23
Earnings analysis 23
Financial analysis 25
List of abbreviations 28

First Sensor AG
Page 3
Exhibit 1: First Sensor at a glance
Source: First Sensor, equinet Research; Customers: solely equinet Research
Business Units
Guidance 2018e (First Sensor): equinet Estimates
Revenue: Revenue:y/y y/y
EBIT EBIT
CEO CFO
# of employees
FY 2017798 (FTE)
Daimler Trucks, VW, FUSO, Volvo, Renault, Paccar, Hella, Delphi, Velodyne,
Autoliv, Kenworth, DAF, Navistar, Western Star
Bosch, Hamamatsu, Excelitas, Sensata Technologies
A) Development of Industry 4.0, B) Demand for process automation
A broad customer base of c. 2.000 business clients
No concrete figures disclosed; most likely strong position in industrial pressure
sensors and optical sensor solutions
Hamamatsu, Amphenol Advanced Sensors, Excelitas, Detection Technology,
Smi Pressure Sensors
Positioned in strategic target markets which are of limited interest for large players; FIS covers the entire value chain for sensor solution systems; focus on individual solutions for specific customer needs; higher pricing power for sensor
system solutions due to high complexity; lower pricing power in the direction of suppliers;
Strategy: Higher profitability
(I) Targets and Markets
(II) Key Customer & Products
(III) Forward integration
(IV) Internationalization
Roche, Fresenius, Siemens, Draegerwerke
Most likely strong position in pressure and flow
7.2% Organic growth y/y n.a.
No concrete figures disclosed; most likely above average position pressure
sensors; optical sensors (e.g. LiDAR systems) with strong growth in upcoming
years
OEMs for medical devices
Sales (EURm)
A) Miniaturization of medical technology, B) increasing demand for intelligent
solutions, which analyse and communicate the measured data, C) general e-
health trend
Honeywell, all sensors, Merit Sensor, OSI Systems, Sensirion
A) Autonomous driving, B) Green mobility
Sales 5Y hist. CAGR 5.7%10.6
A broad range of industrial end-markets Automotive OEMs and large suppliers, retrofitters
Shareholder
structure &
management
Dr. Dirk Rothweiler Dr. Mathias Gollwitzer Shareholder structure
CEO (appointed until end of 2019)
• Background in physics
• EVP Optical Systems at Jenoptik
• Vice President Sales & Service at TCZ
• MD Asia-Pacific for Süss Microtec AG
CFO (appointed until 2022)
• Head of group controlling, EnBW
• CFO Mercedes-Benz France SAS
• Head of Corporate Controlling, DaimlerChrysler AG
Sales & EBIT
Split
Sales split by region Sales split by division Group sales development
2017147.5 EBITDA (EURm) 19.6 EBIT adj. (EURm)
Margin 13.3% Margin
Strategy &
Guidance
ConsensusEUR 150-160m EUR 157m n.a.
1.7% - 8.5% 6.4% n.a.
7.0% - 9.0% 7.9% n.a.
Market share/
positioning
Customers
Drivers
Entry barriers/
competitive
advantage
Main
competitors
Products/
applications
Medical Mobility
First Sensor offers solutions measuring pressure, flow, liquid level, oxygen,
light, radiation and acceleration for such areas as breathing and respiration,
dialysis, endoscopy, and diacnostics.
In the segment Mobility, First Sensor develops and manufacturs sensor
devices in such applications as advanced driver assistance systems (ADAS)
and OEM pressure sensors and camera solutions
Industrial
A wide range of standardized and customized sensors in such applications as
length measurement, radiation and security, Smart Building, industrial process
control and aerospace
50%
28%
12%
10% 0% DACH
Other Europe
North America
Asia
Other
51%
19%
30%
Industrial
Medical
Mobility
DPE Deutsche
Priv ate Equity
GmbH
36%
Teslin Capital Management
BV
5%
Free Float59%
0.0%
2.0%
4.0%
6.0%
8.0%
10.0%
0
50
100
150
200
2015 2016 2017 2018e 2019e 2020e
EU
R m
Industrial Medical Mobil ity EBIT margin
First Sensor AG
Page 4
Investment Case in Charts
Exhibit 2: Long-term perspectives for sensors Exhibit 3: FIS active in 4-5 sensor market segments
Source: Yole Développment Source: AMR, BCC, R&M, equinet Research
Exhibit 4: EBIT-margin improvement long-term … Exhibit 5: … and short-term
Source: First Sensor, equinet Research Source: First Sensor, equinet Research
Exhibit 6: FIS a strong cash flow generator Exhibit 7: EBIT-margin and multiple landscape
Source: First Sensor, equinet Research Source: FactSet, equinet Research
36%
22%
21%
8%
5%
6% Industrial
Automotive
Consumer
Medical
Aerospace andDefence
Other
-40.0%
-20.0%
0.0%
20.0%
40.0%
0.0
40.0
80.0
120.0
160.0
200.0
EU
R m
Revenue EBIT Margin
organic growth since 2012
-5.0%
0.0%
5.0%
10.0%
15.0%
0
20
40
60
Q1
2015
Q2 2
015
Q3
2015
Q4
2015
Q1 2
016
Q2
2016
Q3
2016
Q4
2016
Q1
2017
Q2
2017
Q3
2017
Q4
2017
Q1
2018
Q2 2
018e
Q3 2
018e
Q4 2
018e
EU
R m
Revenues EBIT Margin
-20.0
-10.0
0.0
10.0
20.0
30.0
EU
R m
Operating CF Operating FCF
ams AG
Detection Technology
Elmos Semiconductor
Hamamatsu Photonics
Integrated Device
Technology
Jenoptik Melexis
OSI Systems
Sensata Technologies
TE Connectivity
First Sensor
0
5
10
15
20
25
30
0% 5% 10% 15% 20% 25% 30% 35%
EV
/EB
IT 2
018e
EBIT-Margin 2018e

First Sensor AG
Page 5
Investment case and SWOT analysis
The First Sensor group currently holds leading market positions in its defined strategic end-
markets. These markets have high entry barriers for other medium-sized companies and
volumes most likely are too small for the large players in our view.
The company covers the entire value chain for sensors and related systems. Looking
forward, First Sensor is well positioned to benefit from some megatrends like for example
autonomous driving or Industry 4.0. By benefitting from these trends the current strategy is
directed to a higher margin level and in 2016 and 2017 the group could harvest the first
fruits of this program. Nevertheless the margin level is still behind to some of its listed peer
group companies.
The share price performance since early 2016 reflected already the increase in First
Sensor’s profitability. Since the beginning of 2016 to date the share price showed an
impressive performance of 95% and clearly outperformed the TecDax with an increase of
43%. Year to date the First Sensor shares are up another 11.2%. From this perspective it
seems that some of the positive expectations are already included in the current share price
level.
Exhibit 8: First Sensor: Three years performance Exhibit 9: First Sensor: One year performance
Prices as of 16.05.2018 Prices as of 16.05.2018
Further triggers for the share price in our view are any signs for a further sustainable margin
improvement. These signs can be for example the winning of new high volume OEM
customers, new product innovations, internal cost savings measures or entering new
markets.
The macro picture in Germany and Europe shows first signs that the current boom is
normalizing. The April figure for the German Ifo climate index declined to 102.1 index
points. It is the fifth month in a row with declining figures. It is our impression that the
German economy is slowing down but currently far away from a recession. Pessimists
might raise the question later this year, if a soft landing or a sharp move towards a
recession is the correct scenario.

First Sensor AG
Page 6
Exhibit 10: First Sensor: SWOT – analysis
Source: equinet Research
STRENGTHS WEAKNESSES
Solid market positions in its relevant markets
Strong financial profile with high cash flow orientation
FIS covers the entire value chain for sensor technology
Shareholders have not benefitted from dividend payments since FY2007; 2017e: EUR 0.16
EBIT-margin level currently behind peer-group average
OPPORTUNITIES THREATS
Five pillar strategy argue for a higher margin level
Offering sensor systems in line with megatrends like e.g. autonomous driving, miniaturization of medical equipment, Industry 4.0
Increase the sales portion of sensor system solutions with higher value added
Fast technological change could lead to growing investment needs
Hiring of skilled employees could become more challenging

First Sensor AG
Page 7
Valuation We value the First Sensor shares and derive the target price from our DCF-model. We have
built a base case scenario and in addition a more optimistic view can be seen in a bull case
scenario.
DCF valuation
To calculate the equity value for First Sensor we use our three-stage DCF-model to
determine future cash flows. In our first stage, we calculate a detailed P&L, Balance Sheet
and Cash Flow statement for the period up to 2022e based on information provided by the
company and our own market assessment. In stage two, we switch over to a trend analysis
until 2027e for some key drivers like for example sales growth, EBIT-margin and
investments. In the third stage, we analyze and calculate the terminal value on the basis of
a going-concern assumption. In addition to the listed base input factors, currently we use a
terminal growth rate of 2.5% and a sustainable EBIT-margin of 9.5%.
Exhibit 11: First Sensor: DCF model – Base Case
Source: equinet Research
The major trigger for a further margin improvement is First Sensor’s five-pillar strategy in
our view. The first fruits were already harvested in FY2017, when the EBIT-margin
increased further to 7.2% from 6.6% a year earlier. The last capital markets day in March
Phase III
EUR m 2018e 2019e 2020e 2021e 2022e 2023e 2024e 2025e 2026e 2027e
Revenues 157.0 168.0 180.8 194.9 210.0 224.4 237.9 250.1 260.7 269.5
growth rate 6.4% 7.0% 7.6% 7.8% 7.7% 6.9% 6.0% 5.1% 4.2% 3.4%
EBIT 12.4 13.5 15.6 17.8 19.8 21.2 22.5 23.7 24.7 25.6
EBIT margin 7.9% 8.0% 8.6% 9.1% 9.4% 9.5% 9.5% 9.5% 9.5% 9.5%
Tax -3.7 -4.1 -4.7 -5.3 -5.9 -6.4 -6.8 -7.1 -7.4 -7.7
Tax rate 30% 30% 30% 30% 30% 30% 30% 30% 30% 30%
Depr. & Amort. 10.2 9.8 9.9 10.2 10.3 11.2 11.9 12.5 13.1 13.6
% of sales 6.5% 5.8% 5.5% 5.2% 4.9% 5.0% 5.0% 5.0% 5.0% 5.0%
Capex -10.5 -10.0 -10.2 -11.0 -11.1 -11.9 -12.6 -13.2 -13.8 -14.2
% of sales 6.7% 6.0% 5.6% 5.6% 5.3% 5.3% 5.3% 5.3% 5.3% 5.3%
Change in WC & P -0.7 -0.5 -0.4 -0.1 0.2 0.2 0.2 0.2 0.2 0.1
% of sales 0.4% 0.3% 0.2% 0.1% -0.1% -0.1% -0.1% -0.1% -0.1% -0.1%
Free Cash Flow 7.7 8.8 10.2 11.5 13.3 14.4 15.3 16.1 16.8 17.4 400.3
growth rate nm 13.7% 16.9% 12.3% 15.9% 7.9% 6.5% 5.3% 4.3% 3.4% 2.5%
Present Value FCF 7.4 7.9 8.6 9.0 9.8 9.9 9.8 9.7 9.4 9.1 209.7
PV Phase I 42.6 Risk free rate 3.5% Targ. equity ratio 60%
PV Phase II 47.8 Premium Equity 5.0% Beta 1.1
PV Phase III 209.7 Premium Debt 2.0% WACC 7.0%
Enterprise value 300.1 Sensitivity
- Net Debt (Cash) 22.8 1.5% 2.0% 2.5% 3.0% 3.5%
- Pension Provisions 0.3 6.26% 27.0 29.5 32.7 36.8 42.4
- Minorities & Peripherals 1.2 6.60% 24.9 27.0 29.6 32.9 37.3
+ MV of financial assets WACC 6.95% 23.1 24.8 27.0 29.7 33.2
- Paid-out dividends for last FY 0.0 7.30% 21.4 23.0 24.8 27.0 29.9
+/- Other EV items 7.65% 20.0 21.3 22.9 24.7 27.1
Equity value 275.8
Number of shares 10.2
Value per share (€) 27.0
Current Price (€) 23.9
Upside 13%
Phase I Phase II
Growth in phase III
First Sensor AG
Page 8
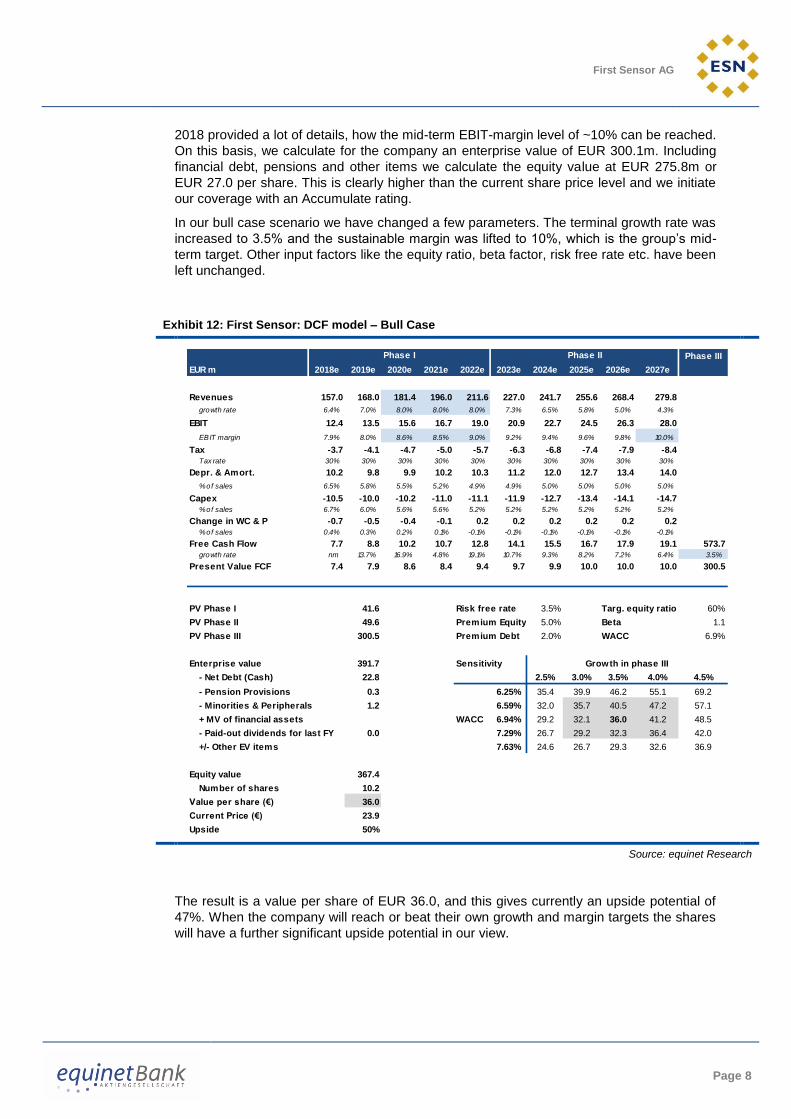
2018 provided a lot of details, how the mid-term EBIT-margin level of ~10% can be reached.
On this basis, we calculate for the company an enterprise value of EUR 300.1m. Including
financial debt, pensions and other items we calculate the equity value at EUR 275.8m or
EUR 27.0 per share. This is clearly higher than the current share price level and we initiate
our coverage with an Accumulate rating.
In our bull case scenario we have changed a few parameters. The terminal growth rate was
increased to 3.5% and the sustainable margin was lifted to 10%, which is the group’s mid-
term target. Other input factors like the equity ratio, beta factor, risk free rate etc. have been
left unchanged.
Exhibit 12: First Sensor: DCF model – Bull Case
Source: equinet Research
The result is a value per share of EUR 36.0, and this gives currently an upside potential of
47%. When the company will reach or beat their own growth and margin targets the shares
will have a further significant upside potential in our view.
Phase III
EUR m 2018e 2019e 2020e 2021e 2022e 2023e 2024e 2025e 2026e 2027e
Revenues 157.0 168.0 181.4 196.0 211.6 227.0 241.7 255.6 268.4 279.8
growth rate 6.4% 7.0% 8.0% 8.0% 8.0% 7.3% 6.5% 5.8% 5.0% 4.3%
EBIT 12.4 13.5 15.6 16.7 19.0 20.9 22.7 24.5 26.3 28.0
EBIT margin 7.9% 8.0% 8.6% 8.5% 9.0% 9.2% 9.4% 9.6% 9.8% 10.0%
Tax -3.7 -4.1 -4.7 -5.0 -5.7 -6.3 -6.8 -7.4 -7.9 -8.4
Tax rate 30% 30% 30% 30% 30% 30% 30% 30% 30% 30%
Depr. & Amort. 10.2 9.8 9.9 10.2 10.3 11.2 12.0 12.7 13.4 14.0
% of sales 6.5% 5.8% 5.5% 5.2% 4.9% 4.9% 5.0% 5.0% 5.0% 5.0%
Capex -10.5 -10.0 -10.2 -11.0 -11.1 -11.9 -12.7 -13.4 -14.1 -14.7
% of sales 6.7% 6.0% 5.6% 5.6% 5.2% 5.2% 5.2% 5.2% 5.2% 5.2%
Change in WC & P -0.7 -0.5 -0.4 -0.1 0.2 0.2 0.2 0.2 0.2 0.2
% of sales 0.4% 0.3% 0.2% 0.1% -0.1% -0.1% -0.1% -0.1% -0.1% -0.1%
Free Cash Flow 7.7 8.8 10.2 10.7 12.8 14.1 15.5 16.7 17.9 19.1 573.7
growth rate nm 13.7% 16.9% 4.8% 19.1% 10.7% 9.3% 8.2% 7.2% 6.4% 3.5%
Present Value FCF 7.4 7.9 8.6 8.4 9.4 9.7 9.9 10.0 10.0 10.0 300.5
PV Phase I 41.6 Risk free rate 3.5% Targ. equity ratio 60%
PV Phase II 49.6 Premium Equity 5.0% Beta 1.1
PV Phase III 300.5 Premium Debt 2.0% WACC 6.9%
Enterprise value 391.7 Sensitivity
- Net Debt (Cash) 22.8 2.5% 3.0% 3.5% 4.0% 4.5%
- Pension Provisions 0.3 6.25% 35.4 39.9 46.2 55.1 69.2
- Minorities & Peripherals 1.2 6.59% 32.0 35.7 40.5 47.2 57.1
+ MV of financial assets WACC 6.94% 29.2 32.1 36.0 41.2 48.5
- Paid-out dividends for last FY 0.0 7.29% 26.7 29.2 32.3 36.4 42.0
+/- Other EV items 7.63% 24.6 26.7 29.3 32.6 36.9
Equity value 367.4
Number of shares 10.2
Value per share (€) 36.0
Current Price (€) 23.9
Upside 50%
Phase I Phase II
Growth in phase III
First Sensor AG
Page 9
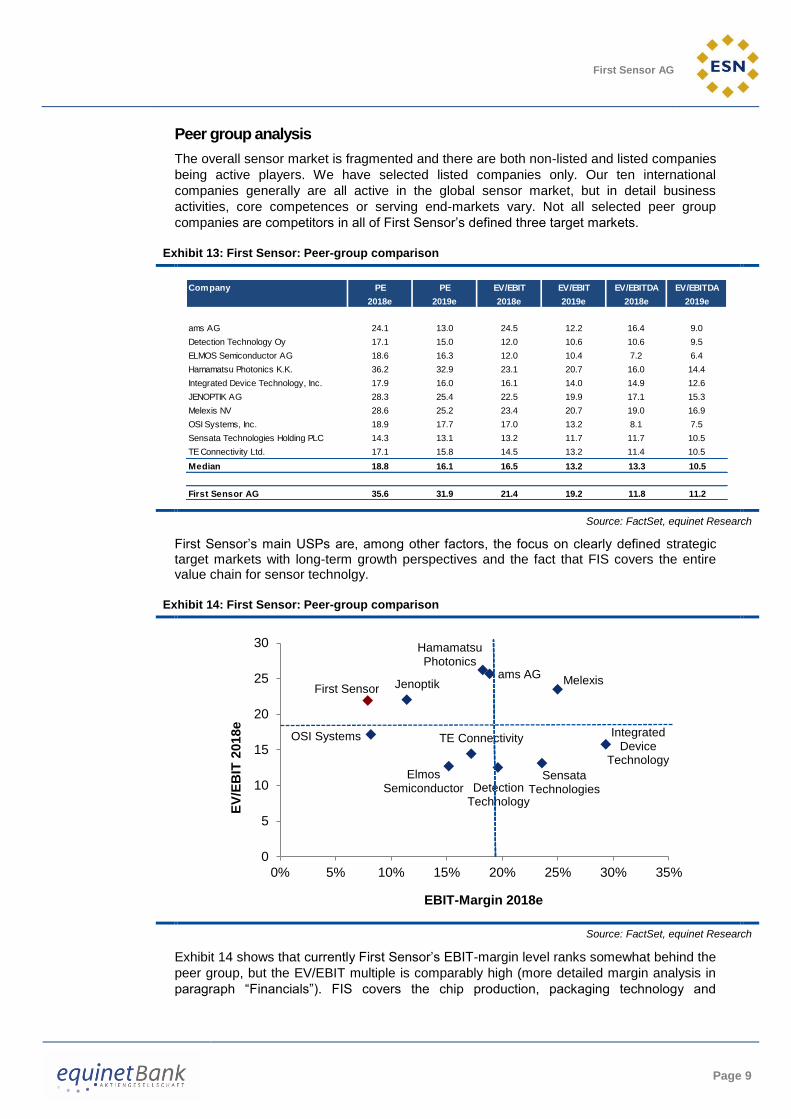
Peer group analysis
The overall sensor market is fragmented and there are both non-listed and listed companies
being active players. We have selected listed companies only. Our ten international
companies generally are all active in the global sensor market, but in detail business
activities, core competences or serving end-markets vary. Not all selected peer group
companies are competitors in all of First Sensor’s defined three target markets.
Exhibit 13: First Sensor: Peer-group comparison
Source: FactSet, equinet Research
First Sensor’s main USPs are, among other factors, the focus on clearly defined strategic target markets with long-term growth perspectives and the fact that FIS covers the entire value chain for sensor technolgy.
Exhibit 14: First Sensor: Peer-group comparison
Source: FactSet, equinet Research
Exhibit 14 shows that currently First Sensor’s EBIT-margin level ranks somewhat behind the
peer group, but the EV/EBIT multiple is comparably high (more detailed margin analysis in
paragraph “Financials”). FIS covers the chip production, packaging technology and
Company PE PE EV/EBIT EV/EBIT EV/EBITDA EV/EBITDA
2018e 2019e 2018e 2019e 2018e 2019e
ams AG 24.1 13.0 24.5 12.2 16.4 9.0
Detection Technology Oy 17.1 15.0 12.0 10.6 10.6 9.5
ELMOS Semiconductor AG 18.6 16.3 12.0 10.4 7.2 6.4
Hamamatsu Photonics K.K. 36.2 32.9 23.1 20.7 16.0 14.4
Integrated Device Technology, Inc. 17.9 16.0 16.1 14.0 14.9 12.6
JENOPTIK AG 28.3 25.4 22.5 19.9 17.1 15.3
Melexis NV 28.6 25.2 23.4 20.7 19.0 16.9
OSI Systems, Inc. 18.9 17.7 17.0 13.2 8.1 7.5
Sensata Technologies Holding PLC 14.3 13.1 13.2 11.7 11.7 10.5
TE Connectivity Ltd. 17.1 15.8 14.5 13.2 11.4 10.5
Median 18.8 16.1 16.5 13.2 13.3 10.5
First Sensor AG 35.6 31.9 21.4 19.2 11.8 11.2
ams AG
Detection Technology
Elmos Semiconductor
Hamamatsu Photonics
Integrated Device
Technology
Jenoptik Melexis
OSI Systems
Sensata Technologies
TE Connectivity
First Sensor
0
5
10
15
20
25
30
0% 5% 10% 15% 20% 25% 30% 35%
EV
/EB
IT 2
018e
EBIT-Margin 2018e

First Sensor AG
Page 10
distribution of sensor products which vary in their margin level. That has to be taken into
account, when comparing the margins with the other players.
Profile of peer-group companies
ams AG
ams AG develops and manufactures analog semiconductors, sensors and related solutions
for customers in consumer, industrial, medical, mobile communication and automotive end
markets. In FY 2017 the company achieved sales of about EUR 1,064m and an operating
income of EUR 169m (margin of 16%) while employing 7,016 people. The company’s core
business areas are Optical sensing, Imaging and Audio and Environmental Sensing. ams
AG is somewhat diversified geographically, with the bulk of revenues coming from Asia
(47%), as well as smaller contributions from EMEA (33%) and the Americas (20%). ams AG
published its Q1 2018 results on the 24th of April with a profit warning for Q2 2018e.
Detection Technology
Finish Detection Technology was founded in 1991 and engages in the design and
manufacture of X-ray imaging components and systems. Products include photodiodes,
detectors and many more. In FY 2017 the company achieved net sales of about EUR 89m
and an operating income of EUR 19.9m (margin of 22.3%). The company currently employs
405 people. The company’s segments are Security and Industrial Business Unit (SBU,
sales share of 65%) and Medical Business Unit (MBU, 35%). Detection Technology shows
little geographic diversification, with a bulk of revenues coming from Asia (63%), as well as
smaller contributions from Europe (12%) and the Americas (25%).
ELMOS Semiconductor AG
ELMOS Semiconductor is a manufacturer of semiconductor based system solutions
headquartered in Dortmund, Germany. In its Semiconductor segment the company offers
solutions with applications in household appliances, digital cameras, building technology
and machine control systems. The Micromechanics segment provides micro-mechanical
technologies in bulk and thin film engineering used in sensors. Most of the products were
shipped into automotive end markets. In FY 2017 ELMOS Semiconductor achieved sales of
about EUR 250.4m and an EBIT of EUR 38.4m (margin of 15.3%).
Hamamatsu Photonics K.K.
Japanese Hamamatsu Photonics is a producer of imaging and analyzing systems,
photomultiplier tubes, imaging devices and various other products. The company’s
segments are Electron Tube (sales share of 53%), Opto-semiconductors (28%), Imaging
and Measurement Instruments (12%) and others being responsible for the remainder. On
April 20 2018, the company pushed up its guidance number for 2018 significantly and has
raised its operating profit guidance to Yen 14,900m from Yen 11,600m, reflecting the
favorable business performance.
Integrated Device Technology Inc.
Integrated Device Technology, Inc. was founded 1980 and today develops system-level
solutions that optimize its customers’ applications. The company products in RF, high
performance timing, memory interface, real-time interconnect, optical interconnect, wireless
power, and smart sensors. These products are among the company’s braod array of
complete mixed-signal solutions for communication, computing, consumer, automotive and
industrial end-markets. The San Jose based company achieved sales of USD 728.2m and
an operating income of USD 110m (15% margin) in 2017. Besides their traditional business

First Sensor AG
Page 11
areas, Integrated Device Technology also engages in Cloud concepts and cloudification of
infrastructure.
Jenoptik AG
German-based Jenoptik AG is a globally operating technology company. In their Optics &
Life Science segment the company is one of the global development and production
partners for optical and micro optical systems and components. The Mobility segment
engages in the production of measurement technology and laser machines while the
Defense & Civil Systems segment develops, manufactures and markets mechatronic and
sensor products for civil and military markets. Jenoptik AG published sales of EUR 748m
and an EBIT of EUR 78m in 2017. The majority of revenues are generated in Europe (58%),
the rest attributable to the Americas (23%) and Asia (15%). The biggest single shareholder
is Thüringer Industriebeteiligungs GmbH & Co. KG with a stake of 11%, according to
Jenoptik AG.
Melexis NV
The foundation of Melexis dates back to 1988, when the Belgian company was founded by
Roland Duchatelet. Its main target market is the automotive industry where it supplies
integrated semiconductor devices. Its portfolio comprises sensors, actuators,
radiofrequency circuits and micro-optical circuits. Based on reported figures, 2017 the group
achieved sales of EUR 511.6m and an EBIT of EUR 132.6m resulting in a margin of 26%.
On April 20 Melexis reported Q1 2018 results, indicating a sales growth of 13% yoy. Melexis
has announced to invest EUR 75m over a period of 5 years into new production facilities in
Bulgaria and expects to grow the workforce from 425 to 575 in 2018.
OSI Systems Inc.
OSI Systems is an integrated designer and manufacturer of specialized electronic systems
and components for critical applications. The firm sells its products and services in
diversified markets including homeland security, healthcare, defense and aerospace. The
company was founded by Deepak Chopra in 1987 and is headquartered in Hawthorne,
USA. The security segment generated USD 550m in sales while Healthcare accounted for
USD 200m and Optoelectronics for USD 206m. Total income from operations amounted to
USD 33.2m in FY 2017. Because of its recent success, OSI Systems announced its
intention to buy back 1m shares in March 2018.
Sensata Technologies Holding plc
Sensata Technologies has a long-lasting track record in sensing technology. Today the
company engages in designing, customizing and manufacturing of mission-critical sensors
and controls. With its products it serves a large variety of end-markets, among them for
example Aerospace & Defense, Marine, Agriculture or Material Handling. Being closer to
First Sensor Sensata is also active in Automotive, Medical and other than already
mentioned Industrial markets. Revenues in the first quarter increased by 9.8% to USD
886.3m, while net profit was up by 26.1% and amounted to USD 90.5m.
TE Connectivity Ltd.
Founded in 2000, Swiss TE Connectivity is a producer of connectivity and sensor solutions.
Products range from data and energy cables to high-end sensors and relays. Sales of USD
13,113m distribute to the segments Transportation solutions (53%), Industrial solution
(27%) and Communication solutions (20%). Income from continuing operations
consequently amounts to USD 1,673m.

First Sensor AG
Page 12
Company Profile
Company overview
In 1991 the company was established as Silicon Sensor GmbH by former employees from
VEB Werk für Fernsehelektronik (in the former German Democratic Republic). As Silicon
Sensor International AG the company went public in 1999. Sales at that time amounted to
EUR 2.97m. In 2011 the company’s name was changed into First Sensor AG and in the
same year the Sensortechnics group was acquired. The strategic rationale behind this
important acquisition was a substantial enlargement of the product offering.
Today, First Sensor group comprises the holding company and ten daughter companies
with nine production and development locations as well as further six sales companies. The
group offers a wide variety of products from sensors to sensor modules and complex sensor
systems solutions. With this range of products and solutions the group focusses on the
three target markets Industrial, Medical and Mobility. The group serves nearly 3,000
customers with some 5,000 products.
First Sensor, so far, achieved a substantial growth. Sales CAGR 2007 – 2017 including
acquisitions reached 14.8%, while the reported EBIT grew by 4.8% with a significant
recovery being visible in the last two years. 2017 the group reached an EBIT-margin of
7.2%. CAGR for the operating cash flow amounted to 13.1%. With an equity ratio between
45% and 50% and a net debt/EBITDA ratio of 1.3 (FY 2017) the group has a solid financial
profile in our view. Mid-term the group wants to achieve an EBIT-margin of ~10%, which is
ambitious but not out of reach. Currently the company has a free float of nearly 61%.
First Sensor’s strategy for further growth
Target of profitable growth should be reached by a five pillar strategy
First Sensor business will benefit from some global megatrends
Achieving a sustainable EBIT-margin of ~10%
The overall target of the group is to achieve a continuing profitable growth, which is a
common goal for an economically acting company and hence is not unique to First Sensor.
After several years of a lower level of profitability since 2016 a recovery of the EBIT-margin
has become visible and according to our assessment there is still room for a further margin
increase.
In the technology driven sensor technology market First Sensor group is focussing on
standard products and on customer-specific solutions. The solutions business, under
normal circumstances, offers a higher margin potential. First Sensor sees its core
competences in particular in:
the designing and manufacturing of silicon-based sensor chips and
the layout and connection technology (LCT), on the basis of which chips become
sensors and sensor systems.
First Sensor AG
Page 13
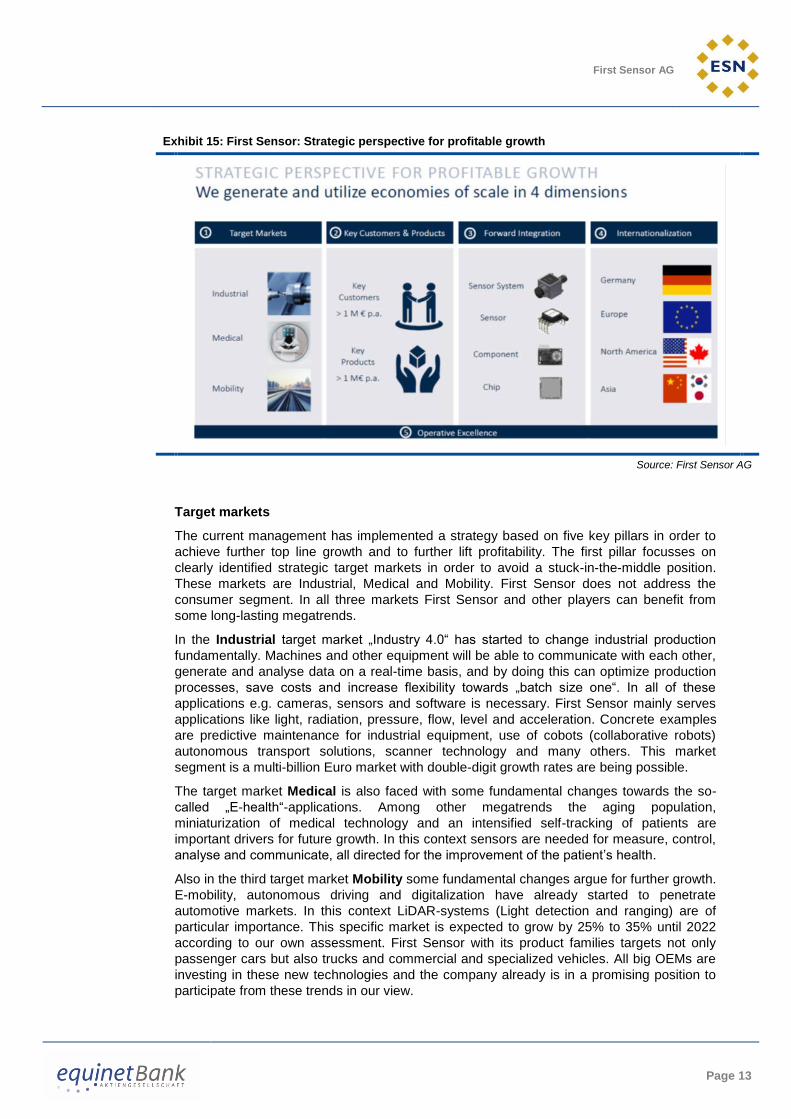
Exhibit 15: First Sensor: Strategic perspective for profitable growth
Source: First Sensor AG
Target markets
The current management has implemented a strategy based on five key pillars in order to
achieve further top line growth and to further lift profitability. The first pillar focusses on
clearly identified strategic target markets in order to avoid a stuck-in-the-middle position.
These markets are Industrial, Medical and Mobility. First Sensor does not address the
consumer segment. In all three markets First Sensor and other players can benefit from
some long-lasting megatrends.
In the Industrial target market „Industry 4.0“ has started to change industrial production
fundamentally. Machines and other equipment will be able to communicate with each other,
generate and analyse data on a real-time basis, and by doing this can optimize production
processes, save costs and increase flexibility towards „batch size one“. In all of these
applications e.g. cameras, sensors and software is necessary. First Sensor mainly serves
applications like light, radiation, pressure, flow, level and acceleration. Concrete examples
are predictive maintenance for industrial equipment, use of cobots (collaborative robots)
autonomous transport solutions, scanner technology and many others. This market
segment is a multi-billion Euro market with double-digit growth rates are being possible.
The target market Medical is also faced with some fundamental changes towards the so-
called „E-health“-applications. Among other megatrends the aging population,
miniaturization of medical technology and an intensified self-tracking of patients are
important drivers for future growth. In this context sensors are needed for measure, control,
analyse and communicate, all directed for the improvement of the patient’s health.
Also in the third target market Mobility some fundamental changes argue for further growth.
E-mobility, autonomous driving and digitalization have already started to penetrate
automotive markets. In this context LiDAR-systems (Light detection and ranging) are of
particular importance. This specific market is expected to grow by 25% to 35% until 2022
according to our own assessment. First Sensor with its product families targets not only
passenger cars but also trucks and commercial and specialized vehicles. All big OEMs are
investing in these new technologies and the company already is in a promising position to
participate from these trends in our view.
First Sensor AG
Page 14
Key customers and Products
The second pillar is to focus more on key customers and key products. The goal is to
improve the economies of scale. Key products are those products which have a sales
potential of more than EUR 1m per year, while key customers also those with sales of more
than EUR 1m per year. The company does not provide any concrete numbers, but
according to our own assessment it is our best estimate that today the group has some 20
to 25 key customers which meant that they generate at least some 20% to 25% of the total
sales. The platform based products normally are standard products with limited volumes
produced. The tailor made sensor systems solution products normally are produced in
larger quantities per product and offer higher margins due to more content of intellectual
property. Larger quantities in addition can increase the purchasing power of First Sensor
and so far can support a margin improvement.
Forward Integration
The third pillar is forward integration. First Sensor has addressed a clear product roadmap
for the areas light, level, pressure, radiation, flow and acceleration. Along the value added
chain, from the chip via component and sensor to sensor systems the sales portion of the
latter product group should increase. These tailor-made, more complex solutions contain
more FIS know-how and with regard to pricing could offer higher margins. Concrete
breakdown figures are not made public by the company but in our view and compared to
other initiatives offer an above average upside potential to profitability.
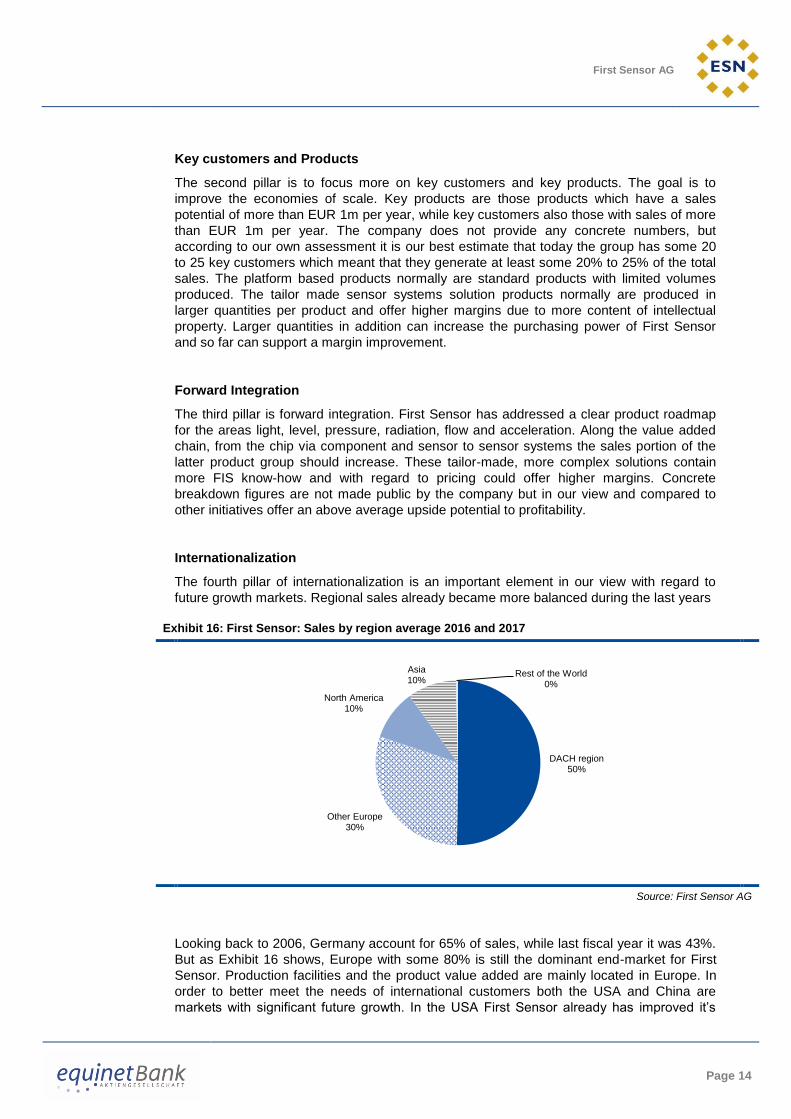
Internationalization
The fourth pillar of internationalization is an important element in our view with regard to
future growth markets. Regional sales already became more balanced during the last years
Exhibit 16: First Sensor: Sales by region average 2016 and 2017
Source: First Sensor AG
Looking back to 2006, Germany account for 65% of sales, while last fiscal year it was 43%.
But as Exhibit 16 shows, Europe with some 80% is still the dominant end-market for First
Sensor. Production facilities and the product value added are mainly located in Europe. In
order to better meet the needs of international customers both the USA and China are
markets with significant future growth. In the USA First Sensor already has improved it’s
DACH region50%
Other Europe30%
North America10%
Asia10%
Rest of the World0%

First Sensor AG
Page 15
position. Sales jumped from EUR 4.4m in 2014 to EUR 17.3m in 2017 (CAGR of 58%).
Progress is also visible in Asia, but the CAGR 2014 to 2017 of +8.9% was clearly lower. In
particular these two region offer significant growth potential and this is reflected in the partly
modified sales organization. A new distribution arm for the region „Overseas“ has been
implemented, covering the North America, Asia and the Rest of the World.
Operational Excellence
Finally the management pays attention to the operational excellence as being a cross-
sectional function. The company already started some projects in 2016 like for example
improving lead times and quality, optimization and consolidation of the product portfolio or
the one ERP system. Portfolio consolidation, among others, strives for a more optimized
product portfolio with a higher share of „A“-products for „A“-customers.
Segment Industrial
First Sensor is organized and works as an integrated industrial group. The three target
markets Industrial, Medical and Mobility are not the basis for the company’s management
approach and internal reporting. Results of the parent company and its subsidiaries do not
meet the criteria for a segment report. As a result, only sales figures but no earnings
breakdown is provided.
The segment Industrial is the biggest segment within the group and generated a stable
sales portion of nearly 50% during the last years. With its sensor products and system
solutions First Sensor concentrated on the following main areas of:
Length measurement (e.g. laser scanners, LiDAR systems)
Radiation and Security (e.g. freight inspection at air and sea ports, scanners)
Smart Buildings (e.g. climate control, energy distribution, condition monitoring)
Industrial Process Control (e.g. level sensing, leak detection)
Aerospace (e.g. control and navigation applications, acceleration).
In this segment several thousands of customers were served according to our assumption
and the main competitors are in our view Hamamatsu, Honeywell, Amphenol Advanced
Sensors or Detection Technology.
Exhibit 17: First Sensor: Segment Industrial
Source: First Sensor AG, equinet Research
Last fiscal year the segment´s sales increased by 3.6% yoy following a decline a year
earlier. As published by the company sales with Industry 4.0 applications in 2017 amounted
to EUR 32.7m or 43.5% of segment sales. Given this volume, the sub-segment last year
was the most important activity in the overall Industrial end-market. Looking forward First
Sensor can benefit from some megatrends, in particular from „Industry 4.0“, and in general
from ongoing factory- and process automation. This year the segment will benefit in
EUR m 2013 2014 2015 2016 2017 2018e 2019e 2020e 2021e 2022e CAGR 13-17 CAGR 18e-22e
Sales 68.3 68.4 74.1 72.5 75.1 79.0 83.5 89.0 95.0 101.0 2.4% 6.3%
yoy % 0.2% 8.3% -2.2% 3.6% 5.2% 5.7% 6.6% 6.7% 6.3%
share of group sales 62.9% 55.2% 53.8% 48.3% 50.9% 50.3% 49.7% 49.2% 48.7% 48.1%

First Sensor AG
Page 16
Germany and Europe from the favourable economy. Based on a solid order backlog we
expect for the upcoming year’s and accelerated sales growth between 5% and 6.7%.
Profitability is expected to increase in our view due to an improved product mix towards the
sale of more system solutions. Furthermore we expect better economies of scale from
serving a higher portion of larger customers with higher unit volumes.
Segment Medical
The Medical segment with a sales share of close to 20% currently is the smallest activity
within the group. Due to its highly sophisticated products the segment could achieve an
above average margin level in our view. In Medical First Sensor concentrated mainly on the
following areas:
Breathing and Respiration (e.g. thermal mass flow sensors, sensors for anesthetic
devices)
Dialysis (e.g. silicon pressure sensors, multi-sensor modules including valves,
pumps etc.)
Diagnostics (e.g. large-scale X-ray detector arrays for CT, video endoscopy).
One of the main customer groups are producers of medical technology like e.g. Siemens or
Drägerwerke. Competitors are, among others, Hammamatsu Photonics from Japan,
Excelitas , Sensirion or ams AG. Other non-listed sensor companies serving the Medical
end-market are for example Amsys GmbH & Co. KG, Framos GmbH, Hottinger Baldwin
Messtechnik GmbH (all Germany) or Sencio B.V. from the Netherlands. Currently not all are
direct competitors for FIS.
Exhibit 18: First Sensor: Segment Medical
Source: First Sensor AG, equinet Research
As the quarterly reporting shows, there is no particular seasonality during the fiscal year.
Following three years of strong sales growth in 2017 the segment reported a decline of 9%
yoy to EUR 27.9m. Some important projects were postponed and could not be
compensated. Therefore we would expect a promising start into the year and expect that
the segment will return to the growth path again with a plus of 7.4% for FY 2018e. Mid- to
long-term new „E-health“-applications and a further miniaturization will drive further growth.
More sophisticated solutions in medical technology will not only measure, but also analyse
results and communicate with other equipment. This trend could also become beneficial for
First Sensor in our view. On the other hand, in particular in Germany, a general cost
pressure in the health care system is visible and could also affect the profitability of
suppliers like First Sensor
EUR m 2013 2014 2015 2016 2017 2018e 2019e 2020e 2021e 2022e CAGR 13-17 CAGR 18e-22e
Sales 17.7 20.4 23.8 30.7 27.9 30.0 32.5 35.3 38.4 41.7 12.1% 8.6%
yoy % 15.4% 16.7% 29.0% -9.0% 7.4% 8.3% 8.6% 8.8% 8.6%
share of group sales 16.3% 16.5% 17.3% 20.5% 18.9% 19.1% 19.3% 19.5% 19.7% 19.9%

First Sensor AG
Page 17
Segment Mobility
The mobility segment in 2017 accounted for 30.1% of group sales. Looking back to FY2013
the sales share with 20.8% was significant lower. Analysing the quarterly sales figures,
there is no particular seasonality visible in our view. In Mobility First Sensor concentrated on
the following main areas:
Advanced driver assistance systems (camera solutions, LiDAR-systems for
autonomous driving)
OEM pressure sensors (passenger cars, trucks, busses, industrial and specialized
vehicles).
Camera solution can be used for example for turn assist, cross traffic assist, smart rear
driving or as a mirror replacement rear solution. Furthermore the OEM pressure sensors
can be used for tank pressure, air flow meters, electrical brake systems, in diesel particulate
filters or for diesel exhaust fluid measurement.
First Sensor’s customers are mainly OEMs, large automotive suppliers and retrofitters.
Competitors in this area are for example ams AG, Melexis, Bosch or Sensata Technologies.
Exhibit 19: First Sensor: Segment Mobility
Source: First Sensor AG, equinet Research
Automotive markets worldwide currently are faced with some fundamental changes:
E-mobility
Autonomous driving
Digitalization.
First Sensor in particular with cameras and sensor solutions can benefit from autonomous
driving.
Based on a market forecast from Yole Développment from February 2018 the potential from
autonomous driving for sensors and sensor systems is really large over the next fifteen
years. First Sensor will concentrate itself on the areas LiDAR and cameras, both being
attractive sub-segments. With regard to sales currently the LiDAR product range is in an
early testing phase and therefore not material. In the Industrial segment it is more material,
but currently also on a low level.
EUR m 2013 2014 2015 2016 2017 2018e 2019e 2020e 2021e 2022e CAGR 13-17 CAGR 18e-22e
Sales 22.6 35.2 39.8 46.9 44.5 48.0 52.0 56.5 61.5 67.3 18.5% 8.8%
yoy % 55.9% 13.1% 17.8% -5.2% 8.0% 8.3% 8.7% 8.8% 9.4%
share of group sales 20.8% 28.4% 28.9% 31.2% 30.1% 30.6% 31.0% 31.3% 31.6% 32.0%

First Sensor AG
Page 18
Exhibit 20: First Sensor:
Source: Yole
Autonomous driving will become accepted over time by reaching various levels. Today
certain assistance systems as for example adaptive cruise control (ACC) will help to
operate the vehicle. The driver is active and drives the car. A next step can be a highly
automated car that controls functions and the driver takes control only if necessary. Finally
any human intervention by a driver is not required. With the introduction in 2017 of the „Blue
Next“ new camera generation based on a modular platform First Sensor today is well
positioned in our view.
Based on purely organic growth for the current year we estimate a sales growth of 8% yoy.
Based on our scenario described above we see good chances that First Sensor can keep
this pace of sales growth.

First Sensor AG
Page 19
Market Environment
World Output 2017 with +3.8% yoy better than expected
Further growth expected in 2018e and 2019e
Long-term outlook with increasing risks
Thanks to its dynamic second half 2017 the World Output came out better than expected.
The IMF in its latest World Economic outlook revised the figure for 2017 to +3.8% yoy from
+3.5% yoy estimated in July 2017. The IMF stated that the global economy gained speed, in
particular in some emerging countries.
Looking forward to 2018e the IMF became more optimistic and increased the estimate to
+3.9% yoy from +3.6% yoy. For Germany the IMF increased the forecast to +2.5% yoy from
+1.8% (from October 2017). This is relevant for First Sensor, because some 50% of the
group sales are generated in the DACH-region. Including other European countries the
sales share is close to 80%. The IMF has also increased significantly the forecast for the
USA for 2018e to +2.9% yoy versus +2.3% from October last year. First Sensor already
2017 achieved a substantial sales growth in North America of 45% and so far the
framework conditions argue for further growth. China will continue to grow, but on a slightly
lower level. The countries output 2018e is expected to reach +6.6% yoy, following a +6.9%
yoy for 2017.
Exhibit 21: Long-term World GDP development Exhibit 22: IMF optimistic for 2018
Source: IMF – World Economic Outlook, April 2018 Source: IMF – World Economic Outlook, April 2018
For the first time the IMF presented the forecast figure for 2019e which is +3.9% yoy (see
Exhibit 22). Comments from the IMF argue for a peak scenario in our view. Long-term the
organisation have identified growing risks which are in particular a „tightening of financial
conditions“ (faster than expected interest hikes), a potential trade war and more
protectionism around the globe and geopolitical risks.
The April figure for the German Ifo climate index declined to 102.1 index points. It is the fifth month in a row with declining figures. Both components of the index, the current situation and the expectations, are down in April. Expectations are also down the fifth months in a row. It is our impression the German economy is slowing down but currently far away from a recession.
-1.0
0.0
1.0
2.0
3.0
4.0
5.0
6.0
2001
2002
2003
2004
2005
2006
2007
2008
2009
2010
2011
2012
2013
2014
2015
2016
2017
2018e
2019e
IMF : World Output, Real GDP, % yoy
2.0
2.5
3.0
3.5
4.0
April 2017 July 2017 April 2018
%
2016 2017 2018e 2019e
First Sensor AG
Page 20
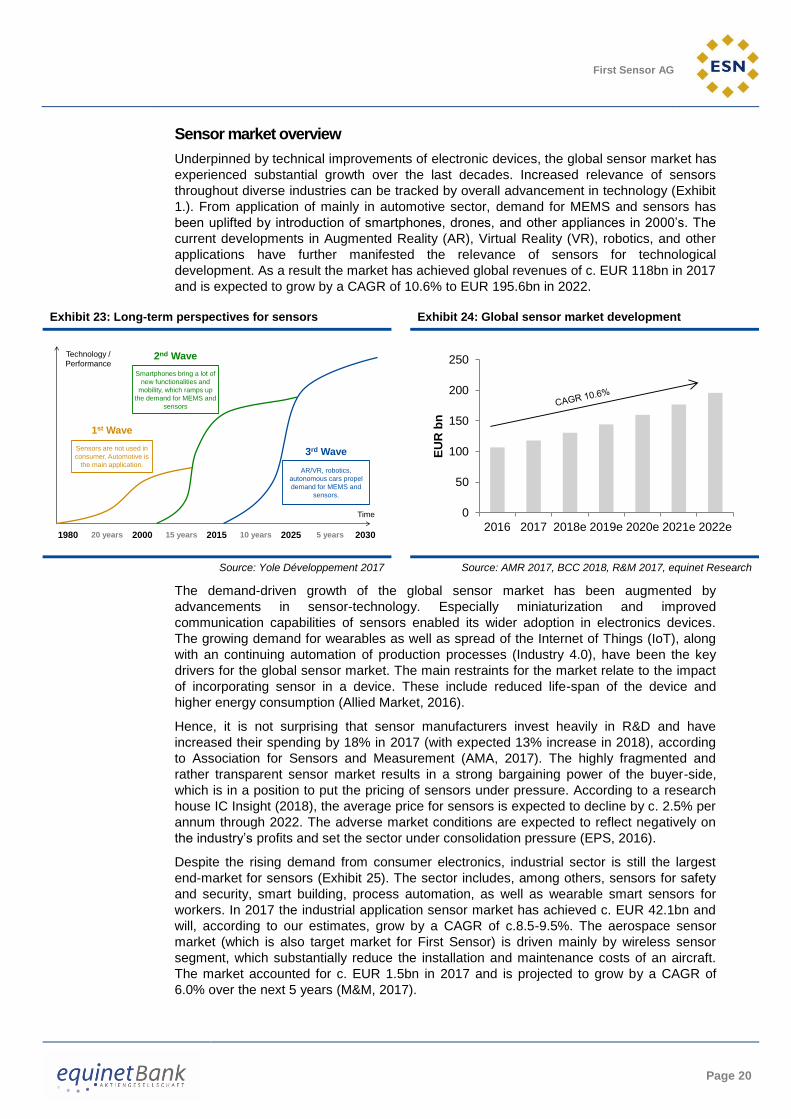
Sensor market overview
Underpinned by technical improvements of electronic devices, the global sensor market has
experienced substantial growth over the last decades. Increased relevance of sensors
throughout diverse industries can be tracked by overall advancement in technology (Exhibit
1.). From application of mainly in automotive sector, demand for MEMS and sensors has
been uplifted by introduction of smartphones, drones, and other appliances in 2000’s. The
current developments in Augmented Reality (AR), Virtual Reality (VR), robotics, and other
applications have further manifested the relevance of sensors for technological
development. As a result the market has achieved global revenues of c. EUR 118bn in 2017
and is expected to grow by a CAGR of 10.6% to EUR 195.6bn in 2022.
Exhibit 23: Long-term perspectives for sensors Exhibit 24: Global sensor market development
Source: Yole Développement 2017 Source: AMR 2017, BCC 2018, R&M 2017, equinet Research
The demand-driven growth of the global sensor market has been augmented by
advancements in sensor-technology. Especially miniaturization and improved
communication capabilities of sensors enabled its wider adoption in electronics devices.
The growing demand for wearables as well as spread of the Internet of Things (IoT), along
with an continuing automation of production processes (Industry 4.0), have been the key
drivers for the global sensor market. The main restraints for the market relate to the impact
of incorporating sensor in a device. These include reduced life-span of the device and
higher energy consumption (Allied Market, 2016).
Hence, it is not surprising that sensor manufacturers invest heavily in R&D and have
increased their spending by 18% in 2017 (with expected 13% increase in 2018), according
to Association for Sensors and Measurement (AMA, 2017). The highly fragmented and
rather transparent sensor market results in a strong bargaining power of the buyer-side,
which is in a position to put the pricing of sensors under pressure. According to a research
house IC Insight (2018), the average price for sensors is expected to decline by c. 2.5% per
annum through 2022. The adverse market conditions are expected to reflect negatively on
the industry’s profits and set the sector under consolidation pressure (EPS, 2016).
Despite the rising demand from consumer electronics, industrial sector is still the largest
end-market for sensors (Exhibit 25). The sector includes, among others, sensors for safety
and security, smart building, process automation, as well as wearable smart sensors for
workers. In 2017 the industrial application sensor market has achieved c. EUR 42.1bn and
will, according to our estimates, grow by a CAGR of c.8.5-9.5%. The aerospace sensor
market (which is also target market for First Sensor) is driven mainly by wireless sensor
segment, which substantially reduce the installation and maintenance costs of an aircraft.
The market accounted for c. EUR 1.5bn in 2017 and is projected to grow by a CAGR of
6.0% over the next 5 years (M&M, 2017).
1980 203020252015200020 years 15 years 10 years 5 years
Time
Technology /
Performance
Smartphones bring a lot of
new functionalities and
mobility, which ramps up
the demand for MEMS and
sensors
1st Wave
2nd Wave
Sensors are not used in
consumer, Automotive is
the main application. AR/VR, robotics,
autonomous cars propel
demand for MEMS and
sensors.
3rd Wave
0
50
100
150
200
250
2016 2017 2018e 2019e 2020e 2021e 2022e
EU
R b
n

First Sensor AG
Page 21
Exhibit 25: Sensor market by applications in 2016 Exhibit 26:Industrial sensor market development
Source: Merger Alliance 2015, equinet Research Source: equinet Research
A wider adoption of self-handling devices for patient care is seen as a possible
countermeasure to the increasing healthcare costs and insufficient resources for stationary
care. Such devices as inhalers, insulin pens and smart syringes allow for dosing of
medicine, as well as record and control of health status remotely. The current 58m of
sensors in medical applications are projected to increase to over 320m by 2022, due to
advancement in sensitivity, accuracy and reliability of medical devices, and sensors in
particular (Yole Développement 2017). Driven by the increasing demand for medical
sensors in the therapeutic and the diagnostic sectors, the market is expected to grow by a
CAGR of 16.0% from EUR 9.5bn in 2017 to 20.0bn in 2022. Similarly, the automotive sector
has been increasing adoption of sensors to improve vehicle performance, along with
significant enhancement of safety, and emission reduction. As of now, a single automobile
is equipped with 60-100 sensors (Nester 2018) in powertrain, body, and safety applications.
Technologies, such as advanced driver assistance (ADA) and lane departure warning
(LDW) systems, are creating new growth opportunities for the automotive sensor market.
Similarly, rising vehicle electrification and improving government safety and gas
consumption standards are likely to stimulate the market growth globally and increase the
number of sensors in a single vehicle to 200. In a longer term, development and
introduction of driverless cars will propel the market of automotive sensors, especially with
respect to LiDAR technology. In total, the market is estimated to register a CAGR of 10.3%
and to grow from EUR 25.9bn in 2017 to EUR 42.3bn in 2022.
Exhibit 27: Medical sensor market development Exhibit 28: Automotive sensor market development
Source: Yole Développement 2017, equinet Research Source: Statista 2018, equinet Research
37%
21%
21%
8%
5%
6%
Industrial
Automotive
Consumer
Medical
Aerospace, etc.
Other0
10
20
30
40
50
60
70
2016 2017 2018e 2019e 2020e 2021e 2022e
EU
R b
n
0
5
10
15
20
25
2016 2017 2018e 2019e 2020e 2021e 2022e
EU
R b
n
0
5
10
15
20
25
30
35
40
45
2016 2017 2018e 2019e 2020e 2021e 2022e
EU
R b
n

First Sensor AG
Page 22
The sensor markets considered above encompass a wide range of technologies which are
related, but not directly addressed by First Sensor. In order to approximate for the target
markets, we focus on the size of the microelectromechanical systems (MEMS) market.
These systems integrate mechanical and electrical components and range in size from 20
micrometres to a millimetre. The small size and weight made these devices attractive for
many applications. Especially consumer electronics, which is responsible for over 40% of
the total MEMS market (Grand View Research 2016), has embraced this technology in such
devices as smartphones and tablets. The total MEMS market is estimated to have reached
about EUR 9.3bn in 2017 (Yole, 2017) with a CAGR of 11.7% (Technavio 2017) over the
next years, to EUR 16.1bn in 2022 (Exhibit 29). Based on the application revenue split of
the MEMS market in 2017 (Exhibit 30), Industrial MEMS market was valued at EUR 900m,
Medical at EUR 1.3bn, and Automotive at EUR 2.4bn in 2017. The total target market of
First Sensor thus amounts to EUR 4.6bn.
Exhibit 29: MEMS market development Exhibit 30: MEMS segmentation 2016
Source: IHS 2015, equinet Research Source: Grand View Research 2016, equinet Research
0
2
4
6
8
10
12
14
16
18
2016 2017 2018e 2019e 2020e 2021e 2022e
EU
R b
n
26%
43%
10%
14%
7%
Automotive
Consumer
Industrial
Medical
Other

First Sensor AG
Page 23
Financials Strategy program a good basis for reaching the 10% EBIT-margin target – we would not
rule out a higher level in the long run
2017 FIS outreached its own financial targets
5-6% of sales for R&D
Q1 2018 report with confirmation of the full-year guidance
FIS a strong cash flow generator
Earnings analysis
As already explained, First Sensor is organized and works as an integrated industrial group.
Results of the parent company and its subsidiaries do not meet the criteria for a segment
reporting.
Following the subprime and global financial crisis the profitability of First Sensor (and for so
many others) sharply declined and in 2008 and 2009 the group had to report losses. But a
strong margin recovery followed immediately in 2010 and the EBIT-margin returned into the
positive area at 8.0%. The peak margin so far was achieved in 2007 with 17.9%. Up to now
the group has not reached this pre-crisis margin level again. Largely this is explained by a
more competitive market framework. It is also reflected by a ten year’s (2007–2017) sales
CAGR of 14.8% and a CAGR for the reported EBIT of 4.8%.
The new management has set in place a modified strategy and the first fruits already
became visible in 2016 and 2017. Also helped by the booming economy the EBIT-margin
increased to 6.6% (2016) and made a further step forward to 7.2% in 2017. But compared
to our defined peer group there is still a gap to close. The average EBIT-margin 2018e of
18.7% compares to our estimate 2018e for First Sensor of 7.9%.
Exhibit 31: Revenues and EBIT Margin Exhibit 32: Temporary EBIT margin decline in Q1 ‘18
Source: First Sensor, equinet Research Source: First Sensor, equinet Research
For 2017 the group outreached its own financial targets. Group sales of EUR 147.5m beat
the guided corridor of EUR 140-145m. The reported EBIT-margin of 7.2% came out
significant better than the target of 5-6%. Main reasons in our view are a better product mix,
better economies of scale and an optimized value added chain. Concerning the EBIT bridge
2017 the main burden factors were higher wages/salaries (plus EUR 1.5m) and negative
volume effects from current products (EUR 1.4m), which could largely be offset by positive
-40.0%
-20.0%
0.0%
20.0%
40.0%
0.0
40.0
80.0
120.0
160.0
200.0
EU
R m
Revenue EBIT Margin
organic growth since 2012
-5.0%
0.0%
5.0%
10.0%
15.0%
0
20
40
60
Q1
2015
Q2 2
015
Q3
2015
Q4
2015
Q1 2
016
Q2
2016
Q3
2016
Q4
2016
Q1
2017
Q2
2017
Q3
2017
Q4
2017
Q1
2018
Q2 2
018e
Q3 2
018e
Q4 2
018e
EU
R m
Revenues EBIT Margin

First Sensor AG
Page 24
volume and price effects from new projects (EUR 2.1m) and by lower consultancy fees
(EUR 1.0m).
Exhibit 33: First Sensor: Key figures
Source: First Sensor AG, equinet Research
Our forecasts for the First Sensor group are based on purely organic growth. We have
outlined above our scenarios for the three defined target markets. The CAGR 2018e-2022e
for the EBIT with 12.5% will be much stronger than for sales with 5.6%. As a result the
corresponding margin is expected to constantly grow to more than 9%. Our underlying
macro scenario for Germany and Europe assumes a normalization of the boom of the last
quarters, as for example the latest Ifo climate index for April signals. Since November 2017
the index was down for the fifth time in a row (by numbers from 105.2 to 102.1 in April
2018).
During the last years the group spend some 5-6% of sales for R&D projects to secure future
growth. 2017 R&D expenses amounted to EUR 8.6m (2016: EUR 8.8m). Overall activities
are directed to seeking and testing new measurement methods what is the basis for the
development of new sensor chips. Secondly sensors and sensor systems have become
smarter and more complex. They must be able to interpret data and to communicate with
other systems. End of 2017 the group employs 94 people or 12% of the total employees in
R&D, while the group currently holds 39 patents. Looking forward we estimate a stable R&D
ratio.
Since 2007 the company distributed no dividends to their shareholders but we understand
this policy to give investments in future profitable growth a higher priority. For FY 2017e
management plans the reopening of dividend payments and made the proposal to the
annual shareholder meeting to pay EUR 0.16 per share or in absolute terms EUR 1.6m. We
interpret this as a positive sign for the group’s outlook and expect a further increase to EUR
0.18 for FY 2018e.
Q1’ 18 with decreased output due to ERP system introduction
Due to ongoing lively demand from end-markets FIS reported a 12% increase in the order
intake to EUR 39.3m. In contrast, group sales came out nearly stable and amounted to EUR
34.5m. The fact that sales came out stable “only” is explained by the introduction of a new
ERP system and a related decline of the group’s output level, mainly in January. So far it
has to put into perspective that the book-to-bill ratio increased to 1.14 (1.02). By end-
markets mainly Industrial was affected. This segment reported a sales decline of 8.4% yoy,
while the other two segments Medical and Mobility reported higher sales figures. The ERP
system introduction effect is visible too at for example a higher inventory level, a partly
higher order backlog, lower sales per employee and a lower EBIT-margin level. In a
conference call management stated that in February and March production levels were up
EUR m 2013 2014 2015 2016 2017 2018e 2019e 2020e 2021e 2022e CAGR 13-17 CAGR 18e-22e
Order intake 121.4 139.3 142.3 132.9 163.7 174.3 185.1 195.3 203.5 217.0 7.8% 5.6%
Sales 108.5 124.0 137.7 150.1 147.5 157.0 168.0 180.8 194.9 210.0 8.0% 7.5%
EBIT reported 2.7 4.1 1.2 10.0 10.6 12.4 13.5 15.6 17.8 19.8 40.6% 12.5%
Operating Cash Flow 10.2 9.8 3.2 16.6 16.0 15.2 17.0 18.8 20.1 21.9 11.7% 9.6%
Analysis
Book-to-bill-ratio (x) 1.12 1.12 1.03 0.89 1.11 1.11 1.10 1.08 1.04 1.03
EBIT-margin, % 2.5% 3.3% 0.9% 6.6% 7.2% 7.9% 8.0% 8.6% 9.1% 9.4%
Oper. CF-margin, % 9.4% 7.9% 2.3% 11.1% 10.8% 9.7% 10.1% 10.4% 10.3% 10.4%
Cash conversion (x) * 3.8 2.4 2.7 1.7 1.5 1.2 1.3 1.2 1.1 1.1

First Sensor AG
Page 25
again, and we expect a positive shift both in sales and profit during the course of the year
2018.
The full year financial targets for 2018 were confirmed. Group sales should reach a level of
EUR 150 – 160m, while our estimate amounted to EUR 157m. On average the next three
quarters have to deliver sales of EUR 40m each in order to reach our estimate. According to
FIS the EBIT-margin should reach 7% - 9% and we are forecasting 7.9%.
Exhibit 34: FIS Q1 2018 with growing order intake and temporary lower EBIT-margin
Source: First Sensor AG, equinet Research
With the Austrian ams AG one of the competitors already reported its Q1 2018 results. Due
to the acquisition of Key Lemon from Switzerland both sales (+147% yoy) and operating
profit (from USD 5.0m to USD 77.3m) were up significantly. The non-consumer area, which
is comparable to First Sensor’s activities, performed positive as expected. Looking forward,
the second quarter will be burdened by a temporary weaker business in the consumer
segment (lower business for mobile phones), while this effect cannot be transferred to First
Sensor.
Financial analysis
The overall financial situation of First Sensor is solid in our view and has no significant
restrictions with regard to the growth plans.
One of the areas of improving the operational excellence is a further optimization of the net
working capital. The strong increase in 2011 is related to the takeover of Sensortechnics
GmbH from Augusta Technology. This M&A-transaction in general was an important step
forward for First Sensor at that time. The move resulted, among other factors, in a new level
for the net working capital (NWC). As a one-time effect the NWC 2011 sharply increased to
53%, but immediately normalized in the following year to 31%.
Last year the NWC in absolute terms amounted to EUR 37.5m (EUR 35.7m) or 25.4%
(23.8%) of sales. On the basis of a more efficient management of inventories and
EUR m Q1 2018 Q1 2017 % YoY equinet Delta
Order intake 39.3 35.1 12.0% 37.2 5.6%
Revenues 34.5 34.3 0.6% 36.3 -5.0%
of which: Industrial 16.3 17.8 -8.4% 18.8 -13.3%
of which: Medical 7.4 6.4 15.6% 6.8 8.8%
of which: Mobility 10.8 10.1 6.9% 10.7 0.9%
Book-to-bill ratio group 1.14 1.02 1.02
EBIT 1.1 1.8 -40.2% 2.6 -59.3%
EBIT Margin 3.1% 5.2% 7.2%
Net income 0.2 1.2 -83.9% 1.8 -88.9%
EPS, EUR 0.02 0.13 -84.9% 0.17 -88.5%

First Sensor AG
Page 26
receivables we see a good chance that over time NWC/Sales can go down further in the
direction of 20%. A further reduction will become more challenging in our view, having in
mind large product variety and the need to have full delivery capacities.
Exhibit 35: Net Working Capital will be reduced over time
Source: First Sensor AG, equinet Research
Exhibit 36: First Sensor a strong cash flow generator
Source: First Sensor AG, equinet Research
First Sensor presented itself as a strong cash flow generator. The takeover of
Sensortechnics GmbH also had a negative impact on the operating cash flow in 2011.
Last year the operating cash flow amounted to EUR 16.0m (EUR 16.6m). Due to a strong
increase in investments the operating free cash flow significantly came down to EUR 2.7m
(10.0m). First Sensor implemented a new and unique ERP-software, and invested in new
production capacities. In 2018e the capex figure will „normalize“ to a level of EUR 10.5m.
This is close to our estimate for depreciation of EUR 10.2m. This is also purely organic and
does not include any M&A activity. The cash conversion rate (Operating cash flow / EBIT)
for the next years is estimated to stay above „1“.
10.0%
20.0%
30.0%
40.0%
50.0%
60.0%
0.0
5.0
10.0
15.0
20.0
25.0
30.0
35.0
40.0
45.0
2007 2008 2009 2010 2011 2012 2013 2014 2015 2016 2017 2018e2019e2020e
EU
R m
Net working capital (NWC) NWC/Sales (%)
-20.0
-15.0
-10.0
-5.0
0.0
5.0
10.0
15.0
20.0
25.0
2007 2008 2009 2010 2011 2012 2013 2014 2015 2016 2017 2018e 2019e 2020e
EU
R m
Operating CF Operating FCF

First Sensor AG
Page 27
With regard to the net financial debt our numbers include pension provisions while First
Sensor does not include this item. But the effect is negligible, because in 2017 pensions
amounted to only EUR 0.3m. During the last years the net financial debt was reduced
steadily because financial debt came down and liquidity improved. Last year’s figure of EUR
23.1m (FIS: EUR 22.8m) resulted in a gearing of 22.2%.
Exhibit 37: Net financial debt reduction expected
Source: First Sensor AG, equinet Research
Exhibit 38: Maturity of promissory notes
Source: First Sensor AG
Gross financial debt of EUR 48.3m includes EUR 40.0m of promissory notes. During 2018
the promissory note of EUR 12.0m will become due. A possible refinancing model is not yet
communicated. With regard to interest rates First Sensor on average 2017 had to pay 2.6%
(2016: 3.5%). We assume that in the current year for Germany we will not see an interest
rate hike and so far a refinancing most likely can be made on a low interest rate level again.
End of 2017 First Sensor on top has access to unused credit lines in an amount of EUR
11.1m. This volume of debt gives the company enough financial flexibility to finance further
growth. From this perspective and given an equity ratio of slightly above 50% it seems that
for the time being no further equity cash injection is needed in our view. It can change for
example in case of a larger M&A transaction.
-20.0%
-10.0%
0.0%
10.0%
20.0%
30.0%
40.0%
-10.0
0.0
10.0
20.0
30.0
40.0
50.0
2007 2008 2009 2010 2011 2012 2013 2014 2015 2016 2017 2018e2019e2020e
EU
R m
Net financial debt Gearing (%)
Placement EUR m Term Due date
2013 12.0 5 years 2018
2015 7.0 5 years 2020
2015 18.0 7 years 2020
2015 3.0 6 years 2022
Total amount 40.0

First Sensor AG
Page 28
List of abbreviations
ADAS Advanced driver assistance system
APD Avalanche photodiode
CIS Contact image sensor
CMOS Complementary metal-oxide semiconductor
DOE Diffractive Optical Element
HVAC Heating, ventilation and air conditioning
ICT In-circuit testing
LiDAR Light detection and ranging
MEMS Microelectromechanical system
VCSL Vertical-Cavity Surface-Emitting Laser
WLO Wafer Level Optics

First Sensor AG
Page 29
First Sensor AG : Summary tables
PROFIT & LOSS (EURm) 12/2014 12/2015 12/2016 12/2017 12/2018e 12/2019e
Sales 124 138 150 148 157 168
Cost of Sales & Operating Costs -111 -126 -128 -128 -134 -145
Non Recurrent Expenses/Income 0.0 0.0 -2.2 0.0 0.0 0.0
EBITDA 13.1 11.5 19.4 19.6 22.6 23.3
EBITDA (adj.)* 13.1 11.5 21.6 19.6 22.6 23.3
Depreciation -9.0 -10.3 -9.4 -9.1 -10.2 -9.8
EBITA 4.1 1.2 10.0 10.6 12.4 13.5
EBITA (adj)* 4.1 1.2 12.2 10.6 12.4 13.5
Amortisations and Write Downs 0.0 0.0 0.0 0.0 0.0 0.0
of which PPA amortisation 0.0 0.0 0.0 0.0 0.0 0.0
EBIT 4.1 1.2 10.0 10.6 12.4 13.5
EBIT (adj.)* 4.1 1.2 12.2 10.6 12.4 13.5
Net Financial Interest -2.4 -2.4 -1.8 -1.9 -2.1 -2.2
Other Financials 0.0 0.0 0.0 0.0 0.0 0.0
Associates 0.0 0.0 0.5 -1.5 0.0 0.0
Other Non Recurrent Items 0.0 0.0 0.0 0.0 0.0 0.0
Earnings Before Tax (EBT) 1.7 -1.2 8.7 7.2 10.2 11.4
Tax -1.3 -0.4 -2.6 -2.8 -3.1 -3.4
Tax rate 76.3% n.m. 30.2% 38.9% 30.0% 30.0%
Discontinued Operations 0.0 0.0 0.0 0.0 0.0 0.0
Minorities -0.2 -0.2 -0.3 -0.2 -0.3 -0.3
Net Profit (reported) 0.2 -1.7 5.7 4.1 6.9 7.7
Net Profit (adj.) 0.2 -1.7 5.8 4.1 6.9 7.7
CASH FLOW (EURm) 12/2014 12/2015 12/2016 12/2017 12/2018e 12/2019e
Cash Flow from Operations before change in NWC 11.4 9.5 15.8 17.8 15.8 17.5
Change in Net Working Capital -1.6 -6.3 0.8 -1.8 -0.7 -0.5
Cash Flow from Operations 9.8 3.2 16.6 16.0 15.2 17.0
Capex -5.4 -7.1 -6.6 -13.2 -10.5 -10.0
Net Financial Investments 1.1 2.0 0.1 0.7 0.0 0.0
Free Cash Flow 5.5 -1.9 10.1 3.5 4.7 7.0
Dividends 0.0 0.0 0.0 0.0 -1.6 -1.8
Other (incl. Capital Increase & share buy backs) 0.0 0.0 0.0 0.0 0.0 0.0
Change in Net Debt 5.5 -1.9 10.1 3.5 3.0 5.2
NOPLAT 2.9 0.8 8.5 7.4 8.7 9.5
BALANCE SHEET & OTHER ITEMS (EURm) 12/2014 12/2015 12/2016 12/2017 12/2018e 12/2019e
Net Tangible Assets 36.4 35.0 33.0 36.4 37.2 36.9
Net Intangible Assets (incl.Goodwill) 52.2 49.6 49.1 48.9 48.4 48.9
Net Financial Assets & Other 0.0 0.0 0.0 0.0 0.0 0.0
Total Fixed Assets 88.7 84.6 82.1 85.3 85.6 85.8
Inventories 29.9 27.1 25.9 24.6 25.1 25.6
Trade receivables 8.6 17.0 18.4 20.8 21.2 21.4
Other current assets 4.8 4.7 3.8 3.4 3.7 3.8
Cash (-) -14.5 -21.5 -23.8 -25.5 -29.5 -35.0
Total Current Assets 57.8 70.4 71.9 74.3 79.5 85.8
Total Assets 146 155 154 160 165 172
Shareholders Equity 71.6 70.7 76.5 80.8 86.0 91.8
Minority 0.4 0.6 0.9 1.2 1.2 1.2
Total Equity 72.0 71.3 77.4 82.0 87.2 93.0
Long term interest bearing debt 35.3 44.5 37.2 36.3 36.3 35.6
Provisions 0.5 0.7 0.3 0.3 0.3 0.3
Other long term liabilities 13.0 11.8 8.1 7.4 7.5 7.6
Total Long Term Liabilities 48.8 57.0 45.6 44.0 44.1 43.5
Short term interest bearing debt 9.0 10.0 11.0 12.0 13.0 14.0
Trade payables 8.2 7.6 8.6 7.9 8.1 8.3
Other current liabilities 8.5 9.1 11.4 13.7 12.7 12.7
Total Current Liabilities 25.7 26.7 31.0 33.6 33.8 35.0
Total Liabilities and Shareholders' Equity 146 155 154 160 165 172
Net Capital Employed 115 117 110 113 115 116
Net Working Capital 30.3 36.5 35.7 37.5 38.2 38.7
GROWTH & MARGINS 12/2014 12/2015 12/2016 12/2017 12/2018e 12/2019e
Sales growth 14.2% 11.1% 9.0% -1.7% 6.4% 7.0%
EBITDA (adj.)* growth -16.4% -11.9% 87.3% -9.2% 15.1% 3.3%
EBITA (adj.)* growth -43.8% -70.7% 916.7% -13.5% 17.4% 9.2%
EBIT (adj)*growth -43.8% -70.7% 916.7% -13.5% 17.4% 9.2%

First Sensor AG
Page 30
First Sensor AG : Summary tables
GROWTH & MARGINS 12/2014 12/2015 12/2016 12/2017 12/2018e 12/2019e
Net Profit growth -93.5% n.m. n.m. -28.2% 66.3% 11.4%
EPS adj. growth -93.6% n.m. n.m. -28.3% 66.3% 11.4%
DPS adj. growth n.m. 12.5% 11.1%
EBITDA (adj)* margin 10.6% 8.4% 14.4% 13.3% 14.4% 13.9%
EBITA (adj)* margin 3.3% 0.9% 8.1% 7.2% 7.9% 8.0%
EBIT (adj)* margin 3.3% 0.9% 8.1% 7.2% 7.9% 8.0%
RATIOS 12/2014 12/2015 12/2016 12/2017 12/2018e 12/2019e
Net Debt/Equity 0.4 0.5 0.3 0.3 0.2 0.2
Net Debt/EBITDA 2.3 2.9 1.3 1.2 0.9 0.6
Interest cover (EBITDA/Fin.interest) 5.4 4.9 10.8 10.6 10.5 10.8
Capex/D&A 60.2% 68.5% 70.1% 145.4% 102.9% 102.0%
Capex/Sales 4.4% 5.1% 4.4% 8.9% 6.7% 6.0%
NWC/Sales 24.4% 26.5% 23.8% 25.4% 24.3% 23.0%
ROE (average) 0.2% -2.4% 7.8% 5.3% 8.2% 8.6%
ROCE (adj.) 2.4% 0.7% 7.2% 6.0% 7.0% 7.6%
WACC 7.0% 7.0% 7.0% 7.0% 7.0% 7.0%
ROCE (adj.)/WACC 0.3 0.1 1.0 0.9 1.0 1.1
PER SHARE DATA (EUR)*** 12/2014 12/2015 12/2016 12/2017 12/2018e 12/2019e
Average diluted number of shares 10.0 10.2 10.2 10.2 10.2 10.2
EPS (reported) 0.02 -0.17 0.56 0.40 0.67 0.75
EPS (adj.) 0.02 -0.17 0.56 0.40 0.67 0.75
BVPS 7.12 6.96 7.49 7.91 8.42 8.99
DPS 0.00 0.00 0.00 0.16 0.18 0.20
VALUATION 12/2014 12/2015 12/2016 12/2017 12/2018e 12/2019e
EV/Sales 1.0 1.2 1.2 1.7 1.7 1.5
EV/EBITDA 9.8 13.9 8.9 12.6 11.8 11.2
EV/EBITDA (adj.)* 9.8 13.9 8.0 12.6 11.8 11.2
EV/EBITA 31.3 133.5 17.4 23.4 21.4 19.2
EV/EBITA (adj.)* 31.3 133.5 14.2 23.4 21.4 19.2
EV/EBIT 31.3 n.m. 17.4 23.4 21.4 19.2
EV/EBIT (adj.)* 31.3 n.m. 14.2 23.4 21.4 19.2
P/E (adj.) n.m. n.m. 25.7 n.m. 35.6 31.9
P/BV 1.4 1.8 1.9 2.8 2.8 2.7
Total Yield Ratio 0.0% 0.0% 0.0% 0.7% 0.8% 0.8%
EV/CE 1.1 1.3 1.5 2.0 2.1 2.1
OpFCF yield 4.5% -3.1% 6.8% 1.2% 1.9% 2.9%
OpFCF/EV 3.4% -2.4% 5.8% 1.1% 1.8% 2.7%
Payout ratio 0.0% 0.0% 0.0% 39.6% 26.8% 26.7%
Dividend yield (gross) 0.0% 0.0% 0.0% 0.7% 0.8% 0.8%
EV AND MKT CAP (EURm) 12/2014 12/2015 12/2016 12/2017 12/2018e 12/2019e
Price** (EUR) 9.75 12.44 14.50 21.76 23.90 23.90
Outstanding number of shares for main stock 10.0 10.2 10.2 10.2 10.2 10.2
Total Market Cap 98 126 148 222 244 244
Net Debt 30 33 24 23 20 15
o/w Cash & Marketable Securities (-) -15 -22 -24 -26 -29 -35
o/w Gross Debt (+) 44 55 48 48 49 50
Other EV components 1 1 1 2 1 1
Enterprise Value (EV adj.) 128 160 174 247 265 260
Source: Company, equinet Bank estimates.
Notes* Where EBITDA (adj.) or EBITA (adj)= EBITDA (or EBITA) -/+ Non Recurrent Expenses/Income and where EBIT (adj)= EBIT-/+ Non Recurrent Expenses/Income - PPA amortisation
**Price (in local currency): Fiscal year end price for Historical Years and Current Price for current and forecasted years
Sector: Technology Hardware & Equipment/Technology Hardware & Equipment
Company Description: First Sensor engages in the development and manufacture of sensors, components and sensor solutions. The
company serves the target markets Industrial, Medical and Mobility. The product portfolio include, among others, pressure, optical,
radiation, flow, level and inertial sensors, cameras and power semiconductors. The company was founded in 1991 and is located in
Berlin, Germany.
First Sensor AG
Page 31
European Coverage of the Members of ESN
A ero space & D efense M em(*) Bper BAK Kemira OPG Campari BAK
Airbus Se CIC Bpi CBI Kws Saat EQB Coca Cola Hbc Ag IBG
Dassault Aviation CIC Caixabank GVC Lanxess EQB Corbion NIBC
Latecoere CIC Commerzbank EQB Linde EQB Danone CIC
Leonardo BAK Credem BAK Siegfried Holding Ag EQB Ebro Foods GVC
Lisi CIC Credit Agrico le Sa CIC Symrise Ag EQB Enervit BAK
M tu Aero Engines EQB Creval BAK Tikkurila OPG Fleury M ichon CIC
Ohb Se EQB Deutsche Bank EQBElectro nic & Electrical
EquipmentM em(*) Forfarmers NIBC
Rheinmetall EQB Deutsche Pfandbriefbank EQB Euromicron Ag EQB Heineken NIBC
Safran CIC Eurobank IBG Neways Electronics NIBC Hkscan OPG
Thales CIC Intesa Sanpaolo BAK Pkc Group OPG La Doria BAK
A lternat ive Energy M em(*) Liberbank GVC Rexel CIC Lanson-Bcc CIC
Daldrup & Soehne EQB M ediobanca BAK Vaisala OPG Laurent Perrier CIC
Siemens Gamesa Re GVC M erkur Bank EQB Viscom EQB Ldc CIC
Sif Group NIBC National Bank Of Greece IBG F inancial Services M em(*) Lucas Bols NIBC
Solaria GVC Natixis CIC Amundi CIC M assimo Zanetti BAK
A uto mo biles & P arts M em(*) Nordea OPG Anima BAK Naturex CIC
Bittium Corporation OPG Piraeus Bank IBG Athex Group IBG Olvi OPG
Bmw EQB Poste Italiane BAK Azimut BAK Orsero BAK
Brembo BAK Procredit Holding EQB Banca Farmafactoring BAK Pernod Ricard CIC
Continental EQB Rothschild & Co CIC Banca Generali BAK Raisio OPG
Daimler Ag EQB Societe Generale CIC Banca Ifis BAK Refresco Group NIBC
Elringklinger EQB Ubi Banca BAK Banca Sistema BAK Remy Cointreau CIC
Ferrari BAK Unicredit BAK Bb Biotech EQB Suedzucker EQB
Fiat Chrysler Automobiles BAK B asic R eso urces M em(*) Bolsas Y M ercados Espanoles Sa GVC Takeaway.Com NIBC
Hella Gmbh & Co. Kgaa EQB Acerinox GVC Capman OPG Telepizza GVC
Indelb BAK Altri CBI Cir BAK Vapiano EQB
Kamux OPG Arcelormittal GVC Comdirect EQB Vidrala GVC
Landi Renzo BAK Corticeira Amorim CBI Corestate Capital Holding S.A. EQB Vilmorin CIC
Leoni EQB Ence GVC Corp. Financiera Alba GVC Viscofan GVC
Nokian Tyres OPG Europac GVC Digital M agics BAK Vranken Pommery M onopole CIC
Norma Group EQB M etka IBG Dobank BAK Wessanen NIBC
Piaggio BAK M etsä Board OPG D ws EQB F o o d & D rug R etailers M em(*)
Pwo EQB M ytilineos IBG Eq OPG Ahold Delhaize NIBC
Schaeff ler EQB Outokumpu OPG Eurazeo CIC Carrefour CIC
Sogefi BAK Ramada CBI Eyemaxx Real Estate EQB Casino Guichard-Perrachon CIC
Stabilus EQB Semapa CBI Ferratum EQB Ceconomy Ag EQB
Stern Groep NIBC Ssab OPG Ffp CIC Dia GVC
Volkswagen EQB Stora Enso OPG Finecobank BAK Jeronimo M artins CBI
B anks M em(*) Surteco EQB Grenke EQB Kesko OPG
Aareal Bank EQB The Navigator Company CBI Hypoport Ag EQB M arr BAK
Aktia OPG Tubacex GVC M lp EQB M etro Ag EQB
Alpha Bank IBG Upm-Kymmene OPG Ovb Holding Ag EQB Sligro NIBC
Banca Carige BAK C hemicals M em(*) Patrizia EQB Sonae CBI
Banca M ps BAK Air Liquide CIC Rallye CIC
Banco Sabadell GVC Arkema CIC Tip Tamburi Investment Partners BAK
Banco Santander GVC Avantium NIBC Unipol Gruppo Finanziario BAK
Bankia GVC Brenntag EQB Wendel CIC
Bankinter GVC Fuchs Petro lub EQB F o o d & B everage M em(*)
Bbva GVC Holland Colours NIBC Acomo NIBC
Bcp CBI Imcd NIBC Atria OPG

First Sensor AG
Page 32
General Industria ls M em(*) Orio la-Kd OPG Talgo GVC Salini Impregilo BAK
2G Energy EQB Orion OPG Technotrans EQB Sias BAK
Aalberts NIBC Orpea CIC Valmet OPG Sonae Industria CBI
Accell Group NIBC Pihlajalinna OPG Wacker Neuson Se EQB Srv OPG
Ahlstrom OPG Recordati BAK Wärtsilä OPG Tarkett CIC
Arcadis NIBC Silmaasema OPG Zardoya Otis GVC Thermador Groupe CIC
Aspo OPG Terveystalo OPG Industria l T ranspo rtat io n M em(*) Titan Cement IBG
Cembre BAK H o useho ld Go o ds M em(*) Bollore CIC Trevi BAK
Huhtamäki OPG De Longhi BAK Ctt CBI Uponor OPG
Kendrion NIBC Elica BAK Logwin EQB Vicat CIC
Nedap NIBC Fila BAK Insurance M em(*) Vinci CIC
Pöyry OPG M aisons Du M onde CIC Allianz EQB Volkerwessels NIBC
Prelios BAK Philips Lighting NIBC Axa CIC Yit OPG
Saf-Holland EQB Industria l Engineering M em(*) Banca M edio lanum BAK M edia M em(*)
Serge Ferrari Group CIC Accsys Technologies NIBC Catto lica Assicurazioni BAK Alma M edia OPG
Tkh Group NIBC Aixtron EQB Generali BAK Arnoldo M ondadori Editore BAK
General R etailers M em(*) Alstom CIC Hannover Re EQB Atresmedia GVC
Beter Bed Holding NIBC Ansaldo Sts BAK M apfre Sa GVC Axel Springer EQB
Elumeo Se EQB Biesse BAK M unich Re EQB Brill NIBC
Fielmann EQB Caf GVC Sampo OPG Cairo Communication BAK
Fnac Darty CIC Cargotec Corp OPG Talanx Group EQB Cofina CBI
Folli Fo llie Group IBG Carraro BAK Unipolsai BAK Cts Eventim EQB
Fourlis Holdings IBG Cnh Industrial BAKM aterials, C o nstruct io n &
InfrastructureM em(*) Digital Bros BAK
Grandvision NIBC Danieli BAK Abertis GVC Gedi Gruppo Editoriale BAK
Hornbach Holding EQB Datalogic BAK Acs GVC Gl Events CIC
Inditex GVC Deutz Ag EQB Aena GVC Impresa CBI
Jumbo IBG Duerr EQB Aeroports De Paris CIC Io l BAK
Ovs BAK Emak BAK Astaldi BAK Ipsos CIC
Rapala OPG Envipco NIBC Atlantia BAK Jcdecaux CIC
Stockmann OPG Exel Composites OPG Boskalis Westminster NIBC Lagardere CIC
Takkt Ag EQB Fincantieri BAK Buzzi Unicem BAK M 6-M etropole Television CIC
Tokmanni OPG Gea Group EQB Caverion OPG M ediaset BAK
Unieuro BAK Gesco EQB Cramo OPG M ediaset Espana GVC
Windeln.De EQB Heidelberger Druck EQB Eiffage CIC Notorious Pictures BAK
Yoox Net-A-Porter BAK Ima BAK Ellaktor IBG Nrj Group CIC
Zalando EQB Indus Holding Ag EQB Eltel OPG Publicis CIC
H ealthcare M em(*) Interpump BAK Ezentis GVC Rcs M ediagroup BAK
4Sc EQB Koenig & Bauer EQB Fcc GVC Relx NIBC
Abivax NIBC Kone OPG Ferrovial GVC Rtl Group EQB
Advicenne NIBC Konecranes OPG Heidelberg Cement Ag CIC Sanoma OPG
Amplifon BAK Krones Ag EQB Heijmans NIBC Solocal Group CIC
Bayer EQB M anitou CIC Imerys CIC Spir Communication CIC
Biotest EQB M anz Ag EQB Lafargeholcim CIC Syzygy Ag EQB
Diasorin BAK M ax Automation Ag EQB Lehto OPG Teleperformance CIC
El.En. BAK M etso Corporation OPG Lemminkäinen OPG Tf1 CIC
Epigenomics Ag EQB Outotec OPG M aire Tecnimont BAK Ubisoft CIC
Genfit CIC Pfeiffer Vacuum EQB M ota Engil CBI Vivendi CIC
Gerresheimer Ag EQB Ponsse OPG Obrascon Huarte Lain GVC Wolters Kluwer NIBC
Guerbet CIC Prima Industrie BAK Ramirent OPG Xing Ag EQB
Heidelberg Pharma EQB Prysmian BAK Royal Bam Group NIBC
Korian CIC Schaltbau Holding Ag EQB Sacyr GVC
M erck EQB Smt Scharf Ag EQB Saint Gobain CIC

First Sensor AG
Page 33
Oil & Gas P ro ducers M em(*) Hispania Activos Inmobiliarios GVC Lassila & Tikanoja OPG I Grandi Viaggi BAK
Eni BAK Igd BAK Openjobmetis BAK Iberso l CBI
Galp Energia CBI Lar España GVC Rai Way BAK Int. A irlines Group GVC
Gas Plus BAK M erlin Properties GVCT echno lo gy H ardware &
EquipmentM em(*) Intralo t IBG
Hellenic Petro leum IBG Realia GVC Asm International NIBC Kotipizza OPG
M aurel Et Prom CIC Technopolis OPG Asml NIBC M elia Hotels International GVC
M otor Oil IBG Wcm Ag EQB Besi NIBC Nh Hotel Group GVC
Neste Corporation OPG So ftware & C o mputer Services M em(*) Ericsson OPG Opap IBG
Qgep CBI Affecto OPG Gigaset EQB Snaitech BAK
Repsol GVC Akka Technologies CIC Nokia OPG Snowworld NIBC
Total CIC Alten CIC Roodmicrotec NIBC Sodexo CIC
Oil Services M em(*) Altran CIC S&T Ag EQB Sonae Capital CBI
Bourbon CIC Assystem CIC Slm Solutions EQB Trigano CIC
Cgg CIC Atos CIC Stmicroelectronics BAK Utilit ies M em(*)
Fugro NIBC Axway Software CIC Suess M icrotec EQB Acciona GVC
Rubis CIC Basware OPG Teleste OPG Acea BAK
Saipem BAK Comptel OPG Va-Q-Tec EQB Albioma CIC
Sbm Offshore NIBC Ctac NIBC T eleco mmunicat io ns M em(*) Direct Energie CIC
Technipfmc Plc CIC Digia Plc OPG 1&1 Drillisch Ag EQB Edp CBI
Tecnicas Reunidas GVC Econocom CIC Acotel BAK Edp Renováveis CBI
Tenaris BAK Esi Group CIC Bouygues CIC Enagas GVC
Vallourec CIC Exprivia BAK Deutsche Telekom EQB Endesa GVC
Vopak NIBC F-Secure OPG Dna OPG Enel BAK
P erso nal Go o ds M em(*) Gft Technologies EQB Elisa OPG Erg BAK
Adidas EQB Ict Group NIBC Euskaltel GVC Eydap IBG
Adler M odemaerkte EQB Indra Sistemas GVC Freenet EQB Falck Renewables BAK
Amer Sports OPG Nemetschek Se EQB Iliad CIC Fortum OPG
Basicnet BAK Neurones CIC Kpn Telecom NIBC Gas Natural Fenosa GVC
Cie Fin. Richemont CIC Nexus Ag EQB M asmovil GVC Hera BAK
Geox BAK Novabase CBI Nos CBI Iberdro la GVC
Gerry Weber EQB Ordina NIBC Orange CIC Iren BAK
Hermes Intl. CIC Psi Software Ag EQB Ote IBG Italgas BAK
Hugo Boss EQB Reply BAK Retelit BAK Public Power Corp IBG
Kering CIC Rib Software EQB Tele Columbus EQB Red Electrica De Espana GVC
Luxottica BAK Rovio Entertainment OPG Telecom Italia BAK Ren CBI
Lvmh CIC Scout24 EQB Telefonica GVC Snam BAK
M arimekko OPG Seven Principles Ag EQB Telefonica Deutschland EQB Terna BAK
M oncler BAK Sii CIC Telia OPG
Puma EQB Software Ag EQB Tiscali BAK
Safilo BAK Sopra Steria Group CIC United Internet EQB
Salvatore Ferragamo BAK Tieto OPG Vodafone BAK
Sarantis IBG Tomtom NIBC T ravel & Leisure M em(*)
Swatch Group CIC Suppo rt Services M em(*) Accor CIC
Technogym BAK Amadeus GVC Aegean Airlines IBG
Tod'S BAK Asiakastieto Group OPG Air France Klm CIC
R eal Estate M em(*) Batenburg NIBC Autogrill BAK
Adler Real Estate EQB Cellnex Telecom GVC Beneteau CIC
Beni Stabili BAK Dpa NIBC Compagnie Des Alpes CIC
Citycon OPG Ei Towers BAK Elior CIC
Demire EQB Enav BAK Europcar CIC
Deutsche Euroshop EQB Fiera M ilano BAK Finnair OPG
Grivalia IBG Inwit BAK Gamenet BAK
LEGEND: BAK: Banca Akros; CIC: CM CIC Market Solutions; CBI: Caixa-Banco de Investimento; GVC: GVC Gaesco Beksa, SV, SA; EQB: equinet bank; IBG: Investment Bank of Greece, NIBC: NIBC Bank N.V: OPG: OP Corporate Bank:;as of 4
th April 2018

First Sensor AG
Page 34
List of ESN Analysts (**)
Artur Amaro CBI +351 213 89 6822 [email protected] Konstantinos Manolopoulos IBG +30 210 817 3388 [email protected]
Stefan Augustin EQB +49-69-58997-430 [email protected] Katharina Mayer EQB +49 69 58997-432 [email protected]
Helena Barbosa CBI +351 21 389 6831 [email protected] Fanny Meindre, PhD CIC +33 1 53 48 80 84 [email protected]
Winfried Becker EQB +49 69 58997-416 [email protected] Marietta Miemietz CFA EQB +49-69-58997-439 [email protected]
Javier Bernat GVC +34 91 436 7816 jav [email protected] Dustin Mildner EQB +49 69 58997-438 [email protected]
Dimitris Birbos IBG +30 210 81 73 392 [email protected] Henri Parkkinen OPG +358 10 252 4409 [email protected]
Agnès Blazy CIC +33 1 53 48 80 67 [email protected] Victor Peiro Pérez GVC +34 91 436 7812 [email protected]
Rafael Bonardell GVC +34 91 436 78 71 [email protected] Alexandre Plaud CIC +33 1 53 48 80 90 [email protected]
Andrea Bonfà BAK +39 02 4344 4269 [email protected] Francis Prêtre CIC +33 4 78 92 02 30 [email protected]
Jean-Baptiste Bouchet CIC +33 1 53 48 80 69 [email protected] Francesco Previtera BAK +39 02 4344 4033 francesco.prev [email protected]
Christian Bruns EQB +49 69 58997 415 [email protected] Jari Raisanen OPG +358 10 252 4504 [email protected]
Giada Cabrino, CIIA BAK +39 02 4344 4092 [email protected] Hannu Rauhala OPG +358 10 252 4392 [email protected]
Niclas Catani OPG +358 10 252 8780 [email protected] Matias Rautionmaa OPG +358 10 252 4408 [email protected]
Pierre Chedeville CIC +33 1 53 48 80 97 [email protected] Eric Ravary CIC +33 1 53 48 80 71 [email protected]
Emmanuel Chevalier CIC +33 1 53 48 80 72 [email protected] Iñigo Recio Pascual GVC +34 91 436 7814 [email protected]
David Da Maia CIC +33 1 53 48 89 36 [email protected] John David Roeg NIBC +31 (0)20 550 86 46 [email protected]
Edwin de Jong NIBC +312 0 5508569 [email protected] Jean-Luc Romain CIC +33 1 53 48 80 66 [email protected]
Martijn den Drijver NIBC +312 0 5508636 [email protected] Vassilis Roumantzis IBG +30 2108173394 [email protected]
Christian Devismes CIC +33 1 53 48 80 85 [email protected] Zafer Rüzgar EQB +49 69 58 99 74 12 [email protected]
Andrea Devita, CFA BAK +39 02 4344 4031 [email protected] Antti Saari OPG +358 10 252 4359 [email protected]
Enrico Esposti, CIIA BAK +39 02 4344 4022 [email protected] Paola Saglietti BAK +39 02 4344 4287 [email protected]
Rafael Fernández de Heredia GVC +34 91 436 78 08 [email protected] Francesco Sala BAK +39 02 4344 4240 [email protected]
Gabriele Gambarova BAK +39 02 43 444 289 [email protected] Tim Schuldt, CFA EQB +49 69 5899 7433 [email protected]
Eduardo Garcia Arguelles GVC +34 914 367 810 [email protected] Cengiz Sen EQB +4969 58997 435 [email protected]
Alexandre Gérard CIC +33 1 53 48 80 93 [email protected] Pekka Spolander OPG +358 10 252 4351 [email protected]
Philipp Häßler, CFA EQB +49 69 58997 414 [email protected] Kimmo Stenvall OPG +358 10 252 4561 [email protected]
Simon Heilmann EQB +49 69 58 997 413 [email protected] Natalia Svyrou-Svyriadi IBG +30 210 81 73 384 [email protected]
Dr. Knud Hinkel, CFA EQB + 49 69 58997 419 [email protected] Manuel Tanzer, CFA EQB +49 69 58997-418 [email protected]
Ebrahim Homani CIC +33 1 53 48 80 87 [email protected] Luigi Tramontana BAK +39 02 4344 4239 [email protected]
Carlos Jesus CBI +351 21 389 6812 [email protected] Johan van den Hooven NIBC +312 0 5508518 [email protected]
Mark Josefson EQB +4969-58997-437 [email protected] Dylan van Haaften NIBC +312 0 611915485 [email protected]
Jean-Christophe Lefèvre-Moulenq CIC +33 1 53 48 80 65 [email protected] Sebastian Winkler NIBC +31 6 21 16 17 94 [email protected]
João Miguel Lourenço CBI +35 121 389 6841 [email protected]
(**) excluding: strategists, macroeconomists, heads of research not covering specific stocks, credit analysts, technical analysts

First Sensor AG
Page 35
Recommendations and Disclosures
Coverage Analyst Target Rating Disc. Coverage Analyst Target Rating Disc.1&1 DRILLISCH AG Sen 66.00 Buy Merck Miemiet z 112.00 Buy
2G Energy Rüzgar 23.50 Accumulat e 2/ 3/ 5 Merkur Bank Häßler 10.00 Buy 2/ 7
Aareal Bank Häßler 42.00 Neut ral Met ro AG Bruns 17.00 Buy 2
adidas Josef son 228.00 Accumulat e MLP Häßler 7.50 Buy 2/ 3
Adler Modemaerkt e Josef son 6.35 Buy 7 MTU Aero Engines Rüzgar 130.00 Reduce 2
ADLER Real Est at e Mayer 17.10 Accumulat e Munich Re Häßler 210.00 Accumulat e
Aixt ron Sen 11.60 Accumulat e 2/ 3 Nemet schek SE Mildner 47.00 Reduce 5
Allianz Häßler 200.00 Neut ral Nexus AG Mildner 28.00 Buy
Axel Springer Josef son 66.50 Reduce Norma Group Schuldt 62.00 Neut ral
Bayer Miemiet z 118.00 Buy OHB SE Rüzgar 40.00 Neut ral 7
Baywa Bruns 33.00 Buy 2/ 7 OVB Holding AG Häßler 20.00 Neut ral 2/ 5/ 7
BB Biot ech Miemiet z 73.00 Buy 7 Pat r izia Mayer 18.00 Neut ral
Biot est Miemiet z 25.00 Neut ral 2/ 3 Pf eif f er Vacuum Sen 162.00 Buy 5
BMW Schuldt 105.00 Buy Procredit Holding Häßler 15.00 Buy 2/ 3/ 5
Brennt ag Hinkel 59.80 Buy 2 PSI SOFTWARE AG Mildner 20.00 Buy 2/ 3
Ceconomy AG Bruns 10.70 Reduce Puma Josef son 492.00 Buy
Cenit Mildner 22.50 Buy PWO Schuldt 52.00 Buy 2/ 3
comdirect Häßler 11.20 Neut ral Rheinmet all Rüzgar 118.00 Neut ral
Commerzbank Häßler 13.00 Neut ral RIB Sof t ware Mildner 25.00 Buy 2/ 3
Cont inent al Schuldt 270.00 Buy RTL Group Josef son 72.00 Accumulat e
CORESTATE Capit al Holding S.A. Mayer 72.00 Buy 2/ 5 S&T AG Sen 21.00 Buy 2/ 3
CTS Event im Heilmann 39.50 Neut ral SAF-Holland Schuldt 17.00 Neut ral 7
Daimler AG Schuldt 80.00 Accumulat e Schaef f ler Tanzer 14.30 Buy
Daldrup & Soehne Becker 14.50 Buy 2/ 3/ 5 Schalt bau Holding AG Becker 32.20 Buy 2/ 7
Demire Mayer 4.55 Buy 2/ 5 SCOUT24 Heilmann 31.00 Reduce 2
Deut sche Bank Häßler 14.00 Buy Siegf r ied Holding AG Miemiet z 338.00 Neut ral
Deut sche EuroShop Mayer 33.00 Neut ral Siemens Healt hineers AG Rüzgar 35.50 Accumulat e 2
Deut sche Pf andbrief bank Häßler 13.50 Neut ral SLM Solut ions Sen 24.00 Sell
Deut sche Telekom Sen 13.30 Neut ral SMT Scharf AG Rüzgar 16.70 Buy 2/ 3
Duerr August in 120.00 Buy Sof t ware AG Mildner 30.00 Sell
Elr ingKlinger Schuldt 10.00 Sell St abilus Tanzer 91.00 Buy
elumeo SE Josef son 10.90 Accumulat e Suedzucker Bruns 12.00 Sell
Epigenomics AG Miemiet z 4.72 Accumulat e 2/ 3 Suess MicroTec Sen 13.80 Accumulat e 2/ 3
Euromicron AG Becker 13.00 Buy 2/ 3/ 5 Surt eco Mildner 30.50 Buy 2/ 3
Eyemaxx Real Est at e Mayer 16.00 Buy 2/ 5/ 7 Symrise AG Hinkel 67.00 Neut ral
Ferrat um Häßler 30.00 Buy Syzygy AG Heilmann 11.50 Accumulat e 2/ 3
Fielmann Heilmann 70.00 Neut ral TAKKT AG Bruns 18.50 Neut ral 2
First Sensor AG Becker 27.00 Accumulat e 7 Talanx Group Häßler 40.00 Accumulat e
Freenet Sen 36.00 Buy 2 Technot rans Becker 45.70 Neut ral 2/ 3
Fuchs Pet rolub Hinkel 48.00 Neut ral TELE COLUMBUS Sen 9.70 Buy
Gea Group August in 39.00 Neut ral Telef onica Deut schland Sen 3.40 Sell
Gerresheimer AG Rüzgar 69.00 Neut ral Unit ed Int ernet Sen 63.00 Buy
Gerry Weber Josef son 8.00 Neut ral Vapiano Bruns 26.50 Buy 2/ 7
Gesco Becker 34.20 Accumulat e 2/ 3/ 5 va-Q-t ec Sen 17.00 Neut ral 2/ 3/ 5
GFT Technologies Mildner 15.50 Buy 2/ 3 Viscom Rüzgar 28.00 Buy 2/ 3
Gigaset Sen 0.85 Accumulat e 2/ 3 Volkswagen Schuldt 162.00 Neut ral
Grenke Häßler 90.00 Neut ral Wacker Neuson SE Becker 27.20 Neut ral
Hannover Re Häßler 110.00 Neut ral windeln.de Josef son 3.10 Buy 2
Heidelberg Pharma Miemiet z 3.50 Accumulat e 2/ 3 XING SE Heilmann 300.00 Buy
Heidelberger Druck August in 3.60 Buy Zalando Josef son 44.50 Neut ral
HELLA GmbH & Co. KGaA Tanzer 57.00 Accumulat e
Hornbach Holding Bruns 89.00 Buy
Hugo Boss Josef son 81.00 Buy
Hypoport AG Häßler 172.00 Accumulat e 2/ 7
INDUS Holding AG Becker 64.50 Neut ral
K+S AG Hinkel 24.40 Neut ral
Koenig & Bauer August in 72.00 Neut ral
Krones AG August in 123.00 Accumulat e
KWS SAAT Hinkel 348.00 Buy
Lanxess Hinkel 83.00 Buy
Leoni Schuldt 57.00 Neut ral
Linde Hinkel 176.00 Neut ral
Logwin Mildner 148.00 Neut ral 2/ 3/ 5
Manz AG Rüzgar 37.00 Neut ral 2/ 3
MAX Aut omat ion AG Becker 9.40 Buy 2/ 3/ 5
* = Coverage suspended Source: equinet Recommendat ions

First Sensor AG
Page 36
Notice according to § 34 b (German) Securities Trading Act (“Wertpapierhandelsgesetz”) This document is issued by Equinet Bank AG (“Equinet Bank”). It has been prepared by its authors independently of the Company, and none of Equinet Bank, the Company or its shareholders has independently verified any of the information given in this document. Equinet Bank possesses relations to the covered companies as detailed in the table on the previous page. Additional information and disclosures will be made available upon request and/or can be looked up on our website http://www.Equinet Bank-ag.de 1 - Equinet Bank and/or its affiliate(s) hold(s) more than 5% of the share capital of this company calculated under computational methods required by German law. 2 - Equinet Bank acts as a designated sponsor for this company, including the provision of bid and ask offers. Therefore, we regularly possess shares of the company in our proprietary trading books. Equinet Bank receives a commission from the company for the provision of the designated sponsor services. 3 – The designated sponsor services include a contractually agreed provision of research services. 4 – Within the last twelve months, Equinet Bank was involved as a lead or co-lead manager in the public offering of securities which are/whose issuer is the subject of this report. 5 – Within the last twelve months, Equinet Bank and/or its affiliate(s) provided investment banking- and/or other consultancy services for this company and/or it’s shareholders. 6 - Equinet Bank and/or its affiliate(s) has/have other substantial financial interests in relation to this issuer. 7 – Equinet Bank has entered into an agreement with this company about the preparation of research reports and – in return - receives a compensation. Companies of the Equinet Bank group and/or its directors, officers and employees or clients may take positions in, and may make purchases and/or sales as principal or agent in the securities or related financial instruments discussed in our reports. The Equinet Bank group may provide investment banking and other services to and/or serve as directors of the companies referred to in our reports. In compliance with Para 5 Sec. 4 of the Ordinance on the Analysis of Financial Instruments (FinAnV) Equinet Bank has realized additional internal and organizational measures, such as specific research guidelines, to prevent or manage conflicts of interest. Neither the company nor its employees are allowed to receive donations from third parties with a special interest in the content of the analysis. The salary of the research analysts of Equinet Bank AG does not depend on the investment banking transactions of the company. Nevertheless, this does not rule out the payment of a bonus which depends on the overall financial performance of the bank. Particular care is taken that the individual performance of each research analyst of Equinet Bank AG is not being assessed by a manager of another business division with similar or same interests. To assure a highest degree of transparency Equinet Bank AG regularly provides - on a quarterly basis – a summary according to Para 5 Sec. 4 No. 3 of the Ordinance on the Analysis of Financial Instruments (FinAnV). It informs about the overall analysts recommendations and sets them in a relationship to those companies, for which Equinet Bank provided investment banking services within the last twelve months. This summary is published via our website http://www.Equinet Bank-ag.de. Furthermore, we refer to our conflict of interest policy as well as the German Securities Trading Act (WpHG) and the Ordinance on the Analysis of Financial Instruments (FinAnV) provided in the download area of our website http://www.Equinet Bank-ag.de.
Remarks
Recommendation System Buy - The stock is expected to generate a total return of over 20% during the next 12 months time horizon. Accumulate - The stock is expected to generate a total return of 10% to 20% during the next 12 months time horizon. Hold - The stock is expected to generate a total return of 0% to 10% during the next 12 months time horizon Reduce - The stock is expected to generate a total return of 0 to -10% during the next 12 months time horizon Sell - The stock is expected to generate a total return below -10% during the next 12 months time horizon Basis of Valuation
Equinet Bank uses for valuation purposes primarily DCF-Valuations and Sum-Of-The-Parts-Valuations as well as peer group comparisons. Share prices
Share prices in this analysis are the German closing prices of the last trading day before the publication. Sources Equinet Bank has made any effort to carefully research all information contained in the analysis. The information on which the analysis is based has been obtained from sources which we believe to be reliable such as, for example, Reuters, Bloomberg and the relevant press as well as the company which is the subject of the analysis. Only that part of the research note is made available to the issuer, who is the subject of the analysis, which is necessary to properly reconcile with the facts. Should this result in considerable changes a reference is made in the research note. Actualizations Opinions expressed in this analysis are our current opinions as of the issuing date indicated on this document. We do not commit ourselves in advance to whether and in which intervals updates are made.

First Sensor AG
Page 37
DISCLAIMER
THE PREPARATION OF THIS DOCUMENT IS SUBJECT TO REGULATION BY GERMAN LAW. THIS DOCUMENT IS BEING SUPPLIED TO YOU SOLELY IN YOUR CAPACITY AS A PROFESSIONAL INSTITUTIONAL INVESTOR FOR YOUR INFORMATION AND MAY NOT BE REPRODUCED OR PASSED ON, DIRECTLY OR INDIRECTLY, TO ANY OTHER PERSON OR PUBLISHED, IN WHOLE OR IN PART, FOR ANY PURPOSE. NEITHER THIS DOCUMENT NOR ANY COPY OF IT MAY BE TAKEN OR TRANSMITTED INTO AUSTRALIA, CANADA OR JAPAN OR DISTRIBUTED, DIRECTLY OR INDIRECTLY, IN AUSTRALIA, CANADA OR JAPAN OR TO ANY RESIDENT THEREOF. THE DELIVERY OF THIS RESEARCH REPORT TO U.S. PERSONS IN THE UNITED STATES OF AMERICA IS MADE BY AND UNDER THE RESPONSIBILITY OF GSN NA, INC. (REGISTERED WITH THE SEC). THIS RESEARCH REPORT IS ONLY INTENDED FOR PERSONS WHO QUALIFY AS MAJOR U.S. INSTITUTIONAL INVESTORS, AS DEFINED IN SECURITIES EXCHANGE ACT RULE 15A-6, AND DEAL WITH GSN NA, INC. HOWEVER, THE DELIVERY OF THIS RESEARCH REPORT OR SUMMARY TO ANY U.S. PERSON SHALL NOT BE DEEMED A RECOMMENDATION OF GSN NA, INC. TO EFFECT ANY TRANSACTIONS IN THE SECURITIES DISCUSSED HEREIN OR AN ENDORSEMENT OF ANYOPINION EXPRESSED HEREIN. GSN NA, INC. MAY FURNISH UPON REQUEST ALL INVESTMENT INFORMATION AVAILABLE TO IT SUPPORTING ANY RECOMMENDATIONS MADE IN THIS RESEARCH REPORT. ALL TRADES WITH U.S. RECIPIENTS OF THIS RESEARCH SHALL BE EXECUTED THROUGH GSN NA, INC. THIS DOCUMENT IS FOR DISTRIBUTION IN THE U.K. ONLY TO PERSONS WHO HAVE PROFESSSIONAL EXPERIENCE IN MATTERS RELATING TO INVESTMENTS AND FALL WITHIN ARTICLE 19(5) OF THE FINANCIAL SERVICES AND MARKETS ACT 2000 (FINANCIAL PROMOTION) ORDER 2005 (THE “ORDER”) OR (ii) ARE PERSONS FALLING WITHIN ARTICLE 49(2)(A) TO (D) OF THE ORDER, NAMELY HIGH NET WORTH COMPANIES, UNINCORPORATED ASSOCIATIONS ETC (ALL SUCH PERSONS TOGETHER BEING REFERRED TO AS “RELEVANT PERSONS”). THIS DOCUMENT MUST NOT BE ACTED ON OR RELIED UPON BY PERSONS WHO ARE NOT RELEVANT PERSONS. ANY INVESTMENT OR INVESTMENT ACTIVITY TO WHICH THIS DOCUMENT RELATES IS AVAILABLE ONLY TO RELEVANT PERSONS AND WILL BE ENGAGED IN ONLY WITH RELEVANT PERSONS. THE DISTRIBUTION OF THIS DOCUMENT IN OTHER JURISDICTIONS OR TO RESIDENTS OF OTHER JURISDICTIONS MAY ALSO BE RESTRICTED BY LAW, AND PERSONS INTO WHOSE POSSESSION THIS DOCUMENT COMES SHOULD INFORM THEMSELVES ABOUT, AND OBSERVE, ANY SUCH RESTRICTIONS. BY ACCEPTING THIS REPORT YOU AGREE TO BE BOUND BY THE FOREGOING INSTRUCTIONS. YOU SHALL INDEMNIFY EQUINET BANK AGAINST ANY DAMAGES, CLAIMS, LOSSES, AND DETRIMENTS RESULTING FROM OR IN CONNECTION WITH THE UNAUTHORIZED USE OF THIS DOCUMENT. This report is for informational purposes only and has no regard to the specific investment objectives, financial situation or particular needs of any specific recipient. This publication is intended to provide information to assist institutional investors in making their own investment decisions, not to provide investment advice to any specific investor. Therefore, investments discussed and recommendations made herein may not be suitable for all investors: readers must exercise their own inde-pendent judgment as to the suitability of such investments and recommendations in the light of their own investment objectives, experience, taxation status and financial position. The information herein is believed by Equinet Bank to be reliable and has been obtained from sources believed to be reliable, but Equinet Bank makes no representation as to the accuracy or completeness of such information. The information given in this report is subject to change without notice; it may be incomplete or condensed and it may not contain all material information concerning the Company. Opinions expressed herein may differ or be contrary to opinions expressed by other business areas of the Equinet Bank group as a result of using different assumptions and criteria. Equinet Bank is under no obligation to update or keep the information current. Equinet Bank provides data concerning the future development of securities in the context of its usual research activity. However, if a financial instrument is denominated in a currency other than an investor’s currency, a change in exchange rates may adversely affect the price or value of, or the income derived from, the financial instrument, and such investor effectively assumes currency risk. In addition, income from an investment may fluctuate and the price or value of financial instruments de-scribed in this report, either directly or indirectly, may rise or fall. Furthermore, past performance is not necessarily indicative of future results. Neither the author nor Equinet Bank accepts any liability whatsoever for any loss howsoever arising from any use of this publication or its contents or otherwise arising in connection herewith, except as provided for under applicable regulations. Equinet Bank shall only be liable for any damages intentionally caused or which result from any gross negligence of Equinet Bank. Further Equinet Bank shall be liable for the breach of a material obligation of Equinet Bank, however, limited to the amount of the typical foreseeable which shall in no event exceed the amount of EUR 10,000. German law shall be applicable and court of jurisdiction for all disputes shall be Frankfurt/Main (Germany).
Competent Supervisory Authority: Bundesanstalt für Finanzdienstleistungsaufsicht -BaFin- (Federal Financial Supervisory Authority) Graurheindorfer Straße 108, 53117 Bonn and
Marie-Curie-Str. 24-28, 60439 Frankfurt am Main
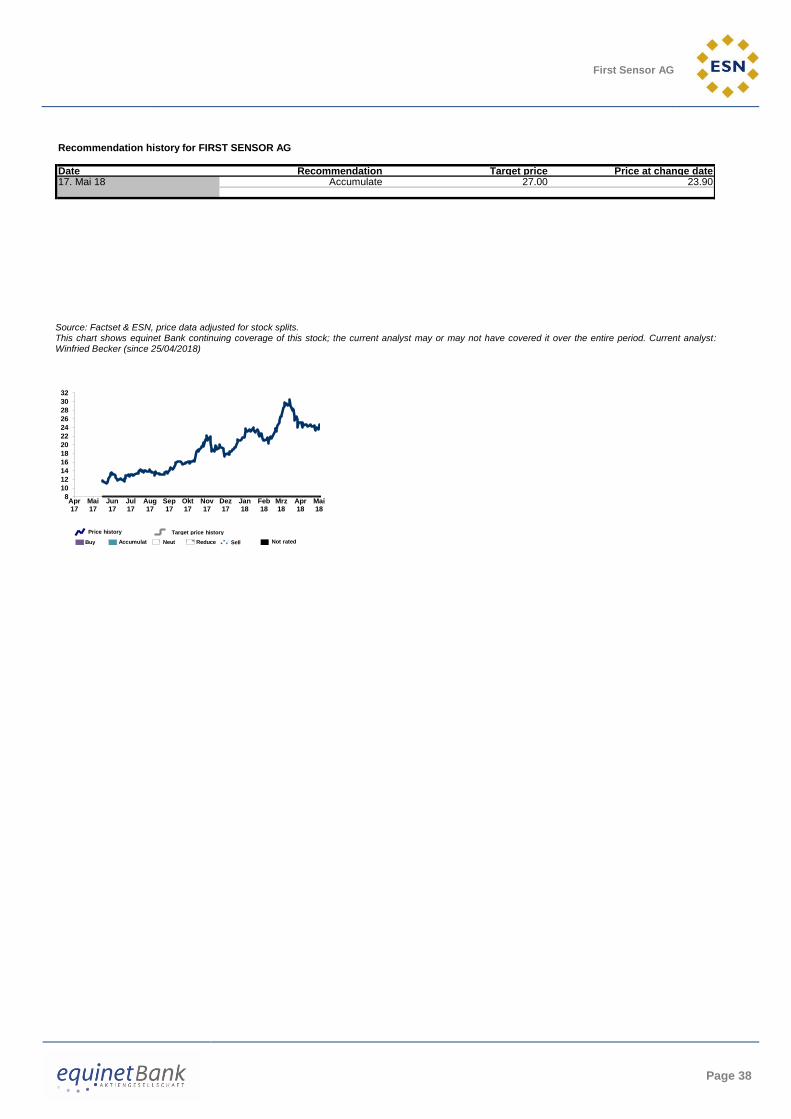
First Sensor AG
Page 38
Source: Factset & ESN, price data adjusted for stock splits. This chart shows equinet Bank continuing coverage of this stock; the current analyst may or may not have covered it over the entire period. Current analyst: Winfried Becker (since 25/04/2018)
Recommendation history for FIRST SENSOR AG
Date Recommendation Target price Price at change date17. Mai 18 Accumulate 27.00 23.90
8
10
12
14
16
18
20
22
24
26
28
30
32
Apr17
Mai17
Jun17
Jul17
Aug17
Sep17
Okt17
Nov17
Dez17
Jan18
Feb18
Mrz18
Apr18
Mai18
Buy Accumulat Neut Reduce Sell Not rated
Price history Target price history

First Sensor AG
Page 39
ESN Recommendation System
The ESN Recommendation System is Absolute. It means that each stock is rated on the
basis of a total return, measured by the upside potential (including dividends and capital
reimbursement) over a 12 month time horizon.
The ESN spectrum of recommendations (or ratings) for each stock comprises 5
categories: Buy (B), Accumulate (A), Neutral (N), Reduce (R) and Sell (S).
Furthermore, in specific cases and for a limited period of time, the analysts are allowed to
rate the stocks as Rating Suspended (RS) or Not Rated (NR), as explained below.
Meaning of each recommendation or rating:
Buy: the stock is expected to generate total return of over 15% during the next 12 months time horizon
Accumulate: the stock is expected to generate total return of 5% to 15% during the next 12 months time horizon
Neutral: the stock is expected to generate total return of -5% to +5% during the next 12 months time horizon
Reduce: the stock is expected to generate total return of -5% to -15% during the next 12 months time horizon
Sell: the stock is expected to generate total return under -15% during the next 12 months time horizon
Rating Suspended: the rating is suspended due to a change of analyst covering the stock or a capital operation (take-over bid, SPO, …) where the issuer of the document (a partner of ESN) or a related party of the issuer is or could be involved
Not Rated: there is no rating for a company being floated (IPO) by the issuer of the document (a partner of ESN) or a related party of the issuer
Certain flexibility on the limits of total return bands is permitted especially during higher phases of volatility on the markets
Equinet Bank Ratings Breakdown
For full ESN Recommendation and Target price history (in the last 12 months) please see ESN Website Link
Date and time of production: 17 May 2018: 19:30 CET First date and time of dissemination: 17 May 2018: 19:35 CET
Buy42%
Accumulate17%
Neutral33%
Reduce4%
Sell4%
First Sensor AG
Page 40
Disclaimer: These reports have been prepared and issued by the Members of European Securities Network LLP (‘ESN’). ESN, its Members and their affiliates (and any director, officer or employee thereof), are neither liable for the proper and complete transmission of these reports nor for any delay in their receipt. Any unauthorised use, disclosure, copying, distribution, or taking of any action in reliance on these reports is strictly prohibited. The views and expressions in the reports are expressions of opinion and are given in good faith, but are subject to change without notice. These reports may not be reproduced in whole or in part or passed to third parties without permission. The information herein was obtained from various sources. ESN, its Members and their affiliates (and any director, officer or employee thereof) do not guarantee their accuracy or completeness, and neither ESN, nor its Members, nor its Members’ affiliates (nor any director, officer or employee thereof) shall be liable in respect of any errors or omissions or for any losses or consequential losses arising from such errors or omissions. Neither the information contained in these reports nor any opinion expressed constitutes an offer, or an invitation to make an offer, to buy or sell any securities or any options, futures or other derivatives related to such securities (‘related investments’). These reports are prepared for the clients of the Members of ESN only. They do not have regard to the specific investment objectives, financial situation and the particular needs of any specific person who may receive any of these reports. Investors should seek financial advice regarding the appropriateness of investing in any securities or investment strategies discussed or recommended in these reports and should understand that statements regarding future prospects may not be realised. Investors should note that income from such securities, if any, may fluctuate and that each security’s price or value may rise or fall. Accordingly, investors may receive back less than originally invested. Past performance is not necessarily a guide to future performance. Foreign currency rates of exchange may adversely affect the value, price or income of any security or related investment mentioned in these reports. In addition, investors in securities such as ADRs, whose value are influenced by the currency of the underlying security, effectively assume currency risk. ESN, its Members and their affiliates may submit a pre-publication draft (without mentioning neither the recommendation nor the target price/fair value) of its reports for review to the Investor Relations Department of the issuer forming the subject of the report, solely for the purpose of correcting any inadvertent material inaccuracies. Like all members employees, analysts receive compensation that is impacted by overall firm profitability For further details about the analyst certification, the specific risks of the company and about the valuation methods used to determine the price targets included in this report/note, please refer to the specific disclaimer pages prepared by the ESN Members. In the case of a short note please refer to the latest relevant published research on single stock or contact the analyst named on the front of the report/note for detailed information on the valuation methods, earning estimates and risks. A full description of all the organisational and administrative measures taken by the Members of ESN to manage interest and conflicts of interest are available on the website of the Members or in the local disclaimer of the Members or contacting directly the Members. Research is available through the ESN Members sales representative. ESN will provide periodic updates on companies or sectors based on company-specific developments or announcements, market conditions or any other publicly available information. Unless agreed in writing with an ESN Member, this research is intended solely for internal use by the recipient. Neither this document nor any copy of it may be taken or transmitted into Australia, Canada or Japan or distributed, directly or indirectly, in Australia, Canada or Japan or to any resident thereof. This document is for distribution in the U.K. Only to persons who have professional experience in matters relating to investments and fall within article 19(5) of the financial services and markets act 2000 (financial promotion) order 2005 (the “order”) or (ii) are persons falling within article 49(2)(a) to (d) of the order, namely high net worth companies, unincorporated associations etc. (all such persons together being referred to as “relevant persons”). This document must not be acted on or relied upon by persons who are not relevant persons. Any investment or investment activity to which this document relates is available only to relevant persons and will be engaged in only with relevant persons. The distribution of this document in other jurisdictions or to residents of other jurisdictions may also be restricted by law, and persons into whose possession this document comes should inform themselves about, and observe, any such restrictions. By accepting this report you agree to be bound by the foregoing instructions. You shall indemnify ESN, its Members and their affiliates (and any director, officer or employee thereof) against any damages, claims, losses, and detriments resulting from or in connection with the unauthorized use of this document. For disclosure upon “conflicts of interest” on the companies under coverage by all the ESN Members, on the “interests” and “conflicts” of the analysts and on each “company recommendation history”, please visit the ESN website (http://www.esnpartnership.eu/research_and_database_access/insite)
or refer to the local disclaimer of the Members, or contact directly the
Memberwww.bancaakros.it regulated by the CONSOB - Commissione Nazionale per le Società e la
Borsa
www.caixabi.pt regulated by the CMVM - Comissão do Mercado de Valores Mobiliários
www.cmcicms.com regulated by the AMF - Autorité des marchés financiers
www.equinet-ag.de regulated by the BaFin - Bundesanstalt für Finanzdienstleistungsaufsicht
www.ibg.gr regulated by the HCMC - Hellenic Capital Market Commission
www.nibc.com regulated by the AFM - Autoriteit Financiële Markten
www.op.fi regulated by the Financial Supervision Authority
www.valores.gvcgaesco.es regulated by CNMV - Comisión Nacional del Mercado de Valores
Members of ESN (European Securities Network LLP)
Banca Akros S.p.A. Viale Eginardo, 29 20149 MILANO Italy Phone: +39 02 43 444 389 Fax: +39 02 43 444 302
GVC Gaesco Beka, SV, SA
C/ Marques de Villamagna 3 28001 Madrid Spain Phone: +34 91 436 7813
Caixa-Banco de Investimento Avenida João XXI, 63 1000-300 Lisboa Portugal Phone: +351 21 313 73 00
Fax: +351 21 389 68 98
CM - CIC Market Solutions 6, avenue de Provence 75441 Paris Cedex 09 France Phone: +33 1 53 48 81 93
equinet Bank AG
Gräfstraße 97 60487 Frankfurt am Main Germany Phone:+49 69 – 58997 – 212 Fax:+49 69 – 58997 – 299
OP Corporate Bank plc
P.O.Box 308 Teollisuuskatu 1, 00013 Helsinki Finland Phone: +358 10 252 011 Fax: +358 10 252 2703
NIBC Bank N.V.
Gustav Mahlerlaan 348 P.O.Box 235 1082 ME Amsterdam The Netherlands Phone: +31 20 550 8500 Fax: +31 20 626 8064
Investment Bank of Greece
32 Aigialeias Str & Paradissou, 151 25 Maroussi, Greece Phone: +30 210 81 73 383