full legal disclaimer - spruce point capital management€¦ · 31/10/2018 · 11/13/14 ametek /...
TRANSCRIPT

1
2
Full Legal Disclaimer
This research presentation expresses our research opinions You should assume that as of the publication date of any presentation report or letter
Spruce Point Capital Management LLC (possibly along with or through our members partners affiliates employees andor consultants) along with our
subscribers and clients has a short position in all stocks (and are longshort combinations of puts and calls on the stock) covered herein including
without limitation Dollarama Inc (ldquoDOLrdquo) and therefore stand to realize significant gains in the event that the price of its stock declines Following
publication of any presentation report or letter we intend to continue transacting in the securities covered therein and we may be long short or neutral
at any time hereafter regardless of our initial recommendation All expressions of opinion are subject to change without notice and Spruce Point
Capital Management does not undertake to update this report or any information contained herein Spruce Point Capital Management subscribers
andor consultants shall have no obligation to inform any investor or viewer of this report about their historical current and future trading activities
This research presentation expresses our research opinions which we have based upon interpretation of certain facts and observations all of which
are based upon publicly available information and all of which are set out in this research presentation Any investment involves substantial risks
including complete loss of capital Any forecasts or estimates are for illustrative purpose only and should not be taken as l imitations of the maximum
possible loss or gain Any information contained in this report may include forward looking statements expectations pro forma analyses estimates
and projections You should assume these types of statements expectations pro forma analyses estimates and projections may turn out to be
incorrect for reasons beyond Spruce Point Capital Management LLCrsquos control This is not investment or accounting advice nor should it be construed
as such Use of Spruce Point Capital Management LLCrsquos research is at your own risk You should do your own research and due d iligence with
assistance from professional financial legal and tax experts before making any investment decision with respect to securities covered herein All
figures assumed to be in Canadian Dollars unless specified otherwise
To the best of our ability and belief as of the date hereof all information contained herein is accurate and reliable and does not omit to state material
facts necessary to make the statements herein not misleading and all information has been obtained from public sources we believe to be accurate
and reliable and who are not insiders or connected persons of the stock covered herein or who may otherwise owe any fiduciary duty or duty of
confidentiality to the issuer or to any other person or entity that was breached by the transmission of information to Spruce Point Capital Management
LLC However Spruce Point Capital Management LLC recognizes that there may be non-public information in the possession of DOL or other insiders
of DOL that has not been publicly disclosed by DOL Therefore such information contained herein is presented ldquoas isrdquo without warranty of any kind ndash
whether express or implied Spruce Point Capital Management LLC makes no other representations express or implied as to the accuracy timeliness
or completeness of any such information or with regard to the results to be obtained from its use You should assume all statements made are our
opinions unless sourced as facts where practical
This reportrsquos estimated fundamental value only represents a best efforts estimate of the potential fundamental valuation of a specific security and is not
expressed as or implied as assessments of the quality of a security a summary of past performance or an actionable investment strategy for an
investor This is not an offer to sell or a solicitation of an offer to Buy any security nor shall any security be offered or sold to any person in any
jurisdiction in which such offer would be unlawful under the securities laws of such jurisdiction Spruce Point Capital Management LLC is not registered
as an investment advisor brokerdealer or accounting firm
All rights reserved This document may not be reproduced or disseminated in whole or in part without the prior written consent of Spruce Point
3
About Spruce Point Capital Management
Spruce Point believes that Dollarama is significantly overvalued based on its undifferentiated and increasingly
uncompetitive business model inflated and unsustainable margins which are posed to decline and its limited growth
prospects which will restrain its ability to hit its long-term earnings expectations
Spruce Point Capital Is An Industry Recognized Research Activist Investment Firm Founded In 2009
bull Founded by Ben Axler a former investment banker with 18 years experience on Wall Street
bull Ranked the 1 Short-Seller in the world by Sumzero after a comprehensive study of 12000 analyst recommendations dating back to 2008 (March 2015)
bull Ranked the 13 Most Influential FinTweeter on Twitter according to Sentieo analysis (Dec 2016)
Report Date Company TickerEnterprise Value
At Report Date ($ billions)CEO Departure Date
2718 Realty Income O $198 John Case Oct 2018
81617 Dorman Products DORM $22 Mathias Barton Aug 2018
71317 Gentex GNTX $47 Fred Bauer Jan 2018
41316 Sabre Corp SABR $112 Tom Klein June 2016
121715 Intertain ITTO $15 John FitzGerald Feb 2016
81915 Caesarstone CSTE $17 Yos Shiran May 2016
21015 Greif GEF $32 David Fischer Oct 2015
111314 AMETEK AME $140 Frank Hermance May 2016
11514 LKQ Corp LKQ $118 Robert Wagman March 2017
72313 Just Energy JETO $20 Ken Hartwick Feb 2014
3513 Boulder Brands BDBD $10 Stephen Hughes June 2015
61412 Bazaarvoice BV $12 Bret Hurt Nov 2012
CEO Departures Post Recent Spruce Point Research Activism
4
Spruce Point Has Succeeded In Canadian Shareholder Activism
Spruce Point has written four critical activist reports in Canada In a majority of the cases the share price has met or
exceeded our downside estimate of intrinsic value The average share price decline is 57 A common theme is that
Canadian analysts donrsquot ask difficult questions of management challenge assumptions and are overly optimistic
Company Intertain TSO3 Just Energy Maxar (Formerly MacDonald Dettwiller)
Exchange Ticker TSX IT TSX TOS NYSE and TSX JE NYSE and TSX MAXR
Report Date December 17 2015 August 23 2017 July 31 2013 Aug 7 2018
Stock Brokers WhoSay Said ldquoBuyrdquo
CanaccordMackieNatrsquol BankCormark
CanaccordRBCScotiaGMP CanaccordRBCTDCIBCCanaccordRBCTDCIBCGMPBMO
Natrsquol BankScotia
Spruce Pointrsquos Criticisms
bull Stock promotion of a poorly organized online gaming roll-up
bull CEO FitzGerald has a checkered past with ties to questionable people
bull Ties to Amaya a company being investigated by regulators
bull Management Incentive Program is flawed and unjustly enriches insiders
bull Questionable financial reporting and accounting practices
bull Overvaluation 45-70 downside
bull Poorly promoted Canadian healthcare company with limited product value
bull Disclosure issues obfuscate actual end market sales and overstatement of total addressable market
bull Over-promotion of a partnership with Getinge that would be destined to fail
bull Terrible insider alignment with mgmt owning 1 of shares
bull 80+ downside when Getinge deal fails
bull Growth by deceptive sales tactics of a service with limited value
bull Reckless debt-fueled acquisition spree has stretched the balance sheet
bull Diverting investors from problems by creating metrics that overstate results
bull Dividend at high risk of being cutbull 46+ downside risk to $4share
bull MDArsquos acquisition of DigitalGlobe driven by the need to cover problems in its satellite business including a forthcoming decline in the geostationary satellite industry
bull Brazen accounting scheme including inflation of intangible assets to overstated Non-IFRS EPS
bull Dangerously levered at 58x when taking into account off-balance sheet liabilities make Maxarrsquos dividend at high risk of being cut or eliminated
bull Analyst estimates are too high and goodwill and asset impairment looms
Successful Outcome
bull Intertain initiated a strategic review upon the report release
bull Feb 2016 CEO FitzGerald resigns from Intertain (source)
bull Intertain delists from the TSX in Jan 2017 and re-lists its shares in the UK -- claiming that the Canadian markets donrsquot value its business (source)
bull Analyst price targets of C$2800 were never achieved Shares hit a low of C$713 down 42
bull On Jan 25 2018 TSO3 discloses amendments to the Getinge partnership validating Spruce Pointrsquos criticisms (source)
bull Multiple brokers downgrade shares from gtC$500 to C$200
bull Share price made a low of C$048 in Oct 2018 down 81
bull Free cash flow available to pay the dividend has contracted materially
bull CEO Ken Hartwick resigned within 7 months after our report (source)
bull CFO resigned a little more than a year after our report (source)
bull Share price made a low of $348 in June 2018 down 51 which exceeded our low share price target
bull Maxarrsquos twice attempted to ldquorefuterdquo our conclusions yet its share price lingers near a multi-year low
bull Maxar admitted that it is evaluating an impairment of assets and that ldquoit is possible that an impairment or write-down will be recognized in Q3rsquo18rdquo
bull The Company also clarified its capital allocation strategy and suggested that debt pay was a priority leaving the safety of the dividend in question(source)
Executive Summary
6
Spruce Point Believes Dollarama (TSX DOL) Is A ldquoStrong Sellrdquo With ~40 Downside Risk
A Retailer Of Low-End Products With Declining Fundamentals In An Increasingly Competitive Environment
bull Undifferentiated Products Dollarama sells a variety of low-priced products mostly sourced directly from China Its purported advantage in ldquosourcingrdquo is contradicted by conversations with industry sources as well as numerous IP infringement lawsuits filed against the Company
bull Moving Upmarket Is A Risky Strategy Faced with years of negative average traffic growth and an increasingly saturated market Dollarama is driving comparable store sales growth by selling higher-priced items However in doing so it is quickly losing its reputation as a true ldquodollar storerdquo and per-store traffic numbers are declining as a result Big Lots (NYSE BIG) undertook a similar strategy in the 2000s but reversed course after admitting its failure
bull Saturation Is Imminent Dollarama cited a 900 store target at the time of its IPO in 2009 when it had just 585 stores Management has since revised this number upwards multiple times first to 1200 then to 1400 and most recently to 1700 Our analysis shows that this target is unrealistic and that the market is already bordering on oversaturation Dollaramarsquos FY lsquo19 store opening pace has thus far been its slowest in years
bull Margins Inexplicably High And Likely Unsustainable Gross margins of 39-40 are remarkably high for a discount retailer but intensifying competition rising labor costs rising transportation costs and a lapsing currency hedge benefit all threaten Dollaramarsquos high profitability levels Patterns in Dollaramarsquos hedging profits and gross margins ex-hedging suggest that management may be leaning on its FX-related profits to prevent its headline gross margin number from declining (see note on next page)
Troublesome Management And Governance Red Flags
bull Founding Family (And A Director) Have Significant Related-Party Deals The Rossy family launched Dollarama from its legacy retail chain in 1992 and owns significant real estate assets that are employed by the enterprise This may have played a role in managementrsquos recent decision to acquire Dollaramarsquos existing Montreal distribution center from the Rossys rather than open a second distribution facility in western Canada as have most peers
bull CEO Stepped Down And Installed His Son Larry Rossy stepped down as CEO in 2016 (and as Chairman in 2018) selecting as his replacement his son Neil ndashpreviously Dollaramarsquos Chief Merchandising Officer We question whether a thorough and arms-length search was conducted to fill this position
bull Opaque Supplier Relationship As part of a deal struck in 2013 Dollarama supplies goods (at an undisclosed profit margin) to Central American discount retailer Dollar City in exchange for an option to acquire the chain in 2020 However Dollarama currently has no formal stake in Dollar City and therefore does not consolidate Dollar Cityrsquos results We are concerned that Dollar City could be overpaying its vendors to lessen the financial burden on Dollarama
bull Insider Ownership Declining Former CEO Larry Rossy has sold or transferred ~75 of his shares since the 2009 IPO Bain Capital liquidated the last of its shares in 2011 at a split-adjusted price of $5 per share 18th the current price The current CFO owns no shares and regularly liquidates options
Dollarama (DOL or ldquothe Companyrdquo) is a dollar store which following a series of price hikes over the course of several yearsis no longer a true
ldquodollar storerdquo As a result DOL has fallen out of favor with value-oriented customers causing average store traffic to contract and thus
necessitating further price hikes to support SSS growth Management is nonetheless aggressively pursuing unrealistic growth targets even as
competitors flood the discount retail market and threaten its improbable margins DOLrsquos shares trade at a 50 premium to peers in the value
retail space ndash even following a ~20 drop after a disappointing Q2 ndash questionable governance and poor earnings quality notwithstanding
We believe that DOL will continue to miss lofty investor expectations and that its premium valuation will continue to be pressured
7
Spruce Point Believes Dollarama (TSX DOL) Is A ldquoStrong Sellrdquo With ~40 Downside Risk
Questionable Accounting Techniques And Capital Allocation Decisions Weaken Quality Of Earnings And Financial Position
bull Currency Hedge Supposedly A Pure Offset To CAD Depreciation But Has Been A Material Profit Center Dollarama claims to hedge currencies only to lock in consistent prices (in CAD) on which its customers can rely However in practice the Company adjusts prices to match non-hedged competitors leaving us to wonder why it hedges at all Much of the recent hedge benefit appears to have reversed but gross margins ex-hedges conveniently rose by just enough over the last two years to maintain steady profitability If nothing else we question whether Dollaramarsquos elevated margins are sustainable
bull Tenant Allowances And Leasehold Improvements Are Amortized Over Very Different Periods While accounting rules may give sufficient leeway to permit this difference we question why lease term assumptions should differ for these two capital accounts Earnings quality suffers notwithstanding
bull Sales Of Certain Assets Such As Vehicles Appear To Be Completed At Above-Market Prices While the financial impact of these moves is difficult to quantify (perhaps due in part to Dollaramarsquos opaque relationship with Dollar City) the liquidation of certain assets is significant in some quarters
bull Leverage Is Increasing Dollarama makes long-term financing decisions using short-term debt the cost of which has risen with recent debt issuances andis likely to continue to increase with rising interest rates ndash and as the Companyrsquos credit profile grows riskier We question managementrsquos decision to increase leverage to support buybacks and dividends simply because the earnings yield is above the after-tax cost of debt We also worry about the state of the balance sheet should the economic environment turn or should the business decline more rapidly
bull Depreciation Is Well Below Capex And Has Been For Years Capital spending easily bests industry peers both as a percentage of sales and vis-agrave-vis steadier DampA charges The mismatch with DampA suggests poor quality of earnings at the very least Meanwhile managementrsquos growth orientation has diverted capital spending away from store remodeling giving stores a stale and dated feel despite rising price points
bull Acquiring Real Estate Flatters EBITDA Acquiring related-party real estate not only lines the pockets of the founding family but also allows Dollarama to shift rent expenses out of the operating line The artificial EBITDA boost helps management to achieve its EBITDA-based compensation targets
Easy To Justify ~40 Downside In DOL Shares
bull Valuation Is Indefensible DOL currently trades at a ~50 premium to peers and carries among the highest multiples of any global retailer Higher only are the valuations of cregraveme de la cregraveme global fashion brands ndash Hermes Prada Ferragamo etc Such lofty multiples are inappropriate for a dollar store with serious near-to-medium-term business risks Analyst estimates are not sufficiently skeptical of managementrsquos targets in light of these concerns
bull Even If Nothing Goes Wrong The Stock Is Overvalued Even if Dollarama executes its growth plan perfectly maintains its world-leading margin and retains a hefty valuation premium to its peers the stock is at best fairly valued at ~$43
bull Under More Reasonable Assumptions DOL Stock Is Overvalued By 40 At Current Levels Even assuming that Dollarama achieves full market penetration ndash with no negative impact on per-store revenues from competition or cannibalization ndash the stock is worth $28 under normalized margins and at a multiple closer to peer norms down ~40 from current levels
bull Analysts Bullish But Wavering Dollaramarsquos disappointing Q2 ndash including SSS guidance contraction and a YoY decline in operating cash flow ndash provoked some downgrades but analysts still see ~26 upside in DOL shares regardless We believe that analysts are too trusting of DOLrsquos growth targets but that the Q2 miss put the Company on notice with a number of analysts Further disappointing quarters could bring more drastic analyst revisions
8
Consensus Estimates (CY) 2018A LTM 2019E 2020E
Stock Price $3845 EV Sales 44x 43x 40x 38x
Shares Outstanding 332 EV EBITDA 174x 167x 161x 149x
Market Capitalization 12752 Adj EV EBITDAR 153x 148x - -
Total Debt Outstanding 1880 Price EPS 254x 241x 224x 199x
Less Cash and Equivalents 182
Enterprise Value 14450 Growth and Margins 2018A LTM 2019E 2020E
Operating Leases 1130 Sales Growth 102 84 102 65
Finance Leases 4 EBITDA Margin 255 256 249 254
Adj Enterprise Value 15584 EPS Growth 228 160 130 127
Credit Metrics 2018A LTM 2019E 2020E
Net Debt EBITDA 20x 20x 19x 17x
Adj Net Debt EBITDAR 28x 27x - -
Capital Structure And Valuation
In C$ MM except per share figures or where indicated
At present Dollarama demonstrates impressive margins and is not egregiously over-levered on a Net Debt-to-EBITDA
basis However as competition increases customers push back against recent price hikes and operating costs creep
upwards we believe that management will have a difficult time maintaining current profitability levels ndash particularly
while pursuing an aggressive growth strategy Leverage will be less sustainable should the businessrsquo performance
decline or the economic environment turn threatening managementrsquos ability to support continued buybacks
dividends while growing store count
Source Dollarama and Bloomberg Estimates
Note Calendar Year Ended Jan 30th
Note Operating Leases valued at 6x Operating Lease Expense
Though analysts
project declining sales
growth they foresee
margin expansion at
the same time This
pair of estimates
makes little sense to
us and should make
investors skeptical of
consensus estimates
Our research will
explain why we
believe margins will be
pressured going
forward
9
Short-Term Debt In A Rising Rate Environment Introduces Refinancing Risk
Significant Short-Term Debt Maturities That Will Have To Be Refinanced At
Higher Rates
Dollarama Has Unhedged Exposure To Interest
Rateshellip
hellipWhile The Three-Month CDOR Rate Rises Rapidly
Source Dollarama
Source Bloomberg
Dollarama refinanced significant short-term debt just last evening levering up the business in the process
Management refinanced its C$400M of 3095 fixed-rate notes due this November with C$500M of 355 fixed-rate
notes due November 2023 Managementrsquos use of short-term debt has burdened the business with refinancing risk in
an environment in which the CDOR rate has risen sharply and is expected to rise for the foreseeable future which has
now forced the Company to bear materially higher interest expenses (compare to its 2203 fixed-rate credit due in
2022) The Company still has C$14B of debt due to mature within the next 12 quarters (including its credit facility)
leaving it exposed to further rate increases The Companyrsquos weighted average debt maturity is about 35 years
320
680
DOLCN Credit Breakdown (C$1875M Total)
Floating Fixed$0
$100
$200
$300
$400
$500
$600DOLCN Debt Maturity Schedule (by CY Quarter)
Available in Revolving Credit Facility Maturing Sep 2023 Available in Revolving Credit Facility Maturing Sep 2020
Series 2 Variable Rate CDOR+59bp Series 3 Variable Rate CDOR+27bp
Fixed Rate 2203 Fixed Rate 2337
Fixed Rate 355
10
Will Dollarama Be The Next Bain Capital-Led Failed Retail IPO
ldquoTwenty-two percent of Bain LBOs from 1984 to 1992 went bankruptrdquo according to Eileen Applebaum in her book
ldquoPrivate Equity at Workrdquo1 Recent Bain-led retail busts include Toys ldquoRrdquo Us Guitar Center and Gymboree
Company DateEnterprise
ValueBain Capital Quotes Outcome
Toys ldquoRrdquo Us March 17 2005 $6600
Toys R Us and Babies R Us are premiere franchises with strong global brand recognition and a collection of high quality product offerings
including toys childrens apparel and baby products and accessories We are excited by the prospect of partnering with the management team and
employees to strengthen the long-term operating and financial performance of the businessesldquo -Matt Levin a MD at Bain
Toys ldquoRrdquo Us Files For BankruptcySept 2018
MichaelsStores
July 1 2006 $6000
We are delighted to partner with the Michaels management team to help build on its already strong position in an attractive industry and
capitalize on the significant growth opportunities that lie ahead Our deep experience in the retail sector reinforces our conviction that Michaels has
the best store locations a broad and attractive assortment of products for crafters of all ages and a sustainable competitive advantage thanks to smart investments in systems and infrastructure We look forward to helping Michaels achieve its full long-term potentialldquo ndash Matt Levin MD
IPO prices at low end of range (June 2014)
Share Price Hits Multi-Year Low in Oct 2018
As SSS Decline
Guitar Center June 27 2007 $2100
ldquoAs the leading retailer of musical instruments in the US Guitar Center enjoys great brand recognition among musicians nationwide a loyal
customer base and a track record of significant growth We look forward to working with the Companyrsquos experienced and capable management
team to continue to build the businessrdquo Jordan Hitch a MD at Bain
The End of Guitar Center
AndGuitar Center Troubles
Only Getting Worse
Gymboree Oct 22 2010 $1800
Gymboree is a terrific company with incredible brand strength and a large population of extremely satisfied customers We look forward to
working with Matthew McCauley and the companys proven and experienced management teamldquo Jordan Hitch MD at Bain Capital
Gymboree Hires Restructuring Counsel
1) Source ldquoBain Capital Sees High Profile Buyouts Go Bustrdquo NY Post March 2018
A Low-End Retailer With Unsustainably High Margins
12
Undifferentiated Goods amp Knock-Off Products
Dollarama sells undifferentiated low-priced consumer goods competing almost entirely on price Many of its products are
knock-offs It is no surprise that the Company has been sued by several companies for trademark infringement
How Dollarama became the retail king of knockoffsSelling cheap imitations of more expensive brands has turned Dollarama into one of Canadarsquos most
successful retailers earning it big bucks and plenty of lawsuits (Source)
ldquoI think they have good lawyers working
for themrdquo says David Lipkus a lawyer
specializing in anti-counterfeit in Toronto
who has helped clients sue businesses in
Canada selling knock-offs ldquoOften
retailers make mistakes and end up
selling fakesrdquo Many lawsuits are settled
privately but the store has been sued
by Nike for selling counterfeit
footwear emblazoned with Nikersquos
iconic basketball player silhouette and
by Umbra a home decoration company
for selling a style of waste basket In
February 2017 Dixon Ticonderoga
launched a suit against the dollar
store chain for a pencil itrsquos been
selling since 2002
Dollarama sells a wide range of discounted knock-offs across product categories
Its business invites litigation
Brazen mimicry multiple knock-offs
of a single producer (Mars)
Source
13
Per-Store Traffic Growth Stagnant But Opportunities For Price Increases May Be Exhausted
Growth in per-store sales has been driven by transaction size growth against declining per-store traffic Transaction
size growth has itself been driven by sales of higher-priced items Dollaramarsquos maximum price point has risen from
$1 prior to FY 2008 to $2 in FY 2008-09 to $3 in FY 2012 to $4 in FY 2017
Contracting store traffic puts per-store sales growth at risk absent further price increases but we question whether
price-driven SSS growth is sustainable as higher prices erode Dollaramarsquos value proposition and put it in closer
competition with more comprehensive big-box retailers Management has expressed reluctance to raise prices further
in the near term regardless (though they said the same when the max price was bumped to $3 several years ago) With
recent price increases now lapping for the first time SSS growth may be at risk
Growth has been propped up by price increases which have made its products more expensive than those at dollar store peers
Between a rock and a hard place Does management continue to erode Dollaramarsquos value proposition with price increases or
keep prices steady and hope for traffic contraction to reverse
Average Quarterly YOY
Growth in Per Store Traffic
-18 since Q1 2014
Transaction
size growth
decelerating
14
Increasing Average Unit Revenues Is A Very Risky Strategy That Has Failed Before
Raising price points to prop up SSS growth against falling store traffic is a major risk for discount retailers as their
entire value proposition comes from their low prices Higher prices may turn off customers and create difficult
comps in the event that price increases must be paused or reversed due to customer pushback
In 2006 for example Big Lots ndash a US discount retailer ndash introduced higher-ticket brand-name items in place of
comparable budget goods in an effort to get customers to spend more per visit This strategy reinvigorated same-
store sales growth for a time but ultimately failed Subsequent difficult comps resulted in negative SSS growth after
management abandoned its so-called ldquoRaise the Ringrdquo strategy
Raise the Ring is
abandoned lower price
points are emphasized
Raise the Ring is
introduced higher priced
items are emphasized
Big Lots alienated shoppers who were
seeking cut-price name-brand goods after
venturing into other areas
like selling frozen food
ldquoOur customer doesnrsquot come to us expecting a
Nordstromrsquos level of in-store shopping
experience They want value treasures
merchandise on the floor and clean restrooms
and we need to meet those expectationsrdquo
[CEO Steve] Fishman said in 2005
hellip
ldquoWersquore an enigmardquo he said at an investor
conference this month ldquoItrsquos been a real
challenge for the marketplacerdquo Source
Calls with industry experts indicate that Dollarama is losing more price-conscious customers to Dollar Tree and other discount retailers
following its efforts to raise prices and that this is a major driver behind recent per-store traffic declines
If price-conscious customers arenrsquot interested in shopping at Dollarama we wonder who ishellip
15
ldquoNothingForADollaramardquo Customers Becoming Conscious Of Price Increases Versus Competitors
Dollaramarsquos price increases may not yet put its prices on par with those of big box retailers like Walmart but
customers have taken notice that Dollarama has increased prices against other Canadian dollar stores Comments
from various internet forums and news sites reveal that customers no longer believe that Dollarama offers as much
value as do other discount retailers suggesting that the strength of Dollaramarsquos value proposition ndash the source of
its appeal and foundation of its business model ndash is at risk The below comments are anecdotal but comments of
this sort regarding Dollarama in particular are nonetheless common among relevant websites
ldquoThe dollar store is no longer a bargain if you
shop around you can by the same things
cheaper or same price elsewhere quit
calling it dollarama no more dollar thingsrdquo
Source
ldquodollar tree here is drastically cheaper then
dollarammardquo ndash Cody Williams
ldquoCody Williams Same here Dollarama is not
really a dollar store anymorerdquo ndash JJ Walker
Source
ldquoI enjoyed the days when everything in Rama
actually was a dollar I go to Dollar Tree
more often now just because everything
there is $125 - ($1 in the US of course)rdquo
Source
ldquoTheir high prices is the problem they still
have better selection than Dollar Tree but
their prices are always higher I know some
dollar store shoppers who go to Dollar
Tree first for the better prices and then go
to Dollarama for the stuff they couldnt
find at Dollar Tree Myself personally have
watched the prices creep up A pair of work
gloves climbed from $250 to 4 or 5 bucks
the discount over Home Depot is only a
buck or two now Also Dollar Tree still
keeps all items under 2 bucks I believerdquo
Source
ldquoThey gonna have to change the Dollarama
name soonrdquo
ldquodollarandaquarterramardquo
ldquoNew Name NothingForaDollarrdquo
ldquoYou forgot lsquoramarsquo NothingForADollaramardquo
ldquoAs for a new name how about
FiveFinaramardquo
ldquofive or lessarmardquo
Source
ldquoDollarRama is no longer in the same
category since they sell at higher prices
more of a discounted store and not a dollar
storerdquo
Source
Just did a quick check of my cleaning cupboard
DT=Dollar Tree DM=Dollarama
- 284L bleach $125 at DT Sometimes they even
have the big 37L bottles Never seen bleach that
cheap at DM
- 976ml Fabric Refresher $125 at DT DM sells it for
$150 and its a smaller bottle
- Oxy First Force spray cleaner $125 at DT $150 at
DM
DT also has a selection of other spray cleaners at
$125 while even other no name ones at DM can go
up to $2
- No name dish soap 1479ml (almost 15L) for $125
at DT 500ml for a $1 (or I guess $125 soon) at DM
- No name Mr Clean sponges At DT its two full
sponges for $125 At DM each sponge is half Mr
Clean cleaner sponge and half normal cheap sponge
- Those square no name tupperware containers that
are 3 for $125 at DM are 4 for $125 at DT
At the dollar-ish level everything Ive found at DT
has been a better value and equal or better
quality
Source
16
Transitioning Away From ldquoDollar Storerdquo Identity Threatens Customer Loyalty
Perhaps in recognition of the fact that Dollarama is losing its status as a true dollar store and that it now belongs to a
different category management has stricken almost all references to ldquodollar storesrdquo from Company filings This poses
a major threat to Dollaramarsquos customer appeal as evidenced by traffic trends and anecdotal customer reactions
FY 2017 Annual Information Form FY 2018 Annual Information Form
17
Margins Are Inexplicably High And Perhaps Unsustainable
We acknowledge that Dollarama is a strong operator with a strong value proposition (though perhaps a declining one) However
we question whether a discount retailer reselling Chinese knock-offs should garner among the highest operating margins of all
global retailers and whether a discount retailer with declining per-store traffic can continue to rely on price hikes for SSS growth
Dollarama stands out among global consumer companies and retailers ndash
45th out of 584 global retailers by operating margin (and 12th out of 584
global retailers by revenue multiple)
Dollarama consistently produces operating margins materially higher than
industry peers and higher than historical industry norms This gap has
only grown more substantial through the last five years
0
5
10
15
20
25
FY 2008 FY 2009 FY 2010 FY 2011 FY 2012 FY 2013 FY 2014 FY 2015 FY 2016 FY 2017 FY 2018
Peer Median Operating Margins vs Dollarama
Peer Median DOL CN
-10
-5
0
5
10
15
20
25
FY 1
989
FY 1
990
FY 1
991
FY 1
992
FY 1
993
FY 1
994
FY 1
995
FY 1
996
FY 1
997
FY 1
998
FY 1
999
FY 2
000
FY 2
001
FY 2
002
FY 2
003
FY 2
004
FY 2
005
FY 2
006
FY 2
007
FY 2
008
FY 2
009
FY 2
010
FY 2
011
FY 2
012
FY 2
013
FY 2
014
FY 2
015
FY 2
016
FY 2
017
FY 2
018
Dollarama Operating Margins vs Peers
DG FDO DLTR FRED BIG DOL CN
Source Bloomberg EQS function Source Dollarama and company filings
18
Debit Card Boost Is Played Out
Dollarama management has characterized the benefit from debit cards as being roughly a doubling in average purchase size
If true this benefit would be visible in year-over-year sales comps
The Company has not always disclosed penetration ndash and they ceased doing so after Q4 2016 ndash but the data suggest that the
average annual comp benefit was approximately 25 from FY 2013-16
Source Dollarama
00
05
10
15
20
25
30
35
40
45
0
10
20
30
40
50
60
Debit Card Penetration and Imputed Comp Benefit
Debit Card Penetration (LHS) Comp Benefit (RHS)
19
Have All The Levers Been Pulled
Dollarama has done a good job of increasing per-store revenue while investing in initiatives designed to remove operating
expenses We cannot fault management for pulling levers to expand margins but we believe the low-hanging
(and high-hanging) fruit has already been harvested
Management has also taken creative measures to raise effective average prices without raising prices directly ndash eg by
strategically replacing some lower-priced goods with close substitutes at higher price points and by reducing the size of
product bundles (pencils candies etc) without cutting prices Such back-door avenues to margin expansion may be exhausted
by this point as noted previously customers are beginning to notice that Dollarama no longer offers a value proposition
comparable to competing dollar stores
FY 13 FY 14 FY 15 FY 16 FY 17 FY 18
Revenue LeversAdd $250-$300
Price PointsDiscounting With Hedged Margins
Add $350-400 Price Points
Accept Credit and Debit Cards
Cost LeversDollar City
RelationshipNew POS Terminals
Kronos Labor Scheduling
Wi-Fi amp ScannersNew Warehouse
ConstructionWarehouse Expansion
Accounting and Financial Levers
Depreciation Schedule Change
Direct Profit from Currency Hedges
Leveraged Share Repurchase
ldquoThanks and good morning In the write up in the
discussion of the foreign exchange headwinds
and gross margin you also said you made select
changes to your product mix I am just wondering if
you could elaborate are there certain categories
thatrsquos your emphasizing in certain categories you are
deemphasizing I am just wondering what that
sentence really meantrdquo
- Peter Sklar BMO Capital Markets
ldquoIts really an item by item discussion Where the
compelling value remains and we are able to take for
example two pencils out of a pack and still be
competitive to help with offsetting some of the
headwinds thatrsquos the way we handle it or in other
cases if we replace the product with a new offering
thatrsquos just as compelling but different at a lower
cost potentially Thatrsquos another way Buyers can use
that tool to help them with the current challengesrdquo
- Michael Ross CFO Dollarama
Is this a sustainable practice as value-oriented customers lose faith in Dollarama
FY 2016 Q4 Earnings Call QampA
20
Costs Rising On Multiple Fronts
While management may have largely exhausted avenues for price increases and efficiency gains other industry and Company
developments threaten to drive up costs through the near term
Cost Driver Explanation
TariffsA significant share of goods (~20 according to industry experts) are sourced either directly or indirectly from the US Tariffs could increase costs on these goods materially
Minimum Wage Hikes
Provincial minimum wages in Canada generally rise much more frequently than do US minimum wages and many are scheduled to rise on an annual basis based on CPI growth Minimum wage hikes have been particularly significant of late (see below) Even provinces whose minimum wages are not tied to CPI growth have seen or are set to see material minimum wage hikes in the near future Notable recent and near-term changes are as follows
bull Alberta From $1360 to $1500 on October 1 2018 (103 increase)bull British Columbia From $1265 to $1385 on June 1 2019 to $1460 on June 1 2020 and to $1520 on June 1 2021 (63 CAGR)bull Ontario From $1160 to $1400 on January 1 2018 (207 increase) and to $1500 on January 1 2019 (additional 71 year-over-year increase)
Will rise according to Ontario CPI growth every October 1 each subsequent year New Ontario Premier Doug Ford is looking to reverse these plansbull Quebec Just increased to $1200 (+66 in May 2018) Significant political push to set provincial minimum wage at 50 of average provincial
minimum wage by 2020bull Manitoba New Brunswick Newfoundland Nova Scotia Ontario Saskatchewan and Yukon Annual minimum wage hikes according to national or
local CPI growth
Employee remuneration for FY 2018 was just over 10 of Dollarama revenue This cost item could realistically grow at a high single-digit rate over the next 2-3 years even if headcount is reduced
Transportation and Logistics
Industry experts have expressed concerns regarding near-term transportation cost increases These would hit Dollarama particularly hard as Dollarama is unique among industry peers It has only one distribution center Rather than invest in a second Dollarama recently purchased its existing distribution center in Montreal ndash which it previously leased from the Rossy family ndash for $394M (in addition to $232M spent on adjacent land) Other large Canadian value retailers generally have two distribution centers ndash one in the eastern half of the country and one in the western half
Rising fuel costs could result in materially higher transportation expenses as Dollarama distributes 92 of its merchandise through its single distribution center Industry experts suggest that shipping goods to Vancouver from Montreal via truck can be almost twice as expensive as shipping to Vancouver from China
We find it interesting that Dollarama chose to purchase property from managementrsquos family rather than follow industry norms and open a second distribution center in western Canada and that five of its six warehouses ndash all located in greater Montreal ndash are also leased from the Rossy family (the sixth warehouse is company-owned built on land purchased from the Rossy family)
MarketingDollarama has historically operated with no marketing expense However US peers spend 1-2 of revenue on average on marketing (see subsequent slides) As competition increases across the Canadian discount retail industry management may be forced to expand marketing efforts
21
Minimum Wage Growth Historically High And Accelerating Rapidly
Canada has seen fairly consistent minimum wage hikes since 2000 and minimum wage growth has outpaced inflation in all but
three years since the beginning of the millennium Dollarama has been able to manage minimum wage hikes and maintain
impressive margins since going public in 2009 Note however that minimum wage growth from 2009-17 was comparatively mild
relative to the prior half-decade Accelerating minimum wage growth through the near term will test managementrsquos ability to
insulate margins from rising labor costs
0
2
4
6
8
10
12
14
2001 2002 2003 2004 2005 2006 2007 2008 2009 2010 2011 2012 2013 2014 2015 2016 2017 2018YTD
Minimum Wage Growth Consistently Ahead of Inflation and Accelerating Rapidly
Weighted Average Minimum Wage Growth Canadian CPI Growth
Minimum wage growth across all Canadian provinces weighted by
province population
Management states that the vast majority of employees make more than minimum wage Nonetheless minimum wage hikes of 10-20 in
Canadarsquos most populous provinces could put material upward pressure on labor costs ndash particularly if these hikes spread to Quebec where
Dollaramarsquos distribution center and all of its warehouses are located Management includes a risk factor to this effect in its MDampA
210
215
220
225
230
235
240
245
250
255
260
FY 2018 EBITDA Margin FY 2018 EBITDA Margin with5 Labor Cost Hike
FY 2018 EBITDA Margin with10 Labor Cost Hike
EBITDA Margin Sensitivity to Labor Cost Hikes
12 weighted average minimum wage growth across Canada driven by
207 hikes in Ontario Average minimum wages could very realistically
continue to grow at high single-digit rates through the next ~2 years if
planned hikes are enacted
With labor costs representing about 10 of Dollarama revenue
profitability is materially sensitive to changes in this item
If labor costs were 10 higher in FY 2018 EBITDA margins would have
been slashed by 80 bps
Labor cost expansion of this magnitude would be significant but is not
necessarily out of the question within 2-3 years
Source Government of Canada
22
Lack Of Transparency Regarding Dollar City Is A Serious Concern
CEO Larry Rossy
and
CFO Michael Ross
mischaracterized
the sale by
attributing it to
vehicles which
has its own
categoryhellip
Why are Dollarama shopping carts being repurposed for Dollar City use
Perhaps they were sold above-market to Dollar City in FY 2013 when the relationship began Could this be the
reason for an unexplained $149M disposal of leasehold improvements that year
Source
1) Dollar City website and press
release announcing the relationship
Q ndash Keith Howlett ldquoOn Note 5 [of the FY
2013 Annual Report] I was trying to figure
out the leasehold improvements there
seemed to be some items called lsquodisposals
at costrsquo and therersquos sort of an offset thererdquo
A ndash Larry Rossy CEO ldquoI donrsquot know what
they are Yoursquore going to have to help me
out guys hererdquo
A ndash Michael Ross CFO ldquoDisposal of costs
that would be fixtures or related tohelliprdquo
A ndash Rossy ldquoI would say carsrdquo
A ndash Ross ldquoCars Yeah okay We sold a
few carsrdquo
Q ndash Howlett ldquoOh I see okay Well it
shows up as CAD 15M for a year thatrsquos a
lot of carsrdquo
A ndash Rossy ldquoOh itrsquos a very expensive
carrdquo
Source FY 2013 Q4 Earnings Call Source Dollarama
2013 Annual Report
In 2013 Dollarama entered into an agreement to export and sell products to Dollar City a Latin American dollar store with a
presence in El Salvador Guatemala and Colombia In exchange for selling goods to Dollar City ldquoat costrdquo plus a small markup
and providing business and operational expertise Dollarama was given an option to acquire the chain exercisable in February
2019 (since extended to February 2020)
Details about Dollar City are scarce Who is the management Where is company headquarters Who are the shareholders
Dollar Cityrsquos website provides limited information and not a single Dollar City manager was quoted at the initiation of the
relationship1 Though management claims to sell to Dollar City ldquoat costrdquo with a markup we have no way of determining how they
are calculating ldquocostrdquo It is more likely that Dollarama loads shared costs into the Dollar City bill that flatter Dollaramarsquos margins
and sells merchandise that isnrsquot selling well in Dollarama stores to Dollar City
More Competition Coming To An Already-Crowded Space
24
Evidence Of Dollarama Store Growth Slowing
The pace with which Dollarama opened stores through the past several years does not appear to be sustainable
Importantly the inevitable reversal in its pacing appears to be occurring this year
The Company opened just eight stores in Q2rsquo19 its lowest store opening count in any quarter of any recent year
Its YTD FY 2019 pace of 18 new stores is also trailing the average pace of recent fiscal years (28 openings) by
~35 Management did not provide a fully satisfactory explanation for this deficit
The slowdown in its pace of store openings could suggest that the Company is having a difficult time identifying
economically-viable locations as it seeks to grow its store count by close to 50 ndash still a very distant target
Fiscal YearStated New
Store Opening Goal
Q1 Q2 First Half Q3 Q4 Total
2019 60-70 10 8 18
2018 60-70 13 17 30 10 25 65
2017 60-70 8 13 21 18 26 65
2016 None 17 17 34 16 25 75
Source Dollarama financial filings
ldquoI want to ask about the pace of store
openings As you noted the slower start to
the year you did maintain the guidance for
this year But wondering about sort of further
beyond that obviously the store potential that
you put out there gives you room to remain at
that pace for a while But does the slower
same store sales assumption change your
thinking about how aggressively you want
to push new stores out thererdquo
- Mark Petrie CIBC
ldquoNo it does not It does not And that I would
also add that if the pace at which weve been
opening stores this year is slower than last year
as mentioned often that just relates to the
specific timing of real estate And if stores are
pushed closer to the end of the year it could be
that there is an overlap between a few more
stores at the end of this year or a few more
stores in the beginning of next year and the
end it will keep our pace of 60 to 70rdquo
- Michael Ross CFO Dollarama
ldquoReal estate timing issuesrdquo
do a poor job of explaining a
drop in H1 new store
openings of over a third
Source Dollarama Q2 FY 2019 Earnings Call
25
Dollarama Potentially Pushing The Limits Of The Canadian Market
Managementrsquos stated goal is to have 1700 stores across Canada by 2027 up from 1178 stores today We do not
believe that it can achieve this without risking significant cannibalization DOLrsquos target would imply a saturation level
higher than the largest US dollar stores (Dollar Tree and Dollar General) which also sell many more consumables and
grocery items Additionally Canada broadly has much lower levels of retail space per capita than the US suggesting
that Canadian concentration is even more pronounced all else equal
US Retail Square Footage Greater Than Canadian
Retail Square Footage
DOLrsquos Target Implies
Greater Than US
Saturation Despite
Narrower Concept
Source Wellington Management
Walmart is not opening stores in Canada suggesting that it believes
the Canadian market is saturated at 114 stores per million people ndash
about 69 of its US concentration (164 stores per million people)
Meanwhile Dollarama continues to expand within Canada despite
even higher Canadian concentration (327 per mil) relative to the US
concentration of large US dollar stores (452 per mil for a 72
ratio) This ratio would be over 100 at DOLrsquos 1700 store target
Higher Canada store
count vis-agrave-vis
comparable US
store count
compared to Walmart
Higher Canada store
concentration vis-agrave-
vis comparable US
store concentration
than Walmart
Retailers with similar store concentrations per capita across both the US and
Canada are effectively more concentrated in Canada vis-agrave-vis the total retail space
in either country
Store Count by Region
Canada US CanUS Ratio
WMT 410 5358 77
DOL ndash Present 1178 14750 80
DOL ndash Future 1700 14750 115
Store Count per Million People by Region
Canada US CanUS Ratio
WMT 114 164 69
DOL ndash Present 327 452 72
DOL ndash Future 472 452 104
DOL CN DG DLTR
Stores 1700 14760 14732
Population (M) 36 326 326
StoresCapita (M) 472 453 452
26
Dollarama Has Benefited From A Benign Competitive Environment
Large competitors have been shuttering Canadian stores continuously through the last four years due to company-
specific issues highlighted by the high-profile exits of Target and Big Lots from Canada12 We believe that this has been
a significant tailwind for Dollarama but one that is largely behind the Company at this juncture
Dollarama has been able to maintain significant share high margins and high returns on capital in large part due to
missteps among peers and the resulting lax competition This is likely unsustainable in a more competitive environment
as Dollarama has few material competitive advantages barriers to entry are low and its discount retailing strategy is not
unique Competent competition from growing industry players ndash Dollar Tree Canada Miniso and Amazon among others
ndash could be the straw that breaks the camelrsquos back for Dollaramarsquos profitability or growth (or both)
Fiscal YearCompany Exiting
CanadaStores Closed Revenue
DOL Revenue Capture
(Estimated)
Estimated Revenue Benefit
Revenue Boost
2018 Sears 200 $2000 3 $60 2
2017 Sears 100 $1000 3 $30 1
2016 Target 133 $2000 6 $120 4
2015 Big Lots 78 $155 10 $16 1
Last Four Year Average $56 2
Note All numbers are SPCM estimates
1) ldquoTarget Canada to close all stores by April 12rdquo
2) ldquoBig Lots Getting Back Out of Canadardquo
27
Light Competition Has Allowed The Company To Spend Nothing On Promotion ndash Until Now
Dollarama has no promotional expense Meanwhile promotional expenses average 1-2 of revenue among US
peers As established competitors continue to expand and as new competitors enter the market (Amazon included)
Dollaramarsquos no-cost marketing strategy may prove untenable
Promotional Expense
as a of Revenue
Intensifying Competition Threatens Dollaramarsquos
Passive Marketing Strategy
2016 2017 2018
BIG 180 180 170
FIVE 264 270 243
DLTR 021 029 048
DG 062 054 044
Average 132 133 126Source Huffington Post
Source Investorscom
The Canadian operation is also a relatively small part of the business However early results are
encouraging and despite competition in the Canadian market Dollar Tree has found success Longer
term the company is aiming for 1000 stores north of the border which does not seem unrealistic
Source Retail Environments
Calls with people at Dollar Tree suggest that the Company is working to
imitate elements of Dollaramarsquos strategy and store layout in its own
Canadian stores (eg raised shelves etc) and that it plans to expand
into Canada aggressively once its strategy is refined ndash likely in 2019
Source Company financial filings
28
Caught Between The Competition How Will Dollarama Fit In
Dollar Tree has maintained its reputation as a true dollar store nothing is priced higher than C$125 ($1 in the US)
Miniso has developed a reputation as a ldquonicerrdquo discount retailer items can cost up to C$25 but the environment is cleaner and
more modern and products are of better quality (but you can still get a dollar-level deal ndash most products are priced under C$10)
Dollarama has all the character of an old tired dollar store but without the dollar prices
Who will shop there unless management invests in store updates rather than opening new stores
Value-driven customers are by definition not loyal customers
Miniso
Clean and modern but cheap
Dollar Tree
No need for price tags everythingrsquos $1 Dollarama
Looks like Dollar Tree priced like Miniso
Irsquoll pass
29
Dollarama Makes No Effort To Appeal Millennials ndashThe Next (And Current) Shopping Generation
Dollarama has zero social media presence unlike all of its peers Not only is the Company out of touch with customers in
an industry which demands a high level of customer engagement but its brand is becoming demonstrably stale
Facebook Twitter Instagram YouTube LinkedIn Pinterest Google+
Dollar Tree Yes Yes Yes Yes Yes Yes No
Dollar General Yes Yes Yes Yes Yes Yes Yes
Family Dollar Yes Yes Yes Yes Yes Yes No
Big Lots Yes Yes Yes Yes Yes No Yes
Miniso (Canada N America)
Yes Yes Yes Yes Yes No No
Great Canadian Dollar Store
Yes Yes No No No No No
Dollarama No No No No No No No
Until now Dollarama has largely been a regional brand with satisfactory name recognition in its provincial home of Quebec
Now that the Company is making a bigger push into Anglophone Canada management should be more proactive in adapting its
strategy to new markets and to a new customer base Yet management continues to employ a strategy more befitting a sleepy
regional business it does not market or work to improve its brand it does not stay current with trends it keeps management
within the family and it is not expanding its logistics chain to support coast-to-coast growth (see subsequent slides)
Management wants Dollarama to be a national brand but it does not appear prepared to run a national business
Questionable Accounting And Financial Practices
31
Hedging Instruments A Material Source Of Profits In Recent Years
Dollaramarsquos sales are in Canadian dollars whereas a majority of its product purchases are US dollar-linked Management claims to enter
into CADUSD hedging arrangements to lock in near-term margins without having to adjust prices in response to FX movements However
management has nonetheless admittedly adjusted prices alongside unhedged peers in response to shifts in the CADUSD exchange rate
rendering its currency hedges a source of profit
Forex dynamics through the last two years have erased the large hedge benefit realized by Dollarama in FY 2016 but management reports
that gross margins have effectively remained flat through this period implying significant gross margin improvement in the underlying
business (see graphs below) As the currency hedge benefit has reversed through the last two years underlying gross margins have
purportedly risen by EXACTLY ENOUGH to keep total gross margins steady between 39-40 We find this oddly convenient ndash or at the very
least we question whether management will be able to maintain steady margins in the face of unfavorable FX rate dynamics in the future
Quick turnaround in
underlying
profitability Just in
time to keep the
declining forex hedge
benefit from dragging
down marginshellip
Even as FX hedge gains fell
from close to 8 of gross profit
in FY 2016 to a drag on gross
profit in FY 2018 gross margin
expanded by over 100 bps over
the same period implying gross
margin expansion ex-forex of
almost 300 bps within two years
for a retailer with gross margins
which were already unusually
high and whose margins had
contracted for four straight
years before the rapid reversal
32
Questionable Depreciation Assumptions
Dollarama changed its depreciation schedule for leasehold improvements (store fixtures) in FY 2015 moving from a 10-year to a 15-
year expected life1 However management did not concurrently lengthen the amortization schedule for tenant inducements
We find this mismatch curious as both quantities should be amortized depreciated over the expected life of a given lease
Adding to the confusion and appearance of foul play DOL discloses in its AIF that its average lease term is just 5 yrs and it just
started disclosing related-party dealing with Director Huw Thomas of SmartCentres ndash a REIT that lists DOL as a top 10 customer23
Lease term implied
by leasehold
depreciation expense
2-3x greater than that
implied by
amortization of
tenant allowance
Mismatch in implied
lease term
inappropriately
inflates EBIT
C$ MillionsFY
2013FY
2014FY
2015FY
2016FY
2017FY
2018
Amortization of Tenant Allowance $29 $35 $43 $49 $48 $51
Starting Balance Sheet Amount 168 207 232 280 344 386
Amortization as a of Asset Amount 173 169 185 175 140 132
Implied Lease Term 58 59 54 57 72 76
Leasehold Depreciation Expense $129 $166 $108 $141 $172 $202
Starting Balance Sheet Amount 1182 1348 1762 2113 2499 2867
Depreciation as a of Asset Amount 109 123 61 67 69 70
Implied Lease Term 92 81 163 150 145 142
Tenant Allowance Amortization Using Leasehold Depreciation Schedule
183 255 142 189 237 272
Reduction In EBIT If Both Were Put On Same Schedule (11) (10) (29) (30) (24) (24)
While the financial impact of this adjustment is limited signs of accounting impropriety do not reflect well on management and cast
doubt on the rest of Dollaramarsquos reports and accounting practices
1) FY 2015 Annual Report p 15 DOL also extended its store and warehouse equipment useful lives from 8-10yrs to 10-15yrs The total reduction of these three items was decrease of $10m in
FY15 depreciation expense
2) DOL states in its AIF p 11 ldquoThe Corporation typically enters into leases with base terms of ten years and options to renew for one or more periods of five years each The average time to
expiration of the Corporationrsquos leases is approximately five yearsrdquo
3) See governance slide on Huw Thomas
33
Capital Spending And Distribution Of Cash To Shareholders Are Overextending The Business
What happened
Management claimed in 2011 that the business was sufficiently cash-generative to support growth and dividendsshare buybacks
and that it would be able to pay down debt while pursuing both However debt has ballooned since then with net debt rising 8x
(and close to 3x versus EBITDA growth) Management is effectively levering up the balance sheet to support dividends and share
buybacks with CFO Michael Ross stating that he will continue to repurchase shares as long as the earnings yield remains above
the after-tax cost of debt
ldquoFor the past few years our cash flow has enabled
us to continue to pursue our growth plans and
continue to pay down debt Our free cash flow is
now sufficient to fund both those priorities
while enhancing new to shareholders through
a quarterly dividend payment We are able to
generate the free cash flow to do all of this
because we employ a simple growth oriented
business model at Dollaramardquo
ndash June 2011 Conference Call
Should Dollaramarsquos struggles become more pronounced ndash or should the
economic cycle turn for the worse ndash this debt overhang could loom large over
the business
Dollarama also consistently spends more on capex (as a percentage of sales) than its peers in the discount retail industry and
shows abnormally high capex versus depreciation and amortization We understand that Dollarama is a growing business which
could explain both patterns in part but it is not the only discount retailer which is investing in store growth
Dollarama DampA consistently
lt50 of capex and a lower
percentage of capex than
industry peers
Dollarama consistently
spends more on capex
(as a percentage of sales) than industry peers
00
05
10
15
20
25
0
200
400
600
800
1000
1200
1400
1600
1800
FY2012
FY2013
FY2014
FY2015
FY2016
FY2017
FY2018
Ne
t D
eb
tEB
ITD
A
Ne
t D
eb
t ($
C M
M)
Net DebtEBITDA Net Debt
0
50
100
150
200
250
300
FY2010 FY2011 FY2012 FY2013 FY2014 FY2015 FY2016 FY2017 FY2018
DampA as a of Capex and Intangibles Annual
DOL DLTR DG BIG FRED
0
1
2
3
4
5
6
7
8
FY2010 FY2011 FY2012 FY2013 FY2014 FY2015 FY2016 FY2017 FY2018
Capex and Intangibles as a of Sales Annual
DOL DLTR DG BIG FRED
34
Where Is The Capex Going
Management has explicitly identified and discussed various capital expenditures in Company filings over the last
five years but this still leaves a large gap versus what was actually spent
Additionally there is a large gap between the amount spent on software development and the amortization expense
associated with this activity suggesting that earnings may be inflated
Some of this is
directed towards
leasehold
improvements etc
but with
managementrsquos
focus on expansion
over existing store
improvements we
question where
management is
directing this capex
Capital Spending Software
on Software Amortization Difference
FY 2018 191 126 65
FY 2017 126 96 3
FY 2016 111 78 33
FY 2015 108 56 52
FY 2014 98 34 64
Are earnings
inflated due to
insufficient
amortization
Note also that a LinkedIn search for software developers at Dollarama turned up effectively nothing ndash at best one person with a tangentially
relevant title (source) So where is the software development capex going
Unlike discount retailer peers Dollarama
did not include software-related
spending in capex until recently and
records it separately in
ldquoAdditions to intangible assetsrdquo1
Do they do this to artificially deflate their
headline capex figure thereby inflating
reported free cash flow
Undiscussed Capital Spending (FY 2014 ndash 2018)
C$ Millions
$500K in capex spent per new store (375 new stores over past five years Source AIF) $1875
Capex spent on construction of 500K sqft warehouse in Montreal 679
$82M spent annually on expansion renovation or relocation of stores over five years 410
$232M spent on land acquisition 232
Discussed Capex Over Past Five Years $3196
Total Reported Capex (ex intangibles) $5200
Undiscussed Capex $2004
Software Capex and Software Amortization Discrepancy
C$ MillionsCapital Spending on
SoftwareSoftware Amortization Ratio
FY 2018 $191 $126 152
FY 2017 126 96 131
FY 2016 111 78 116
FY 2015 108 56 193
FY 2014 98 34 288
1) DOL explicitly started calling out software as a component of capex in Q3rsquo16 with the addition of footnote to guidance
35
Lack Of Transparency Regarding Store Closures And Associated Costs
It is standard industry practice to report store closures remodels and relocations alongside new store openings
However Dollarama reports only ldquoNet New Storesrdquo and does not break this number out in detail Questioned on this
in Q4 2016 management answered that a larger store base would inevitably result in more closures for reasons
outside of its control (fires mall renovations etc) and that reporting closures would therefore not communicate
meaningful information regarding the underlying performance of the business
We strongly disagree store closure information is vital to evaluating the health of a retail chain Management can
provide color on particular closures if it feels that they have been done for reasons other than performance but
failing to report closures entirely hides a key operating statistic from investors
Company Store Movement 2012 2013 2014 2015 2016 2017 2018
DLTR
Beginning 4101 4351 4671 4992 5367 13851 14334OpenedAcquired 278 345 343 391 8850 584 603
Closed 28 25 22 16 366 101 102Closed as of Beginning 07 06 05 03 68 07 07
BIG
Beginning 1398 1533 1495 1493 1460 1449 1432Opened 181 87 55 24 9 9 24Closed 46 46 58 57 20 26 40
Closed as of Beginning 33 30 39 38 14 18 28
DG
Beginning 9372 9937 10506 11132 11789 12483 13320Opened 625 625 650 700 730 900 1315Closed 60 56 24 43 36 63 101
Closed as of Beginning 06 06 02 04 03 05 08
FDO
Beginning 7023 7442 7916 -- -- -- --Opened 475 500 526 -- -- -- --Closed 56 26 400 -- -- -- --
Closed as of Beginning 08 03 51 -- -- -- --Overall Industry Average 09 07 20 07 23 07 08
Other high-growth dollar
stores like Dollar Tree and
Dollar General report store
closures ndash why doesnrsquot
Dollarama
Store closures for whatever
the reasons incur real
restructuring and other
costs Peer retailers
generally give detail on these
expenses whereas
Dollarama does not
We believe that Dollarama
should follow industry norms
and increase transparency
regarding store closures
US Dollar Store peers historically close 08 of stores annually yet Dollarama has not reported any recent closures
36
SSS Metrics Obfuscate Store Performance
Dollaramarsquos official ldquoComparable Store Salesrdquo figure includes ldquorelocated and expandedrdquo stores as ldquocomparable storesrdquo
therefore picking up growth in traffic which can be attributed to relocation-related improvements We believe that this likely
overstates Comparable Store Sales growth while also ignoring associated relocation-related expenses
1) See Q1 FY 2014 earnings call transcript
Management not only hides store closure data as a supposedly uninformative statistic but proclaims that it has NEVER closed a
store due to poor performance1 We find it difficult to believe that a retailer which has existed in its current format since 1992 has
never needed to close a store for poor performance If it has indeed never closed an underperforming store we wonder whether
management has been too ambitious in growing its store base without critically evaluating the profitability of each location
Huntsville Place Mall Jul 2015
7 John St Oct 2012
7 John St Jul 2015
Huntsville Place Mall Oct 2012
Huntsville ON
Relocation
Are these really entirely
ldquocomparablerdquo locations
781 Rue Principale Est May 2016
781 Rue Principale Est Jun 2009Le Carrefour Ste Agathe
May 2016
Ste-Agathe-Des-Monts QC
Relocation
Why assume the costs to
make this lt1 mile move
Notice
Dollarama
sign turned
inside-out
indicating
closure
37
Cash Flow Beginning To Turn Over Despite Efforts To Bolster Results
In H1 FY 2019 Dollaramarsquos cash flow contracted on a year-over-year basis for the first time since it went public ndash this
despite managementrsquos efforts to bolster earnings and EBITDA The contraction appears to be due in large part to
changes in working capital In particular we are concerned that growth in inventories suggests that management
overestimated near-to-medium term sales growth and that declining traffic is starting to weigh on the Company
Dollarama H1 Operating Cash Flow
C$ Millions FY 2014 FY 2015 FY 2016 FY 2017 FY 2018 FY 2019
Net Income $1054 $1221 $1603 $1895 $2265 $2433
CFO Before Working Capital 1394 1488 2124 2156 2769 2999
Changes in Working Capital (287) (236) (870) (110) (126) (886)
Net CFO 1107 1252 1253 2045 2644 2113
YoY Change $326 $322 $01 $792 $599 (531)
Source Dollarama
Governance Concerns
39
Related-Party Transactions With Rossy Family Raise Questions Over Governance And Costs
Fiscal YearRent amp Land Purchases
Paid to Rossys(C$ MM)
As a of Compensation Paid to Rossy Family
FY 2019 (To Date) $394 NA
FY 2018 184 1660
FY 2017 402 4459
FY 2016 179 1305
FY 2015 169 2752
FY 2014 163 1903
As noted Dollarama leases all but one of its five warehouses from the Rossy family and recently purchased land from the Rossys
for the construction of a sixth Management also recently purchased its Montreal distribution center from the Rossy family which
leased the facility to Dollarama until this February We understand that the Rossy family has close historical ties to the business
but this level of close dealing draws our attention particularly given the fact that management has focused on fortifying its
existing distribution footprint ndash closely tied to the Rossy family ndash rather than invest in distribution facilities in western Canada
where major competitors already have distribution centers
DLTR
Distribution
Center
Delta BC
DLTR
Distribution
Center
Mississauga ON
DOL
Distribution
Center
DOL
Warehouses
No Dollarama distribution facilities
located outside of a ~4 mile radius in
Montreal
bull Due to preferential relationship with
Rossy family
bull Will Dollarama be able to expand into
AngloWestern Canada efficiently
without logistics costs ballooning
bull Overly-exposed to fuel price hikes
and rising transportation costs
Related-Party Transactions Significant And Growing
Source Dollarama Financials
Dollar Tree Canada Distribution Centers
Dollarama Distribution Centers And Warehouses
Source DollarTree
Montreal QC
40
Related-Party Transactions With ldquoIndependentrdquo Director Huw Thomas Only Recently Disclosedhellip
Dollarama also leases stores from SmartCentres REIT whose recently-departed CEO Huw Thomas joined Dollaramarsquos
Board of Directors in 2011 and was a member of its audit committee through March 2017
His ldquoindependencerdquo was recently defended by a meandering 260-word footnote in Dollaramarsquos proxy which belies the
fact that Dollarama is a top 10 customer of SmartCentres
This is all the more suspicious in light of Dollaramarsquos questionable lease accounting highlighted earlier
Source Dollarama 2018 Proxy Circular
Note Dollarama did not start disclosing Huwrsquos related-party dealing until the 2017 proxy
circular in June 2017 right after he left the Audit Committee in March 2017
SmartCentres 2017 Annual Report
Dollarama Material To SmartCentres ndash A Top 10 Customer
SmartCentres Promotes Dollarama Relationship From 2011
Calloway (now SmartCentres) 2012 Annual Report
Dollaramarsquos Lengthy Meandering Defense Of Thomas
Huw As Independent Only Recently Disclosed (2017)
Dollarama Recently Changed Rent Expense Disclosure
Source Dollarama Q4rsquo17 Financials Note 15 Related Party Disclosure
Source Dollarama Q2rsquo18 Financials Note 13 Related Party Disclosure
41
House of Windsor House of RossyA Case Study In Nepotism
Neil Rossy had been the Senior VP of Merchandising Chief Merchandising Officer for 25 years prior to being named CEO in
2016 While his family is still a large shareholder they are not a controlling shareholder owning around 5 of the shares
outstanding We question whether the Rossyrsquos century-long family tradition of passing down leadership ndash one which also
persists at the Rossyrsquos ldquosister storerdquo ndash is appropriate for a public company or wise for the long-term health of the business
Salim Rossy
Opened first ldquoS Rossyrdquo
store in 1910 (up-market
department store concept)
George Rossy
President of S Rossy
1937-1973
Larry Rossy
Grew S Rossy from 20 to 44 stores before
converting all S Rossy stores to new
ldquoDollaramardquo concept in 1992 Sold majority
stake to Bain Capital in 2004 IPO in 2009
Neil Rossy
CEO of Dollarama as of 2016
Michael Rossy
Brother of George (one of ten siblings)
Founder amp CEO of ldquoRossyrdquo stores 1949-2010
Michael DiTullio
Son-in-Law of Michael
President amp CEO of Rossy since 2010
Does (or will) the family have a hard time parting with a business that has been in the family for four generations even if parting ways is
the right thing to do
Managing retail chains is very
much a family affair for the
Rossys ndash at both stores
Perhaps Neil was going to be
anointed CEO of Dollarama
regardless of the caliber of other
potential candidates
Letrsquos hope hersquos not Commodus
BONUS
Brother branches out
with separate storehellip
42
Insiders Incentivized To Grow EBITDA
Our earlier concerns about EBITDA quality are amplified by the fact that Dollarama executives are compensated
based on seemingly arbitrary and inflated EBITDA targets This gives management a strong incentive to be inefficient
users of capital as any dollar shifted from operating expense to capex has a direct benefit to key executives
For example note that managementrsquos perhaps questionable decision to purchase one of its Montreal warehouses
will shift what was until recently rent expense into depreciation This change in the accounting treatment of
Dollaramarsquos tenancy costs will provide a windfall to EBITDA potentially boosting management bonuses
Source Dollarama Proxy Circular p 30
43
What Is A Stretch EBITDA Goal
Bonuses are paid upon achievement of 11 EBITDA growth This level was ldquodesigned to be a stretch objectivehellip
attainable only with significant effortrdquo However this target was reset lower after FY 2014 ndash the only year during which
management did not handily exceed the target We believe this further calls into question the independence of the
board and its compensation committee
Year EBITDA Growth Objective EBITDA Growth Achieved
FY 2018 11 18
FY 2017 11 18
FY 2016 11 30
FY 2015 11 15
FY 2014 13 12
FY 2013 13 22
FY 2012 13 26
FY 2014 Management
misses growth objective
FY 2015 Growth objective
adjusted downwards
ldquoThe thresholds were revised by the
Human Resources and Compensation
Committee in the context of its annual
executive compensation review
conducted at the beginning of each fiscal
year to take into account among other
elements the fact that the base for the
calculation is growing every yearrdquo
Source FY15 Management Proxy Circular
What ldquoother elementsrdquo were
taken into account
Source Dollarama
44
Insiders Selling While Company Buys Back Stock At Elevated Prices
Management has been buying back shares at elevated prices through the last several years even while pursuing growth leaving little capital for
(sorely needed) store updates or other uses The average repurchase price since Q1 FY17 is about on par with current share prices and ~40
below our target Since Q2 FY18 the average buyback price has been 25 above current levels
Furthermore just as the Company has been buying back stock at elevated prices insiders have been offloading shares Notably it is evident
from past and current proxy statements that CFO Michael Ross has never held onto shares for which he has been granted options his
common equity ownership is listed at zero every year Note that as the CFO it is he who is dictating the share buyback decision in large part
PeriodShares
Repurchased
Value of Repurchase
(C$ M)
Average Price (Split-
Adj) (C$)
Q1 FY 2017 1542066 1393 3011
Q2 FY 2017 2027080 1842 3029
Q3 FY 2017 1571500 1578 3347
Q4 FY 2017 2279522 2241 3277
Q1 FY 2018 1687240 1806 3568
Q2 FY 2018 1303900 1602 4095
Q3 FY 2018 687700 931 4513
Q4 FY 2018 2425700 3788 5205
Q1 FY 2019 94500 145 5115
Q2 FY 20191 1347341 700 5195
Total 14966549 16026 3797
Discount to Current Share Price 1
Total (Since Q2 FY 2018)
5859141 7170 4815
Discount to Current Share Price -20
Using Company Funds To Overpay For DOL Shareshellip While Insiders Sell Into The Companyrsquos Bidhellip
Source DOL filings and Bloomberg
Insider Title Date Sold SharesProceeds (C$ M)
Price Sold (Split-Adj)(C$)
Nicolas Hien Senior Vice President 482016 6203 06 3224
Michael Ross CFO 482016 80000 74 3083
Paul Roche Vice President 4182016 10000 09 3000
Geoffrey Robillard Senior Vice President 6172016 33500 31 3085
John Assaly Vice President 9272016 30000 30 3333
Geoffrey Robillard Senior Vice President 472017 20000 23 3833
Paul Roche Vice President 472017 23100 26 3752
Josee Kouri Corporate Secretary 4142017 8000 09 3750
Geoffrey Robillard Senior Vice President 9142017 5000 07 4667
Geoffrey Robillard Senior Vice President 12112017 10000 16 5333
John Assaly Vice President 12132017 14096 22 5202
Geoffrey Robillard Senior Vice President 1262018 15000 24 5333
John Thomas Independent Director 1262018 6000 10 5556
Geoffrey Robillard Senior Vice President 6152018 50000 75 5000
John Assaly Vice President 6192018 13404 21 5222
Nicolas Hein Senior Vice President 6222018 36750 19 5170
Paul Roche Vice President 6222018 24000 13 5417
We do not like the fact that insiders have been selling into share buybacks while
the Company levers itself up with short-term debt to support those repurchases
It appears that the execs are levering up the business in part to enrich themselves1) All share information prior to Q2 lsquo19 reflects pre-split data except
Split-Adjusted Average Prices Q2 lsquo19 repurchases were as stated
45
Rossy Family Selling Shares Despite Control Over C-Suite
Notably Founder and former CEO Larry Rossy has trimmed his position tremendously through the last several years
Though this is to be expected to some extent as he recently ceded control of the business we believe that his
ownership stake should be held to a higher standard given his insistence on keeping the business in the family
If he plans to keep the c-suite under a Rossy dynasty the familyrsquos personal stake in the business should reflect that
Source Bloomberg
Valuation And Price Target
47
The Market Has Not Taken Threats To Dollarama Seriously ndash But Optimism Is Ebbing
Analysts are generally bullish on the stock focusing primarily on managementrsquos growth story and taking current
profitability levels for granted The prospect of new competitive threats to a business which has until now seen limited
competition ndash and the risk that prevailing margins are unsustainable even through the near term ndash go underappreciated
Dollaramarsquos poor Q2 cooled analystsrsquo optimism to some extent but we believe that the reaction was largely reactive and
superficial as they adjusted their price targets in such a way that in aggregate they saw exactly the same upside after the
post-Q2 dip as they did before The market still does not fully appreciate the magnitude of the threats facing Dollarama
All price targets in C$ Before Q2 Release After Q2 Release
Firm Recommendation Target PriceUpside (on 82818) Recommendation Target Price
Upside (on 9172018)
Upside (Present)
RBC Capital Markets Outperform $5500 12 Outperform $5200 22 35
Raymond James Outperform $5567 13 Outperform $5000 17 30
Macquarie Outperform $5633 14 Outperform $4900 15 27
BMO Capital Markets Outperform $6100 24 Market Perform $4700 10 22
CIBC Capital Markets Outperform $5900 20 Neutral $4600 8 20
Desjardins Securities Buy $5800 18 Hold $4500 6 17
Veritas Investment Research Co Buy $5600 14 Buy $4800 13 25
Industrial Alliance Securities Hold $5450 11 Buy $5450 28 42
Canaccord Genuity Buy $5900 20 Buy $5500 29 43
Barclays Equal Weight $5200 5 Equal Weight $4400 3 14
TD Securities Buy $5900 20 Hold $4900 15 27
Accountability Research Corp Buy $5400 10 Buy $5000 17 30
National Bank Financial Outperform $5567 13 Sector Perform $4800 13 25
Scotia Capital Sector Outperform $5567 13 Sector Outperform $5050 19 31
Wells Fargo Securities Market Perform $5300 7 Market Perform $4000 -6 4
AVERAGE $5626 14 $4853 14 26
While analysts are still not sufficiently critical of Dollarama the more recent downward move in the stock and subsequent analyst
downgrades may suggest that the market could be primed to evaluate the Company and its growth story with a more discerning eye
We believe that the issues which we highlight in this report will provoke further professional skepticism among analysts and investors
48
Dollarama Not Priced To Perfection ndashPriced Beyond Perfection
We can get close to DOLrsquos current valuation only if we value it as a mature ex-growth business today under
managementrsquos lofty goals for the business for ten years into the future applying no discounts for time
business risk etc
Managementrsquos ten-year store target
bull Current store count 1178 (70 of long-
term target)
Even if Dollarama were a mature business today under managementrsquos long-term targets for the business
DOL stock would not have no upside to current share prices
The market is pricing DOL beyond perfection ndash a valuation this lofty cannot be justified today
Mature Business ValuationC$ MM unless noted
Stores 1700
Revenue per Store $32
Total Revenue $5440
Operating Margin 220
Operating Profit $1197
Interest Expense $50
Tax (275) $315
Net Income $831
Diluted Shares Outstanding 332
EPS $251
PE Multiple 152x
Target Price $3815
Upside -1
Average operating margin since Q1 FY 2016
bull Assumes that DOLrsquos unusually high
margins are sustainable despite
intensifying competition loss of recent FX
benefit and customer pushback against
price hikes
Mature revenue per store estimate
bull Current average revenue per store
~$28M (875 of long-term target)
Industry median NTM PE multiple
bull Assigns no discount to DOL due to
declining store traffic vs peers incoming
competitive threats inefficient distribution
network etc
49
Dollarama Not Priced To Perfection ndashPriced Beyond Perfection (Continued)
Put another way The market is implicitly taking it for
granted that Dollarama will achieve its lofty ten-year
growth targets assuming sustained profitability levels
and per-store efficiency ndash and applying close to the
industry median FY1 EVEBITDA multiple to Dollaramarsquos
FY 2027 EBITDA
Just under ten-
year target
What kind of growth is the market implicitly betting on if
we value Dollarama on par with peers
bull 150 more stores than managementrsquos ten-year target ndash
within nine years
bull 48 CAGR in revenue per store
bull Zero margin compression
FY 2027 Estimates if Management Executes Growth Plans Perfectly
(C$ MM unless noted)
Stores (Year-End) 1688
Revenue per Store $33
Total Revenue $5503
Gross Margin 380
Gross Profit $2093
SGampA per Store 04
SGampA Total 689
EBITDA (FY 2027) $1404
Market Cap 12752
Debt 1880
Cash 182
Enterprise Value $14450
EVEBITDA (FY 2027) 103x
Industry Median EVEBITDA (FY1) 110x
Average gross
margin ex-
hedge gains
since FY 2016
Mature revenue
per store
estimate (15
growth CAGR)
FY 2018 SGampA
per Store
Implied FY 2027
multiple close to
industry median FY1
multiple
FY 2027 Estimates To Justify Prevailing Valuation (C$ MM unless noted)
Stores (Year-End) 1858
Revenue per Store $44
Total Revenue $7929
Gross Margin 380
Gross Profit $3016
SGampA per Store 04
SGampA Total 755
EBITDA (FY 2027) $2261
EVEBITDA (FY 2027) 62x
Enterprise Value 13947
Debt 1880
Cash 182
Equity Valuation $12249
Diluted Shares Outstanding 332
Target Price $3693
Current Price $3845
158 over ten-
year target in
nine years
48 growth
CAGR in
SalesStore
Industry median
FY1 multiple
discounted
75 annually
Average gross
margin ex-
hedge gains
since FY 2016
FY 2018 SGampA
per Store
High forecast gives
us 4 DOWNSIDE
50
Valuation Far Out Of Line With Peers And Historical Multiples
DOL shares trade at a 50-60 premium to peers in the discount retail industry The market is valuing DOL much more like a high-
growth tech company than a brick-and-mortar dollar store (and one with concerning fundamental trends at that) Note that this still
holds true even after DOL shares traded down significantly following its recent Q2 earnings report
It is difficult to justify a valuation this high even if one is bullish on DOL vis-agrave-vis the rest of the industry
Company Ticker
3-Year Consensus Revenue
CAGR
FY 2018 EBITDA Margin
PE(NTM)
PE(FY2)
EVEBITDA(NTM)
EVEBITDA(FY2)
EVSales(NTM)
Dollar Tree DLTR 43 121 139x 134x 91x 88x 10x
Dollar General DG 75 104 163x 162x 112x 112x 12x
Big Lots BIG 06 85 87x 87x 52x 53x 04x
Five Below FIVE 210 162 360x 412x 2113x 243x 32x
Canadian Tire CTC CN 20 90 179x 181x 82x 83x 10x
Metro MRU CN 80 73 142x 139x 99x 101x 08x
MEDIAN 59 97 152x 151x 95x 110x 10x
Dollarama DOL CN 85 255 229x 223x 164x 163x 41x
DOL PREMIUM 505 477 727 509 3057
Does DOL ndash a value retailer
demonstrating concerning
fundamental trends ndash deserve
to be valued on par with
higher-growth industries and
completely out of line with its
industry peers
Profitability is impressive but
likely unsustainable in the face
of growing competition
Enterprise Value Revenues Enterprise Value Adj EBITDA Price Adj EPSDOL shares also trade at
a significant premium to
historical multiples
despite unsustainable
margins an increasingly
saturated market and
rising competitive
threats
51
Does The Market Think Dollarama Is A Dollar Store Or A Premium Retail Brand
Dollarama is valued much more closely to premium retail brands than its discount retail peer group
A bull might ldquojustifyrdquo this by pointing to Dollaramarsquos profitability profile and growth expectations but its EBITDA margins are so
out of line with those of its peers that one is forced to question whether they are sustainable (at best) or honest (at worst)
As discussed Dollaramarsquos consensus sales growth numbers also ignore looming fundamental threats to the business
Company TickerGross
Margin (NTM)
EBITDA Margin (NTM)
Sales Growth (NTM)
EVEBITDA(NTM)
PE(NTM)
EVSales(NTM)
Dollar Tree DLTR 31 11 28 91x 139x 10x
Dollar General DG 31 10 89 112x 163x 12x
Big Lots BIG 41 7 -08 52x 87x 04x
Five Below FIVE 36 15 203 2113x 360x 32x
Canadian Tire CTC CN 34 12 40 82x 179x 10x
Metro MRU CN 19 7 88 99x 142x 08x
MEDIAN 33 11 64 95x 152x 10x
Dollarama DOL CN 40 25 99 164x 229x 41x
DOL PREMIUM 727 505 3057
How does Dollarama support EBITDA
margins more than double those of its
peer group and in line with premium
global retail brands
Company TickerGross
Margin (NTM)
EBITDA Margin (NTM)
Sales Growth (NTM)
EVEBITDA (NTM)
PE (NTM)EVSales
(NTM)
Ferragamo SFER IM 65 17 48 160x 260x 26x
Hermes RMS FP 69 38 84 200x 350x 78x
Prada 1913 HK 74 22 78 100x 210x 23x
Tiffany amp Co TIF 64 24 51 113x 196x 28x
MEDIAN 67 23 65 137x 235x 27x
Dollarama DOL CN 40 25 99 164x 229x 41x
DOL PREMIUM 197 -26 519
Does a discount retailer facing
fundamental headwinds deserve to be
priced 50 or more above its peer
group and closer to global
premium retail brands
52
Margins And Multiples Materially Out-of-Line With Peers
We do not believe that Dollaramarsquos profitability levels ndash which are entirely out of line with peers ndash are justified or sustainable in an
industry as competitive as deep discount retail The Company is already struggling to meet store count growth targets raising the
likelihood that its store growth plan will be dilutive to margins The market assigns a premium valuation to Dollarama on the basis
of relatively high growth expectations and the Companyrsquos industry-leading margins However as discussed throughout this
report we doubt both managementrsquos ability to meet its growth targets and its ability to maintain prevailing profitability levels The
likelihood that the Company will be able to achieve BOTH of these goals simultaneously is even slimmer Accordingly we believe
that the basis for Dollaramarsquos substantial share price premium is unfounded
Dollaramarsquos margin profile is grossly out of
line with peers and we find evidence of
aggressive accounting and questionable
business practices that can partly explain the
issue We doubt that this would be sustainable
even if management wasnrsquot growing the chain
How will a lowno-moat business with falling
per-store traffic be able to maintain its
remarkable profitability advantage while
aggressively expanding its store base
DLTRDG
BIG
FIVE
CTCCN
MRUCNWNCN
DOLCN
0
5
10
15
20
25
30
10 15 20 25 30 35 40 45 50
EBIT
DA
Mar
gin
Gross Margin
Dollarama Margins Completely Out Of Line With Peers
The premium in Dollaramarsquos share
price is driven by the marketrsquos trust in
managementrsquos growth initiatives and
its recognition of the Companyrsquos
dominant profitability
However neither its profitability
advantage nor its growth prospects
are sustainable The likelihood that
management simultaneously
preserves BOTH is extremely low
Big Lots (BIG) Dollar Tree (DLTR) Dollar General (DG) Metro Inc (MRU CN) and Canadian Tire (CTC CN)
x
5x
10x
15x
20x
25x
BIG DLTR MRU CN DG CTC CN DOL CN
PE (NTM)
x
4x
8x
12x
16x
20x
BIG DLTR MRU CN DG CTC CN DOL CN
EVEBITDA
53
Valuing DOL As A Mature Business In The Canadian Market ~40 Downside
C$ MM unlessotherwise noted
Current Run-Rate Valuation
Priced Beyond Perfection
Reasonable Downside
Stores 1170 1700 1500
RevenuesStore 28 32 30
Revenues 3320 5440 4500
Operating Margin 23 22 18
Operating Profit 764 1197 801
Interest Expense 42 50 50
Tax 275 198 315 207
Net Income 523 831 544
Shares 332 332 332
EPS $158 $251 $164
Multiple 24x 16x ~15x
Share Price $3845 $3966 $2460
Upside (Downside) 3 Approx -40
As discussed earlier at 1700 stores DOL would have greater penetration than both Dollar General (DG) and Dollar Tree (DLTR)
which both offer a much broader assortment of goods including perishablesconsumables Meanwhile the US appears to be
overstored versus Canada It is likely unreasonable for DOL to target per capita penetration levels on par with its US peers
Even if we assume that DOL can reach similar penetration levels and match company
growth targets ndash with steady margins no less ndash DOL has little upside
Valuing DOL as a mature business at its upper penetration bound implies ~40 downside
in a more realistic yet still generous scenario in which DOL is valued in line with peers
Higher Canada
store count vis-agrave-
vis comparable US
store count
compared to
Walmart
Higher Canada
store concentration
vis-agrave-vis
comparable US
store concentration
than Walmart
Achieving
managementrsquos
1700 store target
would put DOL at a
higher per capita
penetration level
than US peers
Store Count by Region
Canada US CanUS Ratio
WMT 410 5358 77DOL ndash Present 1178 14750 80DOL ndash Future 1700 14750 115
DOL CN DG DLTR
Stores 1700 14760 14732
Population (M) 36 326 326
StoresCapita (M) 472 453 452
Downside Run-Rate Operating Margin Estimate
ProfitabilityCost Measure JustificationGross Margin Target Recent Historical Average 370
Current SGampA Recent Historical Average 167
Add
Advertising Expense Normalization
Industry Average05
Rent Expense NormalizationAdjusting for Depreciation Rearranged
from Rent Expense 05
Depreciation Catch-Up Matching DampA schedules 15
Pro Forma SGampA 192
Pro Forma Operating Margin 178
Store Count per Mil People by Region
Canada US CanUS Ratio
WMT 114 164 69DOL ndash Present 327 452 72DOL ndash Future 472 452 104

2
Full Legal Disclaimer
This research presentation expresses our research opinions You should assume that as of the publication date of any presentation report or letter
Spruce Point Capital Management LLC (possibly along with or through our members partners affiliates employees andor consultants) along with our
subscribers and clients has a short position in all stocks (and are longshort combinations of puts and calls on the stock) covered herein including
without limitation Dollarama Inc (ldquoDOLrdquo) and therefore stand to realize significant gains in the event that the price of its stock declines Following
publication of any presentation report or letter we intend to continue transacting in the securities covered therein and we may be long short or neutral
at any time hereafter regardless of our initial recommendation All expressions of opinion are subject to change without notice and Spruce Point
Capital Management does not undertake to update this report or any information contained herein Spruce Point Capital Management subscribers
andor consultants shall have no obligation to inform any investor or viewer of this report about their historical current and future trading activities
This research presentation expresses our research opinions which we have based upon interpretation of certain facts and observations all of which
are based upon publicly available information and all of which are set out in this research presentation Any investment involves substantial risks
including complete loss of capital Any forecasts or estimates are for illustrative purpose only and should not be taken as l imitations of the maximum
possible loss or gain Any information contained in this report may include forward looking statements expectations pro forma analyses estimates
and projections You should assume these types of statements expectations pro forma analyses estimates and projections may turn out to be
incorrect for reasons beyond Spruce Point Capital Management LLCrsquos control This is not investment or accounting advice nor should it be construed
as such Use of Spruce Point Capital Management LLCrsquos research is at your own risk You should do your own research and due d iligence with
assistance from professional financial legal and tax experts before making any investment decision with respect to securities covered herein All
figures assumed to be in Canadian Dollars unless specified otherwise
To the best of our ability and belief as of the date hereof all information contained herein is accurate and reliable and does not omit to state material
facts necessary to make the statements herein not misleading and all information has been obtained from public sources we believe to be accurate
and reliable and who are not insiders or connected persons of the stock covered herein or who may otherwise owe any fiduciary duty or duty of
confidentiality to the issuer or to any other person or entity that was breached by the transmission of information to Spruce Point Capital Management
LLC However Spruce Point Capital Management LLC recognizes that there may be non-public information in the possession of DOL or other insiders
of DOL that has not been publicly disclosed by DOL Therefore such information contained herein is presented ldquoas isrdquo without warranty of any kind ndash
whether express or implied Spruce Point Capital Management LLC makes no other representations express or implied as to the accuracy timeliness
or completeness of any such information or with regard to the results to be obtained from its use You should assume all statements made are our
opinions unless sourced as facts where practical
This reportrsquos estimated fundamental value only represents a best efforts estimate of the potential fundamental valuation of a specific security and is not
expressed as or implied as assessments of the quality of a security a summary of past performance or an actionable investment strategy for an
investor This is not an offer to sell or a solicitation of an offer to Buy any security nor shall any security be offered or sold to any person in any
jurisdiction in which such offer would be unlawful under the securities laws of such jurisdiction Spruce Point Capital Management LLC is not registered
as an investment advisor brokerdealer or accounting firm
All rights reserved This document may not be reproduced or disseminated in whole or in part without the prior written consent of Spruce Point
3
About Spruce Point Capital Management
Spruce Point believes that Dollarama is significantly overvalued based on its undifferentiated and increasingly
uncompetitive business model inflated and unsustainable margins which are posed to decline and its limited growth
prospects which will restrain its ability to hit its long-term earnings expectations
Spruce Point Capital Is An Industry Recognized Research Activist Investment Firm Founded In 2009
bull Founded by Ben Axler a former investment banker with 18 years experience on Wall Street
bull Ranked the 1 Short-Seller in the world by Sumzero after a comprehensive study of 12000 analyst recommendations dating back to 2008 (March 2015)
bull Ranked the 13 Most Influential FinTweeter on Twitter according to Sentieo analysis (Dec 2016)
Report Date Company TickerEnterprise Value
At Report Date ($ billions)CEO Departure Date
2718 Realty Income O $198 John Case Oct 2018
81617 Dorman Products DORM $22 Mathias Barton Aug 2018
71317 Gentex GNTX $47 Fred Bauer Jan 2018
41316 Sabre Corp SABR $112 Tom Klein June 2016
121715 Intertain ITTO $15 John FitzGerald Feb 2016
81915 Caesarstone CSTE $17 Yos Shiran May 2016
21015 Greif GEF $32 David Fischer Oct 2015
111314 AMETEK AME $140 Frank Hermance May 2016
11514 LKQ Corp LKQ $118 Robert Wagman March 2017
72313 Just Energy JETO $20 Ken Hartwick Feb 2014
3513 Boulder Brands BDBD $10 Stephen Hughes June 2015
61412 Bazaarvoice BV $12 Bret Hurt Nov 2012
CEO Departures Post Recent Spruce Point Research Activism
4
Spruce Point Has Succeeded In Canadian Shareholder Activism
Spruce Point has written four critical activist reports in Canada In a majority of the cases the share price has met or
exceeded our downside estimate of intrinsic value The average share price decline is 57 A common theme is that
Canadian analysts donrsquot ask difficult questions of management challenge assumptions and are overly optimistic
Company Intertain TSO3 Just Energy Maxar (Formerly MacDonald Dettwiller)
Exchange Ticker TSX IT TSX TOS NYSE and TSX JE NYSE and TSX MAXR
Report Date December 17 2015 August 23 2017 July 31 2013 Aug 7 2018
Stock Brokers WhoSay Said ldquoBuyrdquo
CanaccordMackieNatrsquol BankCormark
CanaccordRBCScotiaGMP CanaccordRBCTDCIBCCanaccordRBCTDCIBCGMPBMO
Natrsquol BankScotia
Spruce Pointrsquos Criticisms
bull Stock promotion of a poorly organized online gaming roll-up
bull CEO FitzGerald has a checkered past with ties to questionable people
bull Ties to Amaya a company being investigated by regulators
bull Management Incentive Program is flawed and unjustly enriches insiders
bull Questionable financial reporting and accounting practices
bull Overvaluation 45-70 downside
bull Poorly promoted Canadian healthcare company with limited product value
bull Disclosure issues obfuscate actual end market sales and overstatement of total addressable market
bull Over-promotion of a partnership with Getinge that would be destined to fail
bull Terrible insider alignment with mgmt owning 1 of shares
bull 80+ downside when Getinge deal fails
bull Growth by deceptive sales tactics of a service with limited value
bull Reckless debt-fueled acquisition spree has stretched the balance sheet
bull Diverting investors from problems by creating metrics that overstate results
bull Dividend at high risk of being cutbull 46+ downside risk to $4share
bull MDArsquos acquisition of DigitalGlobe driven by the need to cover problems in its satellite business including a forthcoming decline in the geostationary satellite industry
bull Brazen accounting scheme including inflation of intangible assets to overstated Non-IFRS EPS
bull Dangerously levered at 58x when taking into account off-balance sheet liabilities make Maxarrsquos dividend at high risk of being cut or eliminated
bull Analyst estimates are too high and goodwill and asset impairment looms
Successful Outcome
bull Intertain initiated a strategic review upon the report release
bull Feb 2016 CEO FitzGerald resigns from Intertain (source)
bull Intertain delists from the TSX in Jan 2017 and re-lists its shares in the UK -- claiming that the Canadian markets donrsquot value its business (source)
bull Analyst price targets of C$2800 were never achieved Shares hit a low of C$713 down 42
bull On Jan 25 2018 TSO3 discloses amendments to the Getinge partnership validating Spruce Pointrsquos criticisms (source)
bull Multiple brokers downgrade shares from gtC$500 to C$200
bull Share price made a low of C$048 in Oct 2018 down 81
bull Free cash flow available to pay the dividend has contracted materially
bull CEO Ken Hartwick resigned within 7 months after our report (source)
bull CFO resigned a little more than a year after our report (source)
bull Share price made a low of $348 in June 2018 down 51 which exceeded our low share price target
bull Maxarrsquos twice attempted to ldquorefuterdquo our conclusions yet its share price lingers near a multi-year low
bull Maxar admitted that it is evaluating an impairment of assets and that ldquoit is possible that an impairment or write-down will be recognized in Q3rsquo18rdquo
bull The Company also clarified its capital allocation strategy and suggested that debt pay was a priority leaving the safety of the dividend in question(source)
Executive Summary
6
Spruce Point Believes Dollarama (TSX DOL) Is A ldquoStrong Sellrdquo With ~40 Downside Risk
A Retailer Of Low-End Products With Declining Fundamentals In An Increasingly Competitive Environment
bull Undifferentiated Products Dollarama sells a variety of low-priced products mostly sourced directly from China Its purported advantage in ldquosourcingrdquo is contradicted by conversations with industry sources as well as numerous IP infringement lawsuits filed against the Company
bull Moving Upmarket Is A Risky Strategy Faced with years of negative average traffic growth and an increasingly saturated market Dollarama is driving comparable store sales growth by selling higher-priced items However in doing so it is quickly losing its reputation as a true ldquodollar storerdquo and per-store traffic numbers are declining as a result Big Lots (NYSE BIG) undertook a similar strategy in the 2000s but reversed course after admitting its failure
bull Saturation Is Imminent Dollarama cited a 900 store target at the time of its IPO in 2009 when it had just 585 stores Management has since revised this number upwards multiple times first to 1200 then to 1400 and most recently to 1700 Our analysis shows that this target is unrealistic and that the market is already bordering on oversaturation Dollaramarsquos FY lsquo19 store opening pace has thus far been its slowest in years
bull Margins Inexplicably High And Likely Unsustainable Gross margins of 39-40 are remarkably high for a discount retailer but intensifying competition rising labor costs rising transportation costs and a lapsing currency hedge benefit all threaten Dollaramarsquos high profitability levels Patterns in Dollaramarsquos hedging profits and gross margins ex-hedging suggest that management may be leaning on its FX-related profits to prevent its headline gross margin number from declining (see note on next page)
Troublesome Management And Governance Red Flags
bull Founding Family (And A Director) Have Significant Related-Party Deals The Rossy family launched Dollarama from its legacy retail chain in 1992 and owns significant real estate assets that are employed by the enterprise This may have played a role in managementrsquos recent decision to acquire Dollaramarsquos existing Montreal distribution center from the Rossys rather than open a second distribution facility in western Canada as have most peers
bull CEO Stepped Down And Installed His Son Larry Rossy stepped down as CEO in 2016 (and as Chairman in 2018) selecting as his replacement his son Neil ndashpreviously Dollaramarsquos Chief Merchandising Officer We question whether a thorough and arms-length search was conducted to fill this position
bull Opaque Supplier Relationship As part of a deal struck in 2013 Dollarama supplies goods (at an undisclosed profit margin) to Central American discount retailer Dollar City in exchange for an option to acquire the chain in 2020 However Dollarama currently has no formal stake in Dollar City and therefore does not consolidate Dollar Cityrsquos results We are concerned that Dollar City could be overpaying its vendors to lessen the financial burden on Dollarama
bull Insider Ownership Declining Former CEO Larry Rossy has sold or transferred ~75 of his shares since the 2009 IPO Bain Capital liquidated the last of its shares in 2011 at a split-adjusted price of $5 per share 18th the current price The current CFO owns no shares and regularly liquidates options
Dollarama (DOL or ldquothe Companyrdquo) is a dollar store which following a series of price hikes over the course of several yearsis no longer a true
ldquodollar storerdquo As a result DOL has fallen out of favor with value-oriented customers causing average store traffic to contract and thus
necessitating further price hikes to support SSS growth Management is nonetheless aggressively pursuing unrealistic growth targets even as
competitors flood the discount retail market and threaten its improbable margins DOLrsquos shares trade at a 50 premium to peers in the value
retail space ndash even following a ~20 drop after a disappointing Q2 ndash questionable governance and poor earnings quality notwithstanding
We believe that DOL will continue to miss lofty investor expectations and that its premium valuation will continue to be pressured
7
Spruce Point Believes Dollarama (TSX DOL) Is A ldquoStrong Sellrdquo With ~40 Downside Risk
Questionable Accounting Techniques And Capital Allocation Decisions Weaken Quality Of Earnings And Financial Position
bull Currency Hedge Supposedly A Pure Offset To CAD Depreciation But Has Been A Material Profit Center Dollarama claims to hedge currencies only to lock in consistent prices (in CAD) on which its customers can rely However in practice the Company adjusts prices to match non-hedged competitors leaving us to wonder why it hedges at all Much of the recent hedge benefit appears to have reversed but gross margins ex-hedges conveniently rose by just enough over the last two years to maintain steady profitability If nothing else we question whether Dollaramarsquos elevated margins are sustainable
bull Tenant Allowances And Leasehold Improvements Are Amortized Over Very Different Periods While accounting rules may give sufficient leeway to permit this difference we question why lease term assumptions should differ for these two capital accounts Earnings quality suffers notwithstanding
bull Sales Of Certain Assets Such As Vehicles Appear To Be Completed At Above-Market Prices While the financial impact of these moves is difficult to quantify (perhaps due in part to Dollaramarsquos opaque relationship with Dollar City) the liquidation of certain assets is significant in some quarters
bull Leverage Is Increasing Dollarama makes long-term financing decisions using short-term debt the cost of which has risen with recent debt issuances andis likely to continue to increase with rising interest rates ndash and as the Companyrsquos credit profile grows riskier We question managementrsquos decision to increase leverage to support buybacks and dividends simply because the earnings yield is above the after-tax cost of debt We also worry about the state of the balance sheet should the economic environment turn or should the business decline more rapidly
bull Depreciation Is Well Below Capex And Has Been For Years Capital spending easily bests industry peers both as a percentage of sales and vis-agrave-vis steadier DampA charges The mismatch with DampA suggests poor quality of earnings at the very least Meanwhile managementrsquos growth orientation has diverted capital spending away from store remodeling giving stores a stale and dated feel despite rising price points
bull Acquiring Real Estate Flatters EBITDA Acquiring related-party real estate not only lines the pockets of the founding family but also allows Dollarama to shift rent expenses out of the operating line The artificial EBITDA boost helps management to achieve its EBITDA-based compensation targets
Easy To Justify ~40 Downside In DOL Shares
bull Valuation Is Indefensible DOL currently trades at a ~50 premium to peers and carries among the highest multiples of any global retailer Higher only are the valuations of cregraveme de la cregraveme global fashion brands ndash Hermes Prada Ferragamo etc Such lofty multiples are inappropriate for a dollar store with serious near-to-medium-term business risks Analyst estimates are not sufficiently skeptical of managementrsquos targets in light of these concerns
bull Even If Nothing Goes Wrong The Stock Is Overvalued Even if Dollarama executes its growth plan perfectly maintains its world-leading margin and retains a hefty valuation premium to its peers the stock is at best fairly valued at ~$43
bull Under More Reasonable Assumptions DOL Stock Is Overvalued By 40 At Current Levels Even assuming that Dollarama achieves full market penetration ndash with no negative impact on per-store revenues from competition or cannibalization ndash the stock is worth $28 under normalized margins and at a multiple closer to peer norms down ~40 from current levels
bull Analysts Bullish But Wavering Dollaramarsquos disappointing Q2 ndash including SSS guidance contraction and a YoY decline in operating cash flow ndash provoked some downgrades but analysts still see ~26 upside in DOL shares regardless We believe that analysts are too trusting of DOLrsquos growth targets but that the Q2 miss put the Company on notice with a number of analysts Further disappointing quarters could bring more drastic analyst revisions
8
Consensus Estimates (CY) 2018A LTM 2019E 2020E
Stock Price $3845 EV Sales 44x 43x 40x 38x
Shares Outstanding 332 EV EBITDA 174x 167x 161x 149x
Market Capitalization 12752 Adj EV EBITDAR 153x 148x - -
Total Debt Outstanding 1880 Price EPS 254x 241x 224x 199x
Less Cash and Equivalents 182
Enterprise Value 14450 Growth and Margins 2018A LTM 2019E 2020E
Operating Leases 1130 Sales Growth 102 84 102 65
Finance Leases 4 EBITDA Margin 255 256 249 254
Adj Enterprise Value 15584 EPS Growth 228 160 130 127
Credit Metrics 2018A LTM 2019E 2020E
Net Debt EBITDA 20x 20x 19x 17x
Adj Net Debt EBITDAR 28x 27x - -
Capital Structure And Valuation
In C$ MM except per share figures or where indicated
At present Dollarama demonstrates impressive margins and is not egregiously over-levered on a Net Debt-to-EBITDA
basis However as competition increases customers push back against recent price hikes and operating costs creep
upwards we believe that management will have a difficult time maintaining current profitability levels ndash particularly
while pursuing an aggressive growth strategy Leverage will be less sustainable should the businessrsquo performance
decline or the economic environment turn threatening managementrsquos ability to support continued buybacks
dividends while growing store count
Source Dollarama and Bloomberg Estimates
Note Calendar Year Ended Jan 30th
Note Operating Leases valued at 6x Operating Lease Expense
Though analysts
project declining sales
growth they foresee
margin expansion at
the same time This
pair of estimates
makes little sense to
us and should make
investors skeptical of
consensus estimates
Our research will
explain why we
believe margins will be
pressured going
forward
9
Short-Term Debt In A Rising Rate Environment Introduces Refinancing Risk
Significant Short-Term Debt Maturities That Will Have To Be Refinanced At
Higher Rates
Dollarama Has Unhedged Exposure To Interest
Rateshellip
hellipWhile The Three-Month CDOR Rate Rises Rapidly
Source Dollarama
Source Bloomberg
Dollarama refinanced significant short-term debt just last evening levering up the business in the process
Management refinanced its C$400M of 3095 fixed-rate notes due this November with C$500M of 355 fixed-rate
notes due November 2023 Managementrsquos use of short-term debt has burdened the business with refinancing risk in
an environment in which the CDOR rate has risen sharply and is expected to rise for the foreseeable future which has
now forced the Company to bear materially higher interest expenses (compare to its 2203 fixed-rate credit due in
2022) The Company still has C$14B of debt due to mature within the next 12 quarters (including its credit facility)
leaving it exposed to further rate increases The Companyrsquos weighted average debt maturity is about 35 years
320
680
DOLCN Credit Breakdown (C$1875M Total)
Floating Fixed$0
$100
$200
$300
$400
$500
$600DOLCN Debt Maturity Schedule (by CY Quarter)
Available in Revolving Credit Facility Maturing Sep 2023 Available in Revolving Credit Facility Maturing Sep 2020
Series 2 Variable Rate CDOR+59bp Series 3 Variable Rate CDOR+27bp
Fixed Rate 2203 Fixed Rate 2337
Fixed Rate 355
10
Will Dollarama Be The Next Bain Capital-Led Failed Retail IPO
ldquoTwenty-two percent of Bain LBOs from 1984 to 1992 went bankruptrdquo according to Eileen Applebaum in her book
ldquoPrivate Equity at Workrdquo1 Recent Bain-led retail busts include Toys ldquoRrdquo Us Guitar Center and Gymboree
Company DateEnterprise
ValueBain Capital Quotes Outcome
Toys ldquoRrdquo Us March 17 2005 $6600
Toys R Us and Babies R Us are premiere franchises with strong global brand recognition and a collection of high quality product offerings
including toys childrens apparel and baby products and accessories We are excited by the prospect of partnering with the management team and
employees to strengthen the long-term operating and financial performance of the businessesldquo -Matt Levin a MD at Bain
Toys ldquoRrdquo Us Files For BankruptcySept 2018
MichaelsStores
July 1 2006 $6000
We are delighted to partner with the Michaels management team to help build on its already strong position in an attractive industry and
capitalize on the significant growth opportunities that lie ahead Our deep experience in the retail sector reinforces our conviction that Michaels has
the best store locations a broad and attractive assortment of products for crafters of all ages and a sustainable competitive advantage thanks to smart investments in systems and infrastructure We look forward to helping Michaels achieve its full long-term potentialldquo ndash Matt Levin MD
IPO prices at low end of range (June 2014)
Share Price Hits Multi-Year Low in Oct 2018
As SSS Decline
Guitar Center June 27 2007 $2100
ldquoAs the leading retailer of musical instruments in the US Guitar Center enjoys great brand recognition among musicians nationwide a loyal
customer base and a track record of significant growth We look forward to working with the Companyrsquos experienced and capable management
team to continue to build the businessrdquo Jordan Hitch a MD at Bain
The End of Guitar Center
AndGuitar Center Troubles
Only Getting Worse
Gymboree Oct 22 2010 $1800
Gymboree is a terrific company with incredible brand strength and a large population of extremely satisfied customers We look forward to
working with Matthew McCauley and the companys proven and experienced management teamldquo Jordan Hitch MD at Bain Capital
Gymboree Hires Restructuring Counsel
1) Source ldquoBain Capital Sees High Profile Buyouts Go Bustrdquo NY Post March 2018
A Low-End Retailer With Unsustainably High Margins
12
Undifferentiated Goods amp Knock-Off Products
Dollarama sells undifferentiated low-priced consumer goods competing almost entirely on price Many of its products are
knock-offs It is no surprise that the Company has been sued by several companies for trademark infringement
How Dollarama became the retail king of knockoffsSelling cheap imitations of more expensive brands has turned Dollarama into one of Canadarsquos most
successful retailers earning it big bucks and plenty of lawsuits (Source)
ldquoI think they have good lawyers working
for themrdquo says David Lipkus a lawyer
specializing in anti-counterfeit in Toronto
who has helped clients sue businesses in
Canada selling knock-offs ldquoOften
retailers make mistakes and end up
selling fakesrdquo Many lawsuits are settled
privately but the store has been sued
by Nike for selling counterfeit
footwear emblazoned with Nikersquos
iconic basketball player silhouette and
by Umbra a home decoration company
for selling a style of waste basket In
February 2017 Dixon Ticonderoga
launched a suit against the dollar
store chain for a pencil itrsquos been
selling since 2002
Dollarama sells a wide range of discounted knock-offs across product categories
Its business invites litigation
Brazen mimicry multiple knock-offs
of a single producer (Mars)
Source
13
Per-Store Traffic Growth Stagnant But Opportunities For Price Increases May Be Exhausted
Growth in per-store sales has been driven by transaction size growth against declining per-store traffic Transaction
size growth has itself been driven by sales of higher-priced items Dollaramarsquos maximum price point has risen from
$1 prior to FY 2008 to $2 in FY 2008-09 to $3 in FY 2012 to $4 in FY 2017
Contracting store traffic puts per-store sales growth at risk absent further price increases but we question whether
price-driven SSS growth is sustainable as higher prices erode Dollaramarsquos value proposition and put it in closer
competition with more comprehensive big-box retailers Management has expressed reluctance to raise prices further
in the near term regardless (though they said the same when the max price was bumped to $3 several years ago) With
recent price increases now lapping for the first time SSS growth may be at risk
Growth has been propped up by price increases which have made its products more expensive than those at dollar store peers
Between a rock and a hard place Does management continue to erode Dollaramarsquos value proposition with price increases or
keep prices steady and hope for traffic contraction to reverse
Average Quarterly YOY
Growth in Per Store Traffic
-18 since Q1 2014
Transaction
size growth
decelerating
14
Increasing Average Unit Revenues Is A Very Risky Strategy That Has Failed Before
Raising price points to prop up SSS growth against falling store traffic is a major risk for discount retailers as their
entire value proposition comes from their low prices Higher prices may turn off customers and create difficult
comps in the event that price increases must be paused or reversed due to customer pushback
In 2006 for example Big Lots ndash a US discount retailer ndash introduced higher-ticket brand-name items in place of
comparable budget goods in an effort to get customers to spend more per visit This strategy reinvigorated same-
store sales growth for a time but ultimately failed Subsequent difficult comps resulted in negative SSS growth after
management abandoned its so-called ldquoRaise the Ringrdquo strategy
Raise the Ring is
abandoned lower price
points are emphasized
Raise the Ring is
introduced higher priced
items are emphasized
Big Lots alienated shoppers who were
seeking cut-price name-brand goods after
venturing into other areas
like selling frozen food
ldquoOur customer doesnrsquot come to us expecting a
Nordstromrsquos level of in-store shopping
experience They want value treasures
merchandise on the floor and clean restrooms
and we need to meet those expectationsrdquo
[CEO Steve] Fishman said in 2005
hellip
ldquoWersquore an enigmardquo he said at an investor
conference this month ldquoItrsquos been a real
challenge for the marketplacerdquo Source
Calls with industry experts indicate that Dollarama is losing more price-conscious customers to Dollar Tree and other discount retailers
following its efforts to raise prices and that this is a major driver behind recent per-store traffic declines
If price-conscious customers arenrsquot interested in shopping at Dollarama we wonder who ishellip
15
ldquoNothingForADollaramardquo Customers Becoming Conscious Of Price Increases Versus Competitors
Dollaramarsquos price increases may not yet put its prices on par with those of big box retailers like Walmart but
customers have taken notice that Dollarama has increased prices against other Canadian dollar stores Comments
from various internet forums and news sites reveal that customers no longer believe that Dollarama offers as much
value as do other discount retailers suggesting that the strength of Dollaramarsquos value proposition ndash the source of
its appeal and foundation of its business model ndash is at risk The below comments are anecdotal but comments of
this sort regarding Dollarama in particular are nonetheless common among relevant websites
ldquoThe dollar store is no longer a bargain if you
shop around you can by the same things
cheaper or same price elsewhere quit
calling it dollarama no more dollar thingsrdquo
Source
ldquodollar tree here is drastically cheaper then
dollarammardquo ndash Cody Williams
ldquoCody Williams Same here Dollarama is not
really a dollar store anymorerdquo ndash JJ Walker
Source
ldquoI enjoyed the days when everything in Rama
actually was a dollar I go to Dollar Tree
more often now just because everything
there is $125 - ($1 in the US of course)rdquo
Source
ldquoTheir high prices is the problem they still
have better selection than Dollar Tree but
their prices are always higher I know some
dollar store shoppers who go to Dollar
Tree first for the better prices and then go
to Dollarama for the stuff they couldnt
find at Dollar Tree Myself personally have
watched the prices creep up A pair of work
gloves climbed from $250 to 4 or 5 bucks
the discount over Home Depot is only a
buck or two now Also Dollar Tree still
keeps all items under 2 bucks I believerdquo
Source
ldquoThey gonna have to change the Dollarama
name soonrdquo
ldquodollarandaquarterramardquo
ldquoNew Name NothingForaDollarrdquo
ldquoYou forgot lsquoramarsquo NothingForADollaramardquo
ldquoAs for a new name how about
FiveFinaramardquo
ldquofive or lessarmardquo
Source
ldquoDollarRama is no longer in the same
category since they sell at higher prices
more of a discounted store and not a dollar
storerdquo
Source
Just did a quick check of my cleaning cupboard
DT=Dollar Tree DM=Dollarama
- 284L bleach $125 at DT Sometimes they even
have the big 37L bottles Never seen bleach that
cheap at DM
- 976ml Fabric Refresher $125 at DT DM sells it for
$150 and its a smaller bottle
- Oxy First Force spray cleaner $125 at DT $150 at
DM
DT also has a selection of other spray cleaners at
$125 while even other no name ones at DM can go
up to $2
- No name dish soap 1479ml (almost 15L) for $125
at DT 500ml for a $1 (or I guess $125 soon) at DM
- No name Mr Clean sponges At DT its two full
sponges for $125 At DM each sponge is half Mr
Clean cleaner sponge and half normal cheap sponge
- Those square no name tupperware containers that
are 3 for $125 at DM are 4 for $125 at DT
At the dollar-ish level everything Ive found at DT
has been a better value and equal or better
quality
Source
16
Transitioning Away From ldquoDollar Storerdquo Identity Threatens Customer Loyalty
Perhaps in recognition of the fact that Dollarama is losing its status as a true dollar store and that it now belongs to a
different category management has stricken almost all references to ldquodollar storesrdquo from Company filings This poses
a major threat to Dollaramarsquos customer appeal as evidenced by traffic trends and anecdotal customer reactions
FY 2017 Annual Information Form FY 2018 Annual Information Form
17
Margins Are Inexplicably High And Perhaps Unsustainable
We acknowledge that Dollarama is a strong operator with a strong value proposition (though perhaps a declining one) However
we question whether a discount retailer reselling Chinese knock-offs should garner among the highest operating margins of all
global retailers and whether a discount retailer with declining per-store traffic can continue to rely on price hikes for SSS growth
Dollarama stands out among global consumer companies and retailers ndash
45th out of 584 global retailers by operating margin (and 12th out of 584
global retailers by revenue multiple)
Dollarama consistently produces operating margins materially higher than
industry peers and higher than historical industry norms This gap has
only grown more substantial through the last five years
0
5
10
15
20
25
FY 2008 FY 2009 FY 2010 FY 2011 FY 2012 FY 2013 FY 2014 FY 2015 FY 2016 FY 2017 FY 2018
Peer Median Operating Margins vs Dollarama
Peer Median DOL CN
-10
-5
0
5
10
15
20
25
FY 1
989
FY 1
990
FY 1
991
FY 1
992
FY 1
993
FY 1
994
FY 1
995
FY 1
996
FY 1
997
FY 1
998
FY 1
999
FY 2
000
FY 2
001
FY 2
002
FY 2
003
FY 2
004
FY 2
005
FY 2
006
FY 2
007
FY 2
008
FY 2
009
FY 2
010
FY 2
011
FY 2
012
FY 2
013
FY 2
014
FY 2
015
FY 2
016
FY 2
017
FY 2
018
Dollarama Operating Margins vs Peers
DG FDO DLTR FRED BIG DOL CN
Source Bloomberg EQS function Source Dollarama and company filings
18
Debit Card Boost Is Played Out
Dollarama management has characterized the benefit from debit cards as being roughly a doubling in average purchase size
If true this benefit would be visible in year-over-year sales comps
The Company has not always disclosed penetration ndash and they ceased doing so after Q4 2016 ndash but the data suggest that the
average annual comp benefit was approximately 25 from FY 2013-16
Source Dollarama
00
05
10
15
20
25
30
35
40
45
0
10
20
30
40
50
60
Debit Card Penetration and Imputed Comp Benefit
Debit Card Penetration (LHS) Comp Benefit (RHS)
19
Have All The Levers Been Pulled
Dollarama has done a good job of increasing per-store revenue while investing in initiatives designed to remove operating
expenses We cannot fault management for pulling levers to expand margins but we believe the low-hanging
(and high-hanging) fruit has already been harvested
Management has also taken creative measures to raise effective average prices without raising prices directly ndash eg by
strategically replacing some lower-priced goods with close substitutes at higher price points and by reducing the size of
product bundles (pencils candies etc) without cutting prices Such back-door avenues to margin expansion may be exhausted
by this point as noted previously customers are beginning to notice that Dollarama no longer offers a value proposition
comparable to competing dollar stores
FY 13 FY 14 FY 15 FY 16 FY 17 FY 18
Revenue LeversAdd $250-$300
Price PointsDiscounting With Hedged Margins
Add $350-400 Price Points
Accept Credit and Debit Cards
Cost LeversDollar City
RelationshipNew POS Terminals
Kronos Labor Scheduling
Wi-Fi amp ScannersNew Warehouse
ConstructionWarehouse Expansion
Accounting and Financial Levers
Depreciation Schedule Change
Direct Profit from Currency Hedges
Leveraged Share Repurchase
ldquoThanks and good morning In the write up in the
discussion of the foreign exchange headwinds
and gross margin you also said you made select
changes to your product mix I am just wondering if
you could elaborate are there certain categories
thatrsquos your emphasizing in certain categories you are
deemphasizing I am just wondering what that
sentence really meantrdquo
- Peter Sklar BMO Capital Markets
ldquoIts really an item by item discussion Where the
compelling value remains and we are able to take for
example two pencils out of a pack and still be
competitive to help with offsetting some of the
headwinds thatrsquos the way we handle it or in other
cases if we replace the product with a new offering
thatrsquos just as compelling but different at a lower
cost potentially Thatrsquos another way Buyers can use
that tool to help them with the current challengesrdquo
- Michael Ross CFO Dollarama
Is this a sustainable practice as value-oriented customers lose faith in Dollarama
FY 2016 Q4 Earnings Call QampA
20
Costs Rising On Multiple Fronts
While management may have largely exhausted avenues for price increases and efficiency gains other industry and Company
developments threaten to drive up costs through the near term
Cost Driver Explanation
TariffsA significant share of goods (~20 according to industry experts) are sourced either directly or indirectly from the US Tariffs could increase costs on these goods materially
Minimum Wage Hikes
Provincial minimum wages in Canada generally rise much more frequently than do US minimum wages and many are scheduled to rise on an annual basis based on CPI growth Minimum wage hikes have been particularly significant of late (see below) Even provinces whose minimum wages are not tied to CPI growth have seen or are set to see material minimum wage hikes in the near future Notable recent and near-term changes are as follows
bull Alberta From $1360 to $1500 on October 1 2018 (103 increase)bull British Columbia From $1265 to $1385 on June 1 2019 to $1460 on June 1 2020 and to $1520 on June 1 2021 (63 CAGR)bull Ontario From $1160 to $1400 on January 1 2018 (207 increase) and to $1500 on January 1 2019 (additional 71 year-over-year increase)
Will rise according to Ontario CPI growth every October 1 each subsequent year New Ontario Premier Doug Ford is looking to reverse these plansbull Quebec Just increased to $1200 (+66 in May 2018) Significant political push to set provincial minimum wage at 50 of average provincial
minimum wage by 2020bull Manitoba New Brunswick Newfoundland Nova Scotia Ontario Saskatchewan and Yukon Annual minimum wage hikes according to national or
local CPI growth
Employee remuneration for FY 2018 was just over 10 of Dollarama revenue This cost item could realistically grow at a high single-digit rate over the next 2-3 years even if headcount is reduced
Transportation and Logistics
Industry experts have expressed concerns regarding near-term transportation cost increases These would hit Dollarama particularly hard as Dollarama is unique among industry peers It has only one distribution center Rather than invest in a second Dollarama recently purchased its existing distribution center in Montreal ndash which it previously leased from the Rossy family ndash for $394M (in addition to $232M spent on adjacent land) Other large Canadian value retailers generally have two distribution centers ndash one in the eastern half of the country and one in the western half
Rising fuel costs could result in materially higher transportation expenses as Dollarama distributes 92 of its merchandise through its single distribution center Industry experts suggest that shipping goods to Vancouver from Montreal via truck can be almost twice as expensive as shipping to Vancouver from China
We find it interesting that Dollarama chose to purchase property from managementrsquos family rather than follow industry norms and open a second distribution center in western Canada and that five of its six warehouses ndash all located in greater Montreal ndash are also leased from the Rossy family (the sixth warehouse is company-owned built on land purchased from the Rossy family)
MarketingDollarama has historically operated with no marketing expense However US peers spend 1-2 of revenue on average on marketing (see subsequent slides) As competition increases across the Canadian discount retail industry management may be forced to expand marketing efforts
21
Minimum Wage Growth Historically High And Accelerating Rapidly
Canada has seen fairly consistent minimum wage hikes since 2000 and minimum wage growth has outpaced inflation in all but
three years since the beginning of the millennium Dollarama has been able to manage minimum wage hikes and maintain
impressive margins since going public in 2009 Note however that minimum wage growth from 2009-17 was comparatively mild
relative to the prior half-decade Accelerating minimum wage growth through the near term will test managementrsquos ability to
insulate margins from rising labor costs
0
2
4
6
8
10
12
14
2001 2002 2003 2004 2005 2006 2007 2008 2009 2010 2011 2012 2013 2014 2015 2016 2017 2018YTD
Minimum Wage Growth Consistently Ahead of Inflation and Accelerating Rapidly
Weighted Average Minimum Wage Growth Canadian CPI Growth
Minimum wage growth across all Canadian provinces weighted by
province population
Management states that the vast majority of employees make more than minimum wage Nonetheless minimum wage hikes of 10-20 in
Canadarsquos most populous provinces could put material upward pressure on labor costs ndash particularly if these hikes spread to Quebec where
Dollaramarsquos distribution center and all of its warehouses are located Management includes a risk factor to this effect in its MDampA
210
215
220
225
230
235
240
245
250
255
260
FY 2018 EBITDA Margin FY 2018 EBITDA Margin with5 Labor Cost Hike
FY 2018 EBITDA Margin with10 Labor Cost Hike
EBITDA Margin Sensitivity to Labor Cost Hikes
12 weighted average minimum wage growth across Canada driven by
207 hikes in Ontario Average minimum wages could very realistically
continue to grow at high single-digit rates through the next ~2 years if
planned hikes are enacted
With labor costs representing about 10 of Dollarama revenue
profitability is materially sensitive to changes in this item
If labor costs were 10 higher in FY 2018 EBITDA margins would have
been slashed by 80 bps
Labor cost expansion of this magnitude would be significant but is not
necessarily out of the question within 2-3 years
Source Government of Canada
22
Lack Of Transparency Regarding Dollar City Is A Serious Concern
CEO Larry Rossy
and
CFO Michael Ross
mischaracterized
the sale by
attributing it to
vehicles which
has its own
categoryhellip
Why are Dollarama shopping carts being repurposed for Dollar City use
Perhaps they were sold above-market to Dollar City in FY 2013 when the relationship began Could this be the
reason for an unexplained $149M disposal of leasehold improvements that year
Source
1) Dollar City website and press
release announcing the relationship
Q ndash Keith Howlett ldquoOn Note 5 [of the FY
2013 Annual Report] I was trying to figure
out the leasehold improvements there
seemed to be some items called lsquodisposals
at costrsquo and therersquos sort of an offset thererdquo
A ndash Larry Rossy CEO ldquoI donrsquot know what
they are Yoursquore going to have to help me
out guys hererdquo
A ndash Michael Ross CFO ldquoDisposal of costs
that would be fixtures or related tohelliprdquo
A ndash Rossy ldquoI would say carsrdquo
A ndash Ross ldquoCars Yeah okay We sold a
few carsrdquo
Q ndash Howlett ldquoOh I see okay Well it
shows up as CAD 15M for a year thatrsquos a
lot of carsrdquo
A ndash Rossy ldquoOh itrsquos a very expensive
carrdquo
Source FY 2013 Q4 Earnings Call Source Dollarama
2013 Annual Report
In 2013 Dollarama entered into an agreement to export and sell products to Dollar City a Latin American dollar store with a
presence in El Salvador Guatemala and Colombia In exchange for selling goods to Dollar City ldquoat costrdquo plus a small markup
and providing business and operational expertise Dollarama was given an option to acquire the chain exercisable in February
2019 (since extended to February 2020)
Details about Dollar City are scarce Who is the management Where is company headquarters Who are the shareholders
Dollar Cityrsquos website provides limited information and not a single Dollar City manager was quoted at the initiation of the
relationship1 Though management claims to sell to Dollar City ldquoat costrdquo with a markup we have no way of determining how they
are calculating ldquocostrdquo It is more likely that Dollarama loads shared costs into the Dollar City bill that flatter Dollaramarsquos margins
and sells merchandise that isnrsquot selling well in Dollarama stores to Dollar City
More Competition Coming To An Already-Crowded Space
24
Evidence Of Dollarama Store Growth Slowing
The pace with which Dollarama opened stores through the past several years does not appear to be sustainable
Importantly the inevitable reversal in its pacing appears to be occurring this year
The Company opened just eight stores in Q2rsquo19 its lowest store opening count in any quarter of any recent year
Its YTD FY 2019 pace of 18 new stores is also trailing the average pace of recent fiscal years (28 openings) by
~35 Management did not provide a fully satisfactory explanation for this deficit
The slowdown in its pace of store openings could suggest that the Company is having a difficult time identifying
economically-viable locations as it seeks to grow its store count by close to 50 ndash still a very distant target
Fiscal YearStated New
Store Opening Goal
Q1 Q2 First Half Q3 Q4 Total
2019 60-70 10 8 18
2018 60-70 13 17 30 10 25 65
2017 60-70 8 13 21 18 26 65
2016 None 17 17 34 16 25 75
Source Dollarama financial filings
ldquoI want to ask about the pace of store
openings As you noted the slower start to
the year you did maintain the guidance for
this year But wondering about sort of further
beyond that obviously the store potential that
you put out there gives you room to remain at
that pace for a while But does the slower
same store sales assumption change your
thinking about how aggressively you want
to push new stores out thererdquo
- Mark Petrie CIBC
ldquoNo it does not It does not And that I would
also add that if the pace at which weve been
opening stores this year is slower than last year
as mentioned often that just relates to the
specific timing of real estate And if stores are
pushed closer to the end of the year it could be
that there is an overlap between a few more
stores at the end of this year or a few more
stores in the beginning of next year and the
end it will keep our pace of 60 to 70rdquo
- Michael Ross CFO Dollarama
ldquoReal estate timing issuesrdquo
do a poor job of explaining a
drop in H1 new store
openings of over a third
Source Dollarama Q2 FY 2019 Earnings Call
25
Dollarama Potentially Pushing The Limits Of The Canadian Market
Managementrsquos stated goal is to have 1700 stores across Canada by 2027 up from 1178 stores today We do not
believe that it can achieve this without risking significant cannibalization DOLrsquos target would imply a saturation level
higher than the largest US dollar stores (Dollar Tree and Dollar General) which also sell many more consumables and
grocery items Additionally Canada broadly has much lower levels of retail space per capita than the US suggesting
that Canadian concentration is even more pronounced all else equal
US Retail Square Footage Greater Than Canadian
Retail Square Footage
DOLrsquos Target Implies
Greater Than US
Saturation Despite
Narrower Concept
Source Wellington Management
Walmart is not opening stores in Canada suggesting that it believes
the Canadian market is saturated at 114 stores per million people ndash
about 69 of its US concentration (164 stores per million people)
Meanwhile Dollarama continues to expand within Canada despite
even higher Canadian concentration (327 per mil) relative to the US
concentration of large US dollar stores (452 per mil for a 72
ratio) This ratio would be over 100 at DOLrsquos 1700 store target
Higher Canada store
count vis-agrave-vis
comparable US
store count
compared to Walmart
Higher Canada store
concentration vis-agrave-
vis comparable US
store concentration
than Walmart
Retailers with similar store concentrations per capita across both the US and
Canada are effectively more concentrated in Canada vis-agrave-vis the total retail space
in either country
Store Count by Region
Canada US CanUS Ratio
WMT 410 5358 77
DOL ndash Present 1178 14750 80
DOL ndash Future 1700 14750 115
Store Count per Million People by Region
Canada US CanUS Ratio
WMT 114 164 69
DOL ndash Present 327 452 72
DOL ndash Future 472 452 104
DOL CN DG DLTR
Stores 1700 14760 14732
Population (M) 36 326 326
StoresCapita (M) 472 453 452
26
Dollarama Has Benefited From A Benign Competitive Environment
Large competitors have been shuttering Canadian stores continuously through the last four years due to company-
specific issues highlighted by the high-profile exits of Target and Big Lots from Canada12 We believe that this has been
a significant tailwind for Dollarama but one that is largely behind the Company at this juncture
Dollarama has been able to maintain significant share high margins and high returns on capital in large part due to
missteps among peers and the resulting lax competition This is likely unsustainable in a more competitive environment
as Dollarama has few material competitive advantages barriers to entry are low and its discount retailing strategy is not
unique Competent competition from growing industry players ndash Dollar Tree Canada Miniso and Amazon among others
ndash could be the straw that breaks the camelrsquos back for Dollaramarsquos profitability or growth (or both)
Fiscal YearCompany Exiting
CanadaStores Closed Revenue
DOL Revenue Capture
(Estimated)
Estimated Revenue Benefit
Revenue Boost
2018 Sears 200 $2000 3 $60 2
2017 Sears 100 $1000 3 $30 1
2016 Target 133 $2000 6 $120 4
2015 Big Lots 78 $155 10 $16 1
Last Four Year Average $56 2
Note All numbers are SPCM estimates
1) ldquoTarget Canada to close all stores by April 12rdquo
2) ldquoBig Lots Getting Back Out of Canadardquo
27
Light Competition Has Allowed The Company To Spend Nothing On Promotion ndash Until Now
Dollarama has no promotional expense Meanwhile promotional expenses average 1-2 of revenue among US
peers As established competitors continue to expand and as new competitors enter the market (Amazon included)
Dollaramarsquos no-cost marketing strategy may prove untenable
Promotional Expense
as a of Revenue
Intensifying Competition Threatens Dollaramarsquos
Passive Marketing Strategy
2016 2017 2018
BIG 180 180 170
FIVE 264 270 243
DLTR 021 029 048
DG 062 054 044
Average 132 133 126Source Huffington Post
Source Investorscom
The Canadian operation is also a relatively small part of the business However early results are
encouraging and despite competition in the Canadian market Dollar Tree has found success Longer
term the company is aiming for 1000 stores north of the border which does not seem unrealistic
Source Retail Environments
Calls with people at Dollar Tree suggest that the Company is working to
imitate elements of Dollaramarsquos strategy and store layout in its own
Canadian stores (eg raised shelves etc) and that it plans to expand
into Canada aggressively once its strategy is refined ndash likely in 2019
Source Company financial filings
28
Caught Between The Competition How Will Dollarama Fit In
Dollar Tree has maintained its reputation as a true dollar store nothing is priced higher than C$125 ($1 in the US)
Miniso has developed a reputation as a ldquonicerrdquo discount retailer items can cost up to C$25 but the environment is cleaner and
more modern and products are of better quality (but you can still get a dollar-level deal ndash most products are priced under C$10)
Dollarama has all the character of an old tired dollar store but without the dollar prices
Who will shop there unless management invests in store updates rather than opening new stores
Value-driven customers are by definition not loyal customers
Miniso
Clean and modern but cheap
Dollar Tree
No need for price tags everythingrsquos $1 Dollarama
Looks like Dollar Tree priced like Miniso
Irsquoll pass
29
Dollarama Makes No Effort To Appeal Millennials ndashThe Next (And Current) Shopping Generation
Dollarama has zero social media presence unlike all of its peers Not only is the Company out of touch with customers in
an industry which demands a high level of customer engagement but its brand is becoming demonstrably stale
Facebook Twitter Instagram YouTube LinkedIn Pinterest Google+
Dollar Tree Yes Yes Yes Yes Yes Yes No
Dollar General Yes Yes Yes Yes Yes Yes Yes
Family Dollar Yes Yes Yes Yes Yes Yes No
Big Lots Yes Yes Yes Yes Yes No Yes
Miniso (Canada N America)
Yes Yes Yes Yes Yes No No
Great Canadian Dollar Store
Yes Yes No No No No No
Dollarama No No No No No No No
Until now Dollarama has largely been a regional brand with satisfactory name recognition in its provincial home of Quebec
Now that the Company is making a bigger push into Anglophone Canada management should be more proactive in adapting its
strategy to new markets and to a new customer base Yet management continues to employ a strategy more befitting a sleepy
regional business it does not market or work to improve its brand it does not stay current with trends it keeps management
within the family and it is not expanding its logistics chain to support coast-to-coast growth (see subsequent slides)
Management wants Dollarama to be a national brand but it does not appear prepared to run a national business
Questionable Accounting And Financial Practices
31
Hedging Instruments A Material Source Of Profits In Recent Years
Dollaramarsquos sales are in Canadian dollars whereas a majority of its product purchases are US dollar-linked Management claims to enter
into CADUSD hedging arrangements to lock in near-term margins without having to adjust prices in response to FX movements However
management has nonetheless admittedly adjusted prices alongside unhedged peers in response to shifts in the CADUSD exchange rate
rendering its currency hedges a source of profit
Forex dynamics through the last two years have erased the large hedge benefit realized by Dollarama in FY 2016 but management reports
that gross margins have effectively remained flat through this period implying significant gross margin improvement in the underlying
business (see graphs below) As the currency hedge benefit has reversed through the last two years underlying gross margins have
purportedly risen by EXACTLY ENOUGH to keep total gross margins steady between 39-40 We find this oddly convenient ndash or at the very
least we question whether management will be able to maintain steady margins in the face of unfavorable FX rate dynamics in the future
Quick turnaround in
underlying
profitability Just in
time to keep the
declining forex hedge
benefit from dragging
down marginshellip
Even as FX hedge gains fell
from close to 8 of gross profit
in FY 2016 to a drag on gross
profit in FY 2018 gross margin
expanded by over 100 bps over
the same period implying gross
margin expansion ex-forex of
almost 300 bps within two years
for a retailer with gross margins
which were already unusually
high and whose margins had
contracted for four straight
years before the rapid reversal
32
Questionable Depreciation Assumptions
Dollarama changed its depreciation schedule for leasehold improvements (store fixtures) in FY 2015 moving from a 10-year to a 15-
year expected life1 However management did not concurrently lengthen the amortization schedule for tenant inducements
We find this mismatch curious as both quantities should be amortized depreciated over the expected life of a given lease
Adding to the confusion and appearance of foul play DOL discloses in its AIF that its average lease term is just 5 yrs and it just
started disclosing related-party dealing with Director Huw Thomas of SmartCentres ndash a REIT that lists DOL as a top 10 customer23
Lease term implied
by leasehold
depreciation expense
2-3x greater than that
implied by
amortization of
tenant allowance
Mismatch in implied
lease term
inappropriately
inflates EBIT
C$ MillionsFY
2013FY
2014FY
2015FY
2016FY
2017FY
2018
Amortization of Tenant Allowance $29 $35 $43 $49 $48 $51
Starting Balance Sheet Amount 168 207 232 280 344 386
Amortization as a of Asset Amount 173 169 185 175 140 132
Implied Lease Term 58 59 54 57 72 76
Leasehold Depreciation Expense $129 $166 $108 $141 $172 $202
Starting Balance Sheet Amount 1182 1348 1762 2113 2499 2867
Depreciation as a of Asset Amount 109 123 61 67 69 70
Implied Lease Term 92 81 163 150 145 142
Tenant Allowance Amortization Using Leasehold Depreciation Schedule
183 255 142 189 237 272
Reduction In EBIT If Both Were Put On Same Schedule (11) (10) (29) (30) (24) (24)
While the financial impact of this adjustment is limited signs of accounting impropriety do not reflect well on management and cast
doubt on the rest of Dollaramarsquos reports and accounting practices
1) FY 2015 Annual Report p 15 DOL also extended its store and warehouse equipment useful lives from 8-10yrs to 10-15yrs The total reduction of these three items was decrease of $10m in
FY15 depreciation expense
2) DOL states in its AIF p 11 ldquoThe Corporation typically enters into leases with base terms of ten years and options to renew for one or more periods of five years each The average time to
expiration of the Corporationrsquos leases is approximately five yearsrdquo
3) See governance slide on Huw Thomas
33
Capital Spending And Distribution Of Cash To Shareholders Are Overextending The Business
What happened
Management claimed in 2011 that the business was sufficiently cash-generative to support growth and dividendsshare buybacks
and that it would be able to pay down debt while pursuing both However debt has ballooned since then with net debt rising 8x
(and close to 3x versus EBITDA growth) Management is effectively levering up the balance sheet to support dividends and share
buybacks with CFO Michael Ross stating that he will continue to repurchase shares as long as the earnings yield remains above
the after-tax cost of debt
ldquoFor the past few years our cash flow has enabled
us to continue to pursue our growth plans and
continue to pay down debt Our free cash flow is
now sufficient to fund both those priorities
while enhancing new to shareholders through
a quarterly dividend payment We are able to
generate the free cash flow to do all of this
because we employ a simple growth oriented
business model at Dollaramardquo
ndash June 2011 Conference Call
Should Dollaramarsquos struggles become more pronounced ndash or should the
economic cycle turn for the worse ndash this debt overhang could loom large over
the business
Dollarama also consistently spends more on capex (as a percentage of sales) than its peers in the discount retail industry and
shows abnormally high capex versus depreciation and amortization We understand that Dollarama is a growing business which
could explain both patterns in part but it is not the only discount retailer which is investing in store growth
Dollarama DampA consistently
lt50 of capex and a lower
percentage of capex than
industry peers
Dollarama consistently
spends more on capex
(as a percentage of sales) than industry peers
00
05
10
15
20
25
0
200
400
600
800
1000
1200
1400
1600
1800
FY2012
FY2013
FY2014
FY2015
FY2016
FY2017
FY2018
Ne
t D
eb
tEB
ITD
A
Ne
t D
eb
t ($
C M
M)
Net DebtEBITDA Net Debt
0
50
100
150
200
250
300
FY2010 FY2011 FY2012 FY2013 FY2014 FY2015 FY2016 FY2017 FY2018
DampA as a of Capex and Intangibles Annual
DOL DLTR DG BIG FRED
0
1
2
3
4
5
6
7
8
FY2010 FY2011 FY2012 FY2013 FY2014 FY2015 FY2016 FY2017 FY2018
Capex and Intangibles as a of Sales Annual
DOL DLTR DG BIG FRED
34
Where Is The Capex Going
Management has explicitly identified and discussed various capital expenditures in Company filings over the last
five years but this still leaves a large gap versus what was actually spent
Additionally there is a large gap between the amount spent on software development and the amortization expense
associated with this activity suggesting that earnings may be inflated
Some of this is
directed towards
leasehold
improvements etc
but with
managementrsquos
focus on expansion
over existing store
improvements we
question where
management is
directing this capex
Capital Spending Software
on Software Amortization Difference
FY 2018 191 126 65
FY 2017 126 96 3
FY 2016 111 78 33
FY 2015 108 56 52
FY 2014 98 34 64
Are earnings
inflated due to
insufficient
amortization
Note also that a LinkedIn search for software developers at Dollarama turned up effectively nothing ndash at best one person with a tangentially
relevant title (source) So where is the software development capex going
Unlike discount retailer peers Dollarama
did not include software-related
spending in capex until recently and
records it separately in
ldquoAdditions to intangible assetsrdquo1
Do they do this to artificially deflate their
headline capex figure thereby inflating
reported free cash flow
Undiscussed Capital Spending (FY 2014 ndash 2018)
C$ Millions
$500K in capex spent per new store (375 new stores over past five years Source AIF) $1875
Capex spent on construction of 500K sqft warehouse in Montreal 679
$82M spent annually on expansion renovation or relocation of stores over five years 410
$232M spent on land acquisition 232
Discussed Capex Over Past Five Years $3196
Total Reported Capex (ex intangibles) $5200
Undiscussed Capex $2004
Software Capex and Software Amortization Discrepancy
C$ MillionsCapital Spending on
SoftwareSoftware Amortization Ratio
FY 2018 $191 $126 152
FY 2017 126 96 131
FY 2016 111 78 116
FY 2015 108 56 193
FY 2014 98 34 288
1) DOL explicitly started calling out software as a component of capex in Q3rsquo16 with the addition of footnote to guidance
35
Lack Of Transparency Regarding Store Closures And Associated Costs
It is standard industry practice to report store closures remodels and relocations alongside new store openings
However Dollarama reports only ldquoNet New Storesrdquo and does not break this number out in detail Questioned on this
in Q4 2016 management answered that a larger store base would inevitably result in more closures for reasons
outside of its control (fires mall renovations etc) and that reporting closures would therefore not communicate
meaningful information regarding the underlying performance of the business
We strongly disagree store closure information is vital to evaluating the health of a retail chain Management can
provide color on particular closures if it feels that they have been done for reasons other than performance but
failing to report closures entirely hides a key operating statistic from investors
Company Store Movement 2012 2013 2014 2015 2016 2017 2018
DLTR
Beginning 4101 4351 4671 4992 5367 13851 14334OpenedAcquired 278 345 343 391 8850 584 603
Closed 28 25 22 16 366 101 102Closed as of Beginning 07 06 05 03 68 07 07
BIG
Beginning 1398 1533 1495 1493 1460 1449 1432Opened 181 87 55 24 9 9 24Closed 46 46 58 57 20 26 40
Closed as of Beginning 33 30 39 38 14 18 28
DG
Beginning 9372 9937 10506 11132 11789 12483 13320Opened 625 625 650 700 730 900 1315Closed 60 56 24 43 36 63 101
Closed as of Beginning 06 06 02 04 03 05 08
FDO
Beginning 7023 7442 7916 -- -- -- --Opened 475 500 526 -- -- -- --Closed 56 26 400 -- -- -- --
Closed as of Beginning 08 03 51 -- -- -- --Overall Industry Average 09 07 20 07 23 07 08
Other high-growth dollar
stores like Dollar Tree and
Dollar General report store
closures ndash why doesnrsquot
Dollarama
Store closures for whatever
the reasons incur real
restructuring and other
costs Peer retailers
generally give detail on these
expenses whereas
Dollarama does not
We believe that Dollarama
should follow industry norms
and increase transparency
regarding store closures
US Dollar Store peers historically close 08 of stores annually yet Dollarama has not reported any recent closures
36
SSS Metrics Obfuscate Store Performance
Dollaramarsquos official ldquoComparable Store Salesrdquo figure includes ldquorelocated and expandedrdquo stores as ldquocomparable storesrdquo
therefore picking up growth in traffic which can be attributed to relocation-related improvements We believe that this likely
overstates Comparable Store Sales growth while also ignoring associated relocation-related expenses
1) See Q1 FY 2014 earnings call transcript
Management not only hides store closure data as a supposedly uninformative statistic but proclaims that it has NEVER closed a
store due to poor performance1 We find it difficult to believe that a retailer which has existed in its current format since 1992 has
never needed to close a store for poor performance If it has indeed never closed an underperforming store we wonder whether
management has been too ambitious in growing its store base without critically evaluating the profitability of each location
Huntsville Place Mall Jul 2015
7 John St Oct 2012
7 John St Jul 2015
Huntsville Place Mall Oct 2012
Huntsville ON
Relocation
Are these really entirely
ldquocomparablerdquo locations
781 Rue Principale Est May 2016
781 Rue Principale Est Jun 2009Le Carrefour Ste Agathe
May 2016
Ste-Agathe-Des-Monts QC
Relocation
Why assume the costs to
make this lt1 mile move
Notice
Dollarama
sign turned
inside-out
indicating
closure
37
Cash Flow Beginning To Turn Over Despite Efforts To Bolster Results
In H1 FY 2019 Dollaramarsquos cash flow contracted on a year-over-year basis for the first time since it went public ndash this
despite managementrsquos efforts to bolster earnings and EBITDA The contraction appears to be due in large part to
changes in working capital In particular we are concerned that growth in inventories suggests that management
overestimated near-to-medium term sales growth and that declining traffic is starting to weigh on the Company
Dollarama H1 Operating Cash Flow
C$ Millions FY 2014 FY 2015 FY 2016 FY 2017 FY 2018 FY 2019
Net Income $1054 $1221 $1603 $1895 $2265 $2433
CFO Before Working Capital 1394 1488 2124 2156 2769 2999
Changes in Working Capital (287) (236) (870) (110) (126) (886)
Net CFO 1107 1252 1253 2045 2644 2113
YoY Change $326 $322 $01 $792 $599 (531)
Source Dollarama
Governance Concerns
39
Related-Party Transactions With Rossy Family Raise Questions Over Governance And Costs
Fiscal YearRent amp Land Purchases
Paid to Rossys(C$ MM)
As a of Compensation Paid to Rossy Family
FY 2019 (To Date) $394 NA
FY 2018 184 1660
FY 2017 402 4459
FY 2016 179 1305
FY 2015 169 2752
FY 2014 163 1903
As noted Dollarama leases all but one of its five warehouses from the Rossy family and recently purchased land from the Rossys
for the construction of a sixth Management also recently purchased its Montreal distribution center from the Rossy family which
leased the facility to Dollarama until this February We understand that the Rossy family has close historical ties to the business
but this level of close dealing draws our attention particularly given the fact that management has focused on fortifying its
existing distribution footprint ndash closely tied to the Rossy family ndash rather than invest in distribution facilities in western Canada
where major competitors already have distribution centers
DLTR
Distribution
Center
Delta BC
DLTR
Distribution
Center
Mississauga ON
DOL
Distribution
Center
DOL
Warehouses
No Dollarama distribution facilities
located outside of a ~4 mile radius in
Montreal
bull Due to preferential relationship with
Rossy family
bull Will Dollarama be able to expand into
AngloWestern Canada efficiently
without logistics costs ballooning
bull Overly-exposed to fuel price hikes
and rising transportation costs
Related-Party Transactions Significant And Growing
Source Dollarama Financials
Dollar Tree Canada Distribution Centers
Dollarama Distribution Centers And Warehouses
Source DollarTree
Montreal QC
40
Related-Party Transactions With ldquoIndependentrdquo Director Huw Thomas Only Recently Disclosedhellip
Dollarama also leases stores from SmartCentres REIT whose recently-departed CEO Huw Thomas joined Dollaramarsquos
Board of Directors in 2011 and was a member of its audit committee through March 2017
His ldquoindependencerdquo was recently defended by a meandering 260-word footnote in Dollaramarsquos proxy which belies the
fact that Dollarama is a top 10 customer of SmartCentres
This is all the more suspicious in light of Dollaramarsquos questionable lease accounting highlighted earlier
Source Dollarama 2018 Proxy Circular
Note Dollarama did not start disclosing Huwrsquos related-party dealing until the 2017 proxy
circular in June 2017 right after he left the Audit Committee in March 2017
SmartCentres 2017 Annual Report
Dollarama Material To SmartCentres ndash A Top 10 Customer
SmartCentres Promotes Dollarama Relationship From 2011
Calloway (now SmartCentres) 2012 Annual Report
Dollaramarsquos Lengthy Meandering Defense Of Thomas
Huw As Independent Only Recently Disclosed (2017)
Dollarama Recently Changed Rent Expense Disclosure
Source Dollarama Q4rsquo17 Financials Note 15 Related Party Disclosure
Source Dollarama Q2rsquo18 Financials Note 13 Related Party Disclosure
41
House of Windsor House of RossyA Case Study In Nepotism
Neil Rossy had been the Senior VP of Merchandising Chief Merchandising Officer for 25 years prior to being named CEO in
2016 While his family is still a large shareholder they are not a controlling shareholder owning around 5 of the shares
outstanding We question whether the Rossyrsquos century-long family tradition of passing down leadership ndash one which also
persists at the Rossyrsquos ldquosister storerdquo ndash is appropriate for a public company or wise for the long-term health of the business
Salim Rossy
Opened first ldquoS Rossyrdquo
store in 1910 (up-market
department store concept)
George Rossy
President of S Rossy
1937-1973
Larry Rossy
Grew S Rossy from 20 to 44 stores before
converting all S Rossy stores to new
ldquoDollaramardquo concept in 1992 Sold majority
stake to Bain Capital in 2004 IPO in 2009
Neil Rossy
CEO of Dollarama as of 2016
Michael Rossy
Brother of George (one of ten siblings)
Founder amp CEO of ldquoRossyrdquo stores 1949-2010
Michael DiTullio
Son-in-Law of Michael
President amp CEO of Rossy since 2010
Does (or will) the family have a hard time parting with a business that has been in the family for four generations even if parting ways is
the right thing to do
Managing retail chains is very
much a family affair for the
Rossys ndash at both stores
Perhaps Neil was going to be
anointed CEO of Dollarama
regardless of the caliber of other
potential candidates
Letrsquos hope hersquos not Commodus
BONUS
Brother branches out
with separate storehellip
42
Insiders Incentivized To Grow EBITDA
Our earlier concerns about EBITDA quality are amplified by the fact that Dollarama executives are compensated
based on seemingly arbitrary and inflated EBITDA targets This gives management a strong incentive to be inefficient
users of capital as any dollar shifted from operating expense to capex has a direct benefit to key executives
For example note that managementrsquos perhaps questionable decision to purchase one of its Montreal warehouses
will shift what was until recently rent expense into depreciation This change in the accounting treatment of
Dollaramarsquos tenancy costs will provide a windfall to EBITDA potentially boosting management bonuses
Source Dollarama Proxy Circular p 30
43
What Is A Stretch EBITDA Goal
Bonuses are paid upon achievement of 11 EBITDA growth This level was ldquodesigned to be a stretch objectivehellip
attainable only with significant effortrdquo However this target was reset lower after FY 2014 ndash the only year during which
management did not handily exceed the target We believe this further calls into question the independence of the
board and its compensation committee
Year EBITDA Growth Objective EBITDA Growth Achieved
FY 2018 11 18
FY 2017 11 18
FY 2016 11 30
FY 2015 11 15
FY 2014 13 12
FY 2013 13 22
FY 2012 13 26
FY 2014 Management
misses growth objective
FY 2015 Growth objective
adjusted downwards
ldquoThe thresholds were revised by the
Human Resources and Compensation
Committee in the context of its annual
executive compensation review
conducted at the beginning of each fiscal
year to take into account among other
elements the fact that the base for the
calculation is growing every yearrdquo
Source FY15 Management Proxy Circular
What ldquoother elementsrdquo were
taken into account
Source Dollarama
44
Insiders Selling While Company Buys Back Stock At Elevated Prices
Management has been buying back shares at elevated prices through the last several years even while pursuing growth leaving little capital for
(sorely needed) store updates or other uses The average repurchase price since Q1 FY17 is about on par with current share prices and ~40
below our target Since Q2 FY18 the average buyback price has been 25 above current levels
Furthermore just as the Company has been buying back stock at elevated prices insiders have been offloading shares Notably it is evident
from past and current proxy statements that CFO Michael Ross has never held onto shares for which he has been granted options his
common equity ownership is listed at zero every year Note that as the CFO it is he who is dictating the share buyback decision in large part
PeriodShares
Repurchased
Value of Repurchase
(C$ M)
Average Price (Split-
Adj) (C$)
Q1 FY 2017 1542066 1393 3011
Q2 FY 2017 2027080 1842 3029
Q3 FY 2017 1571500 1578 3347
Q4 FY 2017 2279522 2241 3277
Q1 FY 2018 1687240 1806 3568
Q2 FY 2018 1303900 1602 4095
Q3 FY 2018 687700 931 4513
Q4 FY 2018 2425700 3788 5205
Q1 FY 2019 94500 145 5115
Q2 FY 20191 1347341 700 5195
Total 14966549 16026 3797
Discount to Current Share Price 1
Total (Since Q2 FY 2018)
5859141 7170 4815
Discount to Current Share Price -20
Using Company Funds To Overpay For DOL Shareshellip While Insiders Sell Into The Companyrsquos Bidhellip
Source DOL filings and Bloomberg
Insider Title Date Sold SharesProceeds (C$ M)
Price Sold (Split-Adj)(C$)
Nicolas Hien Senior Vice President 482016 6203 06 3224
Michael Ross CFO 482016 80000 74 3083
Paul Roche Vice President 4182016 10000 09 3000
Geoffrey Robillard Senior Vice President 6172016 33500 31 3085
John Assaly Vice President 9272016 30000 30 3333
Geoffrey Robillard Senior Vice President 472017 20000 23 3833
Paul Roche Vice President 472017 23100 26 3752
Josee Kouri Corporate Secretary 4142017 8000 09 3750
Geoffrey Robillard Senior Vice President 9142017 5000 07 4667
Geoffrey Robillard Senior Vice President 12112017 10000 16 5333
John Assaly Vice President 12132017 14096 22 5202
Geoffrey Robillard Senior Vice President 1262018 15000 24 5333
John Thomas Independent Director 1262018 6000 10 5556
Geoffrey Robillard Senior Vice President 6152018 50000 75 5000
John Assaly Vice President 6192018 13404 21 5222
Nicolas Hein Senior Vice President 6222018 36750 19 5170
Paul Roche Vice President 6222018 24000 13 5417
We do not like the fact that insiders have been selling into share buybacks while
the Company levers itself up with short-term debt to support those repurchases
It appears that the execs are levering up the business in part to enrich themselves1) All share information prior to Q2 lsquo19 reflects pre-split data except
Split-Adjusted Average Prices Q2 lsquo19 repurchases were as stated
45
Rossy Family Selling Shares Despite Control Over C-Suite
Notably Founder and former CEO Larry Rossy has trimmed his position tremendously through the last several years
Though this is to be expected to some extent as he recently ceded control of the business we believe that his
ownership stake should be held to a higher standard given his insistence on keeping the business in the family
If he plans to keep the c-suite under a Rossy dynasty the familyrsquos personal stake in the business should reflect that
Source Bloomberg
Valuation And Price Target
47
The Market Has Not Taken Threats To Dollarama Seriously ndash But Optimism Is Ebbing
Analysts are generally bullish on the stock focusing primarily on managementrsquos growth story and taking current
profitability levels for granted The prospect of new competitive threats to a business which has until now seen limited
competition ndash and the risk that prevailing margins are unsustainable even through the near term ndash go underappreciated
Dollaramarsquos poor Q2 cooled analystsrsquo optimism to some extent but we believe that the reaction was largely reactive and
superficial as they adjusted their price targets in such a way that in aggregate they saw exactly the same upside after the
post-Q2 dip as they did before The market still does not fully appreciate the magnitude of the threats facing Dollarama
All price targets in C$ Before Q2 Release After Q2 Release
Firm Recommendation Target PriceUpside (on 82818) Recommendation Target Price
Upside (on 9172018)
Upside (Present)
RBC Capital Markets Outperform $5500 12 Outperform $5200 22 35
Raymond James Outperform $5567 13 Outperform $5000 17 30
Macquarie Outperform $5633 14 Outperform $4900 15 27
BMO Capital Markets Outperform $6100 24 Market Perform $4700 10 22
CIBC Capital Markets Outperform $5900 20 Neutral $4600 8 20
Desjardins Securities Buy $5800 18 Hold $4500 6 17
Veritas Investment Research Co Buy $5600 14 Buy $4800 13 25
Industrial Alliance Securities Hold $5450 11 Buy $5450 28 42
Canaccord Genuity Buy $5900 20 Buy $5500 29 43
Barclays Equal Weight $5200 5 Equal Weight $4400 3 14
TD Securities Buy $5900 20 Hold $4900 15 27
Accountability Research Corp Buy $5400 10 Buy $5000 17 30
National Bank Financial Outperform $5567 13 Sector Perform $4800 13 25
Scotia Capital Sector Outperform $5567 13 Sector Outperform $5050 19 31
Wells Fargo Securities Market Perform $5300 7 Market Perform $4000 -6 4
AVERAGE $5626 14 $4853 14 26
While analysts are still not sufficiently critical of Dollarama the more recent downward move in the stock and subsequent analyst
downgrades may suggest that the market could be primed to evaluate the Company and its growth story with a more discerning eye
We believe that the issues which we highlight in this report will provoke further professional skepticism among analysts and investors
48
Dollarama Not Priced To Perfection ndashPriced Beyond Perfection
We can get close to DOLrsquos current valuation only if we value it as a mature ex-growth business today under
managementrsquos lofty goals for the business for ten years into the future applying no discounts for time
business risk etc
Managementrsquos ten-year store target
bull Current store count 1178 (70 of long-
term target)
Even if Dollarama were a mature business today under managementrsquos long-term targets for the business
DOL stock would not have no upside to current share prices
The market is pricing DOL beyond perfection ndash a valuation this lofty cannot be justified today
Mature Business ValuationC$ MM unless noted
Stores 1700
Revenue per Store $32
Total Revenue $5440
Operating Margin 220
Operating Profit $1197
Interest Expense $50
Tax (275) $315
Net Income $831
Diluted Shares Outstanding 332
EPS $251
PE Multiple 152x
Target Price $3815
Upside -1
Average operating margin since Q1 FY 2016
bull Assumes that DOLrsquos unusually high
margins are sustainable despite
intensifying competition loss of recent FX
benefit and customer pushback against
price hikes
Mature revenue per store estimate
bull Current average revenue per store
~$28M (875 of long-term target)
Industry median NTM PE multiple
bull Assigns no discount to DOL due to
declining store traffic vs peers incoming
competitive threats inefficient distribution
network etc
49
Dollarama Not Priced To Perfection ndashPriced Beyond Perfection (Continued)
Put another way The market is implicitly taking it for
granted that Dollarama will achieve its lofty ten-year
growth targets assuming sustained profitability levels
and per-store efficiency ndash and applying close to the
industry median FY1 EVEBITDA multiple to Dollaramarsquos
FY 2027 EBITDA
Just under ten-
year target
What kind of growth is the market implicitly betting on if
we value Dollarama on par with peers
bull 150 more stores than managementrsquos ten-year target ndash
within nine years
bull 48 CAGR in revenue per store
bull Zero margin compression
FY 2027 Estimates if Management Executes Growth Plans Perfectly
(C$ MM unless noted)
Stores (Year-End) 1688
Revenue per Store $33
Total Revenue $5503
Gross Margin 380
Gross Profit $2093
SGampA per Store 04
SGampA Total 689
EBITDA (FY 2027) $1404
Market Cap 12752
Debt 1880
Cash 182
Enterprise Value $14450
EVEBITDA (FY 2027) 103x
Industry Median EVEBITDA (FY1) 110x
Average gross
margin ex-
hedge gains
since FY 2016
Mature revenue
per store
estimate (15
growth CAGR)
FY 2018 SGampA
per Store
Implied FY 2027
multiple close to
industry median FY1
multiple
FY 2027 Estimates To Justify Prevailing Valuation (C$ MM unless noted)
Stores (Year-End) 1858
Revenue per Store $44
Total Revenue $7929
Gross Margin 380
Gross Profit $3016
SGampA per Store 04
SGampA Total 755
EBITDA (FY 2027) $2261
EVEBITDA (FY 2027) 62x
Enterprise Value 13947
Debt 1880
Cash 182
Equity Valuation $12249
Diluted Shares Outstanding 332
Target Price $3693
Current Price $3845
158 over ten-
year target in
nine years
48 growth
CAGR in
SalesStore
Industry median
FY1 multiple
discounted
75 annually
Average gross
margin ex-
hedge gains
since FY 2016
FY 2018 SGampA
per Store
High forecast gives
us 4 DOWNSIDE
50
Valuation Far Out Of Line With Peers And Historical Multiples
DOL shares trade at a 50-60 premium to peers in the discount retail industry The market is valuing DOL much more like a high-
growth tech company than a brick-and-mortar dollar store (and one with concerning fundamental trends at that) Note that this still
holds true even after DOL shares traded down significantly following its recent Q2 earnings report
It is difficult to justify a valuation this high even if one is bullish on DOL vis-agrave-vis the rest of the industry
Company Ticker
3-Year Consensus Revenue
CAGR
FY 2018 EBITDA Margin
PE(NTM)
PE(FY2)
EVEBITDA(NTM)
EVEBITDA(FY2)
EVSales(NTM)
Dollar Tree DLTR 43 121 139x 134x 91x 88x 10x
Dollar General DG 75 104 163x 162x 112x 112x 12x
Big Lots BIG 06 85 87x 87x 52x 53x 04x
Five Below FIVE 210 162 360x 412x 2113x 243x 32x
Canadian Tire CTC CN 20 90 179x 181x 82x 83x 10x
Metro MRU CN 80 73 142x 139x 99x 101x 08x
MEDIAN 59 97 152x 151x 95x 110x 10x
Dollarama DOL CN 85 255 229x 223x 164x 163x 41x
DOL PREMIUM 505 477 727 509 3057
Does DOL ndash a value retailer
demonstrating concerning
fundamental trends ndash deserve
to be valued on par with
higher-growth industries and
completely out of line with its
industry peers
Profitability is impressive but
likely unsustainable in the face
of growing competition
Enterprise Value Revenues Enterprise Value Adj EBITDA Price Adj EPSDOL shares also trade at
a significant premium to
historical multiples
despite unsustainable
margins an increasingly
saturated market and
rising competitive
threats
51
Does The Market Think Dollarama Is A Dollar Store Or A Premium Retail Brand
Dollarama is valued much more closely to premium retail brands than its discount retail peer group
A bull might ldquojustifyrdquo this by pointing to Dollaramarsquos profitability profile and growth expectations but its EBITDA margins are so
out of line with those of its peers that one is forced to question whether they are sustainable (at best) or honest (at worst)
As discussed Dollaramarsquos consensus sales growth numbers also ignore looming fundamental threats to the business
Company TickerGross
Margin (NTM)
EBITDA Margin (NTM)
Sales Growth (NTM)
EVEBITDA(NTM)
PE(NTM)
EVSales(NTM)
Dollar Tree DLTR 31 11 28 91x 139x 10x
Dollar General DG 31 10 89 112x 163x 12x
Big Lots BIG 41 7 -08 52x 87x 04x
Five Below FIVE 36 15 203 2113x 360x 32x
Canadian Tire CTC CN 34 12 40 82x 179x 10x
Metro MRU CN 19 7 88 99x 142x 08x
MEDIAN 33 11 64 95x 152x 10x
Dollarama DOL CN 40 25 99 164x 229x 41x
DOL PREMIUM 727 505 3057
How does Dollarama support EBITDA
margins more than double those of its
peer group and in line with premium
global retail brands
Company TickerGross
Margin (NTM)
EBITDA Margin (NTM)
Sales Growth (NTM)
EVEBITDA (NTM)
PE (NTM)EVSales
(NTM)
Ferragamo SFER IM 65 17 48 160x 260x 26x
Hermes RMS FP 69 38 84 200x 350x 78x
Prada 1913 HK 74 22 78 100x 210x 23x
Tiffany amp Co TIF 64 24 51 113x 196x 28x
MEDIAN 67 23 65 137x 235x 27x
Dollarama DOL CN 40 25 99 164x 229x 41x
DOL PREMIUM 197 -26 519
Does a discount retailer facing
fundamental headwinds deserve to be
priced 50 or more above its peer
group and closer to global
premium retail brands
52
Margins And Multiples Materially Out-of-Line With Peers
We do not believe that Dollaramarsquos profitability levels ndash which are entirely out of line with peers ndash are justified or sustainable in an
industry as competitive as deep discount retail The Company is already struggling to meet store count growth targets raising the
likelihood that its store growth plan will be dilutive to margins The market assigns a premium valuation to Dollarama on the basis
of relatively high growth expectations and the Companyrsquos industry-leading margins However as discussed throughout this
report we doubt both managementrsquos ability to meet its growth targets and its ability to maintain prevailing profitability levels The
likelihood that the Company will be able to achieve BOTH of these goals simultaneously is even slimmer Accordingly we believe
that the basis for Dollaramarsquos substantial share price premium is unfounded
Dollaramarsquos margin profile is grossly out of
line with peers and we find evidence of
aggressive accounting and questionable
business practices that can partly explain the
issue We doubt that this would be sustainable
even if management wasnrsquot growing the chain
How will a lowno-moat business with falling
per-store traffic be able to maintain its
remarkable profitability advantage while
aggressively expanding its store base
DLTRDG
BIG
FIVE
CTCCN
MRUCNWNCN
DOLCN
0
5
10
15
20
25
30
10 15 20 25 30 35 40 45 50
EBIT
DA
Mar
gin
Gross Margin
Dollarama Margins Completely Out Of Line With Peers
The premium in Dollaramarsquos share
price is driven by the marketrsquos trust in
managementrsquos growth initiatives and
its recognition of the Companyrsquos
dominant profitability
However neither its profitability
advantage nor its growth prospects
are sustainable The likelihood that
management simultaneously
preserves BOTH is extremely low
Big Lots (BIG) Dollar Tree (DLTR) Dollar General (DG) Metro Inc (MRU CN) and Canadian Tire (CTC CN)
x
5x
10x
15x
20x
25x
BIG DLTR MRU CN DG CTC CN DOL CN
PE (NTM)
x
4x
8x
12x
16x
20x
BIG DLTR MRU CN DG CTC CN DOL CN
EVEBITDA
53
Valuing DOL As A Mature Business In The Canadian Market ~40 Downside
C$ MM unlessotherwise noted
Current Run-Rate Valuation
Priced Beyond Perfection
Reasonable Downside
Stores 1170 1700 1500
RevenuesStore 28 32 30
Revenues 3320 5440 4500
Operating Margin 23 22 18
Operating Profit 764 1197 801
Interest Expense 42 50 50
Tax 275 198 315 207
Net Income 523 831 544
Shares 332 332 332
EPS $158 $251 $164
Multiple 24x 16x ~15x
Share Price $3845 $3966 $2460
Upside (Downside) 3 Approx -40
As discussed earlier at 1700 stores DOL would have greater penetration than both Dollar General (DG) and Dollar Tree (DLTR)
which both offer a much broader assortment of goods including perishablesconsumables Meanwhile the US appears to be
overstored versus Canada It is likely unreasonable for DOL to target per capita penetration levels on par with its US peers
Even if we assume that DOL can reach similar penetration levels and match company
growth targets ndash with steady margins no less ndash DOL has little upside
Valuing DOL as a mature business at its upper penetration bound implies ~40 downside
in a more realistic yet still generous scenario in which DOL is valued in line with peers
Higher Canada
store count vis-agrave-
vis comparable US
store count
compared to
Walmart
Higher Canada
store concentration
vis-agrave-vis
comparable US
store concentration
than Walmart
Achieving
managementrsquos
1700 store target
would put DOL at a
higher per capita
penetration level
than US peers
Store Count by Region
Canada US CanUS Ratio
WMT 410 5358 77DOL ndash Present 1178 14750 80DOL ndash Future 1700 14750 115
DOL CN DG DLTR
Stores 1700 14760 14732
Population (M) 36 326 326
StoresCapita (M) 472 453 452
Downside Run-Rate Operating Margin Estimate
ProfitabilityCost Measure JustificationGross Margin Target Recent Historical Average 370
Current SGampA Recent Historical Average 167
Add
Advertising Expense Normalization
Industry Average05
Rent Expense NormalizationAdjusting for Depreciation Rearranged
from Rent Expense 05
Depreciation Catch-Up Matching DampA schedules 15
Pro Forma SGampA 192
Pro Forma Operating Margin 178
Store Count per Mil People by Region
Canada US CanUS Ratio
WMT 114 164 69DOL ndash Present 327 452 72DOL ndash Future 472 452 104

3
About Spruce Point Capital Management
Spruce Point believes that Dollarama is significantly overvalued based on its undifferentiated and increasingly
uncompetitive business model inflated and unsustainable margins which are posed to decline and its limited growth
prospects which will restrain its ability to hit its long-term earnings expectations
Spruce Point Capital Is An Industry Recognized Research Activist Investment Firm Founded In 2009
bull Founded by Ben Axler a former investment banker with 18 years experience on Wall Street
bull Ranked the 1 Short-Seller in the world by Sumzero after a comprehensive study of 12000 analyst recommendations dating back to 2008 (March 2015)
bull Ranked the 13 Most Influential FinTweeter on Twitter according to Sentieo analysis (Dec 2016)
Report Date Company TickerEnterprise Value
At Report Date ($ billions)CEO Departure Date
2718 Realty Income O $198 John Case Oct 2018
81617 Dorman Products DORM $22 Mathias Barton Aug 2018
71317 Gentex GNTX $47 Fred Bauer Jan 2018
41316 Sabre Corp SABR $112 Tom Klein June 2016
121715 Intertain ITTO $15 John FitzGerald Feb 2016
81915 Caesarstone CSTE $17 Yos Shiran May 2016
21015 Greif GEF $32 David Fischer Oct 2015
111314 AMETEK AME $140 Frank Hermance May 2016
11514 LKQ Corp LKQ $118 Robert Wagman March 2017
72313 Just Energy JETO $20 Ken Hartwick Feb 2014
3513 Boulder Brands BDBD $10 Stephen Hughes June 2015
61412 Bazaarvoice BV $12 Bret Hurt Nov 2012
CEO Departures Post Recent Spruce Point Research Activism
4
Spruce Point Has Succeeded In Canadian Shareholder Activism
Spruce Point has written four critical activist reports in Canada In a majority of the cases the share price has met or
exceeded our downside estimate of intrinsic value The average share price decline is 57 A common theme is that
Canadian analysts donrsquot ask difficult questions of management challenge assumptions and are overly optimistic
Company Intertain TSO3 Just Energy Maxar (Formerly MacDonald Dettwiller)
Exchange Ticker TSX IT TSX TOS NYSE and TSX JE NYSE and TSX MAXR
Report Date December 17 2015 August 23 2017 July 31 2013 Aug 7 2018
Stock Brokers WhoSay Said ldquoBuyrdquo
CanaccordMackieNatrsquol BankCormark
CanaccordRBCScotiaGMP CanaccordRBCTDCIBCCanaccordRBCTDCIBCGMPBMO
Natrsquol BankScotia
Spruce Pointrsquos Criticisms
bull Stock promotion of a poorly organized online gaming roll-up
bull CEO FitzGerald has a checkered past with ties to questionable people
bull Ties to Amaya a company being investigated by regulators
bull Management Incentive Program is flawed and unjustly enriches insiders
bull Questionable financial reporting and accounting practices
bull Overvaluation 45-70 downside
bull Poorly promoted Canadian healthcare company with limited product value
bull Disclosure issues obfuscate actual end market sales and overstatement of total addressable market
bull Over-promotion of a partnership with Getinge that would be destined to fail
bull Terrible insider alignment with mgmt owning 1 of shares
bull 80+ downside when Getinge deal fails
bull Growth by deceptive sales tactics of a service with limited value
bull Reckless debt-fueled acquisition spree has stretched the balance sheet
bull Diverting investors from problems by creating metrics that overstate results
bull Dividend at high risk of being cutbull 46+ downside risk to $4share
bull MDArsquos acquisition of DigitalGlobe driven by the need to cover problems in its satellite business including a forthcoming decline in the geostationary satellite industry
bull Brazen accounting scheme including inflation of intangible assets to overstated Non-IFRS EPS
bull Dangerously levered at 58x when taking into account off-balance sheet liabilities make Maxarrsquos dividend at high risk of being cut or eliminated
bull Analyst estimates are too high and goodwill and asset impairment looms
Successful Outcome
bull Intertain initiated a strategic review upon the report release
bull Feb 2016 CEO FitzGerald resigns from Intertain (source)
bull Intertain delists from the TSX in Jan 2017 and re-lists its shares in the UK -- claiming that the Canadian markets donrsquot value its business (source)
bull Analyst price targets of C$2800 were never achieved Shares hit a low of C$713 down 42
bull On Jan 25 2018 TSO3 discloses amendments to the Getinge partnership validating Spruce Pointrsquos criticisms (source)
bull Multiple brokers downgrade shares from gtC$500 to C$200
bull Share price made a low of C$048 in Oct 2018 down 81
bull Free cash flow available to pay the dividend has contracted materially
bull CEO Ken Hartwick resigned within 7 months after our report (source)
bull CFO resigned a little more than a year after our report (source)
bull Share price made a low of $348 in June 2018 down 51 which exceeded our low share price target
bull Maxarrsquos twice attempted to ldquorefuterdquo our conclusions yet its share price lingers near a multi-year low
bull Maxar admitted that it is evaluating an impairment of assets and that ldquoit is possible that an impairment or write-down will be recognized in Q3rsquo18rdquo
bull The Company also clarified its capital allocation strategy and suggested that debt pay was a priority leaving the safety of the dividend in question(source)
Executive Summary
6
Spruce Point Believes Dollarama (TSX DOL) Is A ldquoStrong Sellrdquo With ~40 Downside Risk
A Retailer Of Low-End Products With Declining Fundamentals In An Increasingly Competitive Environment
bull Undifferentiated Products Dollarama sells a variety of low-priced products mostly sourced directly from China Its purported advantage in ldquosourcingrdquo is contradicted by conversations with industry sources as well as numerous IP infringement lawsuits filed against the Company
bull Moving Upmarket Is A Risky Strategy Faced with years of negative average traffic growth and an increasingly saturated market Dollarama is driving comparable store sales growth by selling higher-priced items However in doing so it is quickly losing its reputation as a true ldquodollar storerdquo and per-store traffic numbers are declining as a result Big Lots (NYSE BIG) undertook a similar strategy in the 2000s but reversed course after admitting its failure
bull Saturation Is Imminent Dollarama cited a 900 store target at the time of its IPO in 2009 when it had just 585 stores Management has since revised this number upwards multiple times first to 1200 then to 1400 and most recently to 1700 Our analysis shows that this target is unrealistic and that the market is already bordering on oversaturation Dollaramarsquos FY lsquo19 store opening pace has thus far been its slowest in years
bull Margins Inexplicably High And Likely Unsustainable Gross margins of 39-40 are remarkably high for a discount retailer but intensifying competition rising labor costs rising transportation costs and a lapsing currency hedge benefit all threaten Dollaramarsquos high profitability levels Patterns in Dollaramarsquos hedging profits and gross margins ex-hedging suggest that management may be leaning on its FX-related profits to prevent its headline gross margin number from declining (see note on next page)
Troublesome Management And Governance Red Flags
bull Founding Family (And A Director) Have Significant Related-Party Deals The Rossy family launched Dollarama from its legacy retail chain in 1992 and owns significant real estate assets that are employed by the enterprise This may have played a role in managementrsquos recent decision to acquire Dollaramarsquos existing Montreal distribution center from the Rossys rather than open a second distribution facility in western Canada as have most peers
bull CEO Stepped Down And Installed His Son Larry Rossy stepped down as CEO in 2016 (and as Chairman in 2018) selecting as his replacement his son Neil ndashpreviously Dollaramarsquos Chief Merchandising Officer We question whether a thorough and arms-length search was conducted to fill this position
bull Opaque Supplier Relationship As part of a deal struck in 2013 Dollarama supplies goods (at an undisclosed profit margin) to Central American discount retailer Dollar City in exchange for an option to acquire the chain in 2020 However Dollarama currently has no formal stake in Dollar City and therefore does not consolidate Dollar Cityrsquos results We are concerned that Dollar City could be overpaying its vendors to lessen the financial burden on Dollarama
bull Insider Ownership Declining Former CEO Larry Rossy has sold or transferred ~75 of his shares since the 2009 IPO Bain Capital liquidated the last of its shares in 2011 at a split-adjusted price of $5 per share 18th the current price The current CFO owns no shares and regularly liquidates options
Dollarama (DOL or ldquothe Companyrdquo) is a dollar store which following a series of price hikes over the course of several yearsis no longer a true
ldquodollar storerdquo As a result DOL has fallen out of favor with value-oriented customers causing average store traffic to contract and thus
necessitating further price hikes to support SSS growth Management is nonetheless aggressively pursuing unrealistic growth targets even as
competitors flood the discount retail market and threaten its improbable margins DOLrsquos shares trade at a 50 premium to peers in the value
retail space ndash even following a ~20 drop after a disappointing Q2 ndash questionable governance and poor earnings quality notwithstanding
We believe that DOL will continue to miss lofty investor expectations and that its premium valuation will continue to be pressured
7
Spruce Point Believes Dollarama (TSX DOL) Is A ldquoStrong Sellrdquo With ~40 Downside Risk
Questionable Accounting Techniques And Capital Allocation Decisions Weaken Quality Of Earnings And Financial Position
bull Currency Hedge Supposedly A Pure Offset To CAD Depreciation But Has Been A Material Profit Center Dollarama claims to hedge currencies only to lock in consistent prices (in CAD) on which its customers can rely However in practice the Company adjusts prices to match non-hedged competitors leaving us to wonder why it hedges at all Much of the recent hedge benefit appears to have reversed but gross margins ex-hedges conveniently rose by just enough over the last two years to maintain steady profitability If nothing else we question whether Dollaramarsquos elevated margins are sustainable
bull Tenant Allowances And Leasehold Improvements Are Amortized Over Very Different Periods While accounting rules may give sufficient leeway to permit this difference we question why lease term assumptions should differ for these two capital accounts Earnings quality suffers notwithstanding
bull Sales Of Certain Assets Such As Vehicles Appear To Be Completed At Above-Market Prices While the financial impact of these moves is difficult to quantify (perhaps due in part to Dollaramarsquos opaque relationship with Dollar City) the liquidation of certain assets is significant in some quarters
bull Leverage Is Increasing Dollarama makes long-term financing decisions using short-term debt the cost of which has risen with recent debt issuances andis likely to continue to increase with rising interest rates ndash and as the Companyrsquos credit profile grows riskier We question managementrsquos decision to increase leverage to support buybacks and dividends simply because the earnings yield is above the after-tax cost of debt We also worry about the state of the balance sheet should the economic environment turn or should the business decline more rapidly
bull Depreciation Is Well Below Capex And Has Been For Years Capital spending easily bests industry peers both as a percentage of sales and vis-agrave-vis steadier DampA charges The mismatch with DampA suggests poor quality of earnings at the very least Meanwhile managementrsquos growth orientation has diverted capital spending away from store remodeling giving stores a stale and dated feel despite rising price points
bull Acquiring Real Estate Flatters EBITDA Acquiring related-party real estate not only lines the pockets of the founding family but also allows Dollarama to shift rent expenses out of the operating line The artificial EBITDA boost helps management to achieve its EBITDA-based compensation targets
Easy To Justify ~40 Downside In DOL Shares
bull Valuation Is Indefensible DOL currently trades at a ~50 premium to peers and carries among the highest multiples of any global retailer Higher only are the valuations of cregraveme de la cregraveme global fashion brands ndash Hermes Prada Ferragamo etc Such lofty multiples are inappropriate for a dollar store with serious near-to-medium-term business risks Analyst estimates are not sufficiently skeptical of managementrsquos targets in light of these concerns
bull Even If Nothing Goes Wrong The Stock Is Overvalued Even if Dollarama executes its growth plan perfectly maintains its world-leading margin and retains a hefty valuation premium to its peers the stock is at best fairly valued at ~$43
bull Under More Reasonable Assumptions DOL Stock Is Overvalued By 40 At Current Levels Even assuming that Dollarama achieves full market penetration ndash with no negative impact on per-store revenues from competition or cannibalization ndash the stock is worth $28 under normalized margins and at a multiple closer to peer norms down ~40 from current levels
bull Analysts Bullish But Wavering Dollaramarsquos disappointing Q2 ndash including SSS guidance contraction and a YoY decline in operating cash flow ndash provoked some downgrades but analysts still see ~26 upside in DOL shares regardless We believe that analysts are too trusting of DOLrsquos growth targets but that the Q2 miss put the Company on notice with a number of analysts Further disappointing quarters could bring more drastic analyst revisions
8
Consensus Estimates (CY) 2018A LTM 2019E 2020E
Stock Price $3845 EV Sales 44x 43x 40x 38x
Shares Outstanding 332 EV EBITDA 174x 167x 161x 149x
Market Capitalization 12752 Adj EV EBITDAR 153x 148x - -
Total Debt Outstanding 1880 Price EPS 254x 241x 224x 199x
Less Cash and Equivalents 182
Enterprise Value 14450 Growth and Margins 2018A LTM 2019E 2020E
Operating Leases 1130 Sales Growth 102 84 102 65
Finance Leases 4 EBITDA Margin 255 256 249 254
Adj Enterprise Value 15584 EPS Growth 228 160 130 127
Credit Metrics 2018A LTM 2019E 2020E
Net Debt EBITDA 20x 20x 19x 17x
Adj Net Debt EBITDAR 28x 27x - -
Capital Structure And Valuation
In C$ MM except per share figures or where indicated
At present Dollarama demonstrates impressive margins and is not egregiously over-levered on a Net Debt-to-EBITDA
basis However as competition increases customers push back against recent price hikes and operating costs creep
upwards we believe that management will have a difficult time maintaining current profitability levels ndash particularly
while pursuing an aggressive growth strategy Leverage will be less sustainable should the businessrsquo performance
decline or the economic environment turn threatening managementrsquos ability to support continued buybacks
dividends while growing store count
Source Dollarama and Bloomberg Estimates
Note Calendar Year Ended Jan 30th
Note Operating Leases valued at 6x Operating Lease Expense
Though analysts
project declining sales
growth they foresee
margin expansion at
the same time This
pair of estimates
makes little sense to
us and should make
investors skeptical of
consensus estimates
Our research will
explain why we
believe margins will be
pressured going
forward
9
Short-Term Debt In A Rising Rate Environment Introduces Refinancing Risk
Significant Short-Term Debt Maturities That Will Have To Be Refinanced At
Higher Rates
Dollarama Has Unhedged Exposure To Interest
Rateshellip
hellipWhile The Three-Month CDOR Rate Rises Rapidly
Source Dollarama
Source Bloomberg
Dollarama refinanced significant short-term debt just last evening levering up the business in the process
Management refinanced its C$400M of 3095 fixed-rate notes due this November with C$500M of 355 fixed-rate
notes due November 2023 Managementrsquos use of short-term debt has burdened the business with refinancing risk in
an environment in which the CDOR rate has risen sharply and is expected to rise for the foreseeable future which has
now forced the Company to bear materially higher interest expenses (compare to its 2203 fixed-rate credit due in
2022) The Company still has C$14B of debt due to mature within the next 12 quarters (including its credit facility)
leaving it exposed to further rate increases The Companyrsquos weighted average debt maturity is about 35 years
320
680
DOLCN Credit Breakdown (C$1875M Total)
Floating Fixed$0
$100
$200
$300
$400
$500
$600DOLCN Debt Maturity Schedule (by CY Quarter)
Available in Revolving Credit Facility Maturing Sep 2023 Available in Revolving Credit Facility Maturing Sep 2020
Series 2 Variable Rate CDOR+59bp Series 3 Variable Rate CDOR+27bp
Fixed Rate 2203 Fixed Rate 2337
Fixed Rate 355
10
Will Dollarama Be The Next Bain Capital-Led Failed Retail IPO
ldquoTwenty-two percent of Bain LBOs from 1984 to 1992 went bankruptrdquo according to Eileen Applebaum in her book
ldquoPrivate Equity at Workrdquo1 Recent Bain-led retail busts include Toys ldquoRrdquo Us Guitar Center and Gymboree
Company DateEnterprise
ValueBain Capital Quotes Outcome
Toys ldquoRrdquo Us March 17 2005 $6600
Toys R Us and Babies R Us are premiere franchises with strong global brand recognition and a collection of high quality product offerings
including toys childrens apparel and baby products and accessories We are excited by the prospect of partnering with the management team and
employees to strengthen the long-term operating and financial performance of the businessesldquo -Matt Levin a MD at Bain
Toys ldquoRrdquo Us Files For BankruptcySept 2018
MichaelsStores
July 1 2006 $6000
We are delighted to partner with the Michaels management team to help build on its already strong position in an attractive industry and
capitalize on the significant growth opportunities that lie ahead Our deep experience in the retail sector reinforces our conviction that Michaels has
the best store locations a broad and attractive assortment of products for crafters of all ages and a sustainable competitive advantage thanks to smart investments in systems and infrastructure We look forward to helping Michaels achieve its full long-term potentialldquo ndash Matt Levin MD
IPO prices at low end of range (June 2014)
Share Price Hits Multi-Year Low in Oct 2018
As SSS Decline
Guitar Center June 27 2007 $2100
ldquoAs the leading retailer of musical instruments in the US Guitar Center enjoys great brand recognition among musicians nationwide a loyal
customer base and a track record of significant growth We look forward to working with the Companyrsquos experienced and capable management
team to continue to build the businessrdquo Jordan Hitch a MD at Bain
The End of Guitar Center
AndGuitar Center Troubles
Only Getting Worse
Gymboree Oct 22 2010 $1800
Gymboree is a terrific company with incredible brand strength and a large population of extremely satisfied customers We look forward to
working with Matthew McCauley and the companys proven and experienced management teamldquo Jordan Hitch MD at Bain Capital
Gymboree Hires Restructuring Counsel
1) Source ldquoBain Capital Sees High Profile Buyouts Go Bustrdquo NY Post March 2018
A Low-End Retailer With Unsustainably High Margins
12
Undifferentiated Goods amp Knock-Off Products
Dollarama sells undifferentiated low-priced consumer goods competing almost entirely on price Many of its products are
knock-offs It is no surprise that the Company has been sued by several companies for trademark infringement
How Dollarama became the retail king of knockoffsSelling cheap imitations of more expensive brands has turned Dollarama into one of Canadarsquos most
successful retailers earning it big bucks and plenty of lawsuits (Source)
ldquoI think they have good lawyers working
for themrdquo says David Lipkus a lawyer
specializing in anti-counterfeit in Toronto
who has helped clients sue businesses in
Canada selling knock-offs ldquoOften
retailers make mistakes and end up
selling fakesrdquo Many lawsuits are settled
privately but the store has been sued
by Nike for selling counterfeit
footwear emblazoned with Nikersquos
iconic basketball player silhouette and
by Umbra a home decoration company
for selling a style of waste basket In
February 2017 Dixon Ticonderoga
launched a suit against the dollar
store chain for a pencil itrsquos been
selling since 2002
Dollarama sells a wide range of discounted knock-offs across product categories
Its business invites litigation
Brazen mimicry multiple knock-offs
of a single producer (Mars)
Source
13
Per-Store Traffic Growth Stagnant But Opportunities For Price Increases May Be Exhausted
Growth in per-store sales has been driven by transaction size growth against declining per-store traffic Transaction
size growth has itself been driven by sales of higher-priced items Dollaramarsquos maximum price point has risen from
$1 prior to FY 2008 to $2 in FY 2008-09 to $3 in FY 2012 to $4 in FY 2017
Contracting store traffic puts per-store sales growth at risk absent further price increases but we question whether
price-driven SSS growth is sustainable as higher prices erode Dollaramarsquos value proposition and put it in closer
competition with more comprehensive big-box retailers Management has expressed reluctance to raise prices further
in the near term regardless (though they said the same when the max price was bumped to $3 several years ago) With
recent price increases now lapping for the first time SSS growth may be at risk
Growth has been propped up by price increases which have made its products more expensive than those at dollar store peers
Between a rock and a hard place Does management continue to erode Dollaramarsquos value proposition with price increases or
keep prices steady and hope for traffic contraction to reverse
Average Quarterly YOY
Growth in Per Store Traffic
-18 since Q1 2014
Transaction
size growth
decelerating
14
Increasing Average Unit Revenues Is A Very Risky Strategy That Has Failed Before
Raising price points to prop up SSS growth against falling store traffic is a major risk for discount retailers as their
entire value proposition comes from their low prices Higher prices may turn off customers and create difficult
comps in the event that price increases must be paused or reversed due to customer pushback
In 2006 for example Big Lots ndash a US discount retailer ndash introduced higher-ticket brand-name items in place of
comparable budget goods in an effort to get customers to spend more per visit This strategy reinvigorated same-
store sales growth for a time but ultimately failed Subsequent difficult comps resulted in negative SSS growth after
management abandoned its so-called ldquoRaise the Ringrdquo strategy
Raise the Ring is
abandoned lower price
points are emphasized
Raise the Ring is
introduced higher priced
items are emphasized
Big Lots alienated shoppers who were
seeking cut-price name-brand goods after
venturing into other areas
like selling frozen food
ldquoOur customer doesnrsquot come to us expecting a
Nordstromrsquos level of in-store shopping
experience They want value treasures
merchandise on the floor and clean restrooms
and we need to meet those expectationsrdquo
[CEO Steve] Fishman said in 2005
hellip
ldquoWersquore an enigmardquo he said at an investor
conference this month ldquoItrsquos been a real
challenge for the marketplacerdquo Source
Calls with industry experts indicate that Dollarama is losing more price-conscious customers to Dollar Tree and other discount retailers
following its efforts to raise prices and that this is a major driver behind recent per-store traffic declines
If price-conscious customers arenrsquot interested in shopping at Dollarama we wonder who ishellip
15
ldquoNothingForADollaramardquo Customers Becoming Conscious Of Price Increases Versus Competitors
Dollaramarsquos price increases may not yet put its prices on par with those of big box retailers like Walmart but
customers have taken notice that Dollarama has increased prices against other Canadian dollar stores Comments
from various internet forums and news sites reveal that customers no longer believe that Dollarama offers as much
value as do other discount retailers suggesting that the strength of Dollaramarsquos value proposition ndash the source of
its appeal and foundation of its business model ndash is at risk The below comments are anecdotal but comments of
this sort regarding Dollarama in particular are nonetheless common among relevant websites
ldquoThe dollar store is no longer a bargain if you
shop around you can by the same things
cheaper or same price elsewhere quit
calling it dollarama no more dollar thingsrdquo
Source
ldquodollar tree here is drastically cheaper then
dollarammardquo ndash Cody Williams
ldquoCody Williams Same here Dollarama is not
really a dollar store anymorerdquo ndash JJ Walker
Source
ldquoI enjoyed the days when everything in Rama
actually was a dollar I go to Dollar Tree
more often now just because everything
there is $125 - ($1 in the US of course)rdquo
Source
ldquoTheir high prices is the problem they still
have better selection than Dollar Tree but
their prices are always higher I know some
dollar store shoppers who go to Dollar
Tree first for the better prices and then go
to Dollarama for the stuff they couldnt
find at Dollar Tree Myself personally have
watched the prices creep up A pair of work
gloves climbed from $250 to 4 or 5 bucks
the discount over Home Depot is only a
buck or two now Also Dollar Tree still
keeps all items under 2 bucks I believerdquo
Source
ldquoThey gonna have to change the Dollarama
name soonrdquo
ldquodollarandaquarterramardquo
ldquoNew Name NothingForaDollarrdquo
ldquoYou forgot lsquoramarsquo NothingForADollaramardquo
ldquoAs for a new name how about
FiveFinaramardquo
ldquofive or lessarmardquo
Source
ldquoDollarRama is no longer in the same
category since they sell at higher prices
more of a discounted store and not a dollar
storerdquo
Source
Just did a quick check of my cleaning cupboard
DT=Dollar Tree DM=Dollarama
- 284L bleach $125 at DT Sometimes they even
have the big 37L bottles Never seen bleach that
cheap at DM
- 976ml Fabric Refresher $125 at DT DM sells it for
$150 and its a smaller bottle
- Oxy First Force spray cleaner $125 at DT $150 at
DM
DT also has a selection of other spray cleaners at
$125 while even other no name ones at DM can go
up to $2
- No name dish soap 1479ml (almost 15L) for $125
at DT 500ml for a $1 (or I guess $125 soon) at DM
- No name Mr Clean sponges At DT its two full
sponges for $125 At DM each sponge is half Mr
Clean cleaner sponge and half normal cheap sponge
- Those square no name tupperware containers that
are 3 for $125 at DM are 4 for $125 at DT
At the dollar-ish level everything Ive found at DT
has been a better value and equal or better
quality
Source
16
Transitioning Away From ldquoDollar Storerdquo Identity Threatens Customer Loyalty
Perhaps in recognition of the fact that Dollarama is losing its status as a true dollar store and that it now belongs to a
different category management has stricken almost all references to ldquodollar storesrdquo from Company filings This poses
a major threat to Dollaramarsquos customer appeal as evidenced by traffic trends and anecdotal customer reactions
FY 2017 Annual Information Form FY 2018 Annual Information Form
17
Margins Are Inexplicably High And Perhaps Unsustainable
We acknowledge that Dollarama is a strong operator with a strong value proposition (though perhaps a declining one) However
we question whether a discount retailer reselling Chinese knock-offs should garner among the highest operating margins of all
global retailers and whether a discount retailer with declining per-store traffic can continue to rely on price hikes for SSS growth
Dollarama stands out among global consumer companies and retailers ndash
45th out of 584 global retailers by operating margin (and 12th out of 584
global retailers by revenue multiple)
Dollarama consistently produces operating margins materially higher than
industry peers and higher than historical industry norms This gap has
only grown more substantial through the last five years
0
5
10
15
20
25
FY 2008 FY 2009 FY 2010 FY 2011 FY 2012 FY 2013 FY 2014 FY 2015 FY 2016 FY 2017 FY 2018
Peer Median Operating Margins vs Dollarama
Peer Median DOL CN
-10
-5
0
5
10
15
20
25
FY 1
989
FY 1
990
FY 1
991
FY 1
992
FY 1
993
FY 1
994
FY 1
995
FY 1
996
FY 1
997
FY 1
998
FY 1
999
FY 2
000
FY 2
001
FY 2
002
FY 2
003
FY 2
004
FY 2
005
FY 2
006
FY 2
007
FY 2
008
FY 2
009
FY 2
010
FY 2
011
FY 2
012
FY 2
013
FY 2
014
FY 2
015
FY 2
016
FY 2
017
FY 2
018
Dollarama Operating Margins vs Peers
DG FDO DLTR FRED BIG DOL CN
Source Bloomberg EQS function Source Dollarama and company filings
18
Debit Card Boost Is Played Out
Dollarama management has characterized the benefit from debit cards as being roughly a doubling in average purchase size
If true this benefit would be visible in year-over-year sales comps
The Company has not always disclosed penetration ndash and they ceased doing so after Q4 2016 ndash but the data suggest that the
average annual comp benefit was approximately 25 from FY 2013-16
Source Dollarama
00
05
10
15
20
25
30
35
40
45
0
10
20
30
40
50
60
Debit Card Penetration and Imputed Comp Benefit
Debit Card Penetration (LHS) Comp Benefit (RHS)
19
Have All The Levers Been Pulled
Dollarama has done a good job of increasing per-store revenue while investing in initiatives designed to remove operating
expenses We cannot fault management for pulling levers to expand margins but we believe the low-hanging
(and high-hanging) fruit has already been harvested
Management has also taken creative measures to raise effective average prices without raising prices directly ndash eg by
strategically replacing some lower-priced goods with close substitutes at higher price points and by reducing the size of
product bundles (pencils candies etc) without cutting prices Such back-door avenues to margin expansion may be exhausted
by this point as noted previously customers are beginning to notice that Dollarama no longer offers a value proposition
comparable to competing dollar stores
FY 13 FY 14 FY 15 FY 16 FY 17 FY 18
Revenue LeversAdd $250-$300
Price PointsDiscounting With Hedged Margins
Add $350-400 Price Points
Accept Credit and Debit Cards
Cost LeversDollar City
RelationshipNew POS Terminals
Kronos Labor Scheduling
Wi-Fi amp ScannersNew Warehouse
ConstructionWarehouse Expansion
Accounting and Financial Levers
Depreciation Schedule Change
Direct Profit from Currency Hedges
Leveraged Share Repurchase
ldquoThanks and good morning In the write up in the
discussion of the foreign exchange headwinds
and gross margin you also said you made select
changes to your product mix I am just wondering if
you could elaborate are there certain categories
thatrsquos your emphasizing in certain categories you are
deemphasizing I am just wondering what that
sentence really meantrdquo
- Peter Sklar BMO Capital Markets
ldquoIts really an item by item discussion Where the
compelling value remains and we are able to take for
example two pencils out of a pack and still be
competitive to help with offsetting some of the
headwinds thatrsquos the way we handle it or in other
cases if we replace the product with a new offering
thatrsquos just as compelling but different at a lower
cost potentially Thatrsquos another way Buyers can use
that tool to help them with the current challengesrdquo
- Michael Ross CFO Dollarama
Is this a sustainable practice as value-oriented customers lose faith in Dollarama
FY 2016 Q4 Earnings Call QampA
20
Costs Rising On Multiple Fronts
While management may have largely exhausted avenues for price increases and efficiency gains other industry and Company
developments threaten to drive up costs through the near term
Cost Driver Explanation
TariffsA significant share of goods (~20 according to industry experts) are sourced either directly or indirectly from the US Tariffs could increase costs on these goods materially
Minimum Wage Hikes
Provincial minimum wages in Canada generally rise much more frequently than do US minimum wages and many are scheduled to rise on an annual basis based on CPI growth Minimum wage hikes have been particularly significant of late (see below) Even provinces whose minimum wages are not tied to CPI growth have seen or are set to see material minimum wage hikes in the near future Notable recent and near-term changes are as follows
bull Alberta From $1360 to $1500 on October 1 2018 (103 increase)bull British Columbia From $1265 to $1385 on June 1 2019 to $1460 on June 1 2020 and to $1520 on June 1 2021 (63 CAGR)bull Ontario From $1160 to $1400 on January 1 2018 (207 increase) and to $1500 on January 1 2019 (additional 71 year-over-year increase)
Will rise according to Ontario CPI growth every October 1 each subsequent year New Ontario Premier Doug Ford is looking to reverse these plansbull Quebec Just increased to $1200 (+66 in May 2018) Significant political push to set provincial minimum wage at 50 of average provincial
minimum wage by 2020bull Manitoba New Brunswick Newfoundland Nova Scotia Ontario Saskatchewan and Yukon Annual minimum wage hikes according to national or
local CPI growth
Employee remuneration for FY 2018 was just over 10 of Dollarama revenue This cost item could realistically grow at a high single-digit rate over the next 2-3 years even if headcount is reduced
Transportation and Logistics
Industry experts have expressed concerns regarding near-term transportation cost increases These would hit Dollarama particularly hard as Dollarama is unique among industry peers It has only one distribution center Rather than invest in a second Dollarama recently purchased its existing distribution center in Montreal ndash which it previously leased from the Rossy family ndash for $394M (in addition to $232M spent on adjacent land) Other large Canadian value retailers generally have two distribution centers ndash one in the eastern half of the country and one in the western half
Rising fuel costs could result in materially higher transportation expenses as Dollarama distributes 92 of its merchandise through its single distribution center Industry experts suggest that shipping goods to Vancouver from Montreal via truck can be almost twice as expensive as shipping to Vancouver from China
We find it interesting that Dollarama chose to purchase property from managementrsquos family rather than follow industry norms and open a second distribution center in western Canada and that five of its six warehouses ndash all located in greater Montreal ndash are also leased from the Rossy family (the sixth warehouse is company-owned built on land purchased from the Rossy family)
MarketingDollarama has historically operated with no marketing expense However US peers spend 1-2 of revenue on average on marketing (see subsequent slides) As competition increases across the Canadian discount retail industry management may be forced to expand marketing efforts
21
Minimum Wage Growth Historically High And Accelerating Rapidly
Canada has seen fairly consistent minimum wage hikes since 2000 and minimum wage growth has outpaced inflation in all but
three years since the beginning of the millennium Dollarama has been able to manage minimum wage hikes and maintain
impressive margins since going public in 2009 Note however that minimum wage growth from 2009-17 was comparatively mild
relative to the prior half-decade Accelerating minimum wage growth through the near term will test managementrsquos ability to
insulate margins from rising labor costs
0
2
4
6
8
10
12
14
2001 2002 2003 2004 2005 2006 2007 2008 2009 2010 2011 2012 2013 2014 2015 2016 2017 2018YTD
Minimum Wage Growth Consistently Ahead of Inflation and Accelerating Rapidly
Weighted Average Minimum Wage Growth Canadian CPI Growth
Minimum wage growth across all Canadian provinces weighted by
province population
Management states that the vast majority of employees make more than minimum wage Nonetheless minimum wage hikes of 10-20 in
Canadarsquos most populous provinces could put material upward pressure on labor costs ndash particularly if these hikes spread to Quebec where
Dollaramarsquos distribution center and all of its warehouses are located Management includes a risk factor to this effect in its MDampA
210
215
220
225
230
235
240
245
250
255
260
FY 2018 EBITDA Margin FY 2018 EBITDA Margin with5 Labor Cost Hike
FY 2018 EBITDA Margin with10 Labor Cost Hike
EBITDA Margin Sensitivity to Labor Cost Hikes
12 weighted average minimum wage growth across Canada driven by
207 hikes in Ontario Average minimum wages could very realistically
continue to grow at high single-digit rates through the next ~2 years if
planned hikes are enacted
With labor costs representing about 10 of Dollarama revenue
profitability is materially sensitive to changes in this item
If labor costs were 10 higher in FY 2018 EBITDA margins would have
been slashed by 80 bps
Labor cost expansion of this magnitude would be significant but is not
necessarily out of the question within 2-3 years
Source Government of Canada
22
Lack Of Transparency Regarding Dollar City Is A Serious Concern
CEO Larry Rossy
and
CFO Michael Ross
mischaracterized
the sale by
attributing it to
vehicles which
has its own
categoryhellip
Why are Dollarama shopping carts being repurposed for Dollar City use
Perhaps they were sold above-market to Dollar City in FY 2013 when the relationship began Could this be the
reason for an unexplained $149M disposal of leasehold improvements that year
Source
1) Dollar City website and press
release announcing the relationship
Q ndash Keith Howlett ldquoOn Note 5 [of the FY
2013 Annual Report] I was trying to figure
out the leasehold improvements there
seemed to be some items called lsquodisposals
at costrsquo and therersquos sort of an offset thererdquo
A ndash Larry Rossy CEO ldquoI donrsquot know what
they are Yoursquore going to have to help me
out guys hererdquo
A ndash Michael Ross CFO ldquoDisposal of costs
that would be fixtures or related tohelliprdquo
A ndash Rossy ldquoI would say carsrdquo
A ndash Ross ldquoCars Yeah okay We sold a
few carsrdquo
Q ndash Howlett ldquoOh I see okay Well it
shows up as CAD 15M for a year thatrsquos a
lot of carsrdquo
A ndash Rossy ldquoOh itrsquos a very expensive
carrdquo
Source FY 2013 Q4 Earnings Call Source Dollarama
2013 Annual Report
In 2013 Dollarama entered into an agreement to export and sell products to Dollar City a Latin American dollar store with a
presence in El Salvador Guatemala and Colombia In exchange for selling goods to Dollar City ldquoat costrdquo plus a small markup
and providing business and operational expertise Dollarama was given an option to acquire the chain exercisable in February
2019 (since extended to February 2020)
Details about Dollar City are scarce Who is the management Where is company headquarters Who are the shareholders
Dollar Cityrsquos website provides limited information and not a single Dollar City manager was quoted at the initiation of the
relationship1 Though management claims to sell to Dollar City ldquoat costrdquo with a markup we have no way of determining how they
are calculating ldquocostrdquo It is more likely that Dollarama loads shared costs into the Dollar City bill that flatter Dollaramarsquos margins
and sells merchandise that isnrsquot selling well in Dollarama stores to Dollar City
More Competition Coming To An Already-Crowded Space
24
Evidence Of Dollarama Store Growth Slowing
The pace with which Dollarama opened stores through the past several years does not appear to be sustainable
Importantly the inevitable reversal in its pacing appears to be occurring this year
The Company opened just eight stores in Q2rsquo19 its lowest store opening count in any quarter of any recent year
Its YTD FY 2019 pace of 18 new stores is also trailing the average pace of recent fiscal years (28 openings) by
~35 Management did not provide a fully satisfactory explanation for this deficit
The slowdown in its pace of store openings could suggest that the Company is having a difficult time identifying
economically-viable locations as it seeks to grow its store count by close to 50 ndash still a very distant target
Fiscal YearStated New
Store Opening Goal
Q1 Q2 First Half Q3 Q4 Total
2019 60-70 10 8 18
2018 60-70 13 17 30 10 25 65
2017 60-70 8 13 21 18 26 65
2016 None 17 17 34 16 25 75
Source Dollarama financial filings
ldquoI want to ask about the pace of store
openings As you noted the slower start to
the year you did maintain the guidance for
this year But wondering about sort of further
beyond that obviously the store potential that
you put out there gives you room to remain at
that pace for a while But does the slower
same store sales assumption change your
thinking about how aggressively you want
to push new stores out thererdquo
- Mark Petrie CIBC
ldquoNo it does not It does not And that I would
also add that if the pace at which weve been
opening stores this year is slower than last year
as mentioned often that just relates to the
specific timing of real estate And if stores are
pushed closer to the end of the year it could be
that there is an overlap between a few more
stores at the end of this year or a few more
stores in the beginning of next year and the
end it will keep our pace of 60 to 70rdquo
- Michael Ross CFO Dollarama
ldquoReal estate timing issuesrdquo
do a poor job of explaining a
drop in H1 new store
openings of over a third
Source Dollarama Q2 FY 2019 Earnings Call
25
Dollarama Potentially Pushing The Limits Of The Canadian Market
Managementrsquos stated goal is to have 1700 stores across Canada by 2027 up from 1178 stores today We do not
believe that it can achieve this without risking significant cannibalization DOLrsquos target would imply a saturation level
higher than the largest US dollar stores (Dollar Tree and Dollar General) which also sell many more consumables and
grocery items Additionally Canada broadly has much lower levels of retail space per capita than the US suggesting
that Canadian concentration is even more pronounced all else equal
US Retail Square Footage Greater Than Canadian
Retail Square Footage
DOLrsquos Target Implies
Greater Than US
Saturation Despite
Narrower Concept
Source Wellington Management
Walmart is not opening stores in Canada suggesting that it believes
the Canadian market is saturated at 114 stores per million people ndash
about 69 of its US concentration (164 stores per million people)
Meanwhile Dollarama continues to expand within Canada despite
even higher Canadian concentration (327 per mil) relative to the US
concentration of large US dollar stores (452 per mil for a 72
ratio) This ratio would be over 100 at DOLrsquos 1700 store target
Higher Canada store
count vis-agrave-vis
comparable US
store count
compared to Walmart
Higher Canada store
concentration vis-agrave-
vis comparable US
store concentration
than Walmart
Retailers with similar store concentrations per capita across both the US and
Canada are effectively more concentrated in Canada vis-agrave-vis the total retail space
in either country
Store Count by Region
Canada US CanUS Ratio
WMT 410 5358 77
DOL ndash Present 1178 14750 80
DOL ndash Future 1700 14750 115
Store Count per Million People by Region
Canada US CanUS Ratio
WMT 114 164 69
DOL ndash Present 327 452 72
DOL ndash Future 472 452 104
DOL CN DG DLTR
Stores 1700 14760 14732
Population (M) 36 326 326
StoresCapita (M) 472 453 452
26
Dollarama Has Benefited From A Benign Competitive Environment
Large competitors have been shuttering Canadian stores continuously through the last four years due to company-
specific issues highlighted by the high-profile exits of Target and Big Lots from Canada12 We believe that this has been
a significant tailwind for Dollarama but one that is largely behind the Company at this juncture
Dollarama has been able to maintain significant share high margins and high returns on capital in large part due to
missteps among peers and the resulting lax competition This is likely unsustainable in a more competitive environment
as Dollarama has few material competitive advantages barriers to entry are low and its discount retailing strategy is not
unique Competent competition from growing industry players ndash Dollar Tree Canada Miniso and Amazon among others
ndash could be the straw that breaks the camelrsquos back for Dollaramarsquos profitability or growth (or both)
Fiscal YearCompany Exiting
CanadaStores Closed Revenue
DOL Revenue Capture
(Estimated)
Estimated Revenue Benefit
Revenue Boost
2018 Sears 200 $2000 3 $60 2
2017 Sears 100 $1000 3 $30 1
2016 Target 133 $2000 6 $120 4
2015 Big Lots 78 $155 10 $16 1
Last Four Year Average $56 2
Note All numbers are SPCM estimates
1) ldquoTarget Canada to close all stores by April 12rdquo
2) ldquoBig Lots Getting Back Out of Canadardquo
27
Light Competition Has Allowed The Company To Spend Nothing On Promotion ndash Until Now
Dollarama has no promotional expense Meanwhile promotional expenses average 1-2 of revenue among US
peers As established competitors continue to expand and as new competitors enter the market (Amazon included)
Dollaramarsquos no-cost marketing strategy may prove untenable
Promotional Expense
as a of Revenue
Intensifying Competition Threatens Dollaramarsquos
Passive Marketing Strategy
2016 2017 2018
BIG 180 180 170
FIVE 264 270 243
DLTR 021 029 048
DG 062 054 044
Average 132 133 126Source Huffington Post
Source Investorscom
The Canadian operation is also a relatively small part of the business However early results are
encouraging and despite competition in the Canadian market Dollar Tree has found success Longer
term the company is aiming for 1000 stores north of the border which does not seem unrealistic
Source Retail Environments
Calls with people at Dollar Tree suggest that the Company is working to
imitate elements of Dollaramarsquos strategy and store layout in its own
Canadian stores (eg raised shelves etc) and that it plans to expand
into Canada aggressively once its strategy is refined ndash likely in 2019
Source Company financial filings
28
Caught Between The Competition How Will Dollarama Fit In
Dollar Tree has maintained its reputation as a true dollar store nothing is priced higher than C$125 ($1 in the US)
Miniso has developed a reputation as a ldquonicerrdquo discount retailer items can cost up to C$25 but the environment is cleaner and
more modern and products are of better quality (but you can still get a dollar-level deal ndash most products are priced under C$10)
Dollarama has all the character of an old tired dollar store but without the dollar prices
Who will shop there unless management invests in store updates rather than opening new stores
Value-driven customers are by definition not loyal customers
Miniso
Clean and modern but cheap
Dollar Tree
No need for price tags everythingrsquos $1 Dollarama
Looks like Dollar Tree priced like Miniso
Irsquoll pass
29
Dollarama Makes No Effort To Appeal Millennials ndashThe Next (And Current) Shopping Generation
Dollarama has zero social media presence unlike all of its peers Not only is the Company out of touch with customers in
an industry which demands a high level of customer engagement but its brand is becoming demonstrably stale
Facebook Twitter Instagram YouTube LinkedIn Pinterest Google+
Dollar Tree Yes Yes Yes Yes Yes Yes No
Dollar General Yes Yes Yes Yes Yes Yes Yes
Family Dollar Yes Yes Yes Yes Yes Yes No
Big Lots Yes Yes Yes Yes Yes No Yes
Miniso (Canada N America)
Yes Yes Yes Yes Yes No No
Great Canadian Dollar Store
Yes Yes No No No No No
Dollarama No No No No No No No
Until now Dollarama has largely been a regional brand with satisfactory name recognition in its provincial home of Quebec
Now that the Company is making a bigger push into Anglophone Canada management should be more proactive in adapting its
strategy to new markets and to a new customer base Yet management continues to employ a strategy more befitting a sleepy
regional business it does not market or work to improve its brand it does not stay current with trends it keeps management
within the family and it is not expanding its logistics chain to support coast-to-coast growth (see subsequent slides)
Management wants Dollarama to be a national brand but it does not appear prepared to run a national business
Questionable Accounting And Financial Practices
31
Hedging Instruments A Material Source Of Profits In Recent Years
Dollaramarsquos sales are in Canadian dollars whereas a majority of its product purchases are US dollar-linked Management claims to enter
into CADUSD hedging arrangements to lock in near-term margins without having to adjust prices in response to FX movements However
management has nonetheless admittedly adjusted prices alongside unhedged peers in response to shifts in the CADUSD exchange rate
rendering its currency hedges a source of profit
Forex dynamics through the last two years have erased the large hedge benefit realized by Dollarama in FY 2016 but management reports
that gross margins have effectively remained flat through this period implying significant gross margin improvement in the underlying
business (see graphs below) As the currency hedge benefit has reversed through the last two years underlying gross margins have
purportedly risen by EXACTLY ENOUGH to keep total gross margins steady between 39-40 We find this oddly convenient ndash or at the very
least we question whether management will be able to maintain steady margins in the face of unfavorable FX rate dynamics in the future
Quick turnaround in
underlying
profitability Just in
time to keep the
declining forex hedge
benefit from dragging
down marginshellip
Even as FX hedge gains fell
from close to 8 of gross profit
in FY 2016 to a drag on gross
profit in FY 2018 gross margin
expanded by over 100 bps over
the same period implying gross
margin expansion ex-forex of
almost 300 bps within two years
for a retailer with gross margins
which were already unusually
high and whose margins had
contracted for four straight
years before the rapid reversal
32
Questionable Depreciation Assumptions
Dollarama changed its depreciation schedule for leasehold improvements (store fixtures) in FY 2015 moving from a 10-year to a 15-
year expected life1 However management did not concurrently lengthen the amortization schedule for tenant inducements
We find this mismatch curious as both quantities should be amortized depreciated over the expected life of a given lease
Adding to the confusion and appearance of foul play DOL discloses in its AIF that its average lease term is just 5 yrs and it just
started disclosing related-party dealing with Director Huw Thomas of SmartCentres ndash a REIT that lists DOL as a top 10 customer23
Lease term implied
by leasehold
depreciation expense
2-3x greater than that
implied by
amortization of
tenant allowance
Mismatch in implied
lease term
inappropriately
inflates EBIT
C$ MillionsFY
2013FY
2014FY
2015FY
2016FY
2017FY
2018
Amortization of Tenant Allowance $29 $35 $43 $49 $48 $51
Starting Balance Sheet Amount 168 207 232 280 344 386
Amortization as a of Asset Amount 173 169 185 175 140 132
Implied Lease Term 58 59 54 57 72 76
Leasehold Depreciation Expense $129 $166 $108 $141 $172 $202
Starting Balance Sheet Amount 1182 1348 1762 2113 2499 2867
Depreciation as a of Asset Amount 109 123 61 67 69 70
Implied Lease Term 92 81 163 150 145 142
Tenant Allowance Amortization Using Leasehold Depreciation Schedule
183 255 142 189 237 272
Reduction In EBIT If Both Were Put On Same Schedule (11) (10) (29) (30) (24) (24)
While the financial impact of this adjustment is limited signs of accounting impropriety do not reflect well on management and cast
doubt on the rest of Dollaramarsquos reports and accounting practices
1) FY 2015 Annual Report p 15 DOL also extended its store and warehouse equipment useful lives from 8-10yrs to 10-15yrs The total reduction of these three items was decrease of $10m in
FY15 depreciation expense
2) DOL states in its AIF p 11 ldquoThe Corporation typically enters into leases with base terms of ten years and options to renew for one or more periods of five years each The average time to
expiration of the Corporationrsquos leases is approximately five yearsrdquo
3) See governance slide on Huw Thomas
33
Capital Spending And Distribution Of Cash To Shareholders Are Overextending The Business
What happened
Management claimed in 2011 that the business was sufficiently cash-generative to support growth and dividendsshare buybacks
and that it would be able to pay down debt while pursuing both However debt has ballooned since then with net debt rising 8x
(and close to 3x versus EBITDA growth) Management is effectively levering up the balance sheet to support dividends and share
buybacks with CFO Michael Ross stating that he will continue to repurchase shares as long as the earnings yield remains above
the after-tax cost of debt
ldquoFor the past few years our cash flow has enabled
us to continue to pursue our growth plans and
continue to pay down debt Our free cash flow is
now sufficient to fund both those priorities
while enhancing new to shareholders through
a quarterly dividend payment We are able to
generate the free cash flow to do all of this
because we employ a simple growth oriented
business model at Dollaramardquo
ndash June 2011 Conference Call
Should Dollaramarsquos struggles become more pronounced ndash or should the
economic cycle turn for the worse ndash this debt overhang could loom large over
the business
Dollarama also consistently spends more on capex (as a percentage of sales) than its peers in the discount retail industry and
shows abnormally high capex versus depreciation and amortization We understand that Dollarama is a growing business which
could explain both patterns in part but it is not the only discount retailer which is investing in store growth
Dollarama DampA consistently
lt50 of capex and a lower
percentage of capex than
industry peers
Dollarama consistently
spends more on capex
(as a percentage of sales) than industry peers
00
05
10
15
20
25
0
200
400
600
800
1000
1200
1400
1600
1800
FY2012
FY2013
FY2014
FY2015
FY2016
FY2017
FY2018
Ne
t D
eb
tEB
ITD
A
Ne
t D
eb
t ($
C M
M)
Net DebtEBITDA Net Debt
0
50
100
150
200
250
300
FY2010 FY2011 FY2012 FY2013 FY2014 FY2015 FY2016 FY2017 FY2018
DampA as a of Capex and Intangibles Annual
DOL DLTR DG BIG FRED
0
1
2
3
4
5
6
7
8
FY2010 FY2011 FY2012 FY2013 FY2014 FY2015 FY2016 FY2017 FY2018
Capex and Intangibles as a of Sales Annual
DOL DLTR DG BIG FRED
34
Where Is The Capex Going
Management has explicitly identified and discussed various capital expenditures in Company filings over the last
five years but this still leaves a large gap versus what was actually spent
Additionally there is a large gap between the amount spent on software development and the amortization expense
associated with this activity suggesting that earnings may be inflated
Some of this is
directed towards
leasehold
improvements etc
but with
managementrsquos
focus on expansion
over existing store
improvements we
question where
management is
directing this capex
Capital Spending Software
on Software Amortization Difference
FY 2018 191 126 65
FY 2017 126 96 3
FY 2016 111 78 33
FY 2015 108 56 52
FY 2014 98 34 64
Are earnings
inflated due to
insufficient
amortization
Note also that a LinkedIn search for software developers at Dollarama turned up effectively nothing ndash at best one person with a tangentially
relevant title (source) So where is the software development capex going
Unlike discount retailer peers Dollarama
did not include software-related
spending in capex until recently and
records it separately in
ldquoAdditions to intangible assetsrdquo1
Do they do this to artificially deflate their
headline capex figure thereby inflating
reported free cash flow
Undiscussed Capital Spending (FY 2014 ndash 2018)
C$ Millions
$500K in capex spent per new store (375 new stores over past five years Source AIF) $1875
Capex spent on construction of 500K sqft warehouse in Montreal 679
$82M spent annually on expansion renovation or relocation of stores over five years 410
$232M spent on land acquisition 232
Discussed Capex Over Past Five Years $3196
Total Reported Capex (ex intangibles) $5200
Undiscussed Capex $2004
Software Capex and Software Amortization Discrepancy
C$ MillionsCapital Spending on
SoftwareSoftware Amortization Ratio
FY 2018 $191 $126 152
FY 2017 126 96 131
FY 2016 111 78 116
FY 2015 108 56 193
FY 2014 98 34 288
1) DOL explicitly started calling out software as a component of capex in Q3rsquo16 with the addition of footnote to guidance
35
Lack Of Transparency Regarding Store Closures And Associated Costs
It is standard industry practice to report store closures remodels and relocations alongside new store openings
However Dollarama reports only ldquoNet New Storesrdquo and does not break this number out in detail Questioned on this
in Q4 2016 management answered that a larger store base would inevitably result in more closures for reasons
outside of its control (fires mall renovations etc) and that reporting closures would therefore not communicate
meaningful information regarding the underlying performance of the business
We strongly disagree store closure information is vital to evaluating the health of a retail chain Management can
provide color on particular closures if it feels that they have been done for reasons other than performance but
failing to report closures entirely hides a key operating statistic from investors
Company Store Movement 2012 2013 2014 2015 2016 2017 2018
DLTR
Beginning 4101 4351 4671 4992 5367 13851 14334OpenedAcquired 278 345 343 391 8850 584 603
Closed 28 25 22 16 366 101 102Closed as of Beginning 07 06 05 03 68 07 07
BIG
Beginning 1398 1533 1495 1493 1460 1449 1432Opened 181 87 55 24 9 9 24Closed 46 46 58 57 20 26 40
Closed as of Beginning 33 30 39 38 14 18 28
DG
Beginning 9372 9937 10506 11132 11789 12483 13320Opened 625 625 650 700 730 900 1315Closed 60 56 24 43 36 63 101
Closed as of Beginning 06 06 02 04 03 05 08
FDO
Beginning 7023 7442 7916 -- -- -- --Opened 475 500 526 -- -- -- --Closed 56 26 400 -- -- -- --
Closed as of Beginning 08 03 51 -- -- -- --Overall Industry Average 09 07 20 07 23 07 08
Other high-growth dollar
stores like Dollar Tree and
Dollar General report store
closures ndash why doesnrsquot
Dollarama
Store closures for whatever
the reasons incur real
restructuring and other
costs Peer retailers
generally give detail on these
expenses whereas
Dollarama does not
We believe that Dollarama
should follow industry norms
and increase transparency
regarding store closures
US Dollar Store peers historically close 08 of stores annually yet Dollarama has not reported any recent closures
36
SSS Metrics Obfuscate Store Performance
Dollaramarsquos official ldquoComparable Store Salesrdquo figure includes ldquorelocated and expandedrdquo stores as ldquocomparable storesrdquo
therefore picking up growth in traffic which can be attributed to relocation-related improvements We believe that this likely
overstates Comparable Store Sales growth while also ignoring associated relocation-related expenses
1) See Q1 FY 2014 earnings call transcript
Management not only hides store closure data as a supposedly uninformative statistic but proclaims that it has NEVER closed a
store due to poor performance1 We find it difficult to believe that a retailer which has existed in its current format since 1992 has
never needed to close a store for poor performance If it has indeed never closed an underperforming store we wonder whether
management has been too ambitious in growing its store base without critically evaluating the profitability of each location
Huntsville Place Mall Jul 2015
7 John St Oct 2012
7 John St Jul 2015
Huntsville Place Mall Oct 2012
Huntsville ON
Relocation
Are these really entirely
ldquocomparablerdquo locations
781 Rue Principale Est May 2016
781 Rue Principale Est Jun 2009Le Carrefour Ste Agathe
May 2016
Ste-Agathe-Des-Monts QC
Relocation
Why assume the costs to
make this lt1 mile move
Notice
Dollarama
sign turned
inside-out
indicating
closure
37
Cash Flow Beginning To Turn Over Despite Efforts To Bolster Results
In H1 FY 2019 Dollaramarsquos cash flow contracted on a year-over-year basis for the first time since it went public ndash this
despite managementrsquos efforts to bolster earnings and EBITDA The contraction appears to be due in large part to
changes in working capital In particular we are concerned that growth in inventories suggests that management
overestimated near-to-medium term sales growth and that declining traffic is starting to weigh on the Company
Dollarama H1 Operating Cash Flow
C$ Millions FY 2014 FY 2015 FY 2016 FY 2017 FY 2018 FY 2019
Net Income $1054 $1221 $1603 $1895 $2265 $2433
CFO Before Working Capital 1394 1488 2124 2156 2769 2999
Changes in Working Capital (287) (236) (870) (110) (126) (886)
Net CFO 1107 1252 1253 2045 2644 2113
YoY Change $326 $322 $01 $792 $599 (531)
Source Dollarama
Governance Concerns
39
Related-Party Transactions With Rossy Family Raise Questions Over Governance And Costs
Fiscal YearRent amp Land Purchases
Paid to Rossys(C$ MM)
As a of Compensation Paid to Rossy Family
FY 2019 (To Date) $394 NA
FY 2018 184 1660
FY 2017 402 4459
FY 2016 179 1305
FY 2015 169 2752
FY 2014 163 1903
As noted Dollarama leases all but one of its five warehouses from the Rossy family and recently purchased land from the Rossys
for the construction of a sixth Management also recently purchased its Montreal distribution center from the Rossy family which
leased the facility to Dollarama until this February We understand that the Rossy family has close historical ties to the business
but this level of close dealing draws our attention particularly given the fact that management has focused on fortifying its
existing distribution footprint ndash closely tied to the Rossy family ndash rather than invest in distribution facilities in western Canada
where major competitors already have distribution centers
DLTR
Distribution
Center
Delta BC
DLTR
Distribution
Center
Mississauga ON
DOL
Distribution
Center
DOL
Warehouses
No Dollarama distribution facilities
located outside of a ~4 mile radius in
Montreal
bull Due to preferential relationship with
Rossy family
bull Will Dollarama be able to expand into
AngloWestern Canada efficiently
without logistics costs ballooning
bull Overly-exposed to fuel price hikes
and rising transportation costs
Related-Party Transactions Significant And Growing
Source Dollarama Financials
Dollar Tree Canada Distribution Centers
Dollarama Distribution Centers And Warehouses
Source DollarTree
Montreal QC
40
Related-Party Transactions With ldquoIndependentrdquo Director Huw Thomas Only Recently Disclosedhellip
Dollarama also leases stores from SmartCentres REIT whose recently-departed CEO Huw Thomas joined Dollaramarsquos
Board of Directors in 2011 and was a member of its audit committee through March 2017
His ldquoindependencerdquo was recently defended by a meandering 260-word footnote in Dollaramarsquos proxy which belies the
fact that Dollarama is a top 10 customer of SmartCentres
This is all the more suspicious in light of Dollaramarsquos questionable lease accounting highlighted earlier
Source Dollarama 2018 Proxy Circular
Note Dollarama did not start disclosing Huwrsquos related-party dealing until the 2017 proxy
circular in June 2017 right after he left the Audit Committee in March 2017
SmartCentres 2017 Annual Report
Dollarama Material To SmartCentres ndash A Top 10 Customer
SmartCentres Promotes Dollarama Relationship From 2011
Calloway (now SmartCentres) 2012 Annual Report
Dollaramarsquos Lengthy Meandering Defense Of Thomas
Huw As Independent Only Recently Disclosed (2017)
Dollarama Recently Changed Rent Expense Disclosure
Source Dollarama Q4rsquo17 Financials Note 15 Related Party Disclosure
Source Dollarama Q2rsquo18 Financials Note 13 Related Party Disclosure
41
House of Windsor House of RossyA Case Study In Nepotism
Neil Rossy had been the Senior VP of Merchandising Chief Merchandising Officer for 25 years prior to being named CEO in
2016 While his family is still a large shareholder they are not a controlling shareholder owning around 5 of the shares
outstanding We question whether the Rossyrsquos century-long family tradition of passing down leadership ndash one which also
persists at the Rossyrsquos ldquosister storerdquo ndash is appropriate for a public company or wise for the long-term health of the business
Salim Rossy
Opened first ldquoS Rossyrdquo
store in 1910 (up-market
department store concept)
George Rossy
President of S Rossy
1937-1973
Larry Rossy
Grew S Rossy from 20 to 44 stores before
converting all S Rossy stores to new
ldquoDollaramardquo concept in 1992 Sold majority
stake to Bain Capital in 2004 IPO in 2009
Neil Rossy
CEO of Dollarama as of 2016
Michael Rossy
Brother of George (one of ten siblings)
Founder amp CEO of ldquoRossyrdquo stores 1949-2010
Michael DiTullio
Son-in-Law of Michael
President amp CEO of Rossy since 2010
Does (or will) the family have a hard time parting with a business that has been in the family for four generations even if parting ways is
the right thing to do
Managing retail chains is very
much a family affair for the
Rossys ndash at both stores
Perhaps Neil was going to be
anointed CEO of Dollarama
regardless of the caliber of other
potential candidates
Letrsquos hope hersquos not Commodus
BONUS
Brother branches out
with separate storehellip
42
Insiders Incentivized To Grow EBITDA
Our earlier concerns about EBITDA quality are amplified by the fact that Dollarama executives are compensated
based on seemingly arbitrary and inflated EBITDA targets This gives management a strong incentive to be inefficient
users of capital as any dollar shifted from operating expense to capex has a direct benefit to key executives
For example note that managementrsquos perhaps questionable decision to purchase one of its Montreal warehouses
will shift what was until recently rent expense into depreciation This change in the accounting treatment of
Dollaramarsquos tenancy costs will provide a windfall to EBITDA potentially boosting management bonuses
Source Dollarama Proxy Circular p 30
43
What Is A Stretch EBITDA Goal
Bonuses are paid upon achievement of 11 EBITDA growth This level was ldquodesigned to be a stretch objectivehellip
attainable only with significant effortrdquo However this target was reset lower after FY 2014 ndash the only year during which
management did not handily exceed the target We believe this further calls into question the independence of the
board and its compensation committee
Year EBITDA Growth Objective EBITDA Growth Achieved
FY 2018 11 18
FY 2017 11 18
FY 2016 11 30
FY 2015 11 15
FY 2014 13 12
FY 2013 13 22
FY 2012 13 26
FY 2014 Management
misses growth objective
FY 2015 Growth objective
adjusted downwards
ldquoThe thresholds were revised by the
Human Resources and Compensation
Committee in the context of its annual
executive compensation review
conducted at the beginning of each fiscal
year to take into account among other
elements the fact that the base for the
calculation is growing every yearrdquo
Source FY15 Management Proxy Circular
What ldquoother elementsrdquo were
taken into account
Source Dollarama
44
Insiders Selling While Company Buys Back Stock At Elevated Prices
Management has been buying back shares at elevated prices through the last several years even while pursuing growth leaving little capital for
(sorely needed) store updates or other uses The average repurchase price since Q1 FY17 is about on par with current share prices and ~40
below our target Since Q2 FY18 the average buyback price has been 25 above current levels
Furthermore just as the Company has been buying back stock at elevated prices insiders have been offloading shares Notably it is evident
from past and current proxy statements that CFO Michael Ross has never held onto shares for which he has been granted options his
common equity ownership is listed at zero every year Note that as the CFO it is he who is dictating the share buyback decision in large part
PeriodShares
Repurchased
Value of Repurchase
(C$ M)
Average Price (Split-
Adj) (C$)
Q1 FY 2017 1542066 1393 3011
Q2 FY 2017 2027080 1842 3029
Q3 FY 2017 1571500 1578 3347
Q4 FY 2017 2279522 2241 3277
Q1 FY 2018 1687240 1806 3568
Q2 FY 2018 1303900 1602 4095
Q3 FY 2018 687700 931 4513
Q4 FY 2018 2425700 3788 5205
Q1 FY 2019 94500 145 5115
Q2 FY 20191 1347341 700 5195
Total 14966549 16026 3797
Discount to Current Share Price 1
Total (Since Q2 FY 2018)
5859141 7170 4815
Discount to Current Share Price -20
Using Company Funds To Overpay For DOL Shareshellip While Insiders Sell Into The Companyrsquos Bidhellip
Source DOL filings and Bloomberg
Insider Title Date Sold SharesProceeds (C$ M)
Price Sold (Split-Adj)(C$)
Nicolas Hien Senior Vice President 482016 6203 06 3224
Michael Ross CFO 482016 80000 74 3083
Paul Roche Vice President 4182016 10000 09 3000
Geoffrey Robillard Senior Vice President 6172016 33500 31 3085
John Assaly Vice President 9272016 30000 30 3333
Geoffrey Robillard Senior Vice President 472017 20000 23 3833
Paul Roche Vice President 472017 23100 26 3752
Josee Kouri Corporate Secretary 4142017 8000 09 3750
Geoffrey Robillard Senior Vice President 9142017 5000 07 4667
Geoffrey Robillard Senior Vice President 12112017 10000 16 5333
John Assaly Vice President 12132017 14096 22 5202
Geoffrey Robillard Senior Vice President 1262018 15000 24 5333
John Thomas Independent Director 1262018 6000 10 5556
Geoffrey Robillard Senior Vice President 6152018 50000 75 5000
John Assaly Vice President 6192018 13404 21 5222
Nicolas Hein Senior Vice President 6222018 36750 19 5170
Paul Roche Vice President 6222018 24000 13 5417
We do not like the fact that insiders have been selling into share buybacks while
the Company levers itself up with short-term debt to support those repurchases
It appears that the execs are levering up the business in part to enrich themselves1) All share information prior to Q2 lsquo19 reflects pre-split data except
Split-Adjusted Average Prices Q2 lsquo19 repurchases were as stated
45
Rossy Family Selling Shares Despite Control Over C-Suite
Notably Founder and former CEO Larry Rossy has trimmed his position tremendously through the last several years
Though this is to be expected to some extent as he recently ceded control of the business we believe that his
ownership stake should be held to a higher standard given his insistence on keeping the business in the family
If he plans to keep the c-suite under a Rossy dynasty the familyrsquos personal stake in the business should reflect that
Source Bloomberg
Valuation And Price Target
47
The Market Has Not Taken Threats To Dollarama Seriously ndash But Optimism Is Ebbing
Analysts are generally bullish on the stock focusing primarily on managementrsquos growth story and taking current
profitability levels for granted The prospect of new competitive threats to a business which has until now seen limited
competition ndash and the risk that prevailing margins are unsustainable even through the near term ndash go underappreciated
Dollaramarsquos poor Q2 cooled analystsrsquo optimism to some extent but we believe that the reaction was largely reactive and
superficial as they adjusted their price targets in such a way that in aggregate they saw exactly the same upside after the
post-Q2 dip as they did before The market still does not fully appreciate the magnitude of the threats facing Dollarama
All price targets in C$ Before Q2 Release After Q2 Release
Firm Recommendation Target PriceUpside (on 82818) Recommendation Target Price
Upside (on 9172018)
Upside (Present)
RBC Capital Markets Outperform $5500 12 Outperform $5200 22 35
Raymond James Outperform $5567 13 Outperform $5000 17 30
Macquarie Outperform $5633 14 Outperform $4900 15 27
BMO Capital Markets Outperform $6100 24 Market Perform $4700 10 22
CIBC Capital Markets Outperform $5900 20 Neutral $4600 8 20
Desjardins Securities Buy $5800 18 Hold $4500 6 17
Veritas Investment Research Co Buy $5600 14 Buy $4800 13 25
Industrial Alliance Securities Hold $5450 11 Buy $5450 28 42
Canaccord Genuity Buy $5900 20 Buy $5500 29 43
Barclays Equal Weight $5200 5 Equal Weight $4400 3 14
TD Securities Buy $5900 20 Hold $4900 15 27
Accountability Research Corp Buy $5400 10 Buy $5000 17 30
National Bank Financial Outperform $5567 13 Sector Perform $4800 13 25
Scotia Capital Sector Outperform $5567 13 Sector Outperform $5050 19 31
Wells Fargo Securities Market Perform $5300 7 Market Perform $4000 -6 4
AVERAGE $5626 14 $4853 14 26
While analysts are still not sufficiently critical of Dollarama the more recent downward move in the stock and subsequent analyst
downgrades may suggest that the market could be primed to evaluate the Company and its growth story with a more discerning eye
We believe that the issues which we highlight in this report will provoke further professional skepticism among analysts and investors
48
Dollarama Not Priced To Perfection ndashPriced Beyond Perfection
We can get close to DOLrsquos current valuation only if we value it as a mature ex-growth business today under
managementrsquos lofty goals for the business for ten years into the future applying no discounts for time
business risk etc
Managementrsquos ten-year store target
bull Current store count 1178 (70 of long-
term target)
Even if Dollarama were a mature business today under managementrsquos long-term targets for the business
DOL stock would not have no upside to current share prices
The market is pricing DOL beyond perfection ndash a valuation this lofty cannot be justified today
Mature Business ValuationC$ MM unless noted
Stores 1700
Revenue per Store $32
Total Revenue $5440
Operating Margin 220
Operating Profit $1197
Interest Expense $50
Tax (275) $315
Net Income $831
Diluted Shares Outstanding 332
EPS $251
PE Multiple 152x
Target Price $3815
Upside -1
Average operating margin since Q1 FY 2016
bull Assumes that DOLrsquos unusually high
margins are sustainable despite
intensifying competition loss of recent FX
benefit and customer pushback against
price hikes
Mature revenue per store estimate
bull Current average revenue per store
~$28M (875 of long-term target)
Industry median NTM PE multiple
bull Assigns no discount to DOL due to
declining store traffic vs peers incoming
competitive threats inefficient distribution
network etc
49
Dollarama Not Priced To Perfection ndashPriced Beyond Perfection (Continued)
Put another way The market is implicitly taking it for
granted that Dollarama will achieve its lofty ten-year
growth targets assuming sustained profitability levels
and per-store efficiency ndash and applying close to the
industry median FY1 EVEBITDA multiple to Dollaramarsquos
FY 2027 EBITDA
Just under ten-
year target
What kind of growth is the market implicitly betting on if
we value Dollarama on par with peers
bull 150 more stores than managementrsquos ten-year target ndash
within nine years
bull 48 CAGR in revenue per store
bull Zero margin compression
FY 2027 Estimates if Management Executes Growth Plans Perfectly
(C$ MM unless noted)
Stores (Year-End) 1688
Revenue per Store $33
Total Revenue $5503
Gross Margin 380
Gross Profit $2093
SGampA per Store 04
SGampA Total 689
EBITDA (FY 2027) $1404
Market Cap 12752
Debt 1880
Cash 182
Enterprise Value $14450
EVEBITDA (FY 2027) 103x
Industry Median EVEBITDA (FY1) 110x
Average gross
margin ex-
hedge gains
since FY 2016
Mature revenue
per store
estimate (15
growth CAGR)
FY 2018 SGampA
per Store
Implied FY 2027
multiple close to
industry median FY1
multiple
FY 2027 Estimates To Justify Prevailing Valuation (C$ MM unless noted)
Stores (Year-End) 1858
Revenue per Store $44
Total Revenue $7929
Gross Margin 380
Gross Profit $3016
SGampA per Store 04
SGampA Total 755
EBITDA (FY 2027) $2261
EVEBITDA (FY 2027) 62x
Enterprise Value 13947
Debt 1880
Cash 182
Equity Valuation $12249
Diluted Shares Outstanding 332
Target Price $3693
Current Price $3845
158 over ten-
year target in
nine years
48 growth
CAGR in
SalesStore
Industry median
FY1 multiple
discounted
75 annually
Average gross
margin ex-
hedge gains
since FY 2016
FY 2018 SGampA
per Store
High forecast gives
us 4 DOWNSIDE
50
Valuation Far Out Of Line With Peers And Historical Multiples
DOL shares trade at a 50-60 premium to peers in the discount retail industry The market is valuing DOL much more like a high-
growth tech company than a brick-and-mortar dollar store (and one with concerning fundamental trends at that) Note that this still
holds true even after DOL shares traded down significantly following its recent Q2 earnings report
It is difficult to justify a valuation this high even if one is bullish on DOL vis-agrave-vis the rest of the industry
Company Ticker
3-Year Consensus Revenue
CAGR
FY 2018 EBITDA Margin
PE(NTM)
PE(FY2)
EVEBITDA(NTM)
EVEBITDA(FY2)
EVSales(NTM)
Dollar Tree DLTR 43 121 139x 134x 91x 88x 10x
Dollar General DG 75 104 163x 162x 112x 112x 12x
Big Lots BIG 06 85 87x 87x 52x 53x 04x
Five Below FIVE 210 162 360x 412x 2113x 243x 32x
Canadian Tire CTC CN 20 90 179x 181x 82x 83x 10x
Metro MRU CN 80 73 142x 139x 99x 101x 08x
MEDIAN 59 97 152x 151x 95x 110x 10x
Dollarama DOL CN 85 255 229x 223x 164x 163x 41x
DOL PREMIUM 505 477 727 509 3057
Does DOL ndash a value retailer
demonstrating concerning
fundamental trends ndash deserve
to be valued on par with
higher-growth industries and
completely out of line with its
industry peers
Profitability is impressive but
likely unsustainable in the face
of growing competition
Enterprise Value Revenues Enterprise Value Adj EBITDA Price Adj EPSDOL shares also trade at
a significant premium to
historical multiples
despite unsustainable
margins an increasingly
saturated market and
rising competitive
threats
51
Does The Market Think Dollarama Is A Dollar Store Or A Premium Retail Brand
Dollarama is valued much more closely to premium retail brands than its discount retail peer group
A bull might ldquojustifyrdquo this by pointing to Dollaramarsquos profitability profile and growth expectations but its EBITDA margins are so
out of line with those of its peers that one is forced to question whether they are sustainable (at best) or honest (at worst)
As discussed Dollaramarsquos consensus sales growth numbers also ignore looming fundamental threats to the business
Company TickerGross
Margin (NTM)
EBITDA Margin (NTM)
Sales Growth (NTM)
EVEBITDA(NTM)
PE(NTM)
EVSales(NTM)
Dollar Tree DLTR 31 11 28 91x 139x 10x
Dollar General DG 31 10 89 112x 163x 12x
Big Lots BIG 41 7 -08 52x 87x 04x
Five Below FIVE 36 15 203 2113x 360x 32x
Canadian Tire CTC CN 34 12 40 82x 179x 10x
Metro MRU CN 19 7 88 99x 142x 08x
MEDIAN 33 11 64 95x 152x 10x
Dollarama DOL CN 40 25 99 164x 229x 41x
DOL PREMIUM 727 505 3057
How does Dollarama support EBITDA
margins more than double those of its
peer group and in line with premium
global retail brands
Company TickerGross
Margin (NTM)
EBITDA Margin (NTM)
Sales Growth (NTM)
EVEBITDA (NTM)
PE (NTM)EVSales
(NTM)
Ferragamo SFER IM 65 17 48 160x 260x 26x
Hermes RMS FP 69 38 84 200x 350x 78x
Prada 1913 HK 74 22 78 100x 210x 23x
Tiffany amp Co TIF 64 24 51 113x 196x 28x
MEDIAN 67 23 65 137x 235x 27x
Dollarama DOL CN 40 25 99 164x 229x 41x
DOL PREMIUM 197 -26 519
Does a discount retailer facing
fundamental headwinds deserve to be
priced 50 or more above its peer
group and closer to global
premium retail brands
52
Margins And Multiples Materially Out-of-Line With Peers
We do not believe that Dollaramarsquos profitability levels ndash which are entirely out of line with peers ndash are justified or sustainable in an
industry as competitive as deep discount retail The Company is already struggling to meet store count growth targets raising the
likelihood that its store growth plan will be dilutive to margins The market assigns a premium valuation to Dollarama on the basis
of relatively high growth expectations and the Companyrsquos industry-leading margins However as discussed throughout this
report we doubt both managementrsquos ability to meet its growth targets and its ability to maintain prevailing profitability levels The
likelihood that the Company will be able to achieve BOTH of these goals simultaneously is even slimmer Accordingly we believe
that the basis for Dollaramarsquos substantial share price premium is unfounded
Dollaramarsquos margin profile is grossly out of
line with peers and we find evidence of
aggressive accounting and questionable
business practices that can partly explain the
issue We doubt that this would be sustainable
even if management wasnrsquot growing the chain
How will a lowno-moat business with falling
per-store traffic be able to maintain its
remarkable profitability advantage while
aggressively expanding its store base
DLTRDG
BIG
FIVE
CTCCN
MRUCNWNCN
DOLCN
0
5
10
15
20
25
30
10 15 20 25 30 35 40 45 50
EBIT
DA
Mar
gin
Gross Margin
Dollarama Margins Completely Out Of Line With Peers
The premium in Dollaramarsquos share
price is driven by the marketrsquos trust in
managementrsquos growth initiatives and
its recognition of the Companyrsquos
dominant profitability
However neither its profitability
advantage nor its growth prospects
are sustainable The likelihood that
management simultaneously
preserves BOTH is extremely low
Big Lots (BIG) Dollar Tree (DLTR) Dollar General (DG) Metro Inc (MRU CN) and Canadian Tire (CTC CN)
x
5x
10x
15x
20x
25x
BIG DLTR MRU CN DG CTC CN DOL CN
PE (NTM)
x
4x
8x
12x
16x
20x
BIG DLTR MRU CN DG CTC CN DOL CN
EVEBITDA
53
Valuing DOL As A Mature Business In The Canadian Market ~40 Downside
C$ MM unlessotherwise noted
Current Run-Rate Valuation
Priced Beyond Perfection
Reasonable Downside
Stores 1170 1700 1500
RevenuesStore 28 32 30
Revenues 3320 5440 4500
Operating Margin 23 22 18
Operating Profit 764 1197 801
Interest Expense 42 50 50
Tax 275 198 315 207
Net Income 523 831 544
Shares 332 332 332
EPS $158 $251 $164
Multiple 24x 16x ~15x
Share Price $3845 $3966 $2460
Upside (Downside) 3 Approx -40
As discussed earlier at 1700 stores DOL would have greater penetration than both Dollar General (DG) and Dollar Tree (DLTR)
which both offer a much broader assortment of goods including perishablesconsumables Meanwhile the US appears to be
overstored versus Canada It is likely unreasonable for DOL to target per capita penetration levels on par with its US peers
Even if we assume that DOL can reach similar penetration levels and match company
growth targets ndash with steady margins no less ndash DOL has little upside
Valuing DOL as a mature business at its upper penetration bound implies ~40 downside
in a more realistic yet still generous scenario in which DOL is valued in line with peers
Higher Canada
store count vis-agrave-
vis comparable US
store count
compared to
Walmart
Higher Canada
store concentration
vis-agrave-vis
comparable US
store concentration
than Walmart
Achieving
managementrsquos
1700 store target
would put DOL at a
higher per capita
penetration level
than US peers
Store Count by Region
Canada US CanUS Ratio
WMT 410 5358 77DOL ndash Present 1178 14750 80DOL ndash Future 1700 14750 115
DOL CN DG DLTR
Stores 1700 14760 14732
Population (M) 36 326 326
StoresCapita (M) 472 453 452
Downside Run-Rate Operating Margin Estimate
ProfitabilityCost Measure JustificationGross Margin Target Recent Historical Average 370
Current SGampA Recent Historical Average 167
Add
Advertising Expense Normalization
Industry Average05
Rent Expense NormalizationAdjusting for Depreciation Rearranged
from Rent Expense 05
Depreciation Catch-Up Matching DampA schedules 15
Pro Forma SGampA 192
Pro Forma Operating Margin 178
Store Count per Mil People by Region
Canada US CanUS Ratio
WMT 114 164 69DOL ndash Present 327 452 72DOL ndash Future 472 452 104

4
Spruce Point Has Succeeded In Canadian Shareholder Activism
Spruce Point has written four critical activist reports in Canada In a majority of the cases the share price has met or
exceeded our downside estimate of intrinsic value The average share price decline is 57 A common theme is that
Canadian analysts donrsquot ask difficult questions of management challenge assumptions and are overly optimistic
Company Intertain TSO3 Just Energy Maxar (Formerly MacDonald Dettwiller)
Exchange Ticker TSX IT TSX TOS NYSE and TSX JE NYSE and TSX MAXR
Report Date December 17 2015 August 23 2017 July 31 2013 Aug 7 2018
Stock Brokers WhoSay Said ldquoBuyrdquo
CanaccordMackieNatrsquol BankCormark
CanaccordRBCScotiaGMP CanaccordRBCTDCIBCCanaccordRBCTDCIBCGMPBMO
Natrsquol BankScotia
Spruce Pointrsquos Criticisms
bull Stock promotion of a poorly organized online gaming roll-up
bull CEO FitzGerald has a checkered past with ties to questionable people
bull Ties to Amaya a company being investigated by regulators
bull Management Incentive Program is flawed and unjustly enriches insiders
bull Questionable financial reporting and accounting practices
bull Overvaluation 45-70 downside
bull Poorly promoted Canadian healthcare company with limited product value
bull Disclosure issues obfuscate actual end market sales and overstatement of total addressable market
bull Over-promotion of a partnership with Getinge that would be destined to fail
bull Terrible insider alignment with mgmt owning 1 of shares
bull 80+ downside when Getinge deal fails
bull Growth by deceptive sales tactics of a service with limited value
bull Reckless debt-fueled acquisition spree has stretched the balance sheet
bull Diverting investors from problems by creating metrics that overstate results
bull Dividend at high risk of being cutbull 46+ downside risk to $4share
bull MDArsquos acquisition of DigitalGlobe driven by the need to cover problems in its satellite business including a forthcoming decline in the geostationary satellite industry
bull Brazen accounting scheme including inflation of intangible assets to overstated Non-IFRS EPS
bull Dangerously levered at 58x when taking into account off-balance sheet liabilities make Maxarrsquos dividend at high risk of being cut or eliminated
bull Analyst estimates are too high and goodwill and asset impairment looms
Successful Outcome
bull Intertain initiated a strategic review upon the report release
bull Feb 2016 CEO FitzGerald resigns from Intertain (source)
bull Intertain delists from the TSX in Jan 2017 and re-lists its shares in the UK -- claiming that the Canadian markets donrsquot value its business (source)
bull Analyst price targets of C$2800 were never achieved Shares hit a low of C$713 down 42
bull On Jan 25 2018 TSO3 discloses amendments to the Getinge partnership validating Spruce Pointrsquos criticisms (source)
bull Multiple brokers downgrade shares from gtC$500 to C$200
bull Share price made a low of C$048 in Oct 2018 down 81
bull Free cash flow available to pay the dividend has contracted materially
bull CEO Ken Hartwick resigned within 7 months after our report (source)
bull CFO resigned a little more than a year after our report (source)
bull Share price made a low of $348 in June 2018 down 51 which exceeded our low share price target
bull Maxarrsquos twice attempted to ldquorefuterdquo our conclusions yet its share price lingers near a multi-year low
bull Maxar admitted that it is evaluating an impairment of assets and that ldquoit is possible that an impairment or write-down will be recognized in Q3rsquo18rdquo
bull The Company also clarified its capital allocation strategy and suggested that debt pay was a priority leaving the safety of the dividend in question(source)
Executive Summary
6
Spruce Point Believes Dollarama (TSX DOL) Is A ldquoStrong Sellrdquo With ~40 Downside Risk
A Retailer Of Low-End Products With Declining Fundamentals In An Increasingly Competitive Environment
bull Undifferentiated Products Dollarama sells a variety of low-priced products mostly sourced directly from China Its purported advantage in ldquosourcingrdquo is contradicted by conversations with industry sources as well as numerous IP infringement lawsuits filed against the Company
bull Moving Upmarket Is A Risky Strategy Faced with years of negative average traffic growth and an increasingly saturated market Dollarama is driving comparable store sales growth by selling higher-priced items However in doing so it is quickly losing its reputation as a true ldquodollar storerdquo and per-store traffic numbers are declining as a result Big Lots (NYSE BIG) undertook a similar strategy in the 2000s but reversed course after admitting its failure
bull Saturation Is Imminent Dollarama cited a 900 store target at the time of its IPO in 2009 when it had just 585 stores Management has since revised this number upwards multiple times first to 1200 then to 1400 and most recently to 1700 Our analysis shows that this target is unrealistic and that the market is already bordering on oversaturation Dollaramarsquos FY lsquo19 store opening pace has thus far been its slowest in years
bull Margins Inexplicably High And Likely Unsustainable Gross margins of 39-40 are remarkably high for a discount retailer but intensifying competition rising labor costs rising transportation costs and a lapsing currency hedge benefit all threaten Dollaramarsquos high profitability levels Patterns in Dollaramarsquos hedging profits and gross margins ex-hedging suggest that management may be leaning on its FX-related profits to prevent its headline gross margin number from declining (see note on next page)
Troublesome Management And Governance Red Flags
bull Founding Family (And A Director) Have Significant Related-Party Deals The Rossy family launched Dollarama from its legacy retail chain in 1992 and owns significant real estate assets that are employed by the enterprise This may have played a role in managementrsquos recent decision to acquire Dollaramarsquos existing Montreal distribution center from the Rossys rather than open a second distribution facility in western Canada as have most peers
bull CEO Stepped Down And Installed His Son Larry Rossy stepped down as CEO in 2016 (and as Chairman in 2018) selecting as his replacement his son Neil ndashpreviously Dollaramarsquos Chief Merchandising Officer We question whether a thorough and arms-length search was conducted to fill this position
bull Opaque Supplier Relationship As part of a deal struck in 2013 Dollarama supplies goods (at an undisclosed profit margin) to Central American discount retailer Dollar City in exchange for an option to acquire the chain in 2020 However Dollarama currently has no formal stake in Dollar City and therefore does not consolidate Dollar Cityrsquos results We are concerned that Dollar City could be overpaying its vendors to lessen the financial burden on Dollarama
bull Insider Ownership Declining Former CEO Larry Rossy has sold or transferred ~75 of his shares since the 2009 IPO Bain Capital liquidated the last of its shares in 2011 at a split-adjusted price of $5 per share 18th the current price The current CFO owns no shares and regularly liquidates options
Dollarama (DOL or ldquothe Companyrdquo) is a dollar store which following a series of price hikes over the course of several yearsis no longer a true
ldquodollar storerdquo As a result DOL has fallen out of favor with value-oriented customers causing average store traffic to contract and thus
necessitating further price hikes to support SSS growth Management is nonetheless aggressively pursuing unrealistic growth targets even as
competitors flood the discount retail market and threaten its improbable margins DOLrsquos shares trade at a 50 premium to peers in the value
retail space ndash even following a ~20 drop after a disappointing Q2 ndash questionable governance and poor earnings quality notwithstanding
We believe that DOL will continue to miss lofty investor expectations and that its premium valuation will continue to be pressured
7
Spruce Point Believes Dollarama (TSX DOL) Is A ldquoStrong Sellrdquo With ~40 Downside Risk
Questionable Accounting Techniques And Capital Allocation Decisions Weaken Quality Of Earnings And Financial Position
bull Currency Hedge Supposedly A Pure Offset To CAD Depreciation But Has Been A Material Profit Center Dollarama claims to hedge currencies only to lock in consistent prices (in CAD) on which its customers can rely However in practice the Company adjusts prices to match non-hedged competitors leaving us to wonder why it hedges at all Much of the recent hedge benefit appears to have reversed but gross margins ex-hedges conveniently rose by just enough over the last two years to maintain steady profitability If nothing else we question whether Dollaramarsquos elevated margins are sustainable
bull Tenant Allowances And Leasehold Improvements Are Amortized Over Very Different Periods While accounting rules may give sufficient leeway to permit this difference we question why lease term assumptions should differ for these two capital accounts Earnings quality suffers notwithstanding
bull Sales Of Certain Assets Such As Vehicles Appear To Be Completed At Above-Market Prices While the financial impact of these moves is difficult to quantify (perhaps due in part to Dollaramarsquos opaque relationship with Dollar City) the liquidation of certain assets is significant in some quarters
bull Leverage Is Increasing Dollarama makes long-term financing decisions using short-term debt the cost of which has risen with recent debt issuances andis likely to continue to increase with rising interest rates ndash and as the Companyrsquos credit profile grows riskier We question managementrsquos decision to increase leverage to support buybacks and dividends simply because the earnings yield is above the after-tax cost of debt We also worry about the state of the balance sheet should the economic environment turn or should the business decline more rapidly
bull Depreciation Is Well Below Capex And Has Been For Years Capital spending easily bests industry peers both as a percentage of sales and vis-agrave-vis steadier DampA charges The mismatch with DampA suggests poor quality of earnings at the very least Meanwhile managementrsquos growth orientation has diverted capital spending away from store remodeling giving stores a stale and dated feel despite rising price points
bull Acquiring Real Estate Flatters EBITDA Acquiring related-party real estate not only lines the pockets of the founding family but also allows Dollarama to shift rent expenses out of the operating line The artificial EBITDA boost helps management to achieve its EBITDA-based compensation targets
Easy To Justify ~40 Downside In DOL Shares
bull Valuation Is Indefensible DOL currently trades at a ~50 premium to peers and carries among the highest multiples of any global retailer Higher only are the valuations of cregraveme de la cregraveme global fashion brands ndash Hermes Prada Ferragamo etc Such lofty multiples are inappropriate for a dollar store with serious near-to-medium-term business risks Analyst estimates are not sufficiently skeptical of managementrsquos targets in light of these concerns
bull Even If Nothing Goes Wrong The Stock Is Overvalued Even if Dollarama executes its growth plan perfectly maintains its world-leading margin and retains a hefty valuation premium to its peers the stock is at best fairly valued at ~$43
bull Under More Reasonable Assumptions DOL Stock Is Overvalued By 40 At Current Levels Even assuming that Dollarama achieves full market penetration ndash with no negative impact on per-store revenues from competition or cannibalization ndash the stock is worth $28 under normalized margins and at a multiple closer to peer norms down ~40 from current levels
bull Analysts Bullish But Wavering Dollaramarsquos disappointing Q2 ndash including SSS guidance contraction and a YoY decline in operating cash flow ndash provoked some downgrades but analysts still see ~26 upside in DOL shares regardless We believe that analysts are too trusting of DOLrsquos growth targets but that the Q2 miss put the Company on notice with a number of analysts Further disappointing quarters could bring more drastic analyst revisions
8
Consensus Estimates (CY) 2018A LTM 2019E 2020E
Stock Price $3845 EV Sales 44x 43x 40x 38x
Shares Outstanding 332 EV EBITDA 174x 167x 161x 149x
Market Capitalization 12752 Adj EV EBITDAR 153x 148x - -
Total Debt Outstanding 1880 Price EPS 254x 241x 224x 199x
Less Cash and Equivalents 182
Enterprise Value 14450 Growth and Margins 2018A LTM 2019E 2020E
Operating Leases 1130 Sales Growth 102 84 102 65
Finance Leases 4 EBITDA Margin 255 256 249 254
Adj Enterprise Value 15584 EPS Growth 228 160 130 127
Credit Metrics 2018A LTM 2019E 2020E
Net Debt EBITDA 20x 20x 19x 17x
Adj Net Debt EBITDAR 28x 27x - -
Capital Structure And Valuation
In C$ MM except per share figures or where indicated
At present Dollarama demonstrates impressive margins and is not egregiously over-levered on a Net Debt-to-EBITDA
basis However as competition increases customers push back against recent price hikes and operating costs creep
upwards we believe that management will have a difficult time maintaining current profitability levels ndash particularly
while pursuing an aggressive growth strategy Leverage will be less sustainable should the businessrsquo performance
decline or the economic environment turn threatening managementrsquos ability to support continued buybacks
dividends while growing store count
Source Dollarama and Bloomberg Estimates
Note Calendar Year Ended Jan 30th
Note Operating Leases valued at 6x Operating Lease Expense
Though analysts
project declining sales
growth they foresee
margin expansion at
the same time This
pair of estimates
makes little sense to
us and should make
investors skeptical of
consensus estimates
Our research will
explain why we
believe margins will be
pressured going
forward
9
Short-Term Debt In A Rising Rate Environment Introduces Refinancing Risk
Significant Short-Term Debt Maturities That Will Have To Be Refinanced At
Higher Rates
Dollarama Has Unhedged Exposure To Interest
Rateshellip
hellipWhile The Three-Month CDOR Rate Rises Rapidly
Source Dollarama
Source Bloomberg
Dollarama refinanced significant short-term debt just last evening levering up the business in the process
Management refinanced its C$400M of 3095 fixed-rate notes due this November with C$500M of 355 fixed-rate
notes due November 2023 Managementrsquos use of short-term debt has burdened the business with refinancing risk in
an environment in which the CDOR rate has risen sharply and is expected to rise for the foreseeable future which has
now forced the Company to bear materially higher interest expenses (compare to its 2203 fixed-rate credit due in
2022) The Company still has C$14B of debt due to mature within the next 12 quarters (including its credit facility)
leaving it exposed to further rate increases The Companyrsquos weighted average debt maturity is about 35 years
320
680
DOLCN Credit Breakdown (C$1875M Total)
Floating Fixed$0
$100
$200
$300
$400
$500
$600DOLCN Debt Maturity Schedule (by CY Quarter)
Available in Revolving Credit Facility Maturing Sep 2023 Available in Revolving Credit Facility Maturing Sep 2020
Series 2 Variable Rate CDOR+59bp Series 3 Variable Rate CDOR+27bp
Fixed Rate 2203 Fixed Rate 2337
Fixed Rate 355
10
Will Dollarama Be The Next Bain Capital-Led Failed Retail IPO
ldquoTwenty-two percent of Bain LBOs from 1984 to 1992 went bankruptrdquo according to Eileen Applebaum in her book
ldquoPrivate Equity at Workrdquo1 Recent Bain-led retail busts include Toys ldquoRrdquo Us Guitar Center and Gymboree
Company DateEnterprise
ValueBain Capital Quotes Outcome
Toys ldquoRrdquo Us March 17 2005 $6600
Toys R Us and Babies R Us are premiere franchises with strong global brand recognition and a collection of high quality product offerings
including toys childrens apparel and baby products and accessories We are excited by the prospect of partnering with the management team and
employees to strengthen the long-term operating and financial performance of the businessesldquo -Matt Levin a MD at Bain
Toys ldquoRrdquo Us Files For BankruptcySept 2018
MichaelsStores
July 1 2006 $6000
We are delighted to partner with the Michaels management team to help build on its already strong position in an attractive industry and
capitalize on the significant growth opportunities that lie ahead Our deep experience in the retail sector reinforces our conviction that Michaels has
the best store locations a broad and attractive assortment of products for crafters of all ages and a sustainable competitive advantage thanks to smart investments in systems and infrastructure We look forward to helping Michaels achieve its full long-term potentialldquo ndash Matt Levin MD
IPO prices at low end of range (June 2014)
Share Price Hits Multi-Year Low in Oct 2018
As SSS Decline
Guitar Center June 27 2007 $2100
ldquoAs the leading retailer of musical instruments in the US Guitar Center enjoys great brand recognition among musicians nationwide a loyal
customer base and a track record of significant growth We look forward to working with the Companyrsquos experienced and capable management
team to continue to build the businessrdquo Jordan Hitch a MD at Bain
The End of Guitar Center
AndGuitar Center Troubles
Only Getting Worse
Gymboree Oct 22 2010 $1800
Gymboree is a terrific company with incredible brand strength and a large population of extremely satisfied customers We look forward to
working with Matthew McCauley and the companys proven and experienced management teamldquo Jordan Hitch MD at Bain Capital
Gymboree Hires Restructuring Counsel
1) Source ldquoBain Capital Sees High Profile Buyouts Go Bustrdquo NY Post March 2018
A Low-End Retailer With Unsustainably High Margins
12
Undifferentiated Goods amp Knock-Off Products
Dollarama sells undifferentiated low-priced consumer goods competing almost entirely on price Many of its products are
knock-offs It is no surprise that the Company has been sued by several companies for trademark infringement
How Dollarama became the retail king of knockoffsSelling cheap imitations of more expensive brands has turned Dollarama into one of Canadarsquos most
successful retailers earning it big bucks and plenty of lawsuits (Source)
ldquoI think they have good lawyers working
for themrdquo says David Lipkus a lawyer
specializing in anti-counterfeit in Toronto
who has helped clients sue businesses in
Canada selling knock-offs ldquoOften
retailers make mistakes and end up
selling fakesrdquo Many lawsuits are settled
privately but the store has been sued
by Nike for selling counterfeit
footwear emblazoned with Nikersquos
iconic basketball player silhouette and
by Umbra a home decoration company
for selling a style of waste basket In
February 2017 Dixon Ticonderoga
launched a suit against the dollar
store chain for a pencil itrsquos been
selling since 2002
Dollarama sells a wide range of discounted knock-offs across product categories
Its business invites litigation
Brazen mimicry multiple knock-offs
of a single producer (Mars)
Source
13
Per-Store Traffic Growth Stagnant But Opportunities For Price Increases May Be Exhausted
Growth in per-store sales has been driven by transaction size growth against declining per-store traffic Transaction
size growth has itself been driven by sales of higher-priced items Dollaramarsquos maximum price point has risen from
$1 prior to FY 2008 to $2 in FY 2008-09 to $3 in FY 2012 to $4 in FY 2017
Contracting store traffic puts per-store sales growth at risk absent further price increases but we question whether
price-driven SSS growth is sustainable as higher prices erode Dollaramarsquos value proposition and put it in closer
competition with more comprehensive big-box retailers Management has expressed reluctance to raise prices further
in the near term regardless (though they said the same when the max price was bumped to $3 several years ago) With
recent price increases now lapping for the first time SSS growth may be at risk
Growth has been propped up by price increases which have made its products more expensive than those at dollar store peers
Between a rock and a hard place Does management continue to erode Dollaramarsquos value proposition with price increases or
keep prices steady and hope for traffic contraction to reverse
Average Quarterly YOY
Growth in Per Store Traffic
-18 since Q1 2014
Transaction
size growth
decelerating
14
Increasing Average Unit Revenues Is A Very Risky Strategy That Has Failed Before
Raising price points to prop up SSS growth against falling store traffic is a major risk for discount retailers as their
entire value proposition comes from their low prices Higher prices may turn off customers and create difficult
comps in the event that price increases must be paused or reversed due to customer pushback
In 2006 for example Big Lots ndash a US discount retailer ndash introduced higher-ticket brand-name items in place of
comparable budget goods in an effort to get customers to spend more per visit This strategy reinvigorated same-
store sales growth for a time but ultimately failed Subsequent difficult comps resulted in negative SSS growth after
management abandoned its so-called ldquoRaise the Ringrdquo strategy
Raise the Ring is
abandoned lower price
points are emphasized
Raise the Ring is
introduced higher priced
items are emphasized
Big Lots alienated shoppers who were
seeking cut-price name-brand goods after
venturing into other areas
like selling frozen food
ldquoOur customer doesnrsquot come to us expecting a
Nordstromrsquos level of in-store shopping
experience They want value treasures
merchandise on the floor and clean restrooms
and we need to meet those expectationsrdquo
[CEO Steve] Fishman said in 2005
hellip
ldquoWersquore an enigmardquo he said at an investor
conference this month ldquoItrsquos been a real
challenge for the marketplacerdquo Source
Calls with industry experts indicate that Dollarama is losing more price-conscious customers to Dollar Tree and other discount retailers
following its efforts to raise prices and that this is a major driver behind recent per-store traffic declines
If price-conscious customers arenrsquot interested in shopping at Dollarama we wonder who ishellip
15
ldquoNothingForADollaramardquo Customers Becoming Conscious Of Price Increases Versus Competitors
Dollaramarsquos price increases may not yet put its prices on par with those of big box retailers like Walmart but
customers have taken notice that Dollarama has increased prices against other Canadian dollar stores Comments
from various internet forums and news sites reveal that customers no longer believe that Dollarama offers as much
value as do other discount retailers suggesting that the strength of Dollaramarsquos value proposition ndash the source of
its appeal and foundation of its business model ndash is at risk The below comments are anecdotal but comments of
this sort regarding Dollarama in particular are nonetheless common among relevant websites
ldquoThe dollar store is no longer a bargain if you
shop around you can by the same things
cheaper or same price elsewhere quit
calling it dollarama no more dollar thingsrdquo
Source
ldquodollar tree here is drastically cheaper then
dollarammardquo ndash Cody Williams
ldquoCody Williams Same here Dollarama is not
really a dollar store anymorerdquo ndash JJ Walker
Source
ldquoI enjoyed the days when everything in Rama
actually was a dollar I go to Dollar Tree
more often now just because everything
there is $125 - ($1 in the US of course)rdquo
Source
ldquoTheir high prices is the problem they still
have better selection than Dollar Tree but
their prices are always higher I know some
dollar store shoppers who go to Dollar
Tree first for the better prices and then go
to Dollarama for the stuff they couldnt
find at Dollar Tree Myself personally have
watched the prices creep up A pair of work
gloves climbed from $250 to 4 or 5 bucks
the discount over Home Depot is only a
buck or two now Also Dollar Tree still
keeps all items under 2 bucks I believerdquo
Source
ldquoThey gonna have to change the Dollarama
name soonrdquo
ldquodollarandaquarterramardquo
ldquoNew Name NothingForaDollarrdquo
ldquoYou forgot lsquoramarsquo NothingForADollaramardquo
ldquoAs for a new name how about
FiveFinaramardquo
ldquofive or lessarmardquo
Source
ldquoDollarRama is no longer in the same
category since they sell at higher prices
more of a discounted store and not a dollar
storerdquo
Source
Just did a quick check of my cleaning cupboard
DT=Dollar Tree DM=Dollarama
- 284L bleach $125 at DT Sometimes they even
have the big 37L bottles Never seen bleach that
cheap at DM
- 976ml Fabric Refresher $125 at DT DM sells it for
$150 and its a smaller bottle
- Oxy First Force spray cleaner $125 at DT $150 at
DM
DT also has a selection of other spray cleaners at
$125 while even other no name ones at DM can go
up to $2
- No name dish soap 1479ml (almost 15L) for $125
at DT 500ml for a $1 (or I guess $125 soon) at DM
- No name Mr Clean sponges At DT its two full
sponges for $125 At DM each sponge is half Mr
Clean cleaner sponge and half normal cheap sponge
- Those square no name tupperware containers that
are 3 for $125 at DM are 4 for $125 at DT
At the dollar-ish level everything Ive found at DT
has been a better value and equal or better
quality
Source
16
Transitioning Away From ldquoDollar Storerdquo Identity Threatens Customer Loyalty
Perhaps in recognition of the fact that Dollarama is losing its status as a true dollar store and that it now belongs to a
different category management has stricken almost all references to ldquodollar storesrdquo from Company filings This poses
a major threat to Dollaramarsquos customer appeal as evidenced by traffic trends and anecdotal customer reactions
FY 2017 Annual Information Form FY 2018 Annual Information Form
17
Margins Are Inexplicably High And Perhaps Unsustainable
We acknowledge that Dollarama is a strong operator with a strong value proposition (though perhaps a declining one) However
we question whether a discount retailer reselling Chinese knock-offs should garner among the highest operating margins of all
global retailers and whether a discount retailer with declining per-store traffic can continue to rely on price hikes for SSS growth
Dollarama stands out among global consumer companies and retailers ndash
45th out of 584 global retailers by operating margin (and 12th out of 584
global retailers by revenue multiple)
Dollarama consistently produces operating margins materially higher than
industry peers and higher than historical industry norms This gap has
only grown more substantial through the last five years
0
5
10
15
20
25
FY 2008 FY 2009 FY 2010 FY 2011 FY 2012 FY 2013 FY 2014 FY 2015 FY 2016 FY 2017 FY 2018
Peer Median Operating Margins vs Dollarama
Peer Median DOL CN
-10
-5
0
5
10
15
20
25
FY 1
989
FY 1
990
FY 1
991
FY 1
992
FY 1
993
FY 1
994
FY 1
995
FY 1
996
FY 1
997
FY 1
998
FY 1
999
FY 2
000
FY 2
001
FY 2
002
FY 2
003
FY 2
004
FY 2
005
FY 2
006
FY 2
007
FY 2
008
FY 2
009
FY 2
010
FY 2
011
FY 2
012
FY 2
013
FY 2
014
FY 2
015
FY 2
016
FY 2
017
FY 2
018
Dollarama Operating Margins vs Peers
DG FDO DLTR FRED BIG DOL CN
Source Bloomberg EQS function Source Dollarama and company filings
18
Debit Card Boost Is Played Out
Dollarama management has characterized the benefit from debit cards as being roughly a doubling in average purchase size
If true this benefit would be visible in year-over-year sales comps
The Company has not always disclosed penetration ndash and they ceased doing so after Q4 2016 ndash but the data suggest that the
average annual comp benefit was approximately 25 from FY 2013-16
Source Dollarama
00
05
10
15
20
25
30
35
40
45
0
10
20
30
40
50
60
Debit Card Penetration and Imputed Comp Benefit
Debit Card Penetration (LHS) Comp Benefit (RHS)
19
Have All The Levers Been Pulled
Dollarama has done a good job of increasing per-store revenue while investing in initiatives designed to remove operating
expenses We cannot fault management for pulling levers to expand margins but we believe the low-hanging
(and high-hanging) fruit has already been harvested
Management has also taken creative measures to raise effective average prices without raising prices directly ndash eg by
strategically replacing some lower-priced goods with close substitutes at higher price points and by reducing the size of
product bundles (pencils candies etc) without cutting prices Such back-door avenues to margin expansion may be exhausted
by this point as noted previously customers are beginning to notice that Dollarama no longer offers a value proposition
comparable to competing dollar stores
FY 13 FY 14 FY 15 FY 16 FY 17 FY 18
Revenue LeversAdd $250-$300
Price PointsDiscounting With Hedged Margins
Add $350-400 Price Points
Accept Credit and Debit Cards
Cost LeversDollar City
RelationshipNew POS Terminals
Kronos Labor Scheduling
Wi-Fi amp ScannersNew Warehouse
ConstructionWarehouse Expansion
Accounting and Financial Levers
Depreciation Schedule Change
Direct Profit from Currency Hedges
Leveraged Share Repurchase
ldquoThanks and good morning In the write up in the
discussion of the foreign exchange headwinds
and gross margin you also said you made select
changes to your product mix I am just wondering if
you could elaborate are there certain categories
thatrsquos your emphasizing in certain categories you are
deemphasizing I am just wondering what that
sentence really meantrdquo
- Peter Sklar BMO Capital Markets
ldquoIts really an item by item discussion Where the
compelling value remains and we are able to take for
example two pencils out of a pack and still be
competitive to help with offsetting some of the
headwinds thatrsquos the way we handle it or in other
cases if we replace the product with a new offering
thatrsquos just as compelling but different at a lower
cost potentially Thatrsquos another way Buyers can use
that tool to help them with the current challengesrdquo
- Michael Ross CFO Dollarama
Is this a sustainable practice as value-oriented customers lose faith in Dollarama
FY 2016 Q4 Earnings Call QampA
20
Costs Rising On Multiple Fronts
While management may have largely exhausted avenues for price increases and efficiency gains other industry and Company
developments threaten to drive up costs through the near term
Cost Driver Explanation
TariffsA significant share of goods (~20 according to industry experts) are sourced either directly or indirectly from the US Tariffs could increase costs on these goods materially
Minimum Wage Hikes
Provincial minimum wages in Canada generally rise much more frequently than do US minimum wages and many are scheduled to rise on an annual basis based on CPI growth Minimum wage hikes have been particularly significant of late (see below) Even provinces whose minimum wages are not tied to CPI growth have seen or are set to see material minimum wage hikes in the near future Notable recent and near-term changes are as follows
bull Alberta From $1360 to $1500 on October 1 2018 (103 increase)bull British Columbia From $1265 to $1385 on June 1 2019 to $1460 on June 1 2020 and to $1520 on June 1 2021 (63 CAGR)bull Ontario From $1160 to $1400 on January 1 2018 (207 increase) and to $1500 on January 1 2019 (additional 71 year-over-year increase)
Will rise according to Ontario CPI growth every October 1 each subsequent year New Ontario Premier Doug Ford is looking to reverse these plansbull Quebec Just increased to $1200 (+66 in May 2018) Significant political push to set provincial minimum wage at 50 of average provincial
minimum wage by 2020bull Manitoba New Brunswick Newfoundland Nova Scotia Ontario Saskatchewan and Yukon Annual minimum wage hikes according to national or
local CPI growth
Employee remuneration for FY 2018 was just over 10 of Dollarama revenue This cost item could realistically grow at a high single-digit rate over the next 2-3 years even if headcount is reduced
Transportation and Logistics
Industry experts have expressed concerns regarding near-term transportation cost increases These would hit Dollarama particularly hard as Dollarama is unique among industry peers It has only one distribution center Rather than invest in a second Dollarama recently purchased its existing distribution center in Montreal ndash which it previously leased from the Rossy family ndash for $394M (in addition to $232M spent on adjacent land) Other large Canadian value retailers generally have two distribution centers ndash one in the eastern half of the country and one in the western half
Rising fuel costs could result in materially higher transportation expenses as Dollarama distributes 92 of its merchandise through its single distribution center Industry experts suggest that shipping goods to Vancouver from Montreal via truck can be almost twice as expensive as shipping to Vancouver from China
We find it interesting that Dollarama chose to purchase property from managementrsquos family rather than follow industry norms and open a second distribution center in western Canada and that five of its six warehouses ndash all located in greater Montreal ndash are also leased from the Rossy family (the sixth warehouse is company-owned built on land purchased from the Rossy family)
MarketingDollarama has historically operated with no marketing expense However US peers spend 1-2 of revenue on average on marketing (see subsequent slides) As competition increases across the Canadian discount retail industry management may be forced to expand marketing efforts
21
Minimum Wage Growth Historically High And Accelerating Rapidly
Canada has seen fairly consistent minimum wage hikes since 2000 and minimum wage growth has outpaced inflation in all but
three years since the beginning of the millennium Dollarama has been able to manage minimum wage hikes and maintain
impressive margins since going public in 2009 Note however that minimum wage growth from 2009-17 was comparatively mild
relative to the prior half-decade Accelerating minimum wage growth through the near term will test managementrsquos ability to
insulate margins from rising labor costs
0
2
4
6
8
10
12
14
2001 2002 2003 2004 2005 2006 2007 2008 2009 2010 2011 2012 2013 2014 2015 2016 2017 2018YTD
Minimum Wage Growth Consistently Ahead of Inflation and Accelerating Rapidly
Weighted Average Minimum Wage Growth Canadian CPI Growth
Minimum wage growth across all Canadian provinces weighted by
province population
Management states that the vast majority of employees make more than minimum wage Nonetheless minimum wage hikes of 10-20 in
Canadarsquos most populous provinces could put material upward pressure on labor costs ndash particularly if these hikes spread to Quebec where
Dollaramarsquos distribution center and all of its warehouses are located Management includes a risk factor to this effect in its MDampA
210
215
220
225
230
235
240
245
250
255
260
FY 2018 EBITDA Margin FY 2018 EBITDA Margin with5 Labor Cost Hike
FY 2018 EBITDA Margin with10 Labor Cost Hike
EBITDA Margin Sensitivity to Labor Cost Hikes
12 weighted average minimum wage growth across Canada driven by
207 hikes in Ontario Average minimum wages could very realistically
continue to grow at high single-digit rates through the next ~2 years if
planned hikes are enacted
With labor costs representing about 10 of Dollarama revenue
profitability is materially sensitive to changes in this item
If labor costs were 10 higher in FY 2018 EBITDA margins would have
been slashed by 80 bps
Labor cost expansion of this magnitude would be significant but is not
necessarily out of the question within 2-3 years
Source Government of Canada
22
Lack Of Transparency Regarding Dollar City Is A Serious Concern
CEO Larry Rossy
and
CFO Michael Ross
mischaracterized
the sale by
attributing it to
vehicles which
has its own
categoryhellip
Why are Dollarama shopping carts being repurposed for Dollar City use
Perhaps they were sold above-market to Dollar City in FY 2013 when the relationship began Could this be the
reason for an unexplained $149M disposal of leasehold improvements that year
Source
1) Dollar City website and press
release announcing the relationship
Q ndash Keith Howlett ldquoOn Note 5 [of the FY
2013 Annual Report] I was trying to figure
out the leasehold improvements there
seemed to be some items called lsquodisposals
at costrsquo and therersquos sort of an offset thererdquo
A ndash Larry Rossy CEO ldquoI donrsquot know what
they are Yoursquore going to have to help me
out guys hererdquo
A ndash Michael Ross CFO ldquoDisposal of costs
that would be fixtures or related tohelliprdquo
A ndash Rossy ldquoI would say carsrdquo
A ndash Ross ldquoCars Yeah okay We sold a
few carsrdquo
Q ndash Howlett ldquoOh I see okay Well it
shows up as CAD 15M for a year thatrsquos a
lot of carsrdquo
A ndash Rossy ldquoOh itrsquos a very expensive
carrdquo
Source FY 2013 Q4 Earnings Call Source Dollarama
2013 Annual Report
In 2013 Dollarama entered into an agreement to export and sell products to Dollar City a Latin American dollar store with a
presence in El Salvador Guatemala and Colombia In exchange for selling goods to Dollar City ldquoat costrdquo plus a small markup
and providing business and operational expertise Dollarama was given an option to acquire the chain exercisable in February
2019 (since extended to February 2020)
Details about Dollar City are scarce Who is the management Where is company headquarters Who are the shareholders
Dollar Cityrsquos website provides limited information and not a single Dollar City manager was quoted at the initiation of the
relationship1 Though management claims to sell to Dollar City ldquoat costrdquo with a markup we have no way of determining how they
are calculating ldquocostrdquo It is more likely that Dollarama loads shared costs into the Dollar City bill that flatter Dollaramarsquos margins
and sells merchandise that isnrsquot selling well in Dollarama stores to Dollar City
More Competition Coming To An Already-Crowded Space
24
Evidence Of Dollarama Store Growth Slowing
The pace with which Dollarama opened stores through the past several years does not appear to be sustainable
Importantly the inevitable reversal in its pacing appears to be occurring this year
The Company opened just eight stores in Q2rsquo19 its lowest store opening count in any quarter of any recent year
Its YTD FY 2019 pace of 18 new stores is also trailing the average pace of recent fiscal years (28 openings) by
~35 Management did not provide a fully satisfactory explanation for this deficit
The slowdown in its pace of store openings could suggest that the Company is having a difficult time identifying
economically-viable locations as it seeks to grow its store count by close to 50 ndash still a very distant target
Fiscal YearStated New
Store Opening Goal
Q1 Q2 First Half Q3 Q4 Total
2019 60-70 10 8 18
2018 60-70 13 17 30 10 25 65
2017 60-70 8 13 21 18 26 65
2016 None 17 17 34 16 25 75
Source Dollarama financial filings
ldquoI want to ask about the pace of store
openings As you noted the slower start to
the year you did maintain the guidance for
this year But wondering about sort of further
beyond that obviously the store potential that
you put out there gives you room to remain at
that pace for a while But does the slower
same store sales assumption change your
thinking about how aggressively you want
to push new stores out thererdquo
- Mark Petrie CIBC
ldquoNo it does not It does not And that I would
also add that if the pace at which weve been
opening stores this year is slower than last year
as mentioned often that just relates to the
specific timing of real estate And if stores are
pushed closer to the end of the year it could be
that there is an overlap between a few more
stores at the end of this year or a few more
stores in the beginning of next year and the
end it will keep our pace of 60 to 70rdquo
- Michael Ross CFO Dollarama
ldquoReal estate timing issuesrdquo
do a poor job of explaining a
drop in H1 new store
openings of over a third
Source Dollarama Q2 FY 2019 Earnings Call
25
Dollarama Potentially Pushing The Limits Of The Canadian Market
Managementrsquos stated goal is to have 1700 stores across Canada by 2027 up from 1178 stores today We do not
believe that it can achieve this without risking significant cannibalization DOLrsquos target would imply a saturation level
higher than the largest US dollar stores (Dollar Tree and Dollar General) which also sell many more consumables and
grocery items Additionally Canada broadly has much lower levels of retail space per capita than the US suggesting
that Canadian concentration is even more pronounced all else equal
US Retail Square Footage Greater Than Canadian
Retail Square Footage
DOLrsquos Target Implies
Greater Than US
Saturation Despite
Narrower Concept
Source Wellington Management
Walmart is not opening stores in Canada suggesting that it believes
the Canadian market is saturated at 114 stores per million people ndash
about 69 of its US concentration (164 stores per million people)
Meanwhile Dollarama continues to expand within Canada despite
even higher Canadian concentration (327 per mil) relative to the US
concentration of large US dollar stores (452 per mil for a 72
ratio) This ratio would be over 100 at DOLrsquos 1700 store target
Higher Canada store
count vis-agrave-vis
comparable US
store count
compared to Walmart
Higher Canada store
concentration vis-agrave-
vis comparable US
store concentration
than Walmart
Retailers with similar store concentrations per capita across both the US and
Canada are effectively more concentrated in Canada vis-agrave-vis the total retail space
in either country
Store Count by Region
Canada US CanUS Ratio
WMT 410 5358 77
DOL ndash Present 1178 14750 80
DOL ndash Future 1700 14750 115
Store Count per Million People by Region
Canada US CanUS Ratio
WMT 114 164 69
DOL ndash Present 327 452 72
DOL ndash Future 472 452 104
DOL CN DG DLTR
Stores 1700 14760 14732
Population (M) 36 326 326
StoresCapita (M) 472 453 452
26
Dollarama Has Benefited From A Benign Competitive Environment
Large competitors have been shuttering Canadian stores continuously through the last four years due to company-
specific issues highlighted by the high-profile exits of Target and Big Lots from Canada12 We believe that this has been
a significant tailwind for Dollarama but one that is largely behind the Company at this juncture
Dollarama has been able to maintain significant share high margins and high returns on capital in large part due to
missteps among peers and the resulting lax competition This is likely unsustainable in a more competitive environment
as Dollarama has few material competitive advantages barriers to entry are low and its discount retailing strategy is not
unique Competent competition from growing industry players ndash Dollar Tree Canada Miniso and Amazon among others
ndash could be the straw that breaks the camelrsquos back for Dollaramarsquos profitability or growth (or both)
Fiscal YearCompany Exiting
CanadaStores Closed Revenue
DOL Revenue Capture
(Estimated)
Estimated Revenue Benefit
Revenue Boost
2018 Sears 200 $2000 3 $60 2
2017 Sears 100 $1000 3 $30 1
2016 Target 133 $2000 6 $120 4
2015 Big Lots 78 $155 10 $16 1
Last Four Year Average $56 2
Note All numbers are SPCM estimates
1) ldquoTarget Canada to close all stores by April 12rdquo
2) ldquoBig Lots Getting Back Out of Canadardquo
27
Light Competition Has Allowed The Company To Spend Nothing On Promotion ndash Until Now
Dollarama has no promotional expense Meanwhile promotional expenses average 1-2 of revenue among US
peers As established competitors continue to expand and as new competitors enter the market (Amazon included)
Dollaramarsquos no-cost marketing strategy may prove untenable
Promotional Expense
as a of Revenue
Intensifying Competition Threatens Dollaramarsquos
Passive Marketing Strategy
2016 2017 2018
BIG 180 180 170
FIVE 264 270 243
DLTR 021 029 048
DG 062 054 044
Average 132 133 126Source Huffington Post
Source Investorscom
The Canadian operation is also a relatively small part of the business However early results are
encouraging and despite competition in the Canadian market Dollar Tree has found success Longer
term the company is aiming for 1000 stores north of the border which does not seem unrealistic
Source Retail Environments
Calls with people at Dollar Tree suggest that the Company is working to
imitate elements of Dollaramarsquos strategy and store layout in its own
Canadian stores (eg raised shelves etc) and that it plans to expand
into Canada aggressively once its strategy is refined ndash likely in 2019
Source Company financial filings
28
Caught Between The Competition How Will Dollarama Fit In
Dollar Tree has maintained its reputation as a true dollar store nothing is priced higher than C$125 ($1 in the US)
Miniso has developed a reputation as a ldquonicerrdquo discount retailer items can cost up to C$25 but the environment is cleaner and
more modern and products are of better quality (but you can still get a dollar-level deal ndash most products are priced under C$10)
Dollarama has all the character of an old tired dollar store but without the dollar prices
Who will shop there unless management invests in store updates rather than opening new stores
Value-driven customers are by definition not loyal customers
Miniso
Clean and modern but cheap
Dollar Tree
No need for price tags everythingrsquos $1 Dollarama
Looks like Dollar Tree priced like Miniso
Irsquoll pass
29
Dollarama Makes No Effort To Appeal Millennials ndashThe Next (And Current) Shopping Generation
Dollarama has zero social media presence unlike all of its peers Not only is the Company out of touch with customers in
an industry which demands a high level of customer engagement but its brand is becoming demonstrably stale
Facebook Twitter Instagram YouTube LinkedIn Pinterest Google+
Dollar Tree Yes Yes Yes Yes Yes Yes No
Dollar General Yes Yes Yes Yes Yes Yes Yes
Family Dollar Yes Yes Yes Yes Yes Yes No
Big Lots Yes Yes Yes Yes Yes No Yes
Miniso (Canada N America)
Yes Yes Yes Yes Yes No No
Great Canadian Dollar Store
Yes Yes No No No No No
Dollarama No No No No No No No
Until now Dollarama has largely been a regional brand with satisfactory name recognition in its provincial home of Quebec
Now that the Company is making a bigger push into Anglophone Canada management should be more proactive in adapting its
strategy to new markets and to a new customer base Yet management continues to employ a strategy more befitting a sleepy
regional business it does not market or work to improve its brand it does not stay current with trends it keeps management
within the family and it is not expanding its logistics chain to support coast-to-coast growth (see subsequent slides)
Management wants Dollarama to be a national brand but it does not appear prepared to run a national business
Questionable Accounting And Financial Practices
31
Hedging Instruments A Material Source Of Profits In Recent Years
Dollaramarsquos sales are in Canadian dollars whereas a majority of its product purchases are US dollar-linked Management claims to enter
into CADUSD hedging arrangements to lock in near-term margins without having to adjust prices in response to FX movements However
management has nonetheless admittedly adjusted prices alongside unhedged peers in response to shifts in the CADUSD exchange rate
rendering its currency hedges a source of profit
Forex dynamics through the last two years have erased the large hedge benefit realized by Dollarama in FY 2016 but management reports
that gross margins have effectively remained flat through this period implying significant gross margin improvement in the underlying
business (see graphs below) As the currency hedge benefit has reversed through the last two years underlying gross margins have
purportedly risen by EXACTLY ENOUGH to keep total gross margins steady between 39-40 We find this oddly convenient ndash or at the very
least we question whether management will be able to maintain steady margins in the face of unfavorable FX rate dynamics in the future
Quick turnaround in
underlying
profitability Just in
time to keep the
declining forex hedge
benefit from dragging
down marginshellip
Even as FX hedge gains fell
from close to 8 of gross profit
in FY 2016 to a drag on gross
profit in FY 2018 gross margin
expanded by over 100 bps over
the same period implying gross
margin expansion ex-forex of
almost 300 bps within two years
for a retailer with gross margins
which were already unusually
high and whose margins had
contracted for four straight
years before the rapid reversal
32
Questionable Depreciation Assumptions
Dollarama changed its depreciation schedule for leasehold improvements (store fixtures) in FY 2015 moving from a 10-year to a 15-
year expected life1 However management did not concurrently lengthen the amortization schedule for tenant inducements
We find this mismatch curious as both quantities should be amortized depreciated over the expected life of a given lease
Adding to the confusion and appearance of foul play DOL discloses in its AIF that its average lease term is just 5 yrs and it just
started disclosing related-party dealing with Director Huw Thomas of SmartCentres ndash a REIT that lists DOL as a top 10 customer23
Lease term implied
by leasehold
depreciation expense
2-3x greater than that
implied by
amortization of
tenant allowance
Mismatch in implied
lease term
inappropriately
inflates EBIT
C$ MillionsFY
2013FY
2014FY
2015FY
2016FY
2017FY
2018
Amortization of Tenant Allowance $29 $35 $43 $49 $48 $51
Starting Balance Sheet Amount 168 207 232 280 344 386
Amortization as a of Asset Amount 173 169 185 175 140 132
Implied Lease Term 58 59 54 57 72 76
Leasehold Depreciation Expense $129 $166 $108 $141 $172 $202
Starting Balance Sheet Amount 1182 1348 1762 2113 2499 2867
Depreciation as a of Asset Amount 109 123 61 67 69 70
Implied Lease Term 92 81 163 150 145 142
Tenant Allowance Amortization Using Leasehold Depreciation Schedule
183 255 142 189 237 272
Reduction In EBIT If Both Were Put On Same Schedule (11) (10) (29) (30) (24) (24)
While the financial impact of this adjustment is limited signs of accounting impropriety do not reflect well on management and cast
doubt on the rest of Dollaramarsquos reports and accounting practices
1) FY 2015 Annual Report p 15 DOL also extended its store and warehouse equipment useful lives from 8-10yrs to 10-15yrs The total reduction of these three items was decrease of $10m in
FY15 depreciation expense
2) DOL states in its AIF p 11 ldquoThe Corporation typically enters into leases with base terms of ten years and options to renew for one or more periods of five years each The average time to
expiration of the Corporationrsquos leases is approximately five yearsrdquo
3) See governance slide on Huw Thomas
33
Capital Spending And Distribution Of Cash To Shareholders Are Overextending The Business
What happened
Management claimed in 2011 that the business was sufficiently cash-generative to support growth and dividendsshare buybacks
and that it would be able to pay down debt while pursuing both However debt has ballooned since then with net debt rising 8x
(and close to 3x versus EBITDA growth) Management is effectively levering up the balance sheet to support dividends and share
buybacks with CFO Michael Ross stating that he will continue to repurchase shares as long as the earnings yield remains above
the after-tax cost of debt
ldquoFor the past few years our cash flow has enabled
us to continue to pursue our growth plans and
continue to pay down debt Our free cash flow is
now sufficient to fund both those priorities
while enhancing new to shareholders through
a quarterly dividend payment We are able to
generate the free cash flow to do all of this
because we employ a simple growth oriented
business model at Dollaramardquo
ndash June 2011 Conference Call
Should Dollaramarsquos struggles become more pronounced ndash or should the
economic cycle turn for the worse ndash this debt overhang could loom large over
the business
Dollarama also consistently spends more on capex (as a percentage of sales) than its peers in the discount retail industry and
shows abnormally high capex versus depreciation and amortization We understand that Dollarama is a growing business which
could explain both patterns in part but it is not the only discount retailer which is investing in store growth
Dollarama DampA consistently
lt50 of capex and a lower
percentage of capex than
industry peers
Dollarama consistently
spends more on capex
(as a percentage of sales) than industry peers
00
05
10
15
20
25
0
200
400
600
800
1000
1200
1400
1600
1800
FY2012
FY2013
FY2014
FY2015
FY2016
FY2017
FY2018
Ne
t D
eb
tEB
ITD
A
Ne
t D
eb
t ($
C M
M)
Net DebtEBITDA Net Debt
0
50
100
150
200
250
300
FY2010 FY2011 FY2012 FY2013 FY2014 FY2015 FY2016 FY2017 FY2018
DampA as a of Capex and Intangibles Annual
DOL DLTR DG BIG FRED
0
1
2
3
4
5
6
7
8
FY2010 FY2011 FY2012 FY2013 FY2014 FY2015 FY2016 FY2017 FY2018
Capex and Intangibles as a of Sales Annual
DOL DLTR DG BIG FRED
34
Where Is The Capex Going
Management has explicitly identified and discussed various capital expenditures in Company filings over the last
five years but this still leaves a large gap versus what was actually spent
Additionally there is a large gap between the amount spent on software development and the amortization expense
associated with this activity suggesting that earnings may be inflated
Some of this is
directed towards
leasehold
improvements etc
but with
managementrsquos
focus on expansion
over existing store
improvements we
question where
management is
directing this capex
Capital Spending Software
on Software Amortization Difference
FY 2018 191 126 65
FY 2017 126 96 3
FY 2016 111 78 33
FY 2015 108 56 52
FY 2014 98 34 64
Are earnings
inflated due to
insufficient
amortization
Note also that a LinkedIn search for software developers at Dollarama turned up effectively nothing ndash at best one person with a tangentially
relevant title (source) So where is the software development capex going
Unlike discount retailer peers Dollarama
did not include software-related
spending in capex until recently and
records it separately in
ldquoAdditions to intangible assetsrdquo1
Do they do this to artificially deflate their
headline capex figure thereby inflating
reported free cash flow
Undiscussed Capital Spending (FY 2014 ndash 2018)
C$ Millions
$500K in capex spent per new store (375 new stores over past five years Source AIF) $1875
Capex spent on construction of 500K sqft warehouse in Montreal 679
$82M spent annually on expansion renovation or relocation of stores over five years 410
$232M spent on land acquisition 232
Discussed Capex Over Past Five Years $3196
Total Reported Capex (ex intangibles) $5200
Undiscussed Capex $2004
Software Capex and Software Amortization Discrepancy
C$ MillionsCapital Spending on
SoftwareSoftware Amortization Ratio
FY 2018 $191 $126 152
FY 2017 126 96 131
FY 2016 111 78 116
FY 2015 108 56 193
FY 2014 98 34 288
1) DOL explicitly started calling out software as a component of capex in Q3rsquo16 with the addition of footnote to guidance
35
Lack Of Transparency Regarding Store Closures And Associated Costs
It is standard industry practice to report store closures remodels and relocations alongside new store openings
However Dollarama reports only ldquoNet New Storesrdquo and does not break this number out in detail Questioned on this
in Q4 2016 management answered that a larger store base would inevitably result in more closures for reasons
outside of its control (fires mall renovations etc) and that reporting closures would therefore not communicate
meaningful information regarding the underlying performance of the business
We strongly disagree store closure information is vital to evaluating the health of a retail chain Management can
provide color on particular closures if it feels that they have been done for reasons other than performance but
failing to report closures entirely hides a key operating statistic from investors
Company Store Movement 2012 2013 2014 2015 2016 2017 2018
DLTR
Beginning 4101 4351 4671 4992 5367 13851 14334OpenedAcquired 278 345 343 391 8850 584 603
Closed 28 25 22 16 366 101 102Closed as of Beginning 07 06 05 03 68 07 07
BIG
Beginning 1398 1533 1495 1493 1460 1449 1432Opened 181 87 55 24 9 9 24Closed 46 46 58 57 20 26 40
Closed as of Beginning 33 30 39 38 14 18 28
DG
Beginning 9372 9937 10506 11132 11789 12483 13320Opened 625 625 650 700 730 900 1315Closed 60 56 24 43 36 63 101
Closed as of Beginning 06 06 02 04 03 05 08
FDO
Beginning 7023 7442 7916 -- -- -- --Opened 475 500 526 -- -- -- --Closed 56 26 400 -- -- -- --
Closed as of Beginning 08 03 51 -- -- -- --Overall Industry Average 09 07 20 07 23 07 08
Other high-growth dollar
stores like Dollar Tree and
Dollar General report store
closures ndash why doesnrsquot
Dollarama
Store closures for whatever
the reasons incur real
restructuring and other
costs Peer retailers
generally give detail on these
expenses whereas
Dollarama does not
We believe that Dollarama
should follow industry norms
and increase transparency
regarding store closures
US Dollar Store peers historically close 08 of stores annually yet Dollarama has not reported any recent closures
36
SSS Metrics Obfuscate Store Performance
Dollaramarsquos official ldquoComparable Store Salesrdquo figure includes ldquorelocated and expandedrdquo stores as ldquocomparable storesrdquo
therefore picking up growth in traffic which can be attributed to relocation-related improvements We believe that this likely
overstates Comparable Store Sales growth while also ignoring associated relocation-related expenses
1) See Q1 FY 2014 earnings call transcript
Management not only hides store closure data as a supposedly uninformative statistic but proclaims that it has NEVER closed a
store due to poor performance1 We find it difficult to believe that a retailer which has existed in its current format since 1992 has
never needed to close a store for poor performance If it has indeed never closed an underperforming store we wonder whether
management has been too ambitious in growing its store base without critically evaluating the profitability of each location
Huntsville Place Mall Jul 2015
7 John St Oct 2012
7 John St Jul 2015
Huntsville Place Mall Oct 2012
Huntsville ON
Relocation
Are these really entirely
ldquocomparablerdquo locations
781 Rue Principale Est May 2016
781 Rue Principale Est Jun 2009Le Carrefour Ste Agathe
May 2016
Ste-Agathe-Des-Monts QC
Relocation
Why assume the costs to
make this lt1 mile move
Notice
Dollarama
sign turned
inside-out
indicating
closure
37
Cash Flow Beginning To Turn Over Despite Efforts To Bolster Results
In H1 FY 2019 Dollaramarsquos cash flow contracted on a year-over-year basis for the first time since it went public ndash this
despite managementrsquos efforts to bolster earnings and EBITDA The contraction appears to be due in large part to
changes in working capital In particular we are concerned that growth in inventories suggests that management
overestimated near-to-medium term sales growth and that declining traffic is starting to weigh on the Company
Dollarama H1 Operating Cash Flow
C$ Millions FY 2014 FY 2015 FY 2016 FY 2017 FY 2018 FY 2019
Net Income $1054 $1221 $1603 $1895 $2265 $2433
CFO Before Working Capital 1394 1488 2124 2156 2769 2999
Changes in Working Capital (287) (236) (870) (110) (126) (886)
Net CFO 1107 1252 1253 2045 2644 2113
YoY Change $326 $322 $01 $792 $599 (531)
Source Dollarama
Governance Concerns
39
Related-Party Transactions With Rossy Family Raise Questions Over Governance And Costs
Fiscal YearRent amp Land Purchases
Paid to Rossys(C$ MM)
As a of Compensation Paid to Rossy Family
FY 2019 (To Date) $394 NA
FY 2018 184 1660
FY 2017 402 4459
FY 2016 179 1305
FY 2015 169 2752
FY 2014 163 1903
As noted Dollarama leases all but one of its five warehouses from the Rossy family and recently purchased land from the Rossys
for the construction of a sixth Management also recently purchased its Montreal distribution center from the Rossy family which
leased the facility to Dollarama until this February We understand that the Rossy family has close historical ties to the business
but this level of close dealing draws our attention particularly given the fact that management has focused on fortifying its
existing distribution footprint ndash closely tied to the Rossy family ndash rather than invest in distribution facilities in western Canada
where major competitors already have distribution centers
DLTR
Distribution
Center
Delta BC
DLTR
Distribution
Center
Mississauga ON
DOL
Distribution
Center
DOL
Warehouses
No Dollarama distribution facilities
located outside of a ~4 mile radius in
Montreal
bull Due to preferential relationship with
Rossy family
bull Will Dollarama be able to expand into
AngloWestern Canada efficiently
without logistics costs ballooning
bull Overly-exposed to fuel price hikes
and rising transportation costs
Related-Party Transactions Significant And Growing
Source Dollarama Financials
Dollar Tree Canada Distribution Centers
Dollarama Distribution Centers And Warehouses
Source DollarTree
Montreal QC
40
Related-Party Transactions With ldquoIndependentrdquo Director Huw Thomas Only Recently Disclosedhellip
Dollarama also leases stores from SmartCentres REIT whose recently-departed CEO Huw Thomas joined Dollaramarsquos
Board of Directors in 2011 and was a member of its audit committee through March 2017
His ldquoindependencerdquo was recently defended by a meandering 260-word footnote in Dollaramarsquos proxy which belies the
fact that Dollarama is a top 10 customer of SmartCentres
This is all the more suspicious in light of Dollaramarsquos questionable lease accounting highlighted earlier
Source Dollarama 2018 Proxy Circular
Note Dollarama did not start disclosing Huwrsquos related-party dealing until the 2017 proxy
circular in June 2017 right after he left the Audit Committee in March 2017
SmartCentres 2017 Annual Report
Dollarama Material To SmartCentres ndash A Top 10 Customer
SmartCentres Promotes Dollarama Relationship From 2011
Calloway (now SmartCentres) 2012 Annual Report
Dollaramarsquos Lengthy Meandering Defense Of Thomas
Huw As Independent Only Recently Disclosed (2017)
Dollarama Recently Changed Rent Expense Disclosure
Source Dollarama Q4rsquo17 Financials Note 15 Related Party Disclosure
Source Dollarama Q2rsquo18 Financials Note 13 Related Party Disclosure
41
House of Windsor House of RossyA Case Study In Nepotism
Neil Rossy had been the Senior VP of Merchandising Chief Merchandising Officer for 25 years prior to being named CEO in
2016 While his family is still a large shareholder they are not a controlling shareholder owning around 5 of the shares
outstanding We question whether the Rossyrsquos century-long family tradition of passing down leadership ndash one which also
persists at the Rossyrsquos ldquosister storerdquo ndash is appropriate for a public company or wise for the long-term health of the business
Salim Rossy
Opened first ldquoS Rossyrdquo
store in 1910 (up-market
department store concept)
George Rossy
President of S Rossy
1937-1973
Larry Rossy
Grew S Rossy from 20 to 44 stores before
converting all S Rossy stores to new
ldquoDollaramardquo concept in 1992 Sold majority
stake to Bain Capital in 2004 IPO in 2009
Neil Rossy
CEO of Dollarama as of 2016
Michael Rossy
Brother of George (one of ten siblings)
Founder amp CEO of ldquoRossyrdquo stores 1949-2010
Michael DiTullio
Son-in-Law of Michael
President amp CEO of Rossy since 2010
Does (or will) the family have a hard time parting with a business that has been in the family for four generations even if parting ways is
the right thing to do
Managing retail chains is very
much a family affair for the
Rossys ndash at both stores
Perhaps Neil was going to be
anointed CEO of Dollarama
regardless of the caliber of other
potential candidates
Letrsquos hope hersquos not Commodus
BONUS
Brother branches out
with separate storehellip
42
Insiders Incentivized To Grow EBITDA
Our earlier concerns about EBITDA quality are amplified by the fact that Dollarama executives are compensated
based on seemingly arbitrary and inflated EBITDA targets This gives management a strong incentive to be inefficient
users of capital as any dollar shifted from operating expense to capex has a direct benefit to key executives
For example note that managementrsquos perhaps questionable decision to purchase one of its Montreal warehouses
will shift what was until recently rent expense into depreciation This change in the accounting treatment of
Dollaramarsquos tenancy costs will provide a windfall to EBITDA potentially boosting management bonuses
Source Dollarama Proxy Circular p 30
43
What Is A Stretch EBITDA Goal
Bonuses are paid upon achievement of 11 EBITDA growth This level was ldquodesigned to be a stretch objectivehellip
attainable only with significant effortrdquo However this target was reset lower after FY 2014 ndash the only year during which
management did not handily exceed the target We believe this further calls into question the independence of the
board and its compensation committee
Year EBITDA Growth Objective EBITDA Growth Achieved
FY 2018 11 18
FY 2017 11 18
FY 2016 11 30
FY 2015 11 15
FY 2014 13 12
FY 2013 13 22
FY 2012 13 26
FY 2014 Management
misses growth objective
FY 2015 Growth objective
adjusted downwards
ldquoThe thresholds were revised by the
Human Resources and Compensation
Committee in the context of its annual
executive compensation review
conducted at the beginning of each fiscal
year to take into account among other
elements the fact that the base for the
calculation is growing every yearrdquo
Source FY15 Management Proxy Circular
What ldquoother elementsrdquo were
taken into account
Source Dollarama
44
Insiders Selling While Company Buys Back Stock At Elevated Prices
Management has been buying back shares at elevated prices through the last several years even while pursuing growth leaving little capital for
(sorely needed) store updates or other uses The average repurchase price since Q1 FY17 is about on par with current share prices and ~40
below our target Since Q2 FY18 the average buyback price has been 25 above current levels
Furthermore just as the Company has been buying back stock at elevated prices insiders have been offloading shares Notably it is evident
from past and current proxy statements that CFO Michael Ross has never held onto shares for which he has been granted options his
common equity ownership is listed at zero every year Note that as the CFO it is he who is dictating the share buyback decision in large part
PeriodShares
Repurchased
Value of Repurchase
(C$ M)
Average Price (Split-
Adj) (C$)
Q1 FY 2017 1542066 1393 3011
Q2 FY 2017 2027080 1842 3029
Q3 FY 2017 1571500 1578 3347
Q4 FY 2017 2279522 2241 3277
Q1 FY 2018 1687240 1806 3568
Q2 FY 2018 1303900 1602 4095
Q3 FY 2018 687700 931 4513
Q4 FY 2018 2425700 3788 5205
Q1 FY 2019 94500 145 5115
Q2 FY 20191 1347341 700 5195
Total 14966549 16026 3797
Discount to Current Share Price 1
Total (Since Q2 FY 2018)
5859141 7170 4815
Discount to Current Share Price -20
Using Company Funds To Overpay For DOL Shareshellip While Insiders Sell Into The Companyrsquos Bidhellip
Source DOL filings and Bloomberg
Insider Title Date Sold SharesProceeds (C$ M)
Price Sold (Split-Adj)(C$)
Nicolas Hien Senior Vice President 482016 6203 06 3224
Michael Ross CFO 482016 80000 74 3083
Paul Roche Vice President 4182016 10000 09 3000
Geoffrey Robillard Senior Vice President 6172016 33500 31 3085
John Assaly Vice President 9272016 30000 30 3333
Geoffrey Robillard Senior Vice President 472017 20000 23 3833
Paul Roche Vice President 472017 23100 26 3752
Josee Kouri Corporate Secretary 4142017 8000 09 3750
Geoffrey Robillard Senior Vice President 9142017 5000 07 4667
Geoffrey Robillard Senior Vice President 12112017 10000 16 5333
John Assaly Vice President 12132017 14096 22 5202
Geoffrey Robillard Senior Vice President 1262018 15000 24 5333
John Thomas Independent Director 1262018 6000 10 5556
Geoffrey Robillard Senior Vice President 6152018 50000 75 5000
John Assaly Vice President 6192018 13404 21 5222
Nicolas Hein Senior Vice President 6222018 36750 19 5170
Paul Roche Vice President 6222018 24000 13 5417
We do not like the fact that insiders have been selling into share buybacks while
the Company levers itself up with short-term debt to support those repurchases
It appears that the execs are levering up the business in part to enrich themselves1) All share information prior to Q2 lsquo19 reflects pre-split data except
Split-Adjusted Average Prices Q2 lsquo19 repurchases were as stated
45
Rossy Family Selling Shares Despite Control Over C-Suite
Notably Founder and former CEO Larry Rossy has trimmed his position tremendously through the last several years
Though this is to be expected to some extent as he recently ceded control of the business we believe that his
ownership stake should be held to a higher standard given his insistence on keeping the business in the family
If he plans to keep the c-suite under a Rossy dynasty the familyrsquos personal stake in the business should reflect that
Source Bloomberg
Valuation And Price Target
47
The Market Has Not Taken Threats To Dollarama Seriously ndash But Optimism Is Ebbing
Analysts are generally bullish on the stock focusing primarily on managementrsquos growth story and taking current
profitability levels for granted The prospect of new competitive threats to a business which has until now seen limited
competition ndash and the risk that prevailing margins are unsustainable even through the near term ndash go underappreciated
Dollaramarsquos poor Q2 cooled analystsrsquo optimism to some extent but we believe that the reaction was largely reactive and
superficial as they adjusted their price targets in such a way that in aggregate they saw exactly the same upside after the
post-Q2 dip as they did before The market still does not fully appreciate the magnitude of the threats facing Dollarama
All price targets in C$ Before Q2 Release After Q2 Release
Firm Recommendation Target PriceUpside (on 82818) Recommendation Target Price
Upside (on 9172018)
Upside (Present)
RBC Capital Markets Outperform $5500 12 Outperform $5200 22 35
Raymond James Outperform $5567 13 Outperform $5000 17 30
Macquarie Outperform $5633 14 Outperform $4900 15 27
BMO Capital Markets Outperform $6100 24 Market Perform $4700 10 22
CIBC Capital Markets Outperform $5900 20 Neutral $4600 8 20
Desjardins Securities Buy $5800 18 Hold $4500 6 17
Veritas Investment Research Co Buy $5600 14 Buy $4800 13 25
Industrial Alliance Securities Hold $5450 11 Buy $5450 28 42
Canaccord Genuity Buy $5900 20 Buy $5500 29 43
Barclays Equal Weight $5200 5 Equal Weight $4400 3 14
TD Securities Buy $5900 20 Hold $4900 15 27
Accountability Research Corp Buy $5400 10 Buy $5000 17 30
National Bank Financial Outperform $5567 13 Sector Perform $4800 13 25
Scotia Capital Sector Outperform $5567 13 Sector Outperform $5050 19 31
Wells Fargo Securities Market Perform $5300 7 Market Perform $4000 -6 4
AVERAGE $5626 14 $4853 14 26
While analysts are still not sufficiently critical of Dollarama the more recent downward move in the stock and subsequent analyst
downgrades may suggest that the market could be primed to evaluate the Company and its growth story with a more discerning eye
We believe that the issues which we highlight in this report will provoke further professional skepticism among analysts and investors
48
Dollarama Not Priced To Perfection ndashPriced Beyond Perfection
We can get close to DOLrsquos current valuation only if we value it as a mature ex-growth business today under
managementrsquos lofty goals for the business for ten years into the future applying no discounts for time
business risk etc
Managementrsquos ten-year store target
bull Current store count 1178 (70 of long-
term target)
Even if Dollarama were a mature business today under managementrsquos long-term targets for the business
DOL stock would not have no upside to current share prices
The market is pricing DOL beyond perfection ndash a valuation this lofty cannot be justified today
Mature Business ValuationC$ MM unless noted
Stores 1700
Revenue per Store $32
Total Revenue $5440
Operating Margin 220
Operating Profit $1197
Interest Expense $50
Tax (275) $315
Net Income $831
Diluted Shares Outstanding 332
EPS $251
PE Multiple 152x
Target Price $3815
Upside -1
Average operating margin since Q1 FY 2016
bull Assumes that DOLrsquos unusually high
margins are sustainable despite
intensifying competition loss of recent FX
benefit and customer pushback against
price hikes
Mature revenue per store estimate
bull Current average revenue per store
~$28M (875 of long-term target)
Industry median NTM PE multiple
bull Assigns no discount to DOL due to
declining store traffic vs peers incoming
competitive threats inefficient distribution
network etc
49
Dollarama Not Priced To Perfection ndashPriced Beyond Perfection (Continued)
Put another way The market is implicitly taking it for
granted that Dollarama will achieve its lofty ten-year
growth targets assuming sustained profitability levels
and per-store efficiency ndash and applying close to the
industry median FY1 EVEBITDA multiple to Dollaramarsquos
FY 2027 EBITDA
Just under ten-
year target
What kind of growth is the market implicitly betting on if
we value Dollarama on par with peers
bull 150 more stores than managementrsquos ten-year target ndash
within nine years
bull 48 CAGR in revenue per store
bull Zero margin compression
FY 2027 Estimates if Management Executes Growth Plans Perfectly
(C$ MM unless noted)
Stores (Year-End) 1688
Revenue per Store $33
Total Revenue $5503
Gross Margin 380
Gross Profit $2093
SGampA per Store 04
SGampA Total 689
EBITDA (FY 2027) $1404
Market Cap 12752
Debt 1880
Cash 182
Enterprise Value $14450
EVEBITDA (FY 2027) 103x
Industry Median EVEBITDA (FY1) 110x
Average gross
margin ex-
hedge gains
since FY 2016
Mature revenue
per store
estimate (15
growth CAGR)
FY 2018 SGampA
per Store
Implied FY 2027
multiple close to
industry median FY1
multiple
FY 2027 Estimates To Justify Prevailing Valuation (C$ MM unless noted)
Stores (Year-End) 1858
Revenue per Store $44
Total Revenue $7929
Gross Margin 380
Gross Profit $3016
SGampA per Store 04
SGampA Total 755
EBITDA (FY 2027) $2261
EVEBITDA (FY 2027) 62x
Enterprise Value 13947
Debt 1880
Cash 182
Equity Valuation $12249
Diluted Shares Outstanding 332
Target Price $3693
Current Price $3845
158 over ten-
year target in
nine years
48 growth
CAGR in
SalesStore
Industry median
FY1 multiple
discounted
75 annually
Average gross
margin ex-
hedge gains
since FY 2016
FY 2018 SGampA
per Store
High forecast gives
us 4 DOWNSIDE
50
Valuation Far Out Of Line With Peers And Historical Multiples
DOL shares trade at a 50-60 premium to peers in the discount retail industry The market is valuing DOL much more like a high-
growth tech company than a brick-and-mortar dollar store (and one with concerning fundamental trends at that) Note that this still
holds true even after DOL shares traded down significantly following its recent Q2 earnings report
It is difficult to justify a valuation this high even if one is bullish on DOL vis-agrave-vis the rest of the industry
Company Ticker
3-Year Consensus Revenue
CAGR
FY 2018 EBITDA Margin
PE(NTM)
PE(FY2)
EVEBITDA(NTM)
EVEBITDA(FY2)
EVSales(NTM)
Dollar Tree DLTR 43 121 139x 134x 91x 88x 10x
Dollar General DG 75 104 163x 162x 112x 112x 12x
Big Lots BIG 06 85 87x 87x 52x 53x 04x
Five Below FIVE 210 162 360x 412x 2113x 243x 32x
Canadian Tire CTC CN 20 90 179x 181x 82x 83x 10x
Metro MRU CN 80 73 142x 139x 99x 101x 08x
MEDIAN 59 97 152x 151x 95x 110x 10x
Dollarama DOL CN 85 255 229x 223x 164x 163x 41x
DOL PREMIUM 505 477 727 509 3057
Does DOL ndash a value retailer
demonstrating concerning
fundamental trends ndash deserve
to be valued on par with
higher-growth industries and
completely out of line with its
industry peers
Profitability is impressive but
likely unsustainable in the face
of growing competition
Enterprise Value Revenues Enterprise Value Adj EBITDA Price Adj EPSDOL shares also trade at
a significant premium to
historical multiples
despite unsustainable
margins an increasingly
saturated market and
rising competitive
threats
51
Does The Market Think Dollarama Is A Dollar Store Or A Premium Retail Brand
Dollarama is valued much more closely to premium retail brands than its discount retail peer group
A bull might ldquojustifyrdquo this by pointing to Dollaramarsquos profitability profile and growth expectations but its EBITDA margins are so
out of line with those of its peers that one is forced to question whether they are sustainable (at best) or honest (at worst)
As discussed Dollaramarsquos consensus sales growth numbers also ignore looming fundamental threats to the business
Company TickerGross
Margin (NTM)
EBITDA Margin (NTM)
Sales Growth (NTM)
EVEBITDA(NTM)
PE(NTM)
EVSales(NTM)
Dollar Tree DLTR 31 11 28 91x 139x 10x
Dollar General DG 31 10 89 112x 163x 12x
Big Lots BIG 41 7 -08 52x 87x 04x
Five Below FIVE 36 15 203 2113x 360x 32x
Canadian Tire CTC CN 34 12 40 82x 179x 10x
Metro MRU CN 19 7 88 99x 142x 08x
MEDIAN 33 11 64 95x 152x 10x
Dollarama DOL CN 40 25 99 164x 229x 41x
DOL PREMIUM 727 505 3057
How does Dollarama support EBITDA
margins more than double those of its
peer group and in line with premium
global retail brands
Company TickerGross
Margin (NTM)
EBITDA Margin (NTM)
Sales Growth (NTM)
EVEBITDA (NTM)
PE (NTM)EVSales
(NTM)
Ferragamo SFER IM 65 17 48 160x 260x 26x
Hermes RMS FP 69 38 84 200x 350x 78x
Prada 1913 HK 74 22 78 100x 210x 23x
Tiffany amp Co TIF 64 24 51 113x 196x 28x
MEDIAN 67 23 65 137x 235x 27x
Dollarama DOL CN 40 25 99 164x 229x 41x
DOL PREMIUM 197 -26 519
Does a discount retailer facing
fundamental headwinds deserve to be
priced 50 or more above its peer
group and closer to global
premium retail brands
52
Margins And Multiples Materially Out-of-Line With Peers
We do not believe that Dollaramarsquos profitability levels ndash which are entirely out of line with peers ndash are justified or sustainable in an
industry as competitive as deep discount retail The Company is already struggling to meet store count growth targets raising the
likelihood that its store growth plan will be dilutive to margins The market assigns a premium valuation to Dollarama on the basis
of relatively high growth expectations and the Companyrsquos industry-leading margins However as discussed throughout this
report we doubt both managementrsquos ability to meet its growth targets and its ability to maintain prevailing profitability levels The
likelihood that the Company will be able to achieve BOTH of these goals simultaneously is even slimmer Accordingly we believe
that the basis for Dollaramarsquos substantial share price premium is unfounded
Dollaramarsquos margin profile is grossly out of
line with peers and we find evidence of
aggressive accounting and questionable
business practices that can partly explain the
issue We doubt that this would be sustainable
even if management wasnrsquot growing the chain
How will a lowno-moat business with falling
per-store traffic be able to maintain its
remarkable profitability advantage while
aggressively expanding its store base
DLTRDG
BIG
FIVE
CTCCN
MRUCNWNCN
DOLCN
0
5
10
15
20
25
30
10 15 20 25 30 35 40 45 50
EBIT
DA
Mar
gin
Gross Margin
Dollarama Margins Completely Out Of Line With Peers
The premium in Dollaramarsquos share
price is driven by the marketrsquos trust in
managementrsquos growth initiatives and
its recognition of the Companyrsquos
dominant profitability
However neither its profitability
advantage nor its growth prospects
are sustainable The likelihood that
management simultaneously
preserves BOTH is extremely low
Big Lots (BIG) Dollar Tree (DLTR) Dollar General (DG) Metro Inc (MRU CN) and Canadian Tire (CTC CN)
x
5x
10x
15x
20x
25x
BIG DLTR MRU CN DG CTC CN DOL CN
PE (NTM)
x
4x
8x
12x
16x
20x
BIG DLTR MRU CN DG CTC CN DOL CN
EVEBITDA
53
Valuing DOL As A Mature Business In The Canadian Market ~40 Downside
C$ MM unlessotherwise noted
Current Run-Rate Valuation
Priced Beyond Perfection
Reasonable Downside
Stores 1170 1700 1500
RevenuesStore 28 32 30
Revenues 3320 5440 4500
Operating Margin 23 22 18
Operating Profit 764 1197 801
Interest Expense 42 50 50
Tax 275 198 315 207
Net Income 523 831 544
Shares 332 332 332
EPS $158 $251 $164
Multiple 24x 16x ~15x
Share Price $3845 $3966 $2460
Upside (Downside) 3 Approx -40
As discussed earlier at 1700 stores DOL would have greater penetration than both Dollar General (DG) and Dollar Tree (DLTR)
which both offer a much broader assortment of goods including perishablesconsumables Meanwhile the US appears to be
overstored versus Canada It is likely unreasonable for DOL to target per capita penetration levels on par with its US peers
Even if we assume that DOL can reach similar penetration levels and match company
growth targets ndash with steady margins no less ndash DOL has little upside
Valuing DOL as a mature business at its upper penetration bound implies ~40 downside
in a more realistic yet still generous scenario in which DOL is valued in line with peers
Higher Canada
store count vis-agrave-
vis comparable US
store count
compared to
Walmart
Higher Canada
store concentration
vis-agrave-vis
comparable US
store concentration
than Walmart
Achieving
managementrsquos
1700 store target
would put DOL at a
higher per capita
penetration level
than US peers
Store Count by Region
Canada US CanUS Ratio
WMT 410 5358 77DOL ndash Present 1178 14750 80DOL ndash Future 1700 14750 115
DOL CN DG DLTR
Stores 1700 14760 14732
Population (M) 36 326 326
StoresCapita (M) 472 453 452
Downside Run-Rate Operating Margin Estimate
ProfitabilityCost Measure JustificationGross Margin Target Recent Historical Average 370
Current SGampA Recent Historical Average 167
Add
Advertising Expense Normalization
Industry Average05
Rent Expense NormalizationAdjusting for Depreciation Rearranged
from Rent Expense 05
Depreciation Catch-Up Matching DampA schedules 15
Pro Forma SGampA 192
Pro Forma Operating Margin 178
Store Count per Mil People by Region
Canada US CanUS Ratio
WMT 114 164 69DOL ndash Present 327 452 72DOL ndash Future 472 452 104

6
Spruce Point Believes Dollarama (TSX DOL) Is A ldquoStrong Sellrdquo With ~40 Downside Risk
A Retailer Of Low-End Products With Declining Fundamentals In An Increasingly Competitive Environment
bull Undifferentiated Products Dollarama sells a variety of low-priced products mostly sourced directly from China Its purported advantage in ldquosourcingrdquo is contradicted by conversations with industry sources as well as numerous IP infringement lawsuits filed against the Company
bull Moving Upmarket Is A Risky Strategy Faced with years of negative average traffic growth and an increasingly saturated market Dollarama is driving comparable store sales growth by selling higher-priced items However in doing so it is quickly losing its reputation as a true ldquodollar storerdquo and per-store traffic numbers are declining as a result Big Lots (NYSE BIG) undertook a similar strategy in the 2000s but reversed course after admitting its failure
bull Saturation Is Imminent Dollarama cited a 900 store target at the time of its IPO in 2009 when it had just 585 stores Management has since revised this number upwards multiple times first to 1200 then to 1400 and most recently to 1700 Our analysis shows that this target is unrealistic and that the market is already bordering on oversaturation Dollaramarsquos FY lsquo19 store opening pace has thus far been its slowest in years
bull Margins Inexplicably High And Likely Unsustainable Gross margins of 39-40 are remarkably high for a discount retailer but intensifying competition rising labor costs rising transportation costs and a lapsing currency hedge benefit all threaten Dollaramarsquos high profitability levels Patterns in Dollaramarsquos hedging profits and gross margins ex-hedging suggest that management may be leaning on its FX-related profits to prevent its headline gross margin number from declining (see note on next page)
Troublesome Management And Governance Red Flags
bull Founding Family (And A Director) Have Significant Related-Party Deals The Rossy family launched Dollarama from its legacy retail chain in 1992 and owns significant real estate assets that are employed by the enterprise This may have played a role in managementrsquos recent decision to acquire Dollaramarsquos existing Montreal distribution center from the Rossys rather than open a second distribution facility in western Canada as have most peers
bull CEO Stepped Down And Installed His Son Larry Rossy stepped down as CEO in 2016 (and as Chairman in 2018) selecting as his replacement his son Neil ndashpreviously Dollaramarsquos Chief Merchandising Officer We question whether a thorough and arms-length search was conducted to fill this position
bull Opaque Supplier Relationship As part of a deal struck in 2013 Dollarama supplies goods (at an undisclosed profit margin) to Central American discount retailer Dollar City in exchange for an option to acquire the chain in 2020 However Dollarama currently has no formal stake in Dollar City and therefore does not consolidate Dollar Cityrsquos results We are concerned that Dollar City could be overpaying its vendors to lessen the financial burden on Dollarama
bull Insider Ownership Declining Former CEO Larry Rossy has sold or transferred ~75 of his shares since the 2009 IPO Bain Capital liquidated the last of its shares in 2011 at a split-adjusted price of $5 per share 18th the current price The current CFO owns no shares and regularly liquidates options
Dollarama (DOL or ldquothe Companyrdquo) is a dollar store which following a series of price hikes over the course of several yearsis no longer a true
ldquodollar storerdquo As a result DOL has fallen out of favor with value-oriented customers causing average store traffic to contract and thus
necessitating further price hikes to support SSS growth Management is nonetheless aggressively pursuing unrealistic growth targets even as
competitors flood the discount retail market and threaten its improbable margins DOLrsquos shares trade at a 50 premium to peers in the value
retail space ndash even following a ~20 drop after a disappointing Q2 ndash questionable governance and poor earnings quality notwithstanding
We believe that DOL will continue to miss lofty investor expectations and that its premium valuation will continue to be pressured
7
Spruce Point Believes Dollarama (TSX DOL) Is A ldquoStrong Sellrdquo With ~40 Downside Risk
Questionable Accounting Techniques And Capital Allocation Decisions Weaken Quality Of Earnings And Financial Position
bull Currency Hedge Supposedly A Pure Offset To CAD Depreciation But Has Been A Material Profit Center Dollarama claims to hedge currencies only to lock in consistent prices (in CAD) on which its customers can rely However in practice the Company adjusts prices to match non-hedged competitors leaving us to wonder why it hedges at all Much of the recent hedge benefit appears to have reversed but gross margins ex-hedges conveniently rose by just enough over the last two years to maintain steady profitability If nothing else we question whether Dollaramarsquos elevated margins are sustainable
bull Tenant Allowances And Leasehold Improvements Are Amortized Over Very Different Periods While accounting rules may give sufficient leeway to permit this difference we question why lease term assumptions should differ for these two capital accounts Earnings quality suffers notwithstanding
bull Sales Of Certain Assets Such As Vehicles Appear To Be Completed At Above-Market Prices While the financial impact of these moves is difficult to quantify (perhaps due in part to Dollaramarsquos opaque relationship with Dollar City) the liquidation of certain assets is significant in some quarters
bull Leverage Is Increasing Dollarama makes long-term financing decisions using short-term debt the cost of which has risen with recent debt issuances andis likely to continue to increase with rising interest rates ndash and as the Companyrsquos credit profile grows riskier We question managementrsquos decision to increase leverage to support buybacks and dividends simply because the earnings yield is above the after-tax cost of debt We also worry about the state of the balance sheet should the economic environment turn or should the business decline more rapidly
bull Depreciation Is Well Below Capex And Has Been For Years Capital spending easily bests industry peers both as a percentage of sales and vis-agrave-vis steadier DampA charges The mismatch with DampA suggests poor quality of earnings at the very least Meanwhile managementrsquos growth orientation has diverted capital spending away from store remodeling giving stores a stale and dated feel despite rising price points
bull Acquiring Real Estate Flatters EBITDA Acquiring related-party real estate not only lines the pockets of the founding family but also allows Dollarama to shift rent expenses out of the operating line The artificial EBITDA boost helps management to achieve its EBITDA-based compensation targets
Easy To Justify ~40 Downside In DOL Shares
bull Valuation Is Indefensible DOL currently trades at a ~50 premium to peers and carries among the highest multiples of any global retailer Higher only are the valuations of cregraveme de la cregraveme global fashion brands ndash Hermes Prada Ferragamo etc Such lofty multiples are inappropriate for a dollar store with serious near-to-medium-term business risks Analyst estimates are not sufficiently skeptical of managementrsquos targets in light of these concerns
bull Even If Nothing Goes Wrong The Stock Is Overvalued Even if Dollarama executes its growth plan perfectly maintains its world-leading margin and retains a hefty valuation premium to its peers the stock is at best fairly valued at ~$43
bull Under More Reasonable Assumptions DOL Stock Is Overvalued By 40 At Current Levels Even assuming that Dollarama achieves full market penetration ndash with no negative impact on per-store revenues from competition or cannibalization ndash the stock is worth $28 under normalized margins and at a multiple closer to peer norms down ~40 from current levels
bull Analysts Bullish But Wavering Dollaramarsquos disappointing Q2 ndash including SSS guidance contraction and a YoY decline in operating cash flow ndash provoked some downgrades but analysts still see ~26 upside in DOL shares regardless We believe that analysts are too trusting of DOLrsquos growth targets but that the Q2 miss put the Company on notice with a number of analysts Further disappointing quarters could bring more drastic analyst revisions
8
Consensus Estimates (CY) 2018A LTM 2019E 2020E
Stock Price $3845 EV Sales 44x 43x 40x 38x
Shares Outstanding 332 EV EBITDA 174x 167x 161x 149x
Market Capitalization 12752 Adj EV EBITDAR 153x 148x - -
Total Debt Outstanding 1880 Price EPS 254x 241x 224x 199x
Less Cash and Equivalents 182
Enterprise Value 14450 Growth and Margins 2018A LTM 2019E 2020E
Operating Leases 1130 Sales Growth 102 84 102 65
Finance Leases 4 EBITDA Margin 255 256 249 254
Adj Enterprise Value 15584 EPS Growth 228 160 130 127
Credit Metrics 2018A LTM 2019E 2020E
Net Debt EBITDA 20x 20x 19x 17x
Adj Net Debt EBITDAR 28x 27x - -
Capital Structure And Valuation
In C$ MM except per share figures or where indicated
At present Dollarama demonstrates impressive margins and is not egregiously over-levered on a Net Debt-to-EBITDA
basis However as competition increases customers push back against recent price hikes and operating costs creep
upwards we believe that management will have a difficult time maintaining current profitability levels ndash particularly
while pursuing an aggressive growth strategy Leverage will be less sustainable should the businessrsquo performance
decline or the economic environment turn threatening managementrsquos ability to support continued buybacks
dividends while growing store count
Source Dollarama and Bloomberg Estimates
Note Calendar Year Ended Jan 30th
Note Operating Leases valued at 6x Operating Lease Expense
Though analysts
project declining sales
growth they foresee
margin expansion at
the same time This
pair of estimates
makes little sense to
us and should make
investors skeptical of
consensus estimates
Our research will
explain why we
believe margins will be
pressured going
forward
9
Short-Term Debt In A Rising Rate Environment Introduces Refinancing Risk
Significant Short-Term Debt Maturities That Will Have To Be Refinanced At
Higher Rates
Dollarama Has Unhedged Exposure To Interest
Rateshellip
hellipWhile The Three-Month CDOR Rate Rises Rapidly
Source Dollarama
Source Bloomberg
Dollarama refinanced significant short-term debt just last evening levering up the business in the process
Management refinanced its C$400M of 3095 fixed-rate notes due this November with C$500M of 355 fixed-rate
notes due November 2023 Managementrsquos use of short-term debt has burdened the business with refinancing risk in
an environment in which the CDOR rate has risen sharply and is expected to rise for the foreseeable future which has
now forced the Company to bear materially higher interest expenses (compare to its 2203 fixed-rate credit due in
2022) The Company still has C$14B of debt due to mature within the next 12 quarters (including its credit facility)
leaving it exposed to further rate increases The Companyrsquos weighted average debt maturity is about 35 years
320
680
DOLCN Credit Breakdown (C$1875M Total)
Floating Fixed$0
$100
$200
$300
$400
$500
$600DOLCN Debt Maturity Schedule (by CY Quarter)
Available in Revolving Credit Facility Maturing Sep 2023 Available in Revolving Credit Facility Maturing Sep 2020
Series 2 Variable Rate CDOR+59bp Series 3 Variable Rate CDOR+27bp
Fixed Rate 2203 Fixed Rate 2337
Fixed Rate 355
10
Will Dollarama Be The Next Bain Capital-Led Failed Retail IPO
ldquoTwenty-two percent of Bain LBOs from 1984 to 1992 went bankruptrdquo according to Eileen Applebaum in her book
ldquoPrivate Equity at Workrdquo1 Recent Bain-led retail busts include Toys ldquoRrdquo Us Guitar Center and Gymboree
Company DateEnterprise
ValueBain Capital Quotes Outcome
Toys ldquoRrdquo Us March 17 2005 $6600
Toys R Us and Babies R Us are premiere franchises with strong global brand recognition and a collection of high quality product offerings
including toys childrens apparel and baby products and accessories We are excited by the prospect of partnering with the management team and
employees to strengthen the long-term operating and financial performance of the businessesldquo -Matt Levin a MD at Bain
Toys ldquoRrdquo Us Files For BankruptcySept 2018
MichaelsStores
July 1 2006 $6000
We are delighted to partner with the Michaels management team to help build on its already strong position in an attractive industry and
capitalize on the significant growth opportunities that lie ahead Our deep experience in the retail sector reinforces our conviction that Michaels has
the best store locations a broad and attractive assortment of products for crafters of all ages and a sustainable competitive advantage thanks to smart investments in systems and infrastructure We look forward to helping Michaels achieve its full long-term potentialldquo ndash Matt Levin MD
IPO prices at low end of range (June 2014)
Share Price Hits Multi-Year Low in Oct 2018
As SSS Decline
Guitar Center June 27 2007 $2100
ldquoAs the leading retailer of musical instruments in the US Guitar Center enjoys great brand recognition among musicians nationwide a loyal
customer base and a track record of significant growth We look forward to working with the Companyrsquos experienced and capable management
team to continue to build the businessrdquo Jordan Hitch a MD at Bain
The End of Guitar Center
AndGuitar Center Troubles
Only Getting Worse
Gymboree Oct 22 2010 $1800
Gymboree is a terrific company with incredible brand strength and a large population of extremely satisfied customers We look forward to
working with Matthew McCauley and the companys proven and experienced management teamldquo Jordan Hitch MD at Bain Capital
Gymboree Hires Restructuring Counsel
1) Source ldquoBain Capital Sees High Profile Buyouts Go Bustrdquo NY Post March 2018
A Low-End Retailer With Unsustainably High Margins
12
Undifferentiated Goods amp Knock-Off Products
Dollarama sells undifferentiated low-priced consumer goods competing almost entirely on price Many of its products are
knock-offs It is no surprise that the Company has been sued by several companies for trademark infringement
How Dollarama became the retail king of knockoffsSelling cheap imitations of more expensive brands has turned Dollarama into one of Canadarsquos most
successful retailers earning it big bucks and plenty of lawsuits (Source)
ldquoI think they have good lawyers working
for themrdquo says David Lipkus a lawyer
specializing in anti-counterfeit in Toronto
who has helped clients sue businesses in
Canada selling knock-offs ldquoOften
retailers make mistakes and end up
selling fakesrdquo Many lawsuits are settled
privately but the store has been sued
by Nike for selling counterfeit
footwear emblazoned with Nikersquos
iconic basketball player silhouette and
by Umbra a home decoration company
for selling a style of waste basket In
February 2017 Dixon Ticonderoga
launched a suit against the dollar
store chain for a pencil itrsquos been
selling since 2002
Dollarama sells a wide range of discounted knock-offs across product categories
Its business invites litigation
Brazen mimicry multiple knock-offs
of a single producer (Mars)
Source
13
Per-Store Traffic Growth Stagnant But Opportunities For Price Increases May Be Exhausted
Growth in per-store sales has been driven by transaction size growth against declining per-store traffic Transaction
size growth has itself been driven by sales of higher-priced items Dollaramarsquos maximum price point has risen from
$1 prior to FY 2008 to $2 in FY 2008-09 to $3 in FY 2012 to $4 in FY 2017
Contracting store traffic puts per-store sales growth at risk absent further price increases but we question whether
price-driven SSS growth is sustainable as higher prices erode Dollaramarsquos value proposition and put it in closer
competition with more comprehensive big-box retailers Management has expressed reluctance to raise prices further
in the near term regardless (though they said the same when the max price was bumped to $3 several years ago) With
recent price increases now lapping for the first time SSS growth may be at risk
Growth has been propped up by price increases which have made its products more expensive than those at dollar store peers
Between a rock and a hard place Does management continue to erode Dollaramarsquos value proposition with price increases or
keep prices steady and hope for traffic contraction to reverse
Average Quarterly YOY
Growth in Per Store Traffic
-18 since Q1 2014
Transaction
size growth
decelerating
14
Increasing Average Unit Revenues Is A Very Risky Strategy That Has Failed Before
Raising price points to prop up SSS growth against falling store traffic is a major risk for discount retailers as their
entire value proposition comes from their low prices Higher prices may turn off customers and create difficult
comps in the event that price increases must be paused or reversed due to customer pushback
In 2006 for example Big Lots ndash a US discount retailer ndash introduced higher-ticket brand-name items in place of
comparable budget goods in an effort to get customers to spend more per visit This strategy reinvigorated same-
store sales growth for a time but ultimately failed Subsequent difficult comps resulted in negative SSS growth after
management abandoned its so-called ldquoRaise the Ringrdquo strategy
Raise the Ring is
abandoned lower price
points are emphasized
Raise the Ring is
introduced higher priced
items are emphasized
Big Lots alienated shoppers who were
seeking cut-price name-brand goods after
venturing into other areas
like selling frozen food
ldquoOur customer doesnrsquot come to us expecting a
Nordstromrsquos level of in-store shopping
experience They want value treasures
merchandise on the floor and clean restrooms
and we need to meet those expectationsrdquo
[CEO Steve] Fishman said in 2005
hellip
ldquoWersquore an enigmardquo he said at an investor
conference this month ldquoItrsquos been a real
challenge for the marketplacerdquo Source
Calls with industry experts indicate that Dollarama is losing more price-conscious customers to Dollar Tree and other discount retailers
following its efforts to raise prices and that this is a major driver behind recent per-store traffic declines
If price-conscious customers arenrsquot interested in shopping at Dollarama we wonder who ishellip
15
ldquoNothingForADollaramardquo Customers Becoming Conscious Of Price Increases Versus Competitors
Dollaramarsquos price increases may not yet put its prices on par with those of big box retailers like Walmart but
customers have taken notice that Dollarama has increased prices against other Canadian dollar stores Comments
from various internet forums and news sites reveal that customers no longer believe that Dollarama offers as much
value as do other discount retailers suggesting that the strength of Dollaramarsquos value proposition ndash the source of
its appeal and foundation of its business model ndash is at risk The below comments are anecdotal but comments of
this sort regarding Dollarama in particular are nonetheless common among relevant websites
ldquoThe dollar store is no longer a bargain if you
shop around you can by the same things
cheaper or same price elsewhere quit
calling it dollarama no more dollar thingsrdquo
Source
ldquodollar tree here is drastically cheaper then
dollarammardquo ndash Cody Williams
ldquoCody Williams Same here Dollarama is not
really a dollar store anymorerdquo ndash JJ Walker
Source
ldquoI enjoyed the days when everything in Rama
actually was a dollar I go to Dollar Tree
more often now just because everything
there is $125 - ($1 in the US of course)rdquo
Source
ldquoTheir high prices is the problem they still
have better selection than Dollar Tree but
their prices are always higher I know some
dollar store shoppers who go to Dollar
Tree first for the better prices and then go
to Dollarama for the stuff they couldnt
find at Dollar Tree Myself personally have
watched the prices creep up A pair of work
gloves climbed from $250 to 4 or 5 bucks
the discount over Home Depot is only a
buck or two now Also Dollar Tree still
keeps all items under 2 bucks I believerdquo
Source
ldquoThey gonna have to change the Dollarama
name soonrdquo
ldquodollarandaquarterramardquo
ldquoNew Name NothingForaDollarrdquo
ldquoYou forgot lsquoramarsquo NothingForADollaramardquo
ldquoAs for a new name how about
FiveFinaramardquo
ldquofive or lessarmardquo
Source
ldquoDollarRama is no longer in the same
category since they sell at higher prices
more of a discounted store and not a dollar
storerdquo
Source
Just did a quick check of my cleaning cupboard
DT=Dollar Tree DM=Dollarama
- 284L bleach $125 at DT Sometimes they even
have the big 37L bottles Never seen bleach that
cheap at DM
- 976ml Fabric Refresher $125 at DT DM sells it for
$150 and its a smaller bottle
- Oxy First Force spray cleaner $125 at DT $150 at
DM
DT also has a selection of other spray cleaners at
$125 while even other no name ones at DM can go
up to $2
- No name dish soap 1479ml (almost 15L) for $125
at DT 500ml for a $1 (or I guess $125 soon) at DM
- No name Mr Clean sponges At DT its two full
sponges for $125 At DM each sponge is half Mr
Clean cleaner sponge and half normal cheap sponge
- Those square no name tupperware containers that
are 3 for $125 at DM are 4 for $125 at DT
At the dollar-ish level everything Ive found at DT
has been a better value and equal or better
quality
Source
16
Transitioning Away From ldquoDollar Storerdquo Identity Threatens Customer Loyalty
Perhaps in recognition of the fact that Dollarama is losing its status as a true dollar store and that it now belongs to a
different category management has stricken almost all references to ldquodollar storesrdquo from Company filings This poses
a major threat to Dollaramarsquos customer appeal as evidenced by traffic trends and anecdotal customer reactions
FY 2017 Annual Information Form FY 2018 Annual Information Form
17
Margins Are Inexplicably High And Perhaps Unsustainable
We acknowledge that Dollarama is a strong operator with a strong value proposition (though perhaps a declining one) However
we question whether a discount retailer reselling Chinese knock-offs should garner among the highest operating margins of all
global retailers and whether a discount retailer with declining per-store traffic can continue to rely on price hikes for SSS growth
Dollarama stands out among global consumer companies and retailers ndash
45th out of 584 global retailers by operating margin (and 12th out of 584
global retailers by revenue multiple)
Dollarama consistently produces operating margins materially higher than
industry peers and higher than historical industry norms This gap has
only grown more substantial through the last five years
0
5
10
15
20
25
FY 2008 FY 2009 FY 2010 FY 2011 FY 2012 FY 2013 FY 2014 FY 2015 FY 2016 FY 2017 FY 2018
Peer Median Operating Margins vs Dollarama
Peer Median DOL CN
-10
-5
0
5
10
15
20
25
FY 1
989
FY 1
990
FY 1
991
FY 1
992
FY 1
993
FY 1
994
FY 1
995
FY 1
996
FY 1
997
FY 1
998
FY 1
999
FY 2
000
FY 2
001
FY 2
002
FY 2
003
FY 2
004
FY 2
005
FY 2
006
FY 2
007
FY 2
008
FY 2
009
FY 2
010
FY 2
011
FY 2
012
FY 2
013
FY 2
014
FY 2
015
FY 2
016
FY 2
017
FY 2
018
Dollarama Operating Margins vs Peers
DG FDO DLTR FRED BIG DOL CN
Source Bloomberg EQS function Source Dollarama and company filings
18
Debit Card Boost Is Played Out
Dollarama management has characterized the benefit from debit cards as being roughly a doubling in average purchase size
If true this benefit would be visible in year-over-year sales comps
The Company has not always disclosed penetration ndash and they ceased doing so after Q4 2016 ndash but the data suggest that the
average annual comp benefit was approximately 25 from FY 2013-16
Source Dollarama
00
05
10
15
20
25
30
35
40
45
0
10
20
30
40
50
60
Debit Card Penetration and Imputed Comp Benefit
Debit Card Penetration (LHS) Comp Benefit (RHS)
19
Have All The Levers Been Pulled
Dollarama has done a good job of increasing per-store revenue while investing in initiatives designed to remove operating
expenses We cannot fault management for pulling levers to expand margins but we believe the low-hanging
(and high-hanging) fruit has already been harvested
Management has also taken creative measures to raise effective average prices without raising prices directly ndash eg by
strategically replacing some lower-priced goods with close substitutes at higher price points and by reducing the size of
product bundles (pencils candies etc) without cutting prices Such back-door avenues to margin expansion may be exhausted
by this point as noted previously customers are beginning to notice that Dollarama no longer offers a value proposition
comparable to competing dollar stores
FY 13 FY 14 FY 15 FY 16 FY 17 FY 18
Revenue LeversAdd $250-$300
Price PointsDiscounting With Hedged Margins
Add $350-400 Price Points
Accept Credit and Debit Cards
Cost LeversDollar City
RelationshipNew POS Terminals
Kronos Labor Scheduling
Wi-Fi amp ScannersNew Warehouse
ConstructionWarehouse Expansion
Accounting and Financial Levers
Depreciation Schedule Change
Direct Profit from Currency Hedges
Leveraged Share Repurchase
ldquoThanks and good morning In the write up in the
discussion of the foreign exchange headwinds
and gross margin you also said you made select
changes to your product mix I am just wondering if
you could elaborate are there certain categories
thatrsquos your emphasizing in certain categories you are
deemphasizing I am just wondering what that
sentence really meantrdquo
- Peter Sklar BMO Capital Markets
ldquoIts really an item by item discussion Where the
compelling value remains and we are able to take for
example two pencils out of a pack and still be
competitive to help with offsetting some of the
headwinds thatrsquos the way we handle it or in other
cases if we replace the product with a new offering
thatrsquos just as compelling but different at a lower
cost potentially Thatrsquos another way Buyers can use
that tool to help them with the current challengesrdquo
- Michael Ross CFO Dollarama
Is this a sustainable practice as value-oriented customers lose faith in Dollarama
FY 2016 Q4 Earnings Call QampA
20
Costs Rising On Multiple Fronts
While management may have largely exhausted avenues for price increases and efficiency gains other industry and Company
developments threaten to drive up costs through the near term
Cost Driver Explanation
TariffsA significant share of goods (~20 according to industry experts) are sourced either directly or indirectly from the US Tariffs could increase costs on these goods materially
Minimum Wage Hikes
Provincial minimum wages in Canada generally rise much more frequently than do US minimum wages and many are scheduled to rise on an annual basis based on CPI growth Minimum wage hikes have been particularly significant of late (see below) Even provinces whose minimum wages are not tied to CPI growth have seen or are set to see material minimum wage hikes in the near future Notable recent and near-term changes are as follows
bull Alberta From $1360 to $1500 on October 1 2018 (103 increase)bull British Columbia From $1265 to $1385 on June 1 2019 to $1460 on June 1 2020 and to $1520 on June 1 2021 (63 CAGR)bull Ontario From $1160 to $1400 on January 1 2018 (207 increase) and to $1500 on January 1 2019 (additional 71 year-over-year increase)
Will rise according to Ontario CPI growth every October 1 each subsequent year New Ontario Premier Doug Ford is looking to reverse these plansbull Quebec Just increased to $1200 (+66 in May 2018) Significant political push to set provincial minimum wage at 50 of average provincial
minimum wage by 2020bull Manitoba New Brunswick Newfoundland Nova Scotia Ontario Saskatchewan and Yukon Annual minimum wage hikes according to national or
local CPI growth
Employee remuneration for FY 2018 was just over 10 of Dollarama revenue This cost item could realistically grow at a high single-digit rate over the next 2-3 years even if headcount is reduced
Transportation and Logistics
Industry experts have expressed concerns regarding near-term transportation cost increases These would hit Dollarama particularly hard as Dollarama is unique among industry peers It has only one distribution center Rather than invest in a second Dollarama recently purchased its existing distribution center in Montreal ndash which it previously leased from the Rossy family ndash for $394M (in addition to $232M spent on adjacent land) Other large Canadian value retailers generally have two distribution centers ndash one in the eastern half of the country and one in the western half
Rising fuel costs could result in materially higher transportation expenses as Dollarama distributes 92 of its merchandise through its single distribution center Industry experts suggest that shipping goods to Vancouver from Montreal via truck can be almost twice as expensive as shipping to Vancouver from China
We find it interesting that Dollarama chose to purchase property from managementrsquos family rather than follow industry norms and open a second distribution center in western Canada and that five of its six warehouses ndash all located in greater Montreal ndash are also leased from the Rossy family (the sixth warehouse is company-owned built on land purchased from the Rossy family)
MarketingDollarama has historically operated with no marketing expense However US peers spend 1-2 of revenue on average on marketing (see subsequent slides) As competition increases across the Canadian discount retail industry management may be forced to expand marketing efforts
21
Minimum Wage Growth Historically High And Accelerating Rapidly
Canada has seen fairly consistent minimum wage hikes since 2000 and minimum wage growth has outpaced inflation in all but
three years since the beginning of the millennium Dollarama has been able to manage minimum wage hikes and maintain
impressive margins since going public in 2009 Note however that minimum wage growth from 2009-17 was comparatively mild
relative to the prior half-decade Accelerating minimum wage growth through the near term will test managementrsquos ability to
insulate margins from rising labor costs
0
2
4
6
8
10
12
14
2001 2002 2003 2004 2005 2006 2007 2008 2009 2010 2011 2012 2013 2014 2015 2016 2017 2018YTD
Minimum Wage Growth Consistently Ahead of Inflation and Accelerating Rapidly
Weighted Average Minimum Wage Growth Canadian CPI Growth
Minimum wage growth across all Canadian provinces weighted by
province population
Management states that the vast majority of employees make more than minimum wage Nonetheless minimum wage hikes of 10-20 in
Canadarsquos most populous provinces could put material upward pressure on labor costs ndash particularly if these hikes spread to Quebec where
Dollaramarsquos distribution center and all of its warehouses are located Management includes a risk factor to this effect in its MDampA
210
215
220
225
230
235
240
245
250
255
260
FY 2018 EBITDA Margin FY 2018 EBITDA Margin with5 Labor Cost Hike
FY 2018 EBITDA Margin with10 Labor Cost Hike
EBITDA Margin Sensitivity to Labor Cost Hikes
12 weighted average minimum wage growth across Canada driven by
207 hikes in Ontario Average minimum wages could very realistically
continue to grow at high single-digit rates through the next ~2 years if
planned hikes are enacted
With labor costs representing about 10 of Dollarama revenue
profitability is materially sensitive to changes in this item
If labor costs were 10 higher in FY 2018 EBITDA margins would have
been slashed by 80 bps
Labor cost expansion of this magnitude would be significant but is not
necessarily out of the question within 2-3 years
Source Government of Canada
22
Lack Of Transparency Regarding Dollar City Is A Serious Concern
CEO Larry Rossy
and
CFO Michael Ross
mischaracterized
the sale by
attributing it to
vehicles which
has its own
categoryhellip
Why are Dollarama shopping carts being repurposed for Dollar City use
Perhaps they were sold above-market to Dollar City in FY 2013 when the relationship began Could this be the
reason for an unexplained $149M disposal of leasehold improvements that year
Source
1) Dollar City website and press
release announcing the relationship
Q ndash Keith Howlett ldquoOn Note 5 [of the FY
2013 Annual Report] I was trying to figure
out the leasehold improvements there
seemed to be some items called lsquodisposals
at costrsquo and therersquos sort of an offset thererdquo
A ndash Larry Rossy CEO ldquoI donrsquot know what
they are Yoursquore going to have to help me
out guys hererdquo
A ndash Michael Ross CFO ldquoDisposal of costs
that would be fixtures or related tohelliprdquo
A ndash Rossy ldquoI would say carsrdquo
A ndash Ross ldquoCars Yeah okay We sold a
few carsrdquo
Q ndash Howlett ldquoOh I see okay Well it
shows up as CAD 15M for a year thatrsquos a
lot of carsrdquo
A ndash Rossy ldquoOh itrsquos a very expensive
carrdquo
Source FY 2013 Q4 Earnings Call Source Dollarama
2013 Annual Report
In 2013 Dollarama entered into an agreement to export and sell products to Dollar City a Latin American dollar store with a
presence in El Salvador Guatemala and Colombia In exchange for selling goods to Dollar City ldquoat costrdquo plus a small markup
and providing business and operational expertise Dollarama was given an option to acquire the chain exercisable in February
2019 (since extended to February 2020)
Details about Dollar City are scarce Who is the management Where is company headquarters Who are the shareholders
Dollar Cityrsquos website provides limited information and not a single Dollar City manager was quoted at the initiation of the
relationship1 Though management claims to sell to Dollar City ldquoat costrdquo with a markup we have no way of determining how they
are calculating ldquocostrdquo It is more likely that Dollarama loads shared costs into the Dollar City bill that flatter Dollaramarsquos margins
and sells merchandise that isnrsquot selling well in Dollarama stores to Dollar City
More Competition Coming To An Already-Crowded Space
24
Evidence Of Dollarama Store Growth Slowing
The pace with which Dollarama opened stores through the past several years does not appear to be sustainable
Importantly the inevitable reversal in its pacing appears to be occurring this year
The Company opened just eight stores in Q2rsquo19 its lowest store opening count in any quarter of any recent year
Its YTD FY 2019 pace of 18 new stores is also trailing the average pace of recent fiscal years (28 openings) by
~35 Management did not provide a fully satisfactory explanation for this deficit
The slowdown in its pace of store openings could suggest that the Company is having a difficult time identifying
economically-viable locations as it seeks to grow its store count by close to 50 ndash still a very distant target
Fiscal YearStated New
Store Opening Goal
Q1 Q2 First Half Q3 Q4 Total
2019 60-70 10 8 18
2018 60-70 13 17 30 10 25 65
2017 60-70 8 13 21 18 26 65
2016 None 17 17 34 16 25 75
Source Dollarama financial filings
ldquoI want to ask about the pace of store
openings As you noted the slower start to
the year you did maintain the guidance for
this year But wondering about sort of further
beyond that obviously the store potential that
you put out there gives you room to remain at
that pace for a while But does the slower
same store sales assumption change your
thinking about how aggressively you want
to push new stores out thererdquo
- Mark Petrie CIBC
ldquoNo it does not It does not And that I would
also add that if the pace at which weve been
opening stores this year is slower than last year
as mentioned often that just relates to the
specific timing of real estate And if stores are
pushed closer to the end of the year it could be
that there is an overlap between a few more
stores at the end of this year or a few more
stores in the beginning of next year and the
end it will keep our pace of 60 to 70rdquo
- Michael Ross CFO Dollarama
ldquoReal estate timing issuesrdquo
do a poor job of explaining a
drop in H1 new store
openings of over a third
Source Dollarama Q2 FY 2019 Earnings Call
25
Dollarama Potentially Pushing The Limits Of The Canadian Market
Managementrsquos stated goal is to have 1700 stores across Canada by 2027 up from 1178 stores today We do not
believe that it can achieve this without risking significant cannibalization DOLrsquos target would imply a saturation level
higher than the largest US dollar stores (Dollar Tree and Dollar General) which also sell many more consumables and
grocery items Additionally Canada broadly has much lower levels of retail space per capita than the US suggesting
that Canadian concentration is even more pronounced all else equal
US Retail Square Footage Greater Than Canadian
Retail Square Footage
DOLrsquos Target Implies
Greater Than US
Saturation Despite
Narrower Concept
Source Wellington Management
Walmart is not opening stores in Canada suggesting that it believes
the Canadian market is saturated at 114 stores per million people ndash
about 69 of its US concentration (164 stores per million people)
Meanwhile Dollarama continues to expand within Canada despite
even higher Canadian concentration (327 per mil) relative to the US
concentration of large US dollar stores (452 per mil for a 72
ratio) This ratio would be over 100 at DOLrsquos 1700 store target
Higher Canada store
count vis-agrave-vis
comparable US
store count
compared to Walmart
Higher Canada store
concentration vis-agrave-
vis comparable US
store concentration
than Walmart
Retailers with similar store concentrations per capita across both the US and
Canada are effectively more concentrated in Canada vis-agrave-vis the total retail space
in either country
Store Count by Region
Canada US CanUS Ratio
WMT 410 5358 77
DOL ndash Present 1178 14750 80
DOL ndash Future 1700 14750 115
Store Count per Million People by Region
Canada US CanUS Ratio
WMT 114 164 69
DOL ndash Present 327 452 72
DOL ndash Future 472 452 104
DOL CN DG DLTR
Stores 1700 14760 14732
Population (M) 36 326 326
StoresCapita (M) 472 453 452
26
Dollarama Has Benefited From A Benign Competitive Environment
Large competitors have been shuttering Canadian stores continuously through the last four years due to company-
specific issues highlighted by the high-profile exits of Target and Big Lots from Canada12 We believe that this has been
a significant tailwind for Dollarama but one that is largely behind the Company at this juncture
Dollarama has been able to maintain significant share high margins and high returns on capital in large part due to
missteps among peers and the resulting lax competition This is likely unsustainable in a more competitive environment
as Dollarama has few material competitive advantages barriers to entry are low and its discount retailing strategy is not
unique Competent competition from growing industry players ndash Dollar Tree Canada Miniso and Amazon among others
ndash could be the straw that breaks the camelrsquos back for Dollaramarsquos profitability or growth (or both)
Fiscal YearCompany Exiting
CanadaStores Closed Revenue
DOL Revenue Capture
(Estimated)
Estimated Revenue Benefit
Revenue Boost
2018 Sears 200 $2000 3 $60 2
2017 Sears 100 $1000 3 $30 1
2016 Target 133 $2000 6 $120 4
2015 Big Lots 78 $155 10 $16 1
Last Four Year Average $56 2
Note All numbers are SPCM estimates
1) ldquoTarget Canada to close all stores by April 12rdquo
2) ldquoBig Lots Getting Back Out of Canadardquo
27
Light Competition Has Allowed The Company To Spend Nothing On Promotion ndash Until Now
Dollarama has no promotional expense Meanwhile promotional expenses average 1-2 of revenue among US
peers As established competitors continue to expand and as new competitors enter the market (Amazon included)
Dollaramarsquos no-cost marketing strategy may prove untenable
Promotional Expense
as a of Revenue
Intensifying Competition Threatens Dollaramarsquos
Passive Marketing Strategy
2016 2017 2018
BIG 180 180 170
FIVE 264 270 243
DLTR 021 029 048
DG 062 054 044
Average 132 133 126Source Huffington Post
Source Investorscom
The Canadian operation is also a relatively small part of the business However early results are
encouraging and despite competition in the Canadian market Dollar Tree has found success Longer
term the company is aiming for 1000 stores north of the border which does not seem unrealistic
Source Retail Environments
Calls with people at Dollar Tree suggest that the Company is working to
imitate elements of Dollaramarsquos strategy and store layout in its own
Canadian stores (eg raised shelves etc) and that it plans to expand
into Canada aggressively once its strategy is refined ndash likely in 2019
Source Company financial filings
28
Caught Between The Competition How Will Dollarama Fit In
Dollar Tree has maintained its reputation as a true dollar store nothing is priced higher than C$125 ($1 in the US)
Miniso has developed a reputation as a ldquonicerrdquo discount retailer items can cost up to C$25 but the environment is cleaner and
more modern and products are of better quality (but you can still get a dollar-level deal ndash most products are priced under C$10)
Dollarama has all the character of an old tired dollar store but without the dollar prices
Who will shop there unless management invests in store updates rather than opening new stores
Value-driven customers are by definition not loyal customers
Miniso
Clean and modern but cheap
Dollar Tree
No need for price tags everythingrsquos $1 Dollarama
Looks like Dollar Tree priced like Miniso
Irsquoll pass
29
Dollarama Makes No Effort To Appeal Millennials ndashThe Next (And Current) Shopping Generation
Dollarama has zero social media presence unlike all of its peers Not only is the Company out of touch with customers in
an industry which demands a high level of customer engagement but its brand is becoming demonstrably stale
Facebook Twitter Instagram YouTube LinkedIn Pinterest Google+
Dollar Tree Yes Yes Yes Yes Yes Yes No
Dollar General Yes Yes Yes Yes Yes Yes Yes
Family Dollar Yes Yes Yes Yes Yes Yes No
Big Lots Yes Yes Yes Yes Yes No Yes
Miniso (Canada N America)
Yes Yes Yes Yes Yes No No
Great Canadian Dollar Store
Yes Yes No No No No No
Dollarama No No No No No No No
Until now Dollarama has largely been a regional brand with satisfactory name recognition in its provincial home of Quebec
Now that the Company is making a bigger push into Anglophone Canada management should be more proactive in adapting its
strategy to new markets and to a new customer base Yet management continues to employ a strategy more befitting a sleepy
regional business it does not market or work to improve its brand it does not stay current with trends it keeps management
within the family and it is not expanding its logistics chain to support coast-to-coast growth (see subsequent slides)
Management wants Dollarama to be a national brand but it does not appear prepared to run a national business
Questionable Accounting And Financial Practices
31
Hedging Instruments A Material Source Of Profits In Recent Years
Dollaramarsquos sales are in Canadian dollars whereas a majority of its product purchases are US dollar-linked Management claims to enter
into CADUSD hedging arrangements to lock in near-term margins without having to adjust prices in response to FX movements However
management has nonetheless admittedly adjusted prices alongside unhedged peers in response to shifts in the CADUSD exchange rate
rendering its currency hedges a source of profit
Forex dynamics through the last two years have erased the large hedge benefit realized by Dollarama in FY 2016 but management reports
that gross margins have effectively remained flat through this period implying significant gross margin improvement in the underlying
business (see graphs below) As the currency hedge benefit has reversed through the last two years underlying gross margins have
purportedly risen by EXACTLY ENOUGH to keep total gross margins steady between 39-40 We find this oddly convenient ndash or at the very
least we question whether management will be able to maintain steady margins in the face of unfavorable FX rate dynamics in the future
Quick turnaround in
underlying
profitability Just in
time to keep the
declining forex hedge
benefit from dragging
down marginshellip
Even as FX hedge gains fell
from close to 8 of gross profit
in FY 2016 to a drag on gross
profit in FY 2018 gross margin
expanded by over 100 bps over
the same period implying gross
margin expansion ex-forex of
almost 300 bps within two years
for a retailer with gross margins
which were already unusually
high and whose margins had
contracted for four straight
years before the rapid reversal
32
Questionable Depreciation Assumptions
Dollarama changed its depreciation schedule for leasehold improvements (store fixtures) in FY 2015 moving from a 10-year to a 15-
year expected life1 However management did not concurrently lengthen the amortization schedule for tenant inducements
We find this mismatch curious as both quantities should be amortized depreciated over the expected life of a given lease
Adding to the confusion and appearance of foul play DOL discloses in its AIF that its average lease term is just 5 yrs and it just
started disclosing related-party dealing with Director Huw Thomas of SmartCentres ndash a REIT that lists DOL as a top 10 customer23
Lease term implied
by leasehold
depreciation expense
2-3x greater than that
implied by
amortization of
tenant allowance
Mismatch in implied
lease term
inappropriately
inflates EBIT
C$ MillionsFY
2013FY
2014FY
2015FY
2016FY
2017FY
2018
Amortization of Tenant Allowance $29 $35 $43 $49 $48 $51
Starting Balance Sheet Amount 168 207 232 280 344 386
Amortization as a of Asset Amount 173 169 185 175 140 132
Implied Lease Term 58 59 54 57 72 76
Leasehold Depreciation Expense $129 $166 $108 $141 $172 $202
Starting Balance Sheet Amount 1182 1348 1762 2113 2499 2867
Depreciation as a of Asset Amount 109 123 61 67 69 70
Implied Lease Term 92 81 163 150 145 142
Tenant Allowance Amortization Using Leasehold Depreciation Schedule
183 255 142 189 237 272
Reduction In EBIT If Both Were Put On Same Schedule (11) (10) (29) (30) (24) (24)
While the financial impact of this adjustment is limited signs of accounting impropriety do not reflect well on management and cast
doubt on the rest of Dollaramarsquos reports and accounting practices
1) FY 2015 Annual Report p 15 DOL also extended its store and warehouse equipment useful lives from 8-10yrs to 10-15yrs The total reduction of these three items was decrease of $10m in
FY15 depreciation expense
2) DOL states in its AIF p 11 ldquoThe Corporation typically enters into leases with base terms of ten years and options to renew for one or more periods of five years each The average time to
expiration of the Corporationrsquos leases is approximately five yearsrdquo
3) See governance slide on Huw Thomas
33
Capital Spending And Distribution Of Cash To Shareholders Are Overextending The Business
What happened
Management claimed in 2011 that the business was sufficiently cash-generative to support growth and dividendsshare buybacks
and that it would be able to pay down debt while pursuing both However debt has ballooned since then with net debt rising 8x
(and close to 3x versus EBITDA growth) Management is effectively levering up the balance sheet to support dividends and share
buybacks with CFO Michael Ross stating that he will continue to repurchase shares as long as the earnings yield remains above
the after-tax cost of debt
ldquoFor the past few years our cash flow has enabled
us to continue to pursue our growth plans and
continue to pay down debt Our free cash flow is
now sufficient to fund both those priorities
while enhancing new to shareholders through
a quarterly dividend payment We are able to
generate the free cash flow to do all of this
because we employ a simple growth oriented
business model at Dollaramardquo
ndash June 2011 Conference Call
Should Dollaramarsquos struggles become more pronounced ndash or should the
economic cycle turn for the worse ndash this debt overhang could loom large over
the business
Dollarama also consistently spends more on capex (as a percentage of sales) than its peers in the discount retail industry and
shows abnormally high capex versus depreciation and amortization We understand that Dollarama is a growing business which
could explain both patterns in part but it is not the only discount retailer which is investing in store growth
Dollarama DampA consistently
lt50 of capex and a lower
percentage of capex than
industry peers
Dollarama consistently
spends more on capex
(as a percentage of sales) than industry peers
00
05
10
15
20
25
0
200
400
600
800
1000
1200
1400
1600
1800
FY2012
FY2013
FY2014
FY2015
FY2016
FY2017
FY2018
Ne
t D
eb
tEB
ITD
A
Ne
t D
eb
t ($
C M
M)
Net DebtEBITDA Net Debt
0
50
100
150
200
250
300
FY2010 FY2011 FY2012 FY2013 FY2014 FY2015 FY2016 FY2017 FY2018
DampA as a of Capex and Intangibles Annual
DOL DLTR DG BIG FRED
0
1
2
3
4
5
6
7
8
FY2010 FY2011 FY2012 FY2013 FY2014 FY2015 FY2016 FY2017 FY2018
Capex and Intangibles as a of Sales Annual
DOL DLTR DG BIG FRED
34
Where Is The Capex Going
Management has explicitly identified and discussed various capital expenditures in Company filings over the last
five years but this still leaves a large gap versus what was actually spent
Additionally there is a large gap between the amount spent on software development and the amortization expense
associated with this activity suggesting that earnings may be inflated
Some of this is
directed towards
leasehold
improvements etc
but with
managementrsquos
focus on expansion
over existing store
improvements we
question where
management is
directing this capex
Capital Spending Software
on Software Amortization Difference
FY 2018 191 126 65
FY 2017 126 96 3
FY 2016 111 78 33
FY 2015 108 56 52
FY 2014 98 34 64
Are earnings
inflated due to
insufficient
amortization
Note also that a LinkedIn search for software developers at Dollarama turned up effectively nothing ndash at best one person with a tangentially
relevant title (source) So where is the software development capex going
Unlike discount retailer peers Dollarama
did not include software-related
spending in capex until recently and
records it separately in
ldquoAdditions to intangible assetsrdquo1
Do they do this to artificially deflate their
headline capex figure thereby inflating
reported free cash flow
Undiscussed Capital Spending (FY 2014 ndash 2018)
C$ Millions
$500K in capex spent per new store (375 new stores over past five years Source AIF) $1875
Capex spent on construction of 500K sqft warehouse in Montreal 679
$82M spent annually on expansion renovation or relocation of stores over five years 410
$232M spent on land acquisition 232
Discussed Capex Over Past Five Years $3196
Total Reported Capex (ex intangibles) $5200
Undiscussed Capex $2004
Software Capex and Software Amortization Discrepancy
C$ MillionsCapital Spending on
SoftwareSoftware Amortization Ratio
FY 2018 $191 $126 152
FY 2017 126 96 131
FY 2016 111 78 116
FY 2015 108 56 193
FY 2014 98 34 288
1) DOL explicitly started calling out software as a component of capex in Q3rsquo16 with the addition of footnote to guidance
35
Lack Of Transparency Regarding Store Closures And Associated Costs
It is standard industry practice to report store closures remodels and relocations alongside new store openings
However Dollarama reports only ldquoNet New Storesrdquo and does not break this number out in detail Questioned on this
in Q4 2016 management answered that a larger store base would inevitably result in more closures for reasons
outside of its control (fires mall renovations etc) and that reporting closures would therefore not communicate
meaningful information regarding the underlying performance of the business
We strongly disagree store closure information is vital to evaluating the health of a retail chain Management can
provide color on particular closures if it feels that they have been done for reasons other than performance but
failing to report closures entirely hides a key operating statistic from investors
Company Store Movement 2012 2013 2014 2015 2016 2017 2018
DLTR
Beginning 4101 4351 4671 4992 5367 13851 14334OpenedAcquired 278 345 343 391 8850 584 603
Closed 28 25 22 16 366 101 102Closed as of Beginning 07 06 05 03 68 07 07
BIG
Beginning 1398 1533 1495 1493 1460 1449 1432Opened 181 87 55 24 9 9 24Closed 46 46 58 57 20 26 40
Closed as of Beginning 33 30 39 38 14 18 28
DG
Beginning 9372 9937 10506 11132 11789 12483 13320Opened 625 625 650 700 730 900 1315Closed 60 56 24 43 36 63 101
Closed as of Beginning 06 06 02 04 03 05 08
FDO
Beginning 7023 7442 7916 -- -- -- --Opened 475 500 526 -- -- -- --Closed 56 26 400 -- -- -- --
Closed as of Beginning 08 03 51 -- -- -- --Overall Industry Average 09 07 20 07 23 07 08
Other high-growth dollar
stores like Dollar Tree and
Dollar General report store
closures ndash why doesnrsquot
Dollarama
Store closures for whatever
the reasons incur real
restructuring and other
costs Peer retailers
generally give detail on these
expenses whereas
Dollarama does not
We believe that Dollarama
should follow industry norms
and increase transparency
regarding store closures
US Dollar Store peers historically close 08 of stores annually yet Dollarama has not reported any recent closures
36
SSS Metrics Obfuscate Store Performance
Dollaramarsquos official ldquoComparable Store Salesrdquo figure includes ldquorelocated and expandedrdquo stores as ldquocomparable storesrdquo
therefore picking up growth in traffic which can be attributed to relocation-related improvements We believe that this likely
overstates Comparable Store Sales growth while also ignoring associated relocation-related expenses
1) See Q1 FY 2014 earnings call transcript
Management not only hides store closure data as a supposedly uninformative statistic but proclaims that it has NEVER closed a
store due to poor performance1 We find it difficult to believe that a retailer which has existed in its current format since 1992 has
never needed to close a store for poor performance If it has indeed never closed an underperforming store we wonder whether
management has been too ambitious in growing its store base without critically evaluating the profitability of each location
Huntsville Place Mall Jul 2015
7 John St Oct 2012
7 John St Jul 2015
Huntsville Place Mall Oct 2012
Huntsville ON
Relocation
Are these really entirely
ldquocomparablerdquo locations
781 Rue Principale Est May 2016
781 Rue Principale Est Jun 2009Le Carrefour Ste Agathe
May 2016
Ste-Agathe-Des-Monts QC
Relocation
Why assume the costs to
make this lt1 mile move
Notice
Dollarama
sign turned
inside-out
indicating
closure
37
Cash Flow Beginning To Turn Over Despite Efforts To Bolster Results
In H1 FY 2019 Dollaramarsquos cash flow contracted on a year-over-year basis for the first time since it went public ndash this
despite managementrsquos efforts to bolster earnings and EBITDA The contraction appears to be due in large part to
changes in working capital In particular we are concerned that growth in inventories suggests that management
overestimated near-to-medium term sales growth and that declining traffic is starting to weigh on the Company
Dollarama H1 Operating Cash Flow
C$ Millions FY 2014 FY 2015 FY 2016 FY 2017 FY 2018 FY 2019
Net Income $1054 $1221 $1603 $1895 $2265 $2433
CFO Before Working Capital 1394 1488 2124 2156 2769 2999
Changes in Working Capital (287) (236) (870) (110) (126) (886)
Net CFO 1107 1252 1253 2045 2644 2113
YoY Change $326 $322 $01 $792 $599 (531)
Source Dollarama
Governance Concerns
39
Related-Party Transactions With Rossy Family Raise Questions Over Governance And Costs
Fiscal YearRent amp Land Purchases
Paid to Rossys(C$ MM)
As a of Compensation Paid to Rossy Family
FY 2019 (To Date) $394 NA
FY 2018 184 1660
FY 2017 402 4459
FY 2016 179 1305
FY 2015 169 2752
FY 2014 163 1903
As noted Dollarama leases all but one of its five warehouses from the Rossy family and recently purchased land from the Rossys
for the construction of a sixth Management also recently purchased its Montreal distribution center from the Rossy family which
leased the facility to Dollarama until this February We understand that the Rossy family has close historical ties to the business
but this level of close dealing draws our attention particularly given the fact that management has focused on fortifying its
existing distribution footprint ndash closely tied to the Rossy family ndash rather than invest in distribution facilities in western Canada
where major competitors already have distribution centers
DLTR
Distribution
Center
Delta BC
DLTR
Distribution
Center
Mississauga ON
DOL
Distribution
Center
DOL
Warehouses
No Dollarama distribution facilities
located outside of a ~4 mile radius in
Montreal
bull Due to preferential relationship with
Rossy family
bull Will Dollarama be able to expand into
AngloWestern Canada efficiently
without logistics costs ballooning
bull Overly-exposed to fuel price hikes
and rising transportation costs
Related-Party Transactions Significant And Growing
Source Dollarama Financials
Dollar Tree Canada Distribution Centers
Dollarama Distribution Centers And Warehouses
Source DollarTree
Montreal QC
40
Related-Party Transactions With ldquoIndependentrdquo Director Huw Thomas Only Recently Disclosedhellip
Dollarama also leases stores from SmartCentres REIT whose recently-departed CEO Huw Thomas joined Dollaramarsquos
Board of Directors in 2011 and was a member of its audit committee through March 2017
His ldquoindependencerdquo was recently defended by a meandering 260-word footnote in Dollaramarsquos proxy which belies the
fact that Dollarama is a top 10 customer of SmartCentres
This is all the more suspicious in light of Dollaramarsquos questionable lease accounting highlighted earlier
Source Dollarama 2018 Proxy Circular
Note Dollarama did not start disclosing Huwrsquos related-party dealing until the 2017 proxy
circular in June 2017 right after he left the Audit Committee in March 2017
SmartCentres 2017 Annual Report
Dollarama Material To SmartCentres ndash A Top 10 Customer
SmartCentres Promotes Dollarama Relationship From 2011
Calloway (now SmartCentres) 2012 Annual Report
Dollaramarsquos Lengthy Meandering Defense Of Thomas
Huw As Independent Only Recently Disclosed (2017)
Dollarama Recently Changed Rent Expense Disclosure
Source Dollarama Q4rsquo17 Financials Note 15 Related Party Disclosure
Source Dollarama Q2rsquo18 Financials Note 13 Related Party Disclosure
41
House of Windsor House of RossyA Case Study In Nepotism
Neil Rossy had been the Senior VP of Merchandising Chief Merchandising Officer for 25 years prior to being named CEO in
2016 While his family is still a large shareholder they are not a controlling shareholder owning around 5 of the shares
outstanding We question whether the Rossyrsquos century-long family tradition of passing down leadership ndash one which also
persists at the Rossyrsquos ldquosister storerdquo ndash is appropriate for a public company or wise for the long-term health of the business
Salim Rossy
Opened first ldquoS Rossyrdquo
store in 1910 (up-market
department store concept)
George Rossy
President of S Rossy
1937-1973
Larry Rossy
Grew S Rossy from 20 to 44 stores before
converting all S Rossy stores to new
ldquoDollaramardquo concept in 1992 Sold majority
stake to Bain Capital in 2004 IPO in 2009
Neil Rossy
CEO of Dollarama as of 2016
Michael Rossy
Brother of George (one of ten siblings)
Founder amp CEO of ldquoRossyrdquo stores 1949-2010
Michael DiTullio
Son-in-Law of Michael
President amp CEO of Rossy since 2010
Does (or will) the family have a hard time parting with a business that has been in the family for four generations even if parting ways is
the right thing to do
Managing retail chains is very
much a family affair for the
Rossys ndash at both stores
Perhaps Neil was going to be
anointed CEO of Dollarama
regardless of the caliber of other
potential candidates
Letrsquos hope hersquos not Commodus
BONUS
Brother branches out
with separate storehellip
42
Insiders Incentivized To Grow EBITDA
Our earlier concerns about EBITDA quality are amplified by the fact that Dollarama executives are compensated
based on seemingly arbitrary and inflated EBITDA targets This gives management a strong incentive to be inefficient
users of capital as any dollar shifted from operating expense to capex has a direct benefit to key executives
For example note that managementrsquos perhaps questionable decision to purchase one of its Montreal warehouses
will shift what was until recently rent expense into depreciation This change in the accounting treatment of
Dollaramarsquos tenancy costs will provide a windfall to EBITDA potentially boosting management bonuses
Source Dollarama Proxy Circular p 30
43
What Is A Stretch EBITDA Goal
Bonuses are paid upon achievement of 11 EBITDA growth This level was ldquodesigned to be a stretch objectivehellip
attainable only with significant effortrdquo However this target was reset lower after FY 2014 ndash the only year during which
management did not handily exceed the target We believe this further calls into question the independence of the
board and its compensation committee
Year EBITDA Growth Objective EBITDA Growth Achieved
FY 2018 11 18
FY 2017 11 18
FY 2016 11 30
FY 2015 11 15
FY 2014 13 12
FY 2013 13 22
FY 2012 13 26
FY 2014 Management
misses growth objective
FY 2015 Growth objective
adjusted downwards
ldquoThe thresholds were revised by the
Human Resources and Compensation
Committee in the context of its annual
executive compensation review
conducted at the beginning of each fiscal
year to take into account among other
elements the fact that the base for the
calculation is growing every yearrdquo
Source FY15 Management Proxy Circular
What ldquoother elementsrdquo were
taken into account
Source Dollarama
44
Insiders Selling While Company Buys Back Stock At Elevated Prices
Management has been buying back shares at elevated prices through the last several years even while pursuing growth leaving little capital for
(sorely needed) store updates or other uses The average repurchase price since Q1 FY17 is about on par with current share prices and ~40
below our target Since Q2 FY18 the average buyback price has been 25 above current levels
Furthermore just as the Company has been buying back stock at elevated prices insiders have been offloading shares Notably it is evident
from past and current proxy statements that CFO Michael Ross has never held onto shares for which he has been granted options his
common equity ownership is listed at zero every year Note that as the CFO it is he who is dictating the share buyback decision in large part
PeriodShares
Repurchased
Value of Repurchase
(C$ M)
Average Price (Split-
Adj) (C$)
Q1 FY 2017 1542066 1393 3011
Q2 FY 2017 2027080 1842 3029
Q3 FY 2017 1571500 1578 3347
Q4 FY 2017 2279522 2241 3277
Q1 FY 2018 1687240 1806 3568
Q2 FY 2018 1303900 1602 4095
Q3 FY 2018 687700 931 4513
Q4 FY 2018 2425700 3788 5205
Q1 FY 2019 94500 145 5115
Q2 FY 20191 1347341 700 5195
Total 14966549 16026 3797
Discount to Current Share Price 1
Total (Since Q2 FY 2018)
5859141 7170 4815
Discount to Current Share Price -20
Using Company Funds To Overpay For DOL Shareshellip While Insiders Sell Into The Companyrsquos Bidhellip
Source DOL filings and Bloomberg
Insider Title Date Sold SharesProceeds (C$ M)
Price Sold (Split-Adj)(C$)
Nicolas Hien Senior Vice President 482016 6203 06 3224
Michael Ross CFO 482016 80000 74 3083
Paul Roche Vice President 4182016 10000 09 3000
Geoffrey Robillard Senior Vice President 6172016 33500 31 3085
John Assaly Vice President 9272016 30000 30 3333
Geoffrey Robillard Senior Vice President 472017 20000 23 3833
Paul Roche Vice President 472017 23100 26 3752
Josee Kouri Corporate Secretary 4142017 8000 09 3750
Geoffrey Robillard Senior Vice President 9142017 5000 07 4667
Geoffrey Robillard Senior Vice President 12112017 10000 16 5333
John Assaly Vice President 12132017 14096 22 5202
Geoffrey Robillard Senior Vice President 1262018 15000 24 5333
John Thomas Independent Director 1262018 6000 10 5556
Geoffrey Robillard Senior Vice President 6152018 50000 75 5000
John Assaly Vice President 6192018 13404 21 5222
Nicolas Hein Senior Vice President 6222018 36750 19 5170
Paul Roche Vice President 6222018 24000 13 5417
We do not like the fact that insiders have been selling into share buybacks while
the Company levers itself up with short-term debt to support those repurchases
It appears that the execs are levering up the business in part to enrich themselves1) All share information prior to Q2 lsquo19 reflects pre-split data except
Split-Adjusted Average Prices Q2 lsquo19 repurchases were as stated
45
Rossy Family Selling Shares Despite Control Over C-Suite
Notably Founder and former CEO Larry Rossy has trimmed his position tremendously through the last several years
Though this is to be expected to some extent as he recently ceded control of the business we believe that his
ownership stake should be held to a higher standard given his insistence on keeping the business in the family
If he plans to keep the c-suite under a Rossy dynasty the familyrsquos personal stake in the business should reflect that
Source Bloomberg
Valuation And Price Target
47
The Market Has Not Taken Threats To Dollarama Seriously ndash But Optimism Is Ebbing
Analysts are generally bullish on the stock focusing primarily on managementrsquos growth story and taking current
profitability levels for granted The prospect of new competitive threats to a business which has until now seen limited
competition ndash and the risk that prevailing margins are unsustainable even through the near term ndash go underappreciated
Dollaramarsquos poor Q2 cooled analystsrsquo optimism to some extent but we believe that the reaction was largely reactive and
superficial as they adjusted their price targets in such a way that in aggregate they saw exactly the same upside after the
post-Q2 dip as they did before The market still does not fully appreciate the magnitude of the threats facing Dollarama
All price targets in C$ Before Q2 Release After Q2 Release
Firm Recommendation Target PriceUpside (on 82818) Recommendation Target Price
Upside (on 9172018)
Upside (Present)
RBC Capital Markets Outperform $5500 12 Outperform $5200 22 35
Raymond James Outperform $5567 13 Outperform $5000 17 30
Macquarie Outperform $5633 14 Outperform $4900 15 27
BMO Capital Markets Outperform $6100 24 Market Perform $4700 10 22
CIBC Capital Markets Outperform $5900 20 Neutral $4600 8 20
Desjardins Securities Buy $5800 18 Hold $4500 6 17
Veritas Investment Research Co Buy $5600 14 Buy $4800 13 25
Industrial Alliance Securities Hold $5450 11 Buy $5450 28 42
Canaccord Genuity Buy $5900 20 Buy $5500 29 43
Barclays Equal Weight $5200 5 Equal Weight $4400 3 14
TD Securities Buy $5900 20 Hold $4900 15 27
Accountability Research Corp Buy $5400 10 Buy $5000 17 30
National Bank Financial Outperform $5567 13 Sector Perform $4800 13 25
Scotia Capital Sector Outperform $5567 13 Sector Outperform $5050 19 31
Wells Fargo Securities Market Perform $5300 7 Market Perform $4000 -6 4
AVERAGE $5626 14 $4853 14 26
While analysts are still not sufficiently critical of Dollarama the more recent downward move in the stock and subsequent analyst
downgrades may suggest that the market could be primed to evaluate the Company and its growth story with a more discerning eye
We believe that the issues which we highlight in this report will provoke further professional skepticism among analysts and investors
48
Dollarama Not Priced To Perfection ndashPriced Beyond Perfection
We can get close to DOLrsquos current valuation only if we value it as a mature ex-growth business today under
managementrsquos lofty goals for the business for ten years into the future applying no discounts for time
business risk etc
Managementrsquos ten-year store target
bull Current store count 1178 (70 of long-
term target)
Even if Dollarama were a mature business today under managementrsquos long-term targets for the business
DOL stock would not have no upside to current share prices
The market is pricing DOL beyond perfection ndash a valuation this lofty cannot be justified today
Mature Business ValuationC$ MM unless noted
Stores 1700
Revenue per Store $32
Total Revenue $5440
Operating Margin 220
Operating Profit $1197
Interest Expense $50
Tax (275) $315
Net Income $831
Diluted Shares Outstanding 332
EPS $251
PE Multiple 152x
Target Price $3815
Upside -1
Average operating margin since Q1 FY 2016
bull Assumes that DOLrsquos unusually high
margins are sustainable despite
intensifying competition loss of recent FX
benefit and customer pushback against
price hikes
Mature revenue per store estimate
bull Current average revenue per store
~$28M (875 of long-term target)
Industry median NTM PE multiple
bull Assigns no discount to DOL due to
declining store traffic vs peers incoming
competitive threats inefficient distribution
network etc
49
Dollarama Not Priced To Perfection ndashPriced Beyond Perfection (Continued)
Put another way The market is implicitly taking it for
granted that Dollarama will achieve its lofty ten-year
growth targets assuming sustained profitability levels
and per-store efficiency ndash and applying close to the
industry median FY1 EVEBITDA multiple to Dollaramarsquos
FY 2027 EBITDA
Just under ten-
year target
What kind of growth is the market implicitly betting on if
we value Dollarama on par with peers
bull 150 more stores than managementrsquos ten-year target ndash
within nine years
bull 48 CAGR in revenue per store
bull Zero margin compression
FY 2027 Estimates if Management Executes Growth Plans Perfectly
(C$ MM unless noted)
Stores (Year-End) 1688
Revenue per Store $33
Total Revenue $5503
Gross Margin 380
Gross Profit $2093
SGampA per Store 04
SGampA Total 689
EBITDA (FY 2027) $1404
Market Cap 12752
Debt 1880
Cash 182
Enterprise Value $14450
EVEBITDA (FY 2027) 103x
Industry Median EVEBITDA (FY1) 110x
Average gross
margin ex-
hedge gains
since FY 2016
Mature revenue
per store
estimate (15
growth CAGR)
FY 2018 SGampA
per Store
Implied FY 2027
multiple close to
industry median FY1
multiple
FY 2027 Estimates To Justify Prevailing Valuation (C$ MM unless noted)
Stores (Year-End) 1858
Revenue per Store $44
Total Revenue $7929
Gross Margin 380
Gross Profit $3016
SGampA per Store 04
SGampA Total 755
EBITDA (FY 2027) $2261
EVEBITDA (FY 2027) 62x
Enterprise Value 13947
Debt 1880
Cash 182
Equity Valuation $12249
Diluted Shares Outstanding 332
Target Price $3693
Current Price $3845
158 over ten-
year target in
nine years
48 growth
CAGR in
SalesStore
Industry median
FY1 multiple
discounted
75 annually
Average gross
margin ex-
hedge gains
since FY 2016
FY 2018 SGampA
per Store
High forecast gives
us 4 DOWNSIDE
50
Valuation Far Out Of Line With Peers And Historical Multiples
DOL shares trade at a 50-60 premium to peers in the discount retail industry The market is valuing DOL much more like a high-
growth tech company than a brick-and-mortar dollar store (and one with concerning fundamental trends at that) Note that this still
holds true even after DOL shares traded down significantly following its recent Q2 earnings report
It is difficult to justify a valuation this high even if one is bullish on DOL vis-agrave-vis the rest of the industry
Company Ticker
3-Year Consensus Revenue
CAGR
FY 2018 EBITDA Margin
PE(NTM)
PE(FY2)
EVEBITDA(NTM)
EVEBITDA(FY2)
EVSales(NTM)
Dollar Tree DLTR 43 121 139x 134x 91x 88x 10x
Dollar General DG 75 104 163x 162x 112x 112x 12x
Big Lots BIG 06 85 87x 87x 52x 53x 04x
Five Below FIVE 210 162 360x 412x 2113x 243x 32x
Canadian Tire CTC CN 20 90 179x 181x 82x 83x 10x
Metro MRU CN 80 73 142x 139x 99x 101x 08x
MEDIAN 59 97 152x 151x 95x 110x 10x
Dollarama DOL CN 85 255 229x 223x 164x 163x 41x
DOL PREMIUM 505 477 727 509 3057
Does DOL ndash a value retailer
demonstrating concerning
fundamental trends ndash deserve
to be valued on par with
higher-growth industries and
completely out of line with its
industry peers
Profitability is impressive but
likely unsustainable in the face
of growing competition
Enterprise Value Revenues Enterprise Value Adj EBITDA Price Adj EPSDOL shares also trade at
a significant premium to
historical multiples
despite unsustainable
margins an increasingly
saturated market and
rising competitive
threats
51
Does The Market Think Dollarama Is A Dollar Store Or A Premium Retail Brand
Dollarama is valued much more closely to premium retail brands than its discount retail peer group
A bull might ldquojustifyrdquo this by pointing to Dollaramarsquos profitability profile and growth expectations but its EBITDA margins are so
out of line with those of its peers that one is forced to question whether they are sustainable (at best) or honest (at worst)
As discussed Dollaramarsquos consensus sales growth numbers also ignore looming fundamental threats to the business
Company TickerGross
Margin (NTM)
EBITDA Margin (NTM)
Sales Growth (NTM)
EVEBITDA(NTM)
PE(NTM)
EVSales(NTM)
Dollar Tree DLTR 31 11 28 91x 139x 10x
Dollar General DG 31 10 89 112x 163x 12x
Big Lots BIG 41 7 -08 52x 87x 04x
Five Below FIVE 36 15 203 2113x 360x 32x
Canadian Tire CTC CN 34 12 40 82x 179x 10x
Metro MRU CN 19 7 88 99x 142x 08x
MEDIAN 33 11 64 95x 152x 10x
Dollarama DOL CN 40 25 99 164x 229x 41x
DOL PREMIUM 727 505 3057
How does Dollarama support EBITDA
margins more than double those of its
peer group and in line with premium
global retail brands
Company TickerGross
Margin (NTM)
EBITDA Margin (NTM)
Sales Growth (NTM)
EVEBITDA (NTM)
PE (NTM)EVSales
(NTM)
Ferragamo SFER IM 65 17 48 160x 260x 26x
Hermes RMS FP 69 38 84 200x 350x 78x
Prada 1913 HK 74 22 78 100x 210x 23x
Tiffany amp Co TIF 64 24 51 113x 196x 28x
MEDIAN 67 23 65 137x 235x 27x
Dollarama DOL CN 40 25 99 164x 229x 41x
DOL PREMIUM 197 -26 519
Does a discount retailer facing
fundamental headwinds deserve to be
priced 50 or more above its peer
group and closer to global
premium retail brands
52
Margins And Multiples Materially Out-of-Line With Peers
We do not believe that Dollaramarsquos profitability levels ndash which are entirely out of line with peers ndash are justified or sustainable in an
industry as competitive as deep discount retail The Company is already struggling to meet store count growth targets raising the
likelihood that its store growth plan will be dilutive to margins The market assigns a premium valuation to Dollarama on the basis
of relatively high growth expectations and the Companyrsquos industry-leading margins However as discussed throughout this
report we doubt both managementrsquos ability to meet its growth targets and its ability to maintain prevailing profitability levels The
likelihood that the Company will be able to achieve BOTH of these goals simultaneously is even slimmer Accordingly we believe
that the basis for Dollaramarsquos substantial share price premium is unfounded
Dollaramarsquos margin profile is grossly out of
line with peers and we find evidence of
aggressive accounting and questionable
business practices that can partly explain the
issue We doubt that this would be sustainable
even if management wasnrsquot growing the chain
How will a lowno-moat business with falling
per-store traffic be able to maintain its
remarkable profitability advantage while
aggressively expanding its store base
DLTRDG
BIG
FIVE
CTCCN
MRUCNWNCN
DOLCN
0
5
10
15
20
25
30
10 15 20 25 30 35 40 45 50
EBIT
DA
Mar
gin
Gross Margin
Dollarama Margins Completely Out Of Line With Peers
The premium in Dollaramarsquos share
price is driven by the marketrsquos trust in
managementrsquos growth initiatives and
its recognition of the Companyrsquos
dominant profitability
However neither its profitability
advantage nor its growth prospects
are sustainable The likelihood that
management simultaneously
preserves BOTH is extremely low
Big Lots (BIG) Dollar Tree (DLTR) Dollar General (DG) Metro Inc (MRU CN) and Canadian Tire (CTC CN)
x
5x
10x
15x
20x
25x
BIG DLTR MRU CN DG CTC CN DOL CN
PE (NTM)
x
4x
8x
12x
16x
20x
BIG DLTR MRU CN DG CTC CN DOL CN
EVEBITDA
53
Valuing DOL As A Mature Business In The Canadian Market ~40 Downside
C$ MM unlessotherwise noted
Current Run-Rate Valuation
Priced Beyond Perfection
Reasonable Downside
Stores 1170 1700 1500
RevenuesStore 28 32 30
Revenues 3320 5440 4500
Operating Margin 23 22 18
Operating Profit 764 1197 801
Interest Expense 42 50 50
Tax 275 198 315 207
Net Income 523 831 544
Shares 332 332 332
EPS $158 $251 $164
Multiple 24x 16x ~15x
Share Price $3845 $3966 $2460
Upside (Downside) 3 Approx -40
As discussed earlier at 1700 stores DOL would have greater penetration than both Dollar General (DG) and Dollar Tree (DLTR)
which both offer a much broader assortment of goods including perishablesconsumables Meanwhile the US appears to be
overstored versus Canada It is likely unreasonable for DOL to target per capita penetration levels on par with its US peers
Even if we assume that DOL can reach similar penetration levels and match company
growth targets ndash with steady margins no less ndash DOL has little upside
Valuing DOL as a mature business at its upper penetration bound implies ~40 downside
in a more realistic yet still generous scenario in which DOL is valued in line with peers
Higher Canada
store count vis-agrave-
vis comparable US
store count
compared to
Walmart
Higher Canada
store concentration
vis-agrave-vis
comparable US
store concentration
than Walmart
Achieving
managementrsquos
1700 store target
would put DOL at a
higher per capita
penetration level
than US peers
Store Count by Region
Canada US CanUS Ratio
WMT 410 5358 77DOL ndash Present 1178 14750 80DOL ndash Future 1700 14750 115
DOL CN DG DLTR
Stores 1700 14760 14732
Population (M) 36 326 326
StoresCapita (M) 472 453 452
Downside Run-Rate Operating Margin Estimate
ProfitabilityCost Measure JustificationGross Margin Target Recent Historical Average 370
Current SGampA Recent Historical Average 167
Add
Advertising Expense Normalization
Industry Average05
Rent Expense NormalizationAdjusting for Depreciation Rearranged
from Rent Expense 05
Depreciation Catch-Up Matching DampA schedules 15
Pro Forma SGampA 192
Pro Forma Operating Margin 178
Store Count per Mil People by Region
Canada US CanUS Ratio
WMT 114 164 69DOL ndash Present 327 452 72DOL ndash Future 472 452 104

7
Spruce Point Believes Dollarama (TSX DOL) Is A ldquoStrong Sellrdquo With ~40 Downside Risk
Questionable Accounting Techniques And Capital Allocation Decisions Weaken Quality Of Earnings And Financial Position
bull Currency Hedge Supposedly A Pure Offset To CAD Depreciation But Has Been A Material Profit Center Dollarama claims to hedge currencies only to lock in consistent prices (in CAD) on which its customers can rely However in practice the Company adjusts prices to match non-hedged competitors leaving us to wonder why it hedges at all Much of the recent hedge benefit appears to have reversed but gross margins ex-hedges conveniently rose by just enough over the last two years to maintain steady profitability If nothing else we question whether Dollaramarsquos elevated margins are sustainable
bull Tenant Allowances And Leasehold Improvements Are Amortized Over Very Different Periods While accounting rules may give sufficient leeway to permit this difference we question why lease term assumptions should differ for these two capital accounts Earnings quality suffers notwithstanding
bull Sales Of Certain Assets Such As Vehicles Appear To Be Completed At Above-Market Prices While the financial impact of these moves is difficult to quantify (perhaps due in part to Dollaramarsquos opaque relationship with Dollar City) the liquidation of certain assets is significant in some quarters
bull Leverage Is Increasing Dollarama makes long-term financing decisions using short-term debt the cost of which has risen with recent debt issuances andis likely to continue to increase with rising interest rates ndash and as the Companyrsquos credit profile grows riskier We question managementrsquos decision to increase leverage to support buybacks and dividends simply because the earnings yield is above the after-tax cost of debt We also worry about the state of the balance sheet should the economic environment turn or should the business decline more rapidly
bull Depreciation Is Well Below Capex And Has Been For Years Capital spending easily bests industry peers both as a percentage of sales and vis-agrave-vis steadier DampA charges The mismatch with DampA suggests poor quality of earnings at the very least Meanwhile managementrsquos growth orientation has diverted capital spending away from store remodeling giving stores a stale and dated feel despite rising price points
bull Acquiring Real Estate Flatters EBITDA Acquiring related-party real estate not only lines the pockets of the founding family but also allows Dollarama to shift rent expenses out of the operating line The artificial EBITDA boost helps management to achieve its EBITDA-based compensation targets
Easy To Justify ~40 Downside In DOL Shares
bull Valuation Is Indefensible DOL currently trades at a ~50 premium to peers and carries among the highest multiples of any global retailer Higher only are the valuations of cregraveme de la cregraveme global fashion brands ndash Hermes Prada Ferragamo etc Such lofty multiples are inappropriate for a dollar store with serious near-to-medium-term business risks Analyst estimates are not sufficiently skeptical of managementrsquos targets in light of these concerns
bull Even If Nothing Goes Wrong The Stock Is Overvalued Even if Dollarama executes its growth plan perfectly maintains its world-leading margin and retains a hefty valuation premium to its peers the stock is at best fairly valued at ~$43
bull Under More Reasonable Assumptions DOL Stock Is Overvalued By 40 At Current Levels Even assuming that Dollarama achieves full market penetration ndash with no negative impact on per-store revenues from competition or cannibalization ndash the stock is worth $28 under normalized margins and at a multiple closer to peer norms down ~40 from current levels
bull Analysts Bullish But Wavering Dollaramarsquos disappointing Q2 ndash including SSS guidance contraction and a YoY decline in operating cash flow ndash provoked some downgrades but analysts still see ~26 upside in DOL shares regardless We believe that analysts are too trusting of DOLrsquos growth targets but that the Q2 miss put the Company on notice with a number of analysts Further disappointing quarters could bring more drastic analyst revisions
8
Consensus Estimates (CY) 2018A LTM 2019E 2020E
Stock Price $3845 EV Sales 44x 43x 40x 38x
Shares Outstanding 332 EV EBITDA 174x 167x 161x 149x
Market Capitalization 12752 Adj EV EBITDAR 153x 148x - -
Total Debt Outstanding 1880 Price EPS 254x 241x 224x 199x
Less Cash and Equivalents 182
Enterprise Value 14450 Growth and Margins 2018A LTM 2019E 2020E
Operating Leases 1130 Sales Growth 102 84 102 65
Finance Leases 4 EBITDA Margin 255 256 249 254
Adj Enterprise Value 15584 EPS Growth 228 160 130 127
Credit Metrics 2018A LTM 2019E 2020E
Net Debt EBITDA 20x 20x 19x 17x
Adj Net Debt EBITDAR 28x 27x - -
Capital Structure And Valuation
In C$ MM except per share figures or where indicated
At present Dollarama demonstrates impressive margins and is not egregiously over-levered on a Net Debt-to-EBITDA
basis However as competition increases customers push back against recent price hikes and operating costs creep
upwards we believe that management will have a difficult time maintaining current profitability levels ndash particularly
while pursuing an aggressive growth strategy Leverage will be less sustainable should the businessrsquo performance
decline or the economic environment turn threatening managementrsquos ability to support continued buybacks
dividends while growing store count
Source Dollarama and Bloomberg Estimates
Note Calendar Year Ended Jan 30th
Note Operating Leases valued at 6x Operating Lease Expense
Though analysts
project declining sales
growth they foresee
margin expansion at
the same time This
pair of estimates
makes little sense to
us and should make
investors skeptical of
consensus estimates
Our research will
explain why we
believe margins will be
pressured going
forward
9
Short-Term Debt In A Rising Rate Environment Introduces Refinancing Risk
Significant Short-Term Debt Maturities That Will Have To Be Refinanced At
Higher Rates
Dollarama Has Unhedged Exposure To Interest
Rateshellip
hellipWhile The Three-Month CDOR Rate Rises Rapidly
Source Dollarama
Source Bloomberg
Dollarama refinanced significant short-term debt just last evening levering up the business in the process
Management refinanced its C$400M of 3095 fixed-rate notes due this November with C$500M of 355 fixed-rate
notes due November 2023 Managementrsquos use of short-term debt has burdened the business with refinancing risk in
an environment in which the CDOR rate has risen sharply and is expected to rise for the foreseeable future which has
now forced the Company to bear materially higher interest expenses (compare to its 2203 fixed-rate credit due in
2022) The Company still has C$14B of debt due to mature within the next 12 quarters (including its credit facility)
leaving it exposed to further rate increases The Companyrsquos weighted average debt maturity is about 35 years
320
680
DOLCN Credit Breakdown (C$1875M Total)
Floating Fixed$0
$100
$200
$300
$400
$500
$600DOLCN Debt Maturity Schedule (by CY Quarter)
Available in Revolving Credit Facility Maturing Sep 2023 Available in Revolving Credit Facility Maturing Sep 2020
Series 2 Variable Rate CDOR+59bp Series 3 Variable Rate CDOR+27bp
Fixed Rate 2203 Fixed Rate 2337
Fixed Rate 355
10
Will Dollarama Be The Next Bain Capital-Led Failed Retail IPO
ldquoTwenty-two percent of Bain LBOs from 1984 to 1992 went bankruptrdquo according to Eileen Applebaum in her book
ldquoPrivate Equity at Workrdquo1 Recent Bain-led retail busts include Toys ldquoRrdquo Us Guitar Center and Gymboree
Company DateEnterprise
ValueBain Capital Quotes Outcome
Toys ldquoRrdquo Us March 17 2005 $6600
Toys R Us and Babies R Us are premiere franchises with strong global brand recognition and a collection of high quality product offerings
including toys childrens apparel and baby products and accessories We are excited by the prospect of partnering with the management team and
employees to strengthen the long-term operating and financial performance of the businessesldquo -Matt Levin a MD at Bain
Toys ldquoRrdquo Us Files For BankruptcySept 2018
MichaelsStores
July 1 2006 $6000
We are delighted to partner with the Michaels management team to help build on its already strong position in an attractive industry and
capitalize on the significant growth opportunities that lie ahead Our deep experience in the retail sector reinforces our conviction that Michaels has
the best store locations a broad and attractive assortment of products for crafters of all ages and a sustainable competitive advantage thanks to smart investments in systems and infrastructure We look forward to helping Michaels achieve its full long-term potentialldquo ndash Matt Levin MD
IPO prices at low end of range (June 2014)
Share Price Hits Multi-Year Low in Oct 2018
As SSS Decline
Guitar Center June 27 2007 $2100
ldquoAs the leading retailer of musical instruments in the US Guitar Center enjoys great brand recognition among musicians nationwide a loyal
customer base and a track record of significant growth We look forward to working with the Companyrsquos experienced and capable management
team to continue to build the businessrdquo Jordan Hitch a MD at Bain
The End of Guitar Center
AndGuitar Center Troubles
Only Getting Worse
Gymboree Oct 22 2010 $1800
Gymboree is a terrific company with incredible brand strength and a large population of extremely satisfied customers We look forward to
working with Matthew McCauley and the companys proven and experienced management teamldquo Jordan Hitch MD at Bain Capital
Gymboree Hires Restructuring Counsel
1) Source ldquoBain Capital Sees High Profile Buyouts Go Bustrdquo NY Post March 2018
A Low-End Retailer With Unsustainably High Margins
12
Undifferentiated Goods amp Knock-Off Products
Dollarama sells undifferentiated low-priced consumer goods competing almost entirely on price Many of its products are
knock-offs It is no surprise that the Company has been sued by several companies for trademark infringement
How Dollarama became the retail king of knockoffsSelling cheap imitations of more expensive brands has turned Dollarama into one of Canadarsquos most
successful retailers earning it big bucks and plenty of lawsuits (Source)
ldquoI think they have good lawyers working
for themrdquo says David Lipkus a lawyer
specializing in anti-counterfeit in Toronto
who has helped clients sue businesses in
Canada selling knock-offs ldquoOften
retailers make mistakes and end up
selling fakesrdquo Many lawsuits are settled
privately but the store has been sued
by Nike for selling counterfeit
footwear emblazoned with Nikersquos
iconic basketball player silhouette and
by Umbra a home decoration company
for selling a style of waste basket In
February 2017 Dixon Ticonderoga
launched a suit against the dollar
store chain for a pencil itrsquos been
selling since 2002
Dollarama sells a wide range of discounted knock-offs across product categories
Its business invites litigation
Brazen mimicry multiple knock-offs
of a single producer (Mars)
Source
13
Per-Store Traffic Growth Stagnant But Opportunities For Price Increases May Be Exhausted
Growth in per-store sales has been driven by transaction size growth against declining per-store traffic Transaction
size growth has itself been driven by sales of higher-priced items Dollaramarsquos maximum price point has risen from
$1 prior to FY 2008 to $2 in FY 2008-09 to $3 in FY 2012 to $4 in FY 2017
Contracting store traffic puts per-store sales growth at risk absent further price increases but we question whether
price-driven SSS growth is sustainable as higher prices erode Dollaramarsquos value proposition and put it in closer
competition with more comprehensive big-box retailers Management has expressed reluctance to raise prices further
in the near term regardless (though they said the same when the max price was bumped to $3 several years ago) With
recent price increases now lapping for the first time SSS growth may be at risk
Growth has been propped up by price increases which have made its products more expensive than those at dollar store peers
Between a rock and a hard place Does management continue to erode Dollaramarsquos value proposition with price increases or
keep prices steady and hope for traffic contraction to reverse
Average Quarterly YOY
Growth in Per Store Traffic
-18 since Q1 2014
Transaction
size growth
decelerating
14
Increasing Average Unit Revenues Is A Very Risky Strategy That Has Failed Before
Raising price points to prop up SSS growth against falling store traffic is a major risk for discount retailers as their
entire value proposition comes from their low prices Higher prices may turn off customers and create difficult
comps in the event that price increases must be paused or reversed due to customer pushback
In 2006 for example Big Lots ndash a US discount retailer ndash introduced higher-ticket brand-name items in place of
comparable budget goods in an effort to get customers to spend more per visit This strategy reinvigorated same-
store sales growth for a time but ultimately failed Subsequent difficult comps resulted in negative SSS growth after
management abandoned its so-called ldquoRaise the Ringrdquo strategy
Raise the Ring is
abandoned lower price
points are emphasized
Raise the Ring is
introduced higher priced
items are emphasized
Big Lots alienated shoppers who were
seeking cut-price name-brand goods after
venturing into other areas
like selling frozen food
ldquoOur customer doesnrsquot come to us expecting a
Nordstromrsquos level of in-store shopping
experience They want value treasures
merchandise on the floor and clean restrooms
and we need to meet those expectationsrdquo
[CEO Steve] Fishman said in 2005
hellip
ldquoWersquore an enigmardquo he said at an investor
conference this month ldquoItrsquos been a real
challenge for the marketplacerdquo Source
Calls with industry experts indicate that Dollarama is losing more price-conscious customers to Dollar Tree and other discount retailers
following its efforts to raise prices and that this is a major driver behind recent per-store traffic declines
If price-conscious customers arenrsquot interested in shopping at Dollarama we wonder who ishellip
15
ldquoNothingForADollaramardquo Customers Becoming Conscious Of Price Increases Versus Competitors
Dollaramarsquos price increases may not yet put its prices on par with those of big box retailers like Walmart but
customers have taken notice that Dollarama has increased prices against other Canadian dollar stores Comments
from various internet forums and news sites reveal that customers no longer believe that Dollarama offers as much
value as do other discount retailers suggesting that the strength of Dollaramarsquos value proposition ndash the source of
its appeal and foundation of its business model ndash is at risk The below comments are anecdotal but comments of
this sort regarding Dollarama in particular are nonetheless common among relevant websites
ldquoThe dollar store is no longer a bargain if you
shop around you can by the same things
cheaper or same price elsewhere quit
calling it dollarama no more dollar thingsrdquo
Source
ldquodollar tree here is drastically cheaper then
dollarammardquo ndash Cody Williams
ldquoCody Williams Same here Dollarama is not
really a dollar store anymorerdquo ndash JJ Walker
Source
ldquoI enjoyed the days when everything in Rama
actually was a dollar I go to Dollar Tree
more often now just because everything
there is $125 - ($1 in the US of course)rdquo
Source
ldquoTheir high prices is the problem they still
have better selection than Dollar Tree but
their prices are always higher I know some
dollar store shoppers who go to Dollar
Tree first for the better prices and then go
to Dollarama for the stuff they couldnt
find at Dollar Tree Myself personally have
watched the prices creep up A pair of work
gloves climbed from $250 to 4 or 5 bucks
the discount over Home Depot is only a
buck or two now Also Dollar Tree still
keeps all items under 2 bucks I believerdquo
Source
ldquoThey gonna have to change the Dollarama
name soonrdquo
ldquodollarandaquarterramardquo
ldquoNew Name NothingForaDollarrdquo
ldquoYou forgot lsquoramarsquo NothingForADollaramardquo
ldquoAs for a new name how about
FiveFinaramardquo
ldquofive or lessarmardquo
Source
ldquoDollarRama is no longer in the same
category since they sell at higher prices
more of a discounted store and not a dollar
storerdquo
Source
Just did a quick check of my cleaning cupboard
DT=Dollar Tree DM=Dollarama
- 284L bleach $125 at DT Sometimes they even
have the big 37L bottles Never seen bleach that
cheap at DM
- 976ml Fabric Refresher $125 at DT DM sells it for
$150 and its a smaller bottle
- Oxy First Force spray cleaner $125 at DT $150 at
DM
DT also has a selection of other spray cleaners at
$125 while even other no name ones at DM can go
up to $2
- No name dish soap 1479ml (almost 15L) for $125
at DT 500ml for a $1 (or I guess $125 soon) at DM
- No name Mr Clean sponges At DT its two full
sponges for $125 At DM each sponge is half Mr
Clean cleaner sponge and half normal cheap sponge
- Those square no name tupperware containers that
are 3 for $125 at DM are 4 for $125 at DT
At the dollar-ish level everything Ive found at DT
has been a better value and equal or better
quality
Source
16
Transitioning Away From ldquoDollar Storerdquo Identity Threatens Customer Loyalty
Perhaps in recognition of the fact that Dollarama is losing its status as a true dollar store and that it now belongs to a
different category management has stricken almost all references to ldquodollar storesrdquo from Company filings This poses
a major threat to Dollaramarsquos customer appeal as evidenced by traffic trends and anecdotal customer reactions
FY 2017 Annual Information Form FY 2018 Annual Information Form
17
Margins Are Inexplicably High And Perhaps Unsustainable
We acknowledge that Dollarama is a strong operator with a strong value proposition (though perhaps a declining one) However
we question whether a discount retailer reselling Chinese knock-offs should garner among the highest operating margins of all
global retailers and whether a discount retailer with declining per-store traffic can continue to rely on price hikes for SSS growth
Dollarama stands out among global consumer companies and retailers ndash
45th out of 584 global retailers by operating margin (and 12th out of 584
global retailers by revenue multiple)
Dollarama consistently produces operating margins materially higher than
industry peers and higher than historical industry norms This gap has
only grown more substantial through the last five years
0
5
10
15
20
25
FY 2008 FY 2009 FY 2010 FY 2011 FY 2012 FY 2013 FY 2014 FY 2015 FY 2016 FY 2017 FY 2018
Peer Median Operating Margins vs Dollarama
Peer Median DOL CN
-10
-5
0
5
10
15
20
25
FY 1
989
FY 1
990
FY 1
991
FY 1
992
FY 1
993
FY 1
994
FY 1
995
FY 1
996
FY 1
997
FY 1
998
FY 1
999
FY 2
000
FY 2
001
FY 2
002
FY 2
003
FY 2
004
FY 2
005
FY 2
006
FY 2
007
FY 2
008
FY 2
009
FY 2
010
FY 2
011
FY 2
012
FY 2
013
FY 2
014
FY 2
015
FY 2
016
FY 2
017
FY 2
018
Dollarama Operating Margins vs Peers
DG FDO DLTR FRED BIG DOL CN
Source Bloomberg EQS function Source Dollarama and company filings
18
Debit Card Boost Is Played Out
Dollarama management has characterized the benefit from debit cards as being roughly a doubling in average purchase size
If true this benefit would be visible in year-over-year sales comps
The Company has not always disclosed penetration ndash and they ceased doing so after Q4 2016 ndash but the data suggest that the
average annual comp benefit was approximately 25 from FY 2013-16
Source Dollarama
00
05
10
15
20
25
30
35
40
45
0
10
20
30
40
50
60
Debit Card Penetration and Imputed Comp Benefit
Debit Card Penetration (LHS) Comp Benefit (RHS)
19
Have All The Levers Been Pulled
Dollarama has done a good job of increasing per-store revenue while investing in initiatives designed to remove operating
expenses We cannot fault management for pulling levers to expand margins but we believe the low-hanging
(and high-hanging) fruit has already been harvested
Management has also taken creative measures to raise effective average prices without raising prices directly ndash eg by
strategically replacing some lower-priced goods with close substitutes at higher price points and by reducing the size of
product bundles (pencils candies etc) without cutting prices Such back-door avenues to margin expansion may be exhausted
by this point as noted previously customers are beginning to notice that Dollarama no longer offers a value proposition
comparable to competing dollar stores
FY 13 FY 14 FY 15 FY 16 FY 17 FY 18
Revenue LeversAdd $250-$300
Price PointsDiscounting With Hedged Margins
Add $350-400 Price Points
Accept Credit and Debit Cards
Cost LeversDollar City
RelationshipNew POS Terminals
Kronos Labor Scheduling
Wi-Fi amp ScannersNew Warehouse
ConstructionWarehouse Expansion
Accounting and Financial Levers
Depreciation Schedule Change
Direct Profit from Currency Hedges
Leveraged Share Repurchase
ldquoThanks and good morning In the write up in the
discussion of the foreign exchange headwinds
and gross margin you also said you made select
changes to your product mix I am just wondering if
you could elaborate are there certain categories
thatrsquos your emphasizing in certain categories you are
deemphasizing I am just wondering what that
sentence really meantrdquo
- Peter Sklar BMO Capital Markets
ldquoIts really an item by item discussion Where the
compelling value remains and we are able to take for
example two pencils out of a pack and still be
competitive to help with offsetting some of the
headwinds thatrsquos the way we handle it or in other
cases if we replace the product with a new offering
thatrsquos just as compelling but different at a lower
cost potentially Thatrsquos another way Buyers can use
that tool to help them with the current challengesrdquo
- Michael Ross CFO Dollarama
Is this a sustainable practice as value-oriented customers lose faith in Dollarama
FY 2016 Q4 Earnings Call QampA
20
Costs Rising On Multiple Fronts
While management may have largely exhausted avenues for price increases and efficiency gains other industry and Company
developments threaten to drive up costs through the near term
Cost Driver Explanation
TariffsA significant share of goods (~20 according to industry experts) are sourced either directly or indirectly from the US Tariffs could increase costs on these goods materially
Minimum Wage Hikes
Provincial minimum wages in Canada generally rise much more frequently than do US minimum wages and many are scheduled to rise on an annual basis based on CPI growth Minimum wage hikes have been particularly significant of late (see below) Even provinces whose minimum wages are not tied to CPI growth have seen or are set to see material minimum wage hikes in the near future Notable recent and near-term changes are as follows
bull Alberta From $1360 to $1500 on October 1 2018 (103 increase)bull British Columbia From $1265 to $1385 on June 1 2019 to $1460 on June 1 2020 and to $1520 on June 1 2021 (63 CAGR)bull Ontario From $1160 to $1400 on January 1 2018 (207 increase) and to $1500 on January 1 2019 (additional 71 year-over-year increase)
Will rise according to Ontario CPI growth every October 1 each subsequent year New Ontario Premier Doug Ford is looking to reverse these plansbull Quebec Just increased to $1200 (+66 in May 2018) Significant political push to set provincial minimum wage at 50 of average provincial
minimum wage by 2020bull Manitoba New Brunswick Newfoundland Nova Scotia Ontario Saskatchewan and Yukon Annual minimum wage hikes according to national or
local CPI growth
Employee remuneration for FY 2018 was just over 10 of Dollarama revenue This cost item could realistically grow at a high single-digit rate over the next 2-3 years even if headcount is reduced
Transportation and Logistics
Industry experts have expressed concerns regarding near-term transportation cost increases These would hit Dollarama particularly hard as Dollarama is unique among industry peers It has only one distribution center Rather than invest in a second Dollarama recently purchased its existing distribution center in Montreal ndash which it previously leased from the Rossy family ndash for $394M (in addition to $232M spent on adjacent land) Other large Canadian value retailers generally have two distribution centers ndash one in the eastern half of the country and one in the western half
Rising fuel costs could result in materially higher transportation expenses as Dollarama distributes 92 of its merchandise through its single distribution center Industry experts suggest that shipping goods to Vancouver from Montreal via truck can be almost twice as expensive as shipping to Vancouver from China
We find it interesting that Dollarama chose to purchase property from managementrsquos family rather than follow industry norms and open a second distribution center in western Canada and that five of its six warehouses ndash all located in greater Montreal ndash are also leased from the Rossy family (the sixth warehouse is company-owned built on land purchased from the Rossy family)
MarketingDollarama has historically operated with no marketing expense However US peers spend 1-2 of revenue on average on marketing (see subsequent slides) As competition increases across the Canadian discount retail industry management may be forced to expand marketing efforts
21
Minimum Wage Growth Historically High And Accelerating Rapidly
Canada has seen fairly consistent minimum wage hikes since 2000 and minimum wage growth has outpaced inflation in all but
three years since the beginning of the millennium Dollarama has been able to manage minimum wage hikes and maintain
impressive margins since going public in 2009 Note however that minimum wage growth from 2009-17 was comparatively mild
relative to the prior half-decade Accelerating minimum wage growth through the near term will test managementrsquos ability to
insulate margins from rising labor costs
0
2
4
6
8
10
12
14
2001 2002 2003 2004 2005 2006 2007 2008 2009 2010 2011 2012 2013 2014 2015 2016 2017 2018YTD
Minimum Wage Growth Consistently Ahead of Inflation and Accelerating Rapidly
Weighted Average Minimum Wage Growth Canadian CPI Growth
Minimum wage growth across all Canadian provinces weighted by
province population
Management states that the vast majority of employees make more than minimum wage Nonetheless minimum wage hikes of 10-20 in
Canadarsquos most populous provinces could put material upward pressure on labor costs ndash particularly if these hikes spread to Quebec where
Dollaramarsquos distribution center and all of its warehouses are located Management includes a risk factor to this effect in its MDampA
210
215
220
225
230
235
240
245
250
255
260
FY 2018 EBITDA Margin FY 2018 EBITDA Margin with5 Labor Cost Hike
FY 2018 EBITDA Margin with10 Labor Cost Hike
EBITDA Margin Sensitivity to Labor Cost Hikes
12 weighted average minimum wage growth across Canada driven by
207 hikes in Ontario Average minimum wages could very realistically
continue to grow at high single-digit rates through the next ~2 years if
planned hikes are enacted
With labor costs representing about 10 of Dollarama revenue
profitability is materially sensitive to changes in this item
If labor costs were 10 higher in FY 2018 EBITDA margins would have
been slashed by 80 bps
Labor cost expansion of this magnitude would be significant but is not
necessarily out of the question within 2-3 years
Source Government of Canada
22
Lack Of Transparency Regarding Dollar City Is A Serious Concern
CEO Larry Rossy
and
CFO Michael Ross
mischaracterized
the sale by
attributing it to
vehicles which
has its own
categoryhellip
Why are Dollarama shopping carts being repurposed for Dollar City use
Perhaps they were sold above-market to Dollar City in FY 2013 when the relationship began Could this be the
reason for an unexplained $149M disposal of leasehold improvements that year
Source
1) Dollar City website and press
release announcing the relationship
Q ndash Keith Howlett ldquoOn Note 5 [of the FY
2013 Annual Report] I was trying to figure
out the leasehold improvements there
seemed to be some items called lsquodisposals
at costrsquo and therersquos sort of an offset thererdquo
A ndash Larry Rossy CEO ldquoI donrsquot know what
they are Yoursquore going to have to help me
out guys hererdquo
A ndash Michael Ross CFO ldquoDisposal of costs
that would be fixtures or related tohelliprdquo
A ndash Rossy ldquoI would say carsrdquo
A ndash Ross ldquoCars Yeah okay We sold a
few carsrdquo
Q ndash Howlett ldquoOh I see okay Well it
shows up as CAD 15M for a year thatrsquos a
lot of carsrdquo
A ndash Rossy ldquoOh itrsquos a very expensive
carrdquo
Source FY 2013 Q4 Earnings Call Source Dollarama
2013 Annual Report
In 2013 Dollarama entered into an agreement to export and sell products to Dollar City a Latin American dollar store with a
presence in El Salvador Guatemala and Colombia In exchange for selling goods to Dollar City ldquoat costrdquo plus a small markup
and providing business and operational expertise Dollarama was given an option to acquire the chain exercisable in February
2019 (since extended to February 2020)
Details about Dollar City are scarce Who is the management Where is company headquarters Who are the shareholders
Dollar Cityrsquos website provides limited information and not a single Dollar City manager was quoted at the initiation of the
relationship1 Though management claims to sell to Dollar City ldquoat costrdquo with a markup we have no way of determining how they
are calculating ldquocostrdquo It is more likely that Dollarama loads shared costs into the Dollar City bill that flatter Dollaramarsquos margins
and sells merchandise that isnrsquot selling well in Dollarama stores to Dollar City
More Competition Coming To An Already-Crowded Space
24
Evidence Of Dollarama Store Growth Slowing
The pace with which Dollarama opened stores through the past several years does not appear to be sustainable
Importantly the inevitable reversal in its pacing appears to be occurring this year
The Company opened just eight stores in Q2rsquo19 its lowest store opening count in any quarter of any recent year
Its YTD FY 2019 pace of 18 new stores is also trailing the average pace of recent fiscal years (28 openings) by
~35 Management did not provide a fully satisfactory explanation for this deficit
The slowdown in its pace of store openings could suggest that the Company is having a difficult time identifying
economically-viable locations as it seeks to grow its store count by close to 50 ndash still a very distant target
Fiscal YearStated New
Store Opening Goal
Q1 Q2 First Half Q3 Q4 Total
2019 60-70 10 8 18
2018 60-70 13 17 30 10 25 65
2017 60-70 8 13 21 18 26 65
2016 None 17 17 34 16 25 75
Source Dollarama financial filings
ldquoI want to ask about the pace of store
openings As you noted the slower start to
the year you did maintain the guidance for
this year But wondering about sort of further
beyond that obviously the store potential that
you put out there gives you room to remain at
that pace for a while But does the slower
same store sales assumption change your
thinking about how aggressively you want
to push new stores out thererdquo
- Mark Petrie CIBC
ldquoNo it does not It does not And that I would
also add that if the pace at which weve been
opening stores this year is slower than last year
as mentioned often that just relates to the
specific timing of real estate And if stores are
pushed closer to the end of the year it could be
that there is an overlap between a few more
stores at the end of this year or a few more
stores in the beginning of next year and the
end it will keep our pace of 60 to 70rdquo
- Michael Ross CFO Dollarama
ldquoReal estate timing issuesrdquo
do a poor job of explaining a
drop in H1 new store
openings of over a third
Source Dollarama Q2 FY 2019 Earnings Call
25
Dollarama Potentially Pushing The Limits Of The Canadian Market
Managementrsquos stated goal is to have 1700 stores across Canada by 2027 up from 1178 stores today We do not
believe that it can achieve this without risking significant cannibalization DOLrsquos target would imply a saturation level
higher than the largest US dollar stores (Dollar Tree and Dollar General) which also sell many more consumables and
grocery items Additionally Canada broadly has much lower levels of retail space per capita than the US suggesting
that Canadian concentration is even more pronounced all else equal
US Retail Square Footage Greater Than Canadian
Retail Square Footage
DOLrsquos Target Implies
Greater Than US
Saturation Despite
Narrower Concept
Source Wellington Management
Walmart is not opening stores in Canada suggesting that it believes
the Canadian market is saturated at 114 stores per million people ndash
about 69 of its US concentration (164 stores per million people)
Meanwhile Dollarama continues to expand within Canada despite
even higher Canadian concentration (327 per mil) relative to the US
concentration of large US dollar stores (452 per mil for a 72
ratio) This ratio would be over 100 at DOLrsquos 1700 store target
Higher Canada store
count vis-agrave-vis
comparable US
store count
compared to Walmart
Higher Canada store
concentration vis-agrave-
vis comparable US
store concentration
than Walmart
Retailers with similar store concentrations per capita across both the US and
Canada are effectively more concentrated in Canada vis-agrave-vis the total retail space
in either country
Store Count by Region
Canada US CanUS Ratio
WMT 410 5358 77
DOL ndash Present 1178 14750 80
DOL ndash Future 1700 14750 115
Store Count per Million People by Region
Canada US CanUS Ratio
WMT 114 164 69
DOL ndash Present 327 452 72
DOL ndash Future 472 452 104
DOL CN DG DLTR
Stores 1700 14760 14732
Population (M) 36 326 326
StoresCapita (M) 472 453 452
26
Dollarama Has Benefited From A Benign Competitive Environment
Large competitors have been shuttering Canadian stores continuously through the last four years due to company-
specific issues highlighted by the high-profile exits of Target and Big Lots from Canada12 We believe that this has been
a significant tailwind for Dollarama but one that is largely behind the Company at this juncture
Dollarama has been able to maintain significant share high margins and high returns on capital in large part due to
missteps among peers and the resulting lax competition This is likely unsustainable in a more competitive environment
as Dollarama has few material competitive advantages barriers to entry are low and its discount retailing strategy is not
unique Competent competition from growing industry players ndash Dollar Tree Canada Miniso and Amazon among others
ndash could be the straw that breaks the camelrsquos back for Dollaramarsquos profitability or growth (or both)
Fiscal YearCompany Exiting
CanadaStores Closed Revenue
DOL Revenue Capture
(Estimated)
Estimated Revenue Benefit
Revenue Boost
2018 Sears 200 $2000 3 $60 2
2017 Sears 100 $1000 3 $30 1
2016 Target 133 $2000 6 $120 4
2015 Big Lots 78 $155 10 $16 1
Last Four Year Average $56 2
Note All numbers are SPCM estimates
1) ldquoTarget Canada to close all stores by April 12rdquo
2) ldquoBig Lots Getting Back Out of Canadardquo
27
Light Competition Has Allowed The Company To Spend Nothing On Promotion ndash Until Now
Dollarama has no promotional expense Meanwhile promotional expenses average 1-2 of revenue among US
peers As established competitors continue to expand and as new competitors enter the market (Amazon included)
Dollaramarsquos no-cost marketing strategy may prove untenable
Promotional Expense
as a of Revenue
Intensifying Competition Threatens Dollaramarsquos
Passive Marketing Strategy
2016 2017 2018
BIG 180 180 170
FIVE 264 270 243
DLTR 021 029 048
DG 062 054 044
Average 132 133 126Source Huffington Post
Source Investorscom
The Canadian operation is also a relatively small part of the business However early results are
encouraging and despite competition in the Canadian market Dollar Tree has found success Longer
term the company is aiming for 1000 stores north of the border which does not seem unrealistic
Source Retail Environments
Calls with people at Dollar Tree suggest that the Company is working to
imitate elements of Dollaramarsquos strategy and store layout in its own
Canadian stores (eg raised shelves etc) and that it plans to expand
into Canada aggressively once its strategy is refined ndash likely in 2019
Source Company financial filings
28
Caught Between The Competition How Will Dollarama Fit In
Dollar Tree has maintained its reputation as a true dollar store nothing is priced higher than C$125 ($1 in the US)
Miniso has developed a reputation as a ldquonicerrdquo discount retailer items can cost up to C$25 but the environment is cleaner and
more modern and products are of better quality (but you can still get a dollar-level deal ndash most products are priced under C$10)
Dollarama has all the character of an old tired dollar store but without the dollar prices
Who will shop there unless management invests in store updates rather than opening new stores
Value-driven customers are by definition not loyal customers
Miniso
Clean and modern but cheap
Dollar Tree
No need for price tags everythingrsquos $1 Dollarama
Looks like Dollar Tree priced like Miniso
Irsquoll pass
29
Dollarama Makes No Effort To Appeal Millennials ndashThe Next (And Current) Shopping Generation
Dollarama has zero social media presence unlike all of its peers Not only is the Company out of touch with customers in
an industry which demands a high level of customer engagement but its brand is becoming demonstrably stale
Facebook Twitter Instagram YouTube LinkedIn Pinterest Google+
Dollar Tree Yes Yes Yes Yes Yes Yes No
Dollar General Yes Yes Yes Yes Yes Yes Yes
Family Dollar Yes Yes Yes Yes Yes Yes No
Big Lots Yes Yes Yes Yes Yes No Yes
Miniso (Canada N America)
Yes Yes Yes Yes Yes No No
Great Canadian Dollar Store
Yes Yes No No No No No
Dollarama No No No No No No No
Until now Dollarama has largely been a regional brand with satisfactory name recognition in its provincial home of Quebec
Now that the Company is making a bigger push into Anglophone Canada management should be more proactive in adapting its
strategy to new markets and to a new customer base Yet management continues to employ a strategy more befitting a sleepy
regional business it does not market or work to improve its brand it does not stay current with trends it keeps management
within the family and it is not expanding its logistics chain to support coast-to-coast growth (see subsequent slides)
Management wants Dollarama to be a national brand but it does not appear prepared to run a national business
Questionable Accounting And Financial Practices
31
Hedging Instruments A Material Source Of Profits In Recent Years
Dollaramarsquos sales are in Canadian dollars whereas a majority of its product purchases are US dollar-linked Management claims to enter
into CADUSD hedging arrangements to lock in near-term margins without having to adjust prices in response to FX movements However
management has nonetheless admittedly adjusted prices alongside unhedged peers in response to shifts in the CADUSD exchange rate
rendering its currency hedges a source of profit
Forex dynamics through the last two years have erased the large hedge benefit realized by Dollarama in FY 2016 but management reports
that gross margins have effectively remained flat through this period implying significant gross margin improvement in the underlying
business (see graphs below) As the currency hedge benefit has reversed through the last two years underlying gross margins have
purportedly risen by EXACTLY ENOUGH to keep total gross margins steady between 39-40 We find this oddly convenient ndash or at the very
least we question whether management will be able to maintain steady margins in the face of unfavorable FX rate dynamics in the future
Quick turnaround in
underlying
profitability Just in
time to keep the
declining forex hedge
benefit from dragging
down marginshellip
Even as FX hedge gains fell
from close to 8 of gross profit
in FY 2016 to a drag on gross
profit in FY 2018 gross margin
expanded by over 100 bps over
the same period implying gross
margin expansion ex-forex of
almost 300 bps within two years
for a retailer with gross margins
which were already unusually
high and whose margins had
contracted for four straight
years before the rapid reversal
32
Questionable Depreciation Assumptions
Dollarama changed its depreciation schedule for leasehold improvements (store fixtures) in FY 2015 moving from a 10-year to a 15-
year expected life1 However management did not concurrently lengthen the amortization schedule for tenant inducements
We find this mismatch curious as both quantities should be amortized depreciated over the expected life of a given lease
Adding to the confusion and appearance of foul play DOL discloses in its AIF that its average lease term is just 5 yrs and it just
started disclosing related-party dealing with Director Huw Thomas of SmartCentres ndash a REIT that lists DOL as a top 10 customer23
Lease term implied
by leasehold
depreciation expense
2-3x greater than that
implied by
amortization of
tenant allowance
Mismatch in implied
lease term
inappropriately
inflates EBIT
C$ MillionsFY
2013FY
2014FY
2015FY
2016FY
2017FY
2018
Amortization of Tenant Allowance $29 $35 $43 $49 $48 $51
Starting Balance Sheet Amount 168 207 232 280 344 386
Amortization as a of Asset Amount 173 169 185 175 140 132
Implied Lease Term 58 59 54 57 72 76
Leasehold Depreciation Expense $129 $166 $108 $141 $172 $202
Starting Balance Sheet Amount 1182 1348 1762 2113 2499 2867
Depreciation as a of Asset Amount 109 123 61 67 69 70
Implied Lease Term 92 81 163 150 145 142
Tenant Allowance Amortization Using Leasehold Depreciation Schedule
183 255 142 189 237 272
Reduction In EBIT If Both Were Put On Same Schedule (11) (10) (29) (30) (24) (24)
While the financial impact of this adjustment is limited signs of accounting impropriety do not reflect well on management and cast
doubt on the rest of Dollaramarsquos reports and accounting practices
1) FY 2015 Annual Report p 15 DOL also extended its store and warehouse equipment useful lives from 8-10yrs to 10-15yrs The total reduction of these three items was decrease of $10m in
FY15 depreciation expense
2) DOL states in its AIF p 11 ldquoThe Corporation typically enters into leases with base terms of ten years and options to renew for one or more periods of five years each The average time to
expiration of the Corporationrsquos leases is approximately five yearsrdquo
3) See governance slide on Huw Thomas
33
Capital Spending And Distribution Of Cash To Shareholders Are Overextending The Business
What happened
Management claimed in 2011 that the business was sufficiently cash-generative to support growth and dividendsshare buybacks
and that it would be able to pay down debt while pursuing both However debt has ballooned since then with net debt rising 8x
(and close to 3x versus EBITDA growth) Management is effectively levering up the balance sheet to support dividends and share
buybacks with CFO Michael Ross stating that he will continue to repurchase shares as long as the earnings yield remains above
the after-tax cost of debt
ldquoFor the past few years our cash flow has enabled
us to continue to pursue our growth plans and
continue to pay down debt Our free cash flow is
now sufficient to fund both those priorities
while enhancing new to shareholders through
a quarterly dividend payment We are able to
generate the free cash flow to do all of this
because we employ a simple growth oriented
business model at Dollaramardquo
ndash June 2011 Conference Call
Should Dollaramarsquos struggles become more pronounced ndash or should the
economic cycle turn for the worse ndash this debt overhang could loom large over
the business
Dollarama also consistently spends more on capex (as a percentage of sales) than its peers in the discount retail industry and
shows abnormally high capex versus depreciation and amortization We understand that Dollarama is a growing business which
could explain both patterns in part but it is not the only discount retailer which is investing in store growth
Dollarama DampA consistently
lt50 of capex and a lower
percentage of capex than
industry peers
Dollarama consistently
spends more on capex
(as a percentage of sales) than industry peers
00
05
10
15
20
25
0
200
400
600
800
1000
1200
1400
1600
1800
FY2012
FY2013
FY2014
FY2015
FY2016
FY2017
FY2018
Ne
t D
eb
tEB
ITD
A
Ne
t D
eb
t ($
C M
M)
Net DebtEBITDA Net Debt
0
50
100
150
200
250
300
FY2010 FY2011 FY2012 FY2013 FY2014 FY2015 FY2016 FY2017 FY2018
DampA as a of Capex and Intangibles Annual
DOL DLTR DG BIG FRED
0
1
2
3
4
5
6
7
8
FY2010 FY2011 FY2012 FY2013 FY2014 FY2015 FY2016 FY2017 FY2018
Capex and Intangibles as a of Sales Annual
DOL DLTR DG BIG FRED
34
Where Is The Capex Going
Management has explicitly identified and discussed various capital expenditures in Company filings over the last
five years but this still leaves a large gap versus what was actually spent
Additionally there is a large gap between the amount spent on software development and the amortization expense
associated with this activity suggesting that earnings may be inflated
Some of this is
directed towards
leasehold
improvements etc
but with
managementrsquos
focus on expansion
over existing store
improvements we
question where
management is
directing this capex
Capital Spending Software
on Software Amortization Difference
FY 2018 191 126 65
FY 2017 126 96 3
FY 2016 111 78 33
FY 2015 108 56 52
FY 2014 98 34 64
Are earnings
inflated due to
insufficient
amortization
Note also that a LinkedIn search for software developers at Dollarama turned up effectively nothing ndash at best one person with a tangentially
relevant title (source) So where is the software development capex going
Unlike discount retailer peers Dollarama
did not include software-related
spending in capex until recently and
records it separately in
ldquoAdditions to intangible assetsrdquo1
Do they do this to artificially deflate their
headline capex figure thereby inflating
reported free cash flow
Undiscussed Capital Spending (FY 2014 ndash 2018)
C$ Millions
$500K in capex spent per new store (375 new stores over past five years Source AIF) $1875
Capex spent on construction of 500K sqft warehouse in Montreal 679
$82M spent annually on expansion renovation or relocation of stores over five years 410
$232M spent on land acquisition 232
Discussed Capex Over Past Five Years $3196
Total Reported Capex (ex intangibles) $5200
Undiscussed Capex $2004
Software Capex and Software Amortization Discrepancy
C$ MillionsCapital Spending on
SoftwareSoftware Amortization Ratio
FY 2018 $191 $126 152
FY 2017 126 96 131
FY 2016 111 78 116
FY 2015 108 56 193
FY 2014 98 34 288
1) DOL explicitly started calling out software as a component of capex in Q3rsquo16 with the addition of footnote to guidance
35
Lack Of Transparency Regarding Store Closures And Associated Costs
It is standard industry practice to report store closures remodels and relocations alongside new store openings
However Dollarama reports only ldquoNet New Storesrdquo and does not break this number out in detail Questioned on this
in Q4 2016 management answered that a larger store base would inevitably result in more closures for reasons
outside of its control (fires mall renovations etc) and that reporting closures would therefore not communicate
meaningful information regarding the underlying performance of the business
We strongly disagree store closure information is vital to evaluating the health of a retail chain Management can
provide color on particular closures if it feels that they have been done for reasons other than performance but
failing to report closures entirely hides a key operating statistic from investors
Company Store Movement 2012 2013 2014 2015 2016 2017 2018
DLTR
Beginning 4101 4351 4671 4992 5367 13851 14334OpenedAcquired 278 345 343 391 8850 584 603
Closed 28 25 22 16 366 101 102Closed as of Beginning 07 06 05 03 68 07 07
BIG
Beginning 1398 1533 1495 1493 1460 1449 1432Opened 181 87 55 24 9 9 24Closed 46 46 58 57 20 26 40
Closed as of Beginning 33 30 39 38 14 18 28
DG
Beginning 9372 9937 10506 11132 11789 12483 13320Opened 625 625 650 700 730 900 1315Closed 60 56 24 43 36 63 101
Closed as of Beginning 06 06 02 04 03 05 08
FDO
Beginning 7023 7442 7916 -- -- -- --Opened 475 500 526 -- -- -- --Closed 56 26 400 -- -- -- --
Closed as of Beginning 08 03 51 -- -- -- --Overall Industry Average 09 07 20 07 23 07 08
Other high-growth dollar
stores like Dollar Tree and
Dollar General report store
closures ndash why doesnrsquot
Dollarama
Store closures for whatever
the reasons incur real
restructuring and other
costs Peer retailers
generally give detail on these
expenses whereas
Dollarama does not
We believe that Dollarama
should follow industry norms
and increase transparency
regarding store closures
US Dollar Store peers historically close 08 of stores annually yet Dollarama has not reported any recent closures
36
SSS Metrics Obfuscate Store Performance
Dollaramarsquos official ldquoComparable Store Salesrdquo figure includes ldquorelocated and expandedrdquo stores as ldquocomparable storesrdquo
therefore picking up growth in traffic which can be attributed to relocation-related improvements We believe that this likely
overstates Comparable Store Sales growth while also ignoring associated relocation-related expenses
1) See Q1 FY 2014 earnings call transcript
Management not only hides store closure data as a supposedly uninformative statistic but proclaims that it has NEVER closed a
store due to poor performance1 We find it difficult to believe that a retailer which has existed in its current format since 1992 has
never needed to close a store for poor performance If it has indeed never closed an underperforming store we wonder whether
management has been too ambitious in growing its store base without critically evaluating the profitability of each location
Huntsville Place Mall Jul 2015
7 John St Oct 2012
7 John St Jul 2015
Huntsville Place Mall Oct 2012
Huntsville ON
Relocation
Are these really entirely
ldquocomparablerdquo locations
781 Rue Principale Est May 2016
781 Rue Principale Est Jun 2009Le Carrefour Ste Agathe
May 2016
Ste-Agathe-Des-Monts QC
Relocation
Why assume the costs to
make this lt1 mile move
Notice
Dollarama
sign turned
inside-out
indicating
closure
37
Cash Flow Beginning To Turn Over Despite Efforts To Bolster Results
In H1 FY 2019 Dollaramarsquos cash flow contracted on a year-over-year basis for the first time since it went public ndash this
despite managementrsquos efforts to bolster earnings and EBITDA The contraction appears to be due in large part to
changes in working capital In particular we are concerned that growth in inventories suggests that management
overestimated near-to-medium term sales growth and that declining traffic is starting to weigh on the Company
Dollarama H1 Operating Cash Flow
C$ Millions FY 2014 FY 2015 FY 2016 FY 2017 FY 2018 FY 2019
Net Income $1054 $1221 $1603 $1895 $2265 $2433
CFO Before Working Capital 1394 1488 2124 2156 2769 2999
Changes in Working Capital (287) (236) (870) (110) (126) (886)
Net CFO 1107 1252 1253 2045 2644 2113
YoY Change $326 $322 $01 $792 $599 (531)
Source Dollarama
Governance Concerns
39
Related-Party Transactions With Rossy Family Raise Questions Over Governance And Costs
Fiscal YearRent amp Land Purchases
Paid to Rossys(C$ MM)
As a of Compensation Paid to Rossy Family
FY 2019 (To Date) $394 NA
FY 2018 184 1660
FY 2017 402 4459
FY 2016 179 1305
FY 2015 169 2752
FY 2014 163 1903
As noted Dollarama leases all but one of its five warehouses from the Rossy family and recently purchased land from the Rossys
for the construction of a sixth Management also recently purchased its Montreal distribution center from the Rossy family which
leased the facility to Dollarama until this February We understand that the Rossy family has close historical ties to the business
but this level of close dealing draws our attention particularly given the fact that management has focused on fortifying its
existing distribution footprint ndash closely tied to the Rossy family ndash rather than invest in distribution facilities in western Canada
where major competitors already have distribution centers
DLTR
Distribution
Center
Delta BC
DLTR
Distribution
Center
Mississauga ON
DOL
Distribution
Center
DOL
Warehouses
No Dollarama distribution facilities
located outside of a ~4 mile radius in
Montreal
bull Due to preferential relationship with
Rossy family
bull Will Dollarama be able to expand into
AngloWestern Canada efficiently
without logistics costs ballooning
bull Overly-exposed to fuel price hikes
and rising transportation costs
Related-Party Transactions Significant And Growing
Source Dollarama Financials
Dollar Tree Canada Distribution Centers
Dollarama Distribution Centers And Warehouses
Source DollarTree
Montreal QC
40
Related-Party Transactions With ldquoIndependentrdquo Director Huw Thomas Only Recently Disclosedhellip
Dollarama also leases stores from SmartCentres REIT whose recently-departed CEO Huw Thomas joined Dollaramarsquos
Board of Directors in 2011 and was a member of its audit committee through March 2017
His ldquoindependencerdquo was recently defended by a meandering 260-word footnote in Dollaramarsquos proxy which belies the
fact that Dollarama is a top 10 customer of SmartCentres
This is all the more suspicious in light of Dollaramarsquos questionable lease accounting highlighted earlier
Source Dollarama 2018 Proxy Circular
Note Dollarama did not start disclosing Huwrsquos related-party dealing until the 2017 proxy
circular in June 2017 right after he left the Audit Committee in March 2017
SmartCentres 2017 Annual Report
Dollarama Material To SmartCentres ndash A Top 10 Customer
SmartCentres Promotes Dollarama Relationship From 2011
Calloway (now SmartCentres) 2012 Annual Report
Dollaramarsquos Lengthy Meandering Defense Of Thomas
Huw As Independent Only Recently Disclosed (2017)
Dollarama Recently Changed Rent Expense Disclosure
Source Dollarama Q4rsquo17 Financials Note 15 Related Party Disclosure
Source Dollarama Q2rsquo18 Financials Note 13 Related Party Disclosure
41
House of Windsor House of RossyA Case Study In Nepotism
Neil Rossy had been the Senior VP of Merchandising Chief Merchandising Officer for 25 years prior to being named CEO in
2016 While his family is still a large shareholder they are not a controlling shareholder owning around 5 of the shares
outstanding We question whether the Rossyrsquos century-long family tradition of passing down leadership ndash one which also
persists at the Rossyrsquos ldquosister storerdquo ndash is appropriate for a public company or wise for the long-term health of the business
Salim Rossy
Opened first ldquoS Rossyrdquo
store in 1910 (up-market
department store concept)
George Rossy
President of S Rossy
1937-1973
Larry Rossy
Grew S Rossy from 20 to 44 stores before
converting all S Rossy stores to new
ldquoDollaramardquo concept in 1992 Sold majority
stake to Bain Capital in 2004 IPO in 2009
Neil Rossy
CEO of Dollarama as of 2016
Michael Rossy
Brother of George (one of ten siblings)
Founder amp CEO of ldquoRossyrdquo stores 1949-2010
Michael DiTullio
Son-in-Law of Michael
President amp CEO of Rossy since 2010
Does (or will) the family have a hard time parting with a business that has been in the family for four generations even if parting ways is
the right thing to do
Managing retail chains is very
much a family affair for the
Rossys ndash at both stores
Perhaps Neil was going to be
anointed CEO of Dollarama
regardless of the caliber of other
potential candidates
Letrsquos hope hersquos not Commodus
BONUS
Brother branches out
with separate storehellip
42
Insiders Incentivized To Grow EBITDA
Our earlier concerns about EBITDA quality are amplified by the fact that Dollarama executives are compensated
based on seemingly arbitrary and inflated EBITDA targets This gives management a strong incentive to be inefficient
users of capital as any dollar shifted from operating expense to capex has a direct benefit to key executives
For example note that managementrsquos perhaps questionable decision to purchase one of its Montreal warehouses
will shift what was until recently rent expense into depreciation This change in the accounting treatment of
Dollaramarsquos tenancy costs will provide a windfall to EBITDA potentially boosting management bonuses
Source Dollarama Proxy Circular p 30
43
What Is A Stretch EBITDA Goal
Bonuses are paid upon achievement of 11 EBITDA growth This level was ldquodesigned to be a stretch objectivehellip
attainable only with significant effortrdquo However this target was reset lower after FY 2014 ndash the only year during which
management did not handily exceed the target We believe this further calls into question the independence of the
board and its compensation committee
Year EBITDA Growth Objective EBITDA Growth Achieved
FY 2018 11 18
FY 2017 11 18
FY 2016 11 30
FY 2015 11 15
FY 2014 13 12
FY 2013 13 22
FY 2012 13 26
FY 2014 Management
misses growth objective
FY 2015 Growth objective
adjusted downwards
ldquoThe thresholds were revised by the
Human Resources and Compensation
Committee in the context of its annual
executive compensation review
conducted at the beginning of each fiscal
year to take into account among other
elements the fact that the base for the
calculation is growing every yearrdquo
Source FY15 Management Proxy Circular
What ldquoother elementsrdquo were
taken into account
Source Dollarama
44
Insiders Selling While Company Buys Back Stock At Elevated Prices
Management has been buying back shares at elevated prices through the last several years even while pursuing growth leaving little capital for
(sorely needed) store updates or other uses The average repurchase price since Q1 FY17 is about on par with current share prices and ~40
below our target Since Q2 FY18 the average buyback price has been 25 above current levels
Furthermore just as the Company has been buying back stock at elevated prices insiders have been offloading shares Notably it is evident
from past and current proxy statements that CFO Michael Ross has never held onto shares for which he has been granted options his
common equity ownership is listed at zero every year Note that as the CFO it is he who is dictating the share buyback decision in large part
PeriodShares
Repurchased
Value of Repurchase
(C$ M)
Average Price (Split-
Adj) (C$)
Q1 FY 2017 1542066 1393 3011
Q2 FY 2017 2027080 1842 3029
Q3 FY 2017 1571500 1578 3347
Q4 FY 2017 2279522 2241 3277
Q1 FY 2018 1687240 1806 3568
Q2 FY 2018 1303900 1602 4095
Q3 FY 2018 687700 931 4513
Q4 FY 2018 2425700 3788 5205
Q1 FY 2019 94500 145 5115
Q2 FY 20191 1347341 700 5195
Total 14966549 16026 3797
Discount to Current Share Price 1
Total (Since Q2 FY 2018)
5859141 7170 4815
Discount to Current Share Price -20
Using Company Funds To Overpay For DOL Shareshellip While Insiders Sell Into The Companyrsquos Bidhellip
Source DOL filings and Bloomberg
Insider Title Date Sold SharesProceeds (C$ M)
Price Sold (Split-Adj)(C$)
Nicolas Hien Senior Vice President 482016 6203 06 3224
Michael Ross CFO 482016 80000 74 3083
Paul Roche Vice President 4182016 10000 09 3000
Geoffrey Robillard Senior Vice President 6172016 33500 31 3085
John Assaly Vice President 9272016 30000 30 3333
Geoffrey Robillard Senior Vice President 472017 20000 23 3833
Paul Roche Vice President 472017 23100 26 3752
Josee Kouri Corporate Secretary 4142017 8000 09 3750
Geoffrey Robillard Senior Vice President 9142017 5000 07 4667
Geoffrey Robillard Senior Vice President 12112017 10000 16 5333
John Assaly Vice President 12132017 14096 22 5202
Geoffrey Robillard Senior Vice President 1262018 15000 24 5333
John Thomas Independent Director 1262018 6000 10 5556
Geoffrey Robillard Senior Vice President 6152018 50000 75 5000
John Assaly Vice President 6192018 13404 21 5222
Nicolas Hein Senior Vice President 6222018 36750 19 5170
Paul Roche Vice President 6222018 24000 13 5417
We do not like the fact that insiders have been selling into share buybacks while
the Company levers itself up with short-term debt to support those repurchases
It appears that the execs are levering up the business in part to enrich themselves1) All share information prior to Q2 lsquo19 reflects pre-split data except
Split-Adjusted Average Prices Q2 lsquo19 repurchases were as stated
45
Rossy Family Selling Shares Despite Control Over C-Suite
Notably Founder and former CEO Larry Rossy has trimmed his position tremendously through the last several years
Though this is to be expected to some extent as he recently ceded control of the business we believe that his
ownership stake should be held to a higher standard given his insistence on keeping the business in the family
If he plans to keep the c-suite under a Rossy dynasty the familyrsquos personal stake in the business should reflect that
Source Bloomberg
Valuation And Price Target
47
The Market Has Not Taken Threats To Dollarama Seriously ndash But Optimism Is Ebbing
Analysts are generally bullish on the stock focusing primarily on managementrsquos growth story and taking current
profitability levels for granted The prospect of new competitive threats to a business which has until now seen limited
competition ndash and the risk that prevailing margins are unsustainable even through the near term ndash go underappreciated
Dollaramarsquos poor Q2 cooled analystsrsquo optimism to some extent but we believe that the reaction was largely reactive and
superficial as they adjusted their price targets in such a way that in aggregate they saw exactly the same upside after the
post-Q2 dip as they did before The market still does not fully appreciate the magnitude of the threats facing Dollarama
All price targets in C$ Before Q2 Release After Q2 Release
Firm Recommendation Target PriceUpside (on 82818) Recommendation Target Price
Upside (on 9172018)
Upside (Present)
RBC Capital Markets Outperform $5500 12 Outperform $5200 22 35
Raymond James Outperform $5567 13 Outperform $5000 17 30
Macquarie Outperform $5633 14 Outperform $4900 15 27
BMO Capital Markets Outperform $6100 24 Market Perform $4700 10 22
CIBC Capital Markets Outperform $5900 20 Neutral $4600 8 20
Desjardins Securities Buy $5800 18 Hold $4500 6 17
Veritas Investment Research Co Buy $5600 14 Buy $4800 13 25
Industrial Alliance Securities Hold $5450 11 Buy $5450 28 42
Canaccord Genuity Buy $5900 20 Buy $5500 29 43
Barclays Equal Weight $5200 5 Equal Weight $4400 3 14
TD Securities Buy $5900 20 Hold $4900 15 27
Accountability Research Corp Buy $5400 10 Buy $5000 17 30
National Bank Financial Outperform $5567 13 Sector Perform $4800 13 25
Scotia Capital Sector Outperform $5567 13 Sector Outperform $5050 19 31
Wells Fargo Securities Market Perform $5300 7 Market Perform $4000 -6 4
AVERAGE $5626 14 $4853 14 26
While analysts are still not sufficiently critical of Dollarama the more recent downward move in the stock and subsequent analyst
downgrades may suggest that the market could be primed to evaluate the Company and its growth story with a more discerning eye
We believe that the issues which we highlight in this report will provoke further professional skepticism among analysts and investors
48
Dollarama Not Priced To Perfection ndashPriced Beyond Perfection
We can get close to DOLrsquos current valuation only if we value it as a mature ex-growth business today under
managementrsquos lofty goals for the business for ten years into the future applying no discounts for time
business risk etc
Managementrsquos ten-year store target
bull Current store count 1178 (70 of long-
term target)
Even if Dollarama were a mature business today under managementrsquos long-term targets for the business
DOL stock would not have no upside to current share prices
The market is pricing DOL beyond perfection ndash a valuation this lofty cannot be justified today
Mature Business ValuationC$ MM unless noted
Stores 1700
Revenue per Store $32
Total Revenue $5440
Operating Margin 220
Operating Profit $1197
Interest Expense $50
Tax (275) $315
Net Income $831
Diluted Shares Outstanding 332
EPS $251
PE Multiple 152x
Target Price $3815
Upside -1
Average operating margin since Q1 FY 2016
bull Assumes that DOLrsquos unusually high
margins are sustainable despite
intensifying competition loss of recent FX
benefit and customer pushback against
price hikes
Mature revenue per store estimate
bull Current average revenue per store
~$28M (875 of long-term target)
Industry median NTM PE multiple
bull Assigns no discount to DOL due to
declining store traffic vs peers incoming
competitive threats inefficient distribution
network etc
49
Dollarama Not Priced To Perfection ndashPriced Beyond Perfection (Continued)
Put another way The market is implicitly taking it for
granted that Dollarama will achieve its lofty ten-year
growth targets assuming sustained profitability levels
and per-store efficiency ndash and applying close to the
industry median FY1 EVEBITDA multiple to Dollaramarsquos
FY 2027 EBITDA
Just under ten-
year target
What kind of growth is the market implicitly betting on if
we value Dollarama on par with peers
bull 150 more stores than managementrsquos ten-year target ndash
within nine years
bull 48 CAGR in revenue per store
bull Zero margin compression
FY 2027 Estimates if Management Executes Growth Plans Perfectly
(C$ MM unless noted)
Stores (Year-End) 1688
Revenue per Store $33
Total Revenue $5503
Gross Margin 380
Gross Profit $2093
SGampA per Store 04
SGampA Total 689
EBITDA (FY 2027) $1404
Market Cap 12752
Debt 1880
Cash 182
Enterprise Value $14450
EVEBITDA (FY 2027) 103x
Industry Median EVEBITDA (FY1) 110x
Average gross
margin ex-
hedge gains
since FY 2016
Mature revenue
per store
estimate (15
growth CAGR)
FY 2018 SGampA
per Store
Implied FY 2027
multiple close to
industry median FY1
multiple
FY 2027 Estimates To Justify Prevailing Valuation (C$ MM unless noted)
Stores (Year-End) 1858
Revenue per Store $44
Total Revenue $7929
Gross Margin 380
Gross Profit $3016
SGampA per Store 04
SGampA Total 755
EBITDA (FY 2027) $2261
EVEBITDA (FY 2027) 62x
Enterprise Value 13947
Debt 1880
Cash 182
Equity Valuation $12249
Diluted Shares Outstanding 332
Target Price $3693
Current Price $3845
158 over ten-
year target in
nine years
48 growth
CAGR in
SalesStore
Industry median
FY1 multiple
discounted
75 annually
Average gross
margin ex-
hedge gains
since FY 2016
FY 2018 SGampA
per Store
High forecast gives
us 4 DOWNSIDE
50
Valuation Far Out Of Line With Peers And Historical Multiples
DOL shares trade at a 50-60 premium to peers in the discount retail industry The market is valuing DOL much more like a high-
growth tech company than a brick-and-mortar dollar store (and one with concerning fundamental trends at that) Note that this still
holds true even after DOL shares traded down significantly following its recent Q2 earnings report
It is difficult to justify a valuation this high even if one is bullish on DOL vis-agrave-vis the rest of the industry
Company Ticker
3-Year Consensus Revenue
CAGR
FY 2018 EBITDA Margin
PE(NTM)
PE(FY2)
EVEBITDA(NTM)
EVEBITDA(FY2)
EVSales(NTM)
Dollar Tree DLTR 43 121 139x 134x 91x 88x 10x
Dollar General DG 75 104 163x 162x 112x 112x 12x
Big Lots BIG 06 85 87x 87x 52x 53x 04x
Five Below FIVE 210 162 360x 412x 2113x 243x 32x
Canadian Tire CTC CN 20 90 179x 181x 82x 83x 10x
Metro MRU CN 80 73 142x 139x 99x 101x 08x
MEDIAN 59 97 152x 151x 95x 110x 10x
Dollarama DOL CN 85 255 229x 223x 164x 163x 41x
DOL PREMIUM 505 477 727 509 3057
Does DOL ndash a value retailer
demonstrating concerning
fundamental trends ndash deserve
to be valued on par with
higher-growth industries and
completely out of line with its
industry peers
Profitability is impressive but
likely unsustainable in the face
of growing competition
Enterprise Value Revenues Enterprise Value Adj EBITDA Price Adj EPSDOL shares also trade at
a significant premium to
historical multiples
despite unsustainable
margins an increasingly
saturated market and
rising competitive
threats
51
Does The Market Think Dollarama Is A Dollar Store Or A Premium Retail Brand
Dollarama is valued much more closely to premium retail brands than its discount retail peer group
A bull might ldquojustifyrdquo this by pointing to Dollaramarsquos profitability profile and growth expectations but its EBITDA margins are so
out of line with those of its peers that one is forced to question whether they are sustainable (at best) or honest (at worst)
As discussed Dollaramarsquos consensus sales growth numbers also ignore looming fundamental threats to the business
Company TickerGross
Margin (NTM)
EBITDA Margin (NTM)
Sales Growth (NTM)
EVEBITDA(NTM)
PE(NTM)
EVSales(NTM)
Dollar Tree DLTR 31 11 28 91x 139x 10x
Dollar General DG 31 10 89 112x 163x 12x
Big Lots BIG 41 7 -08 52x 87x 04x
Five Below FIVE 36 15 203 2113x 360x 32x
Canadian Tire CTC CN 34 12 40 82x 179x 10x
Metro MRU CN 19 7 88 99x 142x 08x
MEDIAN 33 11 64 95x 152x 10x
Dollarama DOL CN 40 25 99 164x 229x 41x
DOL PREMIUM 727 505 3057
How does Dollarama support EBITDA
margins more than double those of its
peer group and in line with premium
global retail brands
Company TickerGross
Margin (NTM)
EBITDA Margin (NTM)
Sales Growth (NTM)
EVEBITDA (NTM)
PE (NTM)EVSales
(NTM)
Ferragamo SFER IM 65 17 48 160x 260x 26x
Hermes RMS FP 69 38 84 200x 350x 78x
Prada 1913 HK 74 22 78 100x 210x 23x
Tiffany amp Co TIF 64 24 51 113x 196x 28x
MEDIAN 67 23 65 137x 235x 27x
Dollarama DOL CN 40 25 99 164x 229x 41x
DOL PREMIUM 197 -26 519
Does a discount retailer facing
fundamental headwinds deserve to be
priced 50 or more above its peer
group and closer to global
premium retail brands
52
Margins And Multiples Materially Out-of-Line With Peers
We do not believe that Dollaramarsquos profitability levels ndash which are entirely out of line with peers ndash are justified or sustainable in an
industry as competitive as deep discount retail The Company is already struggling to meet store count growth targets raising the
likelihood that its store growth plan will be dilutive to margins The market assigns a premium valuation to Dollarama on the basis
of relatively high growth expectations and the Companyrsquos industry-leading margins However as discussed throughout this
report we doubt both managementrsquos ability to meet its growth targets and its ability to maintain prevailing profitability levels The
likelihood that the Company will be able to achieve BOTH of these goals simultaneously is even slimmer Accordingly we believe
that the basis for Dollaramarsquos substantial share price premium is unfounded
Dollaramarsquos margin profile is grossly out of
line with peers and we find evidence of
aggressive accounting and questionable
business practices that can partly explain the
issue We doubt that this would be sustainable
even if management wasnrsquot growing the chain
How will a lowno-moat business with falling
per-store traffic be able to maintain its
remarkable profitability advantage while
aggressively expanding its store base
DLTRDG
BIG
FIVE
CTCCN
MRUCNWNCN
DOLCN
0
5
10
15
20
25
30
10 15 20 25 30 35 40 45 50
EBIT
DA
Mar
gin
Gross Margin
Dollarama Margins Completely Out Of Line With Peers
The premium in Dollaramarsquos share
price is driven by the marketrsquos trust in
managementrsquos growth initiatives and
its recognition of the Companyrsquos
dominant profitability
However neither its profitability
advantage nor its growth prospects
are sustainable The likelihood that
management simultaneously
preserves BOTH is extremely low
Big Lots (BIG) Dollar Tree (DLTR) Dollar General (DG) Metro Inc (MRU CN) and Canadian Tire (CTC CN)
x
5x
10x
15x
20x
25x
BIG DLTR MRU CN DG CTC CN DOL CN
PE (NTM)
x
4x
8x
12x
16x
20x
BIG DLTR MRU CN DG CTC CN DOL CN
EVEBITDA
53
Valuing DOL As A Mature Business In The Canadian Market ~40 Downside
C$ MM unlessotherwise noted
Current Run-Rate Valuation
Priced Beyond Perfection
Reasonable Downside
Stores 1170 1700 1500
RevenuesStore 28 32 30
Revenues 3320 5440 4500
Operating Margin 23 22 18
Operating Profit 764 1197 801
Interest Expense 42 50 50
Tax 275 198 315 207
Net Income 523 831 544
Shares 332 332 332
EPS $158 $251 $164
Multiple 24x 16x ~15x
Share Price $3845 $3966 $2460
Upside (Downside) 3 Approx -40
As discussed earlier at 1700 stores DOL would have greater penetration than both Dollar General (DG) and Dollar Tree (DLTR)
which both offer a much broader assortment of goods including perishablesconsumables Meanwhile the US appears to be
overstored versus Canada It is likely unreasonable for DOL to target per capita penetration levels on par with its US peers
Even if we assume that DOL can reach similar penetration levels and match company
growth targets ndash with steady margins no less ndash DOL has little upside
Valuing DOL as a mature business at its upper penetration bound implies ~40 downside
in a more realistic yet still generous scenario in which DOL is valued in line with peers
Higher Canada
store count vis-agrave-
vis comparable US
store count
compared to
Walmart
Higher Canada
store concentration
vis-agrave-vis
comparable US
store concentration
than Walmart
Achieving
managementrsquos
1700 store target
would put DOL at a
higher per capita
penetration level
than US peers
Store Count by Region
Canada US CanUS Ratio
WMT 410 5358 77DOL ndash Present 1178 14750 80DOL ndash Future 1700 14750 115
DOL CN DG DLTR
Stores 1700 14760 14732
Population (M) 36 326 326
StoresCapita (M) 472 453 452
Downside Run-Rate Operating Margin Estimate
ProfitabilityCost Measure JustificationGross Margin Target Recent Historical Average 370
Current SGampA Recent Historical Average 167
Add
Advertising Expense Normalization
Industry Average05
Rent Expense NormalizationAdjusting for Depreciation Rearranged
from Rent Expense 05
Depreciation Catch-Up Matching DampA schedules 15
Pro Forma SGampA 192
Pro Forma Operating Margin 178
Store Count per Mil People by Region
Canada US CanUS Ratio
WMT 114 164 69DOL ndash Present 327 452 72DOL ndash Future 472 452 104

8
Consensus Estimates (CY) 2018A LTM 2019E 2020E
Stock Price $3845 EV Sales 44x 43x 40x 38x
Shares Outstanding 332 EV EBITDA 174x 167x 161x 149x
Market Capitalization 12752 Adj EV EBITDAR 153x 148x - -
Total Debt Outstanding 1880 Price EPS 254x 241x 224x 199x
Less Cash and Equivalents 182
Enterprise Value 14450 Growth and Margins 2018A LTM 2019E 2020E
Operating Leases 1130 Sales Growth 102 84 102 65
Finance Leases 4 EBITDA Margin 255 256 249 254
Adj Enterprise Value 15584 EPS Growth 228 160 130 127
Credit Metrics 2018A LTM 2019E 2020E
Net Debt EBITDA 20x 20x 19x 17x
Adj Net Debt EBITDAR 28x 27x - -
Capital Structure And Valuation
In C$ MM except per share figures or where indicated
At present Dollarama demonstrates impressive margins and is not egregiously over-levered on a Net Debt-to-EBITDA
basis However as competition increases customers push back against recent price hikes and operating costs creep
upwards we believe that management will have a difficult time maintaining current profitability levels ndash particularly
while pursuing an aggressive growth strategy Leverage will be less sustainable should the businessrsquo performance
decline or the economic environment turn threatening managementrsquos ability to support continued buybacks
dividends while growing store count
Source Dollarama and Bloomberg Estimates
Note Calendar Year Ended Jan 30th
Note Operating Leases valued at 6x Operating Lease Expense
Though analysts
project declining sales
growth they foresee
margin expansion at
the same time This
pair of estimates
makes little sense to
us and should make
investors skeptical of
consensus estimates
Our research will
explain why we
believe margins will be
pressured going
forward
9
Short-Term Debt In A Rising Rate Environment Introduces Refinancing Risk
Significant Short-Term Debt Maturities That Will Have To Be Refinanced At
Higher Rates
Dollarama Has Unhedged Exposure To Interest
Rateshellip
hellipWhile The Three-Month CDOR Rate Rises Rapidly
Source Dollarama
Source Bloomberg
Dollarama refinanced significant short-term debt just last evening levering up the business in the process
Management refinanced its C$400M of 3095 fixed-rate notes due this November with C$500M of 355 fixed-rate
notes due November 2023 Managementrsquos use of short-term debt has burdened the business with refinancing risk in
an environment in which the CDOR rate has risen sharply and is expected to rise for the foreseeable future which has
now forced the Company to bear materially higher interest expenses (compare to its 2203 fixed-rate credit due in
2022) The Company still has C$14B of debt due to mature within the next 12 quarters (including its credit facility)
leaving it exposed to further rate increases The Companyrsquos weighted average debt maturity is about 35 years
320
680
DOLCN Credit Breakdown (C$1875M Total)
Floating Fixed$0
$100
$200
$300
$400
$500
$600DOLCN Debt Maturity Schedule (by CY Quarter)
Available in Revolving Credit Facility Maturing Sep 2023 Available in Revolving Credit Facility Maturing Sep 2020
Series 2 Variable Rate CDOR+59bp Series 3 Variable Rate CDOR+27bp
Fixed Rate 2203 Fixed Rate 2337
Fixed Rate 355
10
Will Dollarama Be The Next Bain Capital-Led Failed Retail IPO
ldquoTwenty-two percent of Bain LBOs from 1984 to 1992 went bankruptrdquo according to Eileen Applebaum in her book
ldquoPrivate Equity at Workrdquo1 Recent Bain-led retail busts include Toys ldquoRrdquo Us Guitar Center and Gymboree
Company DateEnterprise
ValueBain Capital Quotes Outcome
Toys ldquoRrdquo Us March 17 2005 $6600
Toys R Us and Babies R Us are premiere franchises with strong global brand recognition and a collection of high quality product offerings
including toys childrens apparel and baby products and accessories We are excited by the prospect of partnering with the management team and
employees to strengthen the long-term operating and financial performance of the businessesldquo -Matt Levin a MD at Bain
Toys ldquoRrdquo Us Files For BankruptcySept 2018
MichaelsStores
July 1 2006 $6000
We are delighted to partner with the Michaels management team to help build on its already strong position in an attractive industry and
capitalize on the significant growth opportunities that lie ahead Our deep experience in the retail sector reinforces our conviction that Michaels has
the best store locations a broad and attractive assortment of products for crafters of all ages and a sustainable competitive advantage thanks to smart investments in systems and infrastructure We look forward to helping Michaels achieve its full long-term potentialldquo ndash Matt Levin MD
IPO prices at low end of range (June 2014)
Share Price Hits Multi-Year Low in Oct 2018
As SSS Decline
Guitar Center June 27 2007 $2100
ldquoAs the leading retailer of musical instruments in the US Guitar Center enjoys great brand recognition among musicians nationwide a loyal
customer base and a track record of significant growth We look forward to working with the Companyrsquos experienced and capable management
team to continue to build the businessrdquo Jordan Hitch a MD at Bain
The End of Guitar Center
AndGuitar Center Troubles
Only Getting Worse
Gymboree Oct 22 2010 $1800
Gymboree is a terrific company with incredible brand strength and a large population of extremely satisfied customers We look forward to
working with Matthew McCauley and the companys proven and experienced management teamldquo Jordan Hitch MD at Bain Capital
Gymboree Hires Restructuring Counsel
1) Source ldquoBain Capital Sees High Profile Buyouts Go Bustrdquo NY Post March 2018
A Low-End Retailer With Unsustainably High Margins
12
Undifferentiated Goods amp Knock-Off Products
Dollarama sells undifferentiated low-priced consumer goods competing almost entirely on price Many of its products are
knock-offs It is no surprise that the Company has been sued by several companies for trademark infringement
How Dollarama became the retail king of knockoffsSelling cheap imitations of more expensive brands has turned Dollarama into one of Canadarsquos most
successful retailers earning it big bucks and plenty of lawsuits (Source)
ldquoI think they have good lawyers working
for themrdquo says David Lipkus a lawyer
specializing in anti-counterfeit in Toronto
who has helped clients sue businesses in
Canada selling knock-offs ldquoOften
retailers make mistakes and end up
selling fakesrdquo Many lawsuits are settled
privately but the store has been sued
by Nike for selling counterfeit
footwear emblazoned with Nikersquos
iconic basketball player silhouette and
by Umbra a home decoration company
for selling a style of waste basket In
February 2017 Dixon Ticonderoga
launched a suit against the dollar
store chain for a pencil itrsquos been
selling since 2002
Dollarama sells a wide range of discounted knock-offs across product categories
Its business invites litigation
Brazen mimicry multiple knock-offs
of a single producer (Mars)
Source
13
Per-Store Traffic Growth Stagnant But Opportunities For Price Increases May Be Exhausted
Growth in per-store sales has been driven by transaction size growth against declining per-store traffic Transaction
size growth has itself been driven by sales of higher-priced items Dollaramarsquos maximum price point has risen from
$1 prior to FY 2008 to $2 in FY 2008-09 to $3 in FY 2012 to $4 in FY 2017
Contracting store traffic puts per-store sales growth at risk absent further price increases but we question whether
price-driven SSS growth is sustainable as higher prices erode Dollaramarsquos value proposition and put it in closer
competition with more comprehensive big-box retailers Management has expressed reluctance to raise prices further
in the near term regardless (though they said the same when the max price was bumped to $3 several years ago) With
recent price increases now lapping for the first time SSS growth may be at risk
Growth has been propped up by price increases which have made its products more expensive than those at dollar store peers
Between a rock and a hard place Does management continue to erode Dollaramarsquos value proposition with price increases or
keep prices steady and hope for traffic contraction to reverse
Average Quarterly YOY
Growth in Per Store Traffic
-18 since Q1 2014
Transaction
size growth
decelerating
14
Increasing Average Unit Revenues Is A Very Risky Strategy That Has Failed Before
Raising price points to prop up SSS growth against falling store traffic is a major risk for discount retailers as their
entire value proposition comes from their low prices Higher prices may turn off customers and create difficult
comps in the event that price increases must be paused or reversed due to customer pushback
In 2006 for example Big Lots ndash a US discount retailer ndash introduced higher-ticket brand-name items in place of
comparable budget goods in an effort to get customers to spend more per visit This strategy reinvigorated same-
store sales growth for a time but ultimately failed Subsequent difficult comps resulted in negative SSS growth after
management abandoned its so-called ldquoRaise the Ringrdquo strategy
Raise the Ring is
abandoned lower price
points are emphasized
Raise the Ring is
introduced higher priced
items are emphasized
Big Lots alienated shoppers who were
seeking cut-price name-brand goods after
venturing into other areas
like selling frozen food
ldquoOur customer doesnrsquot come to us expecting a
Nordstromrsquos level of in-store shopping
experience They want value treasures
merchandise on the floor and clean restrooms
and we need to meet those expectationsrdquo
[CEO Steve] Fishman said in 2005
hellip
ldquoWersquore an enigmardquo he said at an investor
conference this month ldquoItrsquos been a real
challenge for the marketplacerdquo Source
Calls with industry experts indicate that Dollarama is losing more price-conscious customers to Dollar Tree and other discount retailers
following its efforts to raise prices and that this is a major driver behind recent per-store traffic declines
If price-conscious customers arenrsquot interested in shopping at Dollarama we wonder who ishellip
15
ldquoNothingForADollaramardquo Customers Becoming Conscious Of Price Increases Versus Competitors
Dollaramarsquos price increases may not yet put its prices on par with those of big box retailers like Walmart but
customers have taken notice that Dollarama has increased prices against other Canadian dollar stores Comments
from various internet forums and news sites reveal that customers no longer believe that Dollarama offers as much
value as do other discount retailers suggesting that the strength of Dollaramarsquos value proposition ndash the source of
its appeal and foundation of its business model ndash is at risk The below comments are anecdotal but comments of
this sort regarding Dollarama in particular are nonetheless common among relevant websites
ldquoThe dollar store is no longer a bargain if you
shop around you can by the same things
cheaper or same price elsewhere quit
calling it dollarama no more dollar thingsrdquo
Source
ldquodollar tree here is drastically cheaper then
dollarammardquo ndash Cody Williams
ldquoCody Williams Same here Dollarama is not
really a dollar store anymorerdquo ndash JJ Walker
Source
ldquoI enjoyed the days when everything in Rama
actually was a dollar I go to Dollar Tree
more often now just because everything
there is $125 - ($1 in the US of course)rdquo
Source
ldquoTheir high prices is the problem they still
have better selection than Dollar Tree but
their prices are always higher I know some
dollar store shoppers who go to Dollar
Tree first for the better prices and then go
to Dollarama for the stuff they couldnt
find at Dollar Tree Myself personally have
watched the prices creep up A pair of work
gloves climbed from $250 to 4 or 5 bucks
the discount over Home Depot is only a
buck or two now Also Dollar Tree still
keeps all items under 2 bucks I believerdquo
Source
ldquoThey gonna have to change the Dollarama
name soonrdquo
ldquodollarandaquarterramardquo
ldquoNew Name NothingForaDollarrdquo
ldquoYou forgot lsquoramarsquo NothingForADollaramardquo
ldquoAs for a new name how about
FiveFinaramardquo
ldquofive or lessarmardquo
Source
ldquoDollarRama is no longer in the same
category since they sell at higher prices
more of a discounted store and not a dollar
storerdquo
Source
Just did a quick check of my cleaning cupboard
DT=Dollar Tree DM=Dollarama
- 284L bleach $125 at DT Sometimes they even
have the big 37L bottles Never seen bleach that
cheap at DM
- 976ml Fabric Refresher $125 at DT DM sells it for
$150 and its a smaller bottle
- Oxy First Force spray cleaner $125 at DT $150 at
DM
DT also has a selection of other spray cleaners at
$125 while even other no name ones at DM can go
up to $2
- No name dish soap 1479ml (almost 15L) for $125
at DT 500ml for a $1 (or I guess $125 soon) at DM
- No name Mr Clean sponges At DT its two full
sponges for $125 At DM each sponge is half Mr
Clean cleaner sponge and half normal cheap sponge
- Those square no name tupperware containers that
are 3 for $125 at DM are 4 for $125 at DT
At the dollar-ish level everything Ive found at DT
has been a better value and equal or better
quality
Source
16
Transitioning Away From ldquoDollar Storerdquo Identity Threatens Customer Loyalty
Perhaps in recognition of the fact that Dollarama is losing its status as a true dollar store and that it now belongs to a
different category management has stricken almost all references to ldquodollar storesrdquo from Company filings This poses
a major threat to Dollaramarsquos customer appeal as evidenced by traffic trends and anecdotal customer reactions
FY 2017 Annual Information Form FY 2018 Annual Information Form
17
Margins Are Inexplicably High And Perhaps Unsustainable
We acknowledge that Dollarama is a strong operator with a strong value proposition (though perhaps a declining one) However
we question whether a discount retailer reselling Chinese knock-offs should garner among the highest operating margins of all
global retailers and whether a discount retailer with declining per-store traffic can continue to rely on price hikes for SSS growth
Dollarama stands out among global consumer companies and retailers ndash
45th out of 584 global retailers by operating margin (and 12th out of 584
global retailers by revenue multiple)
Dollarama consistently produces operating margins materially higher than
industry peers and higher than historical industry norms This gap has
only grown more substantial through the last five years
0
5
10
15
20
25
FY 2008 FY 2009 FY 2010 FY 2011 FY 2012 FY 2013 FY 2014 FY 2015 FY 2016 FY 2017 FY 2018
Peer Median Operating Margins vs Dollarama
Peer Median DOL CN
-10
-5
0
5
10
15
20
25
FY 1
989
FY 1
990
FY 1
991
FY 1
992
FY 1
993
FY 1
994
FY 1
995
FY 1
996
FY 1
997
FY 1
998
FY 1
999
FY 2
000
FY 2
001
FY 2
002
FY 2
003
FY 2
004
FY 2
005
FY 2
006
FY 2
007
FY 2
008
FY 2
009
FY 2
010
FY 2
011
FY 2
012
FY 2
013
FY 2
014
FY 2
015
FY 2
016
FY 2
017
FY 2
018
Dollarama Operating Margins vs Peers
DG FDO DLTR FRED BIG DOL CN
Source Bloomberg EQS function Source Dollarama and company filings
18
Debit Card Boost Is Played Out
Dollarama management has characterized the benefit from debit cards as being roughly a doubling in average purchase size
If true this benefit would be visible in year-over-year sales comps
The Company has not always disclosed penetration ndash and they ceased doing so after Q4 2016 ndash but the data suggest that the
average annual comp benefit was approximately 25 from FY 2013-16
Source Dollarama
00
05
10
15
20
25
30
35
40
45
0
10
20
30
40
50
60
Debit Card Penetration and Imputed Comp Benefit
Debit Card Penetration (LHS) Comp Benefit (RHS)
19
Have All The Levers Been Pulled
Dollarama has done a good job of increasing per-store revenue while investing in initiatives designed to remove operating
expenses We cannot fault management for pulling levers to expand margins but we believe the low-hanging
(and high-hanging) fruit has already been harvested
Management has also taken creative measures to raise effective average prices without raising prices directly ndash eg by
strategically replacing some lower-priced goods with close substitutes at higher price points and by reducing the size of
product bundles (pencils candies etc) without cutting prices Such back-door avenues to margin expansion may be exhausted
by this point as noted previously customers are beginning to notice that Dollarama no longer offers a value proposition
comparable to competing dollar stores
FY 13 FY 14 FY 15 FY 16 FY 17 FY 18
Revenue LeversAdd $250-$300
Price PointsDiscounting With Hedged Margins
Add $350-400 Price Points
Accept Credit and Debit Cards
Cost LeversDollar City
RelationshipNew POS Terminals
Kronos Labor Scheduling
Wi-Fi amp ScannersNew Warehouse
ConstructionWarehouse Expansion
Accounting and Financial Levers
Depreciation Schedule Change
Direct Profit from Currency Hedges
Leveraged Share Repurchase
ldquoThanks and good morning In the write up in the
discussion of the foreign exchange headwinds
and gross margin you also said you made select
changes to your product mix I am just wondering if
you could elaborate are there certain categories
thatrsquos your emphasizing in certain categories you are
deemphasizing I am just wondering what that
sentence really meantrdquo
- Peter Sklar BMO Capital Markets
ldquoIts really an item by item discussion Where the
compelling value remains and we are able to take for
example two pencils out of a pack and still be
competitive to help with offsetting some of the
headwinds thatrsquos the way we handle it or in other
cases if we replace the product with a new offering
thatrsquos just as compelling but different at a lower
cost potentially Thatrsquos another way Buyers can use
that tool to help them with the current challengesrdquo
- Michael Ross CFO Dollarama
Is this a sustainable practice as value-oriented customers lose faith in Dollarama
FY 2016 Q4 Earnings Call QampA
20
Costs Rising On Multiple Fronts
While management may have largely exhausted avenues for price increases and efficiency gains other industry and Company
developments threaten to drive up costs through the near term
Cost Driver Explanation
TariffsA significant share of goods (~20 according to industry experts) are sourced either directly or indirectly from the US Tariffs could increase costs on these goods materially
Minimum Wage Hikes
Provincial minimum wages in Canada generally rise much more frequently than do US minimum wages and many are scheduled to rise on an annual basis based on CPI growth Minimum wage hikes have been particularly significant of late (see below) Even provinces whose minimum wages are not tied to CPI growth have seen or are set to see material minimum wage hikes in the near future Notable recent and near-term changes are as follows
bull Alberta From $1360 to $1500 on October 1 2018 (103 increase)bull British Columbia From $1265 to $1385 on June 1 2019 to $1460 on June 1 2020 and to $1520 on June 1 2021 (63 CAGR)bull Ontario From $1160 to $1400 on January 1 2018 (207 increase) and to $1500 on January 1 2019 (additional 71 year-over-year increase)
Will rise according to Ontario CPI growth every October 1 each subsequent year New Ontario Premier Doug Ford is looking to reverse these plansbull Quebec Just increased to $1200 (+66 in May 2018) Significant political push to set provincial minimum wage at 50 of average provincial
minimum wage by 2020bull Manitoba New Brunswick Newfoundland Nova Scotia Ontario Saskatchewan and Yukon Annual minimum wage hikes according to national or
local CPI growth
Employee remuneration for FY 2018 was just over 10 of Dollarama revenue This cost item could realistically grow at a high single-digit rate over the next 2-3 years even if headcount is reduced
Transportation and Logistics
Industry experts have expressed concerns regarding near-term transportation cost increases These would hit Dollarama particularly hard as Dollarama is unique among industry peers It has only one distribution center Rather than invest in a second Dollarama recently purchased its existing distribution center in Montreal ndash which it previously leased from the Rossy family ndash for $394M (in addition to $232M spent on adjacent land) Other large Canadian value retailers generally have two distribution centers ndash one in the eastern half of the country and one in the western half
Rising fuel costs could result in materially higher transportation expenses as Dollarama distributes 92 of its merchandise through its single distribution center Industry experts suggest that shipping goods to Vancouver from Montreal via truck can be almost twice as expensive as shipping to Vancouver from China
We find it interesting that Dollarama chose to purchase property from managementrsquos family rather than follow industry norms and open a second distribution center in western Canada and that five of its six warehouses ndash all located in greater Montreal ndash are also leased from the Rossy family (the sixth warehouse is company-owned built on land purchased from the Rossy family)
MarketingDollarama has historically operated with no marketing expense However US peers spend 1-2 of revenue on average on marketing (see subsequent slides) As competition increases across the Canadian discount retail industry management may be forced to expand marketing efforts
21
Minimum Wage Growth Historically High And Accelerating Rapidly
Canada has seen fairly consistent minimum wage hikes since 2000 and minimum wage growth has outpaced inflation in all but
three years since the beginning of the millennium Dollarama has been able to manage minimum wage hikes and maintain
impressive margins since going public in 2009 Note however that minimum wage growth from 2009-17 was comparatively mild
relative to the prior half-decade Accelerating minimum wage growth through the near term will test managementrsquos ability to
insulate margins from rising labor costs
0
2
4
6
8
10
12
14
2001 2002 2003 2004 2005 2006 2007 2008 2009 2010 2011 2012 2013 2014 2015 2016 2017 2018YTD
Minimum Wage Growth Consistently Ahead of Inflation and Accelerating Rapidly
Weighted Average Minimum Wage Growth Canadian CPI Growth
Minimum wage growth across all Canadian provinces weighted by
province population
Management states that the vast majority of employees make more than minimum wage Nonetheless minimum wage hikes of 10-20 in
Canadarsquos most populous provinces could put material upward pressure on labor costs ndash particularly if these hikes spread to Quebec where
Dollaramarsquos distribution center and all of its warehouses are located Management includes a risk factor to this effect in its MDampA
210
215
220
225
230
235
240
245
250
255
260
FY 2018 EBITDA Margin FY 2018 EBITDA Margin with5 Labor Cost Hike
FY 2018 EBITDA Margin with10 Labor Cost Hike
EBITDA Margin Sensitivity to Labor Cost Hikes
12 weighted average minimum wage growth across Canada driven by
207 hikes in Ontario Average minimum wages could very realistically
continue to grow at high single-digit rates through the next ~2 years if
planned hikes are enacted
With labor costs representing about 10 of Dollarama revenue
profitability is materially sensitive to changes in this item
If labor costs were 10 higher in FY 2018 EBITDA margins would have
been slashed by 80 bps
Labor cost expansion of this magnitude would be significant but is not
necessarily out of the question within 2-3 years
Source Government of Canada
22
Lack Of Transparency Regarding Dollar City Is A Serious Concern
CEO Larry Rossy
and
CFO Michael Ross
mischaracterized
the sale by
attributing it to
vehicles which
has its own
categoryhellip
Why are Dollarama shopping carts being repurposed for Dollar City use
Perhaps they were sold above-market to Dollar City in FY 2013 when the relationship began Could this be the
reason for an unexplained $149M disposal of leasehold improvements that year
Source
1) Dollar City website and press
release announcing the relationship
Q ndash Keith Howlett ldquoOn Note 5 [of the FY
2013 Annual Report] I was trying to figure
out the leasehold improvements there
seemed to be some items called lsquodisposals
at costrsquo and therersquos sort of an offset thererdquo
A ndash Larry Rossy CEO ldquoI donrsquot know what
they are Yoursquore going to have to help me
out guys hererdquo
A ndash Michael Ross CFO ldquoDisposal of costs
that would be fixtures or related tohelliprdquo
A ndash Rossy ldquoI would say carsrdquo
A ndash Ross ldquoCars Yeah okay We sold a
few carsrdquo
Q ndash Howlett ldquoOh I see okay Well it
shows up as CAD 15M for a year thatrsquos a
lot of carsrdquo
A ndash Rossy ldquoOh itrsquos a very expensive
carrdquo
Source FY 2013 Q4 Earnings Call Source Dollarama
2013 Annual Report
In 2013 Dollarama entered into an agreement to export and sell products to Dollar City a Latin American dollar store with a
presence in El Salvador Guatemala and Colombia In exchange for selling goods to Dollar City ldquoat costrdquo plus a small markup
and providing business and operational expertise Dollarama was given an option to acquire the chain exercisable in February
2019 (since extended to February 2020)
Details about Dollar City are scarce Who is the management Where is company headquarters Who are the shareholders
Dollar Cityrsquos website provides limited information and not a single Dollar City manager was quoted at the initiation of the
relationship1 Though management claims to sell to Dollar City ldquoat costrdquo with a markup we have no way of determining how they
are calculating ldquocostrdquo It is more likely that Dollarama loads shared costs into the Dollar City bill that flatter Dollaramarsquos margins
and sells merchandise that isnrsquot selling well in Dollarama stores to Dollar City
More Competition Coming To An Already-Crowded Space
24
Evidence Of Dollarama Store Growth Slowing
The pace with which Dollarama opened stores through the past several years does not appear to be sustainable
Importantly the inevitable reversal in its pacing appears to be occurring this year
The Company opened just eight stores in Q2rsquo19 its lowest store opening count in any quarter of any recent year
Its YTD FY 2019 pace of 18 new stores is also trailing the average pace of recent fiscal years (28 openings) by
~35 Management did not provide a fully satisfactory explanation for this deficit
The slowdown in its pace of store openings could suggest that the Company is having a difficult time identifying
economically-viable locations as it seeks to grow its store count by close to 50 ndash still a very distant target
Fiscal YearStated New
Store Opening Goal
Q1 Q2 First Half Q3 Q4 Total
2019 60-70 10 8 18
2018 60-70 13 17 30 10 25 65
2017 60-70 8 13 21 18 26 65
2016 None 17 17 34 16 25 75
Source Dollarama financial filings
ldquoI want to ask about the pace of store
openings As you noted the slower start to
the year you did maintain the guidance for
this year But wondering about sort of further
beyond that obviously the store potential that
you put out there gives you room to remain at
that pace for a while But does the slower
same store sales assumption change your
thinking about how aggressively you want
to push new stores out thererdquo
- Mark Petrie CIBC
ldquoNo it does not It does not And that I would
also add that if the pace at which weve been
opening stores this year is slower than last year
as mentioned often that just relates to the
specific timing of real estate And if stores are
pushed closer to the end of the year it could be
that there is an overlap between a few more
stores at the end of this year or a few more
stores in the beginning of next year and the
end it will keep our pace of 60 to 70rdquo
- Michael Ross CFO Dollarama
ldquoReal estate timing issuesrdquo
do a poor job of explaining a
drop in H1 new store
openings of over a third
Source Dollarama Q2 FY 2019 Earnings Call
25
Dollarama Potentially Pushing The Limits Of The Canadian Market
Managementrsquos stated goal is to have 1700 stores across Canada by 2027 up from 1178 stores today We do not
believe that it can achieve this without risking significant cannibalization DOLrsquos target would imply a saturation level
higher than the largest US dollar stores (Dollar Tree and Dollar General) which also sell many more consumables and
grocery items Additionally Canada broadly has much lower levels of retail space per capita than the US suggesting
that Canadian concentration is even more pronounced all else equal
US Retail Square Footage Greater Than Canadian
Retail Square Footage
DOLrsquos Target Implies
Greater Than US
Saturation Despite
Narrower Concept
Source Wellington Management
Walmart is not opening stores in Canada suggesting that it believes
the Canadian market is saturated at 114 stores per million people ndash
about 69 of its US concentration (164 stores per million people)
Meanwhile Dollarama continues to expand within Canada despite
even higher Canadian concentration (327 per mil) relative to the US
concentration of large US dollar stores (452 per mil for a 72
ratio) This ratio would be over 100 at DOLrsquos 1700 store target
Higher Canada store
count vis-agrave-vis
comparable US
store count
compared to Walmart
Higher Canada store
concentration vis-agrave-
vis comparable US
store concentration
than Walmart
Retailers with similar store concentrations per capita across both the US and
Canada are effectively more concentrated in Canada vis-agrave-vis the total retail space
in either country
Store Count by Region
Canada US CanUS Ratio
WMT 410 5358 77
DOL ndash Present 1178 14750 80
DOL ndash Future 1700 14750 115
Store Count per Million People by Region
Canada US CanUS Ratio
WMT 114 164 69
DOL ndash Present 327 452 72
DOL ndash Future 472 452 104
DOL CN DG DLTR
Stores 1700 14760 14732
Population (M) 36 326 326
StoresCapita (M) 472 453 452
26
Dollarama Has Benefited From A Benign Competitive Environment
Large competitors have been shuttering Canadian stores continuously through the last four years due to company-
specific issues highlighted by the high-profile exits of Target and Big Lots from Canada12 We believe that this has been
a significant tailwind for Dollarama but one that is largely behind the Company at this juncture
Dollarama has been able to maintain significant share high margins and high returns on capital in large part due to
missteps among peers and the resulting lax competition This is likely unsustainable in a more competitive environment
as Dollarama has few material competitive advantages barriers to entry are low and its discount retailing strategy is not
unique Competent competition from growing industry players ndash Dollar Tree Canada Miniso and Amazon among others
ndash could be the straw that breaks the camelrsquos back for Dollaramarsquos profitability or growth (or both)
Fiscal YearCompany Exiting
CanadaStores Closed Revenue
DOL Revenue Capture
(Estimated)
Estimated Revenue Benefit
Revenue Boost
2018 Sears 200 $2000 3 $60 2
2017 Sears 100 $1000 3 $30 1
2016 Target 133 $2000 6 $120 4
2015 Big Lots 78 $155 10 $16 1
Last Four Year Average $56 2
Note All numbers are SPCM estimates
1) ldquoTarget Canada to close all stores by April 12rdquo
2) ldquoBig Lots Getting Back Out of Canadardquo
27
Light Competition Has Allowed The Company To Spend Nothing On Promotion ndash Until Now
Dollarama has no promotional expense Meanwhile promotional expenses average 1-2 of revenue among US
peers As established competitors continue to expand and as new competitors enter the market (Amazon included)
Dollaramarsquos no-cost marketing strategy may prove untenable
Promotional Expense
as a of Revenue
Intensifying Competition Threatens Dollaramarsquos
Passive Marketing Strategy
2016 2017 2018
BIG 180 180 170
FIVE 264 270 243
DLTR 021 029 048
DG 062 054 044
Average 132 133 126Source Huffington Post
Source Investorscom
The Canadian operation is also a relatively small part of the business However early results are
encouraging and despite competition in the Canadian market Dollar Tree has found success Longer
term the company is aiming for 1000 stores north of the border which does not seem unrealistic
Source Retail Environments
Calls with people at Dollar Tree suggest that the Company is working to
imitate elements of Dollaramarsquos strategy and store layout in its own
Canadian stores (eg raised shelves etc) and that it plans to expand
into Canada aggressively once its strategy is refined ndash likely in 2019
Source Company financial filings
28
Caught Between The Competition How Will Dollarama Fit In
Dollar Tree has maintained its reputation as a true dollar store nothing is priced higher than C$125 ($1 in the US)
Miniso has developed a reputation as a ldquonicerrdquo discount retailer items can cost up to C$25 but the environment is cleaner and
more modern and products are of better quality (but you can still get a dollar-level deal ndash most products are priced under C$10)
Dollarama has all the character of an old tired dollar store but without the dollar prices
Who will shop there unless management invests in store updates rather than opening new stores
Value-driven customers are by definition not loyal customers
Miniso
Clean and modern but cheap
Dollar Tree
No need for price tags everythingrsquos $1 Dollarama
Looks like Dollar Tree priced like Miniso
Irsquoll pass
29
Dollarama Makes No Effort To Appeal Millennials ndashThe Next (And Current) Shopping Generation
Dollarama has zero social media presence unlike all of its peers Not only is the Company out of touch with customers in
an industry which demands a high level of customer engagement but its brand is becoming demonstrably stale
Facebook Twitter Instagram YouTube LinkedIn Pinterest Google+
Dollar Tree Yes Yes Yes Yes Yes Yes No
Dollar General Yes Yes Yes Yes Yes Yes Yes
Family Dollar Yes Yes Yes Yes Yes Yes No
Big Lots Yes Yes Yes Yes Yes No Yes
Miniso (Canada N America)
Yes Yes Yes Yes Yes No No
Great Canadian Dollar Store
Yes Yes No No No No No
Dollarama No No No No No No No
Until now Dollarama has largely been a regional brand with satisfactory name recognition in its provincial home of Quebec
Now that the Company is making a bigger push into Anglophone Canada management should be more proactive in adapting its
strategy to new markets and to a new customer base Yet management continues to employ a strategy more befitting a sleepy
regional business it does not market or work to improve its brand it does not stay current with trends it keeps management
within the family and it is not expanding its logistics chain to support coast-to-coast growth (see subsequent slides)
Management wants Dollarama to be a national brand but it does not appear prepared to run a national business
Questionable Accounting And Financial Practices
31
Hedging Instruments A Material Source Of Profits In Recent Years
Dollaramarsquos sales are in Canadian dollars whereas a majority of its product purchases are US dollar-linked Management claims to enter
into CADUSD hedging arrangements to lock in near-term margins without having to adjust prices in response to FX movements However
management has nonetheless admittedly adjusted prices alongside unhedged peers in response to shifts in the CADUSD exchange rate
rendering its currency hedges a source of profit
Forex dynamics through the last two years have erased the large hedge benefit realized by Dollarama in FY 2016 but management reports
that gross margins have effectively remained flat through this period implying significant gross margin improvement in the underlying
business (see graphs below) As the currency hedge benefit has reversed through the last two years underlying gross margins have
purportedly risen by EXACTLY ENOUGH to keep total gross margins steady between 39-40 We find this oddly convenient ndash or at the very
least we question whether management will be able to maintain steady margins in the face of unfavorable FX rate dynamics in the future
Quick turnaround in
underlying
profitability Just in
time to keep the
declining forex hedge
benefit from dragging
down marginshellip
Even as FX hedge gains fell
from close to 8 of gross profit
in FY 2016 to a drag on gross
profit in FY 2018 gross margin
expanded by over 100 bps over
the same period implying gross
margin expansion ex-forex of
almost 300 bps within two years
for a retailer with gross margins
which were already unusually
high and whose margins had
contracted for four straight
years before the rapid reversal
32
Questionable Depreciation Assumptions
Dollarama changed its depreciation schedule for leasehold improvements (store fixtures) in FY 2015 moving from a 10-year to a 15-
year expected life1 However management did not concurrently lengthen the amortization schedule for tenant inducements
We find this mismatch curious as both quantities should be amortized depreciated over the expected life of a given lease
Adding to the confusion and appearance of foul play DOL discloses in its AIF that its average lease term is just 5 yrs and it just
started disclosing related-party dealing with Director Huw Thomas of SmartCentres ndash a REIT that lists DOL as a top 10 customer23
Lease term implied
by leasehold
depreciation expense
2-3x greater than that
implied by
amortization of
tenant allowance
Mismatch in implied
lease term
inappropriately
inflates EBIT
C$ MillionsFY
2013FY
2014FY
2015FY
2016FY
2017FY
2018
Amortization of Tenant Allowance $29 $35 $43 $49 $48 $51
Starting Balance Sheet Amount 168 207 232 280 344 386
Amortization as a of Asset Amount 173 169 185 175 140 132
Implied Lease Term 58 59 54 57 72 76
Leasehold Depreciation Expense $129 $166 $108 $141 $172 $202
Starting Balance Sheet Amount 1182 1348 1762 2113 2499 2867
Depreciation as a of Asset Amount 109 123 61 67 69 70
Implied Lease Term 92 81 163 150 145 142
Tenant Allowance Amortization Using Leasehold Depreciation Schedule
183 255 142 189 237 272
Reduction In EBIT If Both Were Put On Same Schedule (11) (10) (29) (30) (24) (24)
While the financial impact of this adjustment is limited signs of accounting impropriety do not reflect well on management and cast
doubt on the rest of Dollaramarsquos reports and accounting practices
1) FY 2015 Annual Report p 15 DOL also extended its store and warehouse equipment useful lives from 8-10yrs to 10-15yrs The total reduction of these three items was decrease of $10m in
FY15 depreciation expense
2) DOL states in its AIF p 11 ldquoThe Corporation typically enters into leases with base terms of ten years and options to renew for one or more periods of five years each The average time to
expiration of the Corporationrsquos leases is approximately five yearsrdquo
3) See governance slide on Huw Thomas
33
Capital Spending And Distribution Of Cash To Shareholders Are Overextending The Business
What happened
Management claimed in 2011 that the business was sufficiently cash-generative to support growth and dividendsshare buybacks
and that it would be able to pay down debt while pursuing both However debt has ballooned since then with net debt rising 8x
(and close to 3x versus EBITDA growth) Management is effectively levering up the balance sheet to support dividends and share
buybacks with CFO Michael Ross stating that he will continue to repurchase shares as long as the earnings yield remains above
the after-tax cost of debt
ldquoFor the past few years our cash flow has enabled
us to continue to pursue our growth plans and
continue to pay down debt Our free cash flow is
now sufficient to fund both those priorities
while enhancing new to shareholders through
a quarterly dividend payment We are able to
generate the free cash flow to do all of this
because we employ a simple growth oriented
business model at Dollaramardquo
ndash June 2011 Conference Call
Should Dollaramarsquos struggles become more pronounced ndash or should the
economic cycle turn for the worse ndash this debt overhang could loom large over
the business
Dollarama also consistently spends more on capex (as a percentage of sales) than its peers in the discount retail industry and
shows abnormally high capex versus depreciation and amortization We understand that Dollarama is a growing business which
could explain both patterns in part but it is not the only discount retailer which is investing in store growth
Dollarama DampA consistently
lt50 of capex and a lower
percentage of capex than
industry peers
Dollarama consistently
spends more on capex
(as a percentage of sales) than industry peers
00
05
10
15
20
25
0
200
400
600
800
1000
1200
1400
1600
1800
FY2012
FY2013
FY2014
FY2015
FY2016
FY2017
FY2018
Ne
t D
eb
tEB
ITD
A
Ne
t D
eb
t ($
C M
M)
Net DebtEBITDA Net Debt
0
50
100
150
200
250
300
FY2010 FY2011 FY2012 FY2013 FY2014 FY2015 FY2016 FY2017 FY2018
DampA as a of Capex and Intangibles Annual
DOL DLTR DG BIG FRED
0
1
2
3
4
5
6
7
8
FY2010 FY2011 FY2012 FY2013 FY2014 FY2015 FY2016 FY2017 FY2018
Capex and Intangibles as a of Sales Annual
DOL DLTR DG BIG FRED
34
Where Is The Capex Going
Management has explicitly identified and discussed various capital expenditures in Company filings over the last
five years but this still leaves a large gap versus what was actually spent
Additionally there is a large gap between the amount spent on software development and the amortization expense
associated with this activity suggesting that earnings may be inflated
Some of this is
directed towards
leasehold
improvements etc
but with
managementrsquos
focus on expansion
over existing store
improvements we
question where
management is
directing this capex
Capital Spending Software
on Software Amortization Difference
FY 2018 191 126 65
FY 2017 126 96 3
FY 2016 111 78 33
FY 2015 108 56 52
FY 2014 98 34 64
Are earnings
inflated due to
insufficient
amortization
Note also that a LinkedIn search for software developers at Dollarama turned up effectively nothing ndash at best one person with a tangentially
relevant title (source) So where is the software development capex going
Unlike discount retailer peers Dollarama
did not include software-related
spending in capex until recently and
records it separately in
ldquoAdditions to intangible assetsrdquo1
Do they do this to artificially deflate their
headline capex figure thereby inflating
reported free cash flow
Undiscussed Capital Spending (FY 2014 ndash 2018)
C$ Millions
$500K in capex spent per new store (375 new stores over past five years Source AIF) $1875
Capex spent on construction of 500K sqft warehouse in Montreal 679
$82M spent annually on expansion renovation or relocation of stores over five years 410
$232M spent on land acquisition 232
Discussed Capex Over Past Five Years $3196
Total Reported Capex (ex intangibles) $5200
Undiscussed Capex $2004
Software Capex and Software Amortization Discrepancy
C$ MillionsCapital Spending on
SoftwareSoftware Amortization Ratio
FY 2018 $191 $126 152
FY 2017 126 96 131
FY 2016 111 78 116
FY 2015 108 56 193
FY 2014 98 34 288
1) DOL explicitly started calling out software as a component of capex in Q3rsquo16 with the addition of footnote to guidance
35
Lack Of Transparency Regarding Store Closures And Associated Costs
It is standard industry practice to report store closures remodels and relocations alongside new store openings
However Dollarama reports only ldquoNet New Storesrdquo and does not break this number out in detail Questioned on this
in Q4 2016 management answered that a larger store base would inevitably result in more closures for reasons
outside of its control (fires mall renovations etc) and that reporting closures would therefore not communicate
meaningful information regarding the underlying performance of the business
We strongly disagree store closure information is vital to evaluating the health of a retail chain Management can
provide color on particular closures if it feels that they have been done for reasons other than performance but
failing to report closures entirely hides a key operating statistic from investors
Company Store Movement 2012 2013 2014 2015 2016 2017 2018
DLTR
Beginning 4101 4351 4671 4992 5367 13851 14334OpenedAcquired 278 345 343 391 8850 584 603
Closed 28 25 22 16 366 101 102Closed as of Beginning 07 06 05 03 68 07 07
BIG
Beginning 1398 1533 1495 1493 1460 1449 1432Opened 181 87 55 24 9 9 24Closed 46 46 58 57 20 26 40
Closed as of Beginning 33 30 39 38 14 18 28
DG
Beginning 9372 9937 10506 11132 11789 12483 13320Opened 625 625 650 700 730 900 1315Closed 60 56 24 43 36 63 101
Closed as of Beginning 06 06 02 04 03 05 08
FDO
Beginning 7023 7442 7916 -- -- -- --Opened 475 500 526 -- -- -- --Closed 56 26 400 -- -- -- --
Closed as of Beginning 08 03 51 -- -- -- --Overall Industry Average 09 07 20 07 23 07 08
Other high-growth dollar
stores like Dollar Tree and
Dollar General report store
closures ndash why doesnrsquot
Dollarama
Store closures for whatever
the reasons incur real
restructuring and other
costs Peer retailers
generally give detail on these
expenses whereas
Dollarama does not
We believe that Dollarama
should follow industry norms
and increase transparency
regarding store closures
US Dollar Store peers historically close 08 of stores annually yet Dollarama has not reported any recent closures
36
SSS Metrics Obfuscate Store Performance
Dollaramarsquos official ldquoComparable Store Salesrdquo figure includes ldquorelocated and expandedrdquo stores as ldquocomparable storesrdquo
therefore picking up growth in traffic which can be attributed to relocation-related improvements We believe that this likely
overstates Comparable Store Sales growth while also ignoring associated relocation-related expenses
1) See Q1 FY 2014 earnings call transcript
Management not only hides store closure data as a supposedly uninformative statistic but proclaims that it has NEVER closed a
store due to poor performance1 We find it difficult to believe that a retailer which has existed in its current format since 1992 has
never needed to close a store for poor performance If it has indeed never closed an underperforming store we wonder whether
management has been too ambitious in growing its store base without critically evaluating the profitability of each location
Huntsville Place Mall Jul 2015
7 John St Oct 2012
7 John St Jul 2015
Huntsville Place Mall Oct 2012
Huntsville ON
Relocation
Are these really entirely
ldquocomparablerdquo locations
781 Rue Principale Est May 2016
781 Rue Principale Est Jun 2009Le Carrefour Ste Agathe
May 2016
Ste-Agathe-Des-Monts QC
Relocation
Why assume the costs to
make this lt1 mile move
Notice
Dollarama
sign turned
inside-out
indicating
closure
37
Cash Flow Beginning To Turn Over Despite Efforts To Bolster Results
In H1 FY 2019 Dollaramarsquos cash flow contracted on a year-over-year basis for the first time since it went public ndash this
despite managementrsquos efforts to bolster earnings and EBITDA The contraction appears to be due in large part to
changes in working capital In particular we are concerned that growth in inventories suggests that management
overestimated near-to-medium term sales growth and that declining traffic is starting to weigh on the Company
Dollarama H1 Operating Cash Flow
C$ Millions FY 2014 FY 2015 FY 2016 FY 2017 FY 2018 FY 2019
Net Income $1054 $1221 $1603 $1895 $2265 $2433
CFO Before Working Capital 1394 1488 2124 2156 2769 2999
Changes in Working Capital (287) (236) (870) (110) (126) (886)
Net CFO 1107 1252 1253 2045 2644 2113
YoY Change $326 $322 $01 $792 $599 (531)
Source Dollarama
Governance Concerns
39
Related-Party Transactions With Rossy Family Raise Questions Over Governance And Costs
Fiscal YearRent amp Land Purchases
Paid to Rossys(C$ MM)
As a of Compensation Paid to Rossy Family
FY 2019 (To Date) $394 NA
FY 2018 184 1660
FY 2017 402 4459
FY 2016 179 1305
FY 2015 169 2752
FY 2014 163 1903
As noted Dollarama leases all but one of its five warehouses from the Rossy family and recently purchased land from the Rossys
for the construction of a sixth Management also recently purchased its Montreal distribution center from the Rossy family which
leased the facility to Dollarama until this February We understand that the Rossy family has close historical ties to the business
but this level of close dealing draws our attention particularly given the fact that management has focused on fortifying its
existing distribution footprint ndash closely tied to the Rossy family ndash rather than invest in distribution facilities in western Canada
where major competitors already have distribution centers
DLTR
Distribution
Center
Delta BC
DLTR
Distribution
Center
Mississauga ON
DOL
Distribution
Center
DOL
Warehouses
No Dollarama distribution facilities
located outside of a ~4 mile radius in
Montreal
bull Due to preferential relationship with
Rossy family
bull Will Dollarama be able to expand into
AngloWestern Canada efficiently
without logistics costs ballooning
bull Overly-exposed to fuel price hikes
and rising transportation costs
Related-Party Transactions Significant And Growing
Source Dollarama Financials
Dollar Tree Canada Distribution Centers
Dollarama Distribution Centers And Warehouses
Source DollarTree
Montreal QC
40
Related-Party Transactions With ldquoIndependentrdquo Director Huw Thomas Only Recently Disclosedhellip
Dollarama also leases stores from SmartCentres REIT whose recently-departed CEO Huw Thomas joined Dollaramarsquos
Board of Directors in 2011 and was a member of its audit committee through March 2017
His ldquoindependencerdquo was recently defended by a meandering 260-word footnote in Dollaramarsquos proxy which belies the
fact that Dollarama is a top 10 customer of SmartCentres
This is all the more suspicious in light of Dollaramarsquos questionable lease accounting highlighted earlier
Source Dollarama 2018 Proxy Circular
Note Dollarama did not start disclosing Huwrsquos related-party dealing until the 2017 proxy
circular in June 2017 right after he left the Audit Committee in March 2017
SmartCentres 2017 Annual Report
Dollarama Material To SmartCentres ndash A Top 10 Customer
SmartCentres Promotes Dollarama Relationship From 2011
Calloway (now SmartCentres) 2012 Annual Report
Dollaramarsquos Lengthy Meandering Defense Of Thomas
Huw As Independent Only Recently Disclosed (2017)
Dollarama Recently Changed Rent Expense Disclosure
Source Dollarama Q4rsquo17 Financials Note 15 Related Party Disclosure
Source Dollarama Q2rsquo18 Financials Note 13 Related Party Disclosure
41
House of Windsor House of RossyA Case Study In Nepotism
Neil Rossy had been the Senior VP of Merchandising Chief Merchandising Officer for 25 years prior to being named CEO in
2016 While his family is still a large shareholder they are not a controlling shareholder owning around 5 of the shares
outstanding We question whether the Rossyrsquos century-long family tradition of passing down leadership ndash one which also
persists at the Rossyrsquos ldquosister storerdquo ndash is appropriate for a public company or wise for the long-term health of the business
Salim Rossy
Opened first ldquoS Rossyrdquo
store in 1910 (up-market
department store concept)
George Rossy
President of S Rossy
1937-1973
Larry Rossy
Grew S Rossy from 20 to 44 stores before
converting all S Rossy stores to new
ldquoDollaramardquo concept in 1992 Sold majority
stake to Bain Capital in 2004 IPO in 2009
Neil Rossy
CEO of Dollarama as of 2016
Michael Rossy
Brother of George (one of ten siblings)
Founder amp CEO of ldquoRossyrdquo stores 1949-2010
Michael DiTullio
Son-in-Law of Michael
President amp CEO of Rossy since 2010
Does (or will) the family have a hard time parting with a business that has been in the family for four generations even if parting ways is
the right thing to do
Managing retail chains is very
much a family affair for the
Rossys ndash at both stores
Perhaps Neil was going to be
anointed CEO of Dollarama
regardless of the caliber of other
potential candidates
Letrsquos hope hersquos not Commodus
BONUS
Brother branches out
with separate storehellip
42
Insiders Incentivized To Grow EBITDA
Our earlier concerns about EBITDA quality are amplified by the fact that Dollarama executives are compensated
based on seemingly arbitrary and inflated EBITDA targets This gives management a strong incentive to be inefficient
users of capital as any dollar shifted from operating expense to capex has a direct benefit to key executives
For example note that managementrsquos perhaps questionable decision to purchase one of its Montreal warehouses
will shift what was until recently rent expense into depreciation This change in the accounting treatment of
Dollaramarsquos tenancy costs will provide a windfall to EBITDA potentially boosting management bonuses
Source Dollarama Proxy Circular p 30
43
What Is A Stretch EBITDA Goal
Bonuses are paid upon achievement of 11 EBITDA growth This level was ldquodesigned to be a stretch objectivehellip
attainable only with significant effortrdquo However this target was reset lower after FY 2014 ndash the only year during which
management did not handily exceed the target We believe this further calls into question the independence of the
board and its compensation committee
Year EBITDA Growth Objective EBITDA Growth Achieved
FY 2018 11 18
FY 2017 11 18
FY 2016 11 30
FY 2015 11 15
FY 2014 13 12
FY 2013 13 22
FY 2012 13 26
FY 2014 Management
misses growth objective
FY 2015 Growth objective
adjusted downwards
ldquoThe thresholds were revised by the
Human Resources and Compensation
Committee in the context of its annual
executive compensation review
conducted at the beginning of each fiscal
year to take into account among other
elements the fact that the base for the
calculation is growing every yearrdquo
Source FY15 Management Proxy Circular
What ldquoother elementsrdquo were
taken into account
Source Dollarama
44
Insiders Selling While Company Buys Back Stock At Elevated Prices
Management has been buying back shares at elevated prices through the last several years even while pursuing growth leaving little capital for
(sorely needed) store updates or other uses The average repurchase price since Q1 FY17 is about on par with current share prices and ~40
below our target Since Q2 FY18 the average buyback price has been 25 above current levels
Furthermore just as the Company has been buying back stock at elevated prices insiders have been offloading shares Notably it is evident
from past and current proxy statements that CFO Michael Ross has never held onto shares for which he has been granted options his
common equity ownership is listed at zero every year Note that as the CFO it is he who is dictating the share buyback decision in large part
PeriodShares
Repurchased
Value of Repurchase
(C$ M)
Average Price (Split-
Adj) (C$)
Q1 FY 2017 1542066 1393 3011
Q2 FY 2017 2027080 1842 3029
Q3 FY 2017 1571500 1578 3347
Q4 FY 2017 2279522 2241 3277
Q1 FY 2018 1687240 1806 3568
Q2 FY 2018 1303900 1602 4095
Q3 FY 2018 687700 931 4513
Q4 FY 2018 2425700 3788 5205
Q1 FY 2019 94500 145 5115
Q2 FY 20191 1347341 700 5195
Total 14966549 16026 3797
Discount to Current Share Price 1
Total (Since Q2 FY 2018)
5859141 7170 4815
Discount to Current Share Price -20
Using Company Funds To Overpay For DOL Shareshellip While Insiders Sell Into The Companyrsquos Bidhellip
Source DOL filings and Bloomberg
Insider Title Date Sold SharesProceeds (C$ M)
Price Sold (Split-Adj)(C$)
Nicolas Hien Senior Vice President 482016 6203 06 3224
Michael Ross CFO 482016 80000 74 3083
Paul Roche Vice President 4182016 10000 09 3000
Geoffrey Robillard Senior Vice President 6172016 33500 31 3085
John Assaly Vice President 9272016 30000 30 3333
Geoffrey Robillard Senior Vice President 472017 20000 23 3833
Paul Roche Vice President 472017 23100 26 3752
Josee Kouri Corporate Secretary 4142017 8000 09 3750
Geoffrey Robillard Senior Vice President 9142017 5000 07 4667
Geoffrey Robillard Senior Vice President 12112017 10000 16 5333
John Assaly Vice President 12132017 14096 22 5202
Geoffrey Robillard Senior Vice President 1262018 15000 24 5333
John Thomas Independent Director 1262018 6000 10 5556
Geoffrey Robillard Senior Vice President 6152018 50000 75 5000
John Assaly Vice President 6192018 13404 21 5222
Nicolas Hein Senior Vice President 6222018 36750 19 5170
Paul Roche Vice President 6222018 24000 13 5417
We do not like the fact that insiders have been selling into share buybacks while
the Company levers itself up with short-term debt to support those repurchases
It appears that the execs are levering up the business in part to enrich themselves1) All share information prior to Q2 lsquo19 reflects pre-split data except
Split-Adjusted Average Prices Q2 lsquo19 repurchases were as stated
45
Rossy Family Selling Shares Despite Control Over C-Suite
Notably Founder and former CEO Larry Rossy has trimmed his position tremendously through the last several years
Though this is to be expected to some extent as he recently ceded control of the business we believe that his
ownership stake should be held to a higher standard given his insistence on keeping the business in the family
If he plans to keep the c-suite under a Rossy dynasty the familyrsquos personal stake in the business should reflect that
Source Bloomberg
Valuation And Price Target
47
The Market Has Not Taken Threats To Dollarama Seriously ndash But Optimism Is Ebbing
Analysts are generally bullish on the stock focusing primarily on managementrsquos growth story and taking current
profitability levels for granted The prospect of new competitive threats to a business which has until now seen limited
competition ndash and the risk that prevailing margins are unsustainable even through the near term ndash go underappreciated
Dollaramarsquos poor Q2 cooled analystsrsquo optimism to some extent but we believe that the reaction was largely reactive and
superficial as they adjusted their price targets in such a way that in aggregate they saw exactly the same upside after the
post-Q2 dip as they did before The market still does not fully appreciate the magnitude of the threats facing Dollarama
All price targets in C$ Before Q2 Release After Q2 Release
Firm Recommendation Target PriceUpside (on 82818) Recommendation Target Price
Upside (on 9172018)
Upside (Present)
RBC Capital Markets Outperform $5500 12 Outperform $5200 22 35
Raymond James Outperform $5567 13 Outperform $5000 17 30
Macquarie Outperform $5633 14 Outperform $4900 15 27
BMO Capital Markets Outperform $6100 24 Market Perform $4700 10 22
CIBC Capital Markets Outperform $5900 20 Neutral $4600 8 20
Desjardins Securities Buy $5800 18 Hold $4500 6 17
Veritas Investment Research Co Buy $5600 14 Buy $4800 13 25
Industrial Alliance Securities Hold $5450 11 Buy $5450 28 42
Canaccord Genuity Buy $5900 20 Buy $5500 29 43
Barclays Equal Weight $5200 5 Equal Weight $4400 3 14
TD Securities Buy $5900 20 Hold $4900 15 27
Accountability Research Corp Buy $5400 10 Buy $5000 17 30
National Bank Financial Outperform $5567 13 Sector Perform $4800 13 25
Scotia Capital Sector Outperform $5567 13 Sector Outperform $5050 19 31
Wells Fargo Securities Market Perform $5300 7 Market Perform $4000 -6 4
AVERAGE $5626 14 $4853 14 26
While analysts are still not sufficiently critical of Dollarama the more recent downward move in the stock and subsequent analyst
downgrades may suggest that the market could be primed to evaluate the Company and its growth story with a more discerning eye
We believe that the issues which we highlight in this report will provoke further professional skepticism among analysts and investors
48
Dollarama Not Priced To Perfection ndashPriced Beyond Perfection
We can get close to DOLrsquos current valuation only if we value it as a mature ex-growth business today under
managementrsquos lofty goals for the business for ten years into the future applying no discounts for time
business risk etc
Managementrsquos ten-year store target
bull Current store count 1178 (70 of long-
term target)
Even if Dollarama were a mature business today under managementrsquos long-term targets for the business
DOL stock would not have no upside to current share prices
The market is pricing DOL beyond perfection ndash a valuation this lofty cannot be justified today
Mature Business ValuationC$ MM unless noted
Stores 1700
Revenue per Store $32
Total Revenue $5440
Operating Margin 220
Operating Profit $1197
Interest Expense $50
Tax (275) $315
Net Income $831
Diluted Shares Outstanding 332
EPS $251
PE Multiple 152x
Target Price $3815
Upside -1
Average operating margin since Q1 FY 2016
bull Assumes that DOLrsquos unusually high
margins are sustainable despite
intensifying competition loss of recent FX
benefit and customer pushback against
price hikes
Mature revenue per store estimate
bull Current average revenue per store
~$28M (875 of long-term target)
Industry median NTM PE multiple
bull Assigns no discount to DOL due to
declining store traffic vs peers incoming
competitive threats inefficient distribution
network etc
49
Dollarama Not Priced To Perfection ndashPriced Beyond Perfection (Continued)
Put another way The market is implicitly taking it for
granted that Dollarama will achieve its lofty ten-year
growth targets assuming sustained profitability levels
and per-store efficiency ndash and applying close to the
industry median FY1 EVEBITDA multiple to Dollaramarsquos
FY 2027 EBITDA
Just under ten-
year target
What kind of growth is the market implicitly betting on if
we value Dollarama on par with peers
bull 150 more stores than managementrsquos ten-year target ndash
within nine years
bull 48 CAGR in revenue per store
bull Zero margin compression
FY 2027 Estimates if Management Executes Growth Plans Perfectly
(C$ MM unless noted)
Stores (Year-End) 1688
Revenue per Store $33
Total Revenue $5503
Gross Margin 380
Gross Profit $2093
SGampA per Store 04
SGampA Total 689
EBITDA (FY 2027) $1404
Market Cap 12752
Debt 1880
Cash 182
Enterprise Value $14450
EVEBITDA (FY 2027) 103x
Industry Median EVEBITDA (FY1) 110x
Average gross
margin ex-
hedge gains
since FY 2016
Mature revenue
per store
estimate (15
growth CAGR)
FY 2018 SGampA
per Store
Implied FY 2027
multiple close to
industry median FY1
multiple
FY 2027 Estimates To Justify Prevailing Valuation (C$ MM unless noted)
Stores (Year-End) 1858
Revenue per Store $44
Total Revenue $7929
Gross Margin 380
Gross Profit $3016
SGampA per Store 04
SGampA Total 755
EBITDA (FY 2027) $2261
EVEBITDA (FY 2027) 62x
Enterprise Value 13947
Debt 1880
Cash 182
Equity Valuation $12249
Diluted Shares Outstanding 332
Target Price $3693
Current Price $3845
158 over ten-
year target in
nine years
48 growth
CAGR in
SalesStore
Industry median
FY1 multiple
discounted
75 annually
Average gross
margin ex-
hedge gains
since FY 2016
FY 2018 SGampA
per Store
High forecast gives
us 4 DOWNSIDE
50
Valuation Far Out Of Line With Peers And Historical Multiples
DOL shares trade at a 50-60 premium to peers in the discount retail industry The market is valuing DOL much more like a high-
growth tech company than a brick-and-mortar dollar store (and one with concerning fundamental trends at that) Note that this still
holds true even after DOL shares traded down significantly following its recent Q2 earnings report
It is difficult to justify a valuation this high even if one is bullish on DOL vis-agrave-vis the rest of the industry
Company Ticker
3-Year Consensus Revenue
CAGR
FY 2018 EBITDA Margin
PE(NTM)
PE(FY2)
EVEBITDA(NTM)
EVEBITDA(FY2)
EVSales(NTM)
Dollar Tree DLTR 43 121 139x 134x 91x 88x 10x
Dollar General DG 75 104 163x 162x 112x 112x 12x
Big Lots BIG 06 85 87x 87x 52x 53x 04x
Five Below FIVE 210 162 360x 412x 2113x 243x 32x
Canadian Tire CTC CN 20 90 179x 181x 82x 83x 10x
Metro MRU CN 80 73 142x 139x 99x 101x 08x
MEDIAN 59 97 152x 151x 95x 110x 10x
Dollarama DOL CN 85 255 229x 223x 164x 163x 41x
DOL PREMIUM 505 477 727 509 3057
Does DOL ndash a value retailer
demonstrating concerning
fundamental trends ndash deserve
to be valued on par with
higher-growth industries and
completely out of line with its
industry peers
Profitability is impressive but
likely unsustainable in the face
of growing competition
Enterprise Value Revenues Enterprise Value Adj EBITDA Price Adj EPSDOL shares also trade at
a significant premium to
historical multiples
despite unsustainable
margins an increasingly
saturated market and
rising competitive
threats
51
Does The Market Think Dollarama Is A Dollar Store Or A Premium Retail Brand
Dollarama is valued much more closely to premium retail brands than its discount retail peer group
A bull might ldquojustifyrdquo this by pointing to Dollaramarsquos profitability profile and growth expectations but its EBITDA margins are so
out of line with those of its peers that one is forced to question whether they are sustainable (at best) or honest (at worst)
As discussed Dollaramarsquos consensus sales growth numbers also ignore looming fundamental threats to the business
Company TickerGross
Margin (NTM)
EBITDA Margin (NTM)
Sales Growth (NTM)
EVEBITDA(NTM)
PE(NTM)
EVSales(NTM)
Dollar Tree DLTR 31 11 28 91x 139x 10x
Dollar General DG 31 10 89 112x 163x 12x
Big Lots BIG 41 7 -08 52x 87x 04x
Five Below FIVE 36 15 203 2113x 360x 32x
Canadian Tire CTC CN 34 12 40 82x 179x 10x
Metro MRU CN 19 7 88 99x 142x 08x
MEDIAN 33 11 64 95x 152x 10x
Dollarama DOL CN 40 25 99 164x 229x 41x
DOL PREMIUM 727 505 3057
How does Dollarama support EBITDA
margins more than double those of its
peer group and in line with premium
global retail brands
Company TickerGross
Margin (NTM)
EBITDA Margin (NTM)
Sales Growth (NTM)
EVEBITDA (NTM)
PE (NTM)EVSales
(NTM)
Ferragamo SFER IM 65 17 48 160x 260x 26x
Hermes RMS FP 69 38 84 200x 350x 78x
Prada 1913 HK 74 22 78 100x 210x 23x
Tiffany amp Co TIF 64 24 51 113x 196x 28x
MEDIAN 67 23 65 137x 235x 27x
Dollarama DOL CN 40 25 99 164x 229x 41x
DOL PREMIUM 197 -26 519
Does a discount retailer facing
fundamental headwinds deserve to be
priced 50 or more above its peer
group and closer to global
premium retail brands
52
Margins And Multiples Materially Out-of-Line With Peers
We do not believe that Dollaramarsquos profitability levels ndash which are entirely out of line with peers ndash are justified or sustainable in an
industry as competitive as deep discount retail The Company is already struggling to meet store count growth targets raising the
likelihood that its store growth plan will be dilutive to margins The market assigns a premium valuation to Dollarama on the basis
of relatively high growth expectations and the Companyrsquos industry-leading margins However as discussed throughout this
report we doubt both managementrsquos ability to meet its growth targets and its ability to maintain prevailing profitability levels The
likelihood that the Company will be able to achieve BOTH of these goals simultaneously is even slimmer Accordingly we believe
that the basis for Dollaramarsquos substantial share price premium is unfounded
Dollaramarsquos margin profile is grossly out of
line with peers and we find evidence of
aggressive accounting and questionable
business practices that can partly explain the
issue We doubt that this would be sustainable
even if management wasnrsquot growing the chain
How will a lowno-moat business with falling
per-store traffic be able to maintain its
remarkable profitability advantage while
aggressively expanding its store base
DLTRDG
BIG
FIVE
CTCCN
MRUCNWNCN
DOLCN
0
5
10
15
20
25
30
10 15 20 25 30 35 40 45 50
EBIT
DA
Mar
gin
Gross Margin
Dollarama Margins Completely Out Of Line With Peers
The premium in Dollaramarsquos share
price is driven by the marketrsquos trust in
managementrsquos growth initiatives and
its recognition of the Companyrsquos
dominant profitability
However neither its profitability
advantage nor its growth prospects
are sustainable The likelihood that
management simultaneously
preserves BOTH is extremely low
Big Lots (BIG) Dollar Tree (DLTR) Dollar General (DG) Metro Inc (MRU CN) and Canadian Tire (CTC CN)
x
5x
10x
15x
20x
25x
BIG DLTR MRU CN DG CTC CN DOL CN
PE (NTM)
x
4x
8x
12x
16x
20x
BIG DLTR MRU CN DG CTC CN DOL CN
EVEBITDA
53
Valuing DOL As A Mature Business In The Canadian Market ~40 Downside
C$ MM unlessotherwise noted
Current Run-Rate Valuation
Priced Beyond Perfection
Reasonable Downside
Stores 1170 1700 1500
RevenuesStore 28 32 30
Revenues 3320 5440 4500
Operating Margin 23 22 18
Operating Profit 764 1197 801
Interest Expense 42 50 50
Tax 275 198 315 207
Net Income 523 831 544
Shares 332 332 332
EPS $158 $251 $164
Multiple 24x 16x ~15x
Share Price $3845 $3966 $2460
Upside (Downside) 3 Approx -40
As discussed earlier at 1700 stores DOL would have greater penetration than both Dollar General (DG) and Dollar Tree (DLTR)
which both offer a much broader assortment of goods including perishablesconsumables Meanwhile the US appears to be
overstored versus Canada It is likely unreasonable for DOL to target per capita penetration levels on par with its US peers
Even if we assume that DOL can reach similar penetration levels and match company
growth targets ndash with steady margins no less ndash DOL has little upside
Valuing DOL as a mature business at its upper penetration bound implies ~40 downside
in a more realistic yet still generous scenario in which DOL is valued in line with peers
Higher Canada
store count vis-agrave-
vis comparable US
store count
compared to
Walmart
Higher Canada
store concentration
vis-agrave-vis
comparable US
store concentration
than Walmart
Achieving
managementrsquos
1700 store target
would put DOL at a
higher per capita
penetration level
than US peers
Store Count by Region
Canada US CanUS Ratio
WMT 410 5358 77DOL ndash Present 1178 14750 80DOL ndash Future 1700 14750 115
DOL CN DG DLTR
Stores 1700 14760 14732
Population (M) 36 326 326
StoresCapita (M) 472 453 452
Downside Run-Rate Operating Margin Estimate
ProfitabilityCost Measure JustificationGross Margin Target Recent Historical Average 370
Current SGampA Recent Historical Average 167
Add
Advertising Expense Normalization
Industry Average05
Rent Expense NormalizationAdjusting for Depreciation Rearranged
from Rent Expense 05
Depreciation Catch-Up Matching DampA schedules 15
Pro Forma SGampA 192
Pro Forma Operating Margin 178
Store Count per Mil People by Region
Canada US CanUS Ratio
WMT 114 164 69DOL ndash Present 327 452 72DOL ndash Future 472 452 104

10
Will Dollarama Be The Next Bain Capital-Led Failed Retail IPO
ldquoTwenty-two percent of Bain LBOs from 1984 to 1992 went bankruptrdquo according to Eileen Applebaum in her book
ldquoPrivate Equity at Workrdquo1 Recent Bain-led retail busts include Toys ldquoRrdquo Us Guitar Center and Gymboree
Company DateEnterprise
ValueBain Capital Quotes Outcome
Toys ldquoRrdquo Us March 17 2005 $6600
Toys R Us and Babies R Us are premiere franchises with strong global brand recognition and a collection of high quality product offerings
including toys childrens apparel and baby products and accessories We are excited by the prospect of partnering with the management team and
employees to strengthen the long-term operating and financial performance of the businessesldquo -Matt Levin a MD at Bain
Toys ldquoRrdquo Us Files For BankruptcySept 2018
MichaelsStores
July 1 2006 $6000
We are delighted to partner with the Michaels management team to help build on its already strong position in an attractive industry and
capitalize on the significant growth opportunities that lie ahead Our deep experience in the retail sector reinforces our conviction that Michaels has
the best store locations a broad and attractive assortment of products for crafters of all ages and a sustainable competitive advantage thanks to smart investments in systems and infrastructure We look forward to helping Michaels achieve its full long-term potentialldquo ndash Matt Levin MD
IPO prices at low end of range (June 2014)
Share Price Hits Multi-Year Low in Oct 2018
As SSS Decline
Guitar Center June 27 2007 $2100
ldquoAs the leading retailer of musical instruments in the US Guitar Center enjoys great brand recognition among musicians nationwide a loyal
customer base and a track record of significant growth We look forward to working with the Companyrsquos experienced and capable management
team to continue to build the businessrdquo Jordan Hitch a MD at Bain
The End of Guitar Center
AndGuitar Center Troubles
Only Getting Worse
Gymboree Oct 22 2010 $1800
Gymboree is a terrific company with incredible brand strength and a large population of extremely satisfied customers We look forward to
working with Matthew McCauley and the companys proven and experienced management teamldquo Jordan Hitch MD at Bain Capital
Gymboree Hires Restructuring Counsel
1) Source ldquoBain Capital Sees High Profile Buyouts Go Bustrdquo NY Post March 2018
A Low-End Retailer With Unsustainably High Margins
12
Undifferentiated Goods amp Knock-Off Products
Dollarama sells undifferentiated low-priced consumer goods competing almost entirely on price Many of its products are
knock-offs It is no surprise that the Company has been sued by several companies for trademark infringement
How Dollarama became the retail king of knockoffsSelling cheap imitations of more expensive brands has turned Dollarama into one of Canadarsquos most
successful retailers earning it big bucks and plenty of lawsuits (Source)
ldquoI think they have good lawyers working
for themrdquo says David Lipkus a lawyer
specializing in anti-counterfeit in Toronto
who has helped clients sue businesses in
Canada selling knock-offs ldquoOften
retailers make mistakes and end up
selling fakesrdquo Many lawsuits are settled
privately but the store has been sued
by Nike for selling counterfeit
footwear emblazoned with Nikersquos
iconic basketball player silhouette and
by Umbra a home decoration company
for selling a style of waste basket In
February 2017 Dixon Ticonderoga
launched a suit against the dollar
store chain for a pencil itrsquos been
selling since 2002
Dollarama sells a wide range of discounted knock-offs across product categories
Its business invites litigation
Brazen mimicry multiple knock-offs
of a single producer (Mars)
Source
13
Per-Store Traffic Growth Stagnant But Opportunities For Price Increases May Be Exhausted
Growth in per-store sales has been driven by transaction size growth against declining per-store traffic Transaction
size growth has itself been driven by sales of higher-priced items Dollaramarsquos maximum price point has risen from
$1 prior to FY 2008 to $2 in FY 2008-09 to $3 in FY 2012 to $4 in FY 2017
Contracting store traffic puts per-store sales growth at risk absent further price increases but we question whether
price-driven SSS growth is sustainable as higher prices erode Dollaramarsquos value proposition and put it in closer
competition with more comprehensive big-box retailers Management has expressed reluctance to raise prices further
in the near term regardless (though they said the same when the max price was bumped to $3 several years ago) With
recent price increases now lapping for the first time SSS growth may be at risk
Growth has been propped up by price increases which have made its products more expensive than those at dollar store peers
Between a rock and a hard place Does management continue to erode Dollaramarsquos value proposition with price increases or
keep prices steady and hope for traffic contraction to reverse
Average Quarterly YOY
Growth in Per Store Traffic
-18 since Q1 2014
Transaction
size growth
decelerating
14
Increasing Average Unit Revenues Is A Very Risky Strategy That Has Failed Before
Raising price points to prop up SSS growth against falling store traffic is a major risk for discount retailers as their
entire value proposition comes from their low prices Higher prices may turn off customers and create difficult
comps in the event that price increases must be paused or reversed due to customer pushback
In 2006 for example Big Lots ndash a US discount retailer ndash introduced higher-ticket brand-name items in place of
comparable budget goods in an effort to get customers to spend more per visit This strategy reinvigorated same-
store sales growth for a time but ultimately failed Subsequent difficult comps resulted in negative SSS growth after
management abandoned its so-called ldquoRaise the Ringrdquo strategy
Raise the Ring is
abandoned lower price
points are emphasized
Raise the Ring is
introduced higher priced
items are emphasized
Big Lots alienated shoppers who were
seeking cut-price name-brand goods after
venturing into other areas
like selling frozen food
ldquoOur customer doesnrsquot come to us expecting a
Nordstromrsquos level of in-store shopping
experience They want value treasures
merchandise on the floor and clean restrooms
and we need to meet those expectationsrdquo
[CEO Steve] Fishman said in 2005
hellip
ldquoWersquore an enigmardquo he said at an investor
conference this month ldquoItrsquos been a real
challenge for the marketplacerdquo Source
Calls with industry experts indicate that Dollarama is losing more price-conscious customers to Dollar Tree and other discount retailers
following its efforts to raise prices and that this is a major driver behind recent per-store traffic declines
If price-conscious customers arenrsquot interested in shopping at Dollarama we wonder who ishellip
15
ldquoNothingForADollaramardquo Customers Becoming Conscious Of Price Increases Versus Competitors
Dollaramarsquos price increases may not yet put its prices on par with those of big box retailers like Walmart but
customers have taken notice that Dollarama has increased prices against other Canadian dollar stores Comments
from various internet forums and news sites reveal that customers no longer believe that Dollarama offers as much
value as do other discount retailers suggesting that the strength of Dollaramarsquos value proposition ndash the source of
its appeal and foundation of its business model ndash is at risk The below comments are anecdotal but comments of
this sort regarding Dollarama in particular are nonetheless common among relevant websites
ldquoThe dollar store is no longer a bargain if you
shop around you can by the same things
cheaper or same price elsewhere quit
calling it dollarama no more dollar thingsrdquo
Source
ldquodollar tree here is drastically cheaper then
dollarammardquo ndash Cody Williams
ldquoCody Williams Same here Dollarama is not
really a dollar store anymorerdquo ndash JJ Walker
Source
ldquoI enjoyed the days when everything in Rama
actually was a dollar I go to Dollar Tree
more often now just because everything
there is $125 - ($1 in the US of course)rdquo
Source
ldquoTheir high prices is the problem they still
have better selection than Dollar Tree but
their prices are always higher I know some
dollar store shoppers who go to Dollar
Tree first for the better prices and then go
to Dollarama for the stuff they couldnt
find at Dollar Tree Myself personally have
watched the prices creep up A pair of work
gloves climbed from $250 to 4 or 5 bucks
the discount over Home Depot is only a
buck or two now Also Dollar Tree still
keeps all items under 2 bucks I believerdquo
Source
ldquoThey gonna have to change the Dollarama
name soonrdquo
ldquodollarandaquarterramardquo
ldquoNew Name NothingForaDollarrdquo
ldquoYou forgot lsquoramarsquo NothingForADollaramardquo
ldquoAs for a new name how about
FiveFinaramardquo
ldquofive or lessarmardquo
Source
ldquoDollarRama is no longer in the same
category since they sell at higher prices
more of a discounted store and not a dollar
storerdquo
Source
Just did a quick check of my cleaning cupboard
DT=Dollar Tree DM=Dollarama
- 284L bleach $125 at DT Sometimes they even
have the big 37L bottles Never seen bleach that
cheap at DM
- 976ml Fabric Refresher $125 at DT DM sells it for
$150 and its a smaller bottle
- Oxy First Force spray cleaner $125 at DT $150 at
DM
DT also has a selection of other spray cleaners at
$125 while even other no name ones at DM can go
up to $2
- No name dish soap 1479ml (almost 15L) for $125
at DT 500ml for a $1 (or I guess $125 soon) at DM
- No name Mr Clean sponges At DT its two full
sponges for $125 At DM each sponge is half Mr
Clean cleaner sponge and half normal cheap sponge
- Those square no name tupperware containers that
are 3 for $125 at DM are 4 for $125 at DT
At the dollar-ish level everything Ive found at DT
has been a better value and equal or better
quality
Source
16
Transitioning Away From ldquoDollar Storerdquo Identity Threatens Customer Loyalty
Perhaps in recognition of the fact that Dollarama is losing its status as a true dollar store and that it now belongs to a
different category management has stricken almost all references to ldquodollar storesrdquo from Company filings This poses
a major threat to Dollaramarsquos customer appeal as evidenced by traffic trends and anecdotal customer reactions
FY 2017 Annual Information Form FY 2018 Annual Information Form
17
Margins Are Inexplicably High And Perhaps Unsustainable
We acknowledge that Dollarama is a strong operator with a strong value proposition (though perhaps a declining one) However
we question whether a discount retailer reselling Chinese knock-offs should garner among the highest operating margins of all
global retailers and whether a discount retailer with declining per-store traffic can continue to rely on price hikes for SSS growth
Dollarama stands out among global consumer companies and retailers ndash
45th out of 584 global retailers by operating margin (and 12th out of 584
global retailers by revenue multiple)
Dollarama consistently produces operating margins materially higher than
industry peers and higher than historical industry norms This gap has
only grown more substantial through the last five years
0
5
10
15
20
25
FY 2008 FY 2009 FY 2010 FY 2011 FY 2012 FY 2013 FY 2014 FY 2015 FY 2016 FY 2017 FY 2018
Peer Median Operating Margins vs Dollarama
Peer Median DOL CN
-10
-5
0
5
10
15
20
25
FY 1
989
FY 1
990
FY 1
991
FY 1
992
FY 1
993
FY 1
994
FY 1
995
FY 1
996
FY 1
997
FY 1
998
FY 1
999
FY 2
000
FY 2
001
FY 2
002
FY 2
003
FY 2
004
FY 2
005
FY 2
006
FY 2
007
FY 2
008
FY 2
009
FY 2
010
FY 2
011
FY 2
012
FY 2
013
FY 2
014
FY 2
015
FY 2
016
FY 2
017
FY 2
018
Dollarama Operating Margins vs Peers
DG FDO DLTR FRED BIG DOL CN
Source Bloomberg EQS function Source Dollarama and company filings
18
Debit Card Boost Is Played Out
Dollarama management has characterized the benefit from debit cards as being roughly a doubling in average purchase size
If true this benefit would be visible in year-over-year sales comps
The Company has not always disclosed penetration ndash and they ceased doing so after Q4 2016 ndash but the data suggest that the
average annual comp benefit was approximately 25 from FY 2013-16
Source Dollarama
00
05
10
15
20
25
30
35
40
45
0
10
20
30
40
50
60
Debit Card Penetration and Imputed Comp Benefit
Debit Card Penetration (LHS) Comp Benefit (RHS)
19
Have All The Levers Been Pulled
Dollarama has done a good job of increasing per-store revenue while investing in initiatives designed to remove operating
expenses We cannot fault management for pulling levers to expand margins but we believe the low-hanging
(and high-hanging) fruit has already been harvested
Management has also taken creative measures to raise effective average prices without raising prices directly ndash eg by
strategically replacing some lower-priced goods with close substitutes at higher price points and by reducing the size of
product bundles (pencils candies etc) without cutting prices Such back-door avenues to margin expansion may be exhausted
by this point as noted previously customers are beginning to notice that Dollarama no longer offers a value proposition
comparable to competing dollar stores
FY 13 FY 14 FY 15 FY 16 FY 17 FY 18
Revenue LeversAdd $250-$300
Price PointsDiscounting With Hedged Margins
Add $350-400 Price Points
Accept Credit and Debit Cards
Cost LeversDollar City
RelationshipNew POS Terminals
Kronos Labor Scheduling
Wi-Fi amp ScannersNew Warehouse
ConstructionWarehouse Expansion
Accounting and Financial Levers
Depreciation Schedule Change
Direct Profit from Currency Hedges
Leveraged Share Repurchase
ldquoThanks and good morning In the write up in the
discussion of the foreign exchange headwinds
and gross margin you also said you made select
changes to your product mix I am just wondering if
you could elaborate are there certain categories
thatrsquos your emphasizing in certain categories you are
deemphasizing I am just wondering what that
sentence really meantrdquo
- Peter Sklar BMO Capital Markets
ldquoIts really an item by item discussion Where the
compelling value remains and we are able to take for
example two pencils out of a pack and still be
competitive to help with offsetting some of the
headwinds thatrsquos the way we handle it or in other
cases if we replace the product with a new offering
thatrsquos just as compelling but different at a lower
cost potentially Thatrsquos another way Buyers can use
that tool to help them with the current challengesrdquo
- Michael Ross CFO Dollarama
Is this a sustainable practice as value-oriented customers lose faith in Dollarama
FY 2016 Q4 Earnings Call QampA
20
Costs Rising On Multiple Fronts
While management may have largely exhausted avenues for price increases and efficiency gains other industry and Company
developments threaten to drive up costs through the near term
Cost Driver Explanation
TariffsA significant share of goods (~20 according to industry experts) are sourced either directly or indirectly from the US Tariffs could increase costs on these goods materially
Minimum Wage Hikes
Provincial minimum wages in Canada generally rise much more frequently than do US minimum wages and many are scheduled to rise on an annual basis based on CPI growth Minimum wage hikes have been particularly significant of late (see below) Even provinces whose minimum wages are not tied to CPI growth have seen or are set to see material minimum wage hikes in the near future Notable recent and near-term changes are as follows
bull Alberta From $1360 to $1500 on October 1 2018 (103 increase)bull British Columbia From $1265 to $1385 on June 1 2019 to $1460 on June 1 2020 and to $1520 on June 1 2021 (63 CAGR)bull Ontario From $1160 to $1400 on January 1 2018 (207 increase) and to $1500 on January 1 2019 (additional 71 year-over-year increase)
Will rise according to Ontario CPI growth every October 1 each subsequent year New Ontario Premier Doug Ford is looking to reverse these plansbull Quebec Just increased to $1200 (+66 in May 2018) Significant political push to set provincial minimum wage at 50 of average provincial
minimum wage by 2020bull Manitoba New Brunswick Newfoundland Nova Scotia Ontario Saskatchewan and Yukon Annual minimum wage hikes according to national or
local CPI growth
Employee remuneration for FY 2018 was just over 10 of Dollarama revenue This cost item could realistically grow at a high single-digit rate over the next 2-3 years even if headcount is reduced
Transportation and Logistics
Industry experts have expressed concerns regarding near-term transportation cost increases These would hit Dollarama particularly hard as Dollarama is unique among industry peers It has only one distribution center Rather than invest in a second Dollarama recently purchased its existing distribution center in Montreal ndash which it previously leased from the Rossy family ndash for $394M (in addition to $232M spent on adjacent land) Other large Canadian value retailers generally have two distribution centers ndash one in the eastern half of the country and one in the western half
Rising fuel costs could result in materially higher transportation expenses as Dollarama distributes 92 of its merchandise through its single distribution center Industry experts suggest that shipping goods to Vancouver from Montreal via truck can be almost twice as expensive as shipping to Vancouver from China
We find it interesting that Dollarama chose to purchase property from managementrsquos family rather than follow industry norms and open a second distribution center in western Canada and that five of its six warehouses ndash all located in greater Montreal ndash are also leased from the Rossy family (the sixth warehouse is company-owned built on land purchased from the Rossy family)
MarketingDollarama has historically operated with no marketing expense However US peers spend 1-2 of revenue on average on marketing (see subsequent slides) As competition increases across the Canadian discount retail industry management may be forced to expand marketing efforts
21
Minimum Wage Growth Historically High And Accelerating Rapidly
Canada has seen fairly consistent minimum wage hikes since 2000 and minimum wage growth has outpaced inflation in all but
three years since the beginning of the millennium Dollarama has been able to manage minimum wage hikes and maintain
impressive margins since going public in 2009 Note however that minimum wage growth from 2009-17 was comparatively mild
relative to the prior half-decade Accelerating minimum wage growth through the near term will test managementrsquos ability to
insulate margins from rising labor costs
0
2
4
6
8
10
12
14
2001 2002 2003 2004 2005 2006 2007 2008 2009 2010 2011 2012 2013 2014 2015 2016 2017 2018YTD
Minimum Wage Growth Consistently Ahead of Inflation and Accelerating Rapidly
Weighted Average Minimum Wage Growth Canadian CPI Growth
Minimum wage growth across all Canadian provinces weighted by
province population
Management states that the vast majority of employees make more than minimum wage Nonetheless minimum wage hikes of 10-20 in
Canadarsquos most populous provinces could put material upward pressure on labor costs ndash particularly if these hikes spread to Quebec where
Dollaramarsquos distribution center and all of its warehouses are located Management includes a risk factor to this effect in its MDampA
210
215
220
225
230
235
240
245
250
255
260
FY 2018 EBITDA Margin FY 2018 EBITDA Margin with5 Labor Cost Hike
FY 2018 EBITDA Margin with10 Labor Cost Hike
EBITDA Margin Sensitivity to Labor Cost Hikes
12 weighted average minimum wage growth across Canada driven by
207 hikes in Ontario Average minimum wages could very realistically
continue to grow at high single-digit rates through the next ~2 years if
planned hikes are enacted
With labor costs representing about 10 of Dollarama revenue
profitability is materially sensitive to changes in this item
If labor costs were 10 higher in FY 2018 EBITDA margins would have
been slashed by 80 bps
Labor cost expansion of this magnitude would be significant but is not
necessarily out of the question within 2-3 years
Source Government of Canada
22
Lack Of Transparency Regarding Dollar City Is A Serious Concern
CEO Larry Rossy
and
CFO Michael Ross
mischaracterized
the sale by
attributing it to
vehicles which
has its own
categoryhellip
Why are Dollarama shopping carts being repurposed for Dollar City use
Perhaps they were sold above-market to Dollar City in FY 2013 when the relationship began Could this be the
reason for an unexplained $149M disposal of leasehold improvements that year
Source
1) Dollar City website and press
release announcing the relationship
Q ndash Keith Howlett ldquoOn Note 5 [of the FY
2013 Annual Report] I was trying to figure
out the leasehold improvements there
seemed to be some items called lsquodisposals
at costrsquo and therersquos sort of an offset thererdquo
A ndash Larry Rossy CEO ldquoI donrsquot know what
they are Yoursquore going to have to help me
out guys hererdquo
A ndash Michael Ross CFO ldquoDisposal of costs
that would be fixtures or related tohelliprdquo
A ndash Rossy ldquoI would say carsrdquo
A ndash Ross ldquoCars Yeah okay We sold a
few carsrdquo
Q ndash Howlett ldquoOh I see okay Well it
shows up as CAD 15M for a year thatrsquos a
lot of carsrdquo
A ndash Rossy ldquoOh itrsquos a very expensive
carrdquo
Source FY 2013 Q4 Earnings Call Source Dollarama
2013 Annual Report
In 2013 Dollarama entered into an agreement to export and sell products to Dollar City a Latin American dollar store with a
presence in El Salvador Guatemala and Colombia In exchange for selling goods to Dollar City ldquoat costrdquo plus a small markup
and providing business and operational expertise Dollarama was given an option to acquire the chain exercisable in February
2019 (since extended to February 2020)
Details about Dollar City are scarce Who is the management Where is company headquarters Who are the shareholders
Dollar Cityrsquos website provides limited information and not a single Dollar City manager was quoted at the initiation of the
relationship1 Though management claims to sell to Dollar City ldquoat costrdquo with a markup we have no way of determining how they
are calculating ldquocostrdquo It is more likely that Dollarama loads shared costs into the Dollar City bill that flatter Dollaramarsquos margins
and sells merchandise that isnrsquot selling well in Dollarama stores to Dollar City
More Competition Coming To An Already-Crowded Space
24
Evidence Of Dollarama Store Growth Slowing
The pace with which Dollarama opened stores through the past several years does not appear to be sustainable
Importantly the inevitable reversal in its pacing appears to be occurring this year
The Company opened just eight stores in Q2rsquo19 its lowest store opening count in any quarter of any recent year
Its YTD FY 2019 pace of 18 new stores is also trailing the average pace of recent fiscal years (28 openings) by
~35 Management did not provide a fully satisfactory explanation for this deficit
The slowdown in its pace of store openings could suggest that the Company is having a difficult time identifying
economically-viable locations as it seeks to grow its store count by close to 50 ndash still a very distant target
Fiscal YearStated New
Store Opening Goal
Q1 Q2 First Half Q3 Q4 Total
2019 60-70 10 8 18
2018 60-70 13 17 30 10 25 65
2017 60-70 8 13 21 18 26 65
2016 None 17 17 34 16 25 75
Source Dollarama financial filings
ldquoI want to ask about the pace of store
openings As you noted the slower start to
the year you did maintain the guidance for
this year But wondering about sort of further
beyond that obviously the store potential that
you put out there gives you room to remain at
that pace for a while But does the slower
same store sales assumption change your
thinking about how aggressively you want
to push new stores out thererdquo
- Mark Petrie CIBC
ldquoNo it does not It does not And that I would
also add that if the pace at which weve been
opening stores this year is slower than last year
as mentioned often that just relates to the
specific timing of real estate And if stores are
pushed closer to the end of the year it could be
that there is an overlap between a few more
stores at the end of this year or a few more
stores in the beginning of next year and the
end it will keep our pace of 60 to 70rdquo
- Michael Ross CFO Dollarama
ldquoReal estate timing issuesrdquo
do a poor job of explaining a
drop in H1 new store
openings of over a third
Source Dollarama Q2 FY 2019 Earnings Call
25
Dollarama Potentially Pushing The Limits Of The Canadian Market
Managementrsquos stated goal is to have 1700 stores across Canada by 2027 up from 1178 stores today We do not
believe that it can achieve this without risking significant cannibalization DOLrsquos target would imply a saturation level
higher than the largest US dollar stores (Dollar Tree and Dollar General) which also sell many more consumables and
grocery items Additionally Canada broadly has much lower levels of retail space per capita than the US suggesting
that Canadian concentration is even more pronounced all else equal
US Retail Square Footage Greater Than Canadian
Retail Square Footage
DOLrsquos Target Implies
Greater Than US
Saturation Despite
Narrower Concept
Source Wellington Management
Walmart is not opening stores in Canada suggesting that it believes
the Canadian market is saturated at 114 stores per million people ndash
about 69 of its US concentration (164 stores per million people)
Meanwhile Dollarama continues to expand within Canada despite
even higher Canadian concentration (327 per mil) relative to the US
concentration of large US dollar stores (452 per mil for a 72
ratio) This ratio would be over 100 at DOLrsquos 1700 store target
Higher Canada store
count vis-agrave-vis
comparable US
store count
compared to Walmart
Higher Canada store
concentration vis-agrave-
vis comparable US
store concentration
than Walmart
Retailers with similar store concentrations per capita across both the US and
Canada are effectively more concentrated in Canada vis-agrave-vis the total retail space
in either country
Store Count by Region
Canada US CanUS Ratio
WMT 410 5358 77
DOL ndash Present 1178 14750 80
DOL ndash Future 1700 14750 115
Store Count per Million People by Region
Canada US CanUS Ratio
WMT 114 164 69
DOL ndash Present 327 452 72
DOL ndash Future 472 452 104
DOL CN DG DLTR
Stores 1700 14760 14732
Population (M) 36 326 326
StoresCapita (M) 472 453 452
26
Dollarama Has Benefited From A Benign Competitive Environment
Large competitors have been shuttering Canadian stores continuously through the last four years due to company-
specific issues highlighted by the high-profile exits of Target and Big Lots from Canada12 We believe that this has been
a significant tailwind for Dollarama but one that is largely behind the Company at this juncture
Dollarama has been able to maintain significant share high margins and high returns on capital in large part due to
missteps among peers and the resulting lax competition This is likely unsustainable in a more competitive environment
as Dollarama has few material competitive advantages barriers to entry are low and its discount retailing strategy is not
unique Competent competition from growing industry players ndash Dollar Tree Canada Miniso and Amazon among others
ndash could be the straw that breaks the camelrsquos back for Dollaramarsquos profitability or growth (or both)
Fiscal YearCompany Exiting
CanadaStores Closed Revenue
DOL Revenue Capture
(Estimated)
Estimated Revenue Benefit
Revenue Boost
2018 Sears 200 $2000 3 $60 2
2017 Sears 100 $1000 3 $30 1
2016 Target 133 $2000 6 $120 4
2015 Big Lots 78 $155 10 $16 1
Last Four Year Average $56 2
Note All numbers are SPCM estimates
1) ldquoTarget Canada to close all stores by April 12rdquo
2) ldquoBig Lots Getting Back Out of Canadardquo
27
Light Competition Has Allowed The Company To Spend Nothing On Promotion ndash Until Now
Dollarama has no promotional expense Meanwhile promotional expenses average 1-2 of revenue among US
peers As established competitors continue to expand and as new competitors enter the market (Amazon included)
Dollaramarsquos no-cost marketing strategy may prove untenable
Promotional Expense
as a of Revenue
Intensifying Competition Threatens Dollaramarsquos
Passive Marketing Strategy
2016 2017 2018
BIG 180 180 170
FIVE 264 270 243
DLTR 021 029 048
DG 062 054 044
Average 132 133 126Source Huffington Post
Source Investorscom
The Canadian operation is also a relatively small part of the business However early results are
encouraging and despite competition in the Canadian market Dollar Tree has found success Longer
term the company is aiming for 1000 stores north of the border which does not seem unrealistic
Source Retail Environments
Calls with people at Dollar Tree suggest that the Company is working to
imitate elements of Dollaramarsquos strategy and store layout in its own
Canadian stores (eg raised shelves etc) and that it plans to expand
into Canada aggressively once its strategy is refined ndash likely in 2019
Source Company financial filings
28
Caught Between The Competition How Will Dollarama Fit In
Dollar Tree has maintained its reputation as a true dollar store nothing is priced higher than C$125 ($1 in the US)
Miniso has developed a reputation as a ldquonicerrdquo discount retailer items can cost up to C$25 but the environment is cleaner and
more modern and products are of better quality (but you can still get a dollar-level deal ndash most products are priced under C$10)
Dollarama has all the character of an old tired dollar store but without the dollar prices
Who will shop there unless management invests in store updates rather than opening new stores
Value-driven customers are by definition not loyal customers
Miniso
Clean and modern but cheap
Dollar Tree
No need for price tags everythingrsquos $1 Dollarama
Looks like Dollar Tree priced like Miniso
Irsquoll pass
29
Dollarama Makes No Effort To Appeal Millennials ndashThe Next (And Current) Shopping Generation
Dollarama has zero social media presence unlike all of its peers Not only is the Company out of touch with customers in
an industry which demands a high level of customer engagement but its brand is becoming demonstrably stale
Facebook Twitter Instagram YouTube LinkedIn Pinterest Google+
Dollar Tree Yes Yes Yes Yes Yes Yes No
Dollar General Yes Yes Yes Yes Yes Yes Yes
Family Dollar Yes Yes Yes Yes Yes Yes No
Big Lots Yes Yes Yes Yes Yes No Yes
Miniso (Canada N America)
Yes Yes Yes Yes Yes No No
Great Canadian Dollar Store
Yes Yes No No No No No
Dollarama No No No No No No No
Until now Dollarama has largely been a regional brand with satisfactory name recognition in its provincial home of Quebec
Now that the Company is making a bigger push into Anglophone Canada management should be more proactive in adapting its
strategy to new markets and to a new customer base Yet management continues to employ a strategy more befitting a sleepy
regional business it does not market or work to improve its brand it does not stay current with trends it keeps management
within the family and it is not expanding its logistics chain to support coast-to-coast growth (see subsequent slides)
Management wants Dollarama to be a national brand but it does not appear prepared to run a national business
Questionable Accounting And Financial Practices
31
Hedging Instruments A Material Source Of Profits In Recent Years
Dollaramarsquos sales are in Canadian dollars whereas a majority of its product purchases are US dollar-linked Management claims to enter
into CADUSD hedging arrangements to lock in near-term margins without having to adjust prices in response to FX movements However
management has nonetheless admittedly adjusted prices alongside unhedged peers in response to shifts in the CADUSD exchange rate
rendering its currency hedges a source of profit
Forex dynamics through the last two years have erased the large hedge benefit realized by Dollarama in FY 2016 but management reports
that gross margins have effectively remained flat through this period implying significant gross margin improvement in the underlying
business (see graphs below) As the currency hedge benefit has reversed through the last two years underlying gross margins have
purportedly risen by EXACTLY ENOUGH to keep total gross margins steady between 39-40 We find this oddly convenient ndash or at the very
least we question whether management will be able to maintain steady margins in the face of unfavorable FX rate dynamics in the future
Quick turnaround in
underlying
profitability Just in
time to keep the
declining forex hedge
benefit from dragging
down marginshellip
Even as FX hedge gains fell
from close to 8 of gross profit
in FY 2016 to a drag on gross
profit in FY 2018 gross margin
expanded by over 100 bps over
the same period implying gross
margin expansion ex-forex of
almost 300 bps within two years
for a retailer with gross margins
which were already unusually
high and whose margins had
contracted for four straight
years before the rapid reversal
32
Questionable Depreciation Assumptions
Dollarama changed its depreciation schedule for leasehold improvements (store fixtures) in FY 2015 moving from a 10-year to a 15-
year expected life1 However management did not concurrently lengthen the amortization schedule for tenant inducements
We find this mismatch curious as both quantities should be amortized depreciated over the expected life of a given lease
Adding to the confusion and appearance of foul play DOL discloses in its AIF that its average lease term is just 5 yrs and it just
started disclosing related-party dealing with Director Huw Thomas of SmartCentres ndash a REIT that lists DOL as a top 10 customer23
Lease term implied
by leasehold
depreciation expense
2-3x greater than that
implied by
amortization of
tenant allowance
Mismatch in implied
lease term
inappropriately
inflates EBIT
C$ MillionsFY
2013FY
2014FY
2015FY
2016FY
2017FY
2018
Amortization of Tenant Allowance $29 $35 $43 $49 $48 $51
Starting Balance Sheet Amount 168 207 232 280 344 386
Amortization as a of Asset Amount 173 169 185 175 140 132
Implied Lease Term 58 59 54 57 72 76
Leasehold Depreciation Expense $129 $166 $108 $141 $172 $202
Starting Balance Sheet Amount 1182 1348 1762 2113 2499 2867
Depreciation as a of Asset Amount 109 123 61 67 69 70
Implied Lease Term 92 81 163 150 145 142
Tenant Allowance Amortization Using Leasehold Depreciation Schedule
183 255 142 189 237 272
Reduction In EBIT If Both Were Put On Same Schedule (11) (10) (29) (30) (24) (24)
While the financial impact of this adjustment is limited signs of accounting impropriety do not reflect well on management and cast
doubt on the rest of Dollaramarsquos reports and accounting practices
1) FY 2015 Annual Report p 15 DOL also extended its store and warehouse equipment useful lives from 8-10yrs to 10-15yrs The total reduction of these three items was decrease of $10m in
FY15 depreciation expense
2) DOL states in its AIF p 11 ldquoThe Corporation typically enters into leases with base terms of ten years and options to renew for one or more periods of five years each The average time to
expiration of the Corporationrsquos leases is approximately five yearsrdquo
3) See governance slide on Huw Thomas
33
Capital Spending And Distribution Of Cash To Shareholders Are Overextending The Business
What happened
Management claimed in 2011 that the business was sufficiently cash-generative to support growth and dividendsshare buybacks
and that it would be able to pay down debt while pursuing both However debt has ballooned since then with net debt rising 8x
(and close to 3x versus EBITDA growth) Management is effectively levering up the balance sheet to support dividends and share
buybacks with CFO Michael Ross stating that he will continue to repurchase shares as long as the earnings yield remains above
the after-tax cost of debt
ldquoFor the past few years our cash flow has enabled
us to continue to pursue our growth plans and
continue to pay down debt Our free cash flow is
now sufficient to fund both those priorities
while enhancing new to shareholders through
a quarterly dividend payment We are able to
generate the free cash flow to do all of this
because we employ a simple growth oriented
business model at Dollaramardquo
ndash June 2011 Conference Call
Should Dollaramarsquos struggles become more pronounced ndash or should the
economic cycle turn for the worse ndash this debt overhang could loom large over
the business
Dollarama also consistently spends more on capex (as a percentage of sales) than its peers in the discount retail industry and
shows abnormally high capex versus depreciation and amortization We understand that Dollarama is a growing business which
could explain both patterns in part but it is not the only discount retailer which is investing in store growth
Dollarama DampA consistently
lt50 of capex and a lower
percentage of capex than
industry peers
Dollarama consistently
spends more on capex
(as a percentage of sales) than industry peers
00
05
10
15
20
25
0
200
400
600
800
1000
1200
1400
1600
1800
FY2012
FY2013
FY2014
FY2015
FY2016
FY2017
FY2018
Ne
t D
eb
tEB
ITD
A
Ne
t D
eb
t ($
C M
M)
Net DebtEBITDA Net Debt
0
50
100
150
200
250
300
FY2010 FY2011 FY2012 FY2013 FY2014 FY2015 FY2016 FY2017 FY2018
DampA as a of Capex and Intangibles Annual
DOL DLTR DG BIG FRED
0
1
2
3
4
5
6
7
8
FY2010 FY2011 FY2012 FY2013 FY2014 FY2015 FY2016 FY2017 FY2018
Capex and Intangibles as a of Sales Annual
DOL DLTR DG BIG FRED
34
Where Is The Capex Going
Management has explicitly identified and discussed various capital expenditures in Company filings over the last
five years but this still leaves a large gap versus what was actually spent
Additionally there is a large gap between the amount spent on software development and the amortization expense
associated with this activity suggesting that earnings may be inflated
Some of this is
directed towards
leasehold
improvements etc
but with
managementrsquos
focus on expansion
over existing store
improvements we
question where
management is
directing this capex
Capital Spending Software
on Software Amortization Difference
FY 2018 191 126 65
FY 2017 126 96 3
FY 2016 111 78 33
FY 2015 108 56 52
FY 2014 98 34 64
Are earnings
inflated due to
insufficient
amortization
Note also that a LinkedIn search for software developers at Dollarama turned up effectively nothing ndash at best one person with a tangentially
relevant title (source) So where is the software development capex going
Unlike discount retailer peers Dollarama
did not include software-related
spending in capex until recently and
records it separately in
ldquoAdditions to intangible assetsrdquo1
Do they do this to artificially deflate their
headline capex figure thereby inflating
reported free cash flow
Undiscussed Capital Spending (FY 2014 ndash 2018)
C$ Millions
$500K in capex spent per new store (375 new stores over past five years Source AIF) $1875
Capex spent on construction of 500K sqft warehouse in Montreal 679
$82M spent annually on expansion renovation or relocation of stores over five years 410
$232M spent on land acquisition 232
Discussed Capex Over Past Five Years $3196
Total Reported Capex (ex intangibles) $5200
Undiscussed Capex $2004
Software Capex and Software Amortization Discrepancy
C$ MillionsCapital Spending on
SoftwareSoftware Amortization Ratio
FY 2018 $191 $126 152
FY 2017 126 96 131
FY 2016 111 78 116
FY 2015 108 56 193
FY 2014 98 34 288
1) DOL explicitly started calling out software as a component of capex in Q3rsquo16 with the addition of footnote to guidance
35
Lack Of Transparency Regarding Store Closures And Associated Costs
It is standard industry practice to report store closures remodels and relocations alongside new store openings
However Dollarama reports only ldquoNet New Storesrdquo and does not break this number out in detail Questioned on this
in Q4 2016 management answered that a larger store base would inevitably result in more closures for reasons
outside of its control (fires mall renovations etc) and that reporting closures would therefore not communicate
meaningful information regarding the underlying performance of the business
We strongly disagree store closure information is vital to evaluating the health of a retail chain Management can
provide color on particular closures if it feels that they have been done for reasons other than performance but
failing to report closures entirely hides a key operating statistic from investors
Company Store Movement 2012 2013 2014 2015 2016 2017 2018
DLTR
Beginning 4101 4351 4671 4992 5367 13851 14334OpenedAcquired 278 345 343 391 8850 584 603
Closed 28 25 22 16 366 101 102Closed as of Beginning 07 06 05 03 68 07 07
BIG
Beginning 1398 1533 1495 1493 1460 1449 1432Opened 181 87 55 24 9 9 24Closed 46 46 58 57 20 26 40
Closed as of Beginning 33 30 39 38 14 18 28
DG
Beginning 9372 9937 10506 11132 11789 12483 13320Opened 625 625 650 700 730 900 1315Closed 60 56 24 43 36 63 101
Closed as of Beginning 06 06 02 04 03 05 08
FDO
Beginning 7023 7442 7916 -- -- -- --Opened 475 500 526 -- -- -- --Closed 56 26 400 -- -- -- --
Closed as of Beginning 08 03 51 -- -- -- --Overall Industry Average 09 07 20 07 23 07 08
Other high-growth dollar
stores like Dollar Tree and
Dollar General report store
closures ndash why doesnrsquot
Dollarama
Store closures for whatever
the reasons incur real
restructuring and other
costs Peer retailers
generally give detail on these
expenses whereas
Dollarama does not
We believe that Dollarama
should follow industry norms
and increase transparency
regarding store closures
US Dollar Store peers historically close 08 of stores annually yet Dollarama has not reported any recent closures
36
SSS Metrics Obfuscate Store Performance
Dollaramarsquos official ldquoComparable Store Salesrdquo figure includes ldquorelocated and expandedrdquo stores as ldquocomparable storesrdquo
therefore picking up growth in traffic which can be attributed to relocation-related improvements We believe that this likely
overstates Comparable Store Sales growth while also ignoring associated relocation-related expenses
1) See Q1 FY 2014 earnings call transcript
Management not only hides store closure data as a supposedly uninformative statistic but proclaims that it has NEVER closed a
store due to poor performance1 We find it difficult to believe that a retailer which has existed in its current format since 1992 has
never needed to close a store for poor performance If it has indeed never closed an underperforming store we wonder whether
management has been too ambitious in growing its store base without critically evaluating the profitability of each location
Huntsville Place Mall Jul 2015
7 John St Oct 2012
7 John St Jul 2015
Huntsville Place Mall Oct 2012
Huntsville ON
Relocation
Are these really entirely
ldquocomparablerdquo locations
781 Rue Principale Est May 2016
781 Rue Principale Est Jun 2009Le Carrefour Ste Agathe
May 2016
Ste-Agathe-Des-Monts QC
Relocation
Why assume the costs to
make this lt1 mile move
Notice
Dollarama
sign turned
inside-out
indicating
closure
37
Cash Flow Beginning To Turn Over Despite Efforts To Bolster Results
In H1 FY 2019 Dollaramarsquos cash flow contracted on a year-over-year basis for the first time since it went public ndash this
despite managementrsquos efforts to bolster earnings and EBITDA The contraction appears to be due in large part to
changes in working capital In particular we are concerned that growth in inventories suggests that management
overestimated near-to-medium term sales growth and that declining traffic is starting to weigh on the Company
Dollarama H1 Operating Cash Flow
C$ Millions FY 2014 FY 2015 FY 2016 FY 2017 FY 2018 FY 2019
Net Income $1054 $1221 $1603 $1895 $2265 $2433
CFO Before Working Capital 1394 1488 2124 2156 2769 2999
Changes in Working Capital (287) (236) (870) (110) (126) (886)
Net CFO 1107 1252 1253 2045 2644 2113
YoY Change $326 $322 $01 $792 $599 (531)
Source Dollarama
Governance Concerns
39
Related-Party Transactions With Rossy Family Raise Questions Over Governance And Costs
Fiscal YearRent amp Land Purchases
Paid to Rossys(C$ MM)
As a of Compensation Paid to Rossy Family
FY 2019 (To Date) $394 NA
FY 2018 184 1660
FY 2017 402 4459
FY 2016 179 1305
FY 2015 169 2752
FY 2014 163 1903
As noted Dollarama leases all but one of its five warehouses from the Rossy family and recently purchased land from the Rossys
for the construction of a sixth Management also recently purchased its Montreal distribution center from the Rossy family which
leased the facility to Dollarama until this February We understand that the Rossy family has close historical ties to the business
but this level of close dealing draws our attention particularly given the fact that management has focused on fortifying its
existing distribution footprint ndash closely tied to the Rossy family ndash rather than invest in distribution facilities in western Canada
where major competitors already have distribution centers
DLTR
Distribution
Center
Delta BC
DLTR
Distribution
Center
Mississauga ON
DOL
Distribution
Center
DOL
Warehouses
No Dollarama distribution facilities
located outside of a ~4 mile radius in
Montreal
bull Due to preferential relationship with
Rossy family
bull Will Dollarama be able to expand into
AngloWestern Canada efficiently
without logistics costs ballooning
bull Overly-exposed to fuel price hikes
and rising transportation costs
Related-Party Transactions Significant And Growing
Source Dollarama Financials
Dollar Tree Canada Distribution Centers
Dollarama Distribution Centers And Warehouses
Source DollarTree
Montreal QC
40
Related-Party Transactions With ldquoIndependentrdquo Director Huw Thomas Only Recently Disclosedhellip
Dollarama also leases stores from SmartCentres REIT whose recently-departed CEO Huw Thomas joined Dollaramarsquos
Board of Directors in 2011 and was a member of its audit committee through March 2017
His ldquoindependencerdquo was recently defended by a meandering 260-word footnote in Dollaramarsquos proxy which belies the
fact that Dollarama is a top 10 customer of SmartCentres
This is all the more suspicious in light of Dollaramarsquos questionable lease accounting highlighted earlier
Source Dollarama 2018 Proxy Circular
Note Dollarama did not start disclosing Huwrsquos related-party dealing until the 2017 proxy
circular in June 2017 right after he left the Audit Committee in March 2017
SmartCentres 2017 Annual Report
Dollarama Material To SmartCentres ndash A Top 10 Customer
SmartCentres Promotes Dollarama Relationship From 2011
Calloway (now SmartCentres) 2012 Annual Report
Dollaramarsquos Lengthy Meandering Defense Of Thomas
Huw As Independent Only Recently Disclosed (2017)
Dollarama Recently Changed Rent Expense Disclosure
Source Dollarama Q4rsquo17 Financials Note 15 Related Party Disclosure
Source Dollarama Q2rsquo18 Financials Note 13 Related Party Disclosure
41
House of Windsor House of RossyA Case Study In Nepotism
Neil Rossy had been the Senior VP of Merchandising Chief Merchandising Officer for 25 years prior to being named CEO in
2016 While his family is still a large shareholder they are not a controlling shareholder owning around 5 of the shares
outstanding We question whether the Rossyrsquos century-long family tradition of passing down leadership ndash one which also
persists at the Rossyrsquos ldquosister storerdquo ndash is appropriate for a public company or wise for the long-term health of the business
Salim Rossy
Opened first ldquoS Rossyrdquo
store in 1910 (up-market
department store concept)
George Rossy
President of S Rossy
1937-1973
Larry Rossy
Grew S Rossy from 20 to 44 stores before
converting all S Rossy stores to new
ldquoDollaramardquo concept in 1992 Sold majority
stake to Bain Capital in 2004 IPO in 2009
Neil Rossy
CEO of Dollarama as of 2016
Michael Rossy
Brother of George (one of ten siblings)
Founder amp CEO of ldquoRossyrdquo stores 1949-2010
Michael DiTullio
Son-in-Law of Michael
President amp CEO of Rossy since 2010
Does (or will) the family have a hard time parting with a business that has been in the family for four generations even if parting ways is
the right thing to do
Managing retail chains is very
much a family affair for the
Rossys ndash at both stores
Perhaps Neil was going to be
anointed CEO of Dollarama
regardless of the caliber of other
potential candidates
Letrsquos hope hersquos not Commodus
BONUS
Brother branches out
with separate storehellip
42
Insiders Incentivized To Grow EBITDA
Our earlier concerns about EBITDA quality are amplified by the fact that Dollarama executives are compensated
based on seemingly arbitrary and inflated EBITDA targets This gives management a strong incentive to be inefficient
users of capital as any dollar shifted from operating expense to capex has a direct benefit to key executives
For example note that managementrsquos perhaps questionable decision to purchase one of its Montreal warehouses
will shift what was until recently rent expense into depreciation This change in the accounting treatment of
Dollaramarsquos tenancy costs will provide a windfall to EBITDA potentially boosting management bonuses
Source Dollarama Proxy Circular p 30
43
What Is A Stretch EBITDA Goal
Bonuses are paid upon achievement of 11 EBITDA growth This level was ldquodesigned to be a stretch objectivehellip
attainable only with significant effortrdquo However this target was reset lower after FY 2014 ndash the only year during which
management did not handily exceed the target We believe this further calls into question the independence of the
board and its compensation committee
Year EBITDA Growth Objective EBITDA Growth Achieved
FY 2018 11 18
FY 2017 11 18
FY 2016 11 30
FY 2015 11 15
FY 2014 13 12
FY 2013 13 22
FY 2012 13 26
FY 2014 Management
misses growth objective
FY 2015 Growth objective
adjusted downwards
ldquoThe thresholds were revised by the
Human Resources and Compensation
Committee in the context of its annual
executive compensation review
conducted at the beginning of each fiscal
year to take into account among other
elements the fact that the base for the
calculation is growing every yearrdquo
Source FY15 Management Proxy Circular
What ldquoother elementsrdquo were
taken into account
Source Dollarama
44
Insiders Selling While Company Buys Back Stock At Elevated Prices
Management has been buying back shares at elevated prices through the last several years even while pursuing growth leaving little capital for
(sorely needed) store updates or other uses The average repurchase price since Q1 FY17 is about on par with current share prices and ~40
below our target Since Q2 FY18 the average buyback price has been 25 above current levels
Furthermore just as the Company has been buying back stock at elevated prices insiders have been offloading shares Notably it is evident
from past and current proxy statements that CFO Michael Ross has never held onto shares for which he has been granted options his
common equity ownership is listed at zero every year Note that as the CFO it is he who is dictating the share buyback decision in large part
PeriodShares
Repurchased
Value of Repurchase
(C$ M)
Average Price (Split-
Adj) (C$)
Q1 FY 2017 1542066 1393 3011
Q2 FY 2017 2027080 1842 3029
Q3 FY 2017 1571500 1578 3347
Q4 FY 2017 2279522 2241 3277
Q1 FY 2018 1687240 1806 3568
Q2 FY 2018 1303900 1602 4095
Q3 FY 2018 687700 931 4513
Q4 FY 2018 2425700 3788 5205
Q1 FY 2019 94500 145 5115
Q2 FY 20191 1347341 700 5195
Total 14966549 16026 3797
Discount to Current Share Price 1
Total (Since Q2 FY 2018)
5859141 7170 4815
Discount to Current Share Price -20
Using Company Funds To Overpay For DOL Shareshellip While Insiders Sell Into The Companyrsquos Bidhellip
Source DOL filings and Bloomberg
Insider Title Date Sold SharesProceeds (C$ M)
Price Sold (Split-Adj)(C$)
Nicolas Hien Senior Vice President 482016 6203 06 3224
Michael Ross CFO 482016 80000 74 3083
Paul Roche Vice President 4182016 10000 09 3000
Geoffrey Robillard Senior Vice President 6172016 33500 31 3085
John Assaly Vice President 9272016 30000 30 3333
Geoffrey Robillard Senior Vice President 472017 20000 23 3833
Paul Roche Vice President 472017 23100 26 3752
Josee Kouri Corporate Secretary 4142017 8000 09 3750
Geoffrey Robillard Senior Vice President 9142017 5000 07 4667
Geoffrey Robillard Senior Vice President 12112017 10000 16 5333
John Assaly Vice President 12132017 14096 22 5202
Geoffrey Robillard Senior Vice President 1262018 15000 24 5333
John Thomas Independent Director 1262018 6000 10 5556
Geoffrey Robillard Senior Vice President 6152018 50000 75 5000
John Assaly Vice President 6192018 13404 21 5222
Nicolas Hein Senior Vice President 6222018 36750 19 5170
Paul Roche Vice President 6222018 24000 13 5417
We do not like the fact that insiders have been selling into share buybacks while
the Company levers itself up with short-term debt to support those repurchases
It appears that the execs are levering up the business in part to enrich themselves1) All share information prior to Q2 lsquo19 reflects pre-split data except
Split-Adjusted Average Prices Q2 lsquo19 repurchases were as stated
45
Rossy Family Selling Shares Despite Control Over C-Suite
Notably Founder and former CEO Larry Rossy has trimmed his position tremendously through the last several years
Though this is to be expected to some extent as he recently ceded control of the business we believe that his
ownership stake should be held to a higher standard given his insistence on keeping the business in the family
If he plans to keep the c-suite under a Rossy dynasty the familyrsquos personal stake in the business should reflect that
Source Bloomberg
Valuation And Price Target
47
The Market Has Not Taken Threats To Dollarama Seriously ndash But Optimism Is Ebbing
Analysts are generally bullish on the stock focusing primarily on managementrsquos growth story and taking current
profitability levels for granted The prospect of new competitive threats to a business which has until now seen limited
competition ndash and the risk that prevailing margins are unsustainable even through the near term ndash go underappreciated
Dollaramarsquos poor Q2 cooled analystsrsquo optimism to some extent but we believe that the reaction was largely reactive and
superficial as they adjusted their price targets in such a way that in aggregate they saw exactly the same upside after the
post-Q2 dip as they did before The market still does not fully appreciate the magnitude of the threats facing Dollarama
All price targets in C$ Before Q2 Release After Q2 Release
Firm Recommendation Target PriceUpside (on 82818) Recommendation Target Price
Upside (on 9172018)
Upside (Present)
RBC Capital Markets Outperform $5500 12 Outperform $5200 22 35
Raymond James Outperform $5567 13 Outperform $5000 17 30
Macquarie Outperform $5633 14 Outperform $4900 15 27
BMO Capital Markets Outperform $6100 24 Market Perform $4700 10 22
CIBC Capital Markets Outperform $5900 20 Neutral $4600 8 20
Desjardins Securities Buy $5800 18 Hold $4500 6 17
Veritas Investment Research Co Buy $5600 14 Buy $4800 13 25
Industrial Alliance Securities Hold $5450 11 Buy $5450 28 42
Canaccord Genuity Buy $5900 20 Buy $5500 29 43
Barclays Equal Weight $5200 5 Equal Weight $4400 3 14
TD Securities Buy $5900 20 Hold $4900 15 27
Accountability Research Corp Buy $5400 10 Buy $5000 17 30
National Bank Financial Outperform $5567 13 Sector Perform $4800 13 25
Scotia Capital Sector Outperform $5567 13 Sector Outperform $5050 19 31
Wells Fargo Securities Market Perform $5300 7 Market Perform $4000 -6 4
AVERAGE $5626 14 $4853 14 26
While analysts are still not sufficiently critical of Dollarama the more recent downward move in the stock and subsequent analyst
downgrades may suggest that the market could be primed to evaluate the Company and its growth story with a more discerning eye
We believe that the issues which we highlight in this report will provoke further professional skepticism among analysts and investors
48
Dollarama Not Priced To Perfection ndashPriced Beyond Perfection
We can get close to DOLrsquos current valuation only if we value it as a mature ex-growth business today under
managementrsquos lofty goals for the business for ten years into the future applying no discounts for time
business risk etc
Managementrsquos ten-year store target
bull Current store count 1178 (70 of long-
term target)
Even if Dollarama were a mature business today under managementrsquos long-term targets for the business
DOL stock would not have no upside to current share prices
The market is pricing DOL beyond perfection ndash a valuation this lofty cannot be justified today
Mature Business ValuationC$ MM unless noted
Stores 1700
Revenue per Store $32
Total Revenue $5440
Operating Margin 220
Operating Profit $1197
Interest Expense $50
Tax (275) $315
Net Income $831
Diluted Shares Outstanding 332
EPS $251
PE Multiple 152x
Target Price $3815
Upside -1
Average operating margin since Q1 FY 2016
bull Assumes that DOLrsquos unusually high
margins are sustainable despite
intensifying competition loss of recent FX
benefit and customer pushback against
price hikes
Mature revenue per store estimate
bull Current average revenue per store
~$28M (875 of long-term target)
Industry median NTM PE multiple
bull Assigns no discount to DOL due to
declining store traffic vs peers incoming
competitive threats inefficient distribution
network etc
49
Dollarama Not Priced To Perfection ndashPriced Beyond Perfection (Continued)
Put another way The market is implicitly taking it for
granted that Dollarama will achieve its lofty ten-year
growth targets assuming sustained profitability levels
and per-store efficiency ndash and applying close to the
industry median FY1 EVEBITDA multiple to Dollaramarsquos
FY 2027 EBITDA
Just under ten-
year target
What kind of growth is the market implicitly betting on if
we value Dollarama on par with peers
bull 150 more stores than managementrsquos ten-year target ndash
within nine years
bull 48 CAGR in revenue per store
bull Zero margin compression
FY 2027 Estimates if Management Executes Growth Plans Perfectly
(C$ MM unless noted)
Stores (Year-End) 1688
Revenue per Store $33
Total Revenue $5503
Gross Margin 380
Gross Profit $2093
SGampA per Store 04
SGampA Total 689
EBITDA (FY 2027) $1404
Market Cap 12752
Debt 1880
Cash 182
Enterprise Value $14450
EVEBITDA (FY 2027) 103x
Industry Median EVEBITDA (FY1) 110x
Average gross
margin ex-
hedge gains
since FY 2016
Mature revenue
per store
estimate (15
growth CAGR)
FY 2018 SGampA
per Store
Implied FY 2027
multiple close to
industry median FY1
multiple
FY 2027 Estimates To Justify Prevailing Valuation (C$ MM unless noted)
Stores (Year-End) 1858
Revenue per Store $44
Total Revenue $7929
Gross Margin 380
Gross Profit $3016
SGampA per Store 04
SGampA Total 755
EBITDA (FY 2027) $2261
EVEBITDA (FY 2027) 62x
Enterprise Value 13947
Debt 1880
Cash 182
Equity Valuation $12249
Diluted Shares Outstanding 332
Target Price $3693
Current Price $3845
158 over ten-
year target in
nine years
48 growth
CAGR in
SalesStore
Industry median
FY1 multiple
discounted
75 annually
Average gross
margin ex-
hedge gains
since FY 2016
FY 2018 SGampA
per Store
High forecast gives
us 4 DOWNSIDE
50
Valuation Far Out Of Line With Peers And Historical Multiples
DOL shares trade at a 50-60 premium to peers in the discount retail industry The market is valuing DOL much more like a high-
growth tech company than a brick-and-mortar dollar store (and one with concerning fundamental trends at that) Note that this still
holds true even after DOL shares traded down significantly following its recent Q2 earnings report
It is difficult to justify a valuation this high even if one is bullish on DOL vis-agrave-vis the rest of the industry
Company Ticker
3-Year Consensus Revenue
CAGR
FY 2018 EBITDA Margin
PE(NTM)
PE(FY2)
EVEBITDA(NTM)
EVEBITDA(FY2)
EVSales(NTM)
Dollar Tree DLTR 43 121 139x 134x 91x 88x 10x
Dollar General DG 75 104 163x 162x 112x 112x 12x
Big Lots BIG 06 85 87x 87x 52x 53x 04x
Five Below FIVE 210 162 360x 412x 2113x 243x 32x
Canadian Tire CTC CN 20 90 179x 181x 82x 83x 10x
Metro MRU CN 80 73 142x 139x 99x 101x 08x
MEDIAN 59 97 152x 151x 95x 110x 10x
Dollarama DOL CN 85 255 229x 223x 164x 163x 41x
DOL PREMIUM 505 477 727 509 3057
Does DOL ndash a value retailer
demonstrating concerning
fundamental trends ndash deserve
to be valued on par with
higher-growth industries and
completely out of line with its
industry peers
Profitability is impressive but
likely unsustainable in the face
of growing competition
Enterprise Value Revenues Enterprise Value Adj EBITDA Price Adj EPSDOL shares also trade at
a significant premium to
historical multiples
despite unsustainable
margins an increasingly
saturated market and
rising competitive
threats
51
Does The Market Think Dollarama Is A Dollar Store Or A Premium Retail Brand
Dollarama is valued much more closely to premium retail brands than its discount retail peer group
A bull might ldquojustifyrdquo this by pointing to Dollaramarsquos profitability profile and growth expectations but its EBITDA margins are so
out of line with those of its peers that one is forced to question whether they are sustainable (at best) or honest (at worst)
As discussed Dollaramarsquos consensus sales growth numbers also ignore looming fundamental threats to the business
Company TickerGross
Margin (NTM)
EBITDA Margin (NTM)
Sales Growth (NTM)
EVEBITDA(NTM)
PE(NTM)
EVSales(NTM)
Dollar Tree DLTR 31 11 28 91x 139x 10x
Dollar General DG 31 10 89 112x 163x 12x
Big Lots BIG 41 7 -08 52x 87x 04x
Five Below FIVE 36 15 203 2113x 360x 32x
Canadian Tire CTC CN 34 12 40 82x 179x 10x
Metro MRU CN 19 7 88 99x 142x 08x
MEDIAN 33 11 64 95x 152x 10x
Dollarama DOL CN 40 25 99 164x 229x 41x
DOL PREMIUM 727 505 3057
How does Dollarama support EBITDA
margins more than double those of its
peer group and in line with premium
global retail brands
Company TickerGross
Margin (NTM)
EBITDA Margin (NTM)
Sales Growth (NTM)
EVEBITDA (NTM)
PE (NTM)EVSales
(NTM)
Ferragamo SFER IM 65 17 48 160x 260x 26x
Hermes RMS FP 69 38 84 200x 350x 78x
Prada 1913 HK 74 22 78 100x 210x 23x
Tiffany amp Co TIF 64 24 51 113x 196x 28x
MEDIAN 67 23 65 137x 235x 27x
Dollarama DOL CN 40 25 99 164x 229x 41x
DOL PREMIUM 197 -26 519
Does a discount retailer facing
fundamental headwinds deserve to be
priced 50 or more above its peer
group and closer to global
premium retail brands
52
Margins And Multiples Materially Out-of-Line With Peers
We do not believe that Dollaramarsquos profitability levels ndash which are entirely out of line with peers ndash are justified or sustainable in an
industry as competitive as deep discount retail The Company is already struggling to meet store count growth targets raising the
likelihood that its store growth plan will be dilutive to margins The market assigns a premium valuation to Dollarama on the basis
of relatively high growth expectations and the Companyrsquos industry-leading margins However as discussed throughout this
report we doubt both managementrsquos ability to meet its growth targets and its ability to maintain prevailing profitability levels The
likelihood that the Company will be able to achieve BOTH of these goals simultaneously is even slimmer Accordingly we believe
that the basis for Dollaramarsquos substantial share price premium is unfounded
Dollaramarsquos margin profile is grossly out of
line with peers and we find evidence of
aggressive accounting and questionable
business practices that can partly explain the
issue We doubt that this would be sustainable
even if management wasnrsquot growing the chain
How will a lowno-moat business with falling
per-store traffic be able to maintain its
remarkable profitability advantage while
aggressively expanding its store base
DLTRDG
BIG
FIVE
CTCCN
MRUCNWNCN
DOLCN
0
5
10
15
20
25
30
10 15 20 25 30 35 40 45 50
EBIT
DA
Mar
gin
Gross Margin
Dollarama Margins Completely Out Of Line With Peers
The premium in Dollaramarsquos share
price is driven by the marketrsquos trust in
managementrsquos growth initiatives and
its recognition of the Companyrsquos
dominant profitability
However neither its profitability
advantage nor its growth prospects
are sustainable The likelihood that
management simultaneously
preserves BOTH is extremely low
Big Lots (BIG) Dollar Tree (DLTR) Dollar General (DG) Metro Inc (MRU CN) and Canadian Tire (CTC CN)
x
5x
10x
15x
20x
25x
BIG DLTR MRU CN DG CTC CN DOL CN
PE (NTM)
x
4x
8x
12x
16x
20x
BIG DLTR MRU CN DG CTC CN DOL CN
EVEBITDA
53
Valuing DOL As A Mature Business In The Canadian Market ~40 Downside
C$ MM unlessotherwise noted
Current Run-Rate Valuation
Priced Beyond Perfection
Reasonable Downside
Stores 1170 1700 1500
RevenuesStore 28 32 30
Revenues 3320 5440 4500
Operating Margin 23 22 18
Operating Profit 764 1197 801
Interest Expense 42 50 50
Tax 275 198 315 207
Net Income 523 831 544
Shares 332 332 332
EPS $158 $251 $164
Multiple 24x 16x ~15x
Share Price $3845 $3966 $2460
Upside (Downside) 3 Approx -40
As discussed earlier at 1700 stores DOL would have greater penetration than both Dollar General (DG) and Dollar Tree (DLTR)
which both offer a much broader assortment of goods including perishablesconsumables Meanwhile the US appears to be
overstored versus Canada It is likely unreasonable for DOL to target per capita penetration levels on par with its US peers
Even if we assume that DOL can reach similar penetration levels and match company
growth targets ndash with steady margins no less ndash DOL has little upside
Valuing DOL as a mature business at its upper penetration bound implies ~40 downside
in a more realistic yet still generous scenario in which DOL is valued in line with peers
Higher Canada
store count vis-agrave-
vis comparable US
store count
compared to
Walmart
Higher Canada
store concentration
vis-agrave-vis
comparable US
store concentration
than Walmart
Achieving
managementrsquos
1700 store target
would put DOL at a
higher per capita
penetration level
than US peers
Store Count by Region
Canada US CanUS Ratio
WMT 410 5358 77DOL ndash Present 1178 14750 80DOL ndash Future 1700 14750 115
DOL CN DG DLTR
Stores 1700 14760 14732
Population (M) 36 326 326
StoresCapita (M) 472 453 452
Downside Run-Rate Operating Margin Estimate
ProfitabilityCost Measure JustificationGross Margin Target Recent Historical Average 370
Current SGampA Recent Historical Average 167
Add
Advertising Expense Normalization
Industry Average05
Rent Expense NormalizationAdjusting for Depreciation Rearranged
from Rent Expense 05
Depreciation Catch-Up Matching DampA schedules 15
Pro Forma SGampA 192
Pro Forma Operating Margin 178
Store Count per Mil People by Region
Canada US CanUS Ratio
WMT 114 164 69DOL ndash Present 327 452 72DOL ndash Future 472 452 104

12
Undifferentiated Goods amp Knock-Off Products
Dollarama sells undifferentiated low-priced consumer goods competing almost entirely on price Many of its products are
knock-offs It is no surprise that the Company has been sued by several companies for trademark infringement
How Dollarama became the retail king of knockoffsSelling cheap imitations of more expensive brands has turned Dollarama into one of Canadarsquos most
successful retailers earning it big bucks and plenty of lawsuits (Source)
ldquoI think they have good lawyers working
for themrdquo says David Lipkus a lawyer
specializing in anti-counterfeit in Toronto
who has helped clients sue businesses in
Canada selling knock-offs ldquoOften
retailers make mistakes and end up
selling fakesrdquo Many lawsuits are settled
privately but the store has been sued
by Nike for selling counterfeit
footwear emblazoned with Nikersquos
iconic basketball player silhouette and
by Umbra a home decoration company
for selling a style of waste basket In
February 2017 Dixon Ticonderoga
launched a suit against the dollar
store chain for a pencil itrsquos been
selling since 2002
Dollarama sells a wide range of discounted knock-offs across product categories
Its business invites litigation
Brazen mimicry multiple knock-offs
of a single producer (Mars)
Source
13
Per-Store Traffic Growth Stagnant But Opportunities For Price Increases May Be Exhausted
Growth in per-store sales has been driven by transaction size growth against declining per-store traffic Transaction
size growth has itself been driven by sales of higher-priced items Dollaramarsquos maximum price point has risen from
$1 prior to FY 2008 to $2 in FY 2008-09 to $3 in FY 2012 to $4 in FY 2017
Contracting store traffic puts per-store sales growth at risk absent further price increases but we question whether
price-driven SSS growth is sustainable as higher prices erode Dollaramarsquos value proposition and put it in closer
competition with more comprehensive big-box retailers Management has expressed reluctance to raise prices further
in the near term regardless (though they said the same when the max price was bumped to $3 several years ago) With
recent price increases now lapping for the first time SSS growth may be at risk
Growth has been propped up by price increases which have made its products more expensive than those at dollar store peers
Between a rock and a hard place Does management continue to erode Dollaramarsquos value proposition with price increases or
keep prices steady and hope for traffic contraction to reverse
Average Quarterly YOY
Growth in Per Store Traffic
-18 since Q1 2014
Transaction
size growth
decelerating
14
Increasing Average Unit Revenues Is A Very Risky Strategy That Has Failed Before
Raising price points to prop up SSS growth against falling store traffic is a major risk for discount retailers as their
entire value proposition comes from their low prices Higher prices may turn off customers and create difficult
comps in the event that price increases must be paused or reversed due to customer pushback
In 2006 for example Big Lots ndash a US discount retailer ndash introduced higher-ticket brand-name items in place of
comparable budget goods in an effort to get customers to spend more per visit This strategy reinvigorated same-
store sales growth for a time but ultimately failed Subsequent difficult comps resulted in negative SSS growth after
management abandoned its so-called ldquoRaise the Ringrdquo strategy
Raise the Ring is
abandoned lower price
points are emphasized
Raise the Ring is
introduced higher priced
items are emphasized
Big Lots alienated shoppers who were
seeking cut-price name-brand goods after
venturing into other areas
like selling frozen food
ldquoOur customer doesnrsquot come to us expecting a
Nordstromrsquos level of in-store shopping
experience They want value treasures
merchandise on the floor and clean restrooms
and we need to meet those expectationsrdquo
[CEO Steve] Fishman said in 2005
hellip
ldquoWersquore an enigmardquo he said at an investor
conference this month ldquoItrsquos been a real
challenge for the marketplacerdquo Source
Calls with industry experts indicate that Dollarama is losing more price-conscious customers to Dollar Tree and other discount retailers
following its efforts to raise prices and that this is a major driver behind recent per-store traffic declines
If price-conscious customers arenrsquot interested in shopping at Dollarama we wonder who ishellip
15
ldquoNothingForADollaramardquo Customers Becoming Conscious Of Price Increases Versus Competitors
Dollaramarsquos price increases may not yet put its prices on par with those of big box retailers like Walmart but
customers have taken notice that Dollarama has increased prices against other Canadian dollar stores Comments
from various internet forums and news sites reveal that customers no longer believe that Dollarama offers as much
value as do other discount retailers suggesting that the strength of Dollaramarsquos value proposition ndash the source of
its appeal and foundation of its business model ndash is at risk The below comments are anecdotal but comments of
this sort regarding Dollarama in particular are nonetheless common among relevant websites
ldquoThe dollar store is no longer a bargain if you
shop around you can by the same things
cheaper or same price elsewhere quit
calling it dollarama no more dollar thingsrdquo
Source
ldquodollar tree here is drastically cheaper then
dollarammardquo ndash Cody Williams
ldquoCody Williams Same here Dollarama is not
really a dollar store anymorerdquo ndash JJ Walker
Source
ldquoI enjoyed the days when everything in Rama
actually was a dollar I go to Dollar Tree
more often now just because everything
there is $125 - ($1 in the US of course)rdquo
Source
ldquoTheir high prices is the problem they still
have better selection than Dollar Tree but
their prices are always higher I know some
dollar store shoppers who go to Dollar
Tree first for the better prices and then go
to Dollarama for the stuff they couldnt
find at Dollar Tree Myself personally have
watched the prices creep up A pair of work
gloves climbed from $250 to 4 or 5 bucks
the discount over Home Depot is only a
buck or two now Also Dollar Tree still
keeps all items under 2 bucks I believerdquo
Source
ldquoThey gonna have to change the Dollarama
name soonrdquo
ldquodollarandaquarterramardquo
ldquoNew Name NothingForaDollarrdquo
ldquoYou forgot lsquoramarsquo NothingForADollaramardquo
ldquoAs for a new name how about
FiveFinaramardquo
ldquofive or lessarmardquo
Source
ldquoDollarRama is no longer in the same
category since they sell at higher prices
more of a discounted store and not a dollar
storerdquo
Source
Just did a quick check of my cleaning cupboard
DT=Dollar Tree DM=Dollarama
- 284L bleach $125 at DT Sometimes they even
have the big 37L bottles Never seen bleach that
cheap at DM
- 976ml Fabric Refresher $125 at DT DM sells it for
$150 and its a smaller bottle
- Oxy First Force spray cleaner $125 at DT $150 at
DM
DT also has a selection of other spray cleaners at
$125 while even other no name ones at DM can go
up to $2
- No name dish soap 1479ml (almost 15L) for $125
at DT 500ml for a $1 (or I guess $125 soon) at DM
- No name Mr Clean sponges At DT its two full
sponges for $125 At DM each sponge is half Mr
Clean cleaner sponge and half normal cheap sponge
- Those square no name tupperware containers that
are 3 for $125 at DM are 4 for $125 at DT
At the dollar-ish level everything Ive found at DT
has been a better value and equal or better
quality
Source
16
Transitioning Away From ldquoDollar Storerdquo Identity Threatens Customer Loyalty
Perhaps in recognition of the fact that Dollarama is losing its status as a true dollar store and that it now belongs to a
different category management has stricken almost all references to ldquodollar storesrdquo from Company filings This poses
a major threat to Dollaramarsquos customer appeal as evidenced by traffic trends and anecdotal customer reactions
FY 2017 Annual Information Form FY 2018 Annual Information Form
17
Margins Are Inexplicably High And Perhaps Unsustainable
We acknowledge that Dollarama is a strong operator with a strong value proposition (though perhaps a declining one) However
we question whether a discount retailer reselling Chinese knock-offs should garner among the highest operating margins of all
global retailers and whether a discount retailer with declining per-store traffic can continue to rely on price hikes for SSS growth
Dollarama stands out among global consumer companies and retailers ndash
45th out of 584 global retailers by operating margin (and 12th out of 584
global retailers by revenue multiple)
Dollarama consistently produces operating margins materially higher than
industry peers and higher than historical industry norms This gap has
only grown more substantial through the last five years
0
5
10
15
20
25
FY 2008 FY 2009 FY 2010 FY 2011 FY 2012 FY 2013 FY 2014 FY 2015 FY 2016 FY 2017 FY 2018
Peer Median Operating Margins vs Dollarama
Peer Median DOL CN
-10
-5
0
5
10
15
20
25
FY 1
989
FY 1
990
FY 1
991
FY 1
992
FY 1
993
FY 1
994
FY 1
995
FY 1
996
FY 1
997
FY 1
998
FY 1
999
FY 2
000
FY 2
001
FY 2
002
FY 2
003
FY 2
004
FY 2
005
FY 2
006
FY 2
007
FY 2
008
FY 2
009
FY 2
010
FY 2
011
FY 2
012
FY 2
013
FY 2
014
FY 2
015
FY 2
016
FY 2
017
FY 2
018
Dollarama Operating Margins vs Peers
DG FDO DLTR FRED BIG DOL CN
Source Bloomberg EQS function Source Dollarama and company filings
18
Debit Card Boost Is Played Out
Dollarama management has characterized the benefit from debit cards as being roughly a doubling in average purchase size
If true this benefit would be visible in year-over-year sales comps
The Company has not always disclosed penetration ndash and they ceased doing so after Q4 2016 ndash but the data suggest that the
average annual comp benefit was approximately 25 from FY 2013-16
Source Dollarama
00
05
10
15
20
25
30
35
40
45
0
10
20
30
40
50
60
Debit Card Penetration and Imputed Comp Benefit
Debit Card Penetration (LHS) Comp Benefit (RHS)
19
Have All The Levers Been Pulled
Dollarama has done a good job of increasing per-store revenue while investing in initiatives designed to remove operating
expenses We cannot fault management for pulling levers to expand margins but we believe the low-hanging
(and high-hanging) fruit has already been harvested
Management has also taken creative measures to raise effective average prices without raising prices directly ndash eg by
strategically replacing some lower-priced goods with close substitutes at higher price points and by reducing the size of
product bundles (pencils candies etc) without cutting prices Such back-door avenues to margin expansion may be exhausted
by this point as noted previously customers are beginning to notice that Dollarama no longer offers a value proposition
comparable to competing dollar stores
FY 13 FY 14 FY 15 FY 16 FY 17 FY 18
Revenue LeversAdd $250-$300
Price PointsDiscounting With Hedged Margins
Add $350-400 Price Points
Accept Credit and Debit Cards
Cost LeversDollar City
RelationshipNew POS Terminals
Kronos Labor Scheduling
Wi-Fi amp ScannersNew Warehouse
ConstructionWarehouse Expansion
Accounting and Financial Levers
Depreciation Schedule Change
Direct Profit from Currency Hedges
Leveraged Share Repurchase
ldquoThanks and good morning In the write up in the
discussion of the foreign exchange headwinds
and gross margin you also said you made select
changes to your product mix I am just wondering if
you could elaborate are there certain categories
thatrsquos your emphasizing in certain categories you are
deemphasizing I am just wondering what that
sentence really meantrdquo
- Peter Sklar BMO Capital Markets
ldquoIts really an item by item discussion Where the
compelling value remains and we are able to take for
example two pencils out of a pack and still be
competitive to help with offsetting some of the
headwinds thatrsquos the way we handle it or in other
cases if we replace the product with a new offering
thatrsquos just as compelling but different at a lower
cost potentially Thatrsquos another way Buyers can use
that tool to help them with the current challengesrdquo
- Michael Ross CFO Dollarama
Is this a sustainable practice as value-oriented customers lose faith in Dollarama
FY 2016 Q4 Earnings Call QampA
20
Costs Rising On Multiple Fronts
While management may have largely exhausted avenues for price increases and efficiency gains other industry and Company
developments threaten to drive up costs through the near term
Cost Driver Explanation
TariffsA significant share of goods (~20 according to industry experts) are sourced either directly or indirectly from the US Tariffs could increase costs on these goods materially
Minimum Wage Hikes
Provincial minimum wages in Canada generally rise much more frequently than do US minimum wages and many are scheduled to rise on an annual basis based on CPI growth Minimum wage hikes have been particularly significant of late (see below) Even provinces whose minimum wages are not tied to CPI growth have seen or are set to see material minimum wage hikes in the near future Notable recent and near-term changes are as follows
bull Alberta From $1360 to $1500 on October 1 2018 (103 increase)bull British Columbia From $1265 to $1385 on June 1 2019 to $1460 on June 1 2020 and to $1520 on June 1 2021 (63 CAGR)bull Ontario From $1160 to $1400 on January 1 2018 (207 increase) and to $1500 on January 1 2019 (additional 71 year-over-year increase)
Will rise according to Ontario CPI growth every October 1 each subsequent year New Ontario Premier Doug Ford is looking to reverse these plansbull Quebec Just increased to $1200 (+66 in May 2018) Significant political push to set provincial minimum wage at 50 of average provincial
minimum wage by 2020bull Manitoba New Brunswick Newfoundland Nova Scotia Ontario Saskatchewan and Yukon Annual minimum wage hikes according to national or
local CPI growth
Employee remuneration for FY 2018 was just over 10 of Dollarama revenue This cost item could realistically grow at a high single-digit rate over the next 2-3 years even if headcount is reduced
Transportation and Logistics
Industry experts have expressed concerns regarding near-term transportation cost increases These would hit Dollarama particularly hard as Dollarama is unique among industry peers It has only one distribution center Rather than invest in a second Dollarama recently purchased its existing distribution center in Montreal ndash which it previously leased from the Rossy family ndash for $394M (in addition to $232M spent on adjacent land) Other large Canadian value retailers generally have two distribution centers ndash one in the eastern half of the country and one in the western half
Rising fuel costs could result in materially higher transportation expenses as Dollarama distributes 92 of its merchandise through its single distribution center Industry experts suggest that shipping goods to Vancouver from Montreal via truck can be almost twice as expensive as shipping to Vancouver from China
We find it interesting that Dollarama chose to purchase property from managementrsquos family rather than follow industry norms and open a second distribution center in western Canada and that five of its six warehouses ndash all located in greater Montreal ndash are also leased from the Rossy family (the sixth warehouse is company-owned built on land purchased from the Rossy family)
MarketingDollarama has historically operated with no marketing expense However US peers spend 1-2 of revenue on average on marketing (see subsequent slides) As competition increases across the Canadian discount retail industry management may be forced to expand marketing efforts
21
Minimum Wage Growth Historically High And Accelerating Rapidly
Canada has seen fairly consistent minimum wage hikes since 2000 and minimum wage growth has outpaced inflation in all but
three years since the beginning of the millennium Dollarama has been able to manage minimum wage hikes and maintain
impressive margins since going public in 2009 Note however that minimum wage growth from 2009-17 was comparatively mild
relative to the prior half-decade Accelerating minimum wage growth through the near term will test managementrsquos ability to
insulate margins from rising labor costs
0
2
4
6
8
10
12
14
2001 2002 2003 2004 2005 2006 2007 2008 2009 2010 2011 2012 2013 2014 2015 2016 2017 2018YTD
Minimum Wage Growth Consistently Ahead of Inflation and Accelerating Rapidly
Weighted Average Minimum Wage Growth Canadian CPI Growth
Minimum wage growth across all Canadian provinces weighted by
province population
Management states that the vast majority of employees make more than minimum wage Nonetheless minimum wage hikes of 10-20 in
Canadarsquos most populous provinces could put material upward pressure on labor costs ndash particularly if these hikes spread to Quebec where
Dollaramarsquos distribution center and all of its warehouses are located Management includes a risk factor to this effect in its MDampA
210
215
220
225
230
235
240
245
250
255
260
FY 2018 EBITDA Margin FY 2018 EBITDA Margin with5 Labor Cost Hike
FY 2018 EBITDA Margin with10 Labor Cost Hike
EBITDA Margin Sensitivity to Labor Cost Hikes
12 weighted average minimum wage growth across Canada driven by
207 hikes in Ontario Average minimum wages could very realistically
continue to grow at high single-digit rates through the next ~2 years if
planned hikes are enacted
With labor costs representing about 10 of Dollarama revenue
profitability is materially sensitive to changes in this item
If labor costs were 10 higher in FY 2018 EBITDA margins would have
been slashed by 80 bps
Labor cost expansion of this magnitude would be significant but is not
necessarily out of the question within 2-3 years
Source Government of Canada
22
Lack Of Transparency Regarding Dollar City Is A Serious Concern
CEO Larry Rossy
and
CFO Michael Ross
mischaracterized
the sale by
attributing it to
vehicles which
has its own
categoryhellip
Why are Dollarama shopping carts being repurposed for Dollar City use
Perhaps they were sold above-market to Dollar City in FY 2013 when the relationship began Could this be the
reason for an unexplained $149M disposal of leasehold improvements that year
Source
1) Dollar City website and press
release announcing the relationship
Q ndash Keith Howlett ldquoOn Note 5 [of the FY
2013 Annual Report] I was trying to figure
out the leasehold improvements there
seemed to be some items called lsquodisposals
at costrsquo and therersquos sort of an offset thererdquo
A ndash Larry Rossy CEO ldquoI donrsquot know what
they are Yoursquore going to have to help me
out guys hererdquo
A ndash Michael Ross CFO ldquoDisposal of costs
that would be fixtures or related tohelliprdquo
A ndash Rossy ldquoI would say carsrdquo
A ndash Ross ldquoCars Yeah okay We sold a
few carsrdquo
Q ndash Howlett ldquoOh I see okay Well it
shows up as CAD 15M for a year thatrsquos a
lot of carsrdquo
A ndash Rossy ldquoOh itrsquos a very expensive
carrdquo
Source FY 2013 Q4 Earnings Call Source Dollarama
2013 Annual Report
In 2013 Dollarama entered into an agreement to export and sell products to Dollar City a Latin American dollar store with a
presence in El Salvador Guatemala and Colombia In exchange for selling goods to Dollar City ldquoat costrdquo plus a small markup
and providing business and operational expertise Dollarama was given an option to acquire the chain exercisable in February
2019 (since extended to February 2020)
Details about Dollar City are scarce Who is the management Where is company headquarters Who are the shareholders
Dollar Cityrsquos website provides limited information and not a single Dollar City manager was quoted at the initiation of the
relationship1 Though management claims to sell to Dollar City ldquoat costrdquo with a markup we have no way of determining how they
are calculating ldquocostrdquo It is more likely that Dollarama loads shared costs into the Dollar City bill that flatter Dollaramarsquos margins
and sells merchandise that isnrsquot selling well in Dollarama stores to Dollar City
More Competition Coming To An Already-Crowded Space
24
Evidence Of Dollarama Store Growth Slowing
The pace with which Dollarama opened stores through the past several years does not appear to be sustainable
Importantly the inevitable reversal in its pacing appears to be occurring this year
The Company opened just eight stores in Q2rsquo19 its lowest store opening count in any quarter of any recent year
Its YTD FY 2019 pace of 18 new stores is also trailing the average pace of recent fiscal years (28 openings) by
~35 Management did not provide a fully satisfactory explanation for this deficit
The slowdown in its pace of store openings could suggest that the Company is having a difficult time identifying
economically-viable locations as it seeks to grow its store count by close to 50 ndash still a very distant target
Fiscal YearStated New
Store Opening Goal
Q1 Q2 First Half Q3 Q4 Total
2019 60-70 10 8 18
2018 60-70 13 17 30 10 25 65
2017 60-70 8 13 21 18 26 65
2016 None 17 17 34 16 25 75
Source Dollarama financial filings
ldquoI want to ask about the pace of store
openings As you noted the slower start to
the year you did maintain the guidance for
this year But wondering about sort of further
beyond that obviously the store potential that
you put out there gives you room to remain at
that pace for a while But does the slower
same store sales assumption change your
thinking about how aggressively you want
to push new stores out thererdquo
- Mark Petrie CIBC
ldquoNo it does not It does not And that I would
also add that if the pace at which weve been
opening stores this year is slower than last year
as mentioned often that just relates to the
specific timing of real estate And if stores are
pushed closer to the end of the year it could be
that there is an overlap between a few more
stores at the end of this year or a few more
stores in the beginning of next year and the
end it will keep our pace of 60 to 70rdquo
- Michael Ross CFO Dollarama
ldquoReal estate timing issuesrdquo
do a poor job of explaining a
drop in H1 new store
openings of over a third
Source Dollarama Q2 FY 2019 Earnings Call
25
Dollarama Potentially Pushing The Limits Of The Canadian Market
Managementrsquos stated goal is to have 1700 stores across Canada by 2027 up from 1178 stores today We do not
believe that it can achieve this without risking significant cannibalization DOLrsquos target would imply a saturation level
higher than the largest US dollar stores (Dollar Tree and Dollar General) which also sell many more consumables and
grocery items Additionally Canada broadly has much lower levels of retail space per capita than the US suggesting
that Canadian concentration is even more pronounced all else equal
US Retail Square Footage Greater Than Canadian
Retail Square Footage
DOLrsquos Target Implies
Greater Than US
Saturation Despite
Narrower Concept
Source Wellington Management
Walmart is not opening stores in Canada suggesting that it believes
the Canadian market is saturated at 114 stores per million people ndash
about 69 of its US concentration (164 stores per million people)
Meanwhile Dollarama continues to expand within Canada despite
even higher Canadian concentration (327 per mil) relative to the US
concentration of large US dollar stores (452 per mil for a 72
ratio) This ratio would be over 100 at DOLrsquos 1700 store target
Higher Canada store
count vis-agrave-vis
comparable US
store count
compared to Walmart
Higher Canada store
concentration vis-agrave-
vis comparable US
store concentration
than Walmart
Retailers with similar store concentrations per capita across both the US and
Canada are effectively more concentrated in Canada vis-agrave-vis the total retail space
in either country
Store Count by Region
Canada US CanUS Ratio
WMT 410 5358 77
DOL ndash Present 1178 14750 80
DOL ndash Future 1700 14750 115
Store Count per Million People by Region
Canada US CanUS Ratio
WMT 114 164 69
DOL ndash Present 327 452 72
DOL ndash Future 472 452 104
DOL CN DG DLTR
Stores 1700 14760 14732
Population (M) 36 326 326
StoresCapita (M) 472 453 452
26
Dollarama Has Benefited From A Benign Competitive Environment
Large competitors have been shuttering Canadian stores continuously through the last four years due to company-
specific issues highlighted by the high-profile exits of Target and Big Lots from Canada12 We believe that this has been
a significant tailwind for Dollarama but one that is largely behind the Company at this juncture
Dollarama has been able to maintain significant share high margins and high returns on capital in large part due to
missteps among peers and the resulting lax competition This is likely unsustainable in a more competitive environment
as Dollarama has few material competitive advantages barriers to entry are low and its discount retailing strategy is not
unique Competent competition from growing industry players ndash Dollar Tree Canada Miniso and Amazon among others
ndash could be the straw that breaks the camelrsquos back for Dollaramarsquos profitability or growth (or both)
Fiscal YearCompany Exiting
CanadaStores Closed Revenue
DOL Revenue Capture
(Estimated)
Estimated Revenue Benefit
Revenue Boost
2018 Sears 200 $2000 3 $60 2
2017 Sears 100 $1000 3 $30 1
2016 Target 133 $2000 6 $120 4
2015 Big Lots 78 $155 10 $16 1
Last Four Year Average $56 2
Note All numbers are SPCM estimates
1) ldquoTarget Canada to close all stores by April 12rdquo
2) ldquoBig Lots Getting Back Out of Canadardquo
27
Light Competition Has Allowed The Company To Spend Nothing On Promotion ndash Until Now
Dollarama has no promotional expense Meanwhile promotional expenses average 1-2 of revenue among US
peers As established competitors continue to expand and as new competitors enter the market (Amazon included)
Dollaramarsquos no-cost marketing strategy may prove untenable
Promotional Expense
as a of Revenue
Intensifying Competition Threatens Dollaramarsquos
Passive Marketing Strategy
2016 2017 2018
BIG 180 180 170
FIVE 264 270 243
DLTR 021 029 048
DG 062 054 044
Average 132 133 126Source Huffington Post
Source Investorscom
The Canadian operation is also a relatively small part of the business However early results are
encouraging and despite competition in the Canadian market Dollar Tree has found success Longer
term the company is aiming for 1000 stores north of the border which does not seem unrealistic
Source Retail Environments
Calls with people at Dollar Tree suggest that the Company is working to
imitate elements of Dollaramarsquos strategy and store layout in its own
Canadian stores (eg raised shelves etc) and that it plans to expand
into Canada aggressively once its strategy is refined ndash likely in 2019
Source Company financial filings
28
Caught Between The Competition How Will Dollarama Fit In
Dollar Tree has maintained its reputation as a true dollar store nothing is priced higher than C$125 ($1 in the US)
Miniso has developed a reputation as a ldquonicerrdquo discount retailer items can cost up to C$25 but the environment is cleaner and
more modern and products are of better quality (but you can still get a dollar-level deal ndash most products are priced under C$10)
Dollarama has all the character of an old tired dollar store but without the dollar prices
Who will shop there unless management invests in store updates rather than opening new stores
Value-driven customers are by definition not loyal customers
Miniso
Clean and modern but cheap
Dollar Tree
No need for price tags everythingrsquos $1 Dollarama
Looks like Dollar Tree priced like Miniso
Irsquoll pass
29
Dollarama Makes No Effort To Appeal Millennials ndashThe Next (And Current) Shopping Generation
Dollarama has zero social media presence unlike all of its peers Not only is the Company out of touch with customers in
an industry which demands a high level of customer engagement but its brand is becoming demonstrably stale
Facebook Twitter Instagram YouTube LinkedIn Pinterest Google+
Dollar Tree Yes Yes Yes Yes Yes Yes No
Dollar General Yes Yes Yes Yes Yes Yes Yes
Family Dollar Yes Yes Yes Yes Yes Yes No
Big Lots Yes Yes Yes Yes Yes No Yes
Miniso (Canada N America)
Yes Yes Yes Yes Yes No No
Great Canadian Dollar Store
Yes Yes No No No No No
Dollarama No No No No No No No
Until now Dollarama has largely been a regional brand with satisfactory name recognition in its provincial home of Quebec
Now that the Company is making a bigger push into Anglophone Canada management should be more proactive in adapting its
strategy to new markets and to a new customer base Yet management continues to employ a strategy more befitting a sleepy
regional business it does not market or work to improve its brand it does not stay current with trends it keeps management
within the family and it is not expanding its logistics chain to support coast-to-coast growth (see subsequent slides)
Management wants Dollarama to be a national brand but it does not appear prepared to run a national business
Questionable Accounting And Financial Practices
31
Hedging Instruments A Material Source Of Profits In Recent Years
Dollaramarsquos sales are in Canadian dollars whereas a majority of its product purchases are US dollar-linked Management claims to enter
into CADUSD hedging arrangements to lock in near-term margins without having to adjust prices in response to FX movements However
management has nonetheless admittedly adjusted prices alongside unhedged peers in response to shifts in the CADUSD exchange rate
rendering its currency hedges a source of profit
Forex dynamics through the last two years have erased the large hedge benefit realized by Dollarama in FY 2016 but management reports
that gross margins have effectively remained flat through this period implying significant gross margin improvement in the underlying
business (see graphs below) As the currency hedge benefit has reversed through the last two years underlying gross margins have
purportedly risen by EXACTLY ENOUGH to keep total gross margins steady between 39-40 We find this oddly convenient ndash or at the very
least we question whether management will be able to maintain steady margins in the face of unfavorable FX rate dynamics in the future
Quick turnaround in
underlying
profitability Just in
time to keep the
declining forex hedge
benefit from dragging
down marginshellip
Even as FX hedge gains fell
from close to 8 of gross profit
in FY 2016 to a drag on gross
profit in FY 2018 gross margin
expanded by over 100 bps over
the same period implying gross
margin expansion ex-forex of
almost 300 bps within two years
for a retailer with gross margins
which were already unusually
high and whose margins had
contracted for four straight
years before the rapid reversal
32
Questionable Depreciation Assumptions
Dollarama changed its depreciation schedule for leasehold improvements (store fixtures) in FY 2015 moving from a 10-year to a 15-
year expected life1 However management did not concurrently lengthen the amortization schedule for tenant inducements
We find this mismatch curious as both quantities should be amortized depreciated over the expected life of a given lease
Adding to the confusion and appearance of foul play DOL discloses in its AIF that its average lease term is just 5 yrs and it just
started disclosing related-party dealing with Director Huw Thomas of SmartCentres ndash a REIT that lists DOL as a top 10 customer23
Lease term implied
by leasehold
depreciation expense
2-3x greater than that
implied by
amortization of
tenant allowance
Mismatch in implied
lease term
inappropriately
inflates EBIT
C$ MillionsFY
2013FY
2014FY
2015FY
2016FY
2017FY
2018
Amortization of Tenant Allowance $29 $35 $43 $49 $48 $51
Starting Balance Sheet Amount 168 207 232 280 344 386
Amortization as a of Asset Amount 173 169 185 175 140 132
Implied Lease Term 58 59 54 57 72 76
Leasehold Depreciation Expense $129 $166 $108 $141 $172 $202
Starting Balance Sheet Amount 1182 1348 1762 2113 2499 2867
Depreciation as a of Asset Amount 109 123 61 67 69 70
Implied Lease Term 92 81 163 150 145 142
Tenant Allowance Amortization Using Leasehold Depreciation Schedule
183 255 142 189 237 272
Reduction In EBIT If Both Were Put On Same Schedule (11) (10) (29) (30) (24) (24)
While the financial impact of this adjustment is limited signs of accounting impropriety do not reflect well on management and cast
doubt on the rest of Dollaramarsquos reports and accounting practices
1) FY 2015 Annual Report p 15 DOL also extended its store and warehouse equipment useful lives from 8-10yrs to 10-15yrs The total reduction of these three items was decrease of $10m in
FY15 depreciation expense
2) DOL states in its AIF p 11 ldquoThe Corporation typically enters into leases with base terms of ten years and options to renew for one or more periods of five years each The average time to
expiration of the Corporationrsquos leases is approximately five yearsrdquo
3) See governance slide on Huw Thomas
33
Capital Spending And Distribution Of Cash To Shareholders Are Overextending The Business
What happened
Management claimed in 2011 that the business was sufficiently cash-generative to support growth and dividendsshare buybacks
and that it would be able to pay down debt while pursuing both However debt has ballooned since then with net debt rising 8x
(and close to 3x versus EBITDA growth) Management is effectively levering up the balance sheet to support dividends and share
buybacks with CFO Michael Ross stating that he will continue to repurchase shares as long as the earnings yield remains above
the after-tax cost of debt
ldquoFor the past few years our cash flow has enabled
us to continue to pursue our growth plans and
continue to pay down debt Our free cash flow is
now sufficient to fund both those priorities
while enhancing new to shareholders through
a quarterly dividend payment We are able to
generate the free cash flow to do all of this
because we employ a simple growth oriented
business model at Dollaramardquo
ndash June 2011 Conference Call
Should Dollaramarsquos struggles become more pronounced ndash or should the
economic cycle turn for the worse ndash this debt overhang could loom large over
the business
Dollarama also consistently spends more on capex (as a percentage of sales) than its peers in the discount retail industry and
shows abnormally high capex versus depreciation and amortization We understand that Dollarama is a growing business which
could explain both patterns in part but it is not the only discount retailer which is investing in store growth
Dollarama DampA consistently
lt50 of capex and a lower
percentage of capex than
industry peers
Dollarama consistently
spends more on capex
(as a percentage of sales) than industry peers
00
05
10
15
20
25
0
200
400
600
800
1000
1200
1400
1600
1800
FY2012
FY2013
FY2014
FY2015
FY2016
FY2017
FY2018
Ne
t D
eb
tEB
ITD
A
Ne
t D
eb
t ($
C M
M)
Net DebtEBITDA Net Debt
0
50
100
150
200
250
300
FY2010 FY2011 FY2012 FY2013 FY2014 FY2015 FY2016 FY2017 FY2018
DampA as a of Capex and Intangibles Annual
DOL DLTR DG BIG FRED
0
1
2
3
4
5
6
7
8
FY2010 FY2011 FY2012 FY2013 FY2014 FY2015 FY2016 FY2017 FY2018
Capex and Intangibles as a of Sales Annual
DOL DLTR DG BIG FRED
34
Where Is The Capex Going
Management has explicitly identified and discussed various capital expenditures in Company filings over the last
five years but this still leaves a large gap versus what was actually spent
Additionally there is a large gap between the amount spent on software development and the amortization expense
associated with this activity suggesting that earnings may be inflated
Some of this is
directed towards
leasehold
improvements etc
but with
managementrsquos
focus on expansion
over existing store
improvements we
question where
management is
directing this capex
Capital Spending Software
on Software Amortization Difference
FY 2018 191 126 65
FY 2017 126 96 3
FY 2016 111 78 33
FY 2015 108 56 52
FY 2014 98 34 64
Are earnings
inflated due to
insufficient
amortization
Note also that a LinkedIn search for software developers at Dollarama turned up effectively nothing ndash at best one person with a tangentially
relevant title (source) So where is the software development capex going
Unlike discount retailer peers Dollarama
did not include software-related
spending in capex until recently and
records it separately in
ldquoAdditions to intangible assetsrdquo1
Do they do this to artificially deflate their
headline capex figure thereby inflating
reported free cash flow
Undiscussed Capital Spending (FY 2014 ndash 2018)
C$ Millions
$500K in capex spent per new store (375 new stores over past five years Source AIF) $1875
Capex spent on construction of 500K sqft warehouse in Montreal 679
$82M spent annually on expansion renovation or relocation of stores over five years 410
$232M spent on land acquisition 232
Discussed Capex Over Past Five Years $3196
Total Reported Capex (ex intangibles) $5200
Undiscussed Capex $2004
Software Capex and Software Amortization Discrepancy
C$ MillionsCapital Spending on
SoftwareSoftware Amortization Ratio
FY 2018 $191 $126 152
FY 2017 126 96 131
FY 2016 111 78 116
FY 2015 108 56 193
FY 2014 98 34 288
1) DOL explicitly started calling out software as a component of capex in Q3rsquo16 with the addition of footnote to guidance
35
Lack Of Transparency Regarding Store Closures And Associated Costs
It is standard industry practice to report store closures remodels and relocations alongside new store openings
However Dollarama reports only ldquoNet New Storesrdquo and does not break this number out in detail Questioned on this
in Q4 2016 management answered that a larger store base would inevitably result in more closures for reasons
outside of its control (fires mall renovations etc) and that reporting closures would therefore not communicate
meaningful information regarding the underlying performance of the business
We strongly disagree store closure information is vital to evaluating the health of a retail chain Management can
provide color on particular closures if it feels that they have been done for reasons other than performance but
failing to report closures entirely hides a key operating statistic from investors
Company Store Movement 2012 2013 2014 2015 2016 2017 2018
DLTR
Beginning 4101 4351 4671 4992 5367 13851 14334OpenedAcquired 278 345 343 391 8850 584 603
Closed 28 25 22 16 366 101 102Closed as of Beginning 07 06 05 03 68 07 07
BIG
Beginning 1398 1533 1495 1493 1460 1449 1432Opened 181 87 55 24 9 9 24Closed 46 46 58 57 20 26 40
Closed as of Beginning 33 30 39 38 14 18 28
DG
Beginning 9372 9937 10506 11132 11789 12483 13320Opened 625 625 650 700 730 900 1315Closed 60 56 24 43 36 63 101
Closed as of Beginning 06 06 02 04 03 05 08
FDO
Beginning 7023 7442 7916 -- -- -- --Opened 475 500 526 -- -- -- --Closed 56 26 400 -- -- -- --
Closed as of Beginning 08 03 51 -- -- -- --Overall Industry Average 09 07 20 07 23 07 08
Other high-growth dollar
stores like Dollar Tree and
Dollar General report store
closures ndash why doesnrsquot
Dollarama
Store closures for whatever
the reasons incur real
restructuring and other
costs Peer retailers
generally give detail on these
expenses whereas
Dollarama does not
We believe that Dollarama
should follow industry norms
and increase transparency
regarding store closures
US Dollar Store peers historically close 08 of stores annually yet Dollarama has not reported any recent closures
36
SSS Metrics Obfuscate Store Performance
Dollaramarsquos official ldquoComparable Store Salesrdquo figure includes ldquorelocated and expandedrdquo stores as ldquocomparable storesrdquo
therefore picking up growth in traffic which can be attributed to relocation-related improvements We believe that this likely
overstates Comparable Store Sales growth while also ignoring associated relocation-related expenses
1) See Q1 FY 2014 earnings call transcript
Management not only hides store closure data as a supposedly uninformative statistic but proclaims that it has NEVER closed a
store due to poor performance1 We find it difficult to believe that a retailer which has existed in its current format since 1992 has
never needed to close a store for poor performance If it has indeed never closed an underperforming store we wonder whether
management has been too ambitious in growing its store base without critically evaluating the profitability of each location
Huntsville Place Mall Jul 2015
7 John St Oct 2012
7 John St Jul 2015
Huntsville Place Mall Oct 2012
Huntsville ON
Relocation
Are these really entirely
ldquocomparablerdquo locations
781 Rue Principale Est May 2016
781 Rue Principale Est Jun 2009Le Carrefour Ste Agathe
May 2016
Ste-Agathe-Des-Monts QC
Relocation
Why assume the costs to
make this lt1 mile move
Notice
Dollarama
sign turned
inside-out
indicating
closure
37
Cash Flow Beginning To Turn Over Despite Efforts To Bolster Results
In H1 FY 2019 Dollaramarsquos cash flow contracted on a year-over-year basis for the first time since it went public ndash this
despite managementrsquos efforts to bolster earnings and EBITDA The contraction appears to be due in large part to
changes in working capital In particular we are concerned that growth in inventories suggests that management
overestimated near-to-medium term sales growth and that declining traffic is starting to weigh on the Company
Dollarama H1 Operating Cash Flow
C$ Millions FY 2014 FY 2015 FY 2016 FY 2017 FY 2018 FY 2019
Net Income $1054 $1221 $1603 $1895 $2265 $2433
CFO Before Working Capital 1394 1488 2124 2156 2769 2999
Changes in Working Capital (287) (236) (870) (110) (126) (886)
Net CFO 1107 1252 1253 2045 2644 2113
YoY Change $326 $322 $01 $792 $599 (531)
Source Dollarama
Governance Concerns
39
Related-Party Transactions With Rossy Family Raise Questions Over Governance And Costs
Fiscal YearRent amp Land Purchases
Paid to Rossys(C$ MM)
As a of Compensation Paid to Rossy Family
FY 2019 (To Date) $394 NA
FY 2018 184 1660
FY 2017 402 4459
FY 2016 179 1305
FY 2015 169 2752
FY 2014 163 1903
As noted Dollarama leases all but one of its five warehouses from the Rossy family and recently purchased land from the Rossys
for the construction of a sixth Management also recently purchased its Montreal distribution center from the Rossy family which
leased the facility to Dollarama until this February We understand that the Rossy family has close historical ties to the business
but this level of close dealing draws our attention particularly given the fact that management has focused on fortifying its
existing distribution footprint ndash closely tied to the Rossy family ndash rather than invest in distribution facilities in western Canada
where major competitors already have distribution centers
DLTR
Distribution
Center
Delta BC
DLTR
Distribution
Center
Mississauga ON
DOL
Distribution
Center
DOL
Warehouses
No Dollarama distribution facilities
located outside of a ~4 mile radius in
Montreal
bull Due to preferential relationship with
Rossy family
bull Will Dollarama be able to expand into
AngloWestern Canada efficiently
without logistics costs ballooning
bull Overly-exposed to fuel price hikes
and rising transportation costs
Related-Party Transactions Significant And Growing
Source Dollarama Financials
Dollar Tree Canada Distribution Centers
Dollarama Distribution Centers And Warehouses
Source DollarTree
Montreal QC
40
Related-Party Transactions With ldquoIndependentrdquo Director Huw Thomas Only Recently Disclosedhellip
Dollarama also leases stores from SmartCentres REIT whose recently-departed CEO Huw Thomas joined Dollaramarsquos
Board of Directors in 2011 and was a member of its audit committee through March 2017
His ldquoindependencerdquo was recently defended by a meandering 260-word footnote in Dollaramarsquos proxy which belies the
fact that Dollarama is a top 10 customer of SmartCentres
This is all the more suspicious in light of Dollaramarsquos questionable lease accounting highlighted earlier
Source Dollarama 2018 Proxy Circular
Note Dollarama did not start disclosing Huwrsquos related-party dealing until the 2017 proxy
circular in June 2017 right after he left the Audit Committee in March 2017
SmartCentres 2017 Annual Report
Dollarama Material To SmartCentres ndash A Top 10 Customer
SmartCentres Promotes Dollarama Relationship From 2011
Calloway (now SmartCentres) 2012 Annual Report
Dollaramarsquos Lengthy Meandering Defense Of Thomas
Huw As Independent Only Recently Disclosed (2017)
Dollarama Recently Changed Rent Expense Disclosure
Source Dollarama Q4rsquo17 Financials Note 15 Related Party Disclosure
Source Dollarama Q2rsquo18 Financials Note 13 Related Party Disclosure
41
House of Windsor House of RossyA Case Study In Nepotism
Neil Rossy had been the Senior VP of Merchandising Chief Merchandising Officer for 25 years prior to being named CEO in
2016 While his family is still a large shareholder they are not a controlling shareholder owning around 5 of the shares
outstanding We question whether the Rossyrsquos century-long family tradition of passing down leadership ndash one which also
persists at the Rossyrsquos ldquosister storerdquo ndash is appropriate for a public company or wise for the long-term health of the business
Salim Rossy
Opened first ldquoS Rossyrdquo
store in 1910 (up-market
department store concept)
George Rossy
President of S Rossy
1937-1973
Larry Rossy
Grew S Rossy from 20 to 44 stores before
converting all S Rossy stores to new
ldquoDollaramardquo concept in 1992 Sold majority
stake to Bain Capital in 2004 IPO in 2009
Neil Rossy
CEO of Dollarama as of 2016
Michael Rossy
Brother of George (one of ten siblings)
Founder amp CEO of ldquoRossyrdquo stores 1949-2010
Michael DiTullio
Son-in-Law of Michael
President amp CEO of Rossy since 2010
Does (or will) the family have a hard time parting with a business that has been in the family for four generations even if parting ways is
the right thing to do
Managing retail chains is very
much a family affair for the
Rossys ndash at both stores
Perhaps Neil was going to be
anointed CEO of Dollarama
regardless of the caliber of other
potential candidates
Letrsquos hope hersquos not Commodus
BONUS
Brother branches out
with separate storehellip
42
Insiders Incentivized To Grow EBITDA
Our earlier concerns about EBITDA quality are amplified by the fact that Dollarama executives are compensated
based on seemingly arbitrary and inflated EBITDA targets This gives management a strong incentive to be inefficient
users of capital as any dollar shifted from operating expense to capex has a direct benefit to key executives
For example note that managementrsquos perhaps questionable decision to purchase one of its Montreal warehouses
will shift what was until recently rent expense into depreciation This change in the accounting treatment of
Dollaramarsquos tenancy costs will provide a windfall to EBITDA potentially boosting management bonuses
Source Dollarama Proxy Circular p 30
43
What Is A Stretch EBITDA Goal
Bonuses are paid upon achievement of 11 EBITDA growth This level was ldquodesigned to be a stretch objectivehellip
attainable only with significant effortrdquo However this target was reset lower after FY 2014 ndash the only year during which
management did not handily exceed the target We believe this further calls into question the independence of the
board and its compensation committee
Year EBITDA Growth Objective EBITDA Growth Achieved
FY 2018 11 18
FY 2017 11 18
FY 2016 11 30
FY 2015 11 15
FY 2014 13 12
FY 2013 13 22
FY 2012 13 26
FY 2014 Management
misses growth objective
FY 2015 Growth objective
adjusted downwards
ldquoThe thresholds were revised by the
Human Resources and Compensation
Committee in the context of its annual
executive compensation review
conducted at the beginning of each fiscal
year to take into account among other
elements the fact that the base for the
calculation is growing every yearrdquo
Source FY15 Management Proxy Circular
What ldquoother elementsrdquo were
taken into account
Source Dollarama
44
Insiders Selling While Company Buys Back Stock At Elevated Prices
Management has been buying back shares at elevated prices through the last several years even while pursuing growth leaving little capital for
(sorely needed) store updates or other uses The average repurchase price since Q1 FY17 is about on par with current share prices and ~40
below our target Since Q2 FY18 the average buyback price has been 25 above current levels
Furthermore just as the Company has been buying back stock at elevated prices insiders have been offloading shares Notably it is evident
from past and current proxy statements that CFO Michael Ross has never held onto shares for which he has been granted options his
common equity ownership is listed at zero every year Note that as the CFO it is he who is dictating the share buyback decision in large part
PeriodShares
Repurchased
Value of Repurchase
(C$ M)
Average Price (Split-
Adj) (C$)
Q1 FY 2017 1542066 1393 3011
Q2 FY 2017 2027080 1842 3029
Q3 FY 2017 1571500 1578 3347
Q4 FY 2017 2279522 2241 3277
Q1 FY 2018 1687240 1806 3568
Q2 FY 2018 1303900 1602 4095
Q3 FY 2018 687700 931 4513
Q4 FY 2018 2425700 3788 5205
Q1 FY 2019 94500 145 5115
Q2 FY 20191 1347341 700 5195
Total 14966549 16026 3797
Discount to Current Share Price 1
Total (Since Q2 FY 2018)
5859141 7170 4815
Discount to Current Share Price -20
Using Company Funds To Overpay For DOL Shareshellip While Insiders Sell Into The Companyrsquos Bidhellip
Source DOL filings and Bloomberg
Insider Title Date Sold SharesProceeds (C$ M)
Price Sold (Split-Adj)(C$)
Nicolas Hien Senior Vice President 482016 6203 06 3224
Michael Ross CFO 482016 80000 74 3083
Paul Roche Vice President 4182016 10000 09 3000
Geoffrey Robillard Senior Vice President 6172016 33500 31 3085
John Assaly Vice President 9272016 30000 30 3333
Geoffrey Robillard Senior Vice President 472017 20000 23 3833
Paul Roche Vice President 472017 23100 26 3752
Josee Kouri Corporate Secretary 4142017 8000 09 3750
Geoffrey Robillard Senior Vice President 9142017 5000 07 4667
Geoffrey Robillard Senior Vice President 12112017 10000 16 5333
John Assaly Vice President 12132017 14096 22 5202
Geoffrey Robillard Senior Vice President 1262018 15000 24 5333
John Thomas Independent Director 1262018 6000 10 5556
Geoffrey Robillard Senior Vice President 6152018 50000 75 5000
John Assaly Vice President 6192018 13404 21 5222
Nicolas Hein Senior Vice President 6222018 36750 19 5170
Paul Roche Vice President 6222018 24000 13 5417
We do not like the fact that insiders have been selling into share buybacks while
the Company levers itself up with short-term debt to support those repurchases
It appears that the execs are levering up the business in part to enrich themselves1) All share information prior to Q2 lsquo19 reflects pre-split data except
Split-Adjusted Average Prices Q2 lsquo19 repurchases were as stated
45
Rossy Family Selling Shares Despite Control Over C-Suite
Notably Founder and former CEO Larry Rossy has trimmed his position tremendously through the last several years
Though this is to be expected to some extent as he recently ceded control of the business we believe that his
ownership stake should be held to a higher standard given his insistence on keeping the business in the family
If he plans to keep the c-suite under a Rossy dynasty the familyrsquos personal stake in the business should reflect that
Source Bloomberg
Valuation And Price Target
47
The Market Has Not Taken Threats To Dollarama Seriously ndash But Optimism Is Ebbing
Analysts are generally bullish on the stock focusing primarily on managementrsquos growth story and taking current
profitability levels for granted The prospect of new competitive threats to a business which has until now seen limited
competition ndash and the risk that prevailing margins are unsustainable even through the near term ndash go underappreciated
Dollaramarsquos poor Q2 cooled analystsrsquo optimism to some extent but we believe that the reaction was largely reactive and
superficial as they adjusted their price targets in such a way that in aggregate they saw exactly the same upside after the
post-Q2 dip as they did before The market still does not fully appreciate the magnitude of the threats facing Dollarama
All price targets in C$ Before Q2 Release After Q2 Release
Firm Recommendation Target PriceUpside (on 82818) Recommendation Target Price
Upside (on 9172018)
Upside (Present)
RBC Capital Markets Outperform $5500 12 Outperform $5200 22 35
Raymond James Outperform $5567 13 Outperform $5000 17 30
Macquarie Outperform $5633 14 Outperform $4900 15 27
BMO Capital Markets Outperform $6100 24 Market Perform $4700 10 22
CIBC Capital Markets Outperform $5900 20 Neutral $4600 8 20
Desjardins Securities Buy $5800 18 Hold $4500 6 17
Veritas Investment Research Co Buy $5600 14 Buy $4800 13 25
Industrial Alliance Securities Hold $5450 11 Buy $5450 28 42
Canaccord Genuity Buy $5900 20 Buy $5500 29 43
Barclays Equal Weight $5200 5 Equal Weight $4400 3 14
TD Securities Buy $5900 20 Hold $4900 15 27
Accountability Research Corp Buy $5400 10 Buy $5000 17 30
National Bank Financial Outperform $5567 13 Sector Perform $4800 13 25
Scotia Capital Sector Outperform $5567 13 Sector Outperform $5050 19 31
Wells Fargo Securities Market Perform $5300 7 Market Perform $4000 -6 4
AVERAGE $5626 14 $4853 14 26
While analysts are still not sufficiently critical of Dollarama the more recent downward move in the stock and subsequent analyst
downgrades may suggest that the market could be primed to evaluate the Company and its growth story with a more discerning eye
We believe that the issues which we highlight in this report will provoke further professional skepticism among analysts and investors
48
Dollarama Not Priced To Perfection ndashPriced Beyond Perfection
We can get close to DOLrsquos current valuation only if we value it as a mature ex-growth business today under
managementrsquos lofty goals for the business for ten years into the future applying no discounts for time
business risk etc
Managementrsquos ten-year store target
bull Current store count 1178 (70 of long-
term target)
Even if Dollarama were a mature business today under managementrsquos long-term targets for the business
DOL stock would not have no upside to current share prices
The market is pricing DOL beyond perfection ndash a valuation this lofty cannot be justified today
Mature Business ValuationC$ MM unless noted
Stores 1700
Revenue per Store $32
Total Revenue $5440
Operating Margin 220
Operating Profit $1197
Interest Expense $50
Tax (275) $315
Net Income $831
Diluted Shares Outstanding 332
EPS $251
PE Multiple 152x
Target Price $3815
Upside -1
Average operating margin since Q1 FY 2016
bull Assumes that DOLrsquos unusually high
margins are sustainable despite
intensifying competition loss of recent FX
benefit and customer pushback against
price hikes
Mature revenue per store estimate
bull Current average revenue per store
~$28M (875 of long-term target)
Industry median NTM PE multiple
bull Assigns no discount to DOL due to
declining store traffic vs peers incoming
competitive threats inefficient distribution
network etc
49
Dollarama Not Priced To Perfection ndashPriced Beyond Perfection (Continued)
Put another way The market is implicitly taking it for
granted that Dollarama will achieve its lofty ten-year
growth targets assuming sustained profitability levels
and per-store efficiency ndash and applying close to the
industry median FY1 EVEBITDA multiple to Dollaramarsquos
FY 2027 EBITDA
Just under ten-
year target
What kind of growth is the market implicitly betting on if
we value Dollarama on par with peers
bull 150 more stores than managementrsquos ten-year target ndash
within nine years
bull 48 CAGR in revenue per store
bull Zero margin compression
FY 2027 Estimates if Management Executes Growth Plans Perfectly
(C$ MM unless noted)
Stores (Year-End) 1688
Revenue per Store $33
Total Revenue $5503
Gross Margin 380
Gross Profit $2093
SGampA per Store 04
SGampA Total 689
EBITDA (FY 2027) $1404
Market Cap 12752
Debt 1880
Cash 182
Enterprise Value $14450
EVEBITDA (FY 2027) 103x
Industry Median EVEBITDA (FY1) 110x
Average gross
margin ex-
hedge gains
since FY 2016
Mature revenue
per store
estimate (15
growth CAGR)
FY 2018 SGampA
per Store
Implied FY 2027
multiple close to
industry median FY1
multiple
FY 2027 Estimates To Justify Prevailing Valuation (C$ MM unless noted)
Stores (Year-End) 1858
Revenue per Store $44
Total Revenue $7929
Gross Margin 380
Gross Profit $3016
SGampA per Store 04
SGampA Total 755
EBITDA (FY 2027) $2261
EVEBITDA (FY 2027) 62x
Enterprise Value 13947
Debt 1880
Cash 182
Equity Valuation $12249
Diluted Shares Outstanding 332
Target Price $3693
Current Price $3845
158 over ten-
year target in
nine years
48 growth
CAGR in
SalesStore
Industry median
FY1 multiple
discounted
75 annually
Average gross
margin ex-
hedge gains
since FY 2016
FY 2018 SGampA
per Store
High forecast gives
us 4 DOWNSIDE
50
Valuation Far Out Of Line With Peers And Historical Multiples
DOL shares trade at a 50-60 premium to peers in the discount retail industry The market is valuing DOL much more like a high-
growth tech company than a brick-and-mortar dollar store (and one with concerning fundamental trends at that) Note that this still
holds true even after DOL shares traded down significantly following its recent Q2 earnings report
It is difficult to justify a valuation this high even if one is bullish on DOL vis-agrave-vis the rest of the industry
Company Ticker
3-Year Consensus Revenue
CAGR
FY 2018 EBITDA Margin
PE(NTM)
PE(FY2)
EVEBITDA(NTM)
EVEBITDA(FY2)
EVSales(NTM)
Dollar Tree DLTR 43 121 139x 134x 91x 88x 10x
Dollar General DG 75 104 163x 162x 112x 112x 12x
Big Lots BIG 06 85 87x 87x 52x 53x 04x
Five Below FIVE 210 162 360x 412x 2113x 243x 32x
Canadian Tire CTC CN 20 90 179x 181x 82x 83x 10x
Metro MRU CN 80 73 142x 139x 99x 101x 08x
MEDIAN 59 97 152x 151x 95x 110x 10x
Dollarama DOL CN 85 255 229x 223x 164x 163x 41x
DOL PREMIUM 505 477 727 509 3057
Does DOL ndash a value retailer
demonstrating concerning
fundamental trends ndash deserve
to be valued on par with
higher-growth industries and
completely out of line with its
industry peers
Profitability is impressive but
likely unsustainable in the face
of growing competition
Enterprise Value Revenues Enterprise Value Adj EBITDA Price Adj EPSDOL shares also trade at
a significant premium to
historical multiples
despite unsustainable
margins an increasingly
saturated market and
rising competitive
threats
51
Does The Market Think Dollarama Is A Dollar Store Or A Premium Retail Brand
Dollarama is valued much more closely to premium retail brands than its discount retail peer group
A bull might ldquojustifyrdquo this by pointing to Dollaramarsquos profitability profile and growth expectations but its EBITDA margins are so
out of line with those of its peers that one is forced to question whether they are sustainable (at best) or honest (at worst)
As discussed Dollaramarsquos consensus sales growth numbers also ignore looming fundamental threats to the business
Company TickerGross
Margin (NTM)
EBITDA Margin (NTM)
Sales Growth (NTM)
EVEBITDA(NTM)
PE(NTM)
EVSales(NTM)
Dollar Tree DLTR 31 11 28 91x 139x 10x
Dollar General DG 31 10 89 112x 163x 12x
Big Lots BIG 41 7 -08 52x 87x 04x
Five Below FIVE 36 15 203 2113x 360x 32x
Canadian Tire CTC CN 34 12 40 82x 179x 10x
Metro MRU CN 19 7 88 99x 142x 08x
MEDIAN 33 11 64 95x 152x 10x
Dollarama DOL CN 40 25 99 164x 229x 41x
DOL PREMIUM 727 505 3057
How does Dollarama support EBITDA
margins more than double those of its
peer group and in line with premium
global retail brands
Company TickerGross
Margin (NTM)
EBITDA Margin (NTM)
Sales Growth (NTM)
EVEBITDA (NTM)
PE (NTM)EVSales
(NTM)
Ferragamo SFER IM 65 17 48 160x 260x 26x
Hermes RMS FP 69 38 84 200x 350x 78x
Prada 1913 HK 74 22 78 100x 210x 23x
Tiffany amp Co TIF 64 24 51 113x 196x 28x
MEDIAN 67 23 65 137x 235x 27x
Dollarama DOL CN 40 25 99 164x 229x 41x
DOL PREMIUM 197 -26 519
Does a discount retailer facing
fundamental headwinds deserve to be
priced 50 or more above its peer
group and closer to global
premium retail brands
52
Margins And Multiples Materially Out-of-Line With Peers
We do not believe that Dollaramarsquos profitability levels ndash which are entirely out of line with peers ndash are justified or sustainable in an
industry as competitive as deep discount retail The Company is already struggling to meet store count growth targets raising the
likelihood that its store growth plan will be dilutive to margins The market assigns a premium valuation to Dollarama on the basis
of relatively high growth expectations and the Companyrsquos industry-leading margins However as discussed throughout this
report we doubt both managementrsquos ability to meet its growth targets and its ability to maintain prevailing profitability levels The
likelihood that the Company will be able to achieve BOTH of these goals simultaneously is even slimmer Accordingly we believe
that the basis for Dollaramarsquos substantial share price premium is unfounded
Dollaramarsquos margin profile is grossly out of
line with peers and we find evidence of
aggressive accounting and questionable
business practices that can partly explain the
issue We doubt that this would be sustainable
even if management wasnrsquot growing the chain
How will a lowno-moat business with falling
per-store traffic be able to maintain its
remarkable profitability advantage while
aggressively expanding its store base
DLTRDG
BIG
FIVE
CTCCN
MRUCNWNCN
DOLCN
0
5
10
15
20
25
30
10 15 20 25 30 35 40 45 50
EBIT
DA
Mar
gin
Gross Margin
Dollarama Margins Completely Out Of Line With Peers
The premium in Dollaramarsquos share
price is driven by the marketrsquos trust in
managementrsquos growth initiatives and
its recognition of the Companyrsquos
dominant profitability
However neither its profitability
advantage nor its growth prospects
are sustainable The likelihood that
management simultaneously
preserves BOTH is extremely low
Big Lots (BIG) Dollar Tree (DLTR) Dollar General (DG) Metro Inc (MRU CN) and Canadian Tire (CTC CN)
x
5x
10x
15x
20x
25x
BIG DLTR MRU CN DG CTC CN DOL CN
PE (NTM)
x
4x
8x
12x
16x
20x
BIG DLTR MRU CN DG CTC CN DOL CN
EVEBITDA
53
Valuing DOL As A Mature Business In The Canadian Market ~40 Downside
C$ MM unlessotherwise noted
Current Run-Rate Valuation
Priced Beyond Perfection
Reasonable Downside
Stores 1170 1700 1500
RevenuesStore 28 32 30
Revenues 3320 5440 4500
Operating Margin 23 22 18
Operating Profit 764 1197 801
Interest Expense 42 50 50
Tax 275 198 315 207
Net Income 523 831 544
Shares 332 332 332
EPS $158 $251 $164
Multiple 24x 16x ~15x
Share Price $3845 $3966 $2460
Upside (Downside) 3 Approx -40
As discussed earlier at 1700 stores DOL would have greater penetration than both Dollar General (DG) and Dollar Tree (DLTR)
which both offer a much broader assortment of goods including perishablesconsumables Meanwhile the US appears to be
overstored versus Canada It is likely unreasonable for DOL to target per capita penetration levels on par with its US peers
Even if we assume that DOL can reach similar penetration levels and match company
growth targets ndash with steady margins no less ndash DOL has little upside
Valuing DOL as a mature business at its upper penetration bound implies ~40 downside
in a more realistic yet still generous scenario in which DOL is valued in line with peers
Higher Canada
store count vis-agrave-
vis comparable US
store count
compared to
Walmart
Higher Canada
store concentration
vis-agrave-vis
comparable US
store concentration
than Walmart
Achieving
managementrsquos
1700 store target
would put DOL at a
higher per capita
penetration level
than US peers
Store Count by Region
Canada US CanUS Ratio
WMT 410 5358 77DOL ndash Present 1178 14750 80DOL ndash Future 1700 14750 115
DOL CN DG DLTR
Stores 1700 14760 14732
Population (M) 36 326 326
StoresCapita (M) 472 453 452
Downside Run-Rate Operating Margin Estimate
ProfitabilityCost Measure JustificationGross Margin Target Recent Historical Average 370
Current SGampA Recent Historical Average 167
Add
Advertising Expense Normalization
Industry Average05
Rent Expense NormalizationAdjusting for Depreciation Rearranged
from Rent Expense 05
Depreciation Catch-Up Matching DampA schedules 15
Pro Forma SGampA 192
Pro Forma Operating Margin 178
Store Count per Mil People by Region
Canada US CanUS Ratio
WMT 114 164 69DOL ndash Present 327 452 72DOL ndash Future 472 452 104

14
Increasing Average Unit Revenues Is A Very Risky Strategy That Has Failed Before
Raising price points to prop up SSS growth against falling store traffic is a major risk for discount retailers as their
entire value proposition comes from their low prices Higher prices may turn off customers and create difficult
comps in the event that price increases must be paused or reversed due to customer pushback
In 2006 for example Big Lots ndash a US discount retailer ndash introduced higher-ticket brand-name items in place of
comparable budget goods in an effort to get customers to spend more per visit This strategy reinvigorated same-
store sales growth for a time but ultimately failed Subsequent difficult comps resulted in negative SSS growth after
management abandoned its so-called ldquoRaise the Ringrdquo strategy
Raise the Ring is
abandoned lower price
points are emphasized
Raise the Ring is
introduced higher priced
items are emphasized
Big Lots alienated shoppers who were
seeking cut-price name-brand goods after
venturing into other areas
like selling frozen food
ldquoOur customer doesnrsquot come to us expecting a
Nordstromrsquos level of in-store shopping
experience They want value treasures
merchandise on the floor and clean restrooms
and we need to meet those expectationsrdquo
[CEO Steve] Fishman said in 2005
hellip
ldquoWersquore an enigmardquo he said at an investor
conference this month ldquoItrsquos been a real
challenge for the marketplacerdquo Source
Calls with industry experts indicate that Dollarama is losing more price-conscious customers to Dollar Tree and other discount retailers
following its efforts to raise prices and that this is a major driver behind recent per-store traffic declines
If price-conscious customers arenrsquot interested in shopping at Dollarama we wonder who ishellip
15
ldquoNothingForADollaramardquo Customers Becoming Conscious Of Price Increases Versus Competitors
Dollaramarsquos price increases may not yet put its prices on par with those of big box retailers like Walmart but
customers have taken notice that Dollarama has increased prices against other Canadian dollar stores Comments
from various internet forums and news sites reveal that customers no longer believe that Dollarama offers as much
value as do other discount retailers suggesting that the strength of Dollaramarsquos value proposition ndash the source of
its appeal and foundation of its business model ndash is at risk The below comments are anecdotal but comments of
this sort regarding Dollarama in particular are nonetheless common among relevant websites
ldquoThe dollar store is no longer a bargain if you
shop around you can by the same things
cheaper or same price elsewhere quit
calling it dollarama no more dollar thingsrdquo
Source
ldquodollar tree here is drastically cheaper then
dollarammardquo ndash Cody Williams
ldquoCody Williams Same here Dollarama is not
really a dollar store anymorerdquo ndash JJ Walker
Source
ldquoI enjoyed the days when everything in Rama
actually was a dollar I go to Dollar Tree
more often now just because everything
there is $125 - ($1 in the US of course)rdquo
Source
ldquoTheir high prices is the problem they still
have better selection than Dollar Tree but
their prices are always higher I know some
dollar store shoppers who go to Dollar
Tree first for the better prices and then go
to Dollarama for the stuff they couldnt
find at Dollar Tree Myself personally have
watched the prices creep up A pair of work
gloves climbed from $250 to 4 or 5 bucks
the discount over Home Depot is only a
buck or two now Also Dollar Tree still
keeps all items under 2 bucks I believerdquo
Source
ldquoThey gonna have to change the Dollarama
name soonrdquo
ldquodollarandaquarterramardquo
ldquoNew Name NothingForaDollarrdquo
ldquoYou forgot lsquoramarsquo NothingForADollaramardquo
ldquoAs for a new name how about
FiveFinaramardquo
ldquofive or lessarmardquo
Source
ldquoDollarRama is no longer in the same
category since they sell at higher prices
more of a discounted store and not a dollar
storerdquo
Source
Just did a quick check of my cleaning cupboard
DT=Dollar Tree DM=Dollarama
- 284L bleach $125 at DT Sometimes they even
have the big 37L bottles Never seen bleach that
cheap at DM
- 976ml Fabric Refresher $125 at DT DM sells it for
$150 and its a smaller bottle
- Oxy First Force spray cleaner $125 at DT $150 at
DM
DT also has a selection of other spray cleaners at
$125 while even other no name ones at DM can go
up to $2
- No name dish soap 1479ml (almost 15L) for $125
at DT 500ml for a $1 (or I guess $125 soon) at DM
- No name Mr Clean sponges At DT its two full
sponges for $125 At DM each sponge is half Mr
Clean cleaner sponge and half normal cheap sponge
- Those square no name tupperware containers that
are 3 for $125 at DM are 4 for $125 at DT
At the dollar-ish level everything Ive found at DT
has been a better value and equal or better
quality
Source
16
Transitioning Away From ldquoDollar Storerdquo Identity Threatens Customer Loyalty
Perhaps in recognition of the fact that Dollarama is losing its status as a true dollar store and that it now belongs to a
different category management has stricken almost all references to ldquodollar storesrdquo from Company filings This poses
a major threat to Dollaramarsquos customer appeal as evidenced by traffic trends and anecdotal customer reactions
FY 2017 Annual Information Form FY 2018 Annual Information Form
17
Margins Are Inexplicably High And Perhaps Unsustainable
We acknowledge that Dollarama is a strong operator with a strong value proposition (though perhaps a declining one) However
we question whether a discount retailer reselling Chinese knock-offs should garner among the highest operating margins of all
global retailers and whether a discount retailer with declining per-store traffic can continue to rely on price hikes for SSS growth
Dollarama stands out among global consumer companies and retailers ndash
45th out of 584 global retailers by operating margin (and 12th out of 584
global retailers by revenue multiple)
Dollarama consistently produces operating margins materially higher than
industry peers and higher than historical industry norms This gap has
only grown more substantial through the last five years
0
5
10
15
20
25
FY 2008 FY 2009 FY 2010 FY 2011 FY 2012 FY 2013 FY 2014 FY 2015 FY 2016 FY 2017 FY 2018
Peer Median Operating Margins vs Dollarama
Peer Median DOL CN
-10
-5
0
5
10
15
20
25
FY 1
989
FY 1
990
FY 1
991
FY 1
992
FY 1
993
FY 1
994
FY 1
995
FY 1
996
FY 1
997
FY 1
998
FY 1
999
FY 2
000
FY 2
001
FY 2
002
FY 2
003
FY 2
004
FY 2
005
FY 2
006
FY 2
007
FY 2
008
FY 2
009
FY 2
010
FY 2
011
FY 2
012
FY 2
013
FY 2
014
FY 2
015
FY 2
016
FY 2
017
FY 2
018
Dollarama Operating Margins vs Peers
DG FDO DLTR FRED BIG DOL CN
Source Bloomberg EQS function Source Dollarama and company filings
18
Debit Card Boost Is Played Out
Dollarama management has characterized the benefit from debit cards as being roughly a doubling in average purchase size
If true this benefit would be visible in year-over-year sales comps
The Company has not always disclosed penetration ndash and they ceased doing so after Q4 2016 ndash but the data suggest that the
average annual comp benefit was approximately 25 from FY 2013-16
Source Dollarama
00
05
10
15
20
25
30
35
40
45
0
10
20
30
40
50
60
Debit Card Penetration and Imputed Comp Benefit
Debit Card Penetration (LHS) Comp Benefit (RHS)
19
Have All The Levers Been Pulled
Dollarama has done a good job of increasing per-store revenue while investing in initiatives designed to remove operating
expenses We cannot fault management for pulling levers to expand margins but we believe the low-hanging
(and high-hanging) fruit has already been harvested
Management has also taken creative measures to raise effective average prices without raising prices directly ndash eg by
strategically replacing some lower-priced goods with close substitutes at higher price points and by reducing the size of
product bundles (pencils candies etc) without cutting prices Such back-door avenues to margin expansion may be exhausted
by this point as noted previously customers are beginning to notice that Dollarama no longer offers a value proposition
comparable to competing dollar stores
FY 13 FY 14 FY 15 FY 16 FY 17 FY 18
Revenue LeversAdd $250-$300
Price PointsDiscounting With Hedged Margins
Add $350-400 Price Points
Accept Credit and Debit Cards
Cost LeversDollar City
RelationshipNew POS Terminals
Kronos Labor Scheduling
Wi-Fi amp ScannersNew Warehouse
ConstructionWarehouse Expansion
Accounting and Financial Levers
Depreciation Schedule Change
Direct Profit from Currency Hedges
Leveraged Share Repurchase
ldquoThanks and good morning In the write up in the
discussion of the foreign exchange headwinds
and gross margin you also said you made select
changes to your product mix I am just wondering if
you could elaborate are there certain categories
thatrsquos your emphasizing in certain categories you are
deemphasizing I am just wondering what that
sentence really meantrdquo
- Peter Sklar BMO Capital Markets
ldquoIts really an item by item discussion Where the
compelling value remains and we are able to take for
example two pencils out of a pack and still be
competitive to help with offsetting some of the
headwinds thatrsquos the way we handle it or in other
cases if we replace the product with a new offering
thatrsquos just as compelling but different at a lower
cost potentially Thatrsquos another way Buyers can use
that tool to help them with the current challengesrdquo
- Michael Ross CFO Dollarama
Is this a sustainable practice as value-oriented customers lose faith in Dollarama
FY 2016 Q4 Earnings Call QampA
20
Costs Rising On Multiple Fronts
While management may have largely exhausted avenues for price increases and efficiency gains other industry and Company
developments threaten to drive up costs through the near term
Cost Driver Explanation
TariffsA significant share of goods (~20 according to industry experts) are sourced either directly or indirectly from the US Tariffs could increase costs on these goods materially
Minimum Wage Hikes
Provincial minimum wages in Canada generally rise much more frequently than do US minimum wages and many are scheduled to rise on an annual basis based on CPI growth Minimum wage hikes have been particularly significant of late (see below) Even provinces whose minimum wages are not tied to CPI growth have seen or are set to see material minimum wage hikes in the near future Notable recent and near-term changes are as follows
bull Alberta From $1360 to $1500 on October 1 2018 (103 increase)bull British Columbia From $1265 to $1385 on June 1 2019 to $1460 on June 1 2020 and to $1520 on June 1 2021 (63 CAGR)bull Ontario From $1160 to $1400 on January 1 2018 (207 increase) and to $1500 on January 1 2019 (additional 71 year-over-year increase)
Will rise according to Ontario CPI growth every October 1 each subsequent year New Ontario Premier Doug Ford is looking to reverse these plansbull Quebec Just increased to $1200 (+66 in May 2018) Significant political push to set provincial minimum wage at 50 of average provincial
minimum wage by 2020bull Manitoba New Brunswick Newfoundland Nova Scotia Ontario Saskatchewan and Yukon Annual minimum wage hikes according to national or
local CPI growth
Employee remuneration for FY 2018 was just over 10 of Dollarama revenue This cost item could realistically grow at a high single-digit rate over the next 2-3 years even if headcount is reduced
Transportation and Logistics
Industry experts have expressed concerns regarding near-term transportation cost increases These would hit Dollarama particularly hard as Dollarama is unique among industry peers It has only one distribution center Rather than invest in a second Dollarama recently purchased its existing distribution center in Montreal ndash which it previously leased from the Rossy family ndash for $394M (in addition to $232M spent on adjacent land) Other large Canadian value retailers generally have two distribution centers ndash one in the eastern half of the country and one in the western half
Rising fuel costs could result in materially higher transportation expenses as Dollarama distributes 92 of its merchandise through its single distribution center Industry experts suggest that shipping goods to Vancouver from Montreal via truck can be almost twice as expensive as shipping to Vancouver from China
We find it interesting that Dollarama chose to purchase property from managementrsquos family rather than follow industry norms and open a second distribution center in western Canada and that five of its six warehouses ndash all located in greater Montreal ndash are also leased from the Rossy family (the sixth warehouse is company-owned built on land purchased from the Rossy family)
MarketingDollarama has historically operated with no marketing expense However US peers spend 1-2 of revenue on average on marketing (see subsequent slides) As competition increases across the Canadian discount retail industry management may be forced to expand marketing efforts
21
Minimum Wage Growth Historically High And Accelerating Rapidly
Canada has seen fairly consistent minimum wage hikes since 2000 and minimum wage growth has outpaced inflation in all but
three years since the beginning of the millennium Dollarama has been able to manage minimum wage hikes and maintain
impressive margins since going public in 2009 Note however that minimum wage growth from 2009-17 was comparatively mild
relative to the prior half-decade Accelerating minimum wage growth through the near term will test managementrsquos ability to
insulate margins from rising labor costs
0
2
4
6
8
10
12
14
2001 2002 2003 2004 2005 2006 2007 2008 2009 2010 2011 2012 2013 2014 2015 2016 2017 2018YTD
Minimum Wage Growth Consistently Ahead of Inflation and Accelerating Rapidly
Weighted Average Minimum Wage Growth Canadian CPI Growth
Minimum wage growth across all Canadian provinces weighted by
province population
Management states that the vast majority of employees make more than minimum wage Nonetheless minimum wage hikes of 10-20 in
Canadarsquos most populous provinces could put material upward pressure on labor costs ndash particularly if these hikes spread to Quebec where
Dollaramarsquos distribution center and all of its warehouses are located Management includes a risk factor to this effect in its MDampA
210
215
220
225
230
235
240
245
250
255
260
FY 2018 EBITDA Margin FY 2018 EBITDA Margin with5 Labor Cost Hike
FY 2018 EBITDA Margin with10 Labor Cost Hike
EBITDA Margin Sensitivity to Labor Cost Hikes
12 weighted average minimum wage growth across Canada driven by
207 hikes in Ontario Average minimum wages could very realistically
continue to grow at high single-digit rates through the next ~2 years if
planned hikes are enacted
With labor costs representing about 10 of Dollarama revenue
profitability is materially sensitive to changes in this item
If labor costs were 10 higher in FY 2018 EBITDA margins would have
been slashed by 80 bps
Labor cost expansion of this magnitude would be significant but is not
necessarily out of the question within 2-3 years
Source Government of Canada
22
Lack Of Transparency Regarding Dollar City Is A Serious Concern
CEO Larry Rossy
and
CFO Michael Ross
mischaracterized
the sale by
attributing it to
vehicles which
has its own
categoryhellip
Why are Dollarama shopping carts being repurposed for Dollar City use
Perhaps they were sold above-market to Dollar City in FY 2013 when the relationship began Could this be the
reason for an unexplained $149M disposal of leasehold improvements that year
Source
1) Dollar City website and press
release announcing the relationship
Q ndash Keith Howlett ldquoOn Note 5 [of the FY
2013 Annual Report] I was trying to figure
out the leasehold improvements there
seemed to be some items called lsquodisposals
at costrsquo and therersquos sort of an offset thererdquo
A ndash Larry Rossy CEO ldquoI donrsquot know what
they are Yoursquore going to have to help me
out guys hererdquo
A ndash Michael Ross CFO ldquoDisposal of costs
that would be fixtures or related tohelliprdquo
A ndash Rossy ldquoI would say carsrdquo
A ndash Ross ldquoCars Yeah okay We sold a
few carsrdquo
Q ndash Howlett ldquoOh I see okay Well it
shows up as CAD 15M for a year thatrsquos a
lot of carsrdquo
A ndash Rossy ldquoOh itrsquos a very expensive
carrdquo
Source FY 2013 Q4 Earnings Call Source Dollarama
2013 Annual Report
In 2013 Dollarama entered into an agreement to export and sell products to Dollar City a Latin American dollar store with a
presence in El Salvador Guatemala and Colombia In exchange for selling goods to Dollar City ldquoat costrdquo plus a small markup
and providing business and operational expertise Dollarama was given an option to acquire the chain exercisable in February
2019 (since extended to February 2020)
Details about Dollar City are scarce Who is the management Where is company headquarters Who are the shareholders
Dollar Cityrsquos website provides limited information and not a single Dollar City manager was quoted at the initiation of the
relationship1 Though management claims to sell to Dollar City ldquoat costrdquo with a markup we have no way of determining how they
are calculating ldquocostrdquo It is more likely that Dollarama loads shared costs into the Dollar City bill that flatter Dollaramarsquos margins
and sells merchandise that isnrsquot selling well in Dollarama stores to Dollar City
More Competition Coming To An Already-Crowded Space
24
Evidence Of Dollarama Store Growth Slowing
The pace with which Dollarama opened stores through the past several years does not appear to be sustainable
Importantly the inevitable reversal in its pacing appears to be occurring this year
The Company opened just eight stores in Q2rsquo19 its lowest store opening count in any quarter of any recent year
Its YTD FY 2019 pace of 18 new stores is also trailing the average pace of recent fiscal years (28 openings) by
~35 Management did not provide a fully satisfactory explanation for this deficit
The slowdown in its pace of store openings could suggest that the Company is having a difficult time identifying
economically-viable locations as it seeks to grow its store count by close to 50 ndash still a very distant target
Fiscal YearStated New
Store Opening Goal
Q1 Q2 First Half Q3 Q4 Total
2019 60-70 10 8 18
2018 60-70 13 17 30 10 25 65
2017 60-70 8 13 21 18 26 65
2016 None 17 17 34 16 25 75
Source Dollarama financial filings
ldquoI want to ask about the pace of store
openings As you noted the slower start to
the year you did maintain the guidance for
this year But wondering about sort of further
beyond that obviously the store potential that
you put out there gives you room to remain at
that pace for a while But does the slower
same store sales assumption change your
thinking about how aggressively you want
to push new stores out thererdquo
- Mark Petrie CIBC
ldquoNo it does not It does not And that I would
also add that if the pace at which weve been
opening stores this year is slower than last year
as mentioned often that just relates to the
specific timing of real estate And if stores are
pushed closer to the end of the year it could be
that there is an overlap between a few more
stores at the end of this year or a few more
stores in the beginning of next year and the
end it will keep our pace of 60 to 70rdquo
- Michael Ross CFO Dollarama
ldquoReal estate timing issuesrdquo
do a poor job of explaining a
drop in H1 new store
openings of over a third
Source Dollarama Q2 FY 2019 Earnings Call
25
Dollarama Potentially Pushing The Limits Of The Canadian Market
Managementrsquos stated goal is to have 1700 stores across Canada by 2027 up from 1178 stores today We do not
believe that it can achieve this without risking significant cannibalization DOLrsquos target would imply a saturation level
higher than the largest US dollar stores (Dollar Tree and Dollar General) which also sell many more consumables and
grocery items Additionally Canada broadly has much lower levels of retail space per capita than the US suggesting
that Canadian concentration is even more pronounced all else equal
US Retail Square Footage Greater Than Canadian
Retail Square Footage
DOLrsquos Target Implies
Greater Than US
Saturation Despite
Narrower Concept
Source Wellington Management
Walmart is not opening stores in Canada suggesting that it believes
the Canadian market is saturated at 114 stores per million people ndash
about 69 of its US concentration (164 stores per million people)
Meanwhile Dollarama continues to expand within Canada despite
even higher Canadian concentration (327 per mil) relative to the US
concentration of large US dollar stores (452 per mil for a 72
ratio) This ratio would be over 100 at DOLrsquos 1700 store target
Higher Canada store
count vis-agrave-vis
comparable US
store count
compared to Walmart
Higher Canada store
concentration vis-agrave-
vis comparable US
store concentration
than Walmart
Retailers with similar store concentrations per capita across both the US and
Canada are effectively more concentrated in Canada vis-agrave-vis the total retail space
in either country
Store Count by Region
Canada US CanUS Ratio
WMT 410 5358 77
DOL ndash Present 1178 14750 80
DOL ndash Future 1700 14750 115
Store Count per Million People by Region
Canada US CanUS Ratio
WMT 114 164 69
DOL ndash Present 327 452 72
DOL ndash Future 472 452 104
DOL CN DG DLTR
Stores 1700 14760 14732
Population (M) 36 326 326
StoresCapita (M) 472 453 452
26
Dollarama Has Benefited From A Benign Competitive Environment
Large competitors have been shuttering Canadian stores continuously through the last four years due to company-
specific issues highlighted by the high-profile exits of Target and Big Lots from Canada12 We believe that this has been
a significant tailwind for Dollarama but one that is largely behind the Company at this juncture
Dollarama has been able to maintain significant share high margins and high returns on capital in large part due to
missteps among peers and the resulting lax competition This is likely unsustainable in a more competitive environment
as Dollarama has few material competitive advantages barriers to entry are low and its discount retailing strategy is not
unique Competent competition from growing industry players ndash Dollar Tree Canada Miniso and Amazon among others
ndash could be the straw that breaks the camelrsquos back for Dollaramarsquos profitability or growth (or both)
Fiscal YearCompany Exiting
CanadaStores Closed Revenue
DOL Revenue Capture
(Estimated)
Estimated Revenue Benefit
Revenue Boost
2018 Sears 200 $2000 3 $60 2
2017 Sears 100 $1000 3 $30 1
2016 Target 133 $2000 6 $120 4
2015 Big Lots 78 $155 10 $16 1
Last Four Year Average $56 2
Note All numbers are SPCM estimates
1) ldquoTarget Canada to close all stores by April 12rdquo
2) ldquoBig Lots Getting Back Out of Canadardquo
27
Light Competition Has Allowed The Company To Spend Nothing On Promotion ndash Until Now
Dollarama has no promotional expense Meanwhile promotional expenses average 1-2 of revenue among US
peers As established competitors continue to expand and as new competitors enter the market (Amazon included)
Dollaramarsquos no-cost marketing strategy may prove untenable
Promotional Expense
as a of Revenue
Intensifying Competition Threatens Dollaramarsquos
Passive Marketing Strategy
2016 2017 2018
BIG 180 180 170
FIVE 264 270 243
DLTR 021 029 048
DG 062 054 044
Average 132 133 126Source Huffington Post
Source Investorscom
The Canadian operation is also a relatively small part of the business However early results are
encouraging and despite competition in the Canadian market Dollar Tree has found success Longer
term the company is aiming for 1000 stores north of the border which does not seem unrealistic
Source Retail Environments
Calls with people at Dollar Tree suggest that the Company is working to
imitate elements of Dollaramarsquos strategy and store layout in its own
Canadian stores (eg raised shelves etc) and that it plans to expand
into Canada aggressively once its strategy is refined ndash likely in 2019
Source Company financial filings
28
Caught Between The Competition How Will Dollarama Fit In
Dollar Tree has maintained its reputation as a true dollar store nothing is priced higher than C$125 ($1 in the US)
Miniso has developed a reputation as a ldquonicerrdquo discount retailer items can cost up to C$25 but the environment is cleaner and
more modern and products are of better quality (but you can still get a dollar-level deal ndash most products are priced under C$10)
Dollarama has all the character of an old tired dollar store but without the dollar prices
Who will shop there unless management invests in store updates rather than opening new stores
Value-driven customers are by definition not loyal customers
Miniso
Clean and modern but cheap
Dollar Tree
No need for price tags everythingrsquos $1 Dollarama
Looks like Dollar Tree priced like Miniso
Irsquoll pass
29
Dollarama Makes No Effort To Appeal Millennials ndashThe Next (And Current) Shopping Generation
Dollarama has zero social media presence unlike all of its peers Not only is the Company out of touch with customers in
an industry which demands a high level of customer engagement but its brand is becoming demonstrably stale
Facebook Twitter Instagram YouTube LinkedIn Pinterest Google+
Dollar Tree Yes Yes Yes Yes Yes Yes No
Dollar General Yes Yes Yes Yes Yes Yes Yes
Family Dollar Yes Yes Yes Yes Yes Yes No
Big Lots Yes Yes Yes Yes Yes No Yes
Miniso (Canada N America)
Yes Yes Yes Yes Yes No No
Great Canadian Dollar Store
Yes Yes No No No No No
Dollarama No No No No No No No
Until now Dollarama has largely been a regional brand with satisfactory name recognition in its provincial home of Quebec
Now that the Company is making a bigger push into Anglophone Canada management should be more proactive in adapting its
strategy to new markets and to a new customer base Yet management continues to employ a strategy more befitting a sleepy
regional business it does not market or work to improve its brand it does not stay current with trends it keeps management
within the family and it is not expanding its logistics chain to support coast-to-coast growth (see subsequent slides)
Management wants Dollarama to be a national brand but it does not appear prepared to run a national business
Questionable Accounting And Financial Practices
31
Hedging Instruments A Material Source Of Profits In Recent Years
Dollaramarsquos sales are in Canadian dollars whereas a majority of its product purchases are US dollar-linked Management claims to enter
into CADUSD hedging arrangements to lock in near-term margins without having to adjust prices in response to FX movements However
management has nonetheless admittedly adjusted prices alongside unhedged peers in response to shifts in the CADUSD exchange rate
rendering its currency hedges a source of profit
Forex dynamics through the last two years have erased the large hedge benefit realized by Dollarama in FY 2016 but management reports
that gross margins have effectively remained flat through this period implying significant gross margin improvement in the underlying
business (see graphs below) As the currency hedge benefit has reversed through the last two years underlying gross margins have
purportedly risen by EXACTLY ENOUGH to keep total gross margins steady between 39-40 We find this oddly convenient ndash or at the very
least we question whether management will be able to maintain steady margins in the face of unfavorable FX rate dynamics in the future
Quick turnaround in
underlying
profitability Just in
time to keep the
declining forex hedge
benefit from dragging
down marginshellip
Even as FX hedge gains fell
from close to 8 of gross profit
in FY 2016 to a drag on gross
profit in FY 2018 gross margin
expanded by over 100 bps over
the same period implying gross
margin expansion ex-forex of
almost 300 bps within two years
for a retailer with gross margins
which were already unusually
high and whose margins had
contracted for four straight
years before the rapid reversal
32
Questionable Depreciation Assumptions
Dollarama changed its depreciation schedule for leasehold improvements (store fixtures) in FY 2015 moving from a 10-year to a 15-
year expected life1 However management did not concurrently lengthen the amortization schedule for tenant inducements
We find this mismatch curious as both quantities should be amortized depreciated over the expected life of a given lease
Adding to the confusion and appearance of foul play DOL discloses in its AIF that its average lease term is just 5 yrs and it just
started disclosing related-party dealing with Director Huw Thomas of SmartCentres ndash a REIT that lists DOL as a top 10 customer23
Lease term implied
by leasehold
depreciation expense
2-3x greater than that
implied by
amortization of
tenant allowance
Mismatch in implied
lease term
inappropriately
inflates EBIT
C$ MillionsFY
2013FY
2014FY
2015FY
2016FY
2017FY
2018
Amortization of Tenant Allowance $29 $35 $43 $49 $48 $51
Starting Balance Sheet Amount 168 207 232 280 344 386
Amortization as a of Asset Amount 173 169 185 175 140 132
Implied Lease Term 58 59 54 57 72 76
Leasehold Depreciation Expense $129 $166 $108 $141 $172 $202
Starting Balance Sheet Amount 1182 1348 1762 2113 2499 2867
Depreciation as a of Asset Amount 109 123 61 67 69 70
Implied Lease Term 92 81 163 150 145 142
Tenant Allowance Amortization Using Leasehold Depreciation Schedule
183 255 142 189 237 272
Reduction In EBIT If Both Were Put On Same Schedule (11) (10) (29) (30) (24) (24)
While the financial impact of this adjustment is limited signs of accounting impropriety do not reflect well on management and cast
doubt on the rest of Dollaramarsquos reports and accounting practices
1) FY 2015 Annual Report p 15 DOL also extended its store and warehouse equipment useful lives from 8-10yrs to 10-15yrs The total reduction of these three items was decrease of $10m in
FY15 depreciation expense
2) DOL states in its AIF p 11 ldquoThe Corporation typically enters into leases with base terms of ten years and options to renew for one or more periods of five years each The average time to
expiration of the Corporationrsquos leases is approximately five yearsrdquo
3) See governance slide on Huw Thomas
33
Capital Spending And Distribution Of Cash To Shareholders Are Overextending The Business
What happened
Management claimed in 2011 that the business was sufficiently cash-generative to support growth and dividendsshare buybacks
and that it would be able to pay down debt while pursuing both However debt has ballooned since then with net debt rising 8x
(and close to 3x versus EBITDA growth) Management is effectively levering up the balance sheet to support dividends and share
buybacks with CFO Michael Ross stating that he will continue to repurchase shares as long as the earnings yield remains above
the after-tax cost of debt
ldquoFor the past few years our cash flow has enabled
us to continue to pursue our growth plans and
continue to pay down debt Our free cash flow is
now sufficient to fund both those priorities
while enhancing new to shareholders through
a quarterly dividend payment We are able to
generate the free cash flow to do all of this
because we employ a simple growth oriented
business model at Dollaramardquo
ndash June 2011 Conference Call
Should Dollaramarsquos struggles become more pronounced ndash or should the
economic cycle turn for the worse ndash this debt overhang could loom large over
the business
Dollarama also consistently spends more on capex (as a percentage of sales) than its peers in the discount retail industry and
shows abnormally high capex versus depreciation and amortization We understand that Dollarama is a growing business which
could explain both patterns in part but it is not the only discount retailer which is investing in store growth
Dollarama DampA consistently
lt50 of capex and a lower
percentage of capex than
industry peers
Dollarama consistently
spends more on capex
(as a percentage of sales) than industry peers
00
05
10
15
20
25
0
200
400
600
800
1000
1200
1400
1600
1800
FY2012
FY2013
FY2014
FY2015
FY2016
FY2017
FY2018
Ne
t D
eb
tEB
ITD
A
Ne
t D
eb
t ($
C M
M)
Net DebtEBITDA Net Debt
0
50
100
150
200
250
300
FY2010 FY2011 FY2012 FY2013 FY2014 FY2015 FY2016 FY2017 FY2018
DampA as a of Capex and Intangibles Annual
DOL DLTR DG BIG FRED
0
1
2
3
4
5
6
7
8
FY2010 FY2011 FY2012 FY2013 FY2014 FY2015 FY2016 FY2017 FY2018
Capex and Intangibles as a of Sales Annual
DOL DLTR DG BIG FRED
34
Where Is The Capex Going
Management has explicitly identified and discussed various capital expenditures in Company filings over the last
five years but this still leaves a large gap versus what was actually spent
Additionally there is a large gap between the amount spent on software development and the amortization expense
associated with this activity suggesting that earnings may be inflated
Some of this is
directed towards
leasehold
improvements etc
but with
managementrsquos
focus on expansion
over existing store
improvements we
question where
management is
directing this capex
Capital Spending Software
on Software Amortization Difference
FY 2018 191 126 65
FY 2017 126 96 3
FY 2016 111 78 33
FY 2015 108 56 52
FY 2014 98 34 64
Are earnings
inflated due to
insufficient
amortization
Note also that a LinkedIn search for software developers at Dollarama turned up effectively nothing ndash at best one person with a tangentially
relevant title (source) So where is the software development capex going
Unlike discount retailer peers Dollarama
did not include software-related
spending in capex until recently and
records it separately in
ldquoAdditions to intangible assetsrdquo1
Do they do this to artificially deflate their
headline capex figure thereby inflating
reported free cash flow
Undiscussed Capital Spending (FY 2014 ndash 2018)
C$ Millions
$500K in capex spent per new store (375 new stores over past five years Source AIF) $1875
Capex spent on construction of 500K sqft warehouse in Montreal 679
$82M spent annually on expansion renovation or relocation of stores over five years 410
$232M spent on land acquisition 232
Discussed Capex Over Past Five Years $3196
Total Reported Capex (ex intangibles) $5200
Undiscussed Capex $2004
Software Capex and Software Amortization Discrepancy
C$ MillionsCapital Spending on
SoftwareSoftware Amortization Ratio
FY 2018 $191 $126 152
FY 2017 126 96 131
FY 2016 111 78 116
FY 2015 108 56 193
FY 2014 98 34 288
1) DOL explicitly started calling out software as a component of capex in Q3rsquo16 with the addition of footnote to guidance
35
Lack Of Transparency Regarding Store Closures And Associated Costs
It is standard industry practice to report store closures remodels and relocations alongside new store openings
However Dollarama reports only ldquoNet New Storesrdquo and does not break this number out in detail Questioned on this
in Q4 2016 management answered that a larger store base would inevitably result in more closures for reasons
outside of its control (fires mall renovations etc) and that reporting closures would therefore not communicate
meaningful information regarding the underlying performance of the business
We strongly disagree store closure information is vital to evaluating the health of a retail chain Management can
provide color on particular closures if it feels that they have been done for reasons other than performance but
failing to report closures entirely hides a key operating statistic from investors
Company Store Movement 2012 2013 2014 2015 2016 2017 2018
DLTR
Beginning 4101 4351 4671 4992 5367 13851 14334OpenedAcquired 278 345 343 391 8850 584 603
Closed 28 25 22 16 366 101 102Closed as of Beginning 07 06 05 03 68 07 07
BIG
Beginning 1398 1533 1495 1493 1460 1449 1432Opened 181 87 55 24 9 9 24Closed 46 46 58 57 20 26 40
Closed as of Beginning 33 30 39 38 14 18 28
DG
Beginning 9372 9937 10506 11132 11789 12483 13320Opened 625 625 650 700 730 900 1315Closed 60 56 24 43 36 63 101
Closed as of Beginning 06 06 02 04 03 05 08
FDO
Beginning 7023 7442 7916 -- -- -- --Opened 475 500 526 -- -- -- --Closed 56 26 400 -- -- -- --
Closed as of Beginning 08 03 51 -- -- -- --Overall Industry Average 09 07 20 07 23 07 08
Other high-growth dollar
stores like Dollar Tree and
Dollar General report store
closures ndash why doesnrsquot
Dollarama
Store closures for whatever
the reasons incur real
restructuring and other
costs Peer retailers
generally give detail on these
expenses whereas
Dollarama does not
We believe that Dollarama
should follow industry norms
and increase transparency
regarding store closures
US Dollar Store peers historically close 08 of stores annually yet Dollarama has not reported any recent closures
36
SSS Metrics Obfuscate Store Performance
Dollaramarsquos official ldquoComparable Store Salesrdquo figure includes ldquorelocated and expandedrdquo stores as ldquocomparable storesrdquo
therefore picking up growth in traffic which can be attributed to relocation-related improvements We believe that this likely
overstates Comparable Store Sales growth while also ignoring associated relocation-related expenses
1) See Q1 FY 2014 earnings call transcript
Management not only hides store closure data as a supposedly uninformative statistic but proclaims that it has NEVER closed a
store due to poor performance1 We find it difficult to believe that a retailer which has existed in its current format since 1992 has
never needed to close a store for poor performance If it has indeed never closed an underperforming store we wonder whether
management has been too ambitious in growing its store base without critically evaluating the profitability of each location
Huntsville Place Mall Jul 2015
7 John St Oct 2012
7 John St Jul 2015
Huntsville Place Mall Oct 2012
Huntsville ON
Relocation
Are these really entirely
ldquocomparablerdquo locations
781 Rue Principale Est May 2016
781 Rue Principale Est Jun 2009Le Carrefour Ste Agathe
May 2016
Ste-Agathe-Des-Monts QC
Relocation
Why assume the costs to
make this lt1 mile move
Notice
Dollarama
sign turned
inside-out
indicating
closure
37
Cash Flow Beginning To Turn Over Despite Efforts To Bolster Results
In H1 FY 2019 Dollaramarsquos cash flow contracted on a year-over-year basis for the first time since it went public ndash this
despite managementrsquos efforts to bolster earnings and EBITDA The contraction appears to be due in large part to
changes in working capital In particular we are concerned that growth in inventories suggests that management
overestimated near-to-medium term sales growth and that declining traffic is starting to weigh on the Company
Dollarama H1 Operating Cash Flow
C$ Millions FY 2014 FY 2015 FY 2016 FY 2017 FY 2018 FY 2019
Net Income $1054 $1221 $1603 $1895 $2265 $2433
CFO Before Working Capital 1394 1488 2124 2156 2769 2999
Changes in Working Capital (287) (236) (870) (110) (126) (886)
Net CFO 1107 1252 1253 2045 2644 2113
YoY Change $326 $322 $01 $792 $599 (531)
Source Dollarama
Governance Concerns
39
Related-Party Transactions With Rossy Family Raise Questions Over Governance And Costs
Fiscal YearRent amp Land Purchases
Paid to Rossys(C$ MM)
As a of Compensation Paid to Rossy Family
FY 2019 (To Date) $394 NA
FY 2018 184 1660
FY 2017 402 4459
FY 2016 179 1305
FY 2015 169 2752
FY 2014 163 1903
As noted Dollarama leases all but one of its five warehouses from the Rossy family and recently purchased land from the Rossys
for the construction of a sixth Management also recently purchased its Montreal distribution center from the Rossy family which
leased the facility to Dollarama until this February We understand that the Rossy family has close historical ties to the business
but this level of close dealing draws our attention particularly given the fact that management has focused on fortifying its
existing distribution footprint ndash closely tied to the Rossy family ndash rather than invest in distribution facilities in western Canada
where major competitors already have distribution centers
DLTR
Distribution
Center
Delta BC
DLTR
Distribution
Center
Mississauga ON
DOL
Distribution
Center
DOL
Warehouses
No Dollarama distribution facilities
located outside of a ~4 mile radius in
Montreal
bull Due to preferential relationship with
Rossy family
bull Will Dollarama be able to expand into
AngloWestern Canada efficiently
without logistics costs ballooning
bull Overly-exposed to fuel price hikes
and rising transportation costs
Related-Party Transactions Significant And Growing
Source Dollarama Financials
Dollar Tree Canada Distribution Centers
Dollarama Distribution Centers And Warehouses
Source DollarTree
Montreal QC
40
Related-Party Transactions With ldquoIndependentrdquo Director Huw Thomas Only Recently Disclosedhellip
Dollarama also leases stores from SmartCentres REIT whose recently-departed CEO Huw Thomas joined Dollaramarsquos
Board of Directors in 2011 and was a member of its audit committee through March 2017
His ldquoindependencerdquo was recently defended by a meandering 260-word footnote in Dollaramarsquos proxy which belies the
fact that Dollarama is a top 10 customer of SmartCentres
This is all the more suspicious in light of Dollaramarsquos questionable lease accounting highlighted earlier
Source Dollarama 2018 Proxy Circular
Note Dollarama did not start disclosing Huwrsquos related-party dealing until the 2017 proxy
circular in June 2017 right after he left the Audit Committee in March 2017
SmartCentres 2017 Annual Report
Dollarama Material To SmartCentres ndash A Top 10 Customer
SmartCentres Promotes Dollarama Relationship From 2011
Calloway (now SmartCentres) 2012 Annual Report
Dollaramarsquos Lengthy Meandering Defense Of Thomas
Huw As Independent Only Recently Disclosed (2017)
Dollarama Recently Changed Rent Expense Disclosure
Source Dollarama Q4rsquo17 Financials Note 15 Related Party Disclosure
Source Dollarama Q2rsquo18 Financials Note 13 Related Party Disclosure
41
House of Windsor House of RossyA Case Study In Nepotism
Neil Rossy had been the Senior VP of Merchandising Chief Merchandising Officer for 25 years prior to being named CEO in
2016 While his family is still a large shareholder they are not a controlling shareholder owning around 5 of the shares
outstanding We question whether the Rossyrsquos century-long family tradition of passing down leadership ndash one which also
persists at the Rossyrsquos ldquosister storerdquo ndash is appropriate for a public company or wise for the long-term health of the business
Salim Rossy
Opened first ldquoS Rossyrdquo
store in 1910 (up-market
department store concept)
George Rossy
President of S Rossy
1937-1973
Larry Rossy
Grew S Rossy from 20 to 44 stores before
converting all S Rossy stores to new
ldquoDollaramardquo concept in 1992 Sold majority
stake to Bain Capital in 2004 IPO in 2009
Neil Rossy
CEO of Dollarama as of 2016
Michael Rossy
Brother of George (one of ten siblings)
Founder amp CEO of ldquoRossyrdquo stores 1949-2010
Michael DiTullio
Son-in-Law of Michael
President amp CEO of Rossy since 2010
Does (or will) the family have a hard time parting with a business that has been in the family for four generations even if parting ways is
the right thing to do
Managing retail chains is very
much a family affair for the
Rossys ndash at both stores
Perhaps Neil was going to be
anointed CEO of Dollarama
regardless of the caliber of other
potential candidates
Letrsquos hope hersquos not Commodus
BONUS
Brother branches out
with separate storehellip
42
Insiders Incentivized To Grow EBITDA
Our earlier concerns about EBITDA quality are amplified by the fact that Dollarama executives are compensated
based on seemingly arbitrary and inflated EBITDA targets This gives management a strong incentive to be inefficient
users of capital as any dollar shifted from operating expense to capex has a direct benefit to key executives
For example note that managementrsquos perhaps questionable decision to purchase one of its Montreal warehouses
will shift what was until recently rent expense into depreciation This change in the accounting treatment of
Dollaramarsquos tenancy costs will provide a windfall to EBITDA potentially boosting management bonuses
Source Dollarama Proxy Circular p 30
43
What Is A Stretch EBITDA Goal
Bonuses are paid upon achievement of 11 EBITDA growth This level was ldquodesigned to be a stretch objectivehellip
attainable only with significant effortrdquo However this target was reset lower after FY 2014 ndash the only year during which
management did not handily exceed the target We believe this further calls into question the independence of the
board and its compensation committee
Year EBITDA Growth Objective EBITDA Growth Achieved
FY 2018 11 18
FY 2017 11 18
FY 2016 11 30
FY 2015 11 15
FY 2014 13 12
FY 2013 13 22
FY 2012 13 26
FY 2014 Management
misses growth objective
FY 2015 Growth objective
adjusted downwards
ldquoThe thresholds were revised by the
Human Resources and Compensation
Committee in the context of its annual
executive compensation review
conducted at the beginning of each fiscal
year to take into account among other
elements the fact that the base for the
calculation is growing every yearrdquo
Source FY15 Management Proxy Circular
What ldquoother elementsrdquo were
taken into account
Source Dollarama
44
Insiders Selling While Company Buys Back Stock At Elevated Prices
Management has been buying back shares at elevated prices through the last several years even while pursuing growth leaving little capital for
(sorely needed) store updates or other uses The average repurchase price since Q1 FY17 is about on par with current share prices and ~40
below our target Since Q2 FY18 the average buyback price has been 25 above current levels
Furthermore just as the Company has been buying back stock at elevated prices insiders have been offloading shares Notably it is evident
from past and current proxy statements that CFO Michael Ross has never held onto shares for which he has been granted options his
common equity ownership is listed at zero every year Note that as the CFO it is he who is dictating the share buyback decision in large part
PeriodShares
Repurchased
Value of Repurchase
(C$ M)
Average Price (Split-
Adj) (C$)
Q1 FY 2017 1542066 1393 3011
Q2 FY 2017 2027080 1842 3029
Q3 FY 2017 1571500 1578 3347
Q4 FY 2017 2279522 2241 3277
Q1 FY 2018 1687240 1806 3568
Q2 FY 2018 1303900 1602 4095
Q3 FY 2018 687700 931 4513
Q4 FY 2018 2425700 3788 5205
Q1 FY 2019 94500 145 5115
Q2 FY 20191 1347341 700 5195
Total 14966549 16026 3797
Discount to Current Share Price 1
Total (Since Q2 FY 2018)
5859141 7170 4815
Discount to Current Share Price -20
Using Company Funds To Overpay For DOL Shareshellip While Insiders Sell Into The Companyrsquos Bidhellip
Source DOL filings and Bloomberg
Insider Title Date Sold SharesProceeds (C$ M)
Price Sold (Split-Adj)(C$)
Nicolas Hien Senior Vice President 482016 6203 06 3224
Michael Ross CFO 482016 80000 74 3083
Paul Roche Vice President 4182016 10000 09 3000
Geoffrey Robillard Senior Vice President 6172016 33500 31 3085
John Assaly Vice President 9272016 30000 30 3333
Geoffrey Robillard Senior Vice President 472017 20000 23 3833
Paul Roche Vice President 472017 23100 26 3752
Josee Kouri Corporate Secretary 4142017 8000 09 3750
Geoffrey Robillard Senior Vice President 9142017 5000 07 4667
Geoffrey Robillard Senior Vice President 12112017 10000 16 5333
John Assaly Vice President 12132017 14096 22 5202
Geoffrey Robillard Senior Vice President 1262018 15000 24 5333
John Thomas Independent Director 1262018 6000 10 5556
Geoffrey Robillard Senior Vice President 6152018 50000 75 5000
John Assaly Vice President 6192018 13404 21 5222
Nicolas Hein Senior Vice President 6222018 36750 19 5170
Paul Roche Vice President 6222018 24000 13 5417
We do not like the fact that insiders have been selling into share buybacks while
the Company levers itself up with short-term debt to support those repurchases
It appears that the execs are levering up the business in part to enrich themselves1) All share information prior to Q2 lsquo19 reflects pre-split data except
Split-Adjusted Average Prices Q2 lsquo19 repurchases were as stated
45
Rossy Family Selling Shares Despite Control Over C-Suite
Notably Founder and former CEO Larry Rossy has trimmed his position tremendously through the last several years
Though this is to be expected to some extent as he recently ceded control of the business we believe that his
ownership stake should be held to a higher standard given his insistence on keeping the business in the family
If he plans to keep the c-suite under a Rossy dynasty the familyrsquos personal stake in the business should reflect that
Source Bloomberg
Valuation And Price Target
47
The Market Has Not Taken Threats To Dollarama Seriously ndash But Optimism Is Ebbing
Analysts are generally bullish on the stock focusing primarily on managementrsquos growth story and taking current
profitability levels for granted The prospect of new competitive threats to a business which has until now seen limited
competition ndash and the risk that prevailing margins are unsustainable even through the near term ndash go underappreciated
Dollaramarsquos poor Q2 cooled analystsrsquo optimism to some extent but we believe that the reaction was largely reactive and
superficial as they adjusted their price targets in such a way that in aggregate they saw exactly the same upside after the
post-Q2 dip as they did before The market still does not fully appreciate the magnitude of the threats facing Dollarama
All price targets in C$ Before Q2 Release After Q2 Release
Firm Recommendation Target PriceUpside (on 82818) Recommendation Target Price
Upside (on 9172018)
Upside (Present)
RBC Capital Markets Outperform $5500 12 Outperform $5200 22 35
Raymond James Outperform $5567 13 Outperform $5000 17 30
Macquarie Outperform $5633 14 Outperform $4900 15 27
BMO Capital Markets Outperform $6100 24 Market Perform $4700 10 22
CIBC Capital Markets Outperform $5900 20 Neutral $4600 8 20
Desjardins Securities Buy $5800 18 Hold $4500 6 17
Veritas Investment Research Co Buy $5600 14 Buy $4800 13 25
Industrial Alliance Securities Hold $5450 11 Buy $5450 28 42
Canaccord Genuity Buy $5900 20 Buy $5500 29 43
Barclays Equal Weight $5200 5 Equal Weight $4400 3 14
TD Securities Buy $5900 20 Hold $4900 15 27
Accountability Research Corp Buy $5400 10 Buy $5000 17 30
National Bank Financial Outperform $5567 13 Sector Perform $4800 13 25
Scotia Capital Sector Outperform $5567 13 Sector Outperform $5050 19 31
Wells Fargo Securities Market Perform $5300 7 Market Perform $4000 -6 4
AVERAGE $5626 14 $4853 14 26
While analysts are still not sufficiently critical of Dollarama the more recent downward move in the stock and subsequent analyst
downgrades may suggest that the market could be primed to evaluate the Company and its growth story with a more discerning eye
We believe that the issues which we highlight in this report will provoke further professional skepticism among analysts and investors
48
Dollarama Not Priced To Perfection ndashPriced Beyond Perfection
We can get close to DOLrsquos current valuation only if we value it as a mature ex-growth business today under
managementrsquos lofty goals for the business for ten years into the future applying no discounts for time
business risk etc
Managementrsquos ten-year store target
bull Current store count 1178 (70 of long-
term target)
Even if Dollarama were a mature business today under managementrsquos long-term targets for the business
DOL stock would not have no upside to current share prices
The market is pricing DOL beyond perfection ndash a valuation this lofty cannot be justified today
Mature Business ValuationC$ MM unless noted
Stores 1700
Revenue per Store $32
Total Revenue $5440
Operating Margin 220
Operating Profit $1197
Interest Expense $50
Tax (275) $315
Net Income $831
Diluted Shares Outstanding 332
EPS $251
PE Multiple 152x
Target Price $3815
Upside -1
Average operating margin since Q1 FY 2016
bull Assumes that DOLrsquos unusually high
margins are sustainable despite
intensifying competition loss of recent FX
benefit and customer pushback against
price hikes
Mature revenue per store estimate
bull Current average revenue per store
~$28M (875 of long-term target)
Industry median NTM PE multiple
bull Assigns no discount to DOL due to
declining store traffic vs peers incoming
competitive threats inefficient distribution
network etc
49
Dollarama Not Priced To Perfection ndashPriced Beyond Perfection (Continued)
Put another way The market is implicitly taking it for
granted that Dollarama will achieve its lofty ten-year
growth targets assuming sustained profitability levels
and per-store efficiency ndash and applying close to the
industry median FY1 EVEBITDA multiple to Dollaramarsquos
FY 2027 EBITDA
Just under ten-
year target
What kind of growth is the market implicitly betting on if
we value Dollarama on par with peers
bull 150 more stores than managementrsquos ten-year target ndash
within nine years
bull 48 CAGR in revenue per store
bull Zero margin compression
FY 2027 Estimates if Management Executes Growth Plans Perfectly
(C$ MM unless noted)
Stores (Year-End) 1688
Revenue per Store $33
Total Revenue $5503
Gross Margin 380
Gross Profit $2093
SGampA per Store 04
SGampA Total 689
EBITDA (FY 2027) $1404
Market Cap 12752
Debt 1880
Cash 182
Enterprise Value $14450
EVEBITDA (FY 2027) 103x
Industry Median EVEBITDA (FY1) 110x
Average gross
margin ex-
hedge gains
since FY 2016
Mature revenue
per store
estimate (15
growth CAGR)
FY 2018 SGampA
per Store
Implied FY 2027
multiple close to
industry median FY1
multiple
FY 2027 Estimates To Justify Prevailing Valuation (C$ MM unless noted)
Stores (Year-End) 1858
Revenue per Store $44
Total Revenue $7929
Gross Margin 380
Gross Profit $3016
SGampA per Store 04
SGampA Total 755
EBITDA (FY 2027) $2261
EVEBITDA (FY 2027) 62x
Enterprise Value 13947
Debt 1880
Cash 182
Equity Valuation $12249
Diluted Shares Outstanding 332
Target Price $3693
Current Price $3845
158 over ten-
year target in
nine years
48 growth
CAGR in
SalesStore
Industry median
FY1 multiple
discounted
75 annually
Average gross
margin ex-
hedge gains
since FY 2016
FY 2018 SGampA
per Store
High forecast gives
us 4 DOWNSIDE
50
Valuation Far Out Of Line With Peers And Historical Multiples
DOL shares trade at a 50-60 premium to peers in the discount retail industry The market is valuing DOL much more like a high-
growth tech company than a brick-and-mortar dollar store (and one with concerning fundamental trends at that) Note that this still
holds true even after DOL shares traded down significantly following its recent Q2 earnings report
It is difficult to justify a valuation this high even if one is bullish on DOL vis-agrave-vis the rest of the industry
Company Ticker
3-Year Consensus Revenue
CAGR
FY 2018 EBITDA Margin
PE(NTM)
PE(FY2)
EVEBITDA(NTM)
EVEBITDA(FY2)
EVSales(NTM)
Dollar Tree DLTR 43 121 139x 134x 91x 88x 10x
Dollar General DG 75 104 163x 162x 112x 112x 12x
Big Lots BIG 06 85 87x 87x 52x 53x 04x
Five Below FIVE 210 162 360x 412x 2113x 243x 32x
Canadian Tire CTC CN 20 90 179x 181x 82x 83x 10x
Metro MRU CN 80 73 142x 139x 99x 101x 08x
MEDIAN 59 97 152x 151x 95x 110x 10x
Dollarama DOL CN 85 255 229x 223x 164x 163x 41x
DOL PREMIUM 505 477 727 509 3057
Does DOL ndash a value retailer
demonstrating concerning
fundamental trends ndash deserve
to be valued on par with
higher-growth industries and
completely out of line with its
industry peers
Profitability is impressive but
likely unsustainable in the face
of growing competition
Enterprise Value Revenues Enterprise Value Adj EBITDA Price Adj EPSDOL shares also trade at
a significant premium to
historical multiples
despite unsustainable
margins an increasingly
saturated market and
rising competitive
threats
51
Does The Market Think Dollarama Is A Dollar Store Or A Premium Retail Brand
Dollarama is valued much more closely to premium retail brands than its discount retail peer group
A bull might ldquojustifyrdquo this by pointing to Dollaramarsquos profitability profile and growth expectations but its EBITDA margins are so
out of line with those of its peers that one is forced to question whether they are sustainable (at best) or honest (at worst)
As discussed Dollaramarsquos consensus sales growth numbers also ignore looming fundamental threats to the business
Company TickerGross
Margin (NTM)
EBITDA Margin (NTM)
Sales Growth (NTM)
EVEBITDA(NTM)
PE(NTM)
EVSales(NTM)
Dollar Tree DLTR 31 11 28 91x 139x 10x
Dollar General DG 31 10 89 112x 163x 12x
Big Lots BIG 41 7 -08 52x 87x 04x
Five Below FIVE 36 15 203 2113x 360x 32x
Canadian Tire CTC CN 34 12 40 82x 179x 10x
Metro MRU CN 19 7 88 99x 142x 08x
MEDIAN 33 11 64 95x 152x 10x
Dollarama DOL CN 40 25 99 164x 229x 41x
DOL PREMIUM 727 505 3057
How does Dollarama support EBITDA
margins more than double those of its
peer group and in line with premium
global retail brands
Company TickerGross
Margin (NTM)
EBITDA Margin (NTM)
Sales Growth (NTM)
EVEBITDA (NTM)
PE (NTM)EVSales
(NTM)
Ferragamo SFER IM 65 17 48 160x 260x 26x
Hermes RMS FP 69 38 84 200x 350x 78x
Prada 1913 HK 74 22 78 100x 210x 23x
Tiffany amp Co TIF 64 24 51 113x 196x 28x
MEDIAN 67 23 65 137x 235x 27x
Dollarama DOL CN 40 25 99 164x 229x 41x
DOL PREMIUM 197 -26 519
Does a discount retailer facing
fundamental headwinds deserve to be
priced 50 or more above its peer
group and closer to global
premium retail brands
52
Margins And Multiples Materially Out-of-Line With Peers
We do not believe that Dollaramarsquos profitability levels ndash which are entirely out of line with peers ndash are justified or sustainable in an
industry as competitive as deep discount retail The Company is already struggling to meet store count growth targets raising the
likelihood that its store growth plan will be dilutive to margins The market assigns a premium valuation to Dollarama on the basis
of relatively high growth expectations and the Companyrsquos industry-leading margins However as discussed throughout this
report we doubt both managementrsquos ability to meet its growth targets and its ability to maintain prevailing profitability levels The
likelihood that the Company will be able to achieve BOTH of these goals simultaneously is even slimmer Accordingly we believe
that the basis for Dollaramarsquos substantial share price premium is unfounded
Dollaramarsquos margin profile is grossly out of
line with peers and we find evidence of
aggressive accounting and questionable
business practices that can partly explain the
issue We doubt that this would be sustainable
even if management wasnrsquot growing the chain
How will a lowno-moat business with falling
per-store traffic be able to maintain its
remarkable profitability advantage while
aggressively expanding its store base
DLTRDG
BIG
FIVE
CTCCN
MRUCNWNCN
DOLCN
0
5
10
15
20
25
30
10 15 20 25 30 35 40 45 50
EBIT
DA
Mar
gin
Gross Margin
Dollarama Margins Completely Out Of Line With Peers
The premium in Dollaramarsquos share
price is driven by the marketrsquos trust in
managementrsquos growth initiatives and
its recognition of the Companyrsquos
dominant profitability
However neither its profitability
advantage nor its growth prospects
are sustainable The likelihood that
management simultaneously
preserves BOTH is extremely low
Big Lots (BIG) Dollar Tree (DLTR) Dollar General (DG) Metro Inc (MRU CN) and Canadian Tire (CTC CN)
x
5x
10x
15x
20x
25x
BIG DLTR MRU CN DG CTC CN DOL CN
PE (NTM)
x
4x
8x
12x
16x
20x
BIG DLTR MRU CN DG CTC CN DOL CN
EVEBITDA
53
Valuing DOL As A Mature Business In The Canadian Market ~40 Downside
C$ MM unlessotherwise noted
Current Run-Rate Valuation
Priced Beyond Perfection
Reasonable Downside
Stores 1170 1700 1500
RevenuesStore 28 32 30
Revenues 3320 5440 4500
Operating Margin 23 22 18
Operating Profit 764 1197 801
Interest Expense 42 50 50
Tax 275 198 315 207
Net Income 523 831 544
Shares 332 332 332
EPS $158 $251 $164
Multiple 24x 16x ~15x
Share Price $3845 $3966 $2460
Upside (Downside) 3 Approx -40
As discussed earlier at 1700 stores DOL would have greater penetration than both Dollar General (DG) and Dollar Tree (DLTR)
which both offer a much broader assortment of goods including perishablesconsumables Meanwhile the US appears to be
overstored versus Canada It is likely unreasonable for DOL to target per capita penetration levels on par with its US peers
Even if we assume that DOL can reach similar penetration levels and match company
growth targets ndash with steady margins no less ndash DOL has little upside
Valuing DOL as a mature business at its upper penetration bound implies ~40 downside
in a more realistic yet still generous scenario in which DOL is valued in line with peers
Higher Canada
store count vis-agrave-
vis comparable US
store count
compared to
Walmart
Higher Canada
store concentration
vis-agrave-vis
comparable US
store concentration
than Walmart
Achieving
managementrsquos
1700 store target
would put DOL at a
higher per capita
penetration level
than US peers
Store Count by Region
Canada US CanUS Ratio
WMT 410 5358 77DOL ndash Present 1178 14750 80DOL ndash Future 1700 14750 115
DOL CN DG DLTR
Stores 1700 14760 14732
Population (M) 36 326 326
StoresCapita (M) 472 453 452
Downside Run-Rate Operating Margin Estimate
ProfitabilityCost Measure JustificationGross Margin Target Recent Historical Average 370
Current SGampA Recent Historical Average 167
Add
Advertising Expense Normalization
Industry Average05
Rent Expense NormalizationAdjusting for Depreciation Rearranged
from Rent Expense 05
Depreciation Catch-Up Matching DampA schedules 15
Pro Forma SGampA 192
Pro Forma Operating Margin 178
Store Count per Mil People by Region
Canada US CanUS Ratio
WMT 114 164 69DOL ndash Present 327 452 72DOL ndash Future 472 452 104

15
ldquoNothingForADollaramardquo Customers Becoming Conscious Of Price Increases Versus Competitors
Dollaramarsquos price increases may not yet put its prices on par with those of big box retailers like Walmart but
customers have taken notice that Dollarama has increased prices against other Canadian dollar stores Comments
from various internet forums and news sites reveal that customers no longer believe that Dollarama offers as much
value as do other discount retailers suggesting that the strength of Dollaramarsquos value proposition ndash the source of
its appeal and foundation of its business model ndash is at risk The below comments are anecdotal but comments of
this sort regarding Dollarama in particular are nonetheless common among relevant websites
ldquoThe dollar store is no longer a bargain if you
shop around you can by the same things
cheaper or same price elsewhere quit
calling it dollarama no more dollar thingsrdquo
Source
ldquodollar tree here is drastically cheaper then
dollarammardquo ndash Cody Williams
ldquoCody Williams Same here Dollarama is not
really a dollar store anymorerdquo ndash JJ Walker
Source
ldquoI enjoyed the days when everything in Rama
actually was a dollar I go to Dollar Tree
more often now just because everything
there is $125 - ($1 in the US of course)rdquo
Source
ldquoTheir high prices is the problem they still
have better selection than Dollar Tree but
their prices are always higher I know some
dollar store shoppers who go to Dollar
Tree first for the better prices and then go
to Dollarama for the stuff they couldnt
find at Dollar Tree Myself personally have
watched the prices creep up A pair of work
gloves climbed from $250 to 4 or 5 bucks
the discount over Home Depot is only a
buck or two now Also Dollar Tree still
keeps all items under 2 bucks I believerdquo
Source
ldquoThey gonna have to change the Dollarama
name soonrdquo
ldquodollarandaquarterramardquo
ldquoNew Name NothingForaDollarrdquo
ldquoYou forgot lsquoramarsquo NothingForADollaramardquo
ldquoAs for a new name how about
FiveFinaramardquo
ldquofive or lessarmardquo
Source
ldquoDollarRama is no longer in the same
category since they sell at higher prices
more of a discounted store and not a dollar
storerdquo
Source
Just did a quick check of my cleaning cupboard
DT=Dollar Tree DM=Dollarama
- 284L bleach $125 at DT Sometimes they even
have the big 37L bottles Never seen bleach that
cheap at DM
- 976ml Fabric Refresher $125 at DT DM sells it for
$150 and its a smaller bottle
- Oxy First Force spray cleaner $125 at DT $150 at
DM
DT also has a selection of other spray cleaners at
$125 while even other no name ones at DM can go
up to $2
- No name dish soap 1479ml (almost 15L) for $125
at DT 500ml for a $1 (or I guess $125 soon) at DM
- No name Mr Clean sponges At DT its two full
sponges for $125 At DM each sponge is half Mr
Clean cleaner sponge and half normal cheap sponge
- Those square no name tupperware containers that
are 3 for $125 at DM are 4 for $125 at DT
At the dollar-ish level everything Ive found at DT
has been a better value and equal or better
quality
Source
16
Transitioning Away From ldquoDollar Storerdquo Identity Threatens Customer Loyalty
Perhaps in recognition of the fact that Dollarama is losing its status as a true dollar store and that it now belongs to a
different category management has stricken almost all references to ldquodollar storesrdquo from Company filings This poses
a major threat to Dollaramarsquos customer appeal as evidenced by traffic trends and anecdotal customer reactions
FY 2017 Annual Information Form FY 2018 Annual Information Form
17
Margins Are Inexplicably High And Perhaps Unsustainable
We acknowledge that Dollarama is a strong operator with a strong value proposition (though perhaps a declining one) However
we question whether a discount retailer reselling Chinese knock-offs should garner among the highest operating margins of all
global retailers and whether a discount retailer with declining per-store traffic can continue to rely on price hikes for SSS growth
Dollarama stands out among global consumer companies and retailers ndash
45th out of 584 global retailers by operating margin (and 12th out of 584
global retailers by revenue multiple)
Dollarama consistently produces operating margins materially higher than
industry peers and higher than historical industry norms This gap has
only grown more substantial through the last five years
0
5
10
15
20
25
FY 2008 FY 2009 FY 2010 FY 2011 FY 2012 FY 2013 FY 2014 FY 2015 FY 2016 FY 2017 FY 2018
Peer Median Operating Margins vs Dollarama
Peer Median DOL CN
-10
-5
0
5
10
15
20
25
FY 1
989
FY 1
990
FY 1
991
FY 1
992
FY 1
993
FY 1
994
FY 1
995
FY 1
996
FY 1
997
FY 1
998
FY 1
999
FY 2
000
FY 2
001
FY 2
002
FY 2
003
FY 2
004
FY 2
005
FY 2
006
FY 2
007
FY 2
008
FY 2
009
FY 2
010
FY 2
011
FY 2
012
FY 2
013
FY 2
014
FY 2
015
FY 2
016
FY 2
017
FY 2
018
Dollarama Operating Margins vs Peers
DG FDO DLTR FRED BIG DOL CN
Source Bloomberg EQS function Source Dollarama and company filings
18
Debit Card Boost Is Played Out
Dollarama management has characterized the benefit from debit cards as being roughly a doubling in average purchase size
If true this benefit would be visible in year-over-year sales comps
The Company has not always disclosed penetration ndash and they ceased doing so after Q4 2016 ndash but the data suggest that the
average annual comp benefit was approximately 25 from FY 2013-16
Source Dollarama
00
05
10
15
20
25
30
35
40
45
0
10
20
30
40
50
60
Debit Card Penetration and Imputed Comp Benefit
Debit Card Penetration (LHS) Comp Benefit (RHS)
19
Have All The Levers Been Pulled
Dollarama has done a good job of increasing per-store revenue while investing in initiatives designed to remove operating
expenses We cannot fault management for pulling levers to expand margins but we believe the low-hanging
(and high-hanging) fruit has already been harvested
Management has also taken creative measures to raise effective average prices without raising prices directly ndash eg by
strategically replacing some lower-priced goods with close substitutes at higher price points and by reducing the size of
product bundles (pencils candies etc) without cutting prices Such back-door avenues to margin expansion may be exhausted
by this point as noted previously customers are beginning to notice that Dollarama no longer offers a value proposition
comparable to competing dollar stores
FY 13 FY 14 FY 15 FY 16 FY 17 FY 18
Revenue LeversAdd $250-$300
Price PointsDiscounting With Hedged Margins
Add $350-400 Price Points
Accept Credit and Debit Cards
Cost LeversDollar City
RelationshipNew POS Terminals
Kronos Labor Scheduling
Wi-Fi amp ScannersNew Warehouse
ConstructionWarehouse Expansion
Accounting and Financial Levers
Depreciation Schedule Change
Direct Profit from Currency Hedges
Leveraged Share Repurchase
ldquoThanks and good morning In the write up in the
discussion of the foreign exchange headwinds
and gross margin you also said you made select
changes to your product mix I am just wondering if
you could elaborate are there certain categories
thatrsquos your emphasizing in certain categories you are
deemphasizing I am just wondering what that
sentence really meantrdquo
- Peter Sklar BMO Capital Markets
ldquoIts really an item by item discussion Where the
compelling value remains and we are able to take for
example two pencils out of a pack and still be
competitive to help with offsetting some of the
headwinds thatrsquos the way we handle it or in other
cases if we replace the product with a new offering
thatrsquos just as compelling but different at a lower
cost potentially Thatrsquos another way Buyers can use
that tool to help them with the current challengesrdquo
- Michael Ross CFO Dollarama
Is this a sustainable practice as value-oriented customers lose faith in Dollarama
FY 2016 Q4 Earnings Call QampA
20
Costs Rising On Multiple Fronts
While management may have largely exhausted avenues for price increases and efficiency gains other industry and Company
developments threaten to drive up costs through the near term
Cost Driver Explanation
TariffsA significant share of goods (~20 according to industry experts) are sourced either directly or indirectly from the US Tariffs could increase costs on these goods materially
Minimum Wage Hikes
Provincial minimum wages in Canada generally rise much more frequently than do US minimum wages and many are scheduled to rise on an annual basis based on CPI growth Minimum wage hikes have been particularly significant of late (see below) Even provinces whose minimum wages are not tied to CPI growth have seen or are set to see material minimum wage hikes in the near future Notable recent and near-term changes are as follows
bull Alberta From $1360 to $1500 on October 1 2018 (103 increase)bull British Columbia From $1265 to $1385 on June 1 2019 to $1460 on June 1 2020 and to $1520 on June 1 2021 (63 CAGR)bull Ontario From $1160 to $1400 on January 1 2018 (207 increase) and to $1500 on January 1 2019 (additional 71 year-over-year increase)
Will rise according to Ontario CPI growth every October 1 each subsequent year New Ontario Premier Doug Ford is looking to reverse these plansbull Quebec Just increased to $1200 (+66 in May 2018) Significant political push to set provincial minimum wage at 50 of average provincial
minimum wage by 2020bull Manitoba New Brunswick Newfoundland Nova Scotia Ontario Saskatchewan and Yukon Annual minimum wage hikes according to national or
local CPI growth
Employee remuneration for FY 2018 was just over 10 of Dollarama revenue This cost item could realistically grow at a high single-digit rate over the next 2-3 years even if headcount is reduced
Transportation and Logistics
Industry experts have expressed concerns regarding near-term transportation cost increases These would hit Dollarama particularly hard as Dollarama is unique among industry peers It has only one distribution center Rather than invest in a second Dollarama recently purchased its existing distribution center in Montreal ndash which it previously leased from the Rossy family ndash for $394M (in addition to $232M spent on adjacent land) Other large Canadian value retailers generally have two distribution centers ndash one in the eastern half of the country and one in the western half
Rising fuel costs could result in materially higher transportation expenses as Dollarama distributes 92 of its merchandise through its single distribution center Industry experts suggest that shipping goods to Vancouver from Montreal via truck can be almost twice as expensive as shipping to Vancouver from China
We find it interesting that Dollarama chose to purchase property from managementrsquos family rather than follow industry norms and open a second distribution center in western Canada and that five of its six warehouses ndash all located in greater Montreal ndash are also leased from the Rossy family (the sixth warehouse is company-owned built on land purchased from the Rossy family)
MarketingDollarama has historically operated with no marketing expense However US peers spend 1-2 of revenue on average on marketing (see subsequent slides) As competition increases across the Canadian discount retail industry management may be forced to expand marketing efforts
21
Minimum Wage Growth Historically High And Accelerating Rapidly
Canada has seen fairly consistent minimum wage hikes since 2000 and minimum wage growth has outpaced inflation in all but
three years since the beginning of the millennium Dollarama has been able to manage minimum wage hikes and maintain
impressive margins since going public in 2009 Note however that minimum wage growth from 2009-17 was comparatively mild
relative to the prior half-decade Accelerating minimum wage growth through the near term will test managementrsquos ability to
insulate margins from rising labor costs
0
2
4
6
8
10
12
14
2001 2002 2003 2004 2005 2006 2007 2008 2009 2010 2011 2012 2013 2014 2015 2016 2017 2018YTD
Minimum Wage Growth Consistently Ahead of Inflation and Accelerating Rapidly
Weighted Average Minimum Wage Growth Canadian CPI Growth
Minimum wage growth across all Canadian provinces weighted by
province population
Management states that the vast majority of employees make more than minimum wage Nonetheless minimum wage hikes of 10-20 in
Canadarsquos most populous provinces could put material upward pressure on labor costs ndash particularly if these hikes spread to Quebec where
Dollaramarsquos distribution center and all of its warehouses are located Management includes a risk factor to this effect in its MDampA
210
215
220
225
230
235
240
245
250
255
260
FY 2018 EBITDA Margin FY 2018 EBITDA Margin with5 Labor Cost Hike
FY 2018 EBITDA Margin with10 Labor Cost Hike
EBITDA Margin Sensitivity to Labor Cost Hikes
12 weighted average minimum wage growth across Canada driven by
207 hikes in Ontario Average minimum wages could very realistically
continue to grow at high single-digit rates through the next ~2 years if
planned hikes are enacted
With labor costs representing about 10 of Dollarama revenue
profitability is materially sensitive to changes in this item
If labor costs were 10 higher in FY 2018 EBITDA margins would have
been slashed by 80 bps
Labor cost expansion of this magnitude would be significant but is not
necessarily out of the question within 2-3 years
Source Government of Canada
22
Lack Of Transparency Regarding Dollar City Is A Serious Concern
CEO Larry Rossy
and
CFO Michael Ross
mischaracterized
the sale by
attributing it to
vehicles which
has its own
categoryhellip
Why are Dollarama shopping carts being repurposed for Dollar City use
Perhaps they were sold above-market to Dollar City in FY 2013 when the relationship began Could this be the
reason for an unexplained $149M disposal of leasehold improvements that year
Source
1) Dollar City website and press
release announcing the relationship
Q ndash Keith Howlett ldquoOn Note 5 [of the FY
2013 Annual Report] I was trying to figure
out the leasehold improvements there
seemed to be some items called lsquodisposals
at costrsquo and therersquos sort of an offset thererdquo
A ndash Larry Rossy CEO ldquoI donrsquot know what
they are Yoursquore going to have to help me
out guys hererdquo
A ndash Michael Ross CFO ldquoDisposal of costs
that would be fixtures or related tohelliprdquo
A ndash Rossy ldquoI would say carsrdquo
A ndash Ross ldquoCars Yeah okay We sold a
few carsrdquo
Q ndash Howlett ldquoOh I see okay Well it
shows up as CAD 15M for a year thatrsquos a
lot of carsrdquo
A ndash Rossy ldquoOh itrsquos a very expensive
carrdquo
Source FY 2013 Q4 Earnings Call Source Dollarama
2013 Annual Report
In 2013 Dollarama entered into an agreement to export and sell products to Dollar City a Latin American dollar store with a
presence in El Salvador Guatemala and Colombia In exchange for selling goods to Dollar City ldquoat costrdquo plus a small markup
and providing business and operational expertise Dollarama was given an option to acquire the chain exercisable in February
2019 (since extended to February 2020)
Details about Dollar City are scarce Who is the management Where is company headquarters Who are the shareholders
Dollar Cityrsquos website provides limited information and not a single Dollar City manager was quoted at the initiation of the
relationship1 Though management claims to sell to Dollar City ldquoat costrdquo with a markup we have no way of determining how they
are calculating ldquocostrdquo It is more likely that Dollarama loads shared costs into the Dollar City bill that flatter Dollaramarsquos margins
and sells merchandise that isnrsquot selling well in Dollarama stores to Dollar City
More Competition Coming To An Already-Crowded Space
24
Evidence Of Dollarama Store Growth Slowing
The pace with which Dollarama opened stores through the past several years does not appear to be sustainable
Importantly the inevitable reversal in its pacing appears to be occurring this year
The Company opened just eight stores in Q2rsquo19 its lowest store opening count in any quarter of any recent year
Its YTD FY 2019 pace of 18 new stores is also trailing the average pace of recent fiscal years (28 openings) by
~35 Management did not provide a fully satisfactory explanation for this deficit
The slowdown in its pace of store openings could suggest that the Company is having a difficult time identifying
economically-viable locations as it seeks to grow its store count by close to 50 ndash still a very distant target
Fiscal YearStated New
Store Opening Goal
Q1 Q2 First Half Q3 Q4 Total
2019 60-70 10 8 18
2018 60-70 13 17 30 10 25 65
2017 60-70 8 13 21 18 26 65
2016 None 17 17 34 16 25 75
Source Dollarama financial filings
ldquoI want to ask about the pace of store
openings As you noted the slower start to
the year you did maintain the guidance for
this year But wondering about sort of further
beyond that obviously the store potential that
you put out there gives you room to remain at
that pace for a while But does the slower
same store sales assumption change your
thinking about how aggressively you want
to push new stores out thererdquo
- Mark Petrie CIBC
ldquoNo it does not It does not And that I would
also add that if the pace at which weve been
opening stores this year is slower than last year
as mentioned often that just relates to the
specific timing of real estate And if stores are
pushed closer to the end of the year it could be
that there is an overlap between a few more
stores at the end of this year or a few more
stores in the beginning of next year and the
end it will keep our pace of 60 to 70rdquo
- Michael Ross CFO Dollarama
ldquoReal estate timing issuesrdquo
do a poor job of explaining a
drop in H1 new store
openings of over a third
Source Dollarama Q2 FY 2019 Earnings Call
25
Dollarama Potentially Pushing The Limits Of The Canadian Market
Managementrsquos stated goal is to have 1700 stores across Canada by 2027 up from 1178 stores today We do not
believe that it can achieve this without risking significant cannibalization DOLrsquos target would imply a saturation level
higher than the largest US dollar stores (Dollar Tree and Dollar General) which also sell many more consumables and
grocery items Additionally Canada broadly has much lower levels of retail space per capita than the US suggesting
that Canadian concentration is even more pronounced all else equal
US Retail Square Footage Greater Than Canadian
Retail Square Footage
DOLrsquos Target Implies
Greater Than US
Saturation Despite
Narrower Concept
Source Wellington Management
Walmart is not opening stores in Canada suggesting that it believes
the Canadian market is saturated at 114 stores per million people ndash
about 69 of its US concentration (164 stores per million people)
Meanwhile Dollarama continues to expand within Canada despite
even higher Canadian concentration (327 per mil) relative to the US
concentration of large US dollar stores (452 per mil for a 72
ratio) This ratio would be over 100 at DOLrsquos 1700 store target
Higher Canada store
count vis-agrave-vis
comparable US
store count
compared to Walmart
Higher Canada store
concentration vis-agrave-
vis comparable US
store concentration
than Walmart
Retailers with similar store concentrations per capita across both the US and
Canada are effectively more concentrated in Canada vis-agrave-vis the total retail space
in either country
Store Count by Region
Canada US CanUS Ratio
WMT 410 5358 77
DOL ndash Present 1178 14750 80
DOL ndash Future 1700 14750 115
Store Count per Million People by Region
Canada US CanUS Ratio
WMT 114 164 69
DOL ndash Present 327 452 72
DOL ndash Future 472 452 104
DOL CN DG DLTR
Stores 1700 14760 14732
Population (M) 36 326 326
StoresCapita (M) 472 453 452
26
Dollarama Has Benefited From A Benign Competitive Environment
Large competitors have been shuttering Canadian stores continuously through the last four years due to company-
specific issues highlighted by the high-profile exits of Target and Big Lots from Canada12 We believe that this has been
a significant tailwind for Dollarama but one that is largely behind the Company at this juncture
Dollarama has been able to maintain significant share high margins and high returns on capital in large part due to
missteps among peers and the resulting lax competition This is likely unsustainable in a more competitive environment
as Dollarama has few material competitive advantages barriers to entry are low and its discount retailing strategy is not
unique Competent competition from growing industry players ndash Dollar Tree Canada Miniso and Amazon among others
ndash could be the straw that breaks the camelrsquos back for Dollaramarsquos profitability or growth (or both)
Fiscal YearCompany Exiting
CanadaStores Closed Revenue
DOL Revenue Capture
(Estimated)
Estimated Revenue Benefit
Revenue Boost
2018 Sears 200 $2000 3 $60 2
2017 Sears 100 $1000 3 $30 1
2016 Target 133 $2000 6 $120 4
2015 Big Lots 78 $155 10 $16 1
Last Four Year Average $56 2
Note All numbers are SPCM estimates
1) ldquoTarget Canada to close all stores by April 12rdquo
2) ldquoBig Lots Getting Back Out of Canadardquo
27
Light Competition Has Allowed The Company To Spend Nothing On Promotion ndash Until Now
Dollarama has no promotional expense Meanwhile promotional expenses average 1-2 of revenue among US
peers As established competitors continue to expand and as new competitors enter the market (Amazon included)
Dollaramarsquos no-cost marketing strategy may prove untenable
Promotional Expense
as a of Revenue
Intensifying Competition Threatens Dollaramarsquos
Passive Marketing Strategy
2016 2017 2018
BIG 180 180 170
FIVE 264 270 243
DLTR 021 029 048
DG 062 054 044
Average 132 133 126Source Huffington Post
Source Investorscom
The Canadian operation is also a relatively small part of the business However early results are
encouraging and despite competition in the Canadian market Dollar Tree has found success Longer
term the company is aiming for 1000 stores north of the border which does not seem unrealistic
Source Retail Environments
Calls with people at Dollar Tree suggest that the Company is working to
imitate elements of Dollaramarsquos strategy and store layout in its own
Canadian stores (eg raised shelves etc) and that it plans to expand
into Canada aggressively once its strategy is refined ndash likely in 2019
Source Company financial filings
28
Caught Between The Competition How Will Dollarama Fit In
Dollar Tree has maintained its reputation as a true dollar store nothing is priced higher than C$125 ($1 in the US)
Miniso has developed a reputation as a ldquonicerrdquo discount retailer items can cost up to C$25 but the environment is cleaner and
more modern and products are of better quality (but you can still get a dollar-level deal ndash most products are priced under C$10)
Dollarama has all the character of an old tired dollar store but without the dollar prices
Who will shop there unless management invests in store updates rather than opening new stores
Value-driven customers are by definition not loyal customers
Miniso
Clean and modern but cheap
Dollar Tree
No need for price tags everythingrsquos $1 Dollarama
Looks like Dollar Tree priced like Miniso
Irsquoll pass
29
Dollarama Makes No Effort To Appeal Millennials ndashThe Next (And Current) Shopping Generation
Dollarama has zero social media presence unlike all of its peers Not only is the Company out of touch with customers in
an industry which demands a high level of customer engagement but its brand is becoming demonstrably stale
Facebook Twitter Instagram YouTube LinkedIn Pinterest Google+
Dollar Tree Yes Yes Yes Yes Yes Yes No
Dollar General Yes Yes Yes Yes Yes Yes Yes
Family Dollar Yes Yes Yes Yes Yes Yes No
Big Lots Yes Yes Yes Yes Yes No Yes
Miniso (Canada N America)
Yes Yes Yes Yes Yes No No
Great Canadian Dollar Store
Yes Yes No No No No No
Dollarama No No No No No No No
Until now Dollarama has largely been a regional brand with satisfactory name recognition in its provincial home of Quebec
Now that the Company is making a bigger push into Anglophone Canada management should be more proactive in adapting its
strategy to new markets and to a new customer base Yet management continues to employ a strategy more befitting a sleepy
regional business it does not market or work to improve its brand it does not stay current with trends it keeps management
within the family and it is not expanding its logistics chain to support coast-to-coast growth (see subsequent slides)
Management wants Dollarama to be a national brand but it does not appear prepared to run a national business
Questionable Accounting And Financial Practices
31
Hedging Instruments A Material Source Of Profits In Recent Years
Dollaramarsquos sales are in Canadian dollars whereas a majority of its product purchases are US dollar-linked Management claims to enter
into CADUSD hedging arrangements to lock in near-term margins without having to adjust prices in response to FX movements However
management has nonetheless admittedly adjusted prices alongside unhedged peers in response to shifts in the CADUSD exchange rate
rendering its currency hedges a source of profit
Forex dynamics through the last two years have erased the large hedge benefit realized by Dollarama in FY 2016 but management reports
that gross margins have effectively remained flat through this period implying significant gross margin improvement in the underlying
business (see graphs below) As the currency hedge benefit has reversed through the last two years underlying gross margins have
purportedly risen by EXACTLY ENOUGH to keep total gross margins steady between 39-40 We find this oddly convenient ndash or at the very
least we question whether management will be able to maintain steady margins in the face of unfavorable FX rate dynamics in the future
Quick turnaround in
underlying
profitability Just in
time to keep the
declining forex hedge
benefit from dragging
down marginshellip
Even as FX hedge gains fell
from close to 8 of gross profit
in FY 2016 to a drag on gross
profit in FY 2018 gross margin
expanded by over 100 bps over
the same period implying gross
margin expansion ex-forex of
almost 300 bps within two years
for a retailer with gross margins
which were already unusually
high and whose margins had
contracted for four straight
years before the rapid reversal
32
Questionable Depreciation Assumptions
Dollarama changed its depreciation schedule for leasehold improvements (store fixtures) in FY 2015 moving from a 10-year to a 15-
year expected life1 However management did not concurrently lengthen the amortization schedule for tenant inducements
We find this mismatch curious as both quantities should be amortized depreciated over the expected life of a given lease
Adding to the confusion and appearance of foul play DOL discloses in its AIF that its average lease term is just 5 yrs and it just
started disclosing related-party dealing with Director Huw Thomas of SmartCentres ndash a REIT that lists DOL as a top 10 customer23
Lease term implied
by leasehold
depreciation expense
2-3x greater than that
implied by
amortization of
tenant allowance
Mismatch in implied
lease term
inappropriately
inflates EBIT
C$ MillionsFY
2013FY
2014FY
2015FY
2016FY
2017FY
2018
Amortization of Tenant Allowance $29 $35 $43 $49 $48 $51
Starting Balance Sheet Amount 168 207 232 280 344 386
Amortization as a of Asset Amount 173 169 185 175 140 132
Implied Lease Term 58 59 54 57 72 76
Leasehold Depreciation Expense $129 $166 $108 $141 $172 $202
Starting Balance Sheet Amount 1182 1348 1762 2113 2499 2867
Depreciation as a of Asset Amount 109 123 61 67 69 70
Implied Lease Term 92 81 163 150 145 142
Tenant Allowance Amortization Using Leasehold Depreciation Schedule
183 255 142 189 237 272
Reduction In EBIT If Both Were Put On Same Schedule (11) (10) (29) (30) (24) (24)
While the financial impact of this adjustment is limited signs of accounting impropriety do not reflect well on management and cast
doubt on the rest of Dollaramarsquos reports and accounting practices
1) FY 2015 Annual Report p 15 DOL also extended its store and warehouse equipment useful lives from 8-10yrs to 10-15yrs The total reduction of these three items was decrease of $10m in
FY15 depreciation expense
2) DOL states in its AIF p 11 ldquoThe Corporation typically enters into leases with base terms of ten years and options to renew for one or more periods of five years each The average time to
expiration of the Corporationrsquos leases is approximately five yearsrdquo
3) See governance slide on Huw Thomas
33
Capital Spending And Distribution Of Cash To Shareholders Are Overextending The Business
What happened
Management claimed in 2011 that the business was sufficiently cash-generative to support growth and dividendsshare buybacks
and that it would be able to pay down debt while pursuing both However debt has ballooned since then with net debt rising 8x
(and close to 3x versus EBITDA growth) Management is effectively levering up the balance sheet to support dividends and share
buybacks with CFO Michael Ross stating that he will continue to repurchase shares as long as the earnings yield remains above
the after-tax cost of debt
ldquoFor the past few years our cash flow has enabled
us to continue to pursue our growth plans and
continue to pay down debt Our free cash flow is
now sufficient to fund both those priorities
while enhancing new to shareholders through
a quarterly dividend payment We are able to
generate the free cash flow to do all of this
because we employ a simple growth oriented
business model at Dollaramardquo
ndash June 2011 Conference Call
Should Dollaramarsquos struggles become more pronounced ndash or should the
economic cycle turn for the worse ndash this debt overhang could loom large over
the business
Dollarama also consistently spends more on capex (as a percentage of sales) than its peers in the discount retail industry and
shows abnormally high capex versus depreciation and amortization We understand that Dollarama is a growing business which
could explain both patterns in part but it is not the only discount retailer which is investing in store growth
Dollarama DampA consistently
lt50 of capex and a lower
percentage of capex than
industry peers
Dollarama consistently
spends more on capex
(as a percentage of sales) than industry peers
00
05
10
15
20
25
0
200
400
600
800
1000
1200
1400
1600
1800
FY2012
FY2013
FY2014
FY2015
FY2016
FY2017
FY2018
Ne
t D
eb
tEB
ITD
A
Ne
t D
eb
t ($
C M
M)
Net DebtEBITDA Net Debt
0
50
100
150
200
250
300
FY2010 FY2011 FY2012 FY2013 FY2014 FY2015 FY2016 FY2017 FY2018
DampA as a of Capex and Intangibles Annual
DOL DLTR DG BIG FRED
0
1
2
3
4
5
6
7
8
FY2010 FY2011 FY2012 FY2013 FY2014 FY2015 FY2016 FY2017 FY2018
Capex and Intangibles as a of Sales Annual
DOL DLTR DG BIG FRED
34
Where Is The Capex Going
Management has explicitly identified and discussed various capital expenditures in Company filings over the last
five years but this still leaves a large gap versus what was actually spent
Additionally there is a large gap between the amount spent on software development and the amortization expense
associated with this activity suggesting that earnings may be inflated
Some of this is
directed towards
leasehold
improvements etc
but with
managementrsquos
focus on expansion
over existing store
improvements we
question where
management is
directing this capex
Capital Spending Software
on Software Amortization Difference
FY 2018 191 126 65
FY 2017 126 96 3
FY 2016 111 78 33
FY 2015 108 56 52
FY 2014 98 34 64
Are earnings
inflated due to
insufficient
amortization
Note also that a LinkedIn search for software developers at Dollarama turned up effectively nothing ndash at best one person with a tangentially
relevant title (source) So where is the software development capex going
Unlike discount retailer peers Dollarama
did not include software-related
spending in capex until recently and
records it separately in
ldquoAdditions to intangible assetsrdquo1
Do they do this to artificially deflate their
headline capex figure thereby inflating
reported free cash flow
Undiscussed Capital Spending (FY 2014 ndash 2018)
C$ Millions
$500K in capex spent per new store (375 new stores over past five years Source AIF) $1875
Capex spent on construction of 500K sqft warehouse in Montreal 679
$82M spent annually on expansion renovation or relocation of stores over five years 410
$232M spent on land acquisition 232
Discussed Capex Over Past Five Years $3196
Total Reported Capex (ex intangibles) $5200
Undiscussed Capex $2004
Software Capex and Software Amortization Discrepancy
C$ MillionsCapital Spending on
SoftwareSoftware Amortization Ratio
FY 2018 $191 $126 152
FY 2017 126 96 131
FY 2016 111 78 116
FY 2015 108 56 193
FY 2014 98 34 288
1) DOL explicitly started calling out software as a component of capex in Q3rsquo16 with the addition of footnote to guidance
35
Lack Of Transparency Regarding Store Closures And Associated Costs
It is standard industry practice to report store closures remodels and relocations alongside new store openings
However Dollarama reports only ldquoNet New Storesrdquo and does not break this number out in detail Questioned on this
in Q4 2016 management answered that a larger store base would inevitably result in more closures for reasons
outside of its control (fires mall renovations etc) and that reporting closures would therefore not communicate
meaningful information regarding the underlying performance of the business
We strongly disagree store closure information is vital to evaluating the health of a retail chain Management can
provide color on particular closures if it feels that they have been done for reasons other than performance but
failing to report closures entirely hides a key operating statistic from investors
Company Store Movement 2012 2013 2014 2015 2016 2017 2018
DLTR
Beginning 4101 4351 4671 4992 5367 13851 14334OpenedAcquired 278 345 343 391 8850 584 603
Closed 28 25 22 16 366 101 102Closed as of Beginning 07 06 05 03 68 07 07
BIG
Beginning 1398 1533 1495 1493 1460 1449 1432Opened 181 87 55 24 9 9 24Closed 46 46 58 57 20 26 40
Closed as of Beginning 33 30 39 38 14 18 28
DG
Beginning 9372 9937 10506 11132 11789 12483 13320Opened 625 625 650 700 730 900 1315Closed 60 56 24 43 36 63 101
Closed as of Beginning 06 06 02 04 03 05 08
FDO
Beginning 7023 7442 7916 -- -- -- --Opened 475 500 526 -- -- -- --Closed 56 26 400 -- -- -- --
Closed as of Beginning 08 03 51 -- -- -- --Overall Industry Average 09 07 20 07 23 07 08
Other high-growth dollar
stores like Dollar Tree and
Dollar General report store
closures ndash why doesnrsquot
Dollarama
Store closures for whatever
the reasons incur real
restructuring and other
costs Peer retailers
generally give detail on these
expenses whereas
Dollarama does not
We believe that Dollarama
should follow industry norms
and increase transparency
regarding store closures
US Dollar Store peers historically close 08 of stores annually yet Dollarama has not reported any recent closures
36
SSS Metrics Obfuscate Store Performance
Dollaramarsquos official ldquoComparable Store Salesrdquo figure includes ldquorelocated and expandedrdquo stores as ldquocomparable storesrdquo
therefore picking up growth in traffic which can be attributed to relocation-related improvements We believe that this likely
overstates Comparable Store Sales growth while also ignoring associated relocation-related expenses
1) See Q1 FY 2014 earnings call transcript
Management not only hides store closure data as a supposedly uninformative statistic but proclaims that it has NEVER closed a
store due to poor performance1 We find it difficult to believe that a retailer which has existed in its current format since 1992 has
never needed to close a store for poor performance If it has indeed never closed an underperforming store we wonder whether
management has been too ambitious in growing its store base without critically evaluating the profitability of each location
Huntsville Place Mall Jul 2015
7 John St Oct 2012
7 John St Jul 2015
Huntsville Place Mall Oct 2012
Huntsville ON
Relocation
Are these really entirely
ldquocomparablerdquo locations
781 Rue Principale Est May 2016
781 Rue Principale Est Jun 2009Le Carrefour Ste Agathe
May 2016
Ste-Agathe-Des-Monts QC
Relocation
Why assume the costs to
make this lt1 mile move
Notice
Dollarama
sign turned
inside-out
indicating
closure
37
Cash Flow Beginning To Turn Over Despite Efforts To Bolster Results
In H1 FY 2019 Dollaramarsquos cash flow contracted on a year-over-year basis for the first time since it went public ndash this
despite managementrsquos efforts to bolster earnings and EBITDA The contraction appears to be due in large part to
changes in working capital In particular we are concerned that growth in inventories suggests that management
overestimated near-to-medium term sales growth and that declining traffic is starting to weigh on the Company
Dollarama H1 Operating Cash Flow
C$ Millions FY 2014 FY 2015 FY 2016 FY 2017 FY 2018 FY 2019
Net Income $1054 $1221 $1603 $1895 $2265 $2433
CFO Before Working Capital 1394 1488 2124 2156 2769 2999
Changes in Working Capital (287) (236) (870) (110) (126) (886)
Net CFO 1107 1252 1253 2045 2644 2113
YoY Change $326 $322 $01 $792 $599 (531)
Source Dollarama
Governance Concerns
39
Related-Party Transactions With Rossy Family Raise Questions Over Governance And Costs
Fiscal YearRent amp Land Purchases
Paid to Rossys(C$ MM)
As a of Compensation Paid to Rossy Family
FY 2019 (To Date) $394 NA
FY 2018 184 1660
FY 2017 402 4459
FY 2016 179 1305
FY 2015 169 2752
FY 2014 163 1903
As noted Dollarama leases all but one of its five warehouses from the Rossy family and recently purchased land from the Rossys
for the construction of a sixth Management also recently purchased its Montreal distribution center from the Rossy family which
leased the facility to Dollarama until this February We understand that the Rossy family has close historical ties to the business
but this level of close dealing draws our attention particularly given the fact that management has focused on fortifying its
existing distribution footprint ndash closely tied to the Rossy family ndash rather than invest in distribution facilities in western Canada
where major competitors already have distribution centers
DLTR
Distribution
Center
Delta BC
DLTR
Distribution
Center
Mississauga ON
DOL
Distribution
Center
DOL
Warehouses
No Dollarama distribution facilities
located outside of a ~4 mile radius in
Montreal
bull Due to preferential relationship with
Rossy family
bull Will Dollarama be able to expand into
AngloWestern Canada efficiently
without logistics costs ballooning
bull Overly-exposed to fuel price hikes
and rising transportation costs
Related-Party Transactions Significant And Growing
Source Dollarama Financials
Dollar Tree Canada Distribution Centers
Dollarama Distribution Centers And Warehouses
Source DollarTree
Montreal QC
40
Related-Party Transactions With ldquoIndependentrdquo Director Huw Thomas Only Recently Disclosedhellip
Dollarama also leases stores from SmartCentres REIT whose recently-departed CEO Huw Thomas joined Dollaramarsquos
Board of Directors in 2011 and was a member of its audit committee through March 2017
His ldquoindependencerdquo was recently defended by a meandering 260-word footnote in Dollaramarsquos proxy which belies the
fact that Dollarama is a top 10 customer of SmartCentres
This is all the more suspicious in light of Dollaramarsquos questionable lease accounting highlighted earlier
Source Dollarama 2018 Proxy Circular
Note Dollarama did not start disclosing Huwrsquos related-party dealing until the 2017 proxy
circular in June 2017 right after he left the Audit Committee in March 2017
SmartCentres 2017 Annual Report
Dollarama Material To SmartCentres ndash A Top 10 Customer
SmartCentres Promotes Dollarama Relationship From 2011
Calloway (now SmartCentres) 2012 Annual Report
Dollaramarsquos Lengthy Meandering Defense Of Thomas
Huw As Independent Only Recently Disclosed (2017)
Dollarama Recently Changed Rent Expense Disclosure
Source Dollarama Q4rsquo17 Financials Note 15 Related Party Disclosure
Source Dollarama Q2rsquo18 Financials Note 13 Related Party Disclosure
41
House of Windsor House of RossyA Case Study In Nepotism
Neil Rossy had been the Senior VP of Merchandising Chief Merchandising Officer for 25 years prior to being named CEO in
2016 While his family is still a large shareholder they are not a controlling shareholder owning around 5 of the shares
outstanding We question whether the Rossyrsquos century-long family tradition of passing down leadership ndash one which also
persists at the Rossyrsquos ldquosister storerdquo ndash is appropriate for a public company or wise for the long-term health of the business
Salim Rossy
Opened first ldquoS Rossyrdquo
store in 1910 (up-market
department store concept)
George Rossy
President of S Rossy
1937-1973
Larry Rossy
Grew S Rossy from 20 to 44 stores before
converting all S Rossy stores to new
ldquoDollaramardquo concept in 1992 Sold majority
stake to Bain Capital in 2004 IPO in 2009
Neil Rossy
CEO of Dollarama as of 2016
Michael Rossy
Brother of George (one of ten siblings)
Founder amp CEO of ldquoRossyrdquo stores 1949-2010
Michael DiTullio
Son-in-Law of Michael
President amp CEO of Rossy since 2010
Does (or will) the family have a hard time parting with a business that has been in the family for four generations even if parting ways is
the right thing to do
Managing retail chains is very
much a family affair for the
Rossys ndash at both stores
Perhaps Neil was going to be
anointed CEO of Dollarama
regardless of the caliber of other
potential candidates
Letrsquos hope hersquos not Commodus
BONUS
Brother branches out
with separate storehellip
42
Insiders Incentivized To Grow EBITDA
Our earlier concerns about EBITDA quality are amplified by the fact that Dollarama executives are compensated
based on seemingly arbitrary and inflated EBITDA targets This gives management a strong incentive to be inefficient
users of capital as any dollar shifted from operating expense to capex has a direct benefit to key executives
For example note that managementrsquos perhaps questionable decision to purchase one of its Montreal warehouses
will shift what was until recently rent expense into depreciation This change in the accounting treatment of
Dollaramarsquos tenancy costs will provide a windfall to EBITDA potentially boosting management bonuses
Source Dollarama Proxy Circular p 30
43
What Is A Stretch EBITDA Goal
Bonuses are paid upon achievement of 11 EBITDA growth This level was ldquodesigned to be a stretch objectivehellip
attainable only with significant effortrdquo However this target was reset lower after FY 2014 ndash the only year during which
management did not handily exceed the target We believe this further calls into question the independence of the
board and its compensation committee
Year EBITDA Growth Objective EBITDA Growth Achieved
FY 2018 11 18
FY 2017 11 18
FY 2016 11 30
FY 2015 11 15
FY 2014 13 12
FY 2013 13 22
FY 2012 13 26
FY 2014 Management
misses growth objective
FY 2015 Growth objective
adjusted downwards
ldquoThe thresholds were revised by the
Human Resources and Compensation
Committee in the context of its annual
executive compensation review
conducted at the beginning of each fiscal
year to take into account among other
elements the fact that the base for the
calculation is growing every yearrdquo
Source FY15 Management Proxy Circular
What ldquoother elementsrdquo were
taken into account
Source Dollarama
44
Insiders Selling While Company Buys Back Stock At Elevated Prices
Management has been buying back shares at elevated prices through the last several years even while pursuing growth leaving little capital for
(sorely needed) store updates or other uses The average repurchase price since Q1 FY17 is about on par with current share prices and ~40
below our target Since Q2 FY18 the average buyback price has been 25 above current levels
Furthermore just as the Company has been buying back stock at elevated prices insiders have been offloading shares Notably it is evident
from past and current proxy statements that CFO Michael Ross has never held onto shares for which he has been granted options his
common equity ownership is listed at zero every year Note that as the CFO it is he who is dictating the share buyback decision in large part
PeriodShares
Repurchased
Value of Repurchase
(C$ M)
Average Price (Split-
Adj) (C$)
Q1 FY 2017 1542066 1393 3011
Q2 FY 2017 2027080 1842 3029
Q3 FY 2017 1571500 1578 3347
Q4 FY 2017 2279522 2241 3277
Q1 FY 2018 1687240 1806 3568
Q2 FY 2018 1303900 1602 4095
Q3 FY 2018 687700 931 4513
Q4 FY 2018 2425700 3788 5205
Q1 FY 2019 94500 145 5115
Q2 FY 20191 1347341 700 5195
Total 14966549 16026 3797
Discount to Current Share Price 1
Total (Since Q2 FY 2018)
5859141 7170 4815
Discount to Current Share Price -20
Using Company Funds To Overpay For DOL Shareshellip While Insiders Sell Into The Companyrsquos Bidhellip
Source DOL filings and Bloomberg
Insider Title Date Sold SharesProceeds (C$ M)
Price Sold (Split-Adj)(C$)
Nicolas Hien Senior Vice President 482016 6203 06 3224
Michael Ross CFO 482016 80000 74 3083
Paul Roche Vice President 4182016 10000 09 3000
Geoffrey Robillard Senior Vice President 6172016 33500 31 3085
John Assaly Vice President 9272016 30000 30 3333
Geoffrey Robillard Senior Vice President 472017 20000 23 3833
Paul Roche Vice President 472017 23100 26 3752
Josee Kouri Corporate Secretary 4142017 8000 09 3750
Geoffrey Robillard Senior Vice President 9142017 5000 07 4667
Geoffrey Robillard Senior Vice President 12112017 10000 16 5333
John Assaly Vice President 12132017 14096 22 5202
Geoffrey Robillard Senior Vice President 1262018 15000 24 5333
John Thomas Independent Director 1262018 6000 10 5556
Geoffrey Robillard Senior Vice President 6152018 50000 75 5000
John Assaly Vice President 6192018 13404 21 5222
Nicolas Hein Senior Vice President 6222018 36750 19 5170
Paul Roche Vice President 6222018 24000 13 5417
We do not like the fact that insiders have been selling into share buybacks while
the Company levers itself up with short-term debt to support those repurchases
It appears that the execs are levering up the business in part to enrich themselves1) All share information prior to Q2 lsquo19 reflects pre-split data except
Split-Adjusted Average Prices Q2 lsquo19 repurchases were as stated
45
Rossy Family Selling Shares Despite Control Over C-Suite
Notably Founder and former CEO Larry Rossy has trimmed his position tremendously through the last several years
Though this is to be expected to some extent as he recently ceded control of the business we believe that his
ownership stake should be held to a higher standard given his insistence on keeping the business in the family
If he plans to keep the c-suite under a Rossy dynasty the familyrsquos personal stake in the business should reflect that
Source Bloomberg
Valuation And Price Target
47
The Market Has Not Taken Threats To Dollarama Seriously ndash But Optimism Is Ebbing
Analysts are generally bullish on the stock focusing primarily on managementrsquos growth story and taking current
profitability levels for granted The prospect of new competitive threats to a business which has until now seen limited
competition ndash and the risk that prevailing margins are unsustainable even through the near term ndash go underappreciated
Dollaramarsquos poor Q2 cooled analystsrsquo optimism to some extent but we believe that the reaction was largely reactive and
superficial as they adjusted their price targets in such a way that in aggregate they saw exactly the same upside after the
post-Q2 dip as they did before The market still does not fully appreciate the magnitude of the threats facing Dollarama
All price targets in C$ Before Q2 Release After Q2 Release
Firm Recommendation Target PriceUpside (on 82818) Recommendation Target Price
Upside (on 9172018)
Upside (Present)
RBC Capital Markets Outperform $5500 12 Outperform $5200 22 35
Raymond James Outperform $5567 13 Outperform $5000 17 30
Macquarie Outperform $5633 14 Outperform $4900 15 27
BMO Capital Markets Outperform $6100 24 Market Perform $4700 10 22
CIBC Capital Markets Outperform $5900 20 Neutral $4600 8 20
Desjardins Securities Buy $5800 18 Hold $4500 6 17
Veritas Investment Research Co Buy $5600 14 Buy $4800 13 25
Industrial Alliance Securities Hold $5450 11 Buy $5450 28 42
Canaccord Genuity Buy $5900 20 Buy $5500 29 43
Barclays Equal Weight $5200 5 Equal Weight $4400 3 14
TD Securities Buy $5900 20 Hold $4900 15 27
Accountability Research Corp Buy $5400 10 Buy $5000 17 30
National Bank Financial Outperform $5567 13 Sector Perform $4800 13 25
Scotia Capital Sector Outperform $5567 13 Sector Outperform $5050 19 31
Wells Fargo Securities Market Perform $5300 7 Market Perform $4000 -6 4
AVERAGE $5626 14 $4853 14 26
While analysts are still not sufficiently critical of Dollarama the more recent downward move in the stock and subsequent analyst
downgrades may suggest that the market could be primed to evaluate the Company and its growth story with a more discerning eye
We believe that the issues which we highlight in this report will provoke further professional skepticism among analysts and investors
48
Dollarama Not Priced To Perfection ndashPriced Beyond Perfection
We can get close to DOLrsquos current valuation only if we value it as a mature ex-growth business today under
managementrsquos lofty goals for the business for ten years into the future applying no discounts for time
business risk etc
Managementrsquos ten-year store target
bull Current store count 1178 (70 of long-
term target)
Even if Dollarama were a mature business today under managementrsquos long-term targets for the business
DOL stock would not have no upside to current share prices
The market is pricing DOL beyond perfection ndash a valuation this lofty cannot be justified today
Mature Business ValuationC$ MM unless noted
Stores 1700
Revenue per Store $32
Total Revenue $5440
Operating Margin 220
Operating Profit $1197
Interest Expense $50
Tax (275) $315
Net Income $831
Diluted Shares Outstanding 332
EPS $251
PE Multiple 152x
Target Price $3815
Upside -1
Average operating margin since Q1 FY 2016
bull Assumes that DOLrsquos unusually high
margins are sustainable despite
intensifying competition loss of recent FX
benefit and customer pushback against
price hikes
Mature revenue per store estimate
bull Current average revenue per store
~$28M (875 of long-term target)
Industry median NTM PE multiple
bull Assigns no discount to DOL due to
declining store traffic vs peers incoming
competitive threats inefficient distribution
network etc
49
Dollarama Not Priced To Perfection ndashPriced Beyond Perfection (Continued)
Put another way The market is implicitly taking it for
granted that Dollarama will achieve its lofty ten-year
growth targets assuming sustained profitability levels
and per-store efficiency ndash and applying close to the
industry median FY1 EVEBITDA multiple to Dollaramarsquos
FY 2027 EBITDA
Just under ten-
year target
What kind of growth is the market implicitly betting on if
we value Dollarama on par with peers
bull 150 more stores than managementrsquos ten-year target ndash
within nine years
bull 48 CAGR in revenue per store
bull Zero margin compression
FY 2027 Estimates if Management Executes Growth Plans Perfectly
(C$ MM unless noted)
Stores (Year-End) 1688
Revenue per Store $33
Total Revenue $5503
Gross Margin 380
Gross Profit $2093
SGampA per Store 04
SGampA Total 689
EBITDA (FY 2027) $1404
Market Cap 12752
Debt 1880
Cash 182
Enterprise Value $14450
EVEBITDA (FY 2027) 103x
Industry Median EVEBITDA (FY1) 110x
Average gross
margin ex-
hedge gains
since FY 2016
Mature revenue
per store
estimate (15
growth CAGR)
FY 2018 SGampA
per Store
Implied FY 2027
multiple close to
industry median FY1
multiple
FY 2027 Estimates To Justify Prevailing Valuation (C$ MM unless noted)
Stores (Year-End) 1858
Revenue per Store $44
Total Revenue $7929
Gross Margin 380
Gross Profit $3016
SGampA per Store 04
SGampA Total 755
EBITDA (FY 2027) $2261
EVEBITDA (FY 2027) 62x
Enterprise Value 13947
Debt 1880
Cash 182
Equity Valuation $12249
Diluted Shares Outstanding 332
Target Price $3693
Current Price $3845
158 over ten-
year target in
nine years
48 growth
CAGR in
SalesStore
Industry median
FY1 multiple
discounted
75 annually
Average gross
margin ex-
hedge gains
since FY 2016
FY 2018 SGampA
per Store
High forecast gives
us 4 DOWNSIDE
50
Valuation Far Out Of Line With Peers And Historical Multiples
DOL shares trade at a 50-60 premium to peers in the discount retail industry The market is valuing DOL much more like a high-
growth tech company than a brick-and-mortar dollar store (and one with concerning fundamental trends at that) Note that this still
holds true even after DOL shares traded down significantly following its recent Q2 earnings report
It is difficult to justify a valuation this high even if one is bullish on DOL vis-agrave-vis the rest of the industry
Company Ticker
3-Year Consensus Revenue
CAGR
FY 2018 EBITDA Margin
PE(NTM)
PE(FY2)
EVEBITDA(NTM)
EVEBITDA(FY2)
EVSales(NTM)
Dollar Tree DLTR 43 121 139x 134x 91x 88x 10x
Dollar General DG 75 104 163x 162x 112x 112x 12x
Big Lots BIG 06 85 87x 87x 52x 53x 04x
Five Below FIVE 210 162 360x 412x 2113x 243x 32x
Canadian Tire CTC CN 20 90 179x 181x 82x 83x 10x
Metro MRU CN 80 73 142x 139x 99x 101x 08x
MEDIAN 59 97 152x 151x 95x 110x 10x
Dollarama DOL CN 85 255 229x 223x 164x 163x 41x
DOL PREMIUM 505 477 727 509 3057
Does DOL ndash a value retailer
demonstrating concerning
fundamental trends ndash deserve
to be valued on par with
higher-growth industries and
completely out of line with its
industry peers
Profitability is impressive but
likely unsustainable in the face
of growing competition
Enterprise Value Revenues Enterprise Value Adj EBITDA Price Adj EPSDOL shares also trade at
a significant premium to
historical multiples
despite unsustainable
margins an increasingly
saturated market and
rising competitive
threats
51
Does The Market Think Dollarama Is A Dollar Store Or A Premium Retail Brand
Dollarama is valued much more closely to premium retail brands than its discount retail peer group
A bull might ldquojustifyrdquo this by pointing to Dollaramarsquos profitability profile and growth expectations but its EBITDA margins are so
out of line with those of its peers that one is forced to question whether they are sustainable (at best) or honest (at worst)
As discussed Dollaramarsquos consensus sales growth numbers also ignore looming fundamental threats to the business
Company TickerGross
Margin (NTM)
EBITDA Margin (NTM)
Sales Growth (NTM)
EVEBITDA(NTM)
PE(NTM)
EVSales(NTM)
Dollar Tree DLTR 31 11 28 91x 139x 10x
Dollar General DG 31 10 89 112x 163x 12x
Big Lots BIG 41 7 -08 52x 87x 04x
Five Below FIVE 36 15 203 2113x 360x 32x
Canadian Tire CTC CN 34 12 40 82x 179x 10x
Metro MRU CN 19 7 88 99x 142x 08x
MEDIAN 33 11 64 95x 152x 10x
Dollarama DOL CN 40 25 99 164x 229x 41x
DOL PREMIUM 727 505 3057
How does Dollarama support EBITDA
margins more than double those of its
peer group and in line with premium
global retail brands
Company TickerGross
Margin (NTM)
EBITDA Margin (NTM)
Sales Growth (NTM)
EVEBITDA (NTM)
PE (NTM)EVSales
(NTM)
Ferragamo SFER IM 65 17 48 160x 260x 26x
Hermes RMS FP 69 38 84 200x 350x 78x
Prada 1913 HK 74 22 78 100x 210x 23x
Tiffany amp Co TIF 64 24 51 113x 196x 28x
MEDIAN 67 23 65 137x 235x 27x
Dollarama DOL CN 40 25 99 164x 229x 41x
DOL PREMIUM 197 -26 519
Does a discount retailer facing
fundamental headwinds deserve to be
priced 50 or more above its peer
group and closer to global
premium retail brands
52
Margins And Multiples Materially Out-of-Line With Peers
We do not believe that Dollaramarsquos profitability levels ndash which are entirely out of line with peers ndash are justified or sustainable in an
industry as competitive as deep discount retail The Company is already struggling to meet store count growth targets raising the
likelihood that its store growth plan will be dilutive to margins The market assigns a premium valuation to Dollarama on the basis
of relatively high growth expectations and the Companyrsquos industry-leading margins However as discussed throughout this
report we doubt both managementrsquos ability to meet its growth targets and its ability to maintain prevailing profitability levels The
likelihood that the Company will be able to achieve BOTH of these goals simultaneously is even slimmer Accordingly we believe
that the basis for Dollaramarsquos substantial share price premium is unfounded
Dollaramarsquos margin profile is grossly out of
line with peers and we find evidence of
aggressive accounting and questionable
business practices that can partly explain the
issue We doubt that this would be sustainable
even if management wasnrsquot growing the chain
How will a lowno-moat business with falling
per-store traffic be able to maintain its
remarkable profitability advantage while
aggressively expanding its store base
DLTRDG
BIG
FIVE
CTCCN
MRUCNWNCN
DOLCN
0
5
10
15
20
25
30
10 15 20 25 30 35 40 45 50
EBIT
DA
Mar
gin
Gross Margin
Dollarama Margins Completely Out Of Line With Peers
The premium in Dollaramarsquos share
price is driven by the marketrsquos trust in
managementrsquos growth initiatives and
its recognition of the Companyrsquos
dominant profitability
However neither its profitability
advantage nor its growth prospects
are sustainable The likelihood that
management simultaneously
preserves BOTH is extremely low
Big Lots (BIG) Dollar Tree (DLTR) Dollar General (DG) Metro Inc (MRU CN) and Canadian Tire (CTC CN)
x
5x
10x
15x
20x
25x
BIG DLTR MRU CN DG CTC CN DOL CN
PE (NTM)
x
4x
8x
12x
16x
20x
BIG DLTR MRU CN DG CTC CN DOL CN
EVEBITDA
53
Valuing DOL As A Mature Business In The Canadian Market ~40 Downside
C$ MM unlessotherwise noted
Current Run-Rate Valuation
Priced Beyond Perfection
Reasonable Downside
Stores 1170 1700 1500
RevenuesStore 28 32 30
Revenues 3320 5440 4500
Operating Margin 23 22 18
Operating Profit 764 1197 801
Interest Expense 42 50 50
Tax 275 198 315 207
Net Income 523 831 544
Shares 332 332 332
EPS $158 $251 $164
Multiple 24x 16x ~15x
Share Price $3845 $3966 $2460
Upside (Downside) 3 Approx -40
As discussed earlier at 1700 stores DOL would have greater penetration than both Dollar General (DG) and Dollar Tree (DLTR)
which both offer a much broader assortment of goods including perishablesconsumables Meanwhile the US appears to be
overstored versus Canada It is likely unreasonable for DOL to target per capita penetration levels on par with its US peers
Even if we assume that DOL can reach similar penetration levels and match company
growth targets ndash with steady margins no less ndash DOL has little upside
Valuing DOL as a mature business at its upper penetration bound implies ~40 downside
in a more realistic yet still generous scenario in which DOL is valued in line with peers
Higher Canada
store count vis-agrave-
vis comparable US
store count
compared to
Walmart
Higher Canada
store concentration
vis-agrave-vis
comparable US
store concentration
than Walmart
Achieving
managementrsquos
1700 store target
would put DOL at a
higher per capita
penetration level
than US peers
Store Count by Region
Canada US CanUS Ratio
WMT 410 5358 77DOL ndash Present 1178 14750 80DOL ndash Future 1700 14750 115
DOL CN DG DLTR
Stores 1700 14760 14732
Population (M) 36 326 326
StoresCapita (M) 472 453 452
Downside Run-Rate Operating Margin Estimate
ProfitabilityCost Measure JustificationGross Margin Target Recent Historical Average 370
Current SGampA Recent Historical Average 167
Add
Advertising Expense Normalization
Industry Average05
Rent Expense NormalizationAdjusting for Depreciation Rearranged
from Rent Expense 05
Depreciation Catch-Up Matching DampA schedules 15
Pro Forma SGampA 192
Pro Forma Operating Margin 178
Store Count per Mil People by Region
Canada US CanUS Ratio
WMT 114 164 69DOL ndash Present 327 452 72DOL ndash Future 472 452 104

20
Costs Rising On Multiple Fronts
While management may have largely exhausted avenues for price increases and efficiency gains other industry and Company
developments threaten to drive up costs through the near term
Cost Driver Explanation
TariffsA significant share of goods (~20 according to industry experts) are sourced either directly or indirectly from the US Tariffs could increase costs on these goods materially
Minimum Wage Hikes
Provincial minimum wages in Canada generally rise much more frequently than do US minimum wages and many are scheduled to rise on an annual basis based on CPI growth Minimum wage hikes have been particularly significant of late (see below) Even provinces whose minimum wages are not tied to CPI growth have seen or are set to see material minimum wage hikes in the near future Notable recent and near-term changes are as follows
bull Alberta From $1360 to $1500 on October 1 2018 (103 increase)bull British Columbia From $1265 to $1385 on June 1 2019 to $1460 on June 1 2020 and to $1520 on June 1 2021 (63 CAGR)bull Ontario From $1160 to $1400 on January 1 2018 (207 increase) and to $1500 on January 1 2019 (additional 71 year-over-year increase)
Will rise according to Ontario CPI growth every October 1 each subsequent year New Ontario Premier Doug Ford is looking to reverse these plansbull Quebec Just increased to $1200 (+66 in May 2018) Significant political push to set provincial minimum wage at 50 of average provincial
minimum wage by 2020bull Manitoba New Brunswick Newfoundland Nova Scotia Ontario Saskatchewan and Yukon Annual minimum wage hikes according to national or
local CPI growth
Employee remuneration for FY 2018 was just over 10 of Dollarama revenue This cost item could realistically grow at a high single-digit rate over the next 2-3 years even if headcount is reduced
Transportation and Logistics
Industry experts have expressed concerns regarding near-term transportation cost increases These would hit Dollarama particularly hard as Dollarama is unique among industry peers It has only one distribution center Rather than invest in a second Dollarama recently purchased its existing distribution center in Montreal ndash which it previously leased from the Rossy family ndash for $394M (in addition to $232M spent on adjacent land) Other large Canadian value retailers generally have two distribution centers ndash one in the eastern half of the country and one in the western half
Rising fuel costs could result in materially higher transportation expenses as Dollarama distributes 92 of its merchandise through its single distribution center Industry experts suggest that shipping goods to Vancouver from Montreal via truck can be almost twice as expensive as shipping to Vancouver from China
We find it interesting that Dollarama chose to purchase property from managementrsquos family rather than follow industry norms and open a second distribution center in western Canada and that five of its six warehouses ndash all located in greater Montreal ndash are also leased from the Rossy family (the sixth warehouse is company-owned built on land purchased from the Rossy family)
MarketingDollarama has historically operated with no marketing expense However US peers spend 1-2 of revenue on average on marketing (see subsequent slides) As competition increases across the Canadian discount retail industry management may be forced to expand marketing efforts
21
Minimum Wage Growth Historically High And Accelerating Rapidly
Canada has seen fairly consistent minimum wage hikes since 2000 and minimum wage growth has outpaced inflation in all but
three years since the beginning of the millennium Dollarama has been able to manage minimum wage hikes and maintain
impressive margins since going public in 2009 Note however that minimum wage growth from 2009-17 was comparatively mild
relative to the prior half-decade Accelerating minimum wage growth through the near term will test managementrsquos ability to
insulate margins from rising labor costs
0
2
4
6
8
10
12
14
2001 2002 2003 2004 2005 2006 2007 2008 2009 2010 2011 2012 2013 2014 2015 2016 2017 2018YTD
Minimum Wage Growth Consistently Ahead of Inflation and Accelerating Rapidly
Weighted Average Minimum Wage Growth Canadian CPI Growth
Minimum wage growth across all Canadian provinces weighted by
province population
Management states that the vast majority of employees make more than minimum wage Nonetheless minimum wage hikes of 10-20 in
Canadarsquos most populous provinces could put material upward pressure on labor costs ndash particularly if these hikes spread to Quebec where
Dollaramarsquos distribution center and all of its warehouses are located Management includes a risk factor to this effect in its MDampA
210
215
220
225
230
235
240
245
250
255
260
FY 2018 EBITDA Margin FY 2018 EBITDA Margin with5 Labor Cost Hike
FY 2018 EBITDA Margin with10 Labor Cost Hike
EBITDA Margin Sensitivity to Labor Cost Hikes
12 weighted average minimum wage growth across Canada driven by
207 hikes in Ontario Average minimum wages could very realistically
continue to grow at high single-digit rates through the next ~2 years if
planned hikes are enacted
With labor costs representing about 10 of Dollarama revenue
profitability is materially sensitive to changes in this item
If labor costs were 10 higher in FY 2018 EBITDA margins would have
been slashed by 80 bps
Labor cost expansion of this magnitude would be significant but is not
necessarily out of the question within 2-3 years
Source Government of Canada
22
Lack Of Transparency Regarding Dollar City Is A Serious Concern
CEO Larry Rossy
and
CFO Michael Ross
mischaracterized
the sale by
attributing it to
vehicles which
has its own
categoryhellip
Why are Dollarama shopping carts being repurposed for Dollar City use
Perhaps they were sold above-market to Dollar City in FY 2013 when the relationship began Could this be the
reason for an unexplained $149M disposal of leasehold improvements that year
Source
1) Dollar City website and press
release announcing the relationship
Q ndash Keith Howlett ldquoOn Note 5 [of the FY
2013 Annual Report] I was trying to figure
out the leasehold improvements there
seemed to be some items called lsquodisposals
at costrsquo and therersquos sort of an offset thererdquo
A ndash Larry Rossy CEO ldquoI donrsquot know what
they are Yoursquore going to have to help me
out guys hererdquo
A ndash Michael Ross CFO ldquoDisposal of costs
that would be fixtures or related tohelliprdquo
A ndash Rossy ldquoI would say carsrdquo
A ndash Ross ldquoCars Yeah okay We sold a
few carsrdquo
Q ndash Howlett ldquoOh I see okay Well it
shows up as CAD 15M for a year thatrsquos a
lot of carsrdquo
A ndash Rossy ldquoOh itrsquos a very expensive
carrdquo
Source FY 2013 Q4 Earnings Call Source Dollarama
2013 Annual Report
In 2013 Dollarama entered into an agreement to export and sell products to Dollar City a Latin American dollar store with a
presence in El Salvador Guatemala and Colombia In exchange for selling goods to Dollar City ldquoat costrdquo plus a small markup
and providing business and operational expertise Dollarama was given an option to acquire the chain exercisable in February
2019 (since extended to February 2020)
Details about Dollar City are scarce Who is the management Where is company headquarters Who are the shareholders
Dollar Cityrsquos website provides limited information and not a single Dollar City manager was quoted at the initiation of the
relationship1 Though management claims to sell to Dollar City ldquoat costrdquo with a markup we have no way of determining how they
are calculating ldquocostrdquo It is more likely that Dollarama loads shared costs into the Dollar City bill that flatter Dollaramarsquos margins
and sells merchandise that isnrsquot selling well in Dollarama stores to Dollar City
More Competition Coming To An Already-Crowded Space
24
Evidence Of Dollarama Store Growth Slowing
The pace with which Dollarama opened stores through the past several years does not appear to be sustainable
Importantly the inevitable reversal in its pacing appears to be occurring this year
The Company opened just eight stores in Q2rsquo19 its lowest store opening count in any quarter of any recent year
Its YTD FY 2019 pace of 18 new stores is also trailing the average pace of recent fiscal years (28 openings) by
~35 Management did not provide a fully satisfactory explanation for this deficit
The slowdown in its pace of store openings could suggest that the Company is having a difficult time identifying
economically-viable locations as it seeks to grow its store count by close to 50 ndash still a very distant target
Fiscal YearStated New
Store Opening Goal
Q1 Q2 First Half Q3 Q4 Total
2019 60-70 10 8 18
2018 60-70 13 17 30 10 25 65
2017 60-70 8 13 21 18 26 65
2016 None 17 17 34 16 25 75
Source Dollarama financial filings
ldquoI want to ask about the pace of store
openings As you noted the slower start to
the year you did maintain the guidance for
this year But wondering about sort of further
beyond that obviously the store potential that
you put out there gives you room to remain at
that pace for a while But does the slower
same store sales assumption change your
thinking about how aggressively you want
to push new stores out thererdquo
- Mark Petrie CIBC
ldquoNo it does not It does not And that I would
also add that if the pace at which weve been
opening stores this year is slower than last year
as mentioned often that just relates to the
specific timing of real estate And if stores are
pushed closer to the end of the year it could be
that there is an overlap between a few more
stores at the end of this year or a few more
stores in the beginning of next year and the
end it will keep our pace of 60 to 70rdquo
- Michael Ross CFO Dollarama
ldquoReal estate timing issuesrdquo
do a poor job of explaining a
drop in H1 new store
openings of over a third
Source Dollarama Q2 FY 2019 Earnings Call
25
Dollarama Potentially Pushing The Limits Of The Canadian Market
Managementrsquos stated goal is to have 1700 stores across Canada by 2027 up from 1178 stores today We do not
believe that it can achieve this without risking significant cannibalization DOLrsquos target would imply a saturation level
higher than the largest US dollar stores (Dollar Tree and Dollar General) which also sell many more consumables and
grocery items Additionally Canada broadly has much lower levels of retail space per capita than the US suggesting
that Canadian concentration is even more pronounced all else equal
US Retail Square Footage Greater Than Canadian
Retail Square Footage
DOLrsquos Target Implies
Greater Than US
Saturation Despite
Narrower Concept
Source Wellington Management
Walmart is not opening stores in Canada suggesting that it believes
the Canadian market is saturated at 114 stores per million people ndash
about 69 of its US concentration (164 stores per million people)
Meanwhile Dollarama continues to expand within Canada despite
even higher Canadian concentration (327 per mil) relative to the US
concentration of large US dollar stores (452 per mil for a 72
ratio) This ratio would be over 100 at DOLrsquos 1700 store target
Higher Canada store
count vis-agrave-vis
comparable US
store count
compared to Walmart
Higher Canada store
concentration vis-agrave-
vis comparable US
store concentration
than Walmart
Retailers with similar store concentrations per capita across both the US and
Canada are effectively more concentrated in Canada vis-agrave-vis the total retail space
in either country
Store Count by Region
Canada US CanUS Ratio
WMT 410 5358 77
DOL ndash Present 1178 14750 80
DOL ndash Future 1700 14750 115
Store Count per Million People by Region
Canada US CanUS Ratio
WMT 114 164 69
DOL ndash Present 327 452 72
DOL ndash Future 472 452 104
DOL CN DG DLTR
Stores 1700 14760 14732
Population (M) 36 326 326
StoresCapita (M) 472 453 452
26
Dollarama Has Benefited From A Benign Competitive Environment
Large competitors have been shuttering Canadian stores continuously through the last four years due to company-
specific issues highlighted by the high-profile exits of Target and Big Lots from Canada12 We believe that this has been
a significant tailwind for Dollarama but one that is largely behind the Company at this juncture
Dollarama has been able to maintain significant share high margins and high returns on capital in large part due to
missteps among peers and the resulting lax competition This is likely unsustainable in a more competitive environment
as Dollarama has few material competitive advantages barriers to entry are low and its discount retailing strategy is not
unique Competent competition from growing industry players ndash Dollar Tree Canada Miniso and Amazon among others
ndash could be the straw that breaks the camelrsquos back for Dollaramarsquos profitability or growth (or both)
Fiscal YearCompany Exiting
CanadaStores Closed Revenue
DOL Revenue Capture
(Estimated)
Estimated Revenue Benefit
Revenue Boost
2018 Sears 200 $2000 3 $60 2
2017 Sears 100 $1000 3 $30 1
2016 Target 133 $2000 6 $120 4
2015 Big Lots 78 $155 10 $16 1
Last Four Year Average $56 2
Note All numbers are SPCM estimates
1) ldquoTarget Canada to close all stores by April 12rdquo
2) ldquoBig Lots Getting Back Out of Canadardquo
27
Light Competition Has Allowed The Company To Spend Nothing On Promotion ndash Until Now
Dollarama has no promotional expense Meanwhile promotional expenses average 1-2 of revenue among US
peers As established competitors continue to expand and as new competitors enter the market (Amazon included)
Dollaramarsquos no-cost marketing strategy may prove untenable
Promotional Expense
as a of Revenue
Intensifying Competition Threatens Dollaramarsquos
Passive Marketing Strategy
2016 2017 2018
BIG 180 180 170
FIVE 264 270 243
DLTR 021 029 048
DG 062 054 044
Average 132 133 126Source Huffington Post
Source Investorscom
The Canadian operation is also a relatively small part of the business However early results are
encouraging and despite competition in the Canadian market Dollar Tree has found success Longer
term the company is aiming for 1000 stores north of the border which does not seem unrealistic
Source Retail Environments
Calls with people at Dollar Tree suggest that the Company is working to
imitate elements of Dollaramarsquos strategy and store layout in its own
Canadian stores (eg raised shelves etc) and that it plans to expand
into Canada aggressively once its strategy is refined ndash likely in 2019
Source Company financial filings
28
Caught Between The Competition How Will Dollarama Fit In
Dollar Tree has maintained its reputation as a true dollar store nothing is priced higher than C$125 ($1 in the US)
Miniso has developed a reputation as a ldquonicerrdquo discount retailer items can cost up to C$25 but the environment is cleaner and
more modern and products are of better quality (but you can still get a dollar-level deal ndash most products are priced under C$10)
Dollarama has all the character of an old tired dollar store but without the dollar prices
Who will shop there unless management invests in store updates rather than opening new stores
Value-driven customers are by definition not loyal customers
Miniso
Clean and modern but cheap
Dollar Tree
No need for price tags everythingrsquos $1 Dollarama
Looks like Dollar Tree priced like Miniso
Irsquoll pass
29
Dollarama Makes No Effort To Appeal Millennials ndashThe Next (And Current) Shopping Generation
Dollarama has zero social media presence unlike all of its peers Not only is the Company out of touch with customers in
an industry which demands a high level of customer engagement but its brand is becoming demonstrably stale
Facebook Twitter Instagram YouTube LinkedIn Pinterest Google+
Dollar Tree Yes Yes Yes Yes Yes Yes No
Dollar General Yes Yes Yes Yes Yes Yes Yes
Family Dollar Yes Yes Yes Yes Yes Yes No
Big Lots Yes Yes Yes Yes Yes No Yes
Miniso (Canada N America)
Yes Yes Yes Yes Yes No No
Great Canadian Dollar Store
Yes Yes No No No No No
Dollarama No No No No No No No
Until now Dollarama has largely been a regional brand with satisfactory name recognition in its provincial home of Quebec
Now that the Company is making a bigger push into Anglophone Canada management should be more proactive in adapting its
strategy to new markets and to a new customer base Yet management continues to employ a strategy more befitting a sleepy
regional business it does not market or work to improve its brand it does not stay current with trends it keeps management
within the family and it is not expanding its logistics chain to support coast-to-coast growth (see subsequent slides)
Management wants Dollarama to be a national brand but it does not appear prepared to run a national business
Questionable Accounting And Financial Practices
31
Hedging Instruments A Material Source Of Profits In Recent Years
Dollaramarsquos sales are in Canadian dollars whereas a majority of its product purchases are US dollar-linked Management claims to enter
into CADUSD hedging arrangements to lock in near-term margins without having to adjust prices in response to FX movements However
management has nonetheless admittedly adjusted prices alongside unhedged peers in response to shifts in the CADUSD exchange rate
rendering its currency hedges a source of profit
Forex dynamics through the last two years have erased the large hedge benefit realized by Dollarama in FY 2016 but management reports
that gross margins have effectively remained flat through this period implying significant gross margin improvement in the underlying
business (see graphs below) As the currency hedge benefit has reversed through the last two years underlying gross margins have
purportedly risen by EXACTLY ENOUGH to keep total gross margins steady between 39-40 We find this oddly convenient ndash or at the very
least we question whether management will be able to maintain steady margins in the face of unfavorable FX rate dynamics in the future
Quick turnaround in
underlying
profitability Just in
time to keep the
declining forex hedge
benefit from dragging
down marginshellip
Even as FX hedge gains fell
from close to 8 of gross profit
in FY 2016 to a drag on gross
profit in FY 2018 gross margin
expanded by over 100 bps over
the same period implying gross
margin expansion ex-forex of
almost 300 bps within two years
for a retailer with gross margins
which were already unusually
high and whose margins had
contracted for four straight
years before the rapid reversal
32
Questionable Depreciation Assumptions
Dollarama changed its depreciation schedule for leasehold improvements (store fixtures) in FY 2015 moving from a 10-year to a 15-
year expected life1 However management did not concurrently lengthen the amortization schedule for tenant inducements
We find this mismatch curious as both quantities should be amortized depreciated over the expected life of a given lease
Adding to the confusion and appearance of foul play DOL discloses in its AIF that its average lease term is just 5 yrs and it just
started disclosing related-party dealing with Director Huw Thomas of SmartCentres ndash a REIT that lists DOL as a top 10 customer23
Lease term implied
by leasehold
depreciation expense
2-3x greater than that
implied by
amortization of
tenant allowance
Mismatch in implied
lease term
inappropriately
inflates EBIT
C$ MillionsFY
2013FY
2014FY
2015FY
2016FY
2017FY
2018
Amortization of Tenant Allowance $29 $35 $43 $49 $48 $51
Starting Balance Sheet Amount 168 207 232 280 344 386
Amortization as a of Asset Amount 173 169 185 175 140 132
Implied Lease Term 58 59 54 57 72 76
Leasehold Depreciation Expense $129 $166 $108 $141 $172 $202
Starting Balance Sheet Amount 1182 1348 1762 2113 2499 2867
Depreciation as a of Asset Amount 109 123 61 67 69 70
Implied Lease Term 92 81 163 150 145 142
Tenant Allowance Amortization Using Leasehold Depreciation Schedule
183 255 142 189 237 272
Reduction In EBIT If Both Were Put On Same Schedule (11) (10) (29) (30) (24) (24)
While the financial impact of this adjustment is limited signs of accounting impropriety do not reflect well on management and cast
doubt on the rest of Dollaramarsquos reports and accounting practices
1) FY 2015 Annual Report p 15 DOL also extended its store and warehouse equipment useful lives from 8-10yrs to 10-15yrs The total reduction of these three items was decrease of $10m in
FY15 depreciation expense
2) DOL states in its AIF p 11 ldquoThe Corporation typically enters into leases with base terms of ten years and options to renew for one or more periods of five years each The average time to
expiration of the Corporationrsquos leases is approximately five yearsrdquo
3) See governance slide on Huw Thomas
33
Capital Spending And Distribution Of Cash To Shareholders Are Overextending The Business
What happened
Management claimed in 2011 that the business was sufficiently cash-generative to support growth and dividendsshare buybacks
and that it would be able to pay down debt while pursuing both However debt has ballooned since then with net debt rising 8x
(and close to 3x versus EBITDA growth) Management is effectively levering up the balance sheet to support dividends and share
buybacks with CFO Michael Ross stating that he will continue to repurchase shares as long as the earnings yield remains above
the after-tax cost of debt
ldquoFor the past few years our cash flow has enabled
us to continue to pursue our growth plans and
continue to pay down debt Our free cash flow is
now sufficient to fund both those priorities
while enhancing new to shareholders through
a quarterly dividend payment We are able to
generate the free cash flow to do all of this
because we employ a simple growth oriented
business model at Dollaramardquo
ndash June 2011 Conference Call
Should Dollaramarsquos struggles become more pronounced ndash or should the
economic cycle turn for the worse ndash this debt overhang could loom large over
the business
Dollarama also consistently spends more on capex (as a percentage of sales) than its peers in the discount retail industry and
shows abnormally high capex versus depreciation and amortization We understand that Dollarama is a growing business which
could explain both patterns in part but it is not the only discount retailer which is investing in store growth
Dollarama DampA consistently
lt50 of capex and a lower
percentage of capex than
industry peers
Dollarama consistently
spends more on capex
(as a percentage of sales) than industry peers
00
05
10
15
20
25
0
200
400
600
800
1000
1200
1400
1600
1800
FY2012
FY2013
FY2014
FY2015
FY2016
FY2017
FY2018
Ne
t D
eb
tEB
ITD
A
Ne
t D
eb
t ($
C M
M)
Net DebtEBITDA Net Debt
0
50
100
150
200
250
300
FY2010 FY2011 FY2012 FY2013 FY2014 FY2015 FY2016 FY2017 FY2018
DampA as a of Capex and Intangibles Annual
DOL DLTR DG BIG FRED
0
1
2
3
4
5
6
7
8
FY2010 FY2011 FY2012 FY2013 FY2014 FY2015 FY2016 FY2017 FY2018
Capex and Intangibles as a of Sales Annual
DOL DLTR DG BIG FRED
34
Where Is The Capex Going
Management has explicitly identified and discussed various capital expenditures in Company filings over the last
five years but this still leaves a large gap versus what was actually spent
Additionally there is a large gap between the amount spent on software development and the amortization expense
associated with this activity suggesting that earnings may be inflated
Some of this is
directed towards
leasehold
improvements etc
but with
managementrsquos
focus on expansion
over existing store
improvements we
question where
management is
directing this capex
Capital Spending Software
on Software Amortization Difference
FY 2018 191 126 65
FY 2017 126 96 3
FY 2016 111 78 33
FY 2015 108 56 52
FY 2014 98 34 64
Are earnings
inflated due to
insufficient
amortization
Note also that a LinkedIn search for software developers at Dollarama turned up effectively nothing ndash at best one person with a tangentially
relevant title (source) So where is the software development capex going
Unlike discount retailer peers Dollarama
did not include software-related
spending in capex until recently and
records it separately in
ldquoAdditions to intangible assetsrdquo1
Do they do this to artificially deflate their
headline capex figure thereby inflating
reported free cash flow
Undiscussed Capital Spending (FY 2014 ndash 2018)
C$ Millions
$500K in capex spent per new store (375 new stores over past five years Source AIF) $1875
Capex spent on construction of 500K sqft warehouse in Montreal 679
$82M spent annually on expansion renovation or relocation of stores over five years 410
$232M spent on land acquisition 232
Discussed Capex Over Past Five Years $3196
Total Reported Capex (ex intangibles) $5200
Undiscussed Capex $2004
Software Capex and Software Amortization Discrepancy
C$ MillionsCapital Spending on
SoftwareSoftware Amortization Ratio
FY 2018 $191 $126 152
FY 2017 126 96 131
FY 2016 111 78 116
FY 2015 108 56 193
FY 2014 98 34 288
1) DOL explicitly started calling out software as a component of capex in Q3rsquo16 with the addition of footnote to guidance
35
Lack Of Transparency Regarding Store Closures And Associated Costs
It is standard industry practice to report store closures remodels and relocations alongside new store openings
However Dollarama reports only ldquoNet New Storesrdquo and does not break this number out in detail Questioned on this
in Q4 2016 management answered that a larger store base would inevitably result in more closures for reasons
outside of its control (fires mall renovations etc) and that reporting closures would therefore not communicate
meaningful information regarding the underlying performance of the business
We strongly disagree store closure information is vital to evaluating the health of a retail chain Management can
provide color on particular closures if it feels that they have been done for reasons other than performance but
failing to report closures entirely hides a key operating statistic from investors
Company Store Movement 2012 2013 2014 2015 2016 2017 2018
DLTR
Beginning 4101 4351 4671 4992 5367 13851 14334OpenedAcquired 278 345 343 391 8850 584 603
Closed 28 25 22 16 366 101 102Closed as of Beginning 07 06 05 03 68 07 07
BIG
Beginning 1398 1533 1495 1493 1460 1449 1432Opened 181 87 55 24 9 9 24Closed 46 46 58 57 20 26 40
Closed as of Beginning 33 30 39 38 14 18 28
DG
Beginning 9372 9937 10506 11132 11789 12483 13320Opened 625 625 650 700 730 900 1315Closed 60 56 24 43 36 63 101
Closed as of Beginning 06 06 02 04 03 05 08
FDO
Beginning 7023 7442 7916 -- -- -- --Opened 475 500 526 -- -- -- --Closed 56 26 400 -- -- -- --
Closed as of Beginning 08 03 51 -- -- -- --Overall Industry Average 09 07 20 07 23 07 08
Other high-growth dollar
stores like Dollar Tree and
Dollar General report store
closures ndash why doesnrsquot
Dollarama
Store closures for whatever
the reasons incur real
restructuring and other
costs Peer retailers
generally give detail on these
expenses whereas
Dollarama does not
We believe that Dollarama
should follow industry norms
and increase transparency
regarding store closures
US Dollar Store peers historically close 08 of stores annually yet Dollarama has not reported any recent closures
36
SSS Metrics Obfuscate Store Performance
Dollaramarsquos official ldquoComparable Store Salesrdquo figure includes ldquorelocated and expandedrdquo stores as ldquocomparable storesrdquo
therefore picking up growth in traffic which can be attributed to relocation-related improvements We believe that this likely
overstates Comparable Store Sales growth while also ignoring associated relocation-related expenses
1) See Q1 FY 2014 earnings call transcript
Management not only hides store closure data as a supposedly uninformative statistic but proclaims that it has NEVER closed a
store due to poor performance1 We find it difficult to believe that a retailer which has existed in its current format since 1992 has
never needed to close a store for poor performance If it has indeed never closed an underperforming store we wonder whether
management has been too ambitious in growing its store base without critically evaluating the profitability of each location
Huntsville Place Mall Jul 2015
7 John St Oct 2012
7 John St Jul 2015
Huntsville Place Mall Oct 2012
Huntsville ON
Relocation
Are these really entirely
ldquocomparablerdquo locations
781 Rue Principale Est May 2016
781 Rue Principale Est Jun 2009Le Carrefour Ste Agathe
May 2016
Ste-Agathe-Des-Monts QC
Relocation
Why assume the costs to
make this lt1 mile move
Notice
Dollarama
sign turned
inside-out
indicating
closure
37
Cash Flow Beginning To Turn Over Despite Efforts To Bolster Results
In H1 FY 2019 Dollaramarsquos cash flow contracted on a year-over-year basis for the first time since it went public ndash this
despite managementrsquos efforts to bolster earnings and EBITDA The contraction appears to be due in large part to
changes in working capital In particular we are concerned that growth in inventories suggests that management
overestimated near-to-medium term sales growth and that declining traffic is starting to weigh on the Company
Dollarama H1 Operating Cash Flow
C$ Millions FY 2014 FY 2015 FY 2016 FY 2017 FY 2018 FY 2019
Net Income $1054 $1221 $1603 $1895 $2265 $2433
CFO Before Working Capital 1394 1488 2124 2156 2769 2999
Changes in Working Capital (287) (236) (870) (110) (126) (886)
Net CFO 1107 1252 1253 2045 2644 2113
YoY Change $326 $322 $01 $792 $599 (531)
Source Dollarama
Governance Concerns
39
Related-Party Transactions With Rossy Family Raise Questions Over Governance And Costs
Fiscal YearRent amp Land Purchases
Paid to Rossys(C$ MM)
As a of Compensation Paid to Rossy Family
FY 2019 (To Date) $394 NA
FY 2018 184 1660
FY 2017 402 4459
FY 2016 179 1305
FY 2015 169 2752
FY 2014 163 1903
As noted Dollarama leases all but one of its five warehouses from the Rossy family and recently purchased land from the Rossys
for the construction of a sixth Management also recently purchased its Montreal distribution center from the Rossy family which
leased the facility to Dollarama until this February We understand that the Rossy family has close historical ties to the business
but this level of close dealing draws our attention particularly given the fact that management has focused on fortifying its
existing distribution footprint ndash closely tied to the Rossy family ndash rather than invest in distribution facilities in western Canada
where major competitors already have distribution centers
DLTR
Distribution
Center
Delta BC
DLTR
Distribution
Center
Mississauga ON
DOL
Distribution
Center
DOL
Warehouses
No Dollarama distribution facilities
located outside of a ~4 mile radius in
Montreal
bull Due to preferential relationship with
Rossy family
bull Will Dollarama be able to expand into
AngloWestern Canada efficiently
without logistics costs ballooning
bull Overly-exposed to fuel price hikes
and rising transportation costs
Related-Party Transactions Significant And Growing
Source Dollarama Financials
Dollar Tree Canada Distribution Centers
Dollarama Distribution Centers And Warehouses
Source DollarTree
Montreal QC
40
Related-Party Transactions With ldquoIndependentrdquo Director Huw Thomas Only Recently Disclosedhellip
Dollarama also leases stores from SmartCentres REIT whose recently-departed CEO Huw Thomas joined Dollaramarsquos
Board of Directors in 2011 and was a member of its audit committee through March 2017
His ldquoindependencerdquo was recently defended by a meandering 260-word footnote in Dollaramarsquos proxy which belies the
fact that Dollarama is a top 10 customer of SmartCentres
This is all the more suspicious in light of Dollaramarsquos questionable lease accounting highlighted earlier
Source Dollarama 2018 Proxy Circular
Note Dollarama did not start disclosing Huwrsquos related-party dealing until the 2017 proxy
circular in June 2017 right after he left the Audit Committee in March 2017
SmartCentres 2017 Annual Report
Dollarama Material To SmartCentres ndash A Top 10 Customer
SmartCentres Promotes Dollarama Relationship From 2011
Calloway (now SmartCentres) 2012 Annual Report
Dollaramarsquos Lengthy Meandering Defense Of Thomas
Huw As Independent Only Recently Disclosed (2017)
Dollarama Recently Changed Rent Expense Disclosure
Source Dollarama Q4rsquo17 Financials Note 15 Related Party Disclosure
Source Dollarama Q2rsquo18 Financials Note 13 Related Party Disclosure
41
House of Windsor House of RossyA Case Study In Nepotism
Neil Rossy had been the Senior VP of Merchandising Chief Merchandising Officer for 25 years prior to being named CEO in
2016 While his family is still a large shareholder they are not a controlling shareholder owning around 5 of the shares
outstanding We question whether the Rossyrsquos century-long family tradition of passing down leadership ndash one which also
persists at the Rossyrsquos ldquosister storerdquo ndash is appropriate for a public company or wise for the long-term health of the business
Salim Rossy
Opened first ldquoS Rossyrdquo
store in 1910 (up-market
department store concept)
George Rossy
President of S Rossy
1937-1973
Larry Rossy
Grew S Rossy from 20 to 44 stores before
converting all S Rossy stores to new
ldquoDollaramardquo concept in 1992 Sold majority
stake to Bain Capital in 2004 IPO in 2009
Neil Rossy
CEO of Dollarama as of 2016
Michael Rossy
Brother of George (one of ten siblings)
Founder amp CEO of ldquoRossyrdquo stores 1949-2010
Michael DiTullio
Son-in-Law of Michael
President amp CEO of Rossy since 2010
Does (or will) the family have a hard time parting with a business that has been in the family for four generations even if parting ways is
the right thing to do
Managing retail chains is very
much a family affair for the
Rossys ndash at both stores
Perhaps Neil was going to be
anointed CEO of Dollarama
regardless of the caliber of other
potential candidates
Letrsquos hope hersquos not Commodus
BONUS
Brother branches out
with separate storehellip
42
Insiders Incentivized To Grow EBITDA
Our earlier concerns about EBITDA quality are amplified by the fact that Dollarama executives are compensated
based on seemingly arbitrary and inflated EBITDA targets This gives management a strong incentive to be inefficient
users of capital as any dollar shifted from operating expense to capex has a direct benefit to key executives
For example note that managementrsquos perhaps questionable decision to purchase one of its Montreal warehouses
will shift what was until recently rent expense into depreciation This change in the accounting treatment of
Dollaramarsquos tenancy costs will provide a windfall to EBITDA potentially boosting management bonuses
Source Dollarama Proxy Circular p 30
43
What Is A Stretch EBITDA Goal
Bonuses are paid upon achievement of 11 EBITDA growth This level was ldquodesigned to be a stretch objectivehellip
attainable only with significant effortrdquo However this target was reset lower after FY 2014 ndash the only year during which
management did not handily exceed the target We believe this further calls into question the independence of the
board and its compensation committee
Year EBITDA Growth Objective EBITDA Growth Achieved
FY 2018 11 18
FY 2017 11 18
FY 2016 11 30
FY 2015 11 15
FY 2014 13 12
FY 2013 13 22
FY 2012 13 26
FY 2014 Management
misses growth objective
FY 2015 Growth objective
adjusted downwards
ldquoThe thresholds were revised by the
Human Resources and Compensation
Committee in the context of its annual
executive compensation review
conducted at the beginning of each fiscal
year to take into account among other
elements the fact that the base for the
calculation is growing every yearrdquo
Source FY15 Management Proxy Circular
What ldquoother elementsrdquo were
taken into account
Source Dollarama
44
Insiders Selling While Company Buys Back Stock At Elevated Prices
Management has been buying back shares at elevated prices through the last several years even while pursuing growth leaving little capital for
(sorely needed) store updates or other uses The average repurchase price since Q1 FY17 is about on par with current share prices and ~40
below our target Since Q2 FY18 the average buyback price has been 25 above current levels
Furthermore just as the Company has been buying back stock at elevated prices insiders have been offloading shares Notably it is evident
from past and current proxy statements that CFO Michael Ross has never held onto shares for which he has been granted options his
common equity ownership is listed at zero every year Note that as the CFO it is he who is dictating the share buyback decision in large part
PeriodShares
Repurchased
Value of Repurchase
(C$ M)
Average Price (Split-
Adj) (C$)
Q1 FY 2017 1542066 1393 3011
Q2 FY 2017 2027080 1842 3029
Q3 FY 2017 1571500 1578 3347
Q4 FY 2017 2279522 2241 3277
Q1 FY 2018 1687240 1806 3568
Q2 FY 2018 1303900 1602 4095
Q3 FY 2018 687700 931 4513
Q4 FY 2018 2425700 3788 5205
Q1 FY 2019 94500 145 5115
Q2 FY 20191 1347341 700 5195
Total 14966549 16026 3797
Discount to Current Share Price 1
Total (Since Q2 FY 2018)
5859141 7170 4815
Discount to Current Share Price -20
Using Company Funds To Overpay For DOL Shareshellip While Insiders Sell Into The Companyrsquos Bidhellip
Source DOL filings and Bloomberg
Insider Title Date Sold SharesProceeds (C$ M)
Price Sold (Split-Adj)(C$)
Nicolas Hien Senior Vice President 482016 6203 06 3224
Michael Ross CFO 482016 80000 74 3083
Paul Roche Vice President 4182016 10000 09 3000
Geoffrey Robillard Senior Vice President 6172016 33500 31 3085
John Assaly Vice President 9272016 30000 30 3333
Geoffrey Robillard Senior Vice President 472017 20000 23 3833
Paul Roche Vice President 472017 23100 26 3752
Josee Kouri Corporate Secretary 4142017 8000 09 3750
Geoffrey Robillard Senior Vice President 9142017 5000 07 4667
Geoffrey Robillard Senior Vice President 12112017 10000 16 5333
John Assaly Vice President 12132017 14096 22 5202
Geoffrey Robillard Senior Vice President 1262018 15000 24 5333
John Thomas Independent Director 1262018 6000 10 5556
Geoffrey Robillard Senior Vice President 6152018 50000 75 5000
John Assaly Vice President 6192018 13404 21 5222
Nicolas Hein Senior Vice President 6222018 36750 19 5170
Paul Roche Vice President 6222018 24000 13 5417
We do not like the fact that insiders have been selling into share buybacks while
the Company levers itself up with short-term debt to support those repurchases
It appears that the execs are levering up the business in part to enrich themselves1) All share information prior to Q2 lsquo19 reflects pre-split data except
Split-Adjusted Average Prices Q2 lsquo19 repurchases were as stated
45
Rossy Family Selling Shares Despite Control Over C-Suite
Notably Founder and former CEO Larry Rossy has trimmed his position tremendously through the last several years
Though this is to be expected to some extent as he recently ceded control of the business we believe that his
ownership stake should be held to a higher standard given his insistence on keeping the business in the family
If he plans to keep the c-suite under a Rossy dynasty the familyrsquos personal stake in the business should reflect that
Source Bloomberg
Valuation And Price Target
47
The Market Has Not Taken Threats To Dollarama Seriously ndash But Optimism Is Ebbing
Analysts are generally bullish on the stock focusing primarily on managementrsquos growth story and taking current
profitability levels for granted The prospect of new competitive threats to a business which has until now seen limited
competition ndash and the risk that prevailing margins are unsustainable even through the near term ndash go underappreciated
Dollaramarsquos poor Q2 cooled analystsrsquo optimism to some extent but we believe that the reaction was largely reactive and
superficial as they adjusted their price targets in such a way that in aggregate they saw exactly the same upside after the
post-Q2 dip as they did before The market still does not fully appreciate the magnitude of the threats facing Dollarama
All price targets in C$ Before Q2 Release After Q2 Release
Firm Recommendation Target PriceUpside (on 82818) Recommendation Target Price
Upside (on 9172018)
Upside (Present)
RBC Capital Markets Outperform $5500 12 Outperform $5200 22 35
Raymond James Outperform $5567 13 Outperform $5000 17 30
Macquarie Outperform $5633 14 Outperform $4900 15 27
BMO Capital Markets Outperform $6100 24 Market Perform $4700 10 22
CIBC Capital Markets Outperform $5900 20 Neutral $4600 8 20
Desjardins Securities Buy $5800 18 Hold $4500 6 17
Veritas Investment Research Co Buy $5600 14 Buy $4800 13 25
Industrial Alliance Securities Hold $5450 11 Buy $5450 28 42
Canaccord Genuity Buy $5900 20 Buy $5500 29 43
Barclays Equal Weight $5200 5 Equal Weight $4400 3 14
TD Securities Buy $5900 20 Hold $4900 15 27
Accountability Research Corp Buy $5400 10 Buy $5000 17 30
National Bank Financial Outperform $5567 13 Sector Perform $4800 13 25
Scotia Capital Sector Outperform $5567 13 Sector Outperform $5050 19 31
Wells Fargo Securities Market Perform $5300 7 Market Perform $4000 -6 4
AVERAGE $5626 14 $4853 14 26
While analysts are still not sufficiently critical of Dollarama the more recent downward move in the stock and subsequent analyst
downgrades may suggest that the market could be primed to evaluate the Company and its growth story with a more discerning eye
We believe that the issues which we highlight in this report will provoke further professional skepticism among analysts and investors
48
Dollarama Not Priced To Perfection ndashPriced Beyond Perfection
We can get close to DOLrsquos current valuation only if we value it as a mature ex-growth business today under
managementrsquos lofty goals for the business for ten years into the future applying no discounts for time
business risk etc
Managementrsquos ten-year store target
bull Current store count 1178 (70 of long-
term target)
Even if Dollarama were a mature business today under managementrsquos long-term targets for the business
DOL stock would not have no upside to current share prices
The market is pricing DOL beyond perfection ndash a valuation this lofty cannot be justified today
Mature Business ValuationC$ MM unless noted
Stores 1700
Revenue per Store $32
Total Revenue $5440
Operating Margin 220
Operating Profit $1197
Interest Expense $50
Tax (275) $315
Net Income $831
Diluted Shares Outstanding 332
EPS $251
PE Multiple 152x
Target Price $3815
Upside -1
Average operating margin since Q1 FY 2016
bull Assumes that DOLrsquos unusually high
margins are sustainable despite
intensifying competition loss of recent FX
benefit and customer pushback against
price hikes
Mature revenue per store estimate
bull Current average revenue per store
~$28M (875 of long-term target)
Industry median NTM PE multiple
bull Assigns no discount to DOL due to
declining store traffic vs peers incoming
competitive threats inefficient distribution
network etc
49
Dollarama Not Priced To Perfection ndashPriced Beyond Perfection (Continued)
Put another way The market is implicitly taking it for
granted that Dollarama will achieve its lofty ten-year
growth targets assuming sustained profitability levels
and per-store efficiency ndash and applying close to the
industry median FY1 EVEBITDA multiple to Dollaramarsquos
FY 2027 EBITDA
Just under ten-
year target
What kind of growth is the market implicitly betting on if
we value Dollarama on par with peers
bull 150 more stores than managementrsquos ten-year target ndash
within nine years
bull 48 CAGR in revenue per store
bull Zero margin compression
FY 2027 Estimates if Management Executes Growth Plans Perfectly
(C$ MM unless noted)
Stores (Year-End) 1688
Revenue per Store $33
Total Revenue $5503
Gross Margin 380
Gross Profit $2093
SGampA per Store 04
SGampA Total 689
EBITDA (FY 2027) $1404
Market Cap 12752
Debt 1880
Cash 182
Enterprise Value $14450
EVEBITDA (FY 2027) 103x
Industry Median EVEBITDA (FY1) 110x
Average gross
margin ex-
hedge gains
since FY 2016
Mature revenue
per store
estimate (15
growth CAGR)
FY 2018 SGampA
per Store
Implied FY 2027
multiple close to
industry median FY1
multiple
FY 2027 Estimates To Justify Prevailing Valuation (C$ MM unless noted)
Stores (Year-End) 1858
Revenue per Store $44
Total Revenue $7929
Gross Margin 380
Gross Profit $3016
SGampA per Store 04
SGampA Total 755
EBITDA (FY 2027) $2261
EVEBITDA (FY 2027) 62x
Enterprise Value 13947
Debt 1880
Cash 182
Equity Valuation $12249
Diluted Shares Outstanding 332
Target Price $3693
Current Price $3845
158 over ten-
year target in
nine years
48 growth
CAGR in
SalesStore
Industry median
FY1 multiple
discounted
75 annually
Average gross
margin ex-
hedge gains
since FY 2016
FY 2018 SGampA
per Store
High forecast gives
us 4 DOWNSIDE
50
Valuation Far Out Of Line With Peers And Historical Multiples
DOL shares trade at a 50-60 premium to peers in the discount retail industry The market is valuing DOL much more like a high-
growth tech company than a brick-and-mortar dollar store (and one with concerning fundamental trends at that) Note that this still
holds true even after DOL shares traded down significantly following its recent Q2 earnings report
It is difficult to justify a valuation this high even if one is bullish on DOL vis-agrave-vis the rest of the industry
Company Ticker
3-Year Consensus Revenue
CAGR
FY 2018 EBITDA Margin
PE(NTM)
PE(FY2)
EVEBITDA(NTM)
EVEBITDA(FY2)
EVSales(NTM)
Dollar Tree DLTR 43 121 139x 134x 91x 88x 10x
Dollar General DG 75 104 163x 162x 112x 112x 12x
Big Lots BIG 06 85 87x 87x 52x 53x 04x
Five Below FIVE 210 162 360x 412x 2113x 243x 32x
Canadian Tire CTC CN 20 90 179x 181x 82x 83x 10x
Metro MRU CN 80 73 142x 139x 99x 101x 08x
MEDIAN 59 97 152x 151x 95x 110x 10x
Dollarama DOL CN 85 255 229x 223x 164x 163x 41x
DOL PREMIUM 505 477 727 509 3057
Does DOL ndash a value retailer
demonstrating concerning
fundamental trends ndash deserve
to be valued on par with
higher-growth industries and
completely out of line with its
industry peers
Profitability is impressive but
likely unsustainable in the face
of growing competition
Enterprise Value Revenues Enterprise Value Adj EBITDA Price Adj EPSDOL shares also trade at
a significant premium to
historical multiples
despite unsustainable
margins an increasingly
saturated market and
rising competitive
threats
51
Does The Market Think Dollarama Is A Dollar Store Or A Premium Retail Brand
Dollarama is valued much more closely to premium retail brands than its discount retail peer group
A bull might ldquojustifyrdquo this by pointing to Dollaramarsquos profitability profile and growth expectations but its EBITDA margins are so
out of line with those of its peers that one is forced to question whether they are sustainable (at best) or honest (at worst)
As discussed Dollaramarsquos consensus sales growth numbers also ignore looming fundamental threats to the business
Company TickerGross
Margin (NTM)
EBITDA Margin (NTM)
Sales Growth (NTM)
EVEBITDA(NTM)
PE(NTM)
EVSales(NTM)
Dollar Tree DLTR 31 11 28 91x 139x 10x
Dollar General DG 31 10 89 112x 163x 12x
Big Lots BIG 41 7 -08 52x 87x 04x
Five Below FIVE 36 15 203 2113x 360x 32x
Canadian Tire CTC CN 34 12 40 82x 179x 10x
Metro MRU CN 19 7 88 99x 142x 08x
MEDIAN 33 11 64 95x 152x 10x
Dollarama DOL CN 40 25 99 164x 229x 41x
DOL PREMIUM 727 505 3057
How does Dollarama support EBITDA
margins more than double those of its
peer group and in line with premium
global retail brands
Company TickerGross
Margin (NTM)
EBITDA Margin (NTM)
Sales Growth (NTM)
EVEBITDA (NTM)
PE (NTM)EVSales
(NTM)
Ferragamo SFER IM 65 17 48 160x 260x 26x
Hermes RMS FP 69 38 84 200x 350x 78x
Prada 1913 HK 74 22 78 100x 210x 23x
Tiffany amp Co TIF 64 24 51 113x 196x 28x
MEDIAN 67 23 65 137x 235x 27x
Dollarama DOL CN 40 25 99 164x 229x 41x
DOL PREMIUM 197 -26 519
Does a discount retailer facing
fundamental headwinds deserve to be
priced 50 or more above its peer
group and closer to global
premium retail brands
52
Margins And Multiples Materially Out-of-Line With Peers
We do not believe that Dollaramarsquos profitability levels ndash which are entirely out of line with peers ndash are justified or sustainable in an
industry as competitive as deep discount retail The Company is already struggling to meet store count growth targets raising the
likelihood that its store growth plan will be dilutive to margins The market assigns a premium valuation to Dollarama on the basis
of relatively high growth expectations and the Companyrsquos industry-leading margins However as discussed throughout this
report we doubt both managementrsquos ability to meet its growth targets and its ability to maintain prevailing profitability levels The
likelihood that the Company will be able to achieve BOTH of these goals simultaneously is even slimmer Accordingly we believe
that the basis for Dollaramarsquos substantial share price premium is unfounded
Dollaramarsquos margin profile is grossly out of
line with peers and we find evidence of
aggressive accounting and questionable
business practices that can partly explain the
issue We doubt that this would be sustainable
even if management wasnrsquot growing the chain
How will a lowno-moat business with falling
per-store traffic be able to maintain its
remarkable profitability advantage while
aggressively expanding its store base
DLTRDG
BIG
FIVE
CTCCN
MRUCNWNCN
DOLCN
0
5
10
15
20
25
30
10 15 20 25 30 35 40 45 50
EBIT
DA
Mar
gin
Gross Margin
Dollarama Margins Completely Out Of Line With Peers
The premium in Dollaramarsquos share
price is driven by the marketrsquos trust in
managementrsquos growth initiatives and
its recognition of the Companyrsquos
dominant profitability
However neither its profitability
advantage nor its growth prospects
are sustainable The likelihood that
management simultaneously
preserves BOTH is extremely low
Big Lots (BIG) Dollar Tree (DLTR) Dollar General (DG) Metro Inc (MRU CN) and Canadian Tire (CTC CN)
x
5x
10x
15x
20x
25x
BIG DLTR MRU CN DG CTC CN DOL CN
PE (NTM)
x
4x
8x
12x
16x
20x
BIG DLTR MRU CN DG CTC CN DOL CN
EVEBITDA
53
Valuing DOL As A Mature Business In The Canadian Market ~40 Downside
C$ MM unlessotherwise noted
Current Run-Rate Valuation
Priced Beyond Perfection
Reasonable Downside
Stores 1170 1700 1500
RevenuesStore 28 32 30
Revenues 3320 5440 4500
Operating Margin 23 22 18
Operating Profit 764 1197 801
Interest Expense 42 50 50
Tax 275 198 315 207
Net Income 523 831 544
Shares 332 332 332
EPS $158 $251 $164
Multiple 24x 16x ~15x
Share Price $3845 $3966 $2460
Upside (Downside) 3 Approx -40
As discussed earlier at 1700 stores DOL would have greater penetration than both Dollar General (DG) and Dollar Tree (DLTR)
which both offer a much broader assortment of goods including perishablesconsumables Meanwhile the US appears to be
overstored versus Canada It is likely unreasonable for DOL to target per capita penetration levels on par with its US peers
Even if we assume that DOL can reach similar penetration levels and match company
growth targets ndash with steady margins no less ndash DOL has little upside
Valuing DOL as a mature business at its upper penetration bound implies ~40 downside
in a more realistic yet still generous scenario in which DOL is valued in line with peers
Higher Canada
store count vis-agrave-
vis comparable US
store count
compared to
Walmart
Higher Canada
store concentration
vis-agrave-vis
comparable US
store concentration
than Walmart
Achieving
managementrsquos
1700 store target
would put DOL at a
higher per capita
penetration level
than US peers
Store Count by Region
Canada US CanUS Ratio
WMT 410 5358 77DOL ndash Present 1178 14750 80DOL ndash Future 1700 14750 115
DOL CN DG DLTR
Stores 1700 14760 14732
Population (M) 36 326 326
StoresCapita (M) 472 453 452
Downside Run-Rate Operating Margin Estimate
ProfitabilityCost Measure JustificationGross Margin Target Recent Historical Average 370
Current SGampA Recent Historical Average 167
Add
Advertising Expense Normalization
Industry Average05
Rent Expense NormalizationAdjusting for Depreciation Rearranged
from Rent Expense 05
Depreciation Catch-Up Matching DampA schedules 15
Pro Forma SGampA 192
Pro Forma Operating Margin 178
Store Count per Mil People by Region
Canada US CanUS Ratio
WMT 114 164 69DOL ndash Present 327 452 72DOL ndash Future 472 452 104

25
Dollarama Potentially Pushing The Limits Of The Canadian Market
Managementrsquos stated goal is to have 1700 stores across Canada by 2027 up from 1178 stores today We do not
believe that it can achieve this without risking significant cannibalization DOLrsquos target would imply a saturation level
higher than the largest US dollar stores (Dollar Tree and Dollar General) which also sell many more consumables and
grocery items Additionally Canada broadly has much lower levels of retail space per capita than the US suggesting
that Canadian concentration is even more pronounced all else equal
US Retail Square Footage Greater Than Canadian
Retail Square Footage
DOLrsquos Target Implies
Greater Than US
Saturation Despite
Narrower Concept
Source Wellington Management
Walmart is not opening stores in Canada suggesting that it believes
the Canadian market is saturated at 114 stores per million people ndash
about 69 of its US concentration (164 stores per million people)
Meanwhile Dollarama continues to expand within Canada despite
even higher Canadian concentration (327 per mil) relative to the US
concentration of large US dollar stores (452 per mil for a 72
ratio) This ratio would be over 100 at DOLrsquos 1700 store target
Higher Canada store
count vis-agrave-vis
comparable US
store count
compared to Walmart
Higher Canada store
concentration vis-agrave-
vis comparable US
store concentration
than Walmart
Retailers with similar store concentrations per capita across both the US and
Canada are effectively more concentrated in Canada vis-agrave-vis the total retail space
in either country
Store Count by Region
Canada US CanUS Ratio
WMT 410 5358 77
DOL ndash Present 1178 14750 80
DOL ndash Future 1700 14750 115
Store Count per Million People by Region
Canada US CanUS Ratio
WMT 114 164 69
DOL ndash Present 327 452 72
DOL ndash Future 472 452 104
DOL CN DG DLTR
Stores 1700 14760 14732
Population (M) 36 326 326
StoresCapita (M) 472 453 452
26
Dollarama Has Benefited From A Benign Competitive Environment
Large competitors have been shuttering Canadian stores continuously through the last four years due to company-
specific issues highlighted by the high-profile exits of Target and Big Lots from Canada12 We believe that this has been
a significant tailwind for Dollarama but one that is largely behind the Company at this juncture
Dollarama has been able to maintain significant share high margins and high returns on capital in large part due to
missteps among peers and the resulting lax competition This is likely unsustainable in a more competitive environment
as Dollarama has few material competitive advantages barriers to entry are low and its discount retailing strategy is not
unique Competent competition from growing industry players ndash Dollar Tree Canada Miniso and Amazon among others
ndash could be the straw that breaks the camelrsquos back for Dollaramarsquos profitability or growth (or both)
Fiscal YearCompany Exiting
CanadaStores Closed Revenue
DOL Revenue Capture
(Estimated)
Estimated Revenue Benefit
Revenue Boost
2018 Sears 200 $2000 3 $60 2
2017 Sears 100 $1000 3 $30 1
2016 Target 133 $2000 6 $120 4
2015 Big Lots 78 $155 10 $16 1
Last Four Year Average $56 2
Note All numbers are SPCM estimates
1) ldquoTarget Canada to close all stores by April 12rdquo
2) ldquoBig Lots Getting Back Out of Canadardquo
27
Light Competition Has Allowed The Company To Spend Nothing On Promotion ndash Until Now
Dollarama has no promotional expense Meanwhile promotional expenses average 1-2 of revenue among US
peers As established competitors continue to expand and as new competitors enter the market (Amazon included)
Dollaramarsquos no-cost marketing strategy may prove untenable
Promotional Expense
as a of Revenue
Intensifying Competition Threatens Dollaramarsquos
Passive Marketing Strategy
2016 2017 2018
BIG 180 180 170
FIVE 264 270 243
DLTR 021 029 048
DG 062 054 044
Average 132 133 126Source Huffington Post
Source Investorscom
The Canadian operation is also a relatively small part of the business However early results are
encouraging and despite competition in the Canadian market Dollar Tree has found success Longer
term the company is aiming for 1000 stores north of the border which does not seem unrealistic
Source Retail Environments
Calls with people at Dollar Tree suggest that the Company is working to
imitate elements of Dollaramarsquos strategy and store layout in its own
Canadian stores (eg raised shelves etc) and that it plans to expand
into Canada aggressively once its strategy is refined ndash likely in 2019
Source Company financial filings
28
Caught Between The Competition How Will Dollarama Fit In
Dollar Tree has maintained its reputation as a true dollar store nothing is priced higher than C$125 ($1 in the US)
Miniso has developed a reputation as a ldquonicerrdquo discount retailer items can cost up to C$25 but the environment is cleaner and
more modern and products are of better quality (but you can still get a dollar-level deal ndash most products are priced under C$10)
Dollarama has all the character of an old tired dollar store but without the dollar prices
Who will shop there unless management invests in store updates rather than opening new stores
Value-driven customers are by definition not loyal customers
Miniso
Clean and modern but cheap
Dollar Tree
No need for price tags everythingrsquos $1 Dollarama
Looks like Dollar Tree priced like Miniso
Irsquoll pass
29
Dollarama Makes No Effort To Appeal Millennials ndashThe Next (And Current) Shopping Generation
Dollarama has zero social media presence unlike all of its peers Not only is the Company out of touch with customers in
an industry which demands a high level of customer engagement but its brand is becoming demonstrably stale
Facebook Twitter Instagram YouTube LinkedIn Pinterest Google+
Dollar Tree Yes Yes Yes Yes Yes Yes No
Dollar General Yes Yes Yes Yes Yes Yes Yes
Family Dollar Yes Yes Yes Yes Yes Yes No
Big Lots Yes Yes Yes Yes Yes No Yes
Miniso (Canada N America)
Yes Yes Yes Yes Yes No No
Great Canadian Dollar Store
Yes Yes No No No No No
Dollarama No No No No No No No
Until now Dollarama has largely been a regional brand with satisfactory name recognition in its provincial home of Quebec
Now that the Company is making a bigger push into Anglophone Canada management should be more proactive in adapting its
strategy to new markets and to a new customer base Yet management continues to employ a strategy more befitting a sleepy
regional business it does not market or work to improve its brand it does not stay current with trends it keeps management
within the family and it is not expanding its logistics chain to support coast-to-coast growth (see subsequent slides)
Management wants Dollarama to be a national brand but it does not appear prepared to run a national business
Questionable Accounting And Financial Practices
31
Hedging Instruments A Material Source Of Profits In Recent Years
Dollaramarsquos sales are in Canadian dollars whereas a majority of its product purchases are US dollar-linked Management claims to enter
into CADUSD hedging arrangements to lock in near-term margins without having to adjust prices in response to FX movements However
management has nonetheless admittedly adjusted prices alongside unhedged peers in response to shifts in the CADUSD exchange rate
rendering its currency hedges a source of profit
Forex dynamics through the last two years have erased the large hedge benefit realized by Dollarama in FY 2016 but management reports
that gross margins have effectively remained flat through this period implying significant gross margin improvement in the underlying
business (see graphs below) As the currency hedge benefit has reversed through the last two years underlying gross margins have
purportedly risen by EXACTLY ENOUGH to keep total gross margins steady between 39-40 We find this oddly convenient ndash or at the very
least we question whether management will be able to maintain steady margins in the face of unfavorable FX rate dynamics in the future
Quick turnaround in
underlying
profitability Just in
time to keep the
declining forex hedge
benefit from dragging
down marginshellip
Even as FX hedge gains fell
from close to 8 of gross profit
in FY 2016 to a drag on gross
profit in FY 2018 gross margin
expanded by over 100 bps over
the same period implying gross
margin expansion ex-forex of
almost 300 bps within two years
for a retailer with gross margins
which were already unusually
high and whose margins had
contracted for four straight
years before the rapid reversal
32
Questionable Depreciation Assumptions
Dollarama changed its depreciation schedule for leasehold improvements (store fixtures) in FY 2015 moving from a 10-year to a 15-
year expected life1 However management did not concurrently lengthen the amortization schedule for tenant inducements
We find this mismatch curious as both quantities should be amortized depreciated over the expected life of a given lease
Adding to the confusion and appearance of foul play DOL discloses in its AIF that its average lease term is just 5 yrs and it just
started disclosing related-party dealing with Director Huw Thomas of SmartCentres ndash a REIT that lists DOL as a top 10 customer23
Lease term implied
by leasehold
depreciation expense
2-3x greater than that
implied by
amortization of
tenant allowance
Mismatch in implied
lease term
inappropriately
inflates EBIT
C$ MillionsFY
2013FY
2014FY
2015FY
2016FY
2017FY
2018
Amortization of Tenant Allowance $29 $35 $43 $49 $48 $51
Starting Balance Sheet Amount 168 207 232 280 344 386
Amortization as a of Asset Amount 173 169 185 175 140 132
Implied Lease Term 58 59 54 57 72 76
Leasehold Depreciation Expense $129 $166 $108 $141 $172 $202
Starting Balance Sheet Amount 1182 1348 1762 2113 2499 2867
Depreciation as a of Asset Amount 109 123 61 67 69 70
Implied Lease Term 92 81 163 150 145 142
Tenant Allowance Amortization Using Leasehold Depreciation Schedule
183 255 142 189 237 272
Reduction In EBIT If Both Were Put On Same Schedule (11) (10) (29) (30) (24) (24)
While the financial impact of this adjustment is limited signs of accounting impropriety do not reflect well on management and cast
doubt on the rest of Dollaramarsquos reports and accounting practices
1) FY 2015 Annual Report p 15 DOL also extended its store and warehouse equipment useful lives from 8-10yrs to 10-15yrs The total reduction of these three items was decrease of $10m in
FY15 depreciation expense
2) DOL states in its AIF p 11 ldquoThe Corporation typically enters into leases with base terms of ten years and options to renew for one or more periods of five years each The average time to
expiration of the Corporationrsquos leases is approximately five yearsrdquo
3) See governance slide on Huw Thomas
33
Capital Spending And Distribution Of Cash To Shareholders Are Overextending The Business
What happened
Management claimed in 2011 that the business was sufficiently cash-generative to support growth and dividendsshare buybacks
and that it would be able to pay down debt while pursuing both However debt has ballooned since then with net debt rising 8x
(and close to 3x versus EBITDA growth) Management is effectively levering up the balance sheet to support dividends and share
buybacks with CFO Michael Ross stating that he will continue to repurchase shares as long as the earnings yield remains above
the after-tax cost of debt
ldquoFor the past few years our cash flow has enabled
us to continue to pursue our growth plans and
continue to pay down debt Our free cash flow is
now sufficient to fund both those priorities
while enhancing new to shareholders through
a quarterly dividend payment We are able to
generate the free cash flow to do all of this
because we employ a simple growth oriented
business model at Dollaramardquo
ndash June 2011 Conference Call
Should Dollaramarsquos struggles become more pronounced ndash or should the
economic cycle turn for the worse ndash this debt overhang could loom large over
the business
Dollarama also consistently spends more on capex (as a percentage of sales) than its peers in the discount retail industry and
shows abnormally high capex versus depreciation and amortization We understand that Dollarama is a growing business which
could explain both patterns in part but it is not the only discount retailer which is investing in store growth
Dollarama DampA consistently
lt50 of capex and a lower
percentage of capex than
industry peers
Dollarama consistently
spends more on capex
(as a percentage of sales) than industry peers
00
05
10
15
20
25
0
200
400
600
800
1000
1200
1400
1600
1800
FY2012
FY2013
FY2014
FY2015
FY2016
FY2017
FY2018
Ne
t D
eb
tEB
ITD
A
Ne
t D
eb
t ($
C M
M)
Net DebtEBITDA Net Debt
0
50
100
150
200
250
300
FY2010 FY2011 FY2012 FY2013 FY2014 FY2015 FY2016 FY2017 FY2018
DampA as a of Capex and Intangibles Annual
DOL DLTR DG BIG FRED
0
1
2
3
4
5
6
7
8
FY2010 FY2011 FY2012 FY2013 FY2014 FY2015 FY2016 FY2017 FY2018
Capex and Intangibles as a of Sales Annual
DOL DLTR DG BIG FRED
34
Where Is The Capex Going
Management has explicitly identified and discussed various capital expenditures in Company filings over the last
five years but this still leaves a large gap versus what was actually spent
Additionally there is a large gap between the amount spent on software development and the amortization expense
associated with this activity suggesting that earnings may be inflated
Some of this is
directed towards
leasehold
improvements etc
but with
managementrsquos
focus on expansion
over existing store
improvements we
question where
management is
directing this capex
Capital Spending Software
on Software Amortization Difference
FY 2018 191 126 65
FY 2017 126 96 3
FY 2016 111 78 33
FY 2015 108 56 52
FY 2014 98 34 64
Are earnings
inflated due to
insufficient
amortization
Note also that a LinkedIn search for software developers at Dollarama turned up effectively nothing ndash at best one person with a tangentially
relevant title (source) So where is the software development capex going
Unlike discount retailer peers Dollarama
did not include software-related
spending in capex until recently and
records it separately in
ldquoAdditions to intangible assetsrdquo1
Do they do this to artificially deflate their
headline capex figure thereby inflating
reported free cash flow
Undiscussed Capital Spending (FY 2014 ndash 2018)
C$ Millions
$500K in capex spent per new store (375 new stores over past five years Source AIF) $1875
Capex spent on construction of 500K sqft warehouse in Montreal 679
$82M spent annually on expansion renovation or relocation of stores over five years 410
$232M spent on land acquisition 232
Discussed Capex Over Past Five Years $3196
Total Reported Capex (ex intangibles) $5200
Undiscussed Capex $2004
Software Capex and Software Amortization Discrepancy
C$ MillionsCapital Spending on
SoftwareSoftware Amortization Ratio
FY 2018 $191 $126 152
FY 2017 126 96 131
FY 2016 111 78 116
FY 2015 108 56 193
FY 2014 98 34 288
1) DOL explicitly started calling out software as a component of capex in Q3rsquo16 with the addition of footnote to guidance
35
Lack Of Transparency Regarding Store Closures And Associated Costs
It is standard industry practice to report store closures remodels and relocations alongside new store openings
However Dollarama reports only ldquoNet New Storesrdquo and does not break this number out in detail Questioned on this
in Q4 2016 management answered that a larger store base would inevitably result in more closures for reasons
outside of its control (fires mall renovations etc) and that reporting closures would therefore not communicate
meaningful information regarding the underlying performance of the business
We strongly disagree store closure information is vital to evaluating the health of a retail chain Management can
provide color on particular closures if it feels that they have been done for reasons other than performance but
failing to report closures entirely hides a key operating statistic from investors
Company Store Movement 2012 2013 2014 2015 2016 2017 2018
DLTR
Beginning 4101 4351 4671 4992 5367 13851 14334OpenedAcquired 278 345 343 391 8850 584 603
Closed 28 25 22 16 366 101 102Closed as of Beginning 07 06 05 03 68 07 07
BIG
Beginning 1398 1533 1495 1493 1460 1449 1432Opened 181 87 55 24 9 9 24Closed 46 46 58 57 20 26 40
Closed as of Beginning 33 30 39 38 14 18 28
DG
Beginning 9372 9937 10506 11132 11789 12483 13320Opened 625 625 650 700 730 900 1315Closed 60 56 24 43 36 63 101
Closed as of Beginning 06 06 02 04 03 05 08
FDO
Beginning 7023 7442 7916 -- -- -- --Opened 475 500 526 -- -- -- --Closed 56 26 400 -- -- -- --
Closed as of Beginning 08 03 51 -- -- -- --Overall Industry Average 09 07 20 07 23 07 08
Other high-growth dollar
stores like Dollar Tree and
Dollar General report store
closures ndash why doesnrsquot
Dollarama
Store closures for whatever
the reasons incur real
restructuring and other
costs Peer retailers
generally give detail on these
expenses whereas
Dollarama does not
We believe that Dollarama
should follow industry norms
and increase transparency
regarding store closures
US Dollar Store peers historically close 08 of stores annually yet Dollarama has not reported any recent closures
36
SSS Metrics Obfuscate Store Performance
Dollaramarsquos official ldquoComparable Store Salesrdquo figure includes ldquorelocated and expandedrdquo stores as ldquocomparable storesrdquo
therefore picking up growth in traffic which can be attributed to relocation-related improvements We believe that this likely
overstates Comparable Store Sales growth while also ignoring associated relocation-related expenses
1) See Q1 FY 2014 earnings call transcript
Management not only hides store closure data as a supposedly uninformative statistic but proclaims that it has NEVER closed a
store due to poor performance1 We find it difficult to believe that a retailer which has existed in its current format since 1992 has
never needed to close a store for poor performance If it has indeed never closed an underperforming store we wonder whether
management has been too ambitious in growing its store base without critically evaluating the profitability of each location
Huntsville Place Mall Jul 2015
7 John St Oct 2012
7 John St Jul 2015
Huntsville Place Mall Oct 2012
Huntsville ON
Relocation
Are these really entirely
ldquocomparablerdquo locations
781 Rue Principale Est May 2016
781 Rue Principale Est Jun 2009Le Carrefour Ste Agathe
May 2016
Ste-Agathe-Des-Monts QC
Relocation
Why assume the costs to
make this lt1 mile move
Notice
Dollarama
sign turned
inside-out
indicating
closure
37
Cash Flow Beginning To Turn Over Despite Efforts To Bolster Results
In H1 FY 2019 Dollaramarsquos cash flow contracted on a year-over-year basis for the first time since it went public ndash this
despite managementrsquos efforts to bolster earnings and EBITDA The contraction appears to be due in large part to
changes in working capital In particular we are concerned that growth in inventories suggests that management
overestimated near-to-medium term sales growth and that declining traffic is starting to weigh on the Company
Dollarama H1 Operating Cash Flow
C$ Millions FY 2014 FY 2015 FY 2016 FY 2017 FY 2018 FY 2019
Net Income $1054 $1221 $1603 $1895 $2265 $2433
CFO Before Working Capital 1394 1488 2124 2156 2769 2999
Changes in Working Capital (287) (236) (870) (110) (126) (886)
Net CFO 1107 1252 1253 2045 2644 2113
YoY Change $326 $322 $01 $792 $599 (531)
Source Dollarama
Governance Concerns
39
Related-Party Transactions With Rossy Family Raise Questions Over Governance And Costs
Fiscal YearRent amp Land Purchases
Paid to Rossys(C$ MM)
As a of Compensation Paid to Rossy Family
FY 2019 (To Date) $394 NA
FY 2018 184 1660
FY 2017 402 4459
FY 2016 179 1305
FY 2015 169 2752
FY 2014 163 1903
As noted Dollarama leases all but one of its five warehouses from the Rossy family and recently purchased land from the Rossys
for the construction of a sixth Management also recently purchased its Montreal distribution center from the Rossy family which
leased the facility to Dollarama until this February We understand that the Rossy family has close historical ties to the business
but this level of close dealing draws our attention particularly given the fact that management has focused on fortifying its
existing distribution footprint ndash closely tied to the Rossy family ndash rather than invest in distribution facilities in western Canada
where major competitors already have distribution centers
DLTR
Distribution
Center
Delta BC
DLTR
Distribution
Center
Mississauga ON
DOL
Distribution
Center
DOL
Warehouses
No Dollarama distribution facilities
located outside of a ~4 mile radius in
Montreal
bull Due to preferential relationship with
Rossy family
bull Will Dollarama be able to expand into
AngloWestern Canada efficiently
without logistics costs ballooning
bull Overly-exposed to fuel price hikes
and rising transportation costs
Related-Party Transactions Significant And Growing
Source Dollarama Financials
Dollar Tree Canada Distribution Centers
Dollarama Distribution Centers And Warehouses
Source DollarTree
Montreal QC
40
Related-Party Transactions With ldquoIndependentrdquo Director Huw Thomas Only Recently Disclosedhellip
Dollarama also leases stores from SmartCentres REIT whose recently-departed CEO Huw Thomas joined Dollaramarsquos
Board of Directors in 2011 and was a member of its audit committee through March 2017
His ldquoindependencerdquo was recently defended by a meandering 260-word footnote in Dollaramarsquos proxy which belies the
fact that Dollarama is a top 10 customer of SmartCentres
This is all the more suspicious in light of Dollaramarsquos questionable lease accounting highlighted earlier
Source Dollarama 2018 Proxy Circular
Note Dollarama did not start disclosing Huwrsquos related-party dealing until the 2017 proxy
circular in June 2017 right after he left the Audit Committee in March 2017
SmartCentres 2017 Annual Report
Dollarama Material To SmartCentres ndash A Top 10 Customer
SmartCentres Promotes Dollarama Relationship From 2011
Calloway (now SmartCentres) 2012 Annual Report
Dollaramarsquos Lengthy Meandering Defense Of Thomas
Huw As Independent Only Recently Disclosed (2017)
Dollarama Recently Changed Rent Expense Disclosure
Source Dollarama Q4rsquo17 Financials Note 15 Related Party Disclosure
Source Dollarama Q2rsquo18 Financials Note 13 Related Party Disclosure
41
House of Windsor House of RossyA Case Study In Nepotism
Neil Rossy had been the Senior VP of Merchandising Chief Merchandising Officer for 25 years prior to being named CEO in
2016 While his family is still a large shareholder they are not a controlling shareholder owning around 5 of the shares
outstanding We question whether the Rossyrsquos century-long family tradition of passing down leadership ndash one which also
persists at the Rossyrsquos ldquosister storerdquo ndash is appropriate for a public company or wise for the long-term health of the business
Salim Rossy
Opened first ldquoS Rossyrdquo
store in 1910 (up-market
department store concept)
George Rossy
President of S Rossy
1937-1973
Larry Rossy
Grew S Rossy from 20 to 44 stores before
converting all S Rossy stores to new
ldquoDollaramardquo concept in 1992 Sold majority
stake to Bain Capital in 2004 IPO in 2009
Neil Rossy
CEO of Dollarama as of 2016
Michael Rossy
Brother of George (one of ten siblings)
Founder amp CEO of ldquoRossyrdquo stores 1949-2010
Michael DiTullio
Son-in-Law of Michael
President amp CEO of Rossy since 2010
Does (or will) the family have a hard time parting with a business that has been in the family for four generations even if parting ways is
the right thing to do
Managing retail chains is very
much a family affair for the
Rossys ndash at both stores
Perhaps Neil was going to be
anointed CEO of Dollarama
regardless of the caliber of other
potential candidates
Letrsquos hope hersquos not Commodus
BONUS
Brother branches out
with separate storehellip
42
Insiders Incentivized To Grow EBITDA
Our earlier concerns about EBITDA quality are amplified by the fact that Dollarama executives are compensated
based on seemingly arbitrary and inflated EBITDA targets This gives management a strong incentive to be inefficient
users of capital as any dollar shifted from operating expense to capex has a direct benefit to key executives
For example note that managementrsquos perhaps questionable decision to purchase one of its Montreal warehouses
will shift what was until recently rent expense into depreciation This change in the accounting treatment of
Dollaramarsquos tenancy costs will provide a windfall to EBITDA potentially boosting management bonuses
Source Dollarama Proxy Circular p 30
43
What Is A Stretch EBITDA Goal
Bonuses are paid upon achievement of 11 EBITDA growth This level was ldquodesigned to be a stretch objectivehellip
attainable only with significant effortrdquo However this target was reset lower after FY 2014 ndash the only year during which
management did not handily exceed the target We believe this further calls into question the independence of the
board and its compensation committee
Year EBITDA Growth Objective EBITDA Growth Achieved
FY 2018 11 18
FY 2017 11 18
FY 2016 11 30
FY 2015 11 15
FY 2014 13 12
FY 2013 13 22
FY 2012 13 26
FY 2014 Management
misses growth objective
FY 2015 Growth objective
adjusted downwards
ldquoThe thresholds were revised by the
Human Resources and Compensation
Committee in the context of its annual
executive compensation review
conducted at the beginning of each fiscal
year to take into account among other
elements the fact that the base for the
calculation is growing every yearrdquo
Source FY15 Management Proxy Circular
What ldquoother elementsrdquo were
taken into account
Source Dollarama
44
Insiders Selling While Company Buys Back Stock At Elevated Prices
Management has been buying back shares at elevated prices through the last several years even while pursuing growth leaving little capital for
(sorely needed) store updates or other uses The average repurchase price since Q1 FY17 is about on par with current share prices and ~40
below our target Since Q2 FY18 the average buyback price has been 25 above current levels
Furthermore just as the Company has been buying back stock at elevated prices insiders have been offloading shares Notably it is evident
from past and current proxy statements that CFO Michael Ross has never held onto shares for which he has been granted options his
common equity ownership is listed at zero every year Note that as the CFO it is he who is dictating the share buyback decision in large part
PeriodShares
Repurchased
Value of Repurchase
(C$ M)
Average Price (Split-
Adj) (C$)
Q1 FY 2017 1542066 1393 3011
Q2 FY 2017 2027080 1842 3029
Q3 FY 2017 1571500 1578 3347
Q4 FY 2017 2279522 2241 3277
Q1 FY 2018 1687240 1806 3568
Q2 FY 2018 1303900 1602 4095
Q3 FY 2018 687700 931 4513
Q4 FY 2018 2425700 3788 5205
Q1 FY 2019 94500 145 5115
Q2 FY 20191 1347341 700 5195
Total 14966549 16026 3797
Discount to Current Share Price 1
Total (Since Q2 FY 2018)
5859141 7170 4815
Discount to Current Share Price -20
Using Company Funds To Overpay For DOL Shareshellip While Insiders Sell Into The Companyrsquos Bidhellip
Source DOL filings and Bloomberg
Insider Title Date Sold SharesProceeds (C$ M)
Price Sold (Split-Adj)(C$)
Nicolas Hien Senior Vice President 482016 6203 06 3224
Michael Ross CFO 482016 80000 74 3083
Paul Roche Vice President 4182016 10000 09 3000
Geoffrey Robillard Senior Vice President 6172016 33500 31 3085
John Assaly Vice President 9272016 30000 30 3333
Geoffrey Robillard Senior Vice President 472017 20000 23 3833
Paul Roche Vice President 472017 23100 26 3752
Josee Kouri Corporate Secretary 4142017 8000 09 3750
Geoffrey Robillard Senior Vice President 9142017 5000 07 4667
Geoffrey Robillard Senior Vice President 12112017 10000 16 5333
John Assaly Vice President 12132017 14096 22 5202
Geoffrey Robillard Senior Vice President 1262018 15000 24 5333
John Thomas Independent Director 1262018 6000 10 5556
Geoffrey Robillard Senior Vice President 6152018 50000 75 5000
John Assaly Vice President 6192018 13404 21 5222
Nicolas Hein Senior Vice President 6222018 36750 19 5170
Paul Roche Vice President 6222018 24000 13 5417
We do not like the fact that insiders have been selling into share buybacks while
the Company levers itself up with short-term debt to support those repurchases
It appears that the execs are levering up the business in part to enrich themselves1) All share information prior to Q2 lsquo19 reflects pre-split data except
Split-Adjusted Average Prices Q2 lsquo19 repurchases were as stated
45
Rossy Family Selling Shares Despite Control Over C-Suite
Notably Founder and former CEO Larry Rossy has trimmed his position tremendously through the last several years
Though this is to be expected to some extent as he recently ceded control of the business we believe that his
ownership stake should be held to a higher standard given his insistence on keeping the business in the family
If he plans to keep the c-suite under a Rossy dynasty the familyrsquos personal stake in the business should reflect that
Source Bloomberg
Valuation And Price Target
47
The Market Has Not Taken Threats To Dollarama Seriously ndash But Optimism Is Ebbing
Analysts are generally bullish on the stock focusing primarily on managementrsquos growth story and taking current
profitability levels for granted The prospect of new competitive threats to a business which has until now seen limited
competition ndash and the risk that prevailing margins are unsustainable even through the near term ndash go underappreciated
Dollaramarsquos poor Q2 cooled analystsrsquo optimism to some extent but we believe that the reaction was largely reactive and
superficial as they adjusted their price targets in such a way that in aggregate they saw exactly the same upside after the
post-Q2 dip as they did before The market still does not fully appreciate the magnitude of the threats facing Dollarama
All price targets in C$ Before Q2 Release After Q2 Release
Firm Recommendation Target PriceUpside (on 82818) Recommendation Target Price
Upside (on 9172018)
Upside (Present)
RBC Capital Markets Outperform $5500 12 Outperform $5200 22 35
Raymond James Outperform $5567 13 Outperform $5000 17 30
Macquarie Outperform $5633 14 Outperform $4900 15 27
BMO Capital Markets Outperform $6100 24 Market Perform $4700 10 22
CIBC Capital Markets Outperform $5900 20 Neutral $4600 8 20
Desjardins Securities Buy $5800 18 Hold $4500 6 17
Veritas Investment Research Co Buy $5600 14 Buy $4800 13 25
Industrial Alliance Securities Hold $5450 11 Buy $5450 28 42
Canaccord Genuity Buy $5900 20 Buy $5500 29 43
Barclays Equal Weight $5200 5 Equal Weight $4400 3 14
TD Securities Buy $5900 20 Hold $4900 15 27
Accountability Research Corp Buy $5400 10 Buy $5000 17 30
National Bank Financial Outperform $5567 13 Sector Perform $4800 13 25
Scotia Capital Sector Outperform $5567 13 Sector Outperform $5050 19 31
Wells Fargo Securities Market Perform $5300 7 Market Perform $4000 -6 4
AVERAGE $5626 14 $4853 14 26
While analysts are still not sufficiently critical of Dollarama the more recent downward move in the stock and subsequent analyst
downgrades may suggest that the market could be primed to evaluate the Company and its growth story with a more discerning eye
We believe that the issues which we highlight in this report will provoke further professional skepticism among analysts and investors
48
Dollarama Not Priced To Perfection ndashPriced Beyond Perfection
We can get close to DOLrsquos current valuation only if we value it as a mature ex-growth business today under
managementrsquos lofty goals for the business for ten years into the future applying no discounts for time
business risk etc
Managementrsquos ten-year store target
bull Current store count 1178 (70 of long-
term target)
Even if Dollarama were a mature business today under managementrsquos long-term targets for the business
DOL stock would not have no upside to current share prices
The market is pricing DOL beyond perfection ndash a valuation this lofty cannot be justified today
Mature Business ValuationC$ MM unless noted
Stores 1700
Revenue per Store $32
Total Revenue $5440
Operating Margin 220
Operating Profit $1197
Interest Expense $50
Tax (275) $315
Net Income $831
Diluted Shares Outstanding 332
EPS $251
PE Multiple 152x
Target Price $3815
Upside -1
Average operating margin since Q1 FY 2016
bull Assumes that DOLrsquos unusually high
margins are sustainable despite
intensifying competition loss of recent FX
benefit and customer pushback against
price hikes
Mature revenue per store estimate
bull Current average revenue per store
~$28M (875 of long-term target)
Industry median NTM PE multiple
bull Assigns no discount to DOL due to
declining store traffic vs peers incoming
competitive threats inefficient distribution
network etc
49
Dollarama Not Priced To Perfection ndashPriced Beyond Perfection (Continued)
Put another way The market is implicitly taking it for
granted that Dollarama will achieve its lofty ten-year
growth targets assuming sustained profitability levels
and per-store efficiency ndash and applying close to the
industry median FY1 EVEBITDA multiple to Dollaramarsquos
FY 2027 EBITDA
Just under ten-
year target
What kind of growth is the market implicitly betting on if
we value Dollarama on par with peers
bull 150 more stores than managementrsquos ten-year target ndash
within nine years
bull 48 CAGR in revenue per store
bull Zero margin compression
FY 2027 Estimates if Management Executes Growth Plans Perfectly
(C$ MM unless noted)
Stores (Year-End) 1688
Revenue per Store $33
Total Revenue $5503
Gross Margin 380
Gross Profit $2093
SGampA per Store 04
SGampA Total 689
EBITDA (FY 2027) $1404
Market Cap 12752
Debt 1880
Cash 182
Enterprise Value $14450
EVEBITDA (FY 2027) 103x
Industry Median EVEBITDA (FY1) 110x
Average gross
margin ex-
hedge gains
since FY 2016
Mature revenue
per store
estimate (15
growth CAGR)
FY 2018 SGampA
per Store
Implied FY 2027
multiple close to
industry median FY1
multiple
FY 2027 Estimates To Justify Prevailing Valuation (C$ MM unless noted)
Stores (Year-End) 1858
Revenue per Store $44
Total Revenue $7929
Gross Margin 380
Gross Profit $3016
SGampA per Store 04
SGampA Total 755
EBITDA (FY 2027) $2261
EVEBITDA (FY 2027) 62x
Enterprise Value 13947
Debt 1880
Cash 182
Equity Valuation $12249
Diluted Shares Outstanding 332
Target Price $3693
Current Price $3845
158 over ten-
year target in
nine years
48 growth
CAGR in
SalesStore
Industry median
FY1 multiple
discounted
75 annually
Average gross
margin ex-
hedge gains
since FY 2016
FY 2018 SGampA
per Store
High forecast gives
us 4 DOWNSIDE
50
Valuation Far Out Of Line With Peers And Historical Multiples
DOL shares trade at a 50-60 premium to peers in the discount retail industry The market is valuing DOL much more like a high-
growth tech company than a brick-and-mortar dollar store (and one with concerning fundamental trends at that) Note that this still
holds true even after DOL shares traded down significantly following its recent Q2 earnings report
It is difficult to justify a valuation this high even if one is bullish on DOL vis-agrave-vis the rest of the industry
Company Ticker
3-Year Consensus Revenue
CAGR
FY 2018 EBITDA Margin
PE(NTM)
PE(FY2)
EVEBITDA(NTM)
EVEBITDA(FY2)
EVSales(NTM)
Dollar Tree DLTR 43 121 139x 134x 91x 88x 10x
Dollar General DG 75 104 163x 162x 112x 112x 12x
Big Lots BIG 06 85 87x 87x 52x 53x 04x
Five Below FIVE 210 162 360x 412x 2113x 243x 32x
Canadian Tire CTC CN 20 90 179x 181x 82x 83x 10x
Metro MRU CN 80 73 142x 139x 99x 101x 08x
MEDIAN 59 97 152x 151x 95x 110x 10x
Dollarama DOL CN 85 255 229x 223x 164x 163x 41x
DOL PREMIUM 505 477 727 509 3057
Does DOL ndash a value retailer
demonstrating concerning
fundamental trends ndash deserve
to be valued on par with
higher-growth industries and
completely out of line with its
industry peers
Profitability is impressive but
likely unsustainable in the face
of growing competition
Enterprise Value Revenues Enterprise Value Adj EBITDA Price Adj EPSDOL shares also trade at
a significant premium to
historical multiples
despite unsustainable
margins an increasingly
saturated market and
rising competitive
threats
51
Does The Market Think Dollarama Is A Dollar Store Or A Premium Retail Brand
Dollarama is valued much more closely to premium retail brands than its discount retail peer group
A bull might ldquojustifyrdquo this by pointing to Dollaramarsquos profitability profile and growth expectations but its EBITDA margins are so
out of line with those of its peers that one is forced to question whether they are sustainable (at best) or honest (at worst)
As discussed Dollaramarsquos consensus sales growth numbers also ignore looming fundamental threats to the business
Company TickerGross
Margin (NTM)
EBITDA Margin (NTM)
Sales Growth (NTM)
EVEBITDA(NTM)
PE(NTM)
EVSales(NTM)
Dollar Tree DLTR 31 11 28 91x 139x 10x
Dollar General DG 31 10 89 112x 163x 12x
Big Lots BIG 41 7 -08 52x 87x 04x
Five Below FIVE 36 15 203 2113x 360x 32x
Canadian Tire CTC CN 34 12 40 82x 179x 10x
Metro MRU CN 19 7 88 99x 142x 08x
MEDIAN 33 11 64 95x 152x 10x
Dollarama DOL CN 40 25 99 164x 229x 41x
DOL PREMIUM 727 505 3057
How does Dollarama support EBITDA
margins more than double those of its
peer group and in line with premium
global retail brands
Company TickerGross
Margin (NTM)
EBITDA Margin (NTM)
Sales Growth (NTM)
EVEBITDA (NTM)
PE (NTM)EVSales
(NTM)
Ferragamo SFER IM 65 17 48 160x 260x 26x
Hermes RMS FP 69 38 84 200x 350x 78x
Prada 1913 HK 74 22 78 100x 210x 23x
Tiffany amp Co TIF 64 24 51 113x 196x 28x
MEDIAN 67 23 65 137x 235x 27x
Dollarama DOL CN 40 25 99 164x 229x 41x
DOL PREMIUM 197 -26 519
Does a discount retailer facing
fundamental headwinds deserve to be
priced 50 or more above its peer
group and closer to global
premium retail brands
52
Margins And Multiples Materially Out-of-Line With Peers
We do not believe that Dollaramarsquos profitability levels ndash which are entirely out of line with peers ndash are justified or sustainable in an
industry as competitive as deep discount retail The Company is already struggling to meet store count growth targets raising the
likelihood that its store growth plan will be dilutive to margins The market assigns a premium valuation to Dollarama on the basis
of relatively high growth expectations and the Companyrsquos industry-leading margins However as discussed throughout this
report we doubt both managementrsquos ability to meet its growth targets and its ability to maintain prevailing profitability levels The
likelihood that the Company will be able to achieve BOTH of these goals simultaneously is even slimmer Accordingly we believe
that the basis for Dollaramarsquos substantial share price premium is unfounded
Dollaramarsquos margin profile is grossly out of
line with peers and we find evidence of
aggressive accounting and questionable
business practices that can partly explain the
issue We doubt that this would be sustainable
even if management wasnrsquot growing the chain
How will a lowno-moat business with falling
per-store traffic be able to maintain its
remarkable profitability advantage while
aggressively expanding its store base
DLTRDG
BIG
FIVE
CTCCN
MRUCNWNCN
DOLCN
0
5
10
15
20
25
30
10 15 20 25 30 35 40 45 50
EBIT
DA
Mar
gin
Gross Margin
Dollarama Margins Completely Out Of Line With Peers
The premium in Dollaramarsquos share
price is driven by the marketrsquos trust in
managementrsquos growth initiatives and
its recognition of the Companyrsquos
dominant profitability
However neither its profitability
advantage nor its growth prospects
are sustainable The likelihood that
management simultaneously
preserves BOTH is extremely low
Big Lots (BIG) Dollar Tree (DLTR) Dollar General (DG) Metro Inc (MRU CN) and Canadian Tire (CTC CN)
x
5x
10x
15x
20x
25x
BIG DLTR MRU CN DG CTC CN DOL CN
PE (NTM)
x
4x
8x
12x
16x
20x
BIG DLTR MRU CN DG CTC CN DOL CN
EVEBITDA
53
Valuing DOL As A Mature Business In The Canadian Market ~40 Downside
C$ MM unlessotherwise noted
Current Run-Rate Valuation
Priced Beyond Perfection
Reasonable Downside
Stores 1170 1700 1500
RevenuesStore 28 32 30
Revenues 3320 5440 4500
Operating Margin 23 22 18
Operating Profit 764 1197 801
Interest Expense 42 50 50
Tax 275 198 315 207
Net Income 523 831 544
Shares 332 332 332
EPS $158 $251 $164
Multiple 24x 16x ~15x
Share Price $3845 $3966 $2460
Upside (Downside) 3 Approx -40
As discussed earlier at 1700 stores DOL would have greater penetration than both Dollar General (DG) and Dollar Tree (DLTR)
which both offer a much broader assortment of goods including perishablesconsumables Meanwhile the US appears to be
overstored versus Canada It is likely unreasonable for DOL to target per capita penetration levels on par with its US peers
Even if we assume that DOL can reach similar penetration levels and match company
growth targets ndash with steady margins no less ndash DOL has little upside
Valuing DOL as a mature business at its upper penetration bound implies ~40 downside
in a more realistic yet still generous scenario in which DOL is valued in line with peers
Higher Canada
store count vis-agrave-
vis comparable US
store count
compared to
Walmart
Higher Canada
store concentration
vis-agrave-vis
comparable US
store concentration
than Walmart
Achieving
managementrsquos
1700 store target
would put DOL at a
higher per capita
penetration level
than US peers
Store Count by Region
Canada US CanUS Ratio
WMT 410 5358 77DOL ndash Present 1178 14750 80DOL ndash Future 1700 14750 115
DOL CN DG DLTR
Stores 1700 14760 14732
Population (M) 36 326 326
StoresCapita (M) 472 453 452
Downside Run-Rate Operating Margin Estimate
ProfitabilityCost Measure JustificationGross Margin Target Recent Historical Average 370
Current SGampA Recent Historical Average 167
Add
Advertising Expense Normalization
Industry Average05
Rent Expense NormalizationAdjusting for Depreciation Rearranged
from Rent Expense 05
Depreciation Catch-Up Matching DampA schedules 15
Pro Forma SGampA 192
Pro Forma Operating Margin 178
Store Count per Mil People by Region
Canada US CanUS Ratio
WMT 114 164 69DOL ndash Present 327 452 72DOL ndash Future 472 452 104
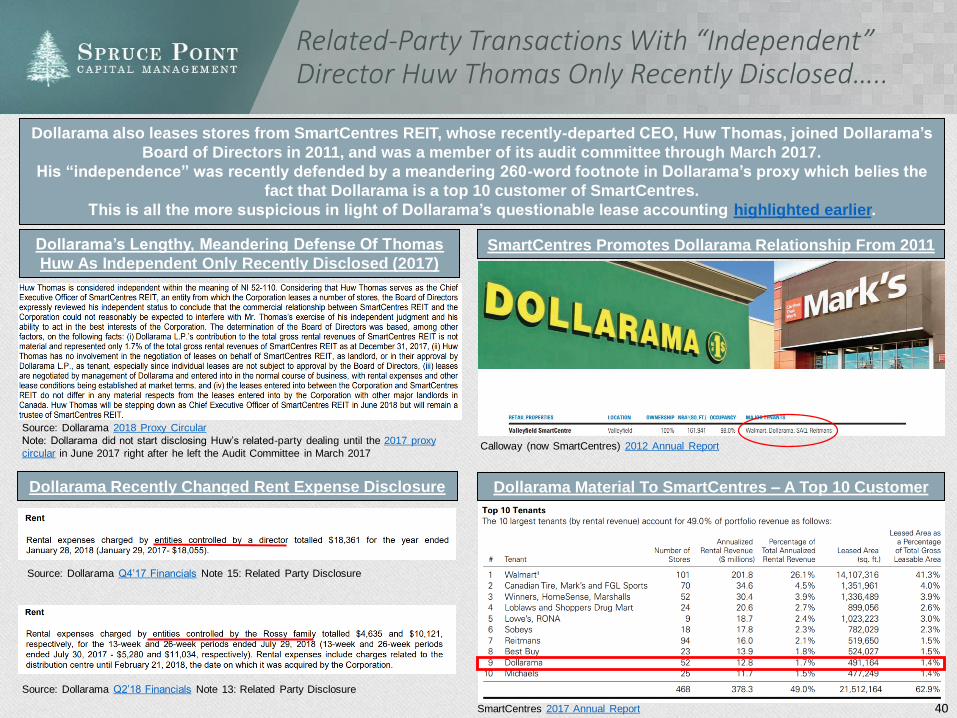