full paper - ratcheting uplift of buried pipelines in sand (p. chitas)
TRANSCRIPT

Ratcheting Uplift of Buried Pipelines in Sand / August 2015 / 1
Ratcheting Uplift of Buried Pipelines in Sand
P. Chitas BSc, MSc
Often regarded as the "arteries" of the oil and
gas sector, offshore pipelines form arguably one
of the key contributing factors to the UK energy
industry, and in a larger scale, to the country's
gross domestic product (GDP). Accordingly, any
potential structural failure of a pipeline system
could have serious detrimental consequences,
both in financial and environmental level,
resulting in damage that could be amounted to
millions for the companies, while any
remediation attempt would be proved extremely
uneconomical. Offshore pipe burial, in turn, is
critical to the safety of the system during its
operation lifecycle, as it serves to provide both
protection from seabed hazards and appropriate
temperature levels for its function. One of the
main causes of failure for a subsea pipeline is
termed "ratcheting", a phenomenon described
by progressive loss of cover depth and may occur
after the system exposure to a certain number of
cycles of loading and unloading, as a result of the
high thermal stresses induced by the extremely
hot carried material (i.e. oil and gas). Based on
findings derived from a series of small-scale
laboratory tests at the University of Dundee, the
aims and objectives of the presented paper,
intend to shed light on dominant parameters that
take place during the investigated phenomenon,
validate current prediction methods and estimate
the adequate soil backfill required for sands of
various densities ranging from loose to medium
dense.
LIST OF NOTATION
D pipeline diameter
D10, 60 particle size
Dr relative density of soil
e in-situ void ratio of soil
emax, emin void ratio of soil in its loosest and
densest state
f empirical uplift resistance factor
Gs particle specific gravity
Gsec secant shear modulus
H depth of cover
𝐻 depth from seabed to pipe centre
H/D embedment ratio
IR relative dilatancy index
k soil permeability
K earth pressure coefficient
Ncycles number of cycles
L length of pipe segment
r roughness parameter
Rcyc cycle load amplitude
Rpeak peak uplift resistance
S soil shear resistance component
VSM vertical slip model
W’ submerged weight of soil block
γ dry unit weight of soil
δmob peak mobilisation distance
σc crushing strength of soil grains
(20 MPa for Quartz sand)
σ’h effective horizontal stress
σ’ν effective normal stress
φcrit soil critical state friction angle
φpeak soil apparent peak friction angle
ψ dilation angle of sand

Ratcheting Uplift of Buried Pipelines in Sand / August 2015 / 2
1. INTRODUCTION
One of the primary causes of failure for offshore
buried pipelines is that of upheaval buckling, which
usually leads to a progressive unburial behaviour,
and forms a result of the vertical bending action
induced by the high internal thermal pressures, in
their attempt to find their way out of the section. The
first officially recorded case of buckling failure
occurred in 1986 in the North Sea, when a section
part of a 17 km long embedded pipe, was found to
stand arch-shaped out of the seabed (Nielsen et al.,
1990). As a result, this unburial behaviour can easily
lead to subsequent damage of the protruding pipe
section which then becomes prone to seabed
geohazards and trawling activities. Ever since the
first incident of buckling failure was recorded, a
considerable research amount of literature has been
concentrated on the establishment of a reliable
framework for the prediction of the required soil
uplift resistance which forms key parameter for the
assessment of the performance during the upheaval
buckling event. Nevertheless, the governing
standards for design against pipeline buckling
(DNV, 2007), are focused on the monotonic case,
without providing adequate information about the
cyclic mode of failure, which is commonly known
as “ratcheting”. In this regard, recently immerged
evidence, suggested that buckling failure of the pipe
can still occur after system’s long-term exposure to
a certain number of loading cycles, arising by forces
of lower load amplitudes than the peak design force.
With the exception of some limited literature
references on the subject (Wang, 2012; Bai and Bai,
2014; Yu et al., 2015), there are still no available
codes or criteria that could dictate reliable design
predictions to address the problem. In response to
the existing research gap on the phenomenon, a
series of small-scale pull-out tests of a pipe section
were conducted in dry sand, with the aid of a state-
of-the-art Instron apparatus (i.e. Figure 1.1), for
controlled material testing, so as to capture the
monotonic as well as the cyclic performance of the
soil, under various stress levels, relative densities
and load amplitudes.
Figure 1.1: Experimental setup
Hence, the aim here is the production of a physical
simulation of the “ratcheting” failure mechanism in
order to investigate the controlling parameters
during the phenomenon, validate existing design
approaches and predict the soil cover required to
provide sufficient resistance.
2. EXPERIMENTAL METHOD
In the presented paper, physical modelling was
adopted for the investigation of the phenomenon,
which was preferred over other methods as it
accounts for nonlinearity, while it may also allow
the capturing of certain aspects that govern soil
behaviour which cannot be modelled implicitly by
other approaches (e.g. finite elements). In this
regard, the problem was treated as a two-
dimensional plane-strain case, through the
conduction of repeated 1g pull-out tests on a short
circular pipe section positioned in a steel chamber
box and buried inside dry fine silica sand (HST95).

Ratcheting Uplift of Buried Pipelines in Sand / August 2015 / 3
The performance was tested both under monotonic
and cyclic loading conditions, with the aid of
specialised Instron equipment provided by the
geotechnical lab of Dundee University, which
allowed controlled and precise measurements to take
place. Accordingly, the physical simulations both
for the “upheaval buckling” and “ratcheting” failure
mechanisms were carried out for loose and medium
density sand, and with the consideration of two
different shallow depths of cover corresponding to 1
and 2 pipe diameters respectively.
2.1 Experimental sequence
Initially, monotonic tests were conducted in order to
obtain representative reference values of the soil
peak uplift capacity and the mobilisation distance
for each case of sand and embedment ratio. In this
regard, the monotonic upheaval buckling
phenomenon was simulated through displacement-
controlled static pull-out tests, while maintaining a
constant pulling speed of 1 mm/min, sufficiently low
so as to ignore any rate effects and assure drained
conditions throughout the tests (Powrie, 2014). The
results from the monotonic case form a necessary
requirement in order to be able to proceed to the
cyclic phase, given that the ratcheting failure
mechanism occurs before the peak load phase is
reached.
The next stage, involving the ratcheting mechanism
simulation, was represented by the conduction of
load-controlled cyclic tests, with the application of
load amplitudes corresponding to 50%, 80% and
90% of the capacity, while the period of the sine
wave was kept constant at 30 seconds. The output
results were then imported into Excel for the
production of a hysteresis loop analysis that enabled
thorough examination of the stiffness degradation,
as well as the accumulated displacement history
after each cycle. All data readings were provided by
Bluehill 3, Instron's main software that enables real-
time, accurate and clear result presentation, during
any material testing through the device.
2.2 Soil sample preparation
The selected soil material for the tests was
represented by dry fine silica sand (HST95),
uniformly graded and rounded, with D10 = 0.10 mm
and D60 = 0.14 mm particle size features. The main
soil index properties comprised the critical state
friction angle, φcrit = 32 o, the particle specific
gravity, Gs = 2.63, and maximum and minimum
densities of 1792 and 1487 kg/m3 respectively. The
density states of the sand specimens were chosen so
as to get an approximate resemblance of the medium
to dense in-situ conditions encountered on the
seabed of the North Sea, as well as the loose soil
state after its placement as backfill at the post-
installation stage (Randolph and Gourvenec, 2011;
Liu et al., 2011; Shajarati et al., 2012).
During sample preparation, air pluviation methods
were considered with the aid of specialised pluviator
equipment allowing the required sample densities to
be achieved, through the simultaneous adjustment of
the drop height, the displacement rate, as well as the
apparatus slot opening. The relative density (i.e.
Equation 2.1) was measured and monitored through
the extraction of the in-situ soil density, while
weighing four small molds filled with sand and
estimating the net unit weight of the soil.
minmax
max
ee
eeDr
Equation 2.1
2.3 Testing arrangement
The main testing equipment used during the
conduction of the tests, consisted of an Instron 5900
series apparatus, a small steel-made rigid pipe model
and a 1g steel-made chamber box with a Perspex
side. Initially, the testing apparatus employed for the
conduction of the experiments, was the latest version
of Instron, a device especially designed for material

Ratcheting Uplift of Buried Pipelines in Sand / August 2015 / 4
performance testing, and the ability to provide real-
time and precise load measurements.
The pipeline was represented by a steel-made rigid
pipe section of 90 mm diameter, 300 mm in length
and 3.9 kg unit weight. Extending 360 mm in height,
an iron frame attachment enabled the safe gripping
of the pipe model during the pull-out tests. For the
chamber to accommodate both the specimen and the
pipe model for the tests, a 1g steel-made box was
used. The box size was selected so as to enable
enough space during the tests and minimise the
boundary effects from wall friction to a sufficient
degree. A visual description of the representative
test arrangement is provided by Figure 2.1 below.
(a) (b)
Figure 2.1: Two-dimensional cross-sectional (a) and plan (b) views of the steel chamber
3. RESULTS PRESENTATION AND
ANALYSIS
In the context of the physical simulation, a total
number of 16 laboratory 1g tests were carried out,
including 4 monotonic displacement-controlled and
12 cyclic load-controlled tests. The first set of tests
was conducted in dry medium dense sand of 60%
relative density and the application of shallow
embedment depths equal to 1 and 2 pipe diameters.
The tests were then repeated for dry loose sand
specimen of 27% relative density and under the
same embedment ratios. Initially, the performance
was tested under monotonic loading conditions for
each case, providing an upheaval buckling
simulation, whereas the subsequent tests were
conducted under cyclic loading amplitudes of 50%,
80% and 90% of the peak load, in order to model the
ratcheting phenomenon. Comprehensive details
with regards to the main features of the experiments
carried out, are summarised in the Table 3.1 below.

Ratcheting Uplift of Buried Pipelines in Sand / August 2015 / 5
Test No. Sand Description γ’
(kN/m3) Load Case Load (%) H/D
D
(mm)
01
Medium Dry
HST95 Sand
(Dr = 60%)
16.25
Monotonic 100
1 90 02 Cyclic 90
03 Cyclic 80
04 Cyclic 50
05 Monotonic 100
2 90 06 Cyclic 90
07 Cyclic 80
08 Cyclic 50
09
Loose Dry
HST95 Sand
(Dr = 27%)
15.25
Monotonic 100
1 90 10 Cyclic 90
11 Cyclic 80
12 Cyclic 50
13 Monotonic 100
2 90 14 Cyclic 90
15 Cyclic 80
16 Cyclic 50
Table 3.1: Summary of main test details
3.1 Monotonic test results
3.1.1 Peak uplift resistance
Soil peak uplift resistance, Rpeak, forms vital factor
when pipeline integrity is of interest, and thus, a
variety of contradictory methods and models have
been put forward by the researchers, most of which
seem to comply with the fact that the latter parameter
is mainly controlled by the depth of cover, H, the
unit weight of the soil, γ, the diameter of the pipe, D,
as well as the dimensionless uplift resistance
coefficient, f (White et al., 2001; DNV, 2007).
Generally, the main components that contribute to
the total resistance against upheaval buckling,
comprise the buoyant self-weight of the pipe, the
dead weight of the soil above the pipe, W’ and the
soil shear resistance, S. However, all the approaches
tend to differ with regards to the interpretation of the
parameter H and the uplift factor, f. A schematic
representation of the most widely accepted models
can be seen in Figure 3.1 below.
(a) Vertical Slip Surface Model (b) Inclined Slip Surface Model
Figure 3.1: Failure mechanisms: (a) Vertical Slip Surface Model; (b) Inclined Slip Surface Model;
(Thusyanthan et al., 2010)

Ratcheting Uplift of Buried Pipelines in Sand / August 2015 / 6
The validation of the experimental results was
carried out through the comparison of the derived
outcomes against literature-based formulas,
including approaches of Trautmann, Schaminée,
White and the DNV guidelines, all of which are
based on the aforementioned design models. The
estimation of Rpeak, according to DNV standards
(2007), as well as based on Trautmann et al. (1985)
Vertical Slip Models (VSM), was implemented by
using the Equation 3.1, while predicting differently
the uplift resistance factor, f.
2
21
82
11'
H
D
D
Hf
H
DHDRpeak
Equation 3.1
With regards to the rest of the approaches, the peak
uplift resistance values were derived using relatively
similar formulas (i.e. Equations 3.2 (a) and (b)), with
the exception that Schaminée et al. (1990) takes H
as it is, while White et al. (2001) considers the
weight of the block from the waist of the pipe and
above or otherwise, H = H + D/2. The updated
formula of White et al. (2008) for the soil uplift
capacity, is given by Equation 3.3.
D
HfHDRpeak 1' Equation 3.2(a)
D
HfDHRpeak 1' Equation 3.2(b)
D
Hf
H
DDHRpeak
81'
Equation 3.3
The uplift resistance factor, f, for each case was
estimated in line with the formulas of Table 3.2
below. Where K0 and Kp, are the lateral earth
pressure coefficients for at-rest and passive
conditions respectively, φcrit, the critical state
friction angle of sand, φpeak, the friction angle at peak
stress, ψ, the dilatancy angle, and r is the roughness
parameter taken as -1.
Method Dimensionless uplift resistance estimation Selected f
DNV (2007)
22 )1tantan1(
tantan
rKf
critcrit
critcritP
(for medium to dense sandy backfill)
critcritcritKf tan)sin1(tan0
(for loose sandy backfill)
0.45 (Medium)
0.29 (Loose)
White et al.,
(2001) & (2008)
2
)2(cos)1(
2
1tantantan 00
KK
f peak
0.62 (Medium)
0.41 (Loose)
Schaminée et al.,
(1990) ].50 ,3.0[f 0.40 (Both)
Trautmann et al.,
(1985) critKf tan0 0.29 (Both)
Table 3.2: Dimensionless uplift resistance prediction methods

Ratcheting Uplift of Buried Pipelines in Sand / August 2015 / 7
The values of peak and dilation angles, were
estimated following Bolton's (1986) concepts,
which are founded on correlations that equate
together, soil dilation angle with relative density, Dr,
and the in-situ mean effective stress, p'.
Rcritpeak mI 8.0 Equation 3.4
1'
ln
pDI c
rR
Equation 3.5
The Table 3.3 that follows, encompasses the
obtained Rpeak values normalised by the pipe unit
length, L, as those have been derived from the tests,
and according to the literature-based approaches,
while the percent error indicated with red colour, is
to enable direct proportional comparisons to be
made. Interpreting the following numerical data, it is
observed that all VSM-based methods tend to
produce the highest deviations from the actual
results, while the formula of the current DNV design
standards seems incapable of capturing the actual
performance owing to its empirical nature. In
contrary, the Inclined Surface Model of White et al.
(2008), represents the actual soil behaviour with the
highest levels of precision (i.e. the maximum
percent error is 3%), as it considers the uplift
coefficient as a function of relative density and the
ambient stress levels, accounting, thus, for dilatancy
effects in the estimations.
Medium sand (Dr = 60%) Loose sand (Dr = 27%)
H/D = 1 H/D = 2 H/D = 1 H/D = 2
Method Rpeak/L
(N/m)
Error
(%)
Rpeak/L
(N/m)
Error
(%)
Rpeak/L
(N/m)
Error
(%)
Rpeak/L
(N/m)
Error
(%)
Measured 322.04 - 793.20 - 247.37 - 552.77 -
DNV (2007) 277.88 -16% 646.11 -23% 217.52 -14% 486.18 -14%
White (2008) 329.58 2% 788.01 -1% 251.53 2% 570.75 3%
White (2001) 381.27 16% 839.69 6% 300.03 18% 619.26 11%
Schaminée (1990) 184.28 -75% 473.85 -67% 172.94 -43% 444.69 -24%
Trautmann (1985) 231.78 -39% 518.06 -53% 159.81 -55% 392.19 -41%
Table 3.3: Experimental and theoretical peak uplift resistance comparisons
Figure 3.2 on the left, aims to express
the non-dimensionalised form of the
results from the measured and the
theoretical peak uplift resistance (i.e.
the Rpeak normalized by the parameters
γ, H, D and L), as a function of the
embedment ratio, H/D.
Figure 3.2: Normalised peak uplift resistance vs H/D ratio
Ratcheting Uplift of Buried Pipelines in Sand / August 2015 / 8
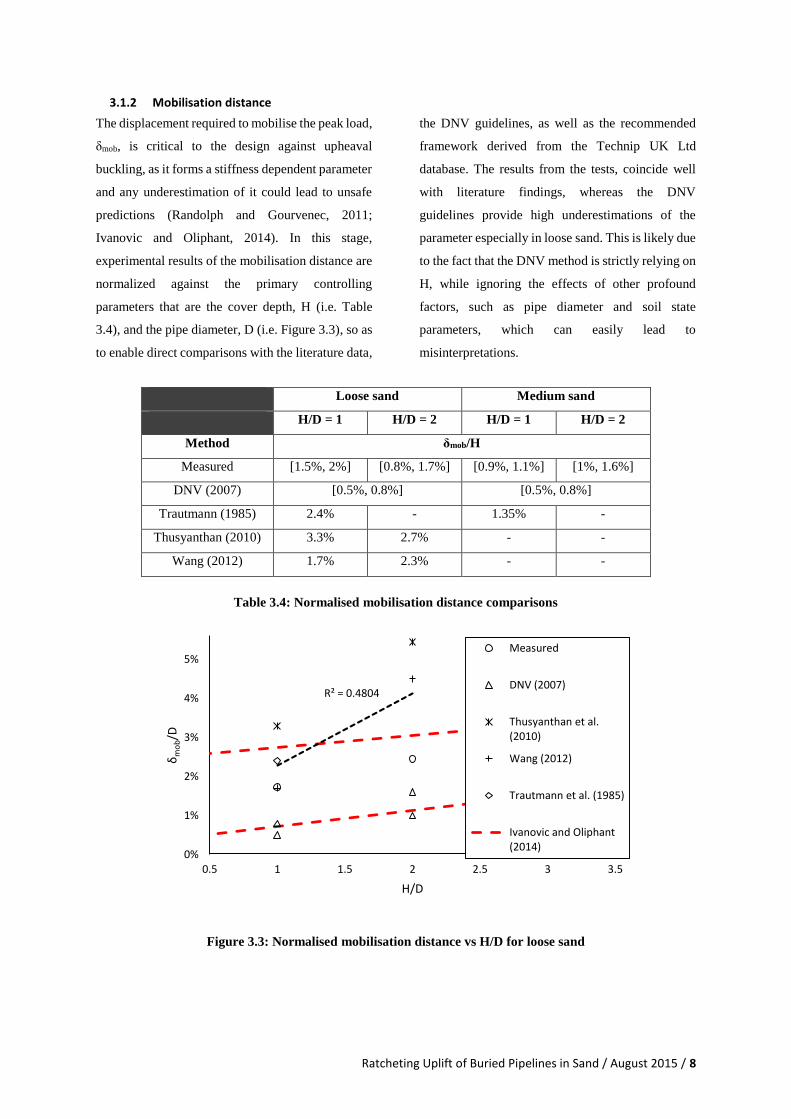
3.1.2 Mobilisation distance
The displacement required to mobilise the peak load,
δmob, is critical to the design against upheaval
buckling, as it forms a stiffness dependent parameter
and any underestimation of it could lead to unsafe
predictions (Randolph and Gourvenec, 2011;
Ivanovic and Oliphant, 2014). In this stage,
experimental results of the mobilisation distance are
normalized against the primary controlling
parameters that are the cover depth, H (i.e. Table
3.4), and the pipe diameter, D (i.e. Figure 3.3), so as
to enable direct comparisons with the literature data,
the DNV guidelines, as well as the recommended
framework derived from the Technip UK Ltd
database. The results from the tests, coincide well
with literature findings, whereas the DNV
guidelines provide high underestimations of the
parameter especially in loose sand. This is likely due
to the fact that the DNV method is strictly relying on
H, while ignoring the effects of other profound
factors, such as pipe diameter and soil state
parameters, which can easily lead to
misinterpretations.
Loose sand Medium sand
H/D = 1 H/D = 2 H/D = 1 H/D = 2
Method δmob/H
Measured [1.5%, 2%] [0.8%, 1.7%] [0.9%, 1.1%] [1%, 1.6%]
DNV (2007) [0.5%, 0.8%] [0.5%, 0.8%]
Trautmann (1985) 2.4% - 1.35% -
Thusyanthan (2010) 3.3% 2.7% - -
Wang (2012) 1.7% 2.3% - -
Table 3.4: Normalised mobilisation distance comparisons
Figure 3.3: Normalised mobilisation distance vs H/D for loose sand
R² = 0.4804
0%
1%
2%
3%
4%
5%
0.5 1 1.5 2 2.5 3 3.5
δm
ob/D
H/D
Measured
DNV (2007)
Thusyanthan et al.(2010)
Wang (2012)
Trautmann et al. (1985)
Ivanovic and Oliphant(2014)

Ratcheting Uplift of Buried Pipelines in Sand / August 2015 / 9
3.2 Cyclic test results
3.2.1 Stiffness degradation
The results from the cyclic tests were analysed in
terms of the stiffness degradation and the
accumulated displacement at the end of each
hysteresis loop. Accordingly, the stiffness
degradation per loading cycle was investigated for
each case, through the derivation of the secant
stiffness parameter, Gsec, which forms product of the
peak shear stress amplitude divided by the
corresponding maximum shear strain for each loop.
The secant modulus graphs below (i.e. Figure 3.4)
indicate that most cases of the shallowest cover
depth can be affected by ratcheting, whereas in the
deepest cases the pipe cyclic movement leads to
densification and progressive stiffening of the
backfill. The difference between the responses for
the two embedment cases, can be explained also by
the common argument that soil stiffness scales up
with the square root of effective stress, which, in
turn, increases with depth.
(a) Loose sand
(b) Medium sand
Figure 3.4: Stiffness degradation as a function of cycle number:
(a) Loose sand; (b) Medium sand

Ratcheting Uplift of Buried Pipelines in Sand / August 2015 / 10
3.2.2 Accumulated displacement
Reviewing the diagrammatical results for the
accumulated displacement normalized by the cover
depth from Figure 3.5, it may be seen that ratcheting
can affect the shallowest embedment cases
especially once δmob is exceeded. Also based on pipe
features, the phenomenon may still occur even if the
mobilisation due to ratcheting is as low as 1.2%D.
However, for the deepest embedment ratio the loss
of cover depth due to the residual cyclic
displacements is counterbalanced by the compaction
and stiffening of the soil.
(a) Loose sand
(b) Medium sand
Figure 3.5: Normalised accumulated displacement as a function of cycle number:
(a) Loose sand; (b) Medium sand

Ratcheting Uplift of Buried Pipelines in Sand / August 2015 / 11
3.2.3 Post cyclic capacity
Worth examining at this point is also the post cyclic
available capacity after the application of 100
cycles, as the impact of this process was not adverse
in all cases (i.e. Figure 3.6). In particular, this is
evident in the case of the highest embedment ratio
for loose sand where the cyclic loading enhanced the
overall soil resistance by 157%, factor that indicates
the significant contribution of the effective stress
level to the soil response during the event.
(a) Loose sand
(b) Medium sand
Figure 3.6: Cyclic load-displacement curves and post cyclic capacity:
(a) Loose sand; (b) Medium sand
4. CONCLUSIONS
Based on conclusions drawn from the outcomes of
this study, the following recommendations are
proposed, which could find future application in the
industry:
a) In terms of the monotonic uplift resistance,
Rpeak, the revised formula proposed by
White et al. (2008), is experimentally
proven to be the most reliable
approximation for the prediction of the
parameter in both cases of sands and
embedment ratios. Additionally, the uplift
resistance coefficient, f, should be regarded
as a function of the soil relative density, Dr,
and the mean stress level at depth of
interest, p', and thus, it should be calculated
in line with Bolton's concepts (1986).
Ratcheting Uplift of Buried Pipelines in Sand / August 2015 / 12
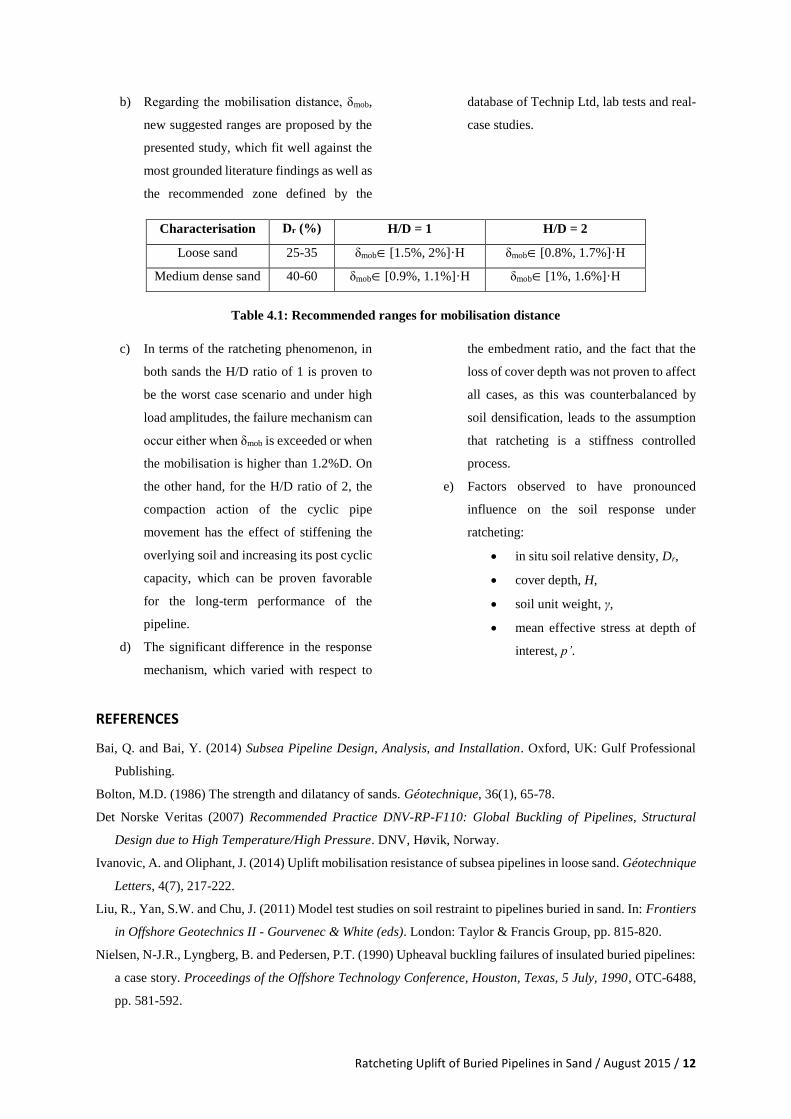
b) Regarding the mobilisation distance, δmob,
new suggested ranges are proposed by the
presented study, which fit well against the
most grounded literature findings as well as
the recommended zone defined by the
database of Technip Ltd, lab tests and real-
case studies.
Characterisation Dr (%) H/D = 1 H/D = 2
Loose sand 25-35 δmob[1.5%, 2%]·H δmob[0.8%, 1.7%]·H
Medium dense sand 40-60 δmob[0.9%, 1.1%]·H δmob[1%, 1.6%]·H
Table 4.1: Recommended ranges for mobilisation distance
c) In terms of the ratcheting phenomenon, in
both sands the H/D ratio of 1 is proven to
be the worst case scenario and under high
load amplitudes, the failure mechanism can
occur either when δmob is exceeded or when
the mobilisation is higher than 1.2%D. On
the other hand, for the H/D ratio of 2, the
compaction action of the cyclic pipe
movement has the effect of stiffening the
overlying soil and increasing its post cyclic
capacity, which can be proven favorable
for the long-term performance of the
pipeline.
d) The significant difference in the response
mechanism, which varied with respect to
the embedment ratio, and the fact that the
loss of cover depth was not proven to affect
all cases, as this was counterbalanced by
soil densification, leads to the assumption
that ratcheting is a stiffness controlled
process.
e) Factors observed to have pronounced
influence on the soil response under
ratcheting:
in situ soil relative density, Dr,
cover depth, H,
soil unit weight, γ,
mean effective stress at depth of
interest, p’.
REFERENCES
Bai, Q. and Bai, Y. (2014) Subsea Pipeline Design, Analysis, and Installation. Oxford, UK: Gulf Professional
Publishing.
Bolton, M.D. (1986) The strength and dilatancy of sands. Géotechnique, 36(1), 65-78.
Det Norske Veritas (2007) Recommended Practice DNV-RP-F110: Global Buckling of Pipelines, Structural
Design due to High Temperature/High Pressure. DNV, Høvik, Norway.
Ivanovic, A. and Oliphant, J. (2014) Uplift mobilisation resistance of subsea pipelines in loose sand. Géotechnique
Letters, 4(7), 217-222.
Liu, R., Yan, S.W. and Chu, J. (2011) Model test studies on soil restraint to pipelines buried in sand. In: Frontiers
in Offshore Geotechnics II - Gourvenec & White (eds). London: Taylor & Francis Group, pp. 815-820.
Nielsen, N-J.R., Lyngberg, B. and Pedersen, P.T. (1990) Upheaval buckling failures of insulated buried pipelines:
a case story. Proceedings of the Offshore Technology Conference, Houston, Texas, 5 July, 1990, OTC-6488,
pp. 581-592.
Ratcheting Uplift of Buried Pipelines in Sand / August 2015 / 13
Powrie, W. (2014) Soil Mechanics: Concepts and Applications, 3rd Edition. London: CRC Press. [Hard Copy]
Randolph, M. and Gourvenec, S. (2011) Offshore Geotechnical Engineering. Oxon: Spon Press. [Hard Copy]
Schaminee, P.E.L., Zorn, N.F. and Schotman, G.J.M. (1990) Soil response for pipeline upheaval buckling
analyses: full-scale laboratory tests and modelling, Proceedings of the 22nd Offshore Technology Conference,
Houston, Texas, July 5, 1990. OTC 6486, pp. 563-572.
Shajarati, A., Sørensen, K.W., Nielsen, S.K. and Ibsen, L.B. (2012) Behaviour of Cohesionless Soils During
Cyclic Loading. DCE Technical Memorandum No. 14. Aalborg University, Denmark.
Thusyanthan, N.I., Mesmar, S., Wang, J. and Haigh, S.K. (2010) Uplift resistance of buried pipelines and DNV-
RP-F110 guidelines. Proceedings of the 33rd Annual Offshore Pipeline Technology Conference & Exhibition,
Amsterdam, 24th - 25 thFebruary 2010. Amsterdam, Netherlands, OPT 2010, pp. 1-20.
Trautmann, C.H., O'Rourke, T.D. and Kulhawy, F.H. (1985) Uplift force-displacement response of buried pipe.
Journal of Geotechnical Engineering, 111(9), 1061-1076.
Wang, J. (2012) Monotonic & cyclic uplift resistance of buried pipelines in cohesionless soils. PhD Dissertation,
University of Cambridge. [Hard Copy]
White, D.J., Barefoot, A.J. and Bolton, M.D. (2001) Centrifuge modelling of upheaval buckling in sand.
International Journal of Physical Modelling in Geotechnics, 1(2), 19-28.
White, D.J., Cheuk, C.Y. and Bolton, M.D. (2008) The uplift resistance of pipes and plate anchors buried in sand.
Géotechnique, 58(10), 771-779.
Yu, L., Zhang, H. and Liu, J. (2015) A discrete element study on upheaval ratcheting behavior of pipelines buried
in sand. In: Frontiers in Offshore Geotechnics III - Meyer (Ed.). London: Taylor & Francis Group, pp. 483-
488.