full...
TRANSCRIPT

HOW WELL PLACED ARE RIVAL ECONOMIES TO TAKE ADVANTAGE OF GROWING GLOBALISATION?
...AND HOW HAVE GOVERNMENTS HELPED COMPANIES IN THEIR COUNTRY TO GROW THROUGH EXPORTS AND INTERNATIONAL EXPANSION? DECEMBER 2013
2 HOW WELL PLACED ARE RIVAL ECONOMIES TO TAKE ADVANTAGE OF GROWING GLOBALISATION
CONTENTS 1 – Introduction 3
2 – Overview 4
3 – Western Europe 6
4 – Central and Eastern Europe 7
5 – Middle East and Africa 8
6 – Asia and Asia Pacific 10
7 – The Americas 11

3 HOW WELL PLACED ARE RIVAL ECONOMIES TO TAKE ADVANTAGE OF GROWING GLOBALISATION
1 – INTRODUCTION
Globalisation is undoubtedly one of the biggest economic trends of the last 50 years, with the lives of consumers around the world now dominated by foreign brands and companies. Nobody seriously expects a reversal of globalisation, and despite the financial crisis and subsequent recession, the pace of globalisation looks set to continue, with rising incomes and increased consumption in emerging economies round the world now one of the key drivers. So what determines whether a country will be a winner in globalisation? Can governments play a role in helping their companies to develop fruitful relationships with customers across national boundaries? This report takes a look at some of the factors that reveal which economies are best placed to take advantage of the expected growth in global trade. Domestic regulations form a key part in determining how successful an economy is in encouraging new business creation and creating wealth. However, businesses that are looking to expand or export overseas will also need to consider whether a particular location makes a suitable base for internationalisation. Some countries are more successful than others at negotiating favourable tax treatment for ‘their’ corporates when they export to or operate in other markets. Negotiating dual tax agreements with the right nations means that companies do not face an excessive tax burden as a result of their overseas activities by being taxed both internationally and at home for the same activity. Similarly, when an economy is already well exposed to internationalisation, with a high trade to GDP ratio, international competition forces it to focus on areas of comparative advantage. This helps ensure that scarce skills and resources are deployed where they are most productive, which should create a virtuous circle. Some countries impose taxes on profits ‘repatriated’ from overseas operations, which can be a disincentive for businesses contemplating expanding their operations. In the USA, one of the last few countries still operating such a system, this has been a hot topic of debate.
4 HOW WELL PLACED ARE RIVAL ECONOMIES TO TAKE ADVANTAGE OF GROWING GLOBALISATION
2 – OVERVIEW
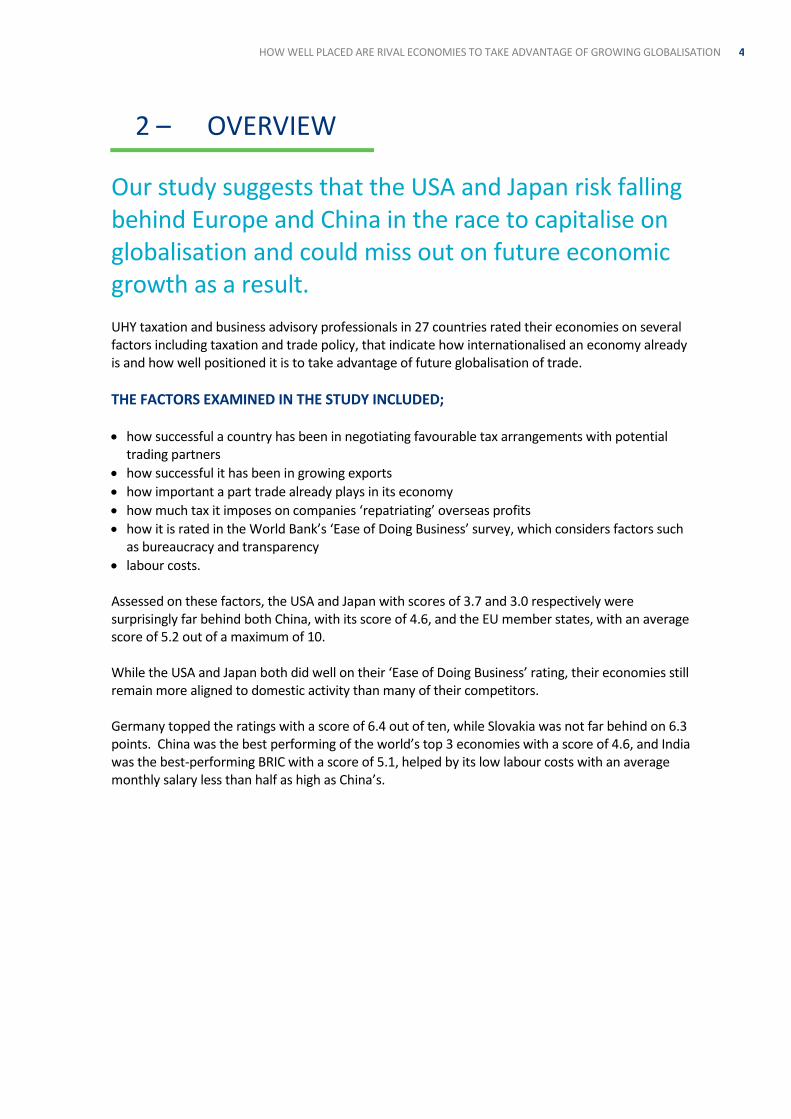
Our study suggests that the USA and Japan risk falling behind Europe and China in the race to capitalise on globalisation and could miss out on future economic growth as a result. UHY taxation and business advisory professionals in 27 countries rated their economies on several factors including taxation and trade policy, that indicate how internationalised an economy already is and how well positioned it is to take advantage of future globalisation of trade.
THE FACTORS EXAMINED IN THE STUDY INCLUDED;
how successful a country has been in negotiating favourable tax arrangements with potential trading partners
how successful it has been in growing exports
how important a part trade already plays in its economy
how much tax it imposes on companies ‘repatriating’ overseas profits
how it is rated in the World Bank’s ‘Ease of Doing Business’ survey, which considers factors such as bureaucracy and transparency
labour costs. Assessed on these factors, the USA and Japan with scores of 3.7 and 3.0 respectively were surprisingly far behind both China, with its score of 4.6, and the EU member states, with an average score of 5.2 out of a maximum of 10. While the USA and Japan both did well on their ‘Ease of Doing Business’ rating, their economies still remain more aligned to domestic activity than many of their competitors. Germany topped the ratings with a score of 6.4 out of ten, while Slovakia was not far behind on 6.3 points. China was the best performing of the world’s top 3 economies with a score of 4.6, and India was the best-performing BRIC with a score of 5.1, helped by its low labour costs with an average monthly salary less than half as high as China’s.
5 HOW WELL PLACED ARE RIVAL ECONOMIES TO TAKE ADVANTAGE OF GROWING GLOBALISATION
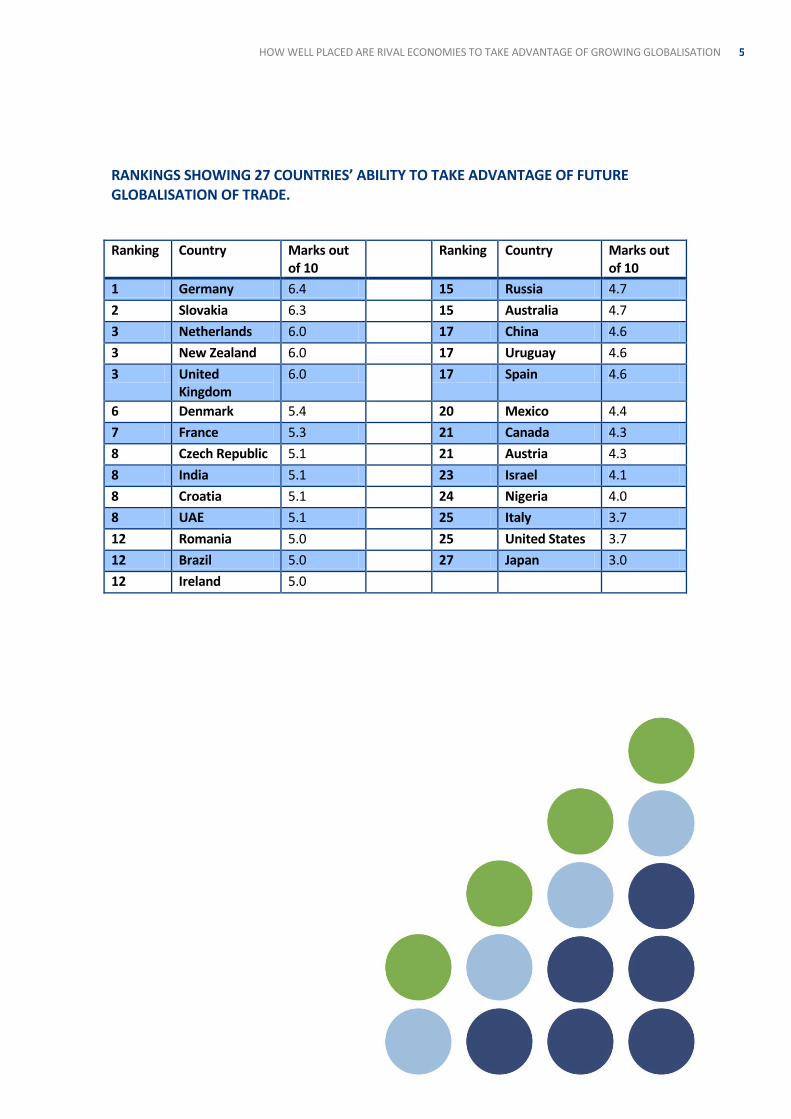
RANKINGS SHOWING 27 COUNTRIES’ ABILITY TO TAKE ADVANTAGE OF FUTURE GLOBALISATION OF TRADE.
Ranking Country Marks out of 10
Ranking Country Marks out of 10
1 Germany 6.4 15 Russia 4.7
2 Slovakia 6.3 15 Australia 4.7
3 Netherlands 6.0 17 China 4.6
3 New Zealand 6.0 17 Uruguay 4.6
3 United Kingdom
6.0 17 Spain 4.6
6 Denmark 5.4 20 Mexico 4.4
7 France 5.3 21 Canada 4.3
8 Czech Republic 5.1 21 Austria 4.3
8 India 5.1 23 Israel 4.1
8 Croatia 5.1 24 Nigeria 4.0
8 UAE 5.1 25 Italy 3.7
12 Romania 5.0 25 United States 3.7
12 Brazil 5.0 27 Japan 3.0
12 Ireland 5.0

6 HOW WELL PLACED ARE RIVAL ECONOMIES TO TAKE ADVANTAGE OF GROWING GLOBALISATION
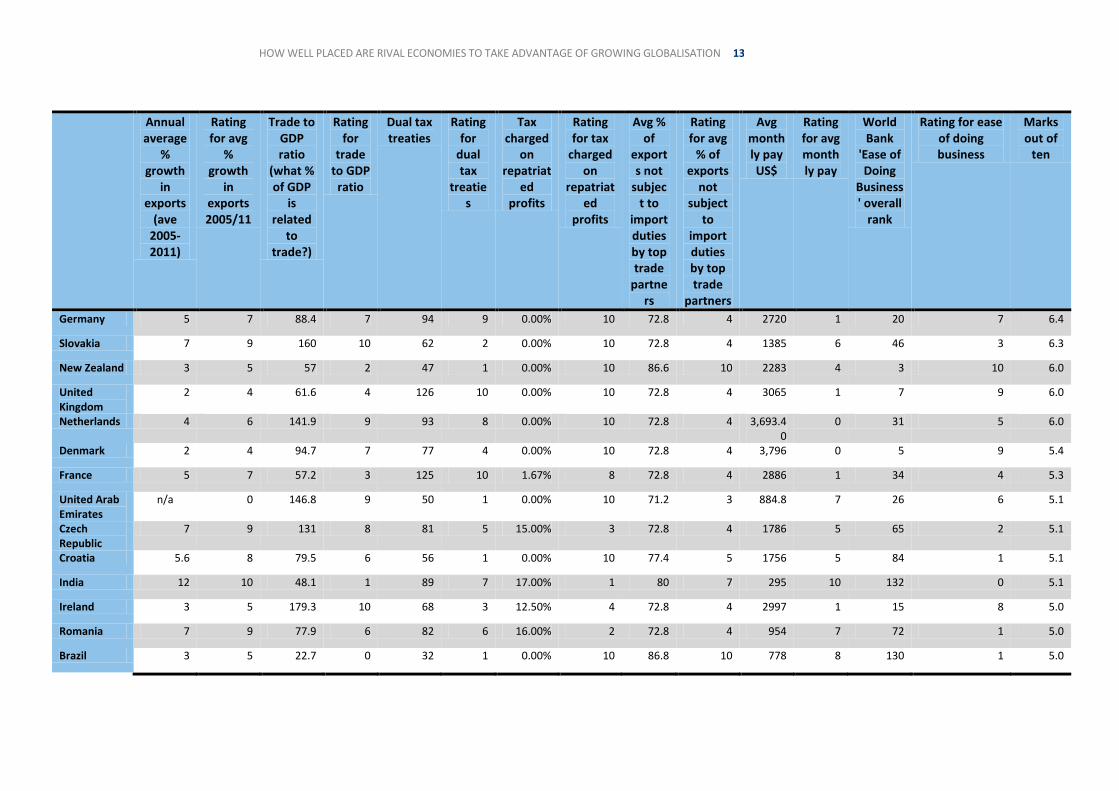
3 – WESTERN EUROPE With Germany coming at the very top of the international global trade table, and the UK and the Netherlands also in the top five, many Western European nations appear to be performing well in terms of their ability to capitalise on global trade opportunities. That said, our findings reveal significant variations across the more established members of the EU in terms of how focused their trade and tax policies are towards boosting international business. Key to Germany’s success is that it scores highly across every measure. For instance, it has the highest average annual export growth of any western European nation (at 5% annually between 2005 and 2011) and levies zero tax on repatriated profits. It also has relatively modest wage bills compared to other industrialised western economies, making it a competitive location both for home-grown businesses and foreign companies looking for a European base. In addition, Germany does the most intra-EU trade, and exports significantly more than it imports from other EU bloc countries (source: Eurostat). The combination of all these factors puts Germany in pole position to capitalise on global growth opportunities. However, despite its top rank overall, there are several specific areas where its performance is far outstripped by some of its near neighbours. For example, while scoring well on the number of dual tax treaties it has negotiated, Germany still falls well behind the UK and France in this area (the UK has 126 tax treaties in place compared to Germany’s 94). The UK and France both perhaps benefit from a historic advantage in this area, with especially strong diplomatic and trade links with the Commonwealth and Francophone Africa. Denmark is the easiest Western European country in the study in which to do business (it is placed 6th in the world), but Italy’s government could do more to make international trade easier through implementing policies to reduce bureaucracy and improve transparency (Italy is 73rd according to the World Bank). This widely recognised need to reform many areas of the Italian economy goes some way towards explaining why, despite having signed 91 dual tax treaties, Italy risks falling behind in its ability to harness globalisation. It achieved only 1% average annual growth in exports over the last seven years and just 53.9% of its GDP comes from trade. In spite of its recent economic troubles, Ireland has managed a creditable performance on the global trade stage, ranked 12th overall in our table. This is due in large part to its aggressive strategy for attracting international business, for instance its long-standing policy of retaining a very low corporation tax rate, which has drawn numerous major international brands to the country (such as Google) and creating a trade balance of 179% of its GDP. This low corporation tax also means that when a company is repatriating profits to Ireland from a country with which Ireland has a dual tax treaty there is generally no tax payable.

7 HOW WELL PLACED ARE RIVAL ECONOMIES TO TAKE ADVANTAGE OF GROWING GLOBALISATION
While its most recent economic performance is not yet reflected in most of the annual indicators included in our study, Spain is now starting to gain ground. Its economy exited a two-year recession in the third quarter of 2013 thanks to strong exports. In recent months, Markit's Purchasing Manager's Index (PMI) has shown that Spain's services and manufacturing companies, which have laid off employees, squeezed wages and cut prices have become more productive, helping them to win international orders. Overall, there is scope for the EU to bolster the global trading position of its member states by going further in offering even more favourable tariffs for exported goods for key trading partners. At 72.8%, EU member states offer one of the lowest proportions of exports duty free in our study.
Annual average
% growth
in exports
(average 2005-2011)
Trade to GDP
ratio (what % of
GDP is related
to trade?)
Number of dual
tax treaties
Tax charged on repatriated
profits
Avg % of exports
not subjected to import duties by top trade partners
Average monthly pay
US$
World Bank
Ease of doing
business ranking
Total marks out of
ten
Germany 5% 88.4 94 0% 72.8% 2,720.00 20 6.4
Netherlands 4% 141.9 93 0% 72.8% 3,693.40 31 6.0
United Kingdom
2% 61.6 126 0% 72.8% 3,065.00 7 6.0
Denmark 2% 94.7 77 0% 72.8% 3,796.00 5 5.4
France 7% 57.2 125 1.67% 72.8% 2,886.00 34 5.3
Ireland 3% 179.3 68 12.5%* 72.8% 2,997.00 15 5.0
Spain 3% 56.1 82 0% 72.8% 2,352.00 44 4.6
Italy 1% 53.9 91 1.38% 72.8% 2,445.00 73 3.7
*(Ireland) maximum – where a dual taxation treaty is in place the rate may be reduced by application of tax credits.
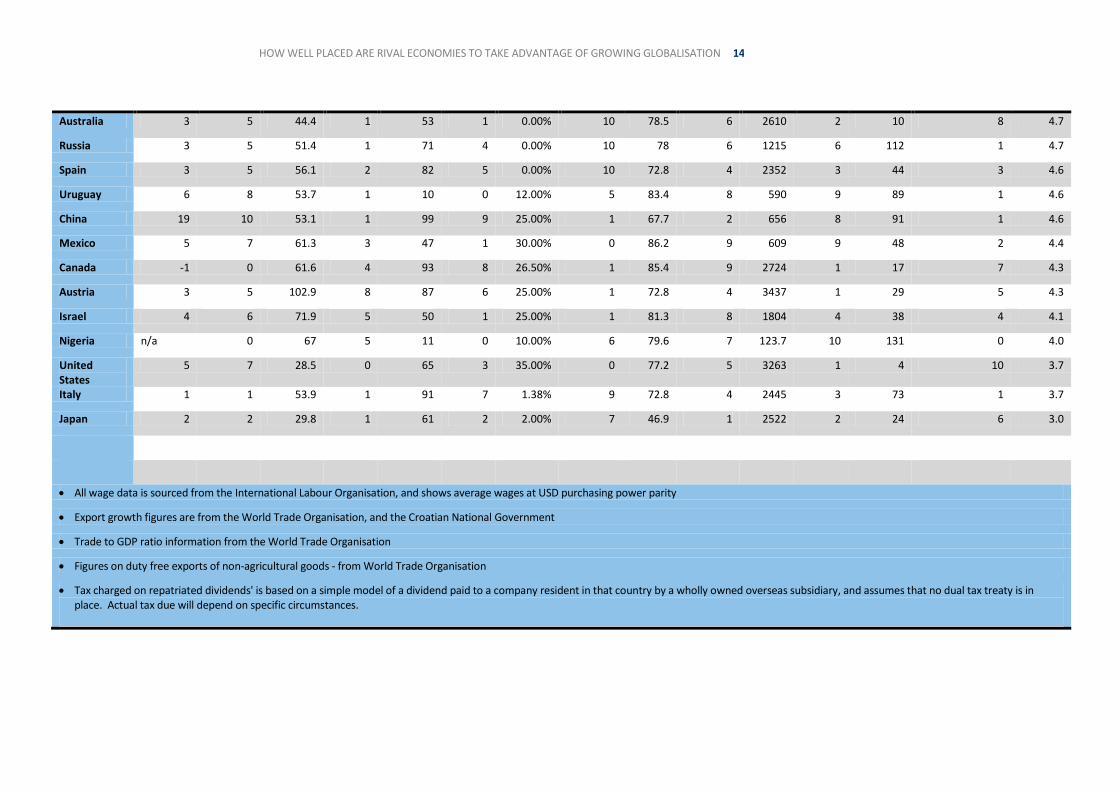
4 – CENTRAL AND EASTERN EUROPE Slovakia has made maximum use of its EU membership, and outscores its central and eastern European counterparts – and indeed most of the rest of the world – on the global trade league table. With annual average growth in exports of 7% in recent years, and a trade to GDP ratio of 160%, Slovakia is now a net exporter in terms of intra-EU trade. Its traditional strengths in manufacturing and its comparatively low labour costs could make it an attractive option for overseas firms looking to expand into Europe. Of the central and eastern European nations featured in our survey Slovakia was also one of the best in terms of Ease of Doing Business, at 46th in the world according to the World Bank. In Romania (which is 72nd in the world on this measure), high levels of bureaucracy remain a barrier to its taking greater advantage of global trade flows, despite having the lowest labour costs in the region and the second highest number of dual tax treaties.

8 HOW WELL PLACED ARE RIVAL ECONOMIES TO TAKE ADVANTAGE OF GROWING GLOBALISATION
With a moderate trade to GDP ratio of 51.4% Russia has the potential to substantially increase its share of international business. While its government offers a high proportion (78%) of exports duty-free to top trading partners, transparency and bureaucracy remain a stumbling block to fully embracing globalisation. Croatia, the EU’s newest member, has seen strong export growth of 5.6% per year in recent years, and should benefit from its EU membership to achieve further export growth. Joining the European bloc should also help Croatia to improve its profile globally and negotiate favourable tax treatment with a wider range of countries: its relatively low score on this measure is a hangover from the political and diplomatic challenges faced by the country in the wake of conflict in the 1990s. Austria scored well on several fronts, with its trade to GDP ratio of 102.9%, the highest number of dual tax treaties in the region (87) and the best ‘ease of doing business’ ranking. However its 25% tax rate on repatriated profits risks presenting a strong disincentive to Austrian companies expanding overseas. Foreign companies could also be deterred by its labour costs which are higher than in the UK, Germany and France.
Annual average
% growth
in exports
(average 2005-2011)
Trade to GDP
ratio (what % of
GDP is related
to trade?)
Number of dual
tax treaties
Tax charged on repatriated
profits
Average % of
exports not
subject to
import duties by top trade
partners
Average monthly pay US$
World Bank
Ease of doing
business ranking
Total marks out of
ten
Slovakia 7% 160 62 0% 72.8% 1,385.00 46 6.3
Czech Republic
7% 131 81 15% 72.8% 1,786.00 65 5.1
Croatia 5.6% 79.5 56 0% 77.4% 1,756.00 84 5.1
Romania 7% 77.9 82 16% 72.8% 954.00 72 5.0
Russia 3% 51.4 71 0% 78.0% 1,215.00 112 4.7
Austria 3% 102.9 87 25% 72.8% 3,437.00 29 4.3
5 – MIDDLE EAST AND AFRICA
The United Arab Emirates (UAE) ranked joint 8th in our table, performing well in its trade to GDP ratio (at 146.8% this is the second highest), ease of doing business score and its modest wage bills. With its diversified economy which includes commerce and tourism as well as oil, and its low tax system and open-market policies such as the introduction of free trade zones, the UAE is a magnet for foreign businesses looking for a base in the Middle East.

9 HOW WELL PLACED ARE RIVAL ECONOMIES TO TAKE ADVANTAGE OF GROWING GLOBALISATION
While it is not possible to obtain comparable UAE-wide data on export growth, Dubai in particular has put very significant effort into improving its trade status, as part of its wider agenda of diversifying away from dependence on oil. The massive expansion of the port at Jebel Ali has fuelled an annual growth in exports and re-exports from Dubai of approximately 20% over the last 7 years. Meanwhile, ING bank predicts export growth for the UAE as a whole at 9% annually. Nigeria ranked above the US, Japan and Italy in its ability to take advantage of future globalisation of trade. Its importance as an oil producer means it has enormous potential to increase its activity internationally but instability in the region could continue to hold it back for some time to come, as foreign businesses’ investment remains at high risk. Israel has seen reasonable annual average export growth in recent years (4%) and scores well in its percentage of exports that are duty free to key trade partners. However its current 25% tax rate on repatriated profits risks undermining its global performance. In 2009 the Israeli government allowed companies to repatriate dividends subject to a special reduced tax rate of 5%. Repeating or making this permanent would certainly provide a major boost to Israeli companies with operations overseas. Although a high proportion of Israel’s current exports are achieved duty free, Israel’s ability to capitalise on international business is hampered by its relatively low number of dual tax treaties. A renewed effort on ‘tax diplomacy’ could potentially smooth the way for Israeli companies to do more business with a wider range of countries, especially in emerging economies with growing incomes that are likely to be bigger consumers and trade partners in the future.
Annual average % growth in exports
(average 2005-2011)
Trade to GDP ratio (what %
of GDP is related to
trade?)
Number of dual
tax treaties
Tax charged on repatriated
profits
Average % of
exports not
subject to
import duties by top trade
partners
Average monthly pay US$
World Bank
Ease of doing
business ranking
Total marks out of
ten
United Arab Emirates
N/A 146.8 50 0% 71.2% 884.80 26 5.1
Israel 4% 71.9 50 25% 81.3% 1804.00 38 4.1
Nigeria N/A 67 11 10% 79.6% 123.70 131 4.0
10 HOW WELL PLACED ARE RIVAL ECONOMIES TO TAKE ADVANTAGE OF GROWING GLOBALISATION
6 – ASIA AND ASIA PACIFIC
New Zealand came joint third overall in our international trade table, leading the way in making it easy for foreign companies to do business there. Average labour costs are well below those of Australia and Japan, and it has the highest trade to GDP ratio in the region, at 57%. However, New Zealand faces strong challengers in its aspiration to boost exports within the Asia Pacific region, and the fast-growing economies of India and China are rapidly gaining ground, seeing an average annual export growth of 12% and 19% respectively between 2005 and 2011. This is hardly surprising, as more and more foreign companies take advantage of their manufacturing skills, low cost base and improved infrastructure to set up subsidiaries there or to contract-out production of goods to local companies. With the second lowest labour costs of any country in our table, and less than half of China’s wage bill, India is very attractive to international businesses looking to establish operations in the region. However, India’s tax system and bureaucracy could be holding it back from performing even better, reflected in a low World Bank ‘Ease of Doing Business’ rating. India’s trade to GDP ratio also remains relatively low, and many Indian companies are yet to be exposed to international competition. While China’s export growth is the strongest of any country in our study, Chinese companies’ ability to tap into consumer demand around the world may be being hampered by its Government’s tax policy, which charges 25% on overseas profits repatriated back to China. As Chinese firms increasingly look beyond their own domestic economy and seek to expand onto the international stage, this risks acting as a significant blow to their ability to take advantage of growth opportunities abroad. The figures also highlight how far Japan, once the global leader in exporting consumer electronics and strong too in the automotive sector, has fallen behind in international trade terms. Having suffered a stagnant economy for more than a decade, the country has lost market share in the electronics industry to regional rivals such as South Korea’s Samsung and Taiwan’s Foxconn. Re-focusing government policy could go a long way towards restoring Japan’s standing in global trade terms, making its businesses more competitive on the international stage. For example, currently it has the lowest proportion of exports offered duty-free to key trading partners of any country in our study, and only 29.8% of its GDP is related to trade. Going forward, it will be interesting to see what impact the Trans Pacific Partnership, the regional trade bloc currently under negotiation will have on international trade in the region as and when it comes to fruition.
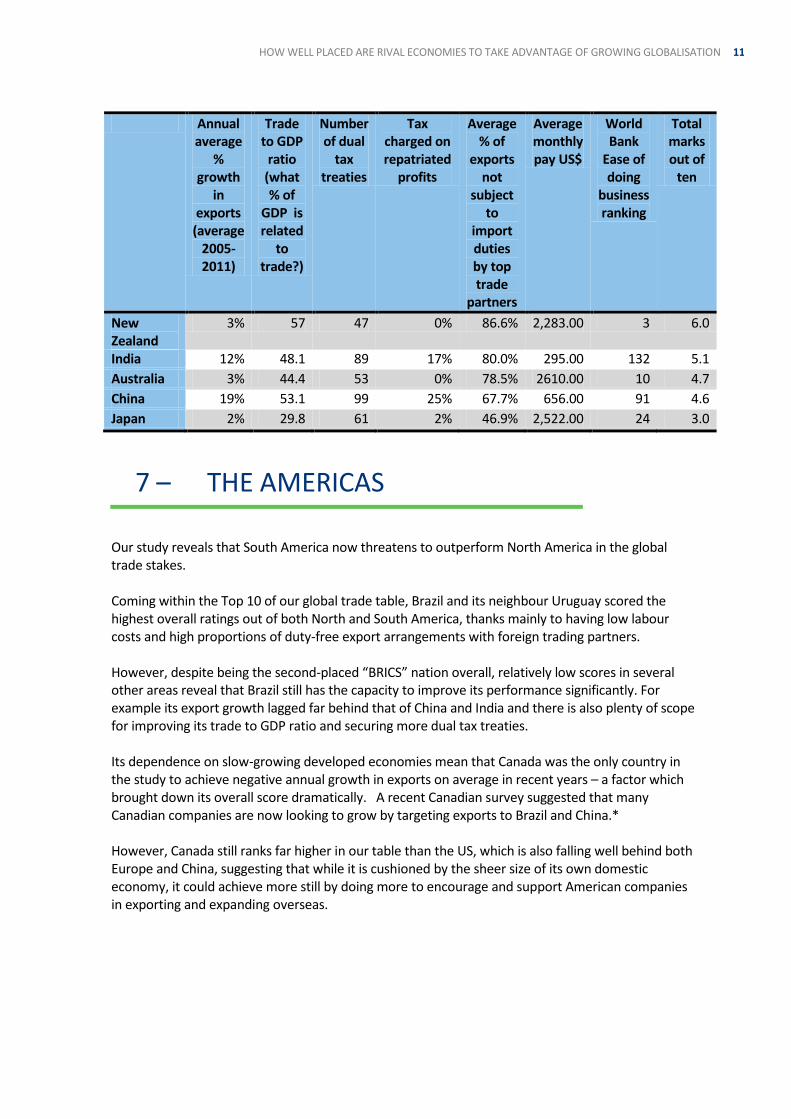
11 HOW WELL PLACED ARE RIVAL ECONOMIES TO TAKE ADVANTAGE OF GROWING GLOBALISATION
Annual average
% growth
in exports
(average 2005-2011)
Trade to GDP
ratio (what % of
GDP is related
to trade?)
Number of dual
tax treaties
Tax charged on repatriated
profits
Average % of
exports not
subject to
import duties by top trade
partners
Average monthly pay US$
World Bank
Ease of doing
business ranking
Total marks out of
ten
New Zealand
3% 57 47 0% 86.6% 2,283.00 3 6.0
India 12% 48.1 89 17% 80.0% 295.00 132 5.1
Australia 3% 44.4 53 0% 78.5% 2610.00 10 4.7
China 19% 53.1 99 25% 67.7% 656.00 91 4.6
Japan 2% 29.8 61 2% 46.9% 2,522.00 24 3.0
7 – THE AMERICAS
Our study reveals that South America now threatens to outperform North America in the global trade stakes. Coming within the Top 10 of our global trade table, Brazil and its neighbour Uruguay scored the highest overall ratings out of both North and South America, thanks mainly to having low labour costs and high proportions of duty-free export arrangements with foreign trading partners. However, despite being the second-placed “BRICS” nation overall, relatively low scores in several other areas reveal that Brazil still has the capacity to improve its performance significantly. For example its export growth lagged far behind that of China and India and there is also plenty of scope for improving its trade to GDP ratio and securing more dual tax treaties. Its dependence on slow-growing developed economies mean that Canada was the only country in the study to achieve negative annual growth in exports on average in recent years – a factor which brought down its overall score dramatically. A recent Canadian survey suggested that many Canadian companies are now looking to grow by targeting exports to Brazil and China.* However, Canada still ranks far higher in our table than the US, which is also falling well behind both Europe and China, suggesting that while it is cushioned by the sheer size of its own domestic economy, it could achieve more still by doing more to encourage and support American companies in exporting and expanding overseas.

12 HOW WELL PLACED ARE RIVAL ECONOMIES TO TAKE ADVANTAGE OF GROWING GLOBALISATION
Despite achieving 5% average annual growth in exports and being the 4th easiest place in the world in which to do business, the USA’s trade and tax policies risk holding its performance back. One key factor hampering it from fully harnessing globalisation is that it levies the highest tax charge on repatriated profits of any country we looked at – a swingeing 35% - potentially acting as a significant barrier to US companies, particularly SMEs, looking to expand overseas. This controversial distortion has been the subject of intense debate, with companies like Apple criticising its impact and blaming it for aggressive profit shifting strategies. Its record in negotiating favourable tax treatment with trading partners to date is also below par, with just over half the number of dual tax treaties that the UK has. However, its efforts to look beyond its domestic economy and broaden its range of key trading partners (historically Canada, Mexico, Japan and the EU) through its involvement in the Trans Pacific Partnership with countries in Asia and the Pacific region could help transform its position in the global trade arena.
*Export Development Canada’s semi-annual survey of Canadian companies, released June
27, 2013. [←]
Annual average
% growth
in exports
(average 2005-2011)
Trade to GDP
ratio (what % of
GDP is related
to trade?)
Number of dual
tax treaties
Tax charged on repatriated
profits
Average % of
exports not
subject to
import duties by top trade
partners
Average monthly pay US$
World Bank
Ease of doing
business ranking
Total marks out of
ten
Brazil 3% 22.7 32 0% 86.8% 778.00 130 5.0
Uruguay 6% 53.7 10 12% 83.4% 590.00 89 4.6
Mexico 5% 61.3 47 30% 86.2% 609.00 48 4.4
Canada -1% 61.6 93 26.5% 85.4% 2,724.00 17 4.3
USA 5% 28.5 65 35% 77.2% 3,263.00 4 3.7
13 HOW WELL PLACED ARE RIVAL ECONOMIES TO TAKE ADVANTAGE OF GROWING GLOBALISATION
Annual average
% growth
in exports
(ave 2005-2011)
Rating for avg
% growth
in exports 2005/11
Trade to GDP ratio
(what % of GDP
is related
to trade?)
Rating for
trade to GDP
ratio
Dual tax treaties
Rating for
dual tax
treaties
Tax charged
on repatriat
ed profits
Rating for tax
charged on
repatriated
profits
Avg % of
exports not
subject to
import duties by top trade
partners
Rating for avg
% of exports
not subject
to import duties by top trade
partners
Avg monthly pay US$
Rating for avg monthly pay
World Bank
'Ease of Doing
Business' overall
rank
Rating for ease of doing business
Marks out of
ten
Germany 5 7 88.4 7 94 9 0.00% 10 72.8 4 2720 1 20 7 6.4
Slovakia 7 9 160 10 62 2 0.00% 10 72.8 4 1385 6 46 3 6.3
New Zealand 3 5 57 2 47 1 0.00% 10 86.6 10 2283 4 3 10 6.0
United Kingdom
2 4 61.6 4 126 10 0.00% 10 72.8 4 3065 1 7 9 6.0
Netherlands 4 6 141.9 9 93 8 0.00% 10 72.8 4 3,693.40
0 31 5 6.0
Denmark 2 4 94.7 7 77 4 0.00% 10 72.8 4 3,796 0 5 9 5.4
France 5 7 57.2 3 125 10 1.67% 8 72.8 4 2886 1 34 4 5.3
United Arab Emirates
n/a 0 146.8 9 50 1 0.00% 10 71.2 3 884.8 7 26 6 5.1
Czech Republic
7 9 131 8 81 5 15.00% 3 72.8 4 1786 5 65 2 5.1
Croatia 5.6 8 79.5 6 56 1 0.00% 10 77.4 5 1756 5 84 1 5.1
India 12 10 48.1 1 89 7 17.00% 1 80 7 295 10 132 0 5.1
Ireland 3 5 179.3 10 68 3 12.50% 4 72.8 4 2997 1 15 8 5.0
Romania 7 9 77.9 6 82 6 16.00% 2 72.8 4 954 7 72 1 5.0
Brazil 3 5 22.7 0 32 1 0.00% 10 86.8 10 778 8 130 1 5.0
14 HOW WELL PLACED ARE RIVAL ECONOMIES TO TAKE ADVANTAGE OF GROWING GLOBALISATION
Australia 3 5 44.4 1 53 1 0.00% 10 78.5 6 2610 2 10 8 4.7
Russia 3 5 51.4 1 71 4 0.00% 10 78 6 1215 6 112 1 4.7
Spain 3 5 56.1 2 82 5 0.00% 10 72.8 4 2352 3 44 3 4.6
Uruguay 6 8 53.7 1 10 0 12.00% 5 83.4 8 590 9 89 1 4.6
China 19 10 53.1 1 99 9 25.00% 1 67.7 2 656 8 91 1 4.6
Mexico 5 7 61.3 3 47 1 30.00% 0 86.2 9 609 9 48 2 4.4
Canada -1 0 61.6 4 93 8 26.50% 1 85.4 9 2724 1 17 7 4.3
Austria 3 5 102.9 8 87 6 25.00% 1 72.8 4 3437 1 29 5 4.3
Israel 4 6 71.9 5 50 1 25.00% 1 81.3 8 1804 4 38 4 4.1
Nigeria n/a 0 67 5 11 0 10.00% 6 79.6 7 123.7 10 131 0 4.0
United States
5 7 28.5 0 65 3 35.00% 0 77.2 5 3263 1 4 10 3.7
Italy 1 1 53.9 1 91 7 1.38% 9 72.8 4 2445 3 73 1 3.7
Japan 2 2 29.8 1 61 2 2.00% 7 46.9 1 2522 2 24 6 3.0
All wage data is sourced from the International Labour Organisation, and shows average wages at USD purchasing power parity
Export growth figures are from the World Trade Organisation, and the Croatian National Government
Trade to GDP ratio information from the World Trade Organisation
Figures on duty free exports of non-agricultural goods - from World Trade Organisation
Tax charged on repatriated dividends' is based on a simple model of a dividend paid to a company resident in that country by a wholly owned overseas subsidiary, and assumes that no dual tax treaty is in place. Actual tax due will depend on specific circumstances.
www.uhy.com
LET US HELP YOU ACHIEVE FURTHER BUSINESS SUCCESS To find out how UHY can assist your business, contact any of our member firms. You can visit us online at www.uhy.com to find contact details for all of our offices, or email us at [email protected] for further information.
UHY is an international network of legally independent accounting and consultancy firms whose administrative entity is Urbach Hacker Young International Limited, a UK company. UHY is the brand name for the UHY international network. Services to clients are provided by member firms and not by Urbach Hacker Young International Limited. Neither Urbach Hacker Young International Limited, the UHY network, nor any member of UHY has any liability for services provided by other members.
© 2013 UHY International Ltd