full-scale fatigue testing of a wind turbine blade in...
TRANSCRIPT

materials
Article
Full-Scale Fatigue Testing of a Wind Turbine Blade inFlapwise Direction and Examining the Effect of CrackPropagation on the Blade Performance
Othman Al-Khudairi 1, Homayoun Hadavinia 1,* ID , Christian Little 2, Gavin Gillmore 1,Peter Greaves 2 and Kirsten Dyer 2,*
1 School of Engineering, Kingston University, London SW15 3DW, UK; [email protected] (O.A.);[email protected] (G.G.)
2 Offshore Renewable Energy Catapult (ORE), Blyth NE24 1LZ, UK; [email protected] (C.L.);[email protected] (P.G.)
* Correspondence: [email protected] (H.H.); [email protected] (K.D.)
Received: 8 August 2017; Accepted: 29 September 2017; Published: 3 October 2017
Abstract: In this paper, the sensitivity of the structural integrity of wind turbine blades to debondingof the shear web from the spar cap was investigated. In this regard, modal analysis, static and fatiguetesting were performed on a 45.7 m blade for three states of the blade: (i) as received blade (ii) whena crack of 200 mm was introduced between the web and the spar cap and (iii) when the crack wasextended to 1000 mm. Calibration pull-tests for all three states of the blade were performed toobtain the strain-bending moment relationship of the blade according to the estimated target bendingmoment (BM) which the blade is expected to experience in its service life. The resultant data wasused to apply appropriate load in the fatigue tests. The blade natural frequencies in flapwise andedgewise directions over a range of frequency domain were found by modal testing for all threestates of the blade. The blade first natural frequency for each state was used for the flapwise fatiguetests. These were performed in accordance with technical specification IEC TS 61400-23. The fatigueresults showed that, for a 200 mm crack between the web and spar cap at 9 m from the blade root,the crack did not propagate at 50% of the target BM up to 62,110 cycles. However, when the loadwas increased to 70% of target BM, some damages were detected on the pressure side of the blade.When the 200 mm crack was extended to 1000 mm, the crack began to propagate when the appliedload exceeded 100% of target BM and the blade experienced delaminations, adhesive joint failure,compression failure and sandwich core failure.
Keywords: wind turbine; wind blades; flapwise fatigue test; blade modal testing; glass fibrepolymer composite
1. Introduction
One of the main recurring problems within wind turbine blades is fatigue of the blade, especiallyas the magnitude of the blade size is increasing. The blades are subjected to a highly irregularloading condition caused by turbulent wind flow, gravity, and inertial loading during acceleratingor decelerating of the turbine. A wind turbine blade is predominantly loaded in the flapwise andedgewise directions. During operation, the source of flapwise loads are mainly aerodynamic, while theedgewise loads are mainly caused by gravity. The aerodynamic loading is at maximum when the bladeposition is at 12 O’clock due to higher wind velocity from wind shear, and a minimum when the bladeis at 6 O’clock when the blade passes through stagnant air in front of the turbine tower. A modernwind turbine is designed to last 20–30 years almost unattended; hence, a comprehensive testing of the
Materials 2017, 10, 1152; doi:10.3390/ma10101152 www.mdpi.com/journal/materials

Materials 2017, 10, 1152 2 of 22
blade is mandatory. Details of the blade testing, inspecting and monitoring procedures can be foundin [1,2].
The flapwise loads are carried by the main spar (or girders) while edgewise loads are takenpartially by spar and partially, if present, by reinforcement in the leading and trailing edges. Shearwebs are located between the two spar caps and provide shear strength to the blade. They are usuallymade from sandwich structure with bi-axial fibre laminate skins and a central core. The rest of theblade is usually constructed from multi-axial skin material and sandwich structure from glass fibrereinforced polymer (GFRP) composite layers, with a core from foam or balsa wood, ensuring low mass,resistance to torsion and buckling. Characterisation of GFRP materials prior to using in the blade isnecessary and the procedure for determining delamination toughness and fatigue performance ofGFRP have been reported elsewhere [3–5].
As part of the certification procedure, all wind turbine blades are subjected to static, fatigueand failure tests in order to ensure that the produced wind turbine blade fulfill the actual designrequirements. Blade manufactures are required to carry out static and fatigue tests of full-scaleblades prior to their deployment for commercial use according to international standards [6–9] andguidelines [10,11]. The static test applies the appropriate extreme load in all directions, i.e. leadingedge, trailing edge, suction side and pressure side. The whole static test is then repeated after thefatigue test to ensure that the blade can handle extreme loads after it has been subjected to high cyclicloading. For application of new materials, or other significant changes in the structural design of theblade, a failure test (also called crash test) may be necessary in addition to the static and fatigue tests.After a crash test the blade is cut open at the point of fracture, and the fracture surfaces are examinedin detail to find out the root cause of failure. The design may be revised after the forensic analysis ofthe fracture surfaces.
Yang et al. [12] have done blade crash testing under flapwise loading on a 40 m long blade madefrom E-glass/epoxy composite materials. They evaluated the structural response of the blade duringloading and after crash they correlated experimental data with numerical modelling. They showed theblade sections subjected to bending moments can suffer a non-linearity in their bending response andmay crush from the rotated compressive or tensile forces due to the curvature that arises from bending.Kühlmeier [13] showed an interlaminar shear failure originated from local bending in the shell due toan initial geometric imperfection could trigger a progressive collapse of the wind turbine blade section.
Lee and Park [14] tested a 48.3 m wind turbine blade to find the residual strength of the bladesubjected to initial static and then fatigue tests. In the positive flapwise direction (from the pressure-sideshell to the suction-side shell), the blade was able to sustain the most severe load, but when a staticload was applied in the opposite direction the blade collapsed when subjected to 70% of the maximumtarget load, equivalent to 50% of the most severe load in the positive flapwise direction. Based on thetest results and the fracture patterns at the blade’s broken section, they suggested a modified laminatelay-up from (±45/0/core/±45/0) to (±45/0/core/0/±45). Of course this modification makes thelaminate symmetric and as a result the coupling stiffness matrix of the laminate, B matrix, becomeszero and extension and bending becomes decoupled.
Jensen et al. [15] tested a 34 m wind turbine blade until its structural collapse. The reported failuremechanism was debonding of the outer shell skin followed by delamination buckling. It was notedthat the non-linear distortion was caused by the crushing pressure derived from the Brazier effect.The Brazier pressure, where the flexural starts to decrease due to ovalisation of the blade structure,has a significant impact on the design of new blades. They optimized a box girder and showed theimportance of including Brazier pressure in the design process for wind turbine blades.
For very long blades, it has been found that buckling failure becomes more important thantip deflection and even fatigue [13]. In blades for safety against buckling a 1.634 safety factor isrecommended, meaning that the structure must be capable of withstanding 1.634 times the worst casebuckling condition. Cox and Echtermeyer [16] studied the effect of changing the fibre orientations ofthe less stiff, off-axis glass fibre plies on increasing the critical buckling load of a 70 m carbon/glass

Materials 2017, 10, 1152 3 of 22
hybrid wind turbine blade from nonlinear finite element analysis. They showed the orientation ofthe stability plies influences the onset of the Brazier effect, which in turn affected blade stabilityand buckling failure location. They achieved a maximum increase of 8% in critical buckling load bychanging the orientation of the stability plies from ±45 as specified in the reference blade to ±70
while both blade weight and laminate thickness remained constant.Blade root failure can result in the blade being pulled out from its hub during operation. Lee
et al. [17] reported delamination failure at the blade root during full-scale fatigue testing of a 3 MWwind turbine blade with length and weight of 56 m and 14.5 ton, respectively. They noticed that thebumping motions of the blade shell redistribute the load at the blade root, resulting in the alleviation ofstresses in some locations and the increase of stresses in other locations. They carried out finite elementanalysis, and showed that in a slender and large wind turbine blade, the actual load distribution at theroot is very different from that calculated using assumptions that the blade root has enough stiffnessto be modelled as a bending of a hollow circular cylinder.
The fatigue life of the blade can be improved by embedding secondary nanoreinforcementsin the polymer matrix. Mishnaevsky and Dai [18] used computational modelling and showed thatsecondary nanoreinforcement can drastically increase the fatigue lifetime of composites. Many otherresearchers have shown experimentally that the toughness of the resin can be substantially improvedby adding nanoparticles to the polymer matrix [19]. Recently by addition of 0.25 wt % of plasmafunctionalised graphene nanoparticles to epoxy, the fracture toughness has been increased by morethan 50% [20]. Using these new advanced resins will improve a broad range of other physical andmechanical properties of the fibre reinforced composite as well at relatively low cost, a promisingmaterial for improving the fatigue damage tolerance of wind turbine blades.
In this paper, a step-by-step full-scale fatigue test of a wind turbine blade is discussed. After thefatigue testing of as received wind turbine blade, the sensitivity of the blade to damage, by manuallydebonding the shear web from spar cap as shown in Figure 1, has been investigated. The steps ofthe testing included modal analysis, static, and fatigue testing of a 45.7 m blade in three states of theblade: (i) as received blade (ii) when a crack of 200 mm was introduced between the web and the sparcap and (iii) when the crack was extended to 1000 mm length. As no design data for the blade wasavailable, the location of the crack was chosen to be at a point on the blade which is usually structurallychallenging (around max chord) and where the bond line was relatively easy to access.
Materials 2017, 10, 1152 3 of 22
load by changing the orientation of the stability plies from ±45° as specified in the reference blade to
±70° while both blade weight and laminate thickness remained constant.
Blade root failure can result in the blade being pulled out from its hub during operation. Lee et
al. [17] reported delamination failure at the blade root during full‐scale fatigue testing of a 3 MW
wind turbine blade with length and weight of 56 m and 14.5 ton, respectively. They noticed that the
bumping motions of the blade shell redistribute the load at the blade root, resulting in the alleviation
of stresses in some locations and the increase of stresses in other locations. They carried out finite
element analysis, and showed that in a slender and large wind turbine blade, the actual load
distribution at the root is very different from that calculated using assumptions that the blade root
has enough stiffness to be modelled as a bending of a hollow circular cylinder.
The fatigue life of the blade can be improved by embedding secondary nanoreinforcements in
the polymer matrix. Mishnaevsky and Dai [18] used computational modelling and showed that
secondary nanoreinforcement can drastically increase the fatigue lifetime of composites. Many other
researchers have shown experimentally that the toughness of the resin can be substantially improved
by adding nanoparticles to the polymer matrix [19]. Recently by addition of 0.25 wt % of plasma
functionalised graphene nanoparticles to epoxy, the fracture toughness has been increased by more
than 50% [20]. Using these new advanced resins will improve a broad range of other physical and
mechanical properties of the fibre reinforced composite as well at relatively low cost, a promising
material for improving the fatigue damage tolerance of wind turbine blades.
In this paper, a step‐by‐step full‐scale fatigue test of a wind turbine blade is discussed. After the
fatigue testing of as received wind turbine blade, the sensitivity of the blade to damage, by manually
debonding the shear web from spar cap as shown in Figure 1, has been investigated. The steps of the
testing included modal analysis, static, and fatigue testing of a 45.7 m blade in three states of the
blade: (i) as received blade (ii) when a crack of 200 mm was introduced between the web and the spar
cap and (iii) when the crack was extended to 1000 mm length. As no design data for the blade was
available, the location of the crack was chosen to be at a point on the blade which is usually
structurally challenging (around max chord) and where the bond line was relatively easy to access.
Figure 1. Schematic of induced crack location.
The calibration pull‐tests for all three states of the blade were performed to obtain the strain‐
bending moment (BM) relationship of the blade according to the target BM which the blade is
expected to experience in its service life. The data was used for applying appropriate loads in the
fatigue tests. Then the blade natural frequencies in both the flapwise and edgewise directions over a
frequency domain range were found by modal testing using hammer impact for all three states of the
blade. The IEC 61400‐23 standard [6] has then been followed for full‐scale blade fatigue testing.
Figure 1. Schematic of induced crack location.
The calibration pull-tests for all three states of the blade were performed to obtain thestrain-bending moment (BM) relationship of the blade according to the target BM which the bladeis expected to experience in its service life. The data was used for applying appropriate loads in the
Materials 2017, 10, 1152 4 of 22
fatigue tests. Then the blade natural frequencies in both the flapwise and edgewise directions over afrequency domain range were found by modal testing using hammer impact for all three states of theblade. The IEC 61400-23 standard [6] has then been followed for full-scale blade fatigue testing. Finally,the states of the crack and accompanying damage for all states of the blade have been identified.
2. Experimental Studies
2.1. Full-Scale Testing Platform
Offshore Renewable Energy (ORE) Catapult has purpose built testing facilities to replicate theharsh fatigue loading which turbine blades experience, within the confines of a test hall. Full-scaleblade tests were performed in ORE Catapult 100 m blade test facility capable of static, fatigue, naturalfrequency testing and for locating the blade centre of gravity.
2.2. The Blade Specification
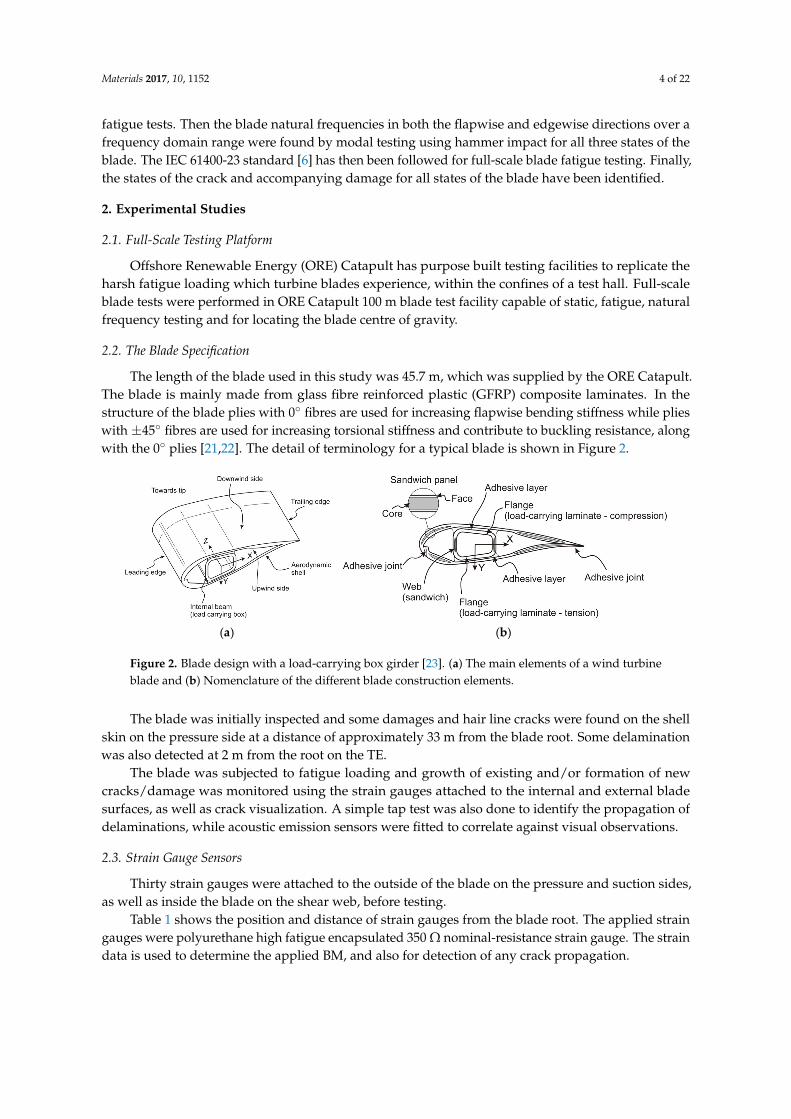
The length of the blade used in this study was 45.7 m, which was supplied by the ORE Catapult.The blade is mainly made from glass fibre reinforced plastic (GFRP) composite laminates. In thestructure of the blade plies with 0 fibres are used for increasing flapwise bending stiffness while plieswith ±45 fibres are used for increasing torsional stiffness and contribute to buckling resistance, alongwith the 0 plies [21,22]. The detail of terminology for a typical blade is shown in Figure 2.
Materials 2017, 10, 1152 4 of 22
Finally, the states of the crack and accompanying damage for all states of the blade have been
identified.
2. Experimental Studies
2.1. Full‐Scale Testing Platform
Offshore Renewable Energy (ORE) Catapult has purpose built testing facilities to replicate the
harsh fatigue loading which turbine blades experience, within the confines of a test hall. Full‐scale
blade tests were performed in ORE Catapult 100 m blade test facility capable of static, fatigue, natural
frequency testing and for locating the blade centre of gravity.
2.2. The Blade Specification
The length of the blade used in this study was 45.7 m, which was supplied by the ORE Catapult.
The blade is mainly made from glass fibre reinforced plastic (GFRP) composite laminates. In the
structure of the blade plies with 0° fibres are used for increasing flapwise bending stiffness while
plies with ±45° fibres are used for increasing torsional stiffness and contribute to buckling resistance,
along with the 0° plies [21,22]. The detail of terminology for a typical blade is shown in Figure 2.
(a) (b)
Figure 2. Blade design with a load‐carrying box girder [23]. (a) The main elements of a wind turbine
blade and (b) Nomenclature of the different blade construction elements.
The blade was initially inspected and some damages and hair line cracks were found on the shell
skin on the pressure side at a distance of approximately 33 m from the blade root. Some delamination
was also detected at 2 m from the root on the TE.
The blade was subjected to fatigue loading and growth of existing and/or formation of new
cracks/damage was monitored using the strain gauges attached to the internal and external blade
surfaces, as well as crack visualization. A simple tap test was also done to identify the propagation
of delaminations, while acoustic emission sensors were fitted to correlate against visual observations.
2.3. Strain Gauge Sensors
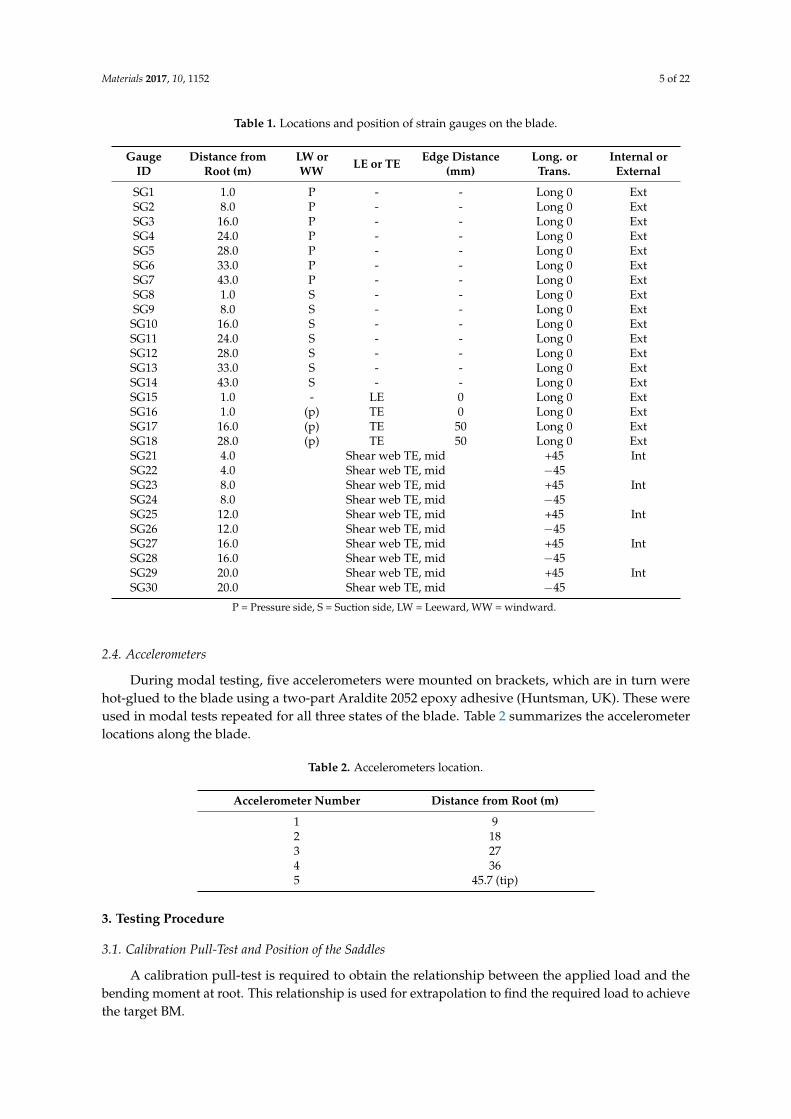
Thirty strain gauges were attached to the outside of the blade on the pressure and suction sides,
as well as inside the blade on the shear web, before testing.
Table 1 shows the position and distance of strain gauges from the blade root. The applied strain
gauges were polyurethane high fatigue encapsulated 350 Ω nominal‐resistance strain gauge. The
strain data is used to determine the applied BM, and also for detection of any crack propagation.
Figure 2. Blade design with a load-carrying box girder [23]. (a) The main elements of a wind turbineblade and (b) Nomenclature of the different blade construction elements.
The blade was initially inspected and some damages and hair line cracks were found on the shellskin on the pressure side at a distance of approximately 33 m from the blade root. Some delaminationwas also detected at 2 m from the root on the TE.
The blade was subjected to fatigue loading and growth of existing and/or formation of newcracks/damage was monitored using the strain gauges attached to the internal and external bladesurfaces, as well as crack visualization. A simple tap test was also done to identify the propagation ofdelaminations, while acoustic emission sensors were fitted to correlate against visual observations.
2.3. Strain Gauge Sensors
Thirty strain gauges were attached to the outside of the blade on the pressure and suction sides,as well as inside the blade on the shear web, before testing.
Table 1 shows the position and distance of strain gauges from the blade root. The applied straingauges were polyurethane high fatigue encapsulated 350 Ω nominal-resistance strain gauge. The straindata is used to determine the applied BM, and also for detection of any crack propagation.
Materials 2017, 10, 1152 5 of 22
Table 1. Locations and position of strain gauges on the blade.
GaugeID
Distance fromRoot (m)
LW orWW LE or TE Edge Distance
(mm)Long. or
Trans.Internal or
External
SG1 1.0 P - - Long 0 ExtSG2 8.0 P - - Long 0 ExtSG3 16.0 P - - Long 0 ExtSG4 24.0 P - - Long 0 ExtSG5 28.0 P - - Long 0 ExtSG6 33.0 P - - Long 0 ExtSG7 43.0 P - - Long 0 ExtSG8 1.0 S - - Long 0 ExtSG9 8.0 S - - Long 0 Ext
SG10 16.0 S - - Long 0 ExtSG11 24.0 S - - Long 0 ExtSG12 28.0 S - - Long 0 ExtSG13 33.0 S - - Long 0 ExtSG14 43.0 S - - Long 0 ExtSG15 1.0 - LE 0 Long 0 ExtSG16 1.0 (p) TE 0 Long 0 ExtSG17 16.0 (p) TE 50 Long 0 ExtSG18 28.0 (p) TE 50 Long 0 ExtSG21 4.0 Shear web TE, mid +45 IntSG22 4.0 Shear web TE, mid −45SG23 8.0 Shear web TE, mid +45 IntSG24 8.0 Shear web TE, mid −45SG25 12.0 Shear web TE, mid +45 IntSG26 12.0 Shear web TE, mid −45SG27 16.0 Shear web TE, mid +45 IntSG28 16.0 Shear web TE, mid −45SG29 20.0 Shear web TE, mid +45 IntSG30 20.0 Shear web TE, mid −45
P = Pressure side, S = Suction side, LW = Leeward, WW = windward.
2.4. Accelerometers
During modal testing, five accelerometers were mounted on brackets, which are in turn werehot-glued to the blade using a two-part Araldite 2052 epoxy adhesive (Huntsman, UK). These wereused in modal tests repeated for all three states of the blade. Table 2 summarizes the accelerometerlocations along the blade.
Table 2. Accelerometers location.
Accelerometer Number Distance from Root (m)
1 92 183 274 365 45.7 (tip)
3. Testing Procedure
3.1. Calibration Pull-Test and Position of the Saddles
A calibration pull-test is required to obtain the relationship between the applied load and thebending moment at root. This relationship is used for extrapolation to find the required load to achievethe target BM.

Materials 2017, 10, 1152 6 of 22
Full-scale blade calibration pull-tests were performed for all three states of the blade. In thecalibration test, the static load was applied by attaching a cable to a hook on the saddle positionedat 35.05 m from the root and the blade was deformed upward by pulling the cable incrementally.Readings from all 30 strain gauges along the blade were recorded at each load increment up to themaximum load. Figure 3 shows the experimental set up for calibration pull-test. The maximum loadapplied was 15 kN in both the upward and downward directions to make sure the blade remains inlinear elastic region. From calibration tests the relationship between the monotonic load and strainwere obtained. Saddles were attached to the blade at positions that the required target BM distributionover the blade length can be applied during the fatigue testing. This was accomplished by attachingthe first saddle at 30.05 m and the second saddle at 35.05 m from the blade root as shown in Figure 3c.
Materials 2017, 10, 1152 6 of 22
3. Testing Procedure
3.1. Calibration Pull‐Test and Position of the Saddles
A calibration pull‐test is required to obtain the relationship between the applied load and the
bending moment at root. This relationship is used for extrapolation to find the required load to
achieve the target BM.
Full‐scale blade calibration pull‐tests were performed for all three states of the blade. In the
calibration test, the static load was applied by attaching a cable to a hook on the saddle positioned at
35.05 m from the root and the blade was deformed upward by pulling the cable incrementally.
Readings from all 30 strain gauges along the blade were recorded at each load increment up to the
maximum load. Figure 3 shows the experimental set up for calibration pull‐test. The maximum load
applied was 15 kN in both the upward and downward directions to make sure the blade remains in
linear elastic region. From calibration tests the relationship between the monotonic load and strain
were obtained. Saddles were attached to the blade at positions that the required target BM
distribution over the blade length can be applied during the fatigue testing. This was accomplished
by attaching the first saddle at 30.05 m and the second saddle at 35.05 m from the blade root as shown
in Figure 3c.
(a)
(b)
(c)
Figure 3. (a) 47.5 m blade attached to Hub Centre 1; (b) position of applied load point in calibration
test and (c) the positions of the saddles on the blade for fatigue tests.
3.2. Modal Testing
In fatigue testing, the blade is resonating by setting the frequency of mass movement on the
saddle equal to the first natural frequencies of the blade which is obtained from model testing. Modal
testing is also used for structural health monitoring (SHM) by tracking any changes in the natural
frequency of the structure caused by any damage formation. ORE Catapults standard testing
procedure PR10015 [24] for modal testing was followed to obtain the frequency response function
(FRF) in the flapwise direction. The transient force excitation of the blade was established by
impacting at rest turbine blade once by a hammer of sufficient mass and velocity. This gives the blade
an initial velocity and acceleration in the flapwise and edgewise directions. The turbine blade thus
oscillates with a superposition of its discrete eigensolutions [25]. For wind turbine blades only a
limited frequency band is of relevance—typically the frequency range between 0.5 Hz and 30 Hz [26].
For flapwise modes, the blade was manually excited at 38.5 m by hammer impact at the blade
centre point on the pitch axis and the response of the blade was recorded by accelerometers. For
edgewise modes, the blade was excited manually at the same length but impacted at the leading edge.
The acceleration response signals were measured at five cross‐sections along the pitch axis. Each cross
section was instrumented with a uniaxial accelerometers recording the accelerations in the flapwise
Figure 3. (a) 47.5 m blade attached to Hub Centre 1; (b) position of applied load point in calibrationtest and (c) the positions of the saddles on the blade for fatigue tests.
3.2. Modal Testing
In fatigue testing, the blade is resonating by setting the frequency of mass movement on thesaddle equal to the first natural frequencies of the blade which is obtained from model testing.Modal testing is also used for structural health monitoring (SHM) by tracking any changes in thenatural frequency of the structure caused by any damage formation. ORE Catapults standard testingprocedure PR10015 [24] for modal testing was followed to obtain the frequency response function (FRF)in the flapwise direction. The transient force excitation of the blade was established by impacting at restturbine blade once by a hammer of sufficient mass and velocity. This gives the blade an initial velocityand acceleration in the flapwise and edgewise directions. The turbine blade thus oscillates with asuperposition of its discrete eigensolutions [25]. For wind turbine blades only a limited frequencyband is of relevance—typically the frequency range between 0.5 Hz and 30 Hz [26].
For flapwise modes, the blade was manually excited at 38.5 m by hammer impact at theblade centre point on the pitch axis and the response of the blade was recorded by accelerometers.For edgewise modes, the blade was excited manually at the same length but impacted at the leadingedge. The acceleration response signals were measured at five cross-sections along the pitch axis.Each cross section was instrumented with a uniaxial accelerometers recording the accelerations inthe flapwise direction, and they were rotated for recording the acceleration in the edgewise direction.From hammer testing the first two modes of as received blade and cracked blade were determined.

Materials 2017, 10, 1152 7 of 22
3.3. Fatigue Testing
The 47.5 m blade was attached to Hub Centre 1, 3.75 m above the floor, with the distance fromfloor to roof of 25 m as shown in Figure 3a. The maximum individual force which can be applied is600 kN, with maximum strain of 10,000 µε.
The excitation device drives the saddle with a sinusoidal motion, and a closed loop control systemcontrols the frequency and amplitude of this motion so that the strain amplitude on a selected straingauge is maintained at the target level required in the test specification. The saddle is designed in sucha way that it will be as close to the blade neutral axis as possible. Excitation devices are attached oneach side of the metal case of the saddle at the Leading Edge (LE) and the Trailing Edge (TE) to excitethe blade for the fatigue testing.
The target BM is the magnitude of the BM that the blade will experience in the service life.The position, magnitude of dynamic mass and amplitude of the saddles is determined to achieve theintended target BM. In the fatigue tests of as received blade, a dynamic mass of 150 kg on each side ofthe saddle at 30.05 m and a dynamic mass of 75 kg on each side of saddle at 35.05 m were required toproduce 50% of the estimated target BM. These masses were also added to the blade during modaltesting to find the natural frequencies of the blade. When the crack was extended to 1000 mm at 70%of the blade estimated target BM, the saddle resonance amplitude limit was reached. Extra masseswere added to the saddles to reduce the resonance amplitude while the strain value kept unchanged.
4. Test Results
4.1. Calibration Pull-Test on as Received Blade
The strains on pressure and suction side along the blade at different applied loads at 35.05 m wererecorded during the calibration pull-test. The variation of the root BM with strain was calculated asshown in Figure 4. The required strain for attaining the estimated target BM in the fatigue test canbe found from extrapolating the results in Figure 4. Usually the target BM should be matched butdue to existing damage in the blade the maximum estimated target BM for the first two states of theblade was limited to 50% of estimated target BM. This was done to make sure the crack propagationtests could be completed without causing early stage failure of the blade. Monitoring of fatigue testswas done by controlling SG2 strain gauge readings of 1478 µε at 2500 kNm BM at the root, which isequivalent to 50% of target BM.
Figure 5 shows the bending moment distribution along the blade. There are three set of data inFigure 5; target BM (solid line), pressure side (dash line) and suction side (diamond markers) BM.The applied BM on the blade was obtained by extrapolating the calibration test results. As explainedbefore, the maximum target BM is set at 50% of expected BM in service. Therefore, the results forpressure and suction bending moments are at 2500 kNm at the root which is equivalent to 50% ofestimated target BM. On the suction side the reading of strain gauge SG9 is unreliable and insteadSG10 was used for the analysis of the bending moment.

Materials 2017, 10, 1152 8 of 22
Materials 2017, 10, 1152 8 of 22
Figure 4. Variation of strains and root bending moment as % of estimated target BM along the as
received blade. Figure 4. Variation of strains and root bending moment as % of estimated target BM along the asreceived blade.

Materials 2017, 10, 1152 9 of 22Materials 2017, 10, 1152 9 of 22
Figure 5. Comparison of target and applied bending moment distribution for as received blade.
4.2. Calibration Pull‐Test on the Blade with 200 mm and 1000 mm Cracks
A 200 mm crack was created by cutting the adhesive bond between the shear web and spar cap
at 9 m from the blade root. Figure 6a shows the crack from outside and Figure 6b shows the crack
from inside of the shear web box. Four AE sensors were fitted on the shear web wall to monitor the
crack growth and to understand its behaviour during cyclic loading.
Figure 6. Creating a 200 mm crack at 9 m from the root. View from (a) outside and (b) inside of the
shear web box.
The blade structural response to crack propagation was studied further by extending manually
the 200 mm crack after calibration, modal and fatigue test to 1000 mm. The centre of de‐bonded crack
was kept unchanged at 9 m from the blade root and it was extended symmetrically from both sides
as shown in Figure 7.
0
1000
2000
3000
4000
5000
0 0.2 0.4 0.6 0.8 1
Target BM provided by customerBM on pressure sideBM on suction side
Be
nd
ing
mo
me
nt (
kNm
)
Distance along the blade (%)
SG9
Figure 5. Comparison of target and applied bending moment distribution for as received blade.
4.2. Calibration Pull-Test on the Blade with 200 mm and 1000 mm Cracks
A 200 mm crack was created by cutting the adhesive bond between the shear web and spar cap at9 m from the blade root. Figure 6a shows the crack from outside and Figure 6b shows the crack frominside of the shear web box. Four AE sensors were fitted on the shear web wall to monitor the crackgrowth and to understand its behaviour during cyclic loading.
Materials 2017, 10, 1152 9 of 22
Figure 5. Comparison of target and applied bending moment distribution for as received blade.
4.2. Calibration Pull‐Test on the Blade with 200 mm and 1000 mm Cracks
A 200 mm crack was created by cutting the adhesive bond between the shear web and spar cap
at 9 m from the blade root. Figure 6a shows the crack from outside and Figure 6b shows the crack
from inside of the shear web box. Four AE sensors were fitted on the shear web wall to monitor the
crack growth and to understand its behaviour during cyclic loading.
Figure 6. Creating a 200 mm crack at 9 m from the root. View from (a) outside and (b) inside of the
shear web box.
The blade structural response to crack propagation was studied further by extending manually
the 200 mm crack after calibration, modal and fatigue test to 1000 mm. The centre of de‐bonded crack
was kept unchanged at 9 m from the blade root and it was extended symmetrically from both sides
as shown in Figure 7.
0
1000
2000
3000
4000
5000
0 0.2 0.4 0.6 0.8 1
Target BM provided by customerBM on pressure sideBM on suction side
Be
nd
ing
mo
me
nt (
kNm
)
Distance along the blade (%)
SG9
Figure 6. Creating a 200 mm crack at 9 m from the root. View from (a) outside and (b) inside of theshear web box.
The blade structural response to crack propagation was studied further by extending manuallythe 200 mm crack after calibration, modal and fatigue test to 1000 mm. The centre of de-bonded crackwas kept unchanged at 9 m from the blade root and it was extended symmetrically from both sides asshown in Figure 7.

Materials 2017, 10, 1152 10 of 22
Materials 2017, 10, 1152 10 of 22
(a)
(b)
Figure 7. Extension of the crack to 1000 mm at 9 m from the blade root. View from (a) outside of the
shear web box; (b) from inside of the shear web box.
New calibration tests were performed to find the new bending moment distribution along the
cracked blade. Figure 8 compares the calibration pull‐test results from SG2 strain gauge reading for
as received blade, blade with 200 mm crack and extended 1000 mm crack.
The strain gauge readings in the calibration pull‐test at SG2 with debonding 200 mm of the shear
web from the spar cap were decreased by about 50% of the initial load and by about 16% of the final
load. The target strain at SG2 at the root became 1523 με at 2500 kNm which increased from 1478 με from before the insertion of 200 mm crack damage. When the crack damage extended further to 1000
mm, the SG2 strain gauge reading was decreased by 64% at the initial load while at the final load, the
SG2 reading decreased by about 20% (see Figure 8).
Figure 7. Extension of the crack to 1000 mm at 9 m from the blade root. View from (a) outside of theshear web box; (b) from inside of the shear web box.
New calibration tests were performed to find the new bending moment distribution along thecracked blade. Figure 8 compares the calibration pull-test results from SG2 strain gauge reading for asreceived blade, blade with 200 mm crack and extended 1000 mm crack.
The strain gauge readings in the calibration pull-test at SG2 with debonding 200 mm of the shearweb from the spar cap were decreased by about 50% of the initial load and by about 16% of the finalload. The target strain at SG2 at the root became 1523 µε at 2500 kNm which increased from 1478 µεfrom before the insertion of 200 mm crack damage. When the crack damage extended further to1000 mm, the SG2 strain gauge reading was decreased by 64% at the initial load while at the final load,the SG2 reading decreased by about 20% (see Figure 8).

Materials 2017, 10, 1152 11 of 22Materials 2017, 10, 1152 11 of 22
Figure 8. Comparison of strain at SG2 before and after introducing 200 mm and 1000 mm crack.
Figure 9 compares the BM at the blade root (as % of target BM) versus strain at SG2 for as
received blade, and when 200 mm and 1000 mm crack introduced to the blade. At 70% BM, SG2
reaches 2132 με for an induced crack of 200 mm while for the 1000 mm extended crack the SG2
reading is 2135 με. The slight difference could be due to a number of reasons such as added saddle
mass, movement of the saddle, ±0.5% accuracy of strain gauges, temperature, etc.
Note that in calibration pull‐test with crack of 1000 mm, the mass on either side of the saddle at
30.05 m was increased from 150 kg to 200 kg, and at 35.05 m, the mass was increased from 75 kg to
100 kg, to become similar to the fatigue test set up.
Figure 9. Comparison of bending moment from SG2 reading for three cases of the blade.
Figure 10 compares the BM distribution along the blade for all three calibrations pull‐test when
the maximum BM at the root is set equal to 50% of the maximum target BM at the root. The result for
the pressure side BM is lower than the suction side. When comparing the results of the 1000 mm
0
50
100
150
200
250
300
350
400
0 4 8 12 16
As receiv ed bladeblade with 200mm c rackblade with 1000mm crack
Str
ain
(
)
Applied load at 35m (kN)
500
1000
1500
2000
2500
3000
3500
4000
20 40 60 80 100 120 140
As receiv ed bladeblade with 200mm crackblade with 1000mm crack
Str
ain
()
Applied bending moment (% of target)
Figure 8. Comparison of strain at SG2 before and after introducing 200 mm and 1000 mm crack.
Figure 9 compares the BM at the blade root (as % of target BM) versus strain at SG2 for as receivedblade, and when 200 mm and 1000 mm crack introduced to the blade. At 70% BM, SG2 reaches 2132 µεfor an induced crack of 200 mm while for the 1000 mm extended crack the SG2 reading is 2135 µε.The slight difference could be due to a number of reasons such as added saddle mass, movement ofthe saddle, ±0.5% accuracy of strain gauges, temperature, etc.
Note that in calibration pull-test with crack of 1000 mm, the mass on either side of the saddle at30.05 m was increased from 150 kg to 200 kg, and at 35.05 m, the mass was increased from 75 kg to100 kg, to become similar to the fatigue test set up.
Materials 2017, 10, 1152 11 of 22
Figure 8. Comparison of strain at SG2 before and after introducing 200 mm and 1000 mm crack.
Figure 9 compares the BM at the blade root (as % of target BM) versus strain at SG2 for as
received blade, and when 200 mm and 1000 mm crack introduced to the blade. At 70% BM, SG2
reaches 2132 με for an induced crack of 200 mm while for the 1000 mm extended crack the SG2
reading is 2135 με. The slight difference could be due to a number of reasons such as added saddle
mass, movement of the saddle, ±0.5% accuracy of strain gauges, temperature, etc.
Note that in calibration pull‐test with crack of 1000 mm, the mass on either side of the saddle at
30.05 m was increased from 150 kg to 200 kg, and at 35.05 m, the mass was increased from 75 kg to
100 kg, to become similar to the fatigue test set up.
Figure 9. Comparison of bending moment from SG2 reading for three cases of the blade.
Figure 10 compares the BM distribution along the blade for all three calibrations pull‐test when
the maximum BM at the root is set equal to 50% of the maximum target BM at the root. The result for
the pressure side BM is lower than the suction side. When comparing the results of the 1000 mm
0
50
100
150
200
250
300
350
400
0 4 8 12 16
As receiv ed bladeblade with 200mm c rackblade with 1000mm crack
Str
ain
(
)
Applied load at 35m (kN)
500
1000
1500
2000
2500
3000
3500
4000
20 40 60 80 100 120 140
As receiv ed bladeblade with 200mm crackblade with 1000mm crack
Str
ain
()
Applied bending moment (% of target)
Figure 9. Comparison of bending moment from SG2 reading for three cases of the blade.
Figure 10 compares the BM distribution along the blade for all three calibrations pull-test whenthe maximum BM at the root is set equal to 50% of the maximum target BM at the root. The resultfor the pressure side BM is lower than the suction side. When comparing the results of the 1000 mm

Materials 2017, 10, 1152 12 of 22
cracked blade at 10% of the blade length, the strain gauge reading decreased by 13.1% in comparisonwith the 200 mm crack damage.
Materials 2017, 10, 1152 12 of 22
cracked blade at 10% of the blade length, the strain gauge reading decreased by 13.1% in comparison
with the 200 mm crack damage.
Figure 10. Comparison of target and measured BM distribution with crack.
4.3. Modal Test on the Blade
4.3.1. Modal Test on as Received Blade
The results of modal test for the as received blade are shown in Figure 11a where the blue line is
the result of flapwise direction, and green line is the result of edgewise direction.
Figure 11b shows a magnified area of Figure 11a between 0 Hz and 2 Hz to quantify accurately
the results for the first natural frequency. The first natural frequency for flapwise (blue line) and
edgewise (green line) were 0.713 Hz and 1.398 Hz, respectively.
Figure 11c shows a magnified area of Figure 11a between 1.5 Hz and 5 Hz where the second
mode shape occurs. The second natural frequencies for flapwise and edgewise were at 2.1 Hz and
4.66 Hz, respectively. The modal test of as received blade with saddles attached at 30.05 m and 35.05
m were also carried out and the first natural frequency was at 0.562 Hz for flapwise mode, a reduction
of about 21.2% from 0.713 Hz.
(a)
0
1000
2000
3000
4000
5000
0 0.2 0.4 0.6 0.8 1
Target BM s hould provided by customerSuction side BM for as received bladePressure side BM for as received b ladeSuction side BM for 200 mm cracked bladePressure side BM for 200 mm cracked bladeSuction side BM for 1000 mm cracked bladePressure side BM for 1000 mm cracked blade
Be
nd
ing
mo
me
nt (
kNm
)
Distance along the blade (%)
Frequency - Hz
Lo
g g
pk
0 12.5105100n
1
100m
10m
1m
100µ
10µ
1µ
Pr375.45600.x Pr375.45600.y
XAxis:YAxis:
X0.000012.500
Hzg pk
Y:1962.21µ64.034µ
Y:2316.90µ9.7220µ
1
2
Figure 10. Comparison of target and measured BM distribution with crack.
4.3. Modal Test on the Blade
4.3.1. Modal Test on as Received Blade
The results of modal test for the as received blade are shown in Figure 11a where the blue line isthe result of flapwise direction, and green line is the result of edgewise direction.
Figure 11b shows a magnified area of Figure 11a between 0 Hz and 2 Hz to quantify accurately theresults for the first natural frequency. The first natural frequency for flapwise (blue line) and edgewise(green line) were 0.713 Hz and 1.398 Hz, respectively.
Figure 11c shows a magnified area of Figure 11a between 1.5 Hz and 5 Hz where the second modeshape occurs. The second natural frequencies for flapwise and edgewise were at 2.1 Hz and 4.66 Hz,respectively. The modal test of as received blade with saddles attached at 30.05 m and 35.05 m werealso carried out and the first natural frequency was at 0.562 Hz for flapwise mode, a reduction of about21.2% from 0.713 Hz.
Materials 2017, 10, 1152 12 of 22
cracked blade at 10% of the blade length, the strain gauge reading decreased by 13.1% in comparison
with the 200 mm crack damage.
Figure 10. Comparison of target and measured BM distribution with crack.
4.3. Modal Test on the Blade
4.3.1. Modal Test on as Received Blade
The results of modal test for the as received blade are shown in Figure 11a where the blue line is
the result of flapwise direction, and green line is the result of edgewise direction.
Figure 11b shows a magnified area of Figure 11a between 0 Hz and 2 Hz to quantify accurately
the results for the first natural frequency. The first natural frequency for flapwise (blue line) and
edgewise (green line) were 0.713 Hz and 1.398 Hz, respectively.
Figure 11c shows a magnified area of Figure 11a between 1.5 Hz and 5 Hz where the second
mode shape occurs. The second natural frequencies for flapwise and edgewise were at 2.1 Hz and
4.66 Hz, respectively. The modal test of as received blade with saddles attached at 30.05 m and 35.05
m were also carried out and the first natural frequency was at 0.562 Hz for flapwise mode, a reduction
of about 21.2% from 0.713 Hz.
(a)
0
1000
2000
3000
4000
5000
0 0.2 0.4 0.6 0.8 1
Target BM s hould provided by customerSuction side BM for as received bladePressure side BM for as received b ladeSuction side BM for 200 mm cracked bladePressure side BM for 200 mm cracked bladeSuction side BM for 1000 mm cracked bladePressure side BM for 1000 mm cracked blade
Be
nd
ing
mo
me
nt (
kNm
)
Distance along the blade (%)
Frequency - Hz
Lo
g g
pk
0 12.5105100n
1
100m
10m
1m
100µ
10µ
1µ
Pr375.45600.x Pr375.45600.y
XAxis:YAxis:
X0.000012.500
Hzg pk
Y:1962.21µ64.034µ
Y:2316.90µ9.7220µ
1
2
Figure 11. Cont.

Materials 2017, 10, 1152 13 of 22Materials 2017, 10, 1152 13 of 22
(b)
(c)
Figure 1. Frequency response function for as received blade without saddles in flapwise (blue line)
and edgewise (green line) directions: (a) an overview; (b) the first modes and (c) the second.
4.3.2. Modal Test on the Blade with Crack of 200 mm and 1000 mm
The modal testing for flapwise directions of blade with 200 mm and 1000 mm crack, together
with the as received blade with attached saddles has been done. No changes in the natural frequencies
were noticed and the first mode remained at 0.562 Hz.
For the blade with the 1000 mm crack, the mass on either side of the saddle at 30.05 m was
increased from 150 kg to 200 kg and at 35.05 m the mass was increased from 75 kg to 100 kg to reduce
the stroke amplitude of masses which were exceeded the limit. The resultant modal test showed a
slight shift in the first natural frequency from 0.562 Hz to 0.556 Hz which is to be expected.
In summary the first natural frequency of as received blade, the blade with 200 mm and 1000
mm crack remained at 0.562 Hz. However, the first natural frequency for the blade with 1000 mm
crack and with added mass was reduced slightly to 0.556 Hz.
5. Fatigue Tests
The blade was excited by two saddles sitting at 30.05 m and 35.05 m from the root of the blade
as shown in Figure 3. The saddles masses oscillated at just below the determined first natural
frequency of the blade to excite the blade to reach to the specific strain at a preselected strain gauge
SG2 located at 8 m from the root on pressure side in longitudinal direction.
5.1. Fatigue Test Results before Crack Insertion
The test conditions and fatigue test results for as received blade are summarised in Table 3 where
the target strain at SG2 is set at 1478 με, reaching 2500 kNm, 50% of target BM at the root as predicted
from the calibration pull‐test described in Section 4.1. After 5241 cycles a visual inspection of the
Frequency - Hz
Lo
g g
pk
0 21.51500m1µ
1
100m
10m
1m
100µ
10µ
Pr375.45600.x Pr375.45600.y
XAxis:YAxis:
X713.66m
1.3984
Hzg pk
Y:1341.43m3.5488m
Y:296.301µ
248.30m
1
2
Frequency - Hz
Lo
g g
pk
1.5 54321µ
100m
10m
1m
100µ
10µ
Pr375.45600.x Pr375.45600.y
XAxis:YAxis:
X2.11044.6640
Hzg pk
Y:110.702m539.65µ
Y:216.891µ
4.5135m
1
2
Figure 11. Frequency response function for as received blade without saddles in flapwise (blue line)and edgewise (green line) directions: (a) an overview; (b) the first modes and (c) the second.
4.3.2. Modal Test on the Blade with Crack of 200 mm and 1000 mm
The modal testing for flapwise directions of blade with 200 mm and 1000 mm crack, together withthe as received blade with attached saddles has been done. No changes in the natural frequencies werenoticed and the first mode remained at 0.562 Hz.
For the blade with the 1000 mm crack, the mass on either side of the saddle at 30.05 m wasincreased from 150 kg to 200 kg and at 35.05 m the mass was increased from 75 kg to 100 kg to reducethe stroke amplitude of masses which were exceeded the limit. The resultant modal test showed aslight shift in the first natural frequency from 0.562 Hz to 0.556 Hz which is to be expected.
In summary the first natural frequency of as received blade, the blade with 200 mm and 1000 mmcrack remained at 0.562 Hz. However, the first natural frequency for the blade with 1000 mm crackand with added mass was reduced slightly to 0.556 Hz.
5. Fatigue Tests
The blade was excited by two saddles sitting at 30.05 m and 35.05 m from the root of the blade asshown in Figure 3. The saddles masses oscillated at just below the determined first natural frequencyof the blade to excite the blade to reach to the specific strain at a preselected strain gauge SG2 locatedat 8 m from the root on pressure side in longitudinal direction.
5.1. Fatigue Test Results before Crack Insertion
The test conditions and fatigue test results for as received blade are summarised in Table 3 wherethe target strain at SG2 is set at 1478 µε, reaching 2500 kNm, 50% of target BM at the root as predicted

Materials 2017, 10, 1152 14 of 22
from the calibration pull-test described in Section 4.1. After 5241 cycles a visual inspection of the bladewas performed and three new cracks were detected. The first cracks appeared at 34 m in the TE wherea 450 mm adhesive joint failure occurred. The second crack of a length of 300 mm occurred at theadhesive joint in the TE at 31 m from the root. The third crack formed at the adhesive joint in the LE at28.36 m.
Table 3. Fatigue test results for the as received blade.
% of BMNominal
Value
Cycles±200
CumulativeCycles
Strain atSG2 (µε)±0.5%
Frequency(Hz)
CrackDistance from
Root (m)
CrackLength(mm)
LocationAmplitude of
ResonanceMass (mm)
25 2217 2217 740 0.43 - - - 77
50 3024 5241 1478 0.5628.36 640 LE
15431 300 TE34 450 TE
50 12,096 17,337 1478 0.56 - - - 15450 14,112 31,449 1478 0.56 - - - 15450 14,112 45,561 1478 0.56 - - - 15450 13,104 58,665 1478 0.56 - - - 15450 6552 65,217 1478 0.56 - - - 154
In the test, the acoustic emission (AE) sensors recognised damage around the same regions asthey were found by visual inspection. After 58,665 cycles the blade has been inspected visually andno new crack was found, nor did the existing crack propagate. The fatigue test on as received bladewas stopped after 65,217 cycles and at the end of the test, the original cracks had not propagatedfurther. It is likely that an edgewise test rather than a flapwise test would have been more effective atgrowing the crack because the spar cap adhesive bond would experience greater shear stresses duringan edgewise test.
The strains at the first cycle along the as received blade from 30 strain gauges are shown inFigure 12a. The highest strains are experienced between 35% and 65% of the blade length from theblade root.
Strain gauge results on the skin of the pressure and suction sides at the first cycle are shown inFigure 12(b), where the strain along the blade varies between 236 µε and 1891 µε. The highest strainon shell skin is at 52% of the overall length. The results are almost identical on the pressure side andsuction side, apart at the 17% blade location where the pressure side shows a reading of 423 µεmorethan the suction side. This indicated that the strain gauge SG9 on the pressure side was faulty andtherefore its reading was discarded.
Strain gauges SG21 to SG30 are attached to the shear web on TE side at ±45 and located from4 m to 20 m from the root. The readings from these gauges at the first cycle are shown in Figure 12c.The strain along the first half of the blade length from the root varies between 24.5 µε and 378 µε.In flapwise fatigue, the maximum strain readings in the shear web occurred at SG23 and SG24 attachedto the shear web, located at 17.5% of the blade length from the root.

Materials 2017, 10, 1152 15 of 22Materials 2017, 10, 1152 15 of 22
Figure 12. Strains along the as received blade at the first cycle of fatigue test: (a) all 30 strain gauges;
(b) only for gauges on pressure and suction side and (c) only for gauges on the shear web on TE side.
5.2. Fatigue Test Results for Blade with 200 mm Crack
The test conditions and results for the blade with a 200 mm crack are shown in A pre‐existing
crack at around 32.96 m had extended by 190 mm in the middle of the blade as shown in Figure 13a
with the overview image of the two cracks found. Figure 13b shows a close inspection of the new
cracks found at about 32.83 m from the blade root which propagated for 110 mm and 40 mm on the
middle cross section at this point. The next visual inspection was carried out after 39,934 cycles, where
the applied BM value had been increased to 70% of the maximum target BM. The visual inspection
showed an existing crack at about 32.96 m propagated 15 mm along the blade longitudinal direction
at the TE midpoint. Finally, a visual inspection was made after 62,110 cycles and no further crack
formation or propagation was observed and the induced crack stayed unchanged at its original
length.
Table 4. Initially, a 2500 kNm bending moment at the root was applied which resulted in 1523
με at SG2. The strain at this location had increased from 1478 με before the insertion of crack, showing
a 3% increase. A visual inspection was performed after 8063 cycles to check if any existing cracks had
propagated or new ones formed. No changes to the existing cracks or to the 200 mm crack at 9 m
distance were observed. Later on the visual inspection was repeated after 26,851 cycles. A pre‐existing
crack at around 32.96 m had extended by 190 mm in the middle of the blade as shown in Figure 13a
with the overview image of the two cracks found. Figure 13b shows a close inspection of the new
cracks found at about 32.83 m from the blade root which propagated for 110 mm and 40 mm on the
middle cross section at this point. The next visual inspection was carried out after 39,934 cycles, where
the applied BM value had been increased to 70% of the maximum target BM. The visual inspection
0
500
1000
1500
2000
0 0.2 0.4 0.6 0.8 1
Str
ain
(
)
Normalised blade position
(a)
0
500
1000
1500
2000
0 0.2 0.4 0.6 0.8 1
Pressure sideSuction s ide
Str
ain
(
)
Normalised blade position
SG9
(b)
0
100
200
300
400
500
0 0.1 0.2 0.3 0.4 0.5
Str
ain
()
Normalised blade position
Shear web TE side(c)
Figure 12. Strains along the as received blade at the first cycle of fatigue test: (a) all 30 strain gauges;(b) only for gauges on pressure and suction side and (c) only for gauges on the shear web on TE side.
5.2. Fatigue Test Results for Blade with 200 mm Crack
The test conditions and results for the blade with a 200 mm crack are shown in A pre-existingcrack at around 32.96 m had extended by 190 mm in the middle of the blade as shown in Figure 13awith the overview image of the two cracks found. Figure 13b shows a close inspection of the newcracks found at about 32.83 m from the blade root which propagated for 110 mm and 40 mm on themiddle cross section at this point. The next visual inspection was carried out after 39,934 cycles, wherethe applied BM value had been increased to 70% of the maximum target BM. The visual inspectionshowed an existing crack at about 32.96 m propagated 15 mm along the blade longitudinal directionat the TE midpoint. Finally, a visual inspection was made after 62,110 cycles and no further crackformation or propagation was observed and the induced crack stayed unchanged at its original length.
Table 4. Initially, a 2500 kNm bending moment at the root was applied which resulted in 1523 µεat SG2. The strain at this location had increased from 1478 µε before the insertion of crack, showing a3% increase. A visual inspection was performed after 8063 cycles to check if any existing cracks hadpropagated or new ones formed. No changes to the existing cracks or to the 200 mm crack at 9 mdistance were observed. Later on the visual inspection was repeated after 26,851 cycles. A pre-existingcrack at around 32.96 m had extended by 190 mm in the middle of the blade as shown in Figure 13awith the overview image of the two cracks found. Figure 13b shows a close inspection of the newcracks found at about 32.83 m from the blade root which propagated for 110 mm and 40 mm on themiddle cross section at this point. The next visual inspection was carried out after 39,934 cycles, wherethe applied BM value had been increased to 70% of the maximum target BM. The visual inspectionshowed an existing crack at about 32.96 m propagated 15 mm along the blade longitudinal direction

Materials 2017, 10, 1152 16 of 22
at the TE midpoint. Finally, a visual inspection was made after 62,110 cycles and no further crackformation or propagation was observed and the induced crack stayed unchanged at its original length.
Table 4. Fatigue test condition and results for the blade with a 200 mm crack.
% of BMNominal
Value
Cycles±200
CumulativeCycles
Strain atSG2 (µε)±0.5%
Frequency(Hz)
CrackDistance from
Root (m)
CrackLength(mm)
LocationAmplitude of
ResonanceMass (mm)
50 2923 2923 1523 0.56 - - - 15850 5140 8063 1523 0.56 - - - 15847 10,281 18,344 1478 0.56 - - - 154
50 8507 26,851 1523 0.56≈32.96 190 TE-Mid
158≈32.83 110 TE-Mid≈32.83 40 TE-Mid
50 806 27,657 1523 0.56 - - - 15870 12,277 39,934 2132 0.56 ≈32.96 15 TE-Mid 26070 12,096 52,030 2132 0.56 - - - 26070 10,080 62,110 2132 0.56 - - - 260
Materials 2017, 10, 1152 16 of 22
showed an existing crack at about 32.96 m propagated 15 mm along the blade longitudinal direction
at the TE midpoint. Finally, a visual inspection was made after 62,110 cycles and no further crack
formation or propagation was observed and the induced crack stayed unchanged at its original
length.
Table 4. Fatigue test condition and results for the blade with a 200 mm crack.
% of BM
Nominal
Value
Cycles
±200
Cumulative
Cycles
Strain
at SG2
(με)
±0.5%
Frequency
(Hz)
Crack
Distance
from
Root (m)
Crack
Length
(mm)
Location
Amplitude
of
Resonance
Mass (mm)
50 2923 2923 1523 0.56 ‐ ‐ ‐ 158
50 5140 8063 1523 0.56 ‐ ‐ ‐ 158
47 10,281 18,344 1478 0.56 ‐ ‐ ‐ 154
50 8507 26,851 1523 0.56
≈32.96 190 TE‐Mid
158 ≈32.83 110 TE‐Mid
≈32.83 40 TE‐Mid
50 806 27,657 1523 0.56 ‐ ‐ ‐ 158
70 12,277 39,934 2132 0.56 ≈32.96 15 TE‐Mid 260
70 12,096 52,030 2132 0.56 ‐ ‐ ‐ 260
70 10,080 62,110 2132 0.56 ‐ ‐ ‐ 260
(a) (b)
Figure 13. (a) Propagation of existing crack at 32.96 m after 26,851 cyclic loading; (b) Formation of
hair line cracks at 32.8 m after 26,851 cyclic loading.
5.3. Fatigue Test Results for Blade after Extending the Crack to 1000 mm
The test conditions and results for the blade after extending the inserted crack to 1000 mm are
shown in Table 5. Initially 3500 kNm bending moment equivalent to 70% of target BM were applied
at the root which resulted in 2135 με at SG2. The strain at this location remained nearly unchanged
close to 2132 με before the crack extended from 200 mm to 1000 mm. Visual inspections of the blade
were performed after 3967; 16,781 and 18,764 cycles to check the state of the cracks in the blade. No
changes to the existing cracks or to the induced crack at 9 m were detected.
The load was then increased to 90%, 100%, 105% and 110% of the blades estimated target BM
value. For these tests the blade first mode natural frequency was obtained using ORE software rather
than doing modal tests to save time.
As mentioned earlier, for this state of the blade mass has been added to the saddles to reduce
the saddle stroke amplitude. The mass on the saddle at 30.05 m was increased from 150 kg to 200 kg
and at 35.05 m was increased from 75 kg to 100 kg on both sides of the saddle, to achieve 70% of the
nominal target BM. At 90% of the nominal BM loading, the mass at 30.05 m was increased to 325 kg
and at 35.05 m increased to 150 kg on both sides of the saddle. Finally, at 100% and 110% of the
Figure 13. (a) Propagation of existing crack at 32.96 m after 26,851 cyclic loading; (b) Formation of hairline cracks at 32.8 m after 26,851 cyclic loading.
5.3. Fatigue Test Results for Blade after Extending the Crack to 1000 mm
The test conditions and results for the blade after extending the inserted crack to 1000 mm areshown in Table 5. Initially 3500 kNm bending moment equivalent to 70% of target BM were applied atthe root which resulted in 2135 µε at SG2. The strain at this location remained nearly unchanged closeto 2132 µε before the crack extended from 200 mm to 1000 mm. Visual inspections of the blade wereperformed after 3967; 16,781 and 18,764 cycles to check the state of the cracks in the blade. No changesto the existing cracks or to the induced crack at 9 m were detected.
The load was then increased to 90%, 100%, 105% and 110% of the blades estimated target BMvalue. For these tests the blade first mode natural frequency was obtained using ORE software ratherthan doing modal tests to save time.
As mentioned earlier, for this state of the blade mass has been added to the saddles to reduce thesaddle stroke amplitude. The mass on the saddle at 30.05 m was increased from 150 kg to 200 kg and at35.05 m was increased from 75 kg to 100 kg on both sides of the saddle, to achieve 70% of the nominaltarget BM. At 90% of the nominal BM loading, the mass at 30.05 m was increased to 325 kg and at35.05 m increased to 150 kg on both sides of the saddle. Finally, at 100% and 110% of the nominal BMloading, the mass at 30.05 m was increased to 400 kg and at 35.05 m increased to 200 kg on both sidesof the saddle.

Materials 2017, 10, 1152 17 of 22
Table 5. Fatigue test results for blade with extended crack to 1000 mm.
% of bmNominal
Value
Cycles±200
CumulativeCycles
Strain atSG2 (µε)±0.5%
Frequency(Hz)
CrackDistance from
Root (m)
CrackLength(mm)
LocationAmplitude of
ResonanceMass (mm)
70 3967 3967 2130 0.551 - - - 21970 12,814 16,781 2135 0.551 - - - 21970 1983 18,764 2135 0.551 - - - 21990 5970 24,734 2737 0.535 - - - 23490 4603 29,337 2737 0.535 - - - 234
100 4451 33,788 3040 0.524 - - - 230105 94 33,882 3211 0.524 - - - 250
100 894 34,776 3040 0.4978.5 35.83 IW *,
OW1749.2 - IW
9.5 - IW, OW
100 12,430 47,206 3040 0.4979.5 DD ** IW, OW
1749.1 DD IW8.5 DD IW, OW
105 357 47,563 3201 0.497 - DD - 220 at 30.05 m165 at 35.05 m
110 9199 56,762 3380 49628.5 DD IW, OW 220 at 30.05 m9.5 DD IW, OW 165 at 35.05 m
* IW = Inside the web, OW = Outside the web, ** DD = Detailed discussion in the report.
A visual inspection of the blade after 34,776 cycles showed a number of cracks was formed aroundthe 1000 mm extended crack. Inside the web box at 8.5 m from the root, two delaminated areas each at10 mm in width were detected. The delamination connected to the web had a delamination lengthof 83 mm and the delamination furthest away from the web had a length of 35 mm as shown inFigure 14a. At 8.5 m, the induced crack through the adhesive joint had propagated from its corner andextended through the plies causing delamination on the web lip, indicating that the crack plane hasbeen deviated from its original path; see Figure 14b. At 9.5 m from the blade root delamination hadoccurred at the corner of the 1000 mm crack as shown in Figure 14c. Figure 14d shows delamination at9.1 m at the location of the corner of the 200 mm crack. The fact that the crack bridged across from theunreinforced adhesive to shear web laminate is interesting, and is probably a result of the complexmode II loading that would be induced by a flapwise test in this region. It is also possible that whencutting the crack the blade had travelled into reinforced material as well as through the adhesive,which would make the bridging more likely to occur.
Materials 2017, 10, 1152 17 of 22
nominal BM loading, the mass at 30.05 m was increased to 400 kg and at 35.05 m increased to 200 kg
on both sides of the saddle.
Table 5. Fatigue test results for blade with extended crack to 1000 mm.
% of bm
Nominal
Value
Cycles
±200
Cumulative
Cycles
Strain at
SG2
(με)
±0.5%
Frequency
(Hz)
Crack
Distance
from Root
(m)
Crack
Length
(mm)
Location
Amplitude of
Resonance
Mass (mm)
70 3967 3967 2130 0.551 ‐ ‐ ‐ 219
70 12,814 16,781 2135 0.551 ‐ ‐ ‐ 219
70 1983 18,764 2135 0.551 ‐ ‐ ‐ 219
90 5970 24,734 2737 0.535 ‐ ‐ ‐ 234
90 4603 29,337 2737 0.535 ‐ ‐ ‐ 234
100 4451 33,788 3040 0.524 ‐ ‐ ‐ 230
105 94 33,882 3211 0.524 ‐ ‐ ‐ 250
100 894 34,776 3040 0.497
8.5 35.83 IW *,
OW 174 9.2 ‐ IW
9.5 ‐ IW, OW
100 12,430 47,206 3040 0.497
9.5 DD ** IW, OW
174 9.1 DD IW
8.5 DD IW, OW
105 357 47,563 3201 0.497 ‐ DD ‐ 220 at 30.05 m
165 at 35.05 m
110 9199 56,762 3380 4962 8.5 DD IW, OW 220 at 30.05 m
9.5 DD IW, OW 165 at 35.05 m
* IW = Inside the web, OW = Outside the web, ** DD = Detailed discussion in the report.
A visual inspection of the blade after 34,776 cycles showed a number of cracks was formed
around the 1000 mm extended crack. Inside the web box at 8.5 m from the root, two delaminated
areas each at 10 mm in width were detected. The delamination connected to the web had a
delamination length of 83 mm and the delamination furthest away from the web had a length of 35
mm as shown in Figure 14a. At 8.5 m, the induced crack through the adhesive joint had propagated
from its corner and extended through the plies causing delamination on the web lip, indicating that
the crack plane has been deviated from its original path; see Figure 14b. At 9.5 m from the blade root
delamination had occurred at the corner of the 1000 mm crack as shown in Figure 14c. Figure 14d
shows delamination at 9.1 m at the location of the corner of the 200 mm crack. The fact that the crack
bridged across from the unreinforced adhesive to shear web laminate is interesting, and is probably
a result of the complex mode II loading that would be induced by a flapwise test in this region. It is
also possible that when cutting the crack the blade had travelled into reinforced material as well as
through the adhesive, which would make the bridging more likely to occur.
Figure 14. Cont.

Materials 2017, 10, 1152 18 of 22
Materials 2017, 10, 1152 18 of 22
(c) (d)
Figure 14. Damaged areas around the root: (a) delamination at 8.5 m (b) adhesive joint failure at 8.5
m; (c) delamination inside the web box at 9.5 m and (d) delamination inside the web box at 9.1 m.
The adhesive joint had debonded outside the web box at 8.5 m as shown in Figure 15a indicating
that the crack had propagated all the way through the web. At 9.5 m the blade experienced multiple
local buckling under compression, and debonding in the sandwich propagated into the web, as
shown in Figure 15b.
(a) (b)
Figure 15. (a) Adhesive debonding outside the web box at 8.5 m; (b) local buckling under compression
and sandwich debonding outside the web box at 9.5 m.
A visual inspection of the blade after 47,206 cycles showed a number of further damages around
the 1000 mm extended crack. At 8.5 m inside the web box, there were two areas of delamination each
10 mm in width. The delamination connected to the web, where the delamination length had
extended by 25 mm. At 8.9 m inside the web box, delamination had occurred at the corner of the
original 200 mm induced crack. Inside the web box at 9.5 m, delamination had extended from the
corner of the 1000 crack to the lip of the web.
Figure 16a shows outside the web box at 9.5 m with an overview of the damaged areas. The
blade experienced multiple local buckling under compression, and sandwich debonding going into
the web. Figure 16b is the magnified view of the damaged area at 9.5 m and Figure 16c shows the
magnified view of the damaged area at 9.3 m. The crack had also propagated 100 mm in the adhesive
joint at 8.5 m.
Figure 14. Damaged areas around the root: (a) delamination at 8.5 m (b) adhesive joint failure at 8.5 m;(c) delamination inside the web box at 9.5 m and (d) delamination inside the web box at 9.1 m.
The adhesive joint had debonded outside the web box at 8.5 m as shown in Figure 15a indicatingthat the crack had propagated all the way through the web. At 9.5 m the blade experienced multiplelocal buckling under compression, and debonding in the sandwich propagated into the web, as shownin Figure 15b.
Materials 2017, 10, 1152 18 of 22
(c) (d)
Figure 14. Damaged areas around the root: (a) delamination at 8.5 m (b) adhesive joint failure at 8.5
m; (c) delamination inside the web box at 9.5 m and (d) delamination inside the web box at 9.1 m.
The adhesive joint had debonded outside the web box at 8.5 m as shown in Figure 15a indicating
that the crack had propagated all the way through the web. At 9.5 m the blade experienced multiple
local buckling under compression, and debonding in the sandwich propagated into the web, as
shown in Figure 15b.
(a) (b)
Figure 15. (a) Adhesive debonding outside the web box at 8.5 m; (b) local buckling under compression
and sandwich debonding outside the web box at 9.5 m.
A visual inspection of the blade after 47,206 cycles showed a number of further damages around
the 1000 mm extended crack. At 8.5 m inside the web box, there were two areas of delamination each
10 mm in width. The delamination connected to the web, where the delamination length had
extended by 25 mm. At 8.9 m inside the web box, delamination had occurred at the corner of the
original 200 mm induced crack. Inside the web box at 9.5 m, delamination had extended from the
corner of the 1000 crack to the lip of the web.
Figure 16a shows outside the web box at 9.5 m with an overview of the damaged areas. The
blade experienced multiple local buckling under compression, and sandwich debonding going into
the web. Figure 16b is the magnified view of the damaged area at 9.5 m and Figure 16c shows the
magnified view of the damaged area at 9.3 m. The crack had also propagated 100 mm in the adhesive
joint at 8.5 m.
Figure 15. (a) Adhesive debonding outside the web box at 8.5 m; (b) local buckling under compressionand sandwich debonding outside the web box at 9.5 m.
A visual inspection of the blade after 47,206 cycles showed a number of further damages aroundthe 1000 mm extended crack. At 8.5 m inside the web box, there were two areas of delaminationeach 10 mm in width. The delamination connected to the web, where the delamination length hadextended by 25 mm. At 8.9 m inside the web box, delamination had occurred at the corner of theoriginal 200 mm induced crack. Inside the web box at 9.5 m, delamination had extended from thecorner of the 1000 crack to the lip of the web.
Figure 16a shows outside the web box at 9.5 m with an overview of the damaged areas. The bladeexperienced multiple local buckling under compression, and sandwich debonding going into the web.Figure 16b is the magnified view of the damaged area at 9.5 m and Figure 16c shows the magnifiedview of the damaged area at 9.3 m. The crack had also propagated 100 mm in the adhesive joint at8.5 m.

Materials 2017, 10, 1152 19 of 22
Materials 2017, 10, 1152 19 of 22
Figure 16. Outside web at 9.5 m (a) overview of local buckling under compression and sandwich
debonding (b) magnified view of damage at 9.5 m (c) magnified view of damage at 9.3 m.
A visual inspection of the blade after 56,762 cycles showed that many of the cracks had extended
along the web within the 1000 mm crack area as illustrated in Figure 17. At 9.5 m inside the web some
delamination had also begun to occur.
Figure 17. Crack propagation within the web; (a) adhesive joint failure outside the web; (b,c) local
buckling under compression outside the web; (d) delamination inside the web.
The variation of SG2 strain versus number of cycles and percentage of applied BM experienced
by the blade at all stages of the fatigue testing for three states of the blade are shown in Figure 18. The
figure shows that no nonlinearity occurred during the entire testing cycles, and that the various
damages created during the fatigue tests had not yet caused any noticeable deterioration to the
structural stiffness of the blade.
Figure 16. Outside web at 9.5 m (a) overview of local buckling under compression and sandwichdebonding (b) magnified view of damage at 9.5 m (c) magnified view of damage at 9.3 m.
A visual inspection of the blade after 56,762 cycles showed that many of the cracks had extendedalong the web within the 1000 mm crack area as illustrated in Figure 17. At 9.5 m inside the web somedelamination had also begun to occur.
Materials 2017, 10, 1152 19 of 22
Figure 16. Outside web at 9.5 m (a) overview of local buckling under compression and sandwich
debonding (b) magnified view of damage at 9.5 m (c) magnified view of damage at 9.3 m.
A visual inspection of the blade after 56,762 cycles showed that many of the cracks had extended
along the web within the 1000 mm crack area as illustrated in Figure 17. At 9.5 m inside the web some
delamination had also begun to occur.
Figure 17. Crack propagation within the web; (a) adhesive joint failure outside the web; (b,c) local
buckling under compression outside the web; (d) delamination inside the web.
The variation of SG2 strain versus number of cycles and percentage of applied BM experienced
by the blade at all stages of the fatigue testing for three states of the blade are shown in Figure 18. The
figure shows that no nonlinearity occurred during the entire testing cycles, and that the various
damages created during the fatigue tests had not yet caused any noticeable deterioration to the
structural stiffness of the blade.
Figure 17. Crack propagation within the web; (a) adhesive joint failure outside the web; (b,c) localbuckling under compression outside the web; (d) delamination inside the web.
The variation of SG2 strain versus number of cycles and percentage of applied BM experiencedby the blade at all stages of the fatigue testing for three states of the blade are shown in Figure 18.The figure shows that no nonlinearity occurred during the entire testing cycles, and that the variousdamages created during the fatigue tests had not yet caused any noticeable deterioration to thestructural stiffness of the blade.

Materials 2017, 10, 1152 20 of 22Materials 2017, 10, 1152 20 of 22
(a)
(b)
Figure 18. (a) SG2 reading versus number of cycles throughout fatigue testing and (b) Variation of
SG2 strain versus BM loading throughout all three stages of fatigue testing.
6. Conclusions
The blades are one of the most critical components of the wind turbine. The structural integrity
of the whole wind turbine depends on the blade, and therefore they have to be tested in order to
ensure that the blade can withstand both the ultimate loads and the fatigue loads to which the blade
will be subjected during its entire service life. Testing of the wind turbine blades in static and fatigue
loading reveal any possible weakness in the design, materials and the manufacturing processes.
Removing the weakness will save both the expensive cost of maintenance or replacement.
In this paper, all required steps for full‐scale fatigue testing of a 47.5 m blade have been
discussed. The starting point was acquiring the required information for fatigue from the calibration
pull‐tests. From this test the magnitude of strain for monitoring the target BM at the root of the blade
in fatigue testing has been identified. These tests were performed in three stages of blade: (i) as
received blade; (ii) when a 200 mm crack was introduced and (iii) when the crack extended to 1000
mm. From the calibration pull‐tests the strain‐bending moment relationship of the blade has been
identified according to the target BM which the blade expected to experience in its service life. These
data were used for monitoring the applied bending moment in the fatigue tests.
For fatigue testing the first natural frequency of the blade is required. The blade natural
frequencies over a range of frequency domain were found by modal testing using hammer impact.
The modal testing has been done in both flapwise and edgewise directions for all three states of the
Figure 18. (a) SG2 reading versus number of cycles throughout fatigue testing and (b) Variation of SG2strain versus BM loading throughout all three stages of fatigue testing.
6. Conclusions
The blades are one of the most critical components of the wind turbine. The structural integrity ofthe whole wind turbine depends on the blade, and therefore they have to be tested in order to ensurethat the blade can withstand both the ultimate loads and the fatigue loads to which the blade will besubjected during its entire service life. Testing of the wind turbine blades in static and fatigue loadingreveal any possible weakness in the design, materials and the manufacturing processes. Removing theweakness will save both the expensive cost of maintenance or replacement.
In this paper, all required steps for full-scale fatigue testing of a 47.5 m blade have been discussed.The starting point was acquiring the required information for fatigue from the calibration pull-tests.From this test the magnitude of strain for monitoring the target BM at the root of the blade in fatiguetesting has been identified. These tests were performed in three stages of blade: (i) as received blade;(ii) when a 200 mm crack was introduced and (iii) when the crack extended to 1000 mm. From thecalibration pull-tests the strain-bending moment relationship of the blade has been identified accordingto the target BM which the blade expected to experience in its service life. These data were used formonitoring the applied bending moment in the fatigue tests.
For fatigue testing the first natural frequency of the blade is required. The blade naturalfrequencies over a range of frequency domain were found by modal testing using hammer impact.

Materials 2017, 10, 1152 21 of 22
The modal testing has been done in both flapwise and edgewise directions for all three states of theblade while the masses were attached to the saddles. The measured natural frequency of the firstmode of as received blade was 0.562 Hz. This frequency has not changed when the 200 mm crackwas introduced in the blade and when the crack further extended to 1000 mm. However, the firstnatural frequency had changed slightly by 0.006 Hz for 1000 mm crack when extra mass was added tothe saddles.
Before start of calibration and fatigue testing, the blade had two areas of defects at 4% and 71%of blade length. After 184,089 cyclic loading of the blade, the areas that experienced most damageand fracture were between 62% and 74% of the blade length from the root, but no damage was foundwithin the shear web.
The sensitivity of the blade structure to damage under cyclic loading was investigated byintroducing a 200 mm crack at 9 m from the root. The crack was created by debonding the webfrom the spar cap. The crack did not propagate in fatigue loading up to 50% of the estimated target BM.When the load increased to 70% of target BM, some damages have been detected on the pressure sideof the blade. However, the 200 mm crack did not propagate under these conditions up to 62,110 cycles.
Finally, the 200 mm crack at 9 m from the root has been extended to 1000 mm. The crack beganto propagate when the applied load exceeded 100% estimated target BM. The blade experienceddelamination around the crack tip of the 1000 mm crack at the web, adhesive joint failure occurred onthe outside of the web, compression failure and sandwich debonding occurred on the inside of theweb, and delaminations were visible on the web just below the 1000 mm crack. The test was beingconducted with only flapwise loading being applied—it would have been interesting to investigatethe rate of crack propagation under edgewise loading as well.
As the blade design was not available, it was impossible to model which crack size would belikely to grow. Therefore, it is not possible to draw any conclusions about whether it is safe to continueoperating with a crack of less than 200 mm length in the spar cap—shear web bond. Also, because theloads were not at 100% until the blade had a 1000 mm crack, the load magnitude will of course havebeen a factor in the increased rate of crack propagation of the larger crack.
Acknowledgments: The authors would like to thank Offshore Renewable Energy Catapult (ORE) for providingthe blade and testing facility to conduct full scale blade testing.
Author Contributions: All authors have been collaborating with each other to obtain a high-quality researchwork. O.A., C.L., and H.H. conceived and designed the experiments; O.A. and C.L. performed the experiments;O.A., C.L. and H.H. analyzed the data; H.H., O.A., G.G., K.D. and P.G. wrote the paper.
Conflicts of Interest: The authors declare no conflict of interest.
References
1. Malhotra, P.; Hyers, R.; Manwel, J.; McGowan, J. A review and design study of blade testing systems forutility-scale wind turbines. Renew. Sustain. Energy Rev. 2012, 16, 284–292. [CrossRef]
2. Yang, B.; Sun, D. Testing, inspecting and monitoring technologies for wind turbine blades: A survey.Renew. Sustain. Energy Rev. 2013, 22, 515–526. [CrossRef]
3. Al-Khudairi, O.; Hadavinia, H.; Lewis, E.; Osborne, B.; Bryars, L.S. Building Delamination Fracture Envelopeunder Mode I/Mode II Loading for FRP Composite Materials. In Advanced Composite Materials for AutomotiveApplications: Structural Integrity and Crashworthiness; Elmarakbi, A., Ed.; Wiley: Hoboken, NJ, USA, 2014;Chapter 12; pp. 293–310.
4. Cadavid, M.O.; Al-Khudairi, O.; Hadavinia, H.; Goodwin, D.; Liaghat, G.H. Experimental studies of stiffnessdegradation and dissipated energy in glass fibre reinforced polymer composite under fatigue loading.Polym. Polym. Compos. 2017, 25, 435–446.
5. Al-Khudairi, O.; Hadavinia, H.; Waggott, A.; Lewis, E.; Little, C. Characterising mode I/mode II fatiguedelamination growth in unidirectional fibre reinforced polymer laminates. Mater. Des. 2015, 66, 93–102.[CrossRef]
Materials 2017, 10, 1152 22 of 22
6. IEC 61400-23:2014: Wind Turbines—Part 23: Full-Scale Structural Testing of Rotor Blades; InternationalElectrotechnical Commission: Geneva, Switzerland, 2014.
7. IEC TS 61400-23:2001: Wind Turbine Generator Systems—Part 23: Full-Scale Structural Testing of Rotor Blades;International Electrotechnical Commission: Geneva, Switzerland, 2001.
8. Vertias, D.N. Standard DNV-DS-J102: Design and Manufacture of Wind Turbine Blades, Offshore andOnshore Wind Turbines. Available online: http://rules.dnvgl.com/docs/pdf/DNV/codes/docs/2010-11/DS-J102.pdf (accessed on 30 September 2017).
9. BS EN 61400-1:2005+A1:2010: Wind Turbines—Design Requirements; British Standards Institution: London,UK, 2006.
10. Rules and Guidelines IV Industrial Services 1 Guideline for the Certification of Wind Turbines; Germanischer Lloyd:Hamburg, Germany, 2010.
11. Rules and Guidelines IV Industrial Services 2 Guideline for the Certification of Offshore Wind Turbines; GermanischerLloyd: Hamburg, Germany, 2005.
12. Yang, J.; Peng, C.; Xiao, J.; Zeng, J.; Xing, S.; Jin, J.; Deng, H. Structural investigation of composite windturbine blade considering structural collapse in full-scale static tests. Compos. Struct. 2013, 97, 15–29.[CrossRef]
13. Kühlmeier, L. Buckling of Wind Turbine Rotor Blades. Analysis, Design and Experimental Validation.Ph.D. Thesis, Aalborg University, Aalborg, Denmark, 2007.
14. Lee, H.G.; Park, J. Static test until structural collapse after fatigue testing of a full-scale wind turbine blade.Compos. Struct. 2016, 136, 251–257. [CrossRef]
15. Jensen, F.M.; Falzon, B.G.; Ankersen, J.; Stang, H. Structural testing and numerical simulation of 34 mcomposite wind turbine blade. Compos. Struct. 2006, 76, 52–61. [CrossRef]
16. Cox, K.A. Echtermeyer, Effects of composite fiber orientation on wind turbine blade buckling resistance.Wind Energy 2014, 17, 1925–1943. [CrossRef]
17. Lee, H.G.; Kang, M.G.; Park, J. Fatigue failure of a composite wind turbine blade at its root end. Compos. Struct.2015, 133, 878–885. [CrossRef]
18. Mishnaevsky, L.; Dai, G. Hybrid and hierarchical nanoreinforced polymer composites: Computationalmodelling of structure-properties relationships. Compos. Struct. 2014, 117, 156–168. [CrossRef]
19. Domun, N.; Hadavinia, H.; Zhang, T.; Sainsbury, T.; Liaghat, G.H.; Vahid, S. Improving fracture toughnessand strength of epoxy using nanomaterials—A review of current status. Nanoscale 2015, 7, 10294–10329.[CrossRef] [PubMed]
20. Domun, N.; Hadavinia, H.; Zhang, T.; Liaghat, G.H.; Vahid, S.; Paton, K.; Spacie, C.; Sainsbury, T. Improvingthe fracture toughness properties of epoxy using graphene nanoplatelets at low filler content. Nanocomposites2017, 1–12. [CrossRef]
21. Thomsen, O. Sandwich materials for wind turbine blade—Present and future. J. Sandw. Struct. Mater. 2009,11, 7–26. [CrossRef]
22. Buckney, N.; Green, S.; Pirrera, A.; Weaver, P.M. On the structural topology of wind turbine blades.Wind Energy 2013, 16, 545–560. [CrossRef]
23. Sørensen, B.F.; Jørgensen, E.; Debel, C.P.; Jensen, F.M.; Jensen, H.M.; Jacobsen, T.K.; Halling, K.M.Improved Design of Large Wind Turbine Blade of Fibre Composites Based on Studies of ScaleEffects (Phase 1)—Summary Report. Available online: http://orbit.dtu.dk/fedora/objects/orbit:90493/datastreams/file_7702048/content (accessed on 30 September 2017).
24. ORE’s Standard Testing Procedure for Modal Testing PR10015; Offshore Renewable Energy Catapult (ORE):Blyth, UK.
25. Larsen, G.C.; Kretz, A. Experimental Determination of Stiffness Distributions and Mode Shapes of Wind TurbineBlades; Forskningscenter Risoe: Roskilde, Denmark, 1995.
26. Larsen, G.C.; Hansen, M.; Baumgart, A.; Carlén, I. Modal Analysis of Wind Turbine Blades. Availableonline: http://orbit.dtu.dk/fedora/objects/orbit:90910/datastreams/file_7712483/content (accessed on30 September 2017).
© 2017 by the authors. Licensee MDPI, Basel, Switzerland. This article is an open accessarticle distributed under the terms and conditions of the Creative Commons Attribution(CC BY) license (http://creativecommons.org/licenses/by/4.0/).