full scale tests of heat strengthened glass with ceramic frit
TRANSCRIPT
Glass Struct. Eng. (2016) 1:261–276DOI 10.1007/s40940-016-0032-3
CHALLENGING GLASS PAPER
Full scale tests of heat strengthened glass with ceramic frit
Matt Bergers · Kayla Natividad ·Stephen M. Morse · H. Scott Norville
Received: 24 December 2015 / Accepted: 7 May 2016 / Published online: 23 May 2016© Springer International Publishing Switzerland 2016
Abstract The authors tested five full scale samples ofnominal 6mm thick heat strengthened glass to failureunder uniform lateral loading. One sample was clearglass, one sample had full coverage ceramic enamelfrit, and the other three samples had ceramic enamel fritpatterns with different percentages of coverage. In test-ing the samples with ceramic enamel frit applications,researchers oriented the specimens to place the ceramicenamel frit in tension under lateral loading. The authorsfound that the samples with ceramic enamel frit dis-played considerably lower magnitudes of load resis-tance than did the clear heat strengthened sample. Inaddition, the authors noted that every fracture originthey have inspected to date from the 75 specimens withceramic enamel frit patterns occurred underneath frit.Micrographs of fracture origins indicate that the fritmay actually damage the glass surface during the heat
M. BergersResearch and Development, Viracon, 800 Park Drive,Owatonna, MN 55060, USAe-mail: [email protected]
K. Natividad · S. M. Morse · H. S. Norville (B)Department of Civil, Environmental, and ConstructionEngineering, Texas Tech University, Lubbock, TX 79409,USAe-mail: [email protected]
K. Natividade-mail: [email protected]
S. M. Morsee-mail: [email protected]
strengthening process. This study has significant impli-cations for architectural glass design.
Keywords Ceramic enamel frit · Heat strengthenedglass · Spandrel glass · Load resistance · Fracture
1 Introduction
Ceramic enamel frit is frequently applied in full cov-erage to heat treated glass lites in spandrel applica-tions. Ceramic enamel frit also finds applications toachieve architectural and aesthetic effects. Recently,heat strengthened spandrel lites in several buildings inthe US have experienced fracture resulting from ther-mally induced stresses. In response to the thermallyinduced fractures occurring in one building, three ofthe authors of this paper undertook a research project(Natividad et al. in review) that indicated the fullcoverage black ceramic enamel frit in that buildingreduced the load resistance of fully tempered glass andheat strengthened glass by approximately a factor of2.0. In short, this study, accomplished with four pointbending tests, indicated that fully tempered glass withthe ceramic enamel frit had load resistance equivalentto that of heat strengthened glass and heat strength-ened glass had load resistance equivalent to annealedglass. The research reported herein involves conductingtests on full scale rectangular specimens to determinewhether the four point testing indicated a singular resultpeculiar to either the frit or the test method.
123
262 M. Bergers et al.
2 Background
Glass, a brittle material, fractures when subjected totensile stress having sufficient magnitude and duration.Glass displays a linear elastic stress-strain relationshipfrom the inception of loading through fracture. Factorsknown to impact window glass strength include, but arenot limited to: age, in-service weathering, load dura-tion, lite geometry and thickness, stress conditions andsurface conditions (Norville and Minor 1985). Krohnet al. (2002) reported that an applied enamel coatinghas a negative effect on the strength and fatigue char-acteristics of heat treated float glass, due to defects inthe enamel. Krampe (2013) states in his dissertationthat frit has long been known to reduce the strength ofheat treated glass to which it is applied. His dissertation(Krampe 2013) investigates potential reasons underly-ing the strength reduction.
The use of ceramic enamel frit on architectural glassis a common practice allowing the inclusion of colorsand patterns. Ceramic enamel frit paint is composed ofminute glass particles, pigment, and a medium wherethe glass and pigment come together (Schmidt 2007).The ceramic enamel frit paint is applied to one side ofannealed glass after it has been cut to its final size forinstallation. Next, the glass is heated to a temperaturenear its softening point and quenched to rapidly coolthe outer glass fibers while the inner fibers cool slowly.During the heating process, the ceramic particles in thepaint melt and fuse with the glass surface. This processproduces a permanent coating over the glass surfacewith residual compressive surface stress (RCSS) on theexterior fibers of the glass and tension in the glass cen-ter. The quenching rate controls the magnitudes of theRCSS and the tension in the middle. To produce heatstrengthened glass, the quenching rate is slower andproduces RCSS ranging from 24 to 52MPa (ASTMC1048 2012b). To produce fully tempered glass, thequenching rate is faster and produces RCSS with aminimum value of 69MPa (ASTM C1048 2012b).Glass with RCSS falling between 52 and 69MPa is notdefined (ASTM C1048 2012b). Annealed float glasswith a ceramic enamel frit coating has been found tohave reduced strength and fatigue resistance lower thanthat of standard annealed float glass. There was no dif-ference, however, between the strength of lites enam-eled on the air-side versus those enameled on the tin-side (Krohn et al. 2002).
Heat treatment alters two major properties of glass:its strength and themanner inwhich it fractures. ASTME1300 (2012c) defines the load resistance of heatstrengthened glass as twice that of annealed glass hav-ing the same geometry and the load resistance of fullytempered glass as four times that of annealed glass hav-ing the same geometry. The origins of the factors 2 and4 for heat strengthened and fully tempered glass loadresistances, respectively, are amystery. Fracture behav-ior for heat strengthened and fully tempered glass dif-fers significantly. Heat strengthened glass fracture pro-duces relatively large shards, similar to those producedby annealed glass fracture, allowing the fracture originlocation to be easily determined. Upon fracture, fullytempered glass dices into innumerable small shards,making determination of the fracture origin locationdifficult, if not impossible. Natividad et al. (in review)observed that while full coverage ceramic enamel fritgreatly reduces the load resistance of fully temperedglass, it did not alter the fracture pattern, i.e., dicing.
3 Test specimens
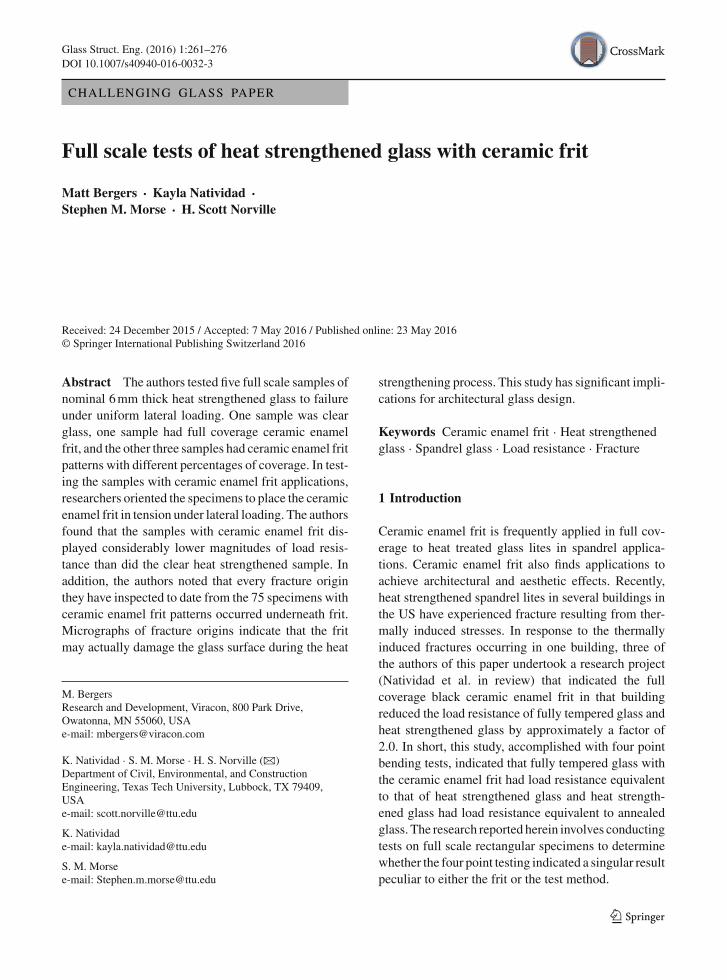
Viracon donated the new heat strengthened glass spec-imens tested in this program. It shipped the speci-mens to testing facilities in Lubbock, TX, immediatelyfollowing production. All specimens had rectangulardimensions of 965mm× 1930mm and 6mm nominalthickness. The specimens were divided into 5 samples.Table1 summarizes the details of the samples. Sam-ple 1 was comprised of clear specimens. Sample 2 wascomprised of specimenswith 40%coverage of ceramicenamel frit in a dot pattern. Sample 3 was comprisedof specimens with 50% coverage of ceramic enamelfrit in a line pattern. Sample 4 was comprised of spec-imens with 60% coverage of ceramic enamel frit in ahole pattern. Sample 5 was comprised of heat strength-ened glass specimens with 100% coverage of ceramicenamel frit. Dots in Sample 2 and holes in Sample 4have a diameter of 3mm. Lines in Sample 3 have athickness of 3mm. The patterns for Samples 2, 3, and 4were silk-screened onto the glass prior to heat strength-ening/fusing the frit to the glass. Frit was applied tospecimens in Sample 5 using a roller coat prior to heatstrengthening/fusing the frit to the glass. Figure1 showsceramic enamel frit patterns on specimens in Samples2, 3, and 4. Viracon designates ceramic enamel fritcolor asV933WarmGrey, a bismuth based borosilicate
123

Full scale tests of heat strengthened glass with ceramic frit 263
Table 1 Summary of sample details
Samplenumber
Description Number ofspecimens
RCSS∗(MPa)
1 Clear 27 42.9
2 Dots 27 41.1
3 Lines 27 40.1
4 Holes 26 42.3
5 Full-flood 27 45.7
frit. The frit supplier wishes to remain unnamed. Thefrit went to the edge of all specimens to which it wasapplied although no edge fractures occurred in the tests.
The first column in Table1 gives the sample number.The second column describes the frit application. Thethird column gives the number of specimens tested inthe sample. The fourth column gives the characteris-tic value of RCSS, RCSS∗, for the sample, discussedbelow.
4 Test procedure
The specimens were tested in a frame consistent withASTM E998 (2012a) which provides detailed specifi-cations and drawings of the test chamber arrangement.In the test procedure, the test specimen, simply sup-ported by neoprene beads set in grooves milled intostructural steel members with a steel plate backing,forms the closure of an airtight chamber. During thetest, air is evacuated from the chamber at a controlledrate. The difference between atmospheric pressure onthe outside of the chamber and the reduced pressureinside the chamber produces the uniform lateral loadacting on the test specimen. During the test procedure,described briefly below, researchers placed the air sideof the clear heat strengthened glass specimens fromSample 1 in tension (toward the interior of the cham-ber). For the four samples with ceramic enamel frit,researchers placed the air side. i.e., the side with theceramic enamel frit, in tension. The test procedure isdescribed fully in other literature (Beason 1980; Abi-assi 1981; Kanabolo and Norville 1984). Briefly, foreach test, research personnel carried out the followingsteps:
(a) Remove the specimen from its crate.(b) Place the specimen on a glass table with the edges
supported to protect the ceramic enamel frit sur-face from damage.
(c) Measure RCSS at 9 points on the specimen’s tin(non-fritted) side using a Grazing Angle SurfacePolarimeter (GASP).
(d) Install the specimen into the test frame.(e) Tape the compression side of the specimen to pre-
serve the fracture pattern.(f) Install the exterior glazing stops.(g) Load the specimen to fracture by evacuating air
from the test frame at a controlled rate to increasethe lateral load across the specimen linearly withtime.
(h) Photograph the fracture pattern while the speci-men is still in the test frame.
(i) Locate and remove the shards containing the frac-ture origin.
(j) Clean and prepare the test frame for the next spec-imen.
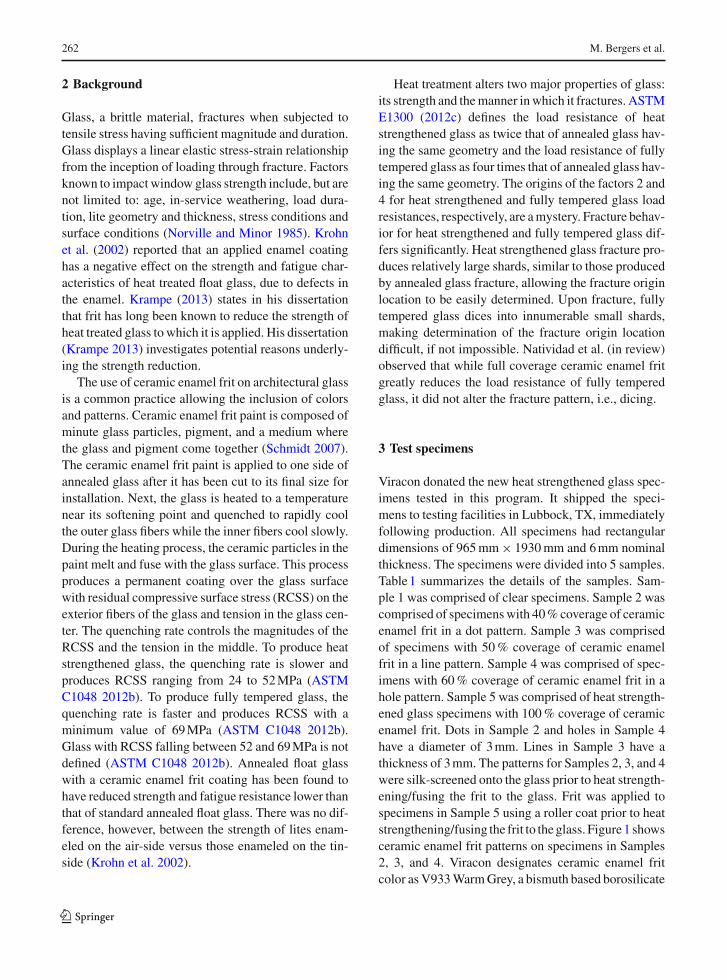
Figure2a shows a fracture pattern for a specimenfrom Sample 2. The green arrow indicates the locationof the fracture origin near the upper right corner of thefracture pattern. Figure2b shows a close view of theshards containing the fracture origin which occurredunderneath a ceramic frit dot.
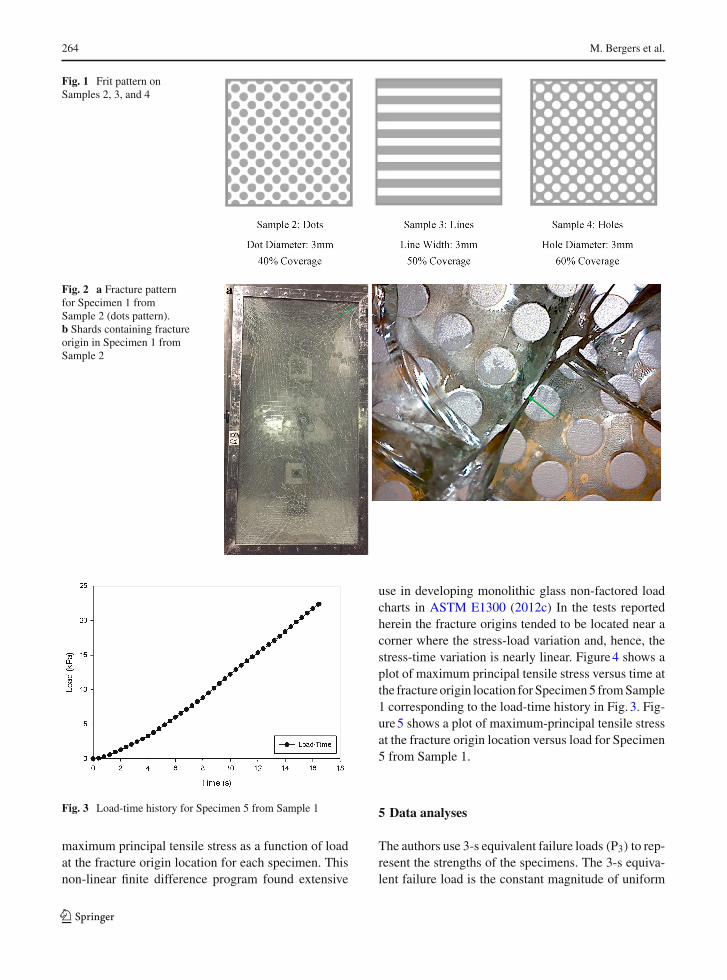
During loading, research personnel used transduc-ers to record the pressure inside the space behind theglass thus establishing the lateral load-time history.They used a data acquisition system to record thepressure-timehistory, collectingmeasurements at a rateof 25Hz. They also measured and recorded center-of-glass deflection using a linear variable deflection trans-ducer. They used deflection data as a first level checkof the analysis program. Figure3 shows a load time-history for Specimen 5 from Sample 1. The load-timehistory represents the difference between atmosphericpressure outside the chamber and the reduced pres-sure as researcher personnel evacuate air from the testchamber.
The authors note that even though the lateral loadvaries more-or-less linearly with time, the maximumprincipal tensile stress at the fracture origin, depend-ing on its location, in general does not. In addition, thelocation of the fracture origin is, in general, different oneach test specimen. After fracture, research personnellocated the fracture origin, noted its position relative tothe lower left corner of the specimen and removed itfor further study.
The authors used a non-linear finite difference analy-sis program (Vallabhan and Wang 1981) to determine
123
264 M. Bergers et al.
Fig. 1 Frit pattern onSamples 2, 3, and 4
Fig. 2 a Fracture patternfor Specimen 1 fromSample 2 (dots pattern).b Shards containing fractureorigin in Specimen 1 fromSample 2
Fig. 3 Load-time history for Specimen 5 from Sample 1
maximum principal tensile stress as a function of loadat the fracture origin location for each specimen. Thisnon-linear finite difference program found extensive
use in developing monolithic glass non-factored loadcharts in ASTM E1300 (2012c) In the tests reportedherein the fracture origins tended to be located near acorner where the stress-load variation and, hence, thestress-time variation is nearly linear. Figure4 shows aplot of maximum principal tensile stress versus time atthe fracture origin location forSpecimen5 fromSample1 corresponding to the load-time history in Fig. 3. Fig-ure5 shows a plot of maximum-principal tensile stressat the fracture origin location versus load for Specimen5 from Sample 1.
5 Data analyses
The authors use 3-s equivalent failure loads (P3) to rep-resent the strengths of the specimens. The 3-s equiva-lent failure load is the constant magnitude of uniform
123
Full scale tests of heat strengthened glass with ceramic frit 265
lateral load that would lead to fracture when applied toa lite over a 3 s duration. They chose this time durationbecause ASTM E1300 (2012c) defines glass lite loadresistance in terms of 3-s duration uniform lateral load-ings. A comparison of the magnitudes of the P3 values,therefore, provides a comparison of the strengths of thesamples consistent with ASTM E1300 (2012c).
They used the integral:
σ3 =[∫ tf
0
[σ (t) − RCSS∗]n
3 s
]1/n
(1)
to establish the 3 s equivalent fracture stress for eachspecimen. In the above integral, tf denotes the timeof fracture in seconds after the inception of loading,σ(t) denotes the maximum principal tensile stress at
Fig. 4 Load-induced maximum principal tensile stress versustime at the fracture origin location for Specimen 5 from Sample 1
Fig. 5 Load-induced maximum principal tensile stress versusload at the fracture origin location for Specimen 5 from Sample 1
the fracture origin at time t, n denotes the static fatigueconstant for glass, and RCSS∗ denotes the magnitude acharacteristic minimum RCSS measured in each sam-ple. As stated above, research personnel made 9 mea-surements of RCSS on each specimen. They then aver-aged the 9 RCSS values for each specimen. The char-acteristic minimum value of RCSS for a sample is thelowest average for all the specimens in each sample.The authors used n=16 for the static fatigue constant.For times when σ(t) < RCSS∗, the integrand is takenas 0 as indicated in Fig. 5. Table1 above indicates thevalues of RCSS* for the specimens for each sample.
Figure6 illustrates (σmax −RCSS∗) versus load fortheSpecimen5 fromSample 1 corresponding toFigs. 3,4, and 5. For each specimen, they entered vertical axisof the specimen’s graph similar to that Fig. 6 with thevalue of (σ3 −RCSS∗) projected a horizontal line tointersect the curve. They then projected a vertical linedownward from the intersection. The intersection ofthe vertical line with the abscissa occurs at the valueP3 for that specimen. Note that for the region where(σmax −RCSS∗) is negative the value was set to zero,both in the procedure in Fig. 6 and well as in evaluatingthe integral in Eq.1.
Tables2, 3, 4, 5 and 6 present failure and 3-s equiv-alent properties for all specimens in each sample. Ineach table, the first column gives the specimen num-bers. The second and third columns give the x and ycoordinates, respectively, of the fracture origin mea-sured from the bottom left corner of the specimen withthe x-direction oriented parallel to the short edge. Thefourth column presents the maximum principle tensilestress at fracture origin when fracture occurred. Thefifth and sixth columns give the 3-s equivalent stress
Fig. 6 Determining P3 for Specimen 5 from Sample 1
123

266 M. Bergers et al.
Table 2 Sample 1 (clear)fracture origin properties
Specimen Location of fractureorigin
σmax at fractureorigin (MPa)
σ3 (MPa) P3 (kPa)
x (mm) y (mm)
1 25 25 100.7 96.3 20.0
2 108 44 70.5 65.5 19.5
3 946 1892 116.1 109.5 22.4
4 933 32 109.8 103.0 21.5
5 916 5 106.3 97.7 20.4
6 3 44 116.3 115.5 22.9
7 959 1930 70.7 62.8 15.5
8 959 1889 101.2 97.8 20.2
9 38 1927 123.5 119.4 23.6
10 964 1889 109.8 102.6 20.8
11 962 1895 111.8 102.1 20.9
12 962 1902 95.8 87.1 18.7
13 51 1927 86.3 79.1 17.5
14 10 83 64.6 62.4 16.2
15 962 1886 81.9 84.4 18.1
16 43 1927 96.1 99.5 20.4
17 44 1927 101.6 113.6 22.6
18 149 1772 95.0 96.3 22.0
19 965 1911 92.9 99.9 20.9
20 27 1919 102.7 99.5 20.6
21 962 1891 109.9 111.9 22.3
22 11 99 67.7 70.0 19.5
23 102 114 75.4 73.9 18.6
24 22 0 129.2 132.5 25.8
25 876 1905 69.4 68.6 18.8
26 94 1919 91.3 95.2 25.6
Average – – 94.5 92.3 20.3
(σ3), and 3s equivalent failure load (P3) values, respec-tively, for each sample.
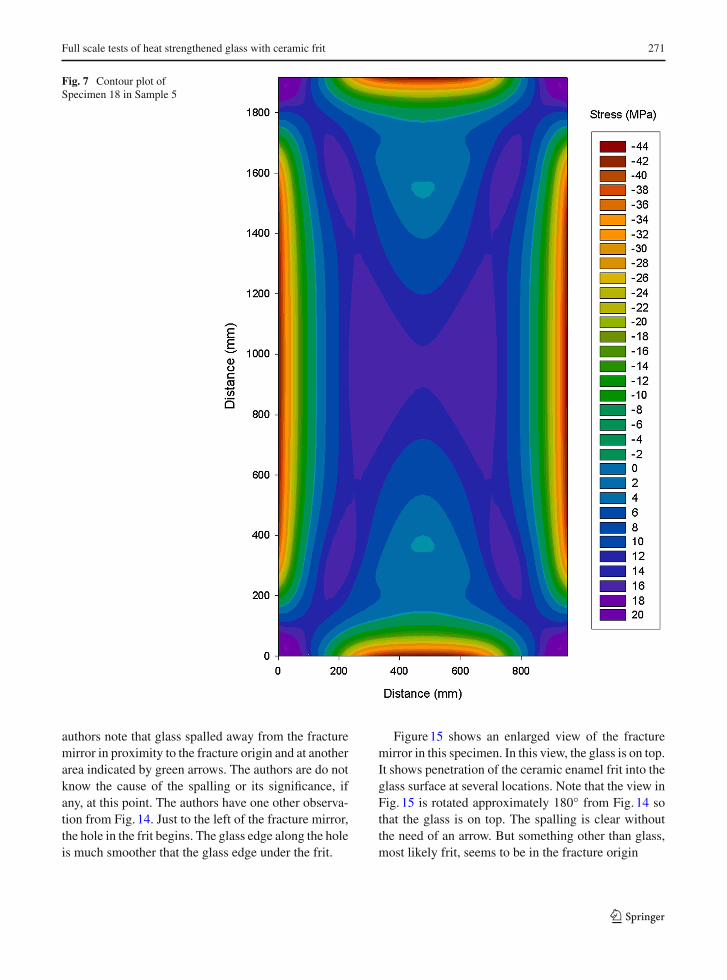
Krall et al. (1981) presents an empirical methodolgyto predict the location of maximum tensile stress as afunction of applied lateral load, glass lite aspect ratio,and glass lite thickness. According to their methodol-ogy, the location of maximum principal tensile stressmoves from the center of the glass towards the cornersas load increases. Figure7 shows a stress contour plotfor Specimen 18 from Sample 5 at the failure load.This specimen fractured at the lowest load and, hence,had the lowest maximum principal tensile stress at itsfracture origin of all specimens tested. The the maxi-mum principal tensile stresses occur in proximity to thecorners of the lite. In Fig. 7, the largest value of max-
imum principal tenile stress, which occurs near eachcorner, is 20.2MPa while the maximum principal ten-sile stress stress at the glass lite’s center was 16.3MPa.It can be inferred that the maximum principal tensilestress would be located near the corners for all otherspecimens tested in this study that fractured at higherloads than Specimen 18 from Sample 5.
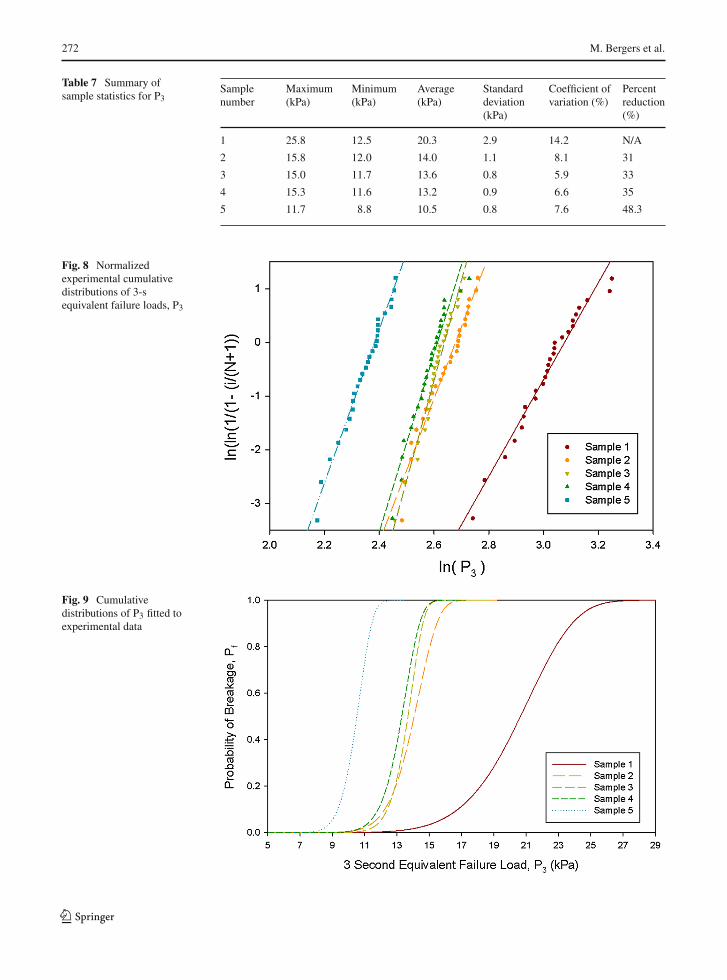
In Table7, the first column gives the sample num-ber. The second column presents the largest value ofP3. The third column presents the smallest value ofP3. The fourth column presents the average value ofP3. The fifth column presents the standard deviation ofP3 values for each sample. The sixth column presentsthe coefficient of variation of P3. The seventh col-umn presents the reduction in the mean value of P3
123
Full scale tests of heat strengthened glass with ceramic frit 267
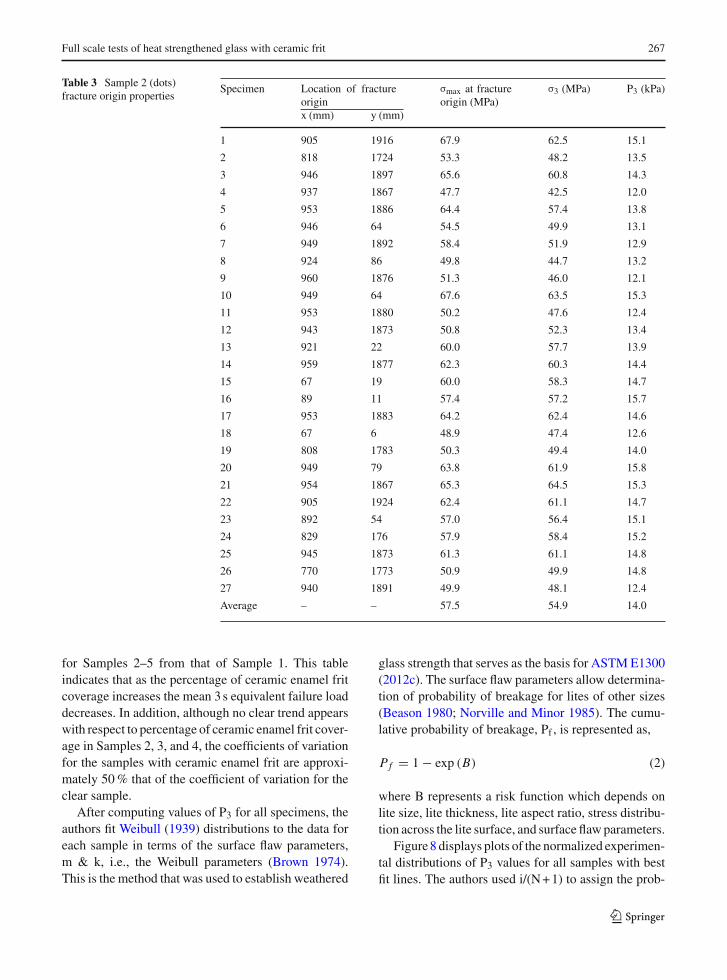
Table 3 Sample 2 (dots)fracture origin properties
Specimen Location of fractureorigin
σmax at fractureorigin (MPa)
σ3 (MPa) P3 (kPa)
x (mm) y (mm)
1 905 1916 67.9 62.5 15.1
2 818 1724 53.3 48.2 13.5
3 946 1897 65.6 60.8 14.3
4 937 1867 47.7 42.5 12.0
5 953 1886 64.4 57.4 13.8
6 946 64 54.5 49.9 13.1
7 949 1892 58.4 51.9 12.9
8 924 86 49.8 44.7 13.2
9 960 1876 51.3 46.0 12.1
10 949 64 67.6 63.5 15.3
11 953 1880 50.2 47.6 12.4
12 943 1873 50.8 52.3 13.4
13 921 22 60.0 57.7 13.9
14 959 1877 62.3 60.3 14.4
15 67 19 60.0 58.3 14.7
16 89 11 57.4 57.2 15.7
17 953 1883 64.2 62.4 14.6
18 67 6 48.9 47.4 12.6
19 808 1783 50.3 49.4 14.0
20 949 79 63.8 61.9 15.8
21 954 1867 65.3 64.5 15.3
22 905 1924 62.4 61.1 14.7
23 892 54 57.0 56.4 15.1
24 829 176 57.9 58.4 15.2
25 945 1873 61.3 61.1 14.8
26 770 1773 50.9 49.9 14.8
27 940 1891 49.9 48.1 12.4
Average – – 57.5 54.9 14.0
for Samples 2–5 from that of Sample 1. This tableindicates that as the percentage of ceramic enamel fritcoverage increases the mean 3s equivalent failure loaddecreases. In addition, although no clear trend appearswith respect to percentage of ceramic enamel frit cover-age in Samples 2, 3, and 4, the coefficients of variationfor the samples with ceramic enamel frit are approxi-mately 50% that of the coefficient of variation for theclear sample.
After computing values of P3 for all specimens, theauthors fit Weibull (1939) distributions to the data foreach sample in terms of the surface flaw parameters,m & k, i.e., the Weibull parameters (Brown 1974).This is the method that was used to establish weathered
glass strength that serves as the basis for ASTM E1300(2012c). The surface flaw parameters allow determina-tion of probability of breakage for lites of other sizes(Beason 1980; Norville and Minor 1985). The cumu-lative probability of breakage, Pf , is represented as,
Pf = 1 − exp (B) (2)
where B represents a risk function which depends onlite size, lite thickness, lite aspect ratio, stress distribu-tion across the lite surface, and surface flawparameters.
Figure8 displays plots of the normalized experimen-tal distributions of P3 values for all samples with bestfit lines. The authors used i/(N+1) to assign the prob-
123
268 M. Bergers et al.
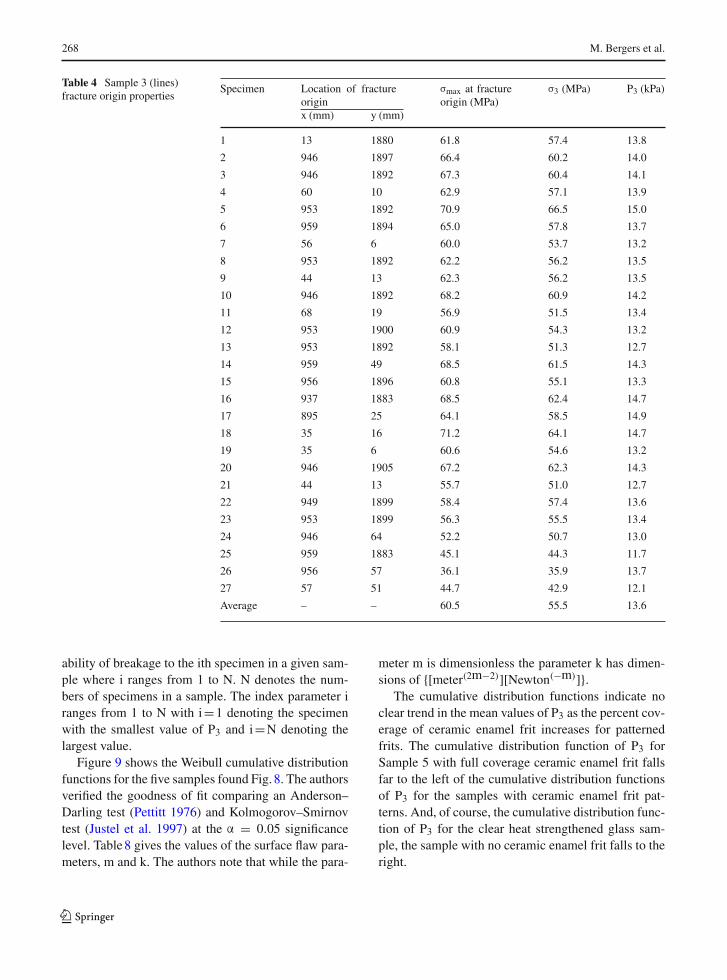
Table 4 Sample 3 (lines)fracture origin properties
Specimen Location of fractureorigin
σmax at fractureorigin (MPa)
σ3 (MPa) P3 (kPa)
x (mm) y (mm)
1 13 1880 61.8 57.4 13.8
2 946 1897 66.4 60.2 14.0
3 946 1892 67.3 60.4 14.1
4 60 10 62.9 57.1 13.9
5 953 1892 70.9 66.5 15.0
6 959 1894 65.0 57.8 13.7
7 56 6 60.0 53.7 13.2
8 953 1892 62.2 56.2 13.5
9 44 13 62.3 56.2 13.5
10 946 1892 68.2 60.9 14.2
11 68 19 56.9 51.5 13.4
12 953 1900 60.9 54.3 13.2
13 953 1892 58.1 51.3 12.7
14 959 49 68.5 61.5 14.3
15 956 1896 60.8 55.1 13.3
16 937 1883 68.5 62.4 14.7
17 895 25 64.1 58.5 14.9
18 35 16 71.2 64.1 14.7
19 35 6 60.6 54.6 13.2
20 946 1905 67.2 62.3 14.3
21 44 13 55.7 51.0 12.7
22 949 1899 58.4 57.4 13.6
23 953 1899 56.3 55.5 13.4
24 946 64 52.2 50.7 13.0
25 959 1883 45.1 44.3 11.7
26 956 57 36.1 35.9 13.7
27 57 51 44.7 42.9 12.1
Average – – 60.5 55.5 13.6
ability of breakage to the ith specimen in a given sam-ple where i ranges from 1 to N. N denotes the num-bers of specimens in a sample. The index parameter iranges from 1 to N with i=1 denoting the specimenwith the smallest value of P3 and i=N denoting thelargest value.
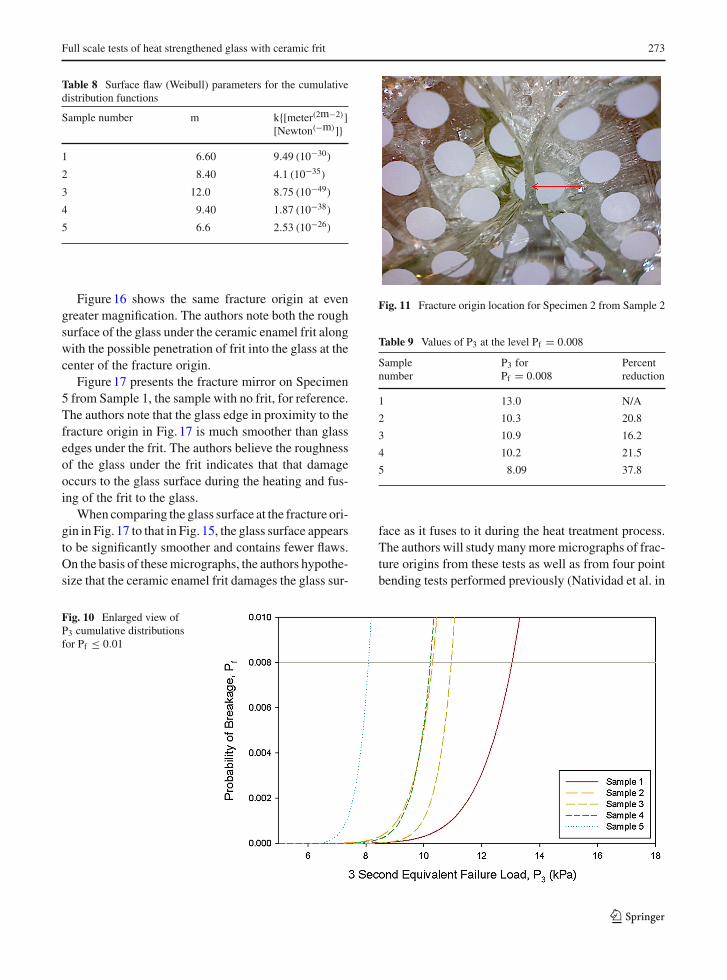
Figure 9 shows the Weibull cumulative distributionfunctions for the five samples found Fig. 8. The authorsverified the goodness of fit comparing an Anderson–Darling test (Pettitt 1976) and Kolmogorov–Smirnovtest (Justel et al. 1997) at the α = 0.05 significancelevel. Table8 gives the values of the surface flaw para-meters, m and k. The authors note that while the para-
meter m is dimensionless the parameter k has dimen-sions of {[meter(2m−2)][Newton(−m)]}.
The cumulative distribution functions indicate noclear trend in the mean values of P3 as the percent cov-erage of ceramic enamel frit increases for patternedfrits. The cumulative distribution function of P3 forSample 5 with full coverage ceramic enamel frit fallsfar to the left of the cumulative distribution functionsof P3 for the samples with ceramic enamel frit pat-terns. And, of course, the cumulative distribution func-tion of P3 for the clear heat strengthened glass sam-ple, the sample with no ceramic enamel frit falls to theright.
123
Full scale tests of heat strengthened glass with ceramic frit 269
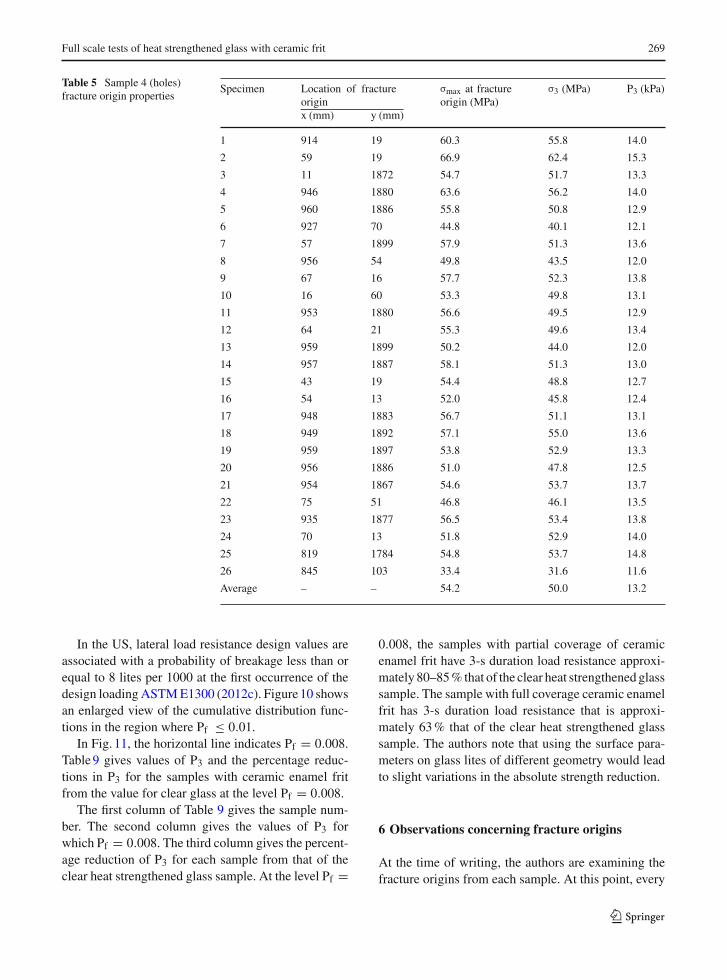
Table 5 Sample 4 (holes)fracture origin properties
Specimen Location of fractureorigin
σmax at fractureorigin (MPa)
σ3 (MPa) P3 (kPa)
x (mm) y (mm)
1 914 19 60.3 55.8 14.0
2 59 19 66.9 62.4 15.3
3 11 1872 54.7 51.7 13.3
4 946 1880 63.6 56.2 14.0
5 960 1886 55.8 50.8 12.9
6 927 70 44.8 40.1 12.1
7 57 1899 57.9 51.3 13.6
8 956 54 49.8 43.5 12.0
9 67 16 57.7 52.3 13.8
10 16 60 53.3 49.8 13.1
11 953 1880 56.6 49.5 12.9
12 64 21 55.3 49.6 13.4
13 959 1899 50.2 44.0 12.0
14 957 1887 58.1 51.3 13.0
15 43 19 54.4 48.8 12.7
16 54 13 52.0 45.8 12.4
17 948 1883 56.7 51.1 13.1
18 949 1892 57.1 55.0 13.6
19 959 1897 53.8 52.9 13.3
20 956 1886 51.0 47.8 12.5
21 954 1867 54.6 53.7 13.7
22 75 51 46.8 46.1 13.5
23 935 1877 56.5 53.4 13.8
24 70 13 51.8 52.9 14.0
25 819 1784 54.8 53.7 14.8
26 845 103 33.4 31.6 11.6
Average – – 54.2 50.0 13.2
In the US, lateral load resistance design values areassociated with a probability of breakage less than orequal to 8 lites per 1000 at the first occurrence of thedesign loadingASTME1300 (2012c). Figure10 showsan enlarged view of the cumulative distribution func-tions in the region where Pf ≤ 0.01.
In Fig. 11, the horizontal line indicates Pf = 0.008.Table9 gives values of P3 and the percentage reduc-tions in P3 for the samples with ceramic enamel fritfrom the value for clear glass at the level Pf = 0.008.
The first column of Table 9 gives the sample num-ber. The second column gives the values of P3 forwhich Pf = 0.008. The third column gives the percent-age reduction of P3 for each sample from that of theclear heat strengthened glass sample. At the level Pf =
0.008, the samples with partial coverage of ceramicenamel frit have 3-s duration load resistance approxi-mately 80–85% that of the clear heat strengthenedglasssample. The sample with full coverage ceramic enamelfrit has 3-s duration load resistance that is approxi-mately 63% that of the clear heat strengthened glasssample. The authors note that using the surface para-meters on glass lites of different geometry would leadto slight variations in the absolute strength reduction.
6 Observations concerning fracture origins
At the time of writing, the authors are examining thefracture origins from each sample. At this point, every
123
270 M. Bergers et al.
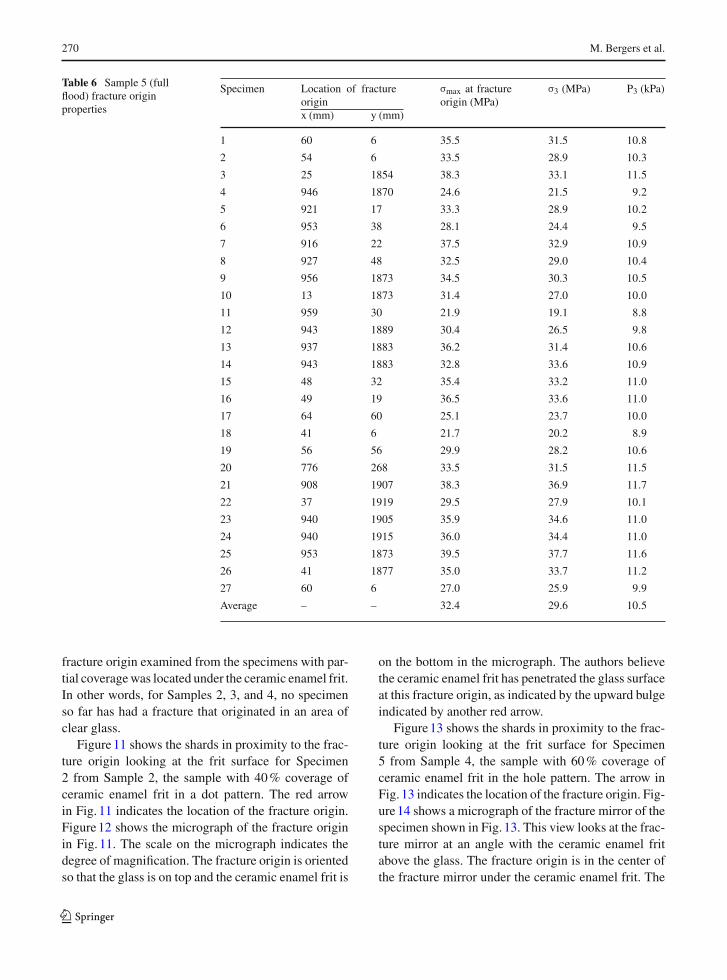
Table 6 Sample 5 (fullflood) fracture originproperties
Specimen Location of fractureorigin
σmax at fractureorigin (MPa)
σ3 (MPa) P3 (kPa)
x (mm) y (mm)
1 60 6 35.5 31.5 10.8
2 54 6 33.5 28.9 10.3
3 25 1854 38.3 33.1 11.5
4 946 1870 24.6 21.5 9.2
5 921 17 33.3 28.9 10.2
6 953 38 28.1 24.4 9.5
7 916 22 37.5 32.9 10.9
8 927 48 32.5 29.0 10.4
9 956 1873 34.5 30.3 10.5
10 13 1873 31.4 27.0 10.0
11 959 30 21.9 19.1 8.8
12 943 1889 30.4 26.5 9.8
13 937 1883 36.2 31.4 10.6
14 943 1883 32.8 33.6 10.9
15 48 32 35.4 33.2 11.0
16 49 19 36.5 33.6 11.0
17 64 60 25.1 23.7 10.0
18 41 6 21.7 20.2 8.9
19 56 56 29.9 28.2 10.6
20 776 268 33.5 31.5 11.5
21 908 1907 38.3 36.9 11.7
22 37 1919 29.5 27.9 10.1
23 940 1905 35.9 34.6 11.0
24 940 1915 36.0 34.4 11.0
25 953 1873 39.5 37.7 11.6
26 41 1877 35.0 33.7 11.2
27 60 6 27.0 25.9 9.9
Average – – 32.4 29.6 10.5
fracture origin examined from the specimens with par-tial coveragewas located under the ceramic enamel frit.In other words, for Samples 2, 3, and 4, no specimenso far has had a fracture that originated in an area ofclear glass.
Figure11 shows the shards in proximity to the frac-ture origin looking at the frit surface for Specimen2 from Sample 2, the sample with 40% coverage ofceramic enamel frit in a dot pattern. The red arrowin Fig. 11 indicates the location of the fracture origin.Figure12 shows the micrograph of the fracture originin Fig. 11. The scale on the micrograph indicates thedegree of magnification. The fracture origin is orientedso that the glass is on top and the ceramic enamel frit is
on the bottom in the micrograph. The authors believethe ceramic enamel frit has penetrated the glass surfaceat this fracture origin, as indicated by the upward bulgeindicated by another red arrow.
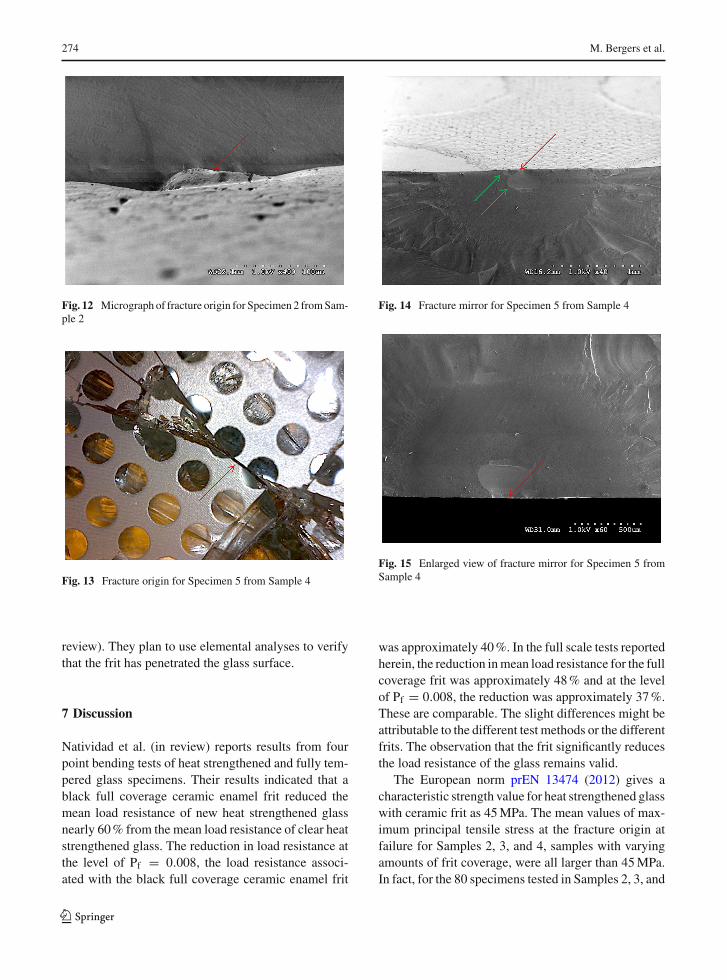
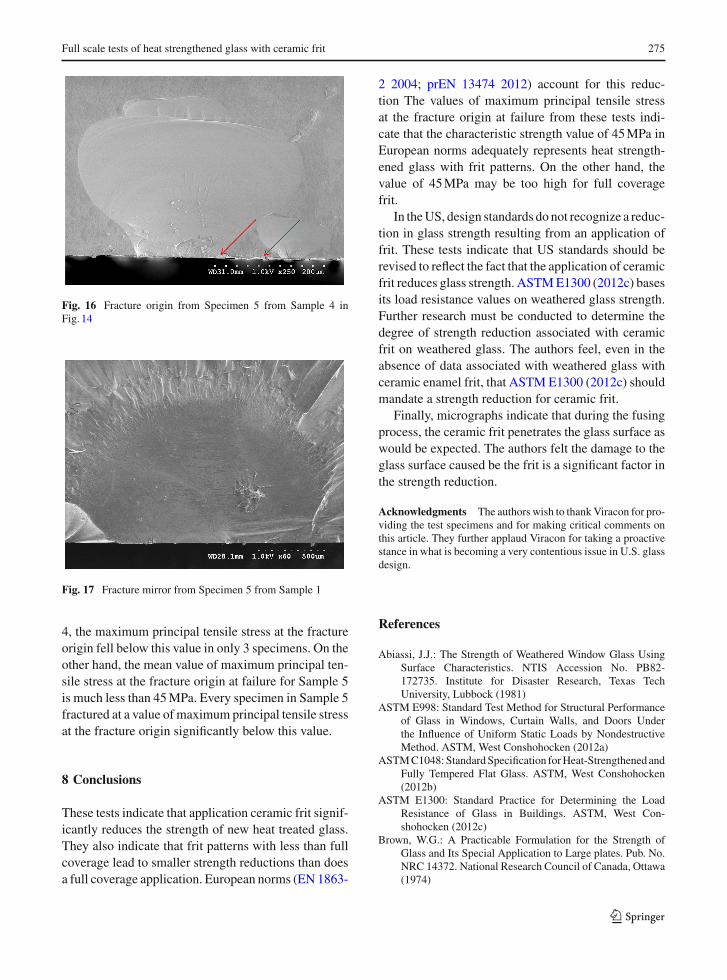
Figure13 shows the shards in proximity to the frac-ture origin looking at the frit surface for Specimen5 from Sample 4, the sample with 60% coverage ofceramic enamel frit in the hole pattern. The arrow inFig. 13 indicates the location of the fracture origin. Fig-ure14 shows a micrograph of the fracture mirror of thespecimen shown in Fig. 13. This view looks at the frac-ture mirror at an angle with the ceramic enamel fritabove the glass. The fracture origin is in the center ofthe fracture mirror under the ceramic enamel frit. The
123
Full scale tests of heat strengthened glass with ceramic frit 271
Fig. 7 Contour plot ofSpecimen 18 in Sample 5
authors note that glass spalled away from the fracturemirror in proximity to the fracture origin and at anotherarea indicated by green arrows. The authors are do notknow the cause of the spalling or its significance, ifany, at this point. The authors have one other observa-tion from Fig. 14. Just to the left of the fracture mirror,the hole in the frit begins. The glass edge along the holeis much smoother that the glass edge under the frit.
Figure15 shows an enlarged view of the fracturemirror in this specimen. In this view, the glass is on top.It shows penetration of the ceramic enamel frit into theglass surface at several locations. Note that the view inFig. 15 is rotated approximately 180◦ from Fig. 14 sothat the glass is on top. The spalling is clear withoutthe need of an arrow. But something other than glass,most likely frit, seems to be in the fracture origin
123
272 M. Bergers et al.
Table 7 Summary ofsample statistics for P3
Samplenumber
Maximum(kPa)
Minimum(kPa)
Average(kPa)
Standarddeviation(kPa)
Coefficient ofvariation (%)
Percentreduction(%)
1 25.8 12.5 20.3 2.9 14.2 N/A
2 15.8 12.0 14.0 1.1 8.1 31
3 15.0 11.7 13.6 0.8 5.9 33
4 15.3 11.6 13.2 0.9 6.6 35
5 11.7 8.8 10.5 0.8 7.6 48.3
Fig. 8 Normalizedexperimental cumulativedistributions of 3-sequivalent failure loads, P3
Fig. 9 Cumulativedistributions of P3 fitted toexperimental data
123
Full scale tests of heat strengthened glass with ceramic frit 273
Table 8 Surface flaw (Weibull) parameters for the cumulativedistribution functions
Sample number m k{[meter(2m−2)][Newton(−m)]}
1 6.60 9.49 (10−30)
2 8.40 4.1 (10−35)
3 12.0 8.75 (10−49)
4 9.40 1.87 (10−38)
5 6.6 2.53 (10−26)
Figure16 shows the same fracture origin at evengreater magnification. The authors note both the roughsurface of the glass under the ceramic enamel frit alongwith the possible penetration of frit into the glass at thecenter of the fracture origin.
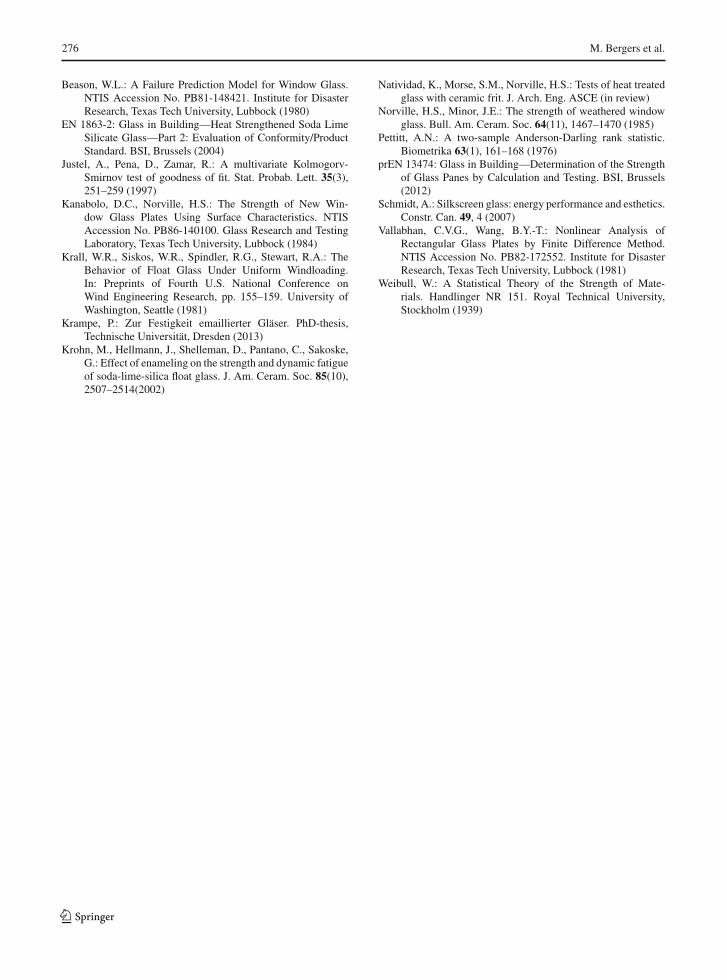
Figure17 presents the fracture mirror on Specimen5 from Sample 1, the sample with no frit, for reference.The authors note that the glass edge in proximity to thefracture origin in Fig. 17 is much smoother than glassedges under the frit. The authors believe the roughnessof the glass under the frit indicates that that damageoccurs to the glass surface during the heating and fus-ing of the frit to the glass.
When comparing the glass surface at the fracture ori-gin in Fig. 17 to that in Fig. 15, the glass surface appearsto be significantly smoother and contains fewer flaws.On the basis of thesemicrographs, the authors hypothe-size that the ceramic enamel frit damages the glass sur-
Fig. 11 Fracture origin location for Specimen 2 from Sample 2
Table 9 Values of P3 at the level Pf = 0.008
Samplenumber
P3 forPf = 0.008
Percentreduction
1 13.0 N/A
2 10.3 20.8
3 10.9 16.2
4 10.2 21.5
5 8.09 37.8
face as it fuses to it during the heat treatment process.The authors will studymanymoremicrographs of frac-ture origins from these tests as well as from four pointbending tests performed previously (Natividad et al. in
Fig. 10 Enlarged view ofP3 cumulative distributionsfor Pf ≤ 0.01
123
274 M. Bergers et al.
Fig. 12 Micrograph of fracture origin for Specimen 2 fromSam-ple 2
Fig. 13 Fracture origin for Specimen 5 from Sample 4
review). They plan to use elemental analyses to verifythat the frit has penetrated the glass surface.
7 Discussion
Natividad et al. (in review) reports results from fourpoint bending tests of heat strengthened and fully tem-pered glass specimens. Their results indicated that ablack full coverage ceramic enamel frit reduced themean load resistance of new heat strengthened glassnearly 60% from the mean load resistance of clear heatstrengthened glass. The reduction in load resistance atthe level of Pf = 0.008, the load resistance associ-ated with the black full coverage ceramic enamel frit
Fig. 14 Fracture mirror for Specimen 5 from Sample 4
Fig. 15 Enlarged view of fracture mirror for Specimen 5 fromSample 4
was approximately 40%. In the full scale tests reportedherein, the reduction inmean load resistance for the fullcoverage frit was approximately 48% and at the levelof Pf = 0.008, the reduction was approximately 37%.These are comparable. The slight differences might beattributable to the different test methods or the differentfrits. The observation that the frit significantly reducesthe load resistance of the glass remains valid.
The European norm prEN 13474 (2012) gives acharacteristic strength value for heat strengthened glasswith ceramic frit as 45MPa. The mean values of max-imum principal tensile stress at the fracture origin atfailure for Samples 2, 3, and 4, samples with varyingamounts of frit coverage, were all larger than 45MPa.In fact, for the 80 specimens tested in Samples 2, 3, and
123
Full scale tests of heat strengthened glass with ceramic frit 275
Fig. 16 Fracture origin from Specimen 5 from Sample 4 inFig. 14
Fig. 17 Fracture mirror from Specimen 5 from Sample 1
4, the maximum principal tensile stress at the fractureorigin fell below this value in only 3 specimens. On theother hand, the mean value of maximum principal ten-sile stress at the fracture origin at failure for Sample 5is much less than 45MPa. Every specimen in Sample 5fractured at a value of maximum principal tensile stressat the fracture origin significantly below this value.
8 Conclusions
These tests indicate that application ceramic frit signif-icantly reduces the strength of new heat treated glass.They also indicate that frit patterns with less than fullcoverage lead to smaller strength reductions than doesa full coverage application. European norms (EN 1863-
2 2004; prEN 13474 2012) account for this reduc-tion The values of maximum principal tensile stressat the fracture origin at failure from these tests indi-cate that the characteristic strength value of 45MPa inEuropean norms adequately represents heat strength-ened glass with frit patterns. On the other hand, thevalue of 45MPa may be too high for full coveragefrit.
In theUS, design standards do not recognize a reduc-tion in glass strength resulting from an application offrit. These tests indicate that US standards should berevised to reflect the fact that the application of ceramicfrit reduces glass strength. ASTME1300 (2012c) basesits load resistance values on weathered glass strength.Further research must be conducted to determine thedegree of strength reduction associated with ceramicfrit on weathered glass. The authors feel, even in theabsence of data associated with weathered glass withceramic enamel frit, that ASTM E1300 (2012c) shouldmandate a strength reduction for ceramic frit.
Finally, micrographs indicate that during the fusingprocess, the ceramic frit penetrates the glass surface aswould be expected. The authors felt the damage to theglass surface caused be the frit is a significant factor inthe strength reduction.
Acknowledgments The authors wish to thankViracon for pro-viding the test specimens and for making critical comments onthis article. They further applaud Viracon for taking a proactivestance in what is becoming a very contentious issue in U.S. glassdesign.
References
Abiassi, J.J.: The Strength of Weathered Window Glass UsingSurface Characteristics. NTIS Accession No. PB82-172735. Institute for Disaster Research, Texas TechUniversity, Lubbock (1981)
ASTM E998: Standard Test Method for Structural Performanceof Glass in Windows, Curtain Walls, and Doors Underthe Influence of Uniform Static Loads by NondestructiveMethod. ASTM, West Conshohocken (2012a)
ASTMC1048: StandardSpecification forHeat-Strengthened andFully Tempered Flat Glass. ASTM, West Conshohocken(2012b)
ASTM E1300: Standard Practice for Determining the LoadResistance of Glass in Buildings. ASTM, West Con-shohocken (2012c)
Brown, W.G.: A Practicable Formulation for the Strength ofGlass and Its Special Application to Large plates. Pub. No.NRC 14372. National Research Council of Canada, Ottawa(1974)
123
276 M. Bergers et al.
Beason, W.L.: A Failure Prediction Model for Window Glass.NTIS Accession No. PB81-148421. Institute for DisasterResearch, Texas Tech University, Lubbock (1980)
EN 1863-2: Glass in Building—Heat Strengthened Soda LimeSilicate Glass—Part 2: Evaluation of Conformity/ProductStandard. BSI, Brussels (2004)
Justel, A., Pena, D., Zamar, R.: A multivariate Kolmogorv-Smirnov test of goodness of fit. Stat. Probab. Lett. 35(3),251–259 (1997)
Kanabolo, D.C., Norville, H.S.: The Strength of New Win-dow Glass Plates Using Surface Characteristics. NTISAccession No. PB86-140100. Glass Research and TestingLaboratory, Texas Tech University, Lubbock (1984)
Krall, W.R., Siskos, W.R., Spindler, R.G., Stewart, R.A.: TheBehavior of Float Glass Under Uniform Windloading.In: Preprints of Fourth U.S. National Conference onWind Engineering Research, pp. 155–159. University ofWashington, Seattle (1981)
Krampe, P.: Zur Festigkeit emaillierter Gläser. PhD-thesis,Technische Universität, Dresden (2013)
Krohn, M., Hellmann, J., Shelleman, D., Pantano, C., Sakoske,G.: Effect of enameling on the strength and dynamic fatigueof soda-lime-silica float glass. J. Am. Ceram. Soc. 85(10),2507–2514(2002)
Natividad, K., Morse, S.M., Norville, H.S.: Tests of heat treatedglass with ceramic frit. J. Arch. Eng. ASCE (in review)
Norville, H.S., Minor, J.E.: The strength of weathered windowglass. Bull. Am. Ceram. Soc. 64(11), 1467–1470 (1985)
Pettitt, A.N.: A two-sample Anderson-Darling rank statistic.Biometrika 63(1), 161–168 (1976)
prEN 13474: Glass in Building—Determination of the Strengthof Glass Panes by Calculation and Testing. BSI, Brussels(2012)
Schmidt, A.: Silkscreen glass: energy performance and esthetics.Constr. Can. 49, 4 (2007)
Vallabhan, C.V.G., Wang, B.Y.-T.: Nonlinear Analysis ofRectangular Glass Plates by Finite Difference Method.NTIS Accession No. PB82-172552. Institute for DisasterResearch, Texas Tech University, Lubbock (1981)
Weibull, W.: A Statistical Theory of the Strength of Mate-rials. Handlinger NR 151. Royal Technical University,Stockholm (1939)
123