full text 01
DESCRIPTION
paperTRANSCRIPT

Energy Conversion and Management 94 (2015) 300–310
Contents lists available at ScienceDirect
Energy Conversion and Management
journal homepage: www.elsevier .com/locate /enconman
Performance study of ejector cooling cycle at critical mode undersuperheated primary flow
http://dx.doi.org/10.1016/j.enconman.2015.01.0390196-8904/� 2015 Elsevier Ltd. All rights reserved.
⇑ Corresponding author.E-mail address: [email protected] (B. Tashtoush).
Bourhan Tashtoush a,⇑, Aiman Alshare b, Saja Al-Rifai a
a Mechanical Engineering Department, Jordan University of Science and Technology, Jordanb Mechanical and Maintenance Engineering Department, German Jordanian University, Jordan
a r t i c l e i n f o a b s t r a c t
Article history:Received 5 November 2014Accepted 14 January 2015
Keywords:Air-conditioningEjectorRenewable energyRefrigerantsCooling cycleTRNSYSEES
In this work the performance of the ejector cooling cycle is investigated at critical mode, where, theeffects of ejector geometry, refrigerant type, and operating condition are studied. The ejector coolingcycle is modeled with EES Software. The mass, momentum, and energy conservation principles areapplied to the secondary and primary flows to investigate the performance of the ejector cooling cycleunder superheated primary flow.
The refrigerant R134 a is selected based on the merit of its environmental and performance character-istics. The primary working fluid in the refrigeration cycle is maintained at superheated conditions foroptimal ejector performance. The solar generator temperature ranges are 80–100 �C. The operating tem-perature of evaporator range is 8–12 �C and the optimal condensation temperature is in the range of 28–40 �C. It is found that constant-pressure mixing ejector generates higher backpressure than constant-areamixing ejector for the same entrainment ratio and COP. The type of ejector is selected based on the per-formance criteria of the critical backpressure and choking condition of the primary flow, the so called EJ2type ejector meets the criteria. The COP is found to be in the range of 0.59–0.67 at condenser backpres-sure of 24 bar due to higher critical condenser pressure and higher generator temperature.
� 2015 Elsevier Ltd. All rights reserved.
1. Introduction
Demands on refrigeration and air conditioning have beenincreased in recent years. The increased demand on electricalenergy for refrigeration and air conditioning combined with the riseof oil prices encouraged researchers to investigate the possibility ofreplacing the high cost fossil fuels energy with renewable energyresources such as solar energy. This strategy will reduce the depen-dence on fossil fuel resources and contribute to conservation ofboth efficient use of energy resources and reduction of CO2 emis-sions [1–4]. In the past, an ejector was used in the steam jet coolingin HVAC systems for commercial buildings. The mechanical com-pressor systems in the vapor compression cycle were replaced bysteam jet cooling systems [5]. Nowadays, ejector cooling system(ECS) is of high significance due to its special specifications, i.e.low cost, simple system design, simple installation and operation,and can be run by a low thermal grade source such as solar energy.
Several mathematical models were developed to study 1-D ejec-tor system with analysis and fluid dynamics theories applied to theprimary and secondary flow [6–14]. The 1-D model was initially
developed by Keenan et al. [6]. In this model, the pressure of pri-mary and secondary flows was assumed equal at the nozzle exit,and the mixing of the two fluids starts at the inlet of the constantarea section. Huang et al. [7–9] used this 1-D model to study 11 dif-ferent ejectors geometry to select an optimal ejector dimensionwith the highest COP and using R141b as working fluid. Sun andEmes [10] presented a computer simulation model for ejectorrefrigeration systems that was developed using an existing ejectortheory. Their model assumes internal irreversibilities within theejector to be included and caters for the addition of a regeneratorand a precooler for improving the system coefficient of perfor-mance. Sun [11] analyzed the effect of ejector geometries on perfor-mance. Technical data including flow rates, entrainment ratio andejector geometry were provided for a 5 kW steam-jet refrigerator.Later, Sun [12] studied the characteristics of the experimental ejec-tor in a steam refrigeration system over a range of evaporator tem-peratures from 5 to 15 �C, boiler temperatures from 95 to 135 �C,and condenser pressures from 23.37 to 53.18 mbar. He found thatwhen increasing the boiler temperature, the entrainment ratio firstincreased and then decreased.
Jia and Wenjien [13] selected the 1-D model to evaluate the effectof the COP, entrainment ratio and cooling capacity. Zhu et al. [14]presented a computational fluid dynamics (CFD) technique to inves-
Nomenclature
A3 area of mixing chamber, m2
At area of nozzle throat, m2
A primary flow location at the inlet of the nozzlea speed of around, m/sD diameter, mCp specific heat at constant pressure, kJ/kg KCv specific heat at constant volume, kJ/kg KH enthalpy at inlet conditions, kJ/kgM mach numberPc condenser backpressure, barPcrit critical backpressure, barPe evaporator pressure, barPg generator pressure, barQg generator heat transfer rate, kWR gas constant, kJ/kg Krp compression ratio, pressure ratio between condenser
and evaporator pressureT temperature, �CTg generator temperature, �CTc condenser temperature, �CTcrit critical condenser temperature, �CTe evaporator temperature, �Cmp mass flow rate of primary fluid, kg/sms mass flow rate of secondary fluid, kg/s1-D one dimensionalCFD computational fluid dynamic tools
COP coefficient of performanceCFC chlorofluorocarbonEES engineering equation solverODP ozone depletion potentialECS ejector cooling systemGWP global warming potential
Greek symbolsx entrainment ratiog efficiencyV specific heat ratio, Cp/Cv
Um coefficient of heat losses
Subscript1–6 refers to Fig. 2e evaporatorc condenserg generatoris isentropicp primary flowP1 primary nozzle exitPy primary flow at section y–ys secondary flowsy secondary flow at section y–ym mixing section m–m
B. Tashtoush et al. / Energy Conversion and Management 94 (2015) 300–310 301
tigate the effects of two important ejector geometry parameters;namely the primary nozzle exit position and the mixing section con-verging angle, on the ejector performance. The optimum position ofprimary nozzle was studied by using 1-D model.
Recently, CFD tools were used to model different modes of ejec-tor operation, ranging from on-design to chocking (maximumcapacity) to even complete malfunctioning when the primary flowis reversed and rejected at the inlet of the secondary flow. In addi-tion, CFD were used to predict the shock-induced flow separation,the performance, and mixing quality, which can efficientlyimprove the ejector design [15]. Other research works experimen-tally investigated the effects of ejector geometry and operatingcondition on the ejector performance. In a two part study of asteam ejector cooling cycle Sriveerakul et al. [16,17] investigatedthe use of CFD to predict the performance of a steam ejector usedin refrigeration applications. They found that the CFD results pre-dicted the ejector performance and agreed with the resultsobtained from the experiments. Also, Vargaet et al. [18] a 2-D axi-symmetric model to investigate the performance of a steam ejectorcooling system powered by solar energy. Yan et al. [19] used a CFDmodel to evaluate the influence of various geometry parameters onthe performance of an air-cooled ejector cooling system and pro-vide an optimal design. In an experimental and computationalstudy, Zhang et al. [20] analyzed the ejector performance. It wasfound that a diffuser angle of 8 degrees and the distance of nozzleexit to mixing chamber of 23 mm and the diffuser length of 88 mmhas the best performance. The CFD can predict not only ejector per-formance, but also gives a better understanding of ejector processsuch as mixing and flow configuration. However, the CFD modelsfailed to predict subcritical operation [21], the discrepancies wereabout 40–50%. In general, CFD method is considered a complexmethod, consumes time, and requires a suitable turbulence modeland a suitable grid size. Whereas, 1-D model is considered rapid,cheap, and can predict overall ejector performance operationalmodes easily in comparison to CFD method.
Cardemil and Colle [22] developed a theoretical ejector modelto evaluate the performance of vapor ejectors operating in criticalmode. They used three different working fluids to evaluate theeffectiveness of the model and compare it with available experi-mental data. The steam jet refrigeration system with constant areaand variable area ejectors was presented by Chandra and Ahmed[23]. They found that stable operation of the steam jet refrigerationsystem can be obtained at low boiler temperature and supersonicejector can enhance the performance of the system by eliminatingthe shock from the ejector. Zhu and Jiang [24] investigated theshock structure and entrainment ratio for convergent and conver-gent–divergent nozzle ejectors. They found that as the shock wavewavelength is increased the entrainment performance willdecrease. Soroureddin et al. [25] presented a thermodynamic anal-ysis of employing ejector and organic Rankine cycles for differentconfigurations.
Several studies on ejector cooling cycle performance using envi-ronmentally friendly refrigerants were carried out under differentoperating conditions. The studies extended to use different work-ing fluid, i.e. R152a, R134a, R290, R600a, R600, R717, R141b,R142b, R114 and R245fa. The result of Selvaraju and Mani [26]shows that R134a achieves high critical entrainment ratio andgood performance. Where Roman and Hernandez [27] chooseR290 as best refrigerants due to highest COP, maximum entrain-ment ratio and required least ejector area ratio, and R600 has anintermediate COP value and R600a has a smaller value. Also, isfound the SECS using R290, R134a and R152a suitable for higherpressures and more strong construction. In the experiment carriedout by Nehdi et al. [28] R717 achieved higher COP followed byR152a, R290 and R134a. Boumaraf and lallemand [29] proved thatR142b can produce better performance than R600a, because R142bconsider a heavier fluid than R600a. R142b is more efficient thanR114 [30]. Petrenko and Volvyk [31] founds that the R600 andR600a are most suitable working fluid can be used in the ejectorcycle. Water has a unique advantage when using as a working fluid

302 B. Tashtoush et al. / Energy Conversion and Management 94 (2015) 300–310
to transfer the heat through the system. The system using wateralso studied [32–34].
In the present work, the 1-D model of an ejector cooling systemand selection of the optimum conditions, equipment size and typeand operating parameters to operate the ejector cooling system iscarried out. In addition, a comparison between two ejector catego-ries, selection of working fluid, parametric analysis of the coolingcycle, and the performance of cooling cycle under superheatingof the primary flow at critical mode are investigated.
2. 1-D analysis of the ejector cooling cycle
In an ejector cooling system, the ejector is used to replace thecompressor in the traditional vapor compression cooling system.The low-grade energy source is used to drive the ejector coolingcycle in contrast to electrical energy that powers the compressioncooling cycle.
The primary flow enters the ejector through a convergent – diver-gent nozzle, which accelerates the flow coming from the generatorfrom subsonic to supersonic velocity and creates a low pressureregion at the nozzle exit. This entrains the secondary flow comingfrom the evaporator. The two streams do not mix directly at the noz-zle exit, the primary flow discharges out along with the entrainedsecondary flow and mixing starts in the constant constant-areasection of the device at a cross section labeled y–y in Fig. 1.
Fig. 1. (a) Constant-pressure mixing ejec
The ejector operates in three different modes, the critical, sub-critical and back flow modes as shown in Fig. 1(b), which describesthe relation between the critical condenser pressure and theentrainment ratio. Critical modes are more favorable in terms ofhigh entrainment ratio and enhanced ejector performance. Thebackpressure or condenser pressure is the determining factor ofejector mode. The entrainment ratio remains constant withincreasing condenser pressure until the back pressure reachesthe critical point, after which the entrainment ratio decrease rap-idly with further increase in the back pressure. The cooling capac-ity and COP remain constant when the ejector is operated underthe critical pressure mode. Further increase in the backpressureabove the critical pressure moves the normal shock wave intothe mixing zone and prevents the secondary flow from chockingand reaching sonic velocity. The drop in the momentum of the sec-ondary flow to zero results in reversing the primary flow to theevaporator and the ejector rendered dysfunctional. The ejector sys-tem attains its highest performance at the chocked mode.
The ejector cooling cycle consists of two phase heat exchangers;generator, condenser and evaporator, In addition to the constantpressure-mixing ejector, pump and expansion valve, as shown inFig. 2. The system performance is evaluated by the coefficient ofperformance COP for the cooling cycle, COP is the indicator of ther-mal system performance, which is equal to the ratio between thecooling effect (Qe) to the total energy input to the generator Qg.
tor. (b) Ejector operational mode [7].

Fig. 2. (a) Ejector cooling cycle. (b) T–S diagram of ejector cooling cycle.
Fig. 3. Variation of ejector area ratio and entrainment ratio with the criticalcondenser pressure at the nozzle inlet. At Te = 8 �C, Pe = 0.04 Mpa. (Comparisonbetween the present model and Huang et al. [7] model).
B. Tashtoush et al. / Energy Conversion and Management 94 (2015) 300–310 303
COP ¼ Q e
Q g¼ x � ðh2 � h6Þe
ðh1 � h5Þgð1Þ
Entrainment ratio and compression ratio also are importantparameters that have described the ejector system performance,these parameters related to the compressor work and coolingcapacity and directly depend on the refrigeration type and ejectorgeometry. The entrainment ratio is the ratio between the massflow rate of the secondary flow and the mass flow rate of the pri-mary flow, and the compression ratio is the pressure ratio betweencondenser and evaporator, given as:
x ¼_ms
_mpð2Þ
rp ¼Pc
Peð3Þ
2.1. Validation of ejector mathematical model and analysis of results
The mathematical model of the ejector used in this study isbased on analyzing the ejector performance at the critical modeoperation shown in Fig. 1, the principles of momentum, massand energy conservation are applied on the secondary and primaryflows through ejector [7]. Flow mixing and frictional losses aretaken into account to describe the real process in the ejector. Toverify the validity of the ejector code developed in EES, theobtained results from the ejector model were compared with pub-lished data having the same operating conditions and the sameworking fluid, [7]. After the validation, the ejector cooling systemmodel is utilized for parametric study. Fig. 3 and Table 1 showsthe results of validation.
It was found that there is a good agreement between the modelresults and the published data. The model results are sensitive tospecific heat ratio; an increase in the specific heat ratios increases
the entrainment ratio. Huang et al. [7] did not report the actualvalue of specific heat ratio that was used in their analysis. The errorpercentage compared to Huang et al. [7] theoretical results Table 1are in the range of � (0.12–11)%, except at results of ejector type(A–G) where the error percentage exceeded �11%. Nevertheless,Huang et al. [7] comparative study between theoretical and exper-imental results with the same refrigerant and same operating con-ditions, also reported similar error percentage for this ejectordimension and pressure level. Similar error range found whenthe results are compared to Huang et al. [7] experimental results.The ejector code results also checked with the results of the Chenet al. [21], the author mentioned the actual value of specific heatratio that was used in the analysis; the same value was used inthe present model. Therefore, an excellent agreement betweentheir results and model of the present study is found with an aver-age error of less than 0.5% for all configurations. Fig. 3 shows thecomparison between results for the area and entrainment ratio.
2.2. Selection of ejector
Ejectors are classified into two types depending on the positionof the nozzle; constant-pressure mixing ejector and constant-areamixing ejector, as shown in Fig. 4. In the constant-pressure mixingejector the exit plane of the nozzle is located within the suctionzone upstream of the constant area section, the static pressurethroughout the mixing zone is assumed constant. In the con-stant-area mixing ejector, the primary nozzle exit is located inthe constant area section, where the mixing of the primary andsecondary flows occurs and the pressures of the two streams arenot equal, [29].
Depicted in Fig. 5 is the relationship between the entrainmentratio and the back pressure at different generator temperatures.It can observed that for the ejector with a fixed geometry, theincrease in the generator temperature and saturation pressure willcause a decrease in the entrainment ratio and the COP, and it willincrease the backpressure. The dashed lines describe the ejectormode, where the entrainment ratio remains constant until thebackpressure reaches the critical point. After this point, if the back-pressure increases, the shock wave will penetrate the mixing sec-tion and the secondary flow will be chocked to a stop. This is thereason behind the decrease of the entrainment ratio. Similar valuesof entrainment ratio are obtained at a given generator temperaturefor both ejector types, however, in the constant area mixing ejectorlower backpressure values are expected in comparison to the con-stant pressure mixing ejector.
Fig. 6 shows the difference between the two types of ejectors. Inthe case of a constant pressure mixing ejector, the normal shock

Table 1Comparison results at Te = 8 �C, Pe = 0.040 MPa.
⁄ Tg
(K)pg
(kPa)Present studyentrainment ratio
Huang et al.model results [7]
Huang et al.experiment results [7]
Chen et al.results [21]
Error % Huang et al.theoretical
Error % Huang et al.experiment
Error %Chen et al.
A–A 368 604 0.156 0.1554 0.1859 0.1595 0.386 �16.083 1.317363 538 0.2023 0.2156 0.2246 0.205 �6.168 �9.928 �0.517357 465 0.2691 0.2880 0.288 0.2705 �6.562 �6.562 0.028351 400 0.3492 0.3525 0.3257 0.3491 �0.936 7.215 �0.805
A–B 363 538 0.2463 0.2093 0.2718 0.2483 17.677 �9.381 �0.218357 465 0.3195 0.3042 0.3117 0.3202 5.029 2.502 0.246351 400 0.4073 0.442 0.3922 0.4063 �7.850 3.850 �0.838
A–G 368 604 0.2484 0.2144 0.2552 0.2505 15.85 �2.664 �0.358363 538 0.3054 0.2395 0.304 0.3065 27.515 0.460 0.103357 465 0.3874 0.3704 0.3883 0.387 4.589 �0.231 0.455351 400 0.4855 0.4609 0.4393 0.4833 5.337 10.516 �0.517
A–C 368 604 0.2883 0.2983 0.2814 0.2898 �3.3523 2.452 �0.114363 538 0.3499 0.3552 0.3488 0.3503 �1.4921 0.315 0.274357 465 0.4385 0.4605 0.4241 0.4373 �4.777 3.395 0.572351 400 0.5444 0.5966 0.4889 0.5413 �8.749 11.352 �0.0542
A–D 368 604 0.3691 0.3476 0.3457 0.3693 6.185 6.768 0.227363 538 0.44 0.4178 0.4446 0.439 5.313 �1.034 0.519357 465 0.5418 0.5215 0.5387 0.539 3.892 0.575 0.744351 400 0.6635 0.6944 0.6627 0.6586 �4.449 0.120 0.744
Fig. 4. (a) Constant-pressure mixing ejector and (b) constant-area mixing ejector.
0.0
0.2
0.4
0.6
0.8
1.0
1.2
1.4
1.6
30 31 32 33 34 36 40 51 59 68 79 90
Ent
rain
mne
t rat
io
Condenser back pressure pc , Kpa
Tg=60 ° c Tg=60 ° c
70° c 70° c
80° c
90° c
110° c
80° c
90° c100° c
110° c
Constant pressure-mixing ejectorConstant area-mixing ejector
100° c
Fig. 5. Entrainment ratio vs. condenser back pressure at different generator temperature-saturation pressure, for R141b at Te = 8 �C and Pe = 40 kPa.
304 B. Tashtoush et al. / Energy Conversion and Management 94 (2015) 300–310
wave raises the pressure to a higher level than the constant area-mixing ejector. In the case of constant area-mixing ejector, thebackpressure does not rise significantly nor does the generatortemperature. For this reason, constant pressure-mixing ejectorcan achieve higher compression ratio than the constant area mix-ing type. Furthermore, an increase in the generator temperature, Tg
results in a significantly higher compression ratio for the constantpressure mixing ejector type in contrast to the constant areamixing type. Although both ejectors types can achieve the sameentrainment ratio and COP at the same operating conditions, how-
ever, the constant pressure-mixing ejector can achieve higherbackpressures and higher pressure ratios than the constant area-mixing ejector. It is well known that the backpressure is the deter-mining factor of ejector mode to be maintained in superheatingconditions and avoid any possible condensation. Therefore, con-stant-pressure mixing ejector is more promising than the constantarea-mixing ejector, because it generates better critical and back-pressure as well as compression ratio for the same entrainmentratio and COP. In the present study, the constant pressure mixingejector model will be adopted.

0.0
0.5
1.0
1.5
2.0
2.5
3.0
0
20
40
60
80
100
120
140
160
180
60 65 70 75 80 85 90 95 100 105 110
Com
pres
sion
rat
io (r
p) a
nd C
OP
Con
dens
er b
ack
pres
sure
(Pc)
Kpa
Tg, °c (at stauration pressure)
Constant area mixing
Constant pressure mixing
Pc
Pc
rp
rp
COP for both ejector type
solid lines: PcDash lines :rpDots line:COP
Fig. 6. Back pressure and compression ratio for both constant pressure mixing andconstant area mixing ejectors type at the same condition, for R141b.
B. Tashtoush et al. / Energy Conversion and Management 94 (2015) 300–310 305
2.3. Selection of working fluid
The performance of the cooling cycle depends mainly on therefrigerant type. The selection criteria of the refrigerant dependon its thermodynamic characteristic and include environmentalimpact (low ozone depletion potential ODP and low global warm-ing potential GWP), safety, economic, and availability. Two catego-ries of working fluid can be considered in the selection; the dryvapor (i.e. R600a, R123, and R141b) and wet vapor (i.e. R134aand Steam). No phase change occurs for the dry vapor during theexpansion process. In contrast, when using wet vapor fluid whichmay forms mall droplets at the nozzle exit and subsequentlyadheres into the nozzle wall, which results in reducing the effec-tive area, and adversely affects the ejector performance. Hence,dry vapor is more favorable than wet vapor fluid. The problem ofdroplet formation of wet refrigerant can be eliminated by havingsuperheated primary fluid enter the ejector. However, a workingsuperheated generator fluid raises the COP and decreases the ejec-tor efficiency slightly. Using chlorofluorocarbon CFC (R11, R12,R113, R114, R115) in the ejector cooling cycle will eliminate theneeds for high generator temperature and pressure. Unfortunately,these types of refrigerants have high ODP and GWP and thereforenot recommended.
Fig. 7 shows the saturated temperature-absolute pressure curvefor different working fluids, which are candidates to be utilized in
0.0
5.0
10.0
15.0
20.0
25.0
30.0
35.0
40.0
45.0
60 65 70 75 80 85
Satu
ra�o
n Pr
essu
re, B
ar
Tg ° C, at satura�on pressu
Fig. 7. Saturated pressure and entrainment ratio vs. generator temp
the ejector cooling cycle. Detailed analysis of the ejector coolingcycle is carried out by using different working fluids such asR717, R134a, R600, R600a, R141b, R152a, R290 and R123 as shownin the Fig. 7. Refrigerants with a smaller value of molar massrequired for the same system capacity to operate with ejector cool-ing cycle, the molar mass in g/mol for the candidate refrigerants asfollows: R717 (17.02), R134a (102.3), R600 (58.12), R600a (58.12),R141b (116.9), R152a (66.05), R290 (44.097) and R123 (152.93).The generator temperature and pressure are one of the determin-ing factors of the system COP. It can be seen that increasing theabsolute pressure for the various refrigerants will increase theCOP and entrainment ratio of the cooling cycle, as shown in Figs. 7and 8. Whereas, the increase in the generator temperature and sat-uration pressure together will decrease the entrainment ratio. Theejector performance differs according to the working fluid type.The highest entrainment ratio, x values and COP corresponds toejector cooling cycle used R717 and the lowest correspond to theejector cycle with R123 and R141b as refrigerants. The ejectorsusing refrigerants R152a, R134a have almost the same x valuesand COP and are less than the values for the cycle used refrigerantR290. Also, the x values and COP of the cycle eighth R600 andR600a as refrigerants are lower than that of ejector cooling cycleswith R152a and R134a as refrigerants and higher than the values ofthe cycle with R123 and R141b as refrigerants. Among investigatedrefrigerants; R717, R290, R152a and R134a are shown to yield abetter performance and COP due to higher absolute pressure.
As shown in Figs. 7 and 8, Ammonia, R717, has the highestentrainment ratios COP, respectively. It has been used in industrialapplications and is generally acknowledged as being the most effi-cient refrigerant. It has a low boiling point, good transport proper-ties, good thermodynamic properties and is favored because it ishighly energy efficient refrigerant which also has minimal environ-mental impact, having zero ozone depletion potential ODP and zeroglobal warming potential GWP. However; R717 is slightly flamma-ble and a toxic refrigerant and therefore it is not suitable for smallscale refrigerant systems or domestic cooling systems. In addition,these figures show that the refrigerant R290 has a favorable entrain-ment ration and COP. It is known that this refrigerant has no ODPand minimal GWP. The maximum generator temperature can beused for ejector work with R290 about 95 �C, because it has a criticaltemperature and pressure equal to 96.7 �C and 42.48 bar, respec-tively. Also, R290 needs high pressures and will robust constructionin comparing to other refrigerants. R290 has low backpressure and
0.0
0.2
0.4
0.6
0.8
1.0
1.2
1.4
1.6
1.8
90 95 100
re
R134a
R152a
R290
R141b
R123
R600a
R600
R717
erature of some interesting working fluid, at Te = 8 �C, Tc = Tcrit.

0.00
0.20
0.40
0.60
0.80
1.00
1.20
1.40
1.60
1.80
0.00
10.00
20.00
30.00
40.00
50.00
60.00
60 65 70 75 80 85 90 95 100
COP
Tcrit
Tg ° C, satura�on pressure
R152a
R290
R141b
R123
R600a
R600
R717
R134a
Solid lines: TcritDashed lines :COP Tcrit
COP
Fig. 8. Tcrit and COP of cooling cycle vs. generator temperature of some interesting working fluid, at Te = 8 �C, Tc = Tcrit.
306 B. Tashtoush et al. / Energy Conversion and Management 94 (2015) 300–310
small differences between the critical and backpressures. Unfortu-nately, R290 is highly flammable and must only be used after carefulconsideration is given to safety, therefore, it will not be selected inthis work. R152a and R134a are a single hydro fluorocarbon orHFC compound. It has no chlorine content, no ODP, and only a mod-est GWP. R134a and R152a are suitable for ejector cooling cyclemore than other refrigerants due to their high COP and x valuesas shown in Figs. 7 and 8. R134a has a critical temperature of101.1 �C and low boiling point of 26.5 �C, while the critical temper-ature for R152a is 114 �C and the boiling point is �25 �C. Since theentrainment ratio for R134a is higher than that of R152a and theboiling point for R134a is higher, the refrigerant R134a will be con-sidered as the e working fluid for the cooling cycle in this study.
From Figs. 7 and 8, it can be seen that the difference betweenthe COP of various refrigerants and the corresponding entrainmentratio is small. Since the COP is a function of the entrainment ratio,x (Eq. (1)), and the effect of the enthalpy differences is less thanthat of the entrainment ratio, hence the COP values are dominatedby the x.
Fig. 9 shows how the primary flow rate increases with increas-ing generator temperature and pressure. At constant coolingcapacity the secondary flow _ms remains constant. As the Tg
increases, the pressure of primary fluid increases as well as theenthalpy. Which creates the required suction of the same amountof secondary flow at the lowest amount of primary flow _mp, result-ing in an increase in entrainment ratio and COP. This explains thereduction in the required primary flow for the refrigerants thathave highest COP and x. For the selected refrigerant R134a, itcan be seen from Fig. 9 that the primary mass flow rate is between0.08 kg/s and 0.175 kg/s in the operating range of the generatortemperature.
0.00
0.05
0.10
0.15
0.20
0.25
0.30
0.35
0.40
0.45
60 65 70 75 80 85 90 95 100
Prim
ary
mas
s flo
w r
ate
mg,
kg/
s
Tg ° C, saturation pressure
R134a R152a
R290 R141b
R123 R600a
R600 R717
Fig. 9. Primary mass flow rate vs. generator temperature of some interestingworking fluid, at Te = 8 �C, Tc = Tcrit, cooling capacity = 7 kW.
2.4. Parametric analysis of ejector cooling cycle using R134a as arefrigerant
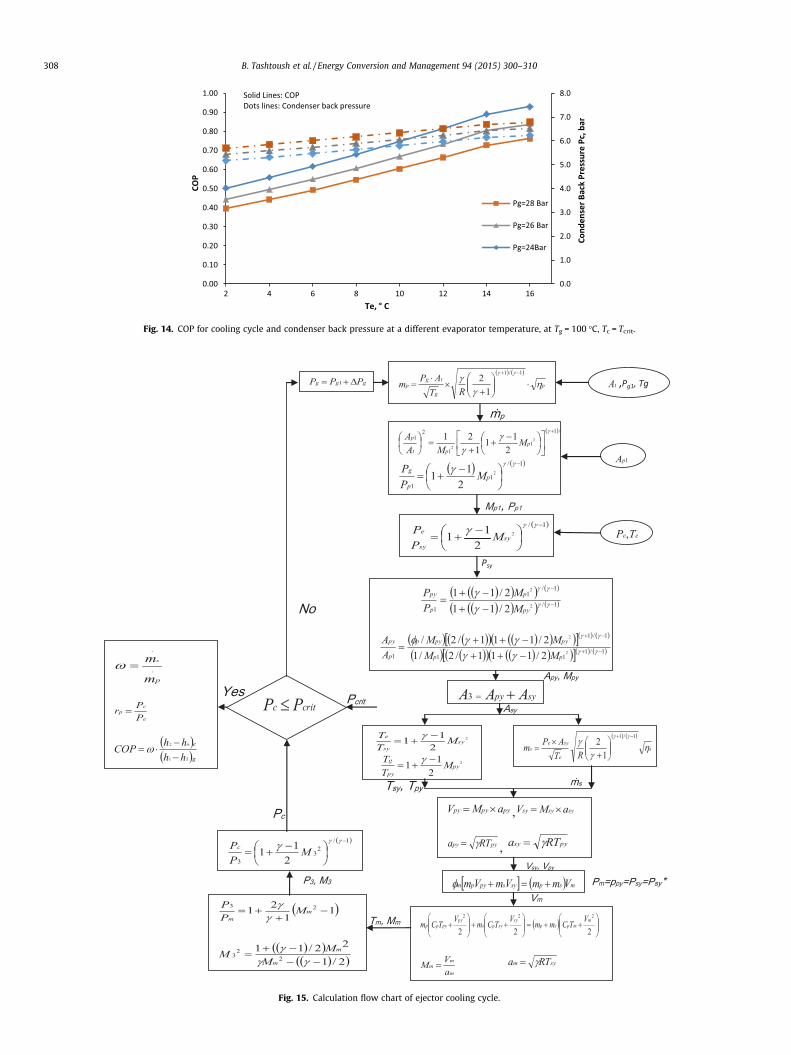
Parametric analysis of the ejector cooling cycle is carried outusing R134a as a working fluid. The mathematical model was writ-ten using the EES program to perform all calculations. Fig. 15 in theappendix shows the flow chart of the ejector mathematical 1-Dmodel following the model proposed by Huang et al. [7]. The crit-ical and back pressures are both calculated theoretically to deter-mine the required generator pressure, to operate under criticalmode for the given ejector dimension. The main purpose of thismodel is to determine the ejector cooling cycle performance overa different operating conditions for fixed ejector dimensions. Inthe analysis, the loss coefficients at section y–y as shown inFig. 1, constant pressure ejector type, are set equal to the defaultvalues that were suggested by Huang et al. [7]. The available refrig-erant properties, stored in the EES data bank, are incorporated inthe program. The program runs with a given set of the input values,including nozzle efficiency, diffuser efficiency, gas constant, spe-cific heat ratio, and operating temperatures for ejector coolingand heating cycles; generator temperature, condenser tempera-ture, and evaporator temperature. The condenser temperature isset to be equal to the critical condenser temperature Tcrit in allcalculations.
2.4.1. Effect of generator pressureThe ejector mathematical model depends on three major parts:
primary nozzle, suction zone, and constant area section. Two ejec-tor geometries are selected to study the performance of coolingcycle at critical mode, the selection criteria of ejector geometryare based on the COP and the critical backpressure. Vidal et al.[35] studied the performance characteristics of the ejector dimen-sions to meet the cooling cycle requirements. He found that thegeometric dimensions of ejector type EJ2 are calculated accordingcooling load capacity. They used ejector type EJ2 with the specifi-cations and dimensions given in Table 2. In addition, Huang et al.[7,9] studied experimentally and theoretically ejector type EJ1 witha cooling capacity of 10 k W and with the specifications shown in
Table 2Ejector geometry.
Ejector specification EJ1 (mm) EJ2 (mm)
Throat diameter 2.64 9.16Exit diameter 4.5 15.6Constant area section diameter 8.10 22.5

0.0
10.0
20.0
30.0
40.0
50.0
60.0
18 21 24 27 30 33 36 40
Tcrit
, °C
Pg, bar
Te=8° C, Tg=100° C, R134a
EJ1
EJ2
Fig. 10. Critical condenser temperature at different generator pressure, at Te = 8 �C,Tg = 100 �C, R134a.
0.0
2.0
4.0
6.0
8.0
10.0
12.0
14.0
16.0
9 12 15 18 21 24 27 30 33 36 39
Bar
Pg, Bar
Pbc
Pcrit
Te=8° c, Tg=100° c, R134a
Fig. 11. The behavior of critical backpressure and back pressure at different level ofgenerator pressure for EJ2, at Te = 8 �C, Tg = 100 �C, R134a.
0.0
0.5
1.0
1.5
2.0
2.5
60 65 70 75 80 85 90 95 100
COP
Tg ° C
Ideal cycle
Actual cycle
Pg=24 bar
Pg=24 bar
26 bar
26 bar
28 bar
28 bar
Fig. 13. COP of cooling cycle at different generator temperature and superheatingpressure, at Te = 8 �C, Tc = Tcrit, EJ2.
B. Tashtoush et al. / Energy Conversion and Management 94 (2015) 300–310 307
Table 2. The two ejector types can meet the cooling load require-ment of this study. However, the superheating of primary fluid isvery important in case of using wet working fluid, R134a. An ejec-tor geometry that can be operated under superheated generatorpressure will be selected to avoid potential condensation condi-tions and droplet formation that may occur on the nozzle wallsas explained earlier. In addition, the performance of the two typesof ejectors in terms of critical condenser temperature and back-pressure will be investigated to find the best choice of these twoejectors.
The performance of the ejector cooling cycle is dominated bytwo parameters; the amount of secondary fluid entrained to the
0.00
0.02
0.04
0.06
0.08
0.10
0.12
0.14
0.16
0.0
0.5
1.0
1.5
2.0
2.5
9 12 15 18 21 24 27 30 33 36 39
Mas
s Flo
w ra
te, K
g/s
Ra�o
, dim
insi
onle
ss
Pg, Bar
Fig. 12. The behavior of entrainment ratio x, compression ratio rp and mass flowrate of primary flow _mp and secondary flow _ms at different level of generatorpressure and Tg = 100 �C.
mixing zone and the momentum of the mixed fluid. The primaryflow decreases when the generator pressure decreases, resultingin an increase in the secondary flow, which increases the COPand the cooling capacity. The momentum of the mixed flow alsowill decrease, which reduces the critical backpressure. An increasein the evaporator pressure will increase the critical backpressure.Thus, the mass flow rate through the mixing zone will increaseand consequently the COP will increase.
The critical pressure is a function of the convergent–divergentnozzle (primary nozzle). When the mach number equals unity,the throat pressure is equal to the critical pressure. The criticalcondenser temperature, Tcrit is the saturation temperature of thecritical pressure; the condensing temperature is set equal to thecritical temperature. Fig. 10 shows the critical condenser tempera-ture for both types of ejector at different generator pressure. Thebest condensation temperature for the cooling cycle is found tobe in the range of 28–40 �C. This range can be achieved for ejectorEJ1 at generator pressure above 33 bar. In the case of using ejectortype EJ2, the pressure of the superheated vapor is in the range of(23–29) bar, which is sufficient to reach the condensation condi-tion. Therefore, EJ2, which has a larger dimension, is more suitablefor working under superheating condition of primary flow.
The ejector function is strongly dependent on the backpressureor the condenser pressure. In order to maintain the ejector func-tionality is essential to provide adequate condenser cooling. Thebackpressure and critical pressure for ejector type EJ2are shownin Fig. 11. It can be observed that the backpressure is well belowthe critical pressure and difference between the two pressuresgrows larger as the generator pressure increases, which indicatesthat the ejector function normally at the critical mode.
A change in the operating temperature in any of the three maincycle components, generator, condenser and evaporator, will affectthe performance of the ejector system and ultimately the overallperformance of the cooling cycle. Therefore, evaluation of theCOP, entrainment ratio and compression ratio of the system at dif-ferent operating conditions will follow.
The primary flow coming from the generator is choked at thenozzle throat. The amount of choked flow rate is influenced bythe generator pressure. Whereas this pressure increases thechocked flow rate increases rapidly. The secondary flow rate slightincreases with generator pressure as a result of the increase in theprimary flow. The entrainment ratio will decrease as a result of theincrease in the generator pressure, which indicative of rising criti-cal pressure. But the increases generator pressure will increase incompression ratio, as shown in Fig. 12.
It can be seen from Fig. 13 that the maximum COP of the ejectorcooling cycle is considerably less than the ideal COP for Carnotcycle. The low entrainment ratio affects the overall performanceof the ejector cycle. Low ejector efficiency is the reason behind
0.0
1.0
2.0
3.0
4.0
5.0
6.0
7.0
8.0
0.00
0.10
0.20
0.30
0.40
0.50
0.60
0.70
0.80
0.90
1.00
2 4 6 8 10 12 14 16
Cond
ense
r Bac
k Pr
essu
re P
c, b
ar
COP
Te, ° C
Pg=28 Bar
Pg=26 Bar
Pg=24Bar
Solid Lines: COPDots lines: Condenser back pressure
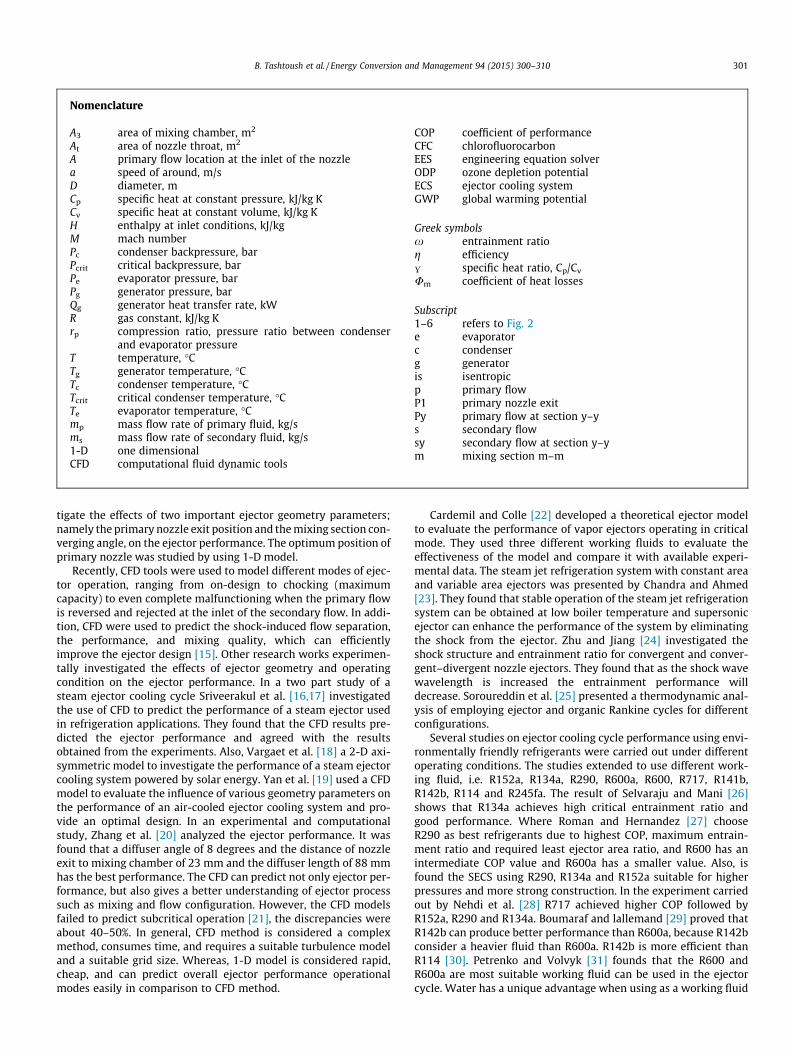
Fig. 14. COP for cooling cycle and condenser back pressure at a different evaporator temperature, at Tg = 100 �C, Tc = Tcrit.
Fig. 15. Calculation flow chart of ejector cooling cycle.
308 B. Tashtoush et al. / Energy Conversion and Management 94 (2015) 300–310

B. Tashtoush et al. / Energy Conversion and Management 94 (2015) 300–310 309
the large discrepancies between the actual and ideal entrainmentsratios and COP. A great amount of kinetic energy is lost in mixingprocess when the high velocity-primary flow entrains the lowvelocity-secondary flow. Also, the kinetic energy is lost throughthe shock wave, and the mixed gas experienced an increase in itsentropy due to a decrease in its available energy. The COP is lowerat higher generator pressure due to lowering of entrainment ratio,and the critical back pressure is higher to maintain the ejectorfunction. The COP increases significantly at the generator temper-ature between 85 and 100 �C. The heights COP is in the range of0.59–0.67 at Pg = 24 bar due to higher critical condenser pressureand higher generator temperature, this referred to the decreasesthe required amount of primary flow to entrain the same amountof secondary flow at higher temperature, where the COP did notshow any significant change in generator temperature less than85 �C.
The variation of the COP and condenser backpressure withevaporating temperature is shown in Fig. 14. It is found that at dif-ferent generator pressures the entrainment ratio increases withincreasing evaporating temperature. At the higher evaporatingtemperature and pressure the value of entrainment ratio and con-denser backpressure also are higher. This is because a smallamount of primary vapor is required and is sufficient to create suc-tion and entrain the required quantity of secondary vapor in theejector. Further, it is seen that at lower generator pressure theentrainment ratio is higher. For instance, increasing the evaporatortemperature from 8 �C to 12 �C at a generator temperature of100 �C will increase the COP of ejector cooling cycle from 0.508to 0.6143, as shown in Fig. 14. For instance, increasing the genera-tor temperature from 90 �C to 100 �C at a 8 �C evaporator temper-ature will decrease the COP of ejector cooling cycle from 0.59 to0.67, as shown in Fig. 13. Therefore, the change of the generatortemperature has a lesser effect on the performance of the systemin comparing to the evaporator and condenser temperatures. Actu-ally, the desired evaporator temperature range to achieve coolingand heating purposes is in the range 7–12 �C, where the COP0.48–0.7 for cooling cycle.
3. Conclusion
The 1-D analysis of the ejector cooling system using R134a isstudied. Analysis of the ejector performance at the critical modeis studied by applying the principle of momentum, mass andenergy conservation principles on the secondary and primaryflows. Constant-pressure mixing ejector is better than constant-area mixing ejector, because it generates better backpressure andcompression ratios for the same entrainment ratio and COP, whichgenerates better performance of the cooling cycle.
Characteristics of the cooling cycle are studied for various kindsof working fluids. There are various refrigerant type candidates forthe ejector cooling system. The environmental constraints restrictthe use of some refrigerants that are used in HVAC system for res-idential and commercial buildings. Dry vapor is better than wetvapor since there is no phase change during the expansion process.Therefore, superheating of primary fluid is very important in caseof using wet working fluid such as R134a, because the possibilityof condensation of the vapor through the isentropic expansion willseriously affect the ejector performance and gas dynamic processin the ejector.
Parametric analysis of the ejector cooling system using R134awas carried out. The COP of the system is influenced strongly byoperating temperatures and pressures. The primary flow decreaseswhen the generator pressure decreases, resulting in an increase inthe secondary flow, which increases the COP and the coolingcapacity. The momentum of the mixed flow will decrease, which
reduce the critical back pressure. The best range of condensationtemperature is 28–40 �C, which can be achieved at the generatorpressure in the range of 23–29 bar for ejector EJ2, to ensure theejector work under superheating condition. The system COP is inthe range of 0.57–0.8 at 100 �C generator temperature, 24–27 bargenerator pressure and 8–12 �C evaporator temperature.
Acknowledgement
The present study was supported by Scientific Research SupportFund, Jordan, through Grant No. ENE/02/02/2012.
Appendix A. Calculation flow chart of ejector cooling cycle
Fig. 15.
References
[1] Fong KF, Chow TT, Lee CK, Lin Z, Chan LS. Comparative study of different solarcooling systems for buildings in subtropical city. Sol Energy2010;84(2):227–44.
[2] Chidambaram LA, Ramana AS, Kamaraj G, Velraj R. Review of solar coolingmethods and thermal storage options. Renew Sustain Energy Rev2011;15(6):3220–8.
[3] Fong KF, Chow TT, Lin Z, Chan LS. Simulation–optimization of solar-assisteddesiccant cooling system for subtropical Hong Kong. Appl Therm Eng2010;30:220–8.
[4] Bilgili M. Hourly simulation and performance of solar electric-vaporcompression refrigeration system. Sol Energy 2011;85:2720–31.
[5] Chunnanond K, Aphornratana S. Ejectors: applications in refrigerationtechnology. Renew Sustain Energy Rev 2004;8:129–55.
[6] Keenan H, Neumann EP, Lustwerk F. An investigation of ejector design byanalysis and experiment. ASME J Appl Mech Trans 1950;72:299–309.
[7] Huang B, Chang J, Wang C, Petrenko V. A 1D analysis of ejector performance.Int J Refrig 1999;22:354–64.
[8] Huang BJ, Chang JM. Empirical correlation for ejector design. Int J Refrig1999;22:379–88.
[9] Huang BJ, Chang JM, Petrenko VA, Zhuk KB. A solar ejector cooling systemusing refrigerant R141b. Sol Energy 1998;64:223–6.
[10] Sun DW, Emes IW. Performance characteristics of HCFC-123 ejectorrefrigeration cycles. Int J Energy Res 1996;20:871–85.
[11] Sun DW. Variable geometry ejectors, their applications in ejector refrigerationsystems. Energy 1996;21:919–29.
[12] Sun DW. Experimental investigation of the performance characteristics of asteam jet refrigeration system. Energy Sources 1997;19:349–67.
[13] Jia Y, Wenjian C. Area ratio effects to the performance of air-cooled ejectorrefrigeration cycle with R134a refrigerant. Energy Convers Manage2012;53:240–6.
[14] Zhu Y, Cai W, Wen C, Li Y. Numerical investigation of geometry parameters fordesign of high performance ejectors. Appl Therm Eng 2009;29:898–905.
[15] Bartosiewicz Y, Aidoun Z, Desevaux P, Mercadier Y. Numerical andexperimental investigations on supersonic ejectors. Int J Heat Fluid Flow2005;26:56–70.
[16] Sriveerakul T, Aphornratana S, Chunnanond K. Performance prediction ofsteam ejector using computational fluid dynamics: Part 1. Validation of theCFD results. Int J Thermal Sci 2007;8:812–22.
[17] Sriveerakul T, Aphornratana S, Chunnanond K. Performance prediction ofsteam ejector using computational fluid dynamics: Part 2. Flow structure of asteam ejector influenced by operating pressures and geometries. Int J ThermSci 2007;46:823–33.
[18] Varga S, Oliveira AC, Diaconu B. Numerical assessment of steam ejectorefficiencies using CFD. Int J Refrig 2009;32:1203–11.
[19] Yan J, Cai W, Li Y. Geometry parameters effect for air-cooled ejector coolingsystems with R134a refrigerant. Renewable Energy 2012;46:155–63.
[20] Zhang B, Song X, Lv J, Zuo J. Study on the key ejector structures of the wasteheat-driven ejector air conditioning system with R236fa as working fluid.Energy Build 2012;49:209–15.
[21] Chen W, Liu M, Chong D, Yan J, Little AB, Bartosiewicz Y. A 1D model to predictejector performance at critical and sub-critical operational regimes. Int J Refrig2013:1–2.
[22] Cardemill Jose M, Colle Sergio. A general model for evaluation of vapor ejectorsperformance for application in refrigeration. Energy Convers Manage2012;64:79–86.
[23] Chandra Vineet V, Ahmed MR. Experimental and computational studies on asteam jet refrigeration system with constant area and variable area ejectors.Energy Convers Manage 2014;79:907–14.
[24] Zhu Yinhai, Jiang Peixue. Experimental and analytical studies on the shockwave length in convergent and convergent-divergent nozzle ejectors. EnergyConvers Manage 2014;88:907–14.

310 B. Tashtoush et al. / Energy Conversion and Management 94 (2015) 300–310
[25] Soroureddin A, Mehr AS, Mahmoudi SMS, Yari M. Thermodynamic analysis ofemploying ejector and organic Rankine cycles for GT-MHR waste heatutilization: a comparative study. Energy Convers Manage 2013.
[26] Selvaraju A, Mani A. Analysis of an ejector with environment friendlyrefrigerants. Appl Therm Eng 2004;24:827–38.
[27] Roman R, Hernandez JI. Performance of ejector cooling systems using lowecological impact refrigerants. Int J Refrig 2011;34:1707–16.
[28] Nehdi E, Kairouani L, Elakhdar M. A solar ejector air-conditioning system usingenvironment-friendly working fluids. Int J Energy Res 2008;32:1194–201.
[29] Boumaraf L, Lallemand A. Modeling of an ejector refrigerating systemoperating in dimensioning and off-dimensioning conditions with theworking fluids R142b and R600a. Appl Therm Eng 2009;29:265–74.
[30] Arbel N, Sokolov M. Revisiting solar-powered ejector air conditioner – thegreener the better. Sol Energy 2004;77:57–66.
[31] Petrenko VO, Volovyk OS. Theoretical study and design of a low-grade heat-driven pilot ejector refrigeration machine operating with butane andisobutane and intended for cooling of gas transported in a gas-mainpipeline. Int J Refrig 2011;34:1699–706.
[32] Ma X, Zhang W, Omer SA, Riffat SB. Experimental investigation of a novelsteam ejector refrigerator suitable for solar energy applications. Appl ThermEng 2010;30:1320–5.
[33] Chen X, Omer S, Worall M, Riffat S. Recent developments in ejectorrefrigeration technologies. Renew Sustain Energy Rev 2013;19:629–51.
[34] Pollerberg C, Ali AH, Dotsch C. Experimental study on the performance of asolar driven steam jet ejector chiller. Energy Convers Manage2008;49:3318–25.
[35] Vidal Humberto, Colle Sergio, Pereira Guilherme dos Santos. Modelling andhourly simulation of a solar ejector cooling system. Appl Therm Eng2006;26:663–72.