full year 2015 results presentation - euronext · full year 2015 results presentation 17 february...
TRANSCRIPT

FULL YEAR 2015 RESULTS PRESENTATION
17 February 2016

EURONEXT PRESENTING TEAM
Stephane Boujnah
CEO & Chairman of the
Managing Board
Amaury Dauge
Group Chief Financial
Officer
Lee Hodgkinson
Head of Markets &
Global Sales
2

EXECUTIVE SUMMARY
1
� Revenue growth: €518.5 million of third party revenue. IPO objective of €500 million� Cost reduction: €83 million (run-rate basis) of net efficiencies. IPO objective of €60 million,
then raised up to €80 million� Profitability increase: Full-year EBITDA margin of 54.7%. IPO objective of 45%, then raised up
to 53%
Achievement of IPO objectives a year in advance
2 Strong pay-out
� Consistent with our dividend policy, 50% of reported earnings resulting in an increase in dividend proposal
� €1.24 dividend per share, an increase of 48% compared to €0.84 paid in 2015� Subject to the AGM approval on 12 May
3
3Constrains on balance sheet lifted
� Capital requirements imposed in the June 2014 license revoked by the Court of Rotterdam� These capital requirements are not applicable any longer� Appeal lodged by the Ministry of Finance has no suspensive effect� The applicable license for capital requirements remains the one of March 2014, with no
particular capital requirements at the holding Company level, pending a revision of this license into the new and final license

OVER-DELIVERY ON IPO OBJECTIVES ONE YEAR AHEAD OF PLAN
45.0%
54.7%
2016
target
2015
actual
Third-party revenues (€m] EBITDA marginCost efficiencies (€m)
Note
1 Unaudited figures. Adj. revenues of €433million 2013
Overperformance: + €19m Overperformance: + €23m Overperformance: + c. 1,000 bps
60
83
2016
target
2015
actual
5.0% 9.5%
500
519
2016
target
2015
actual
CAGR
2013-16 objective 2013-15 actual
4

2015 BUSINESS UPDATE – A RESILIENT MODEL
Listing
� Largest continental European listing venue with more than 1,300 issuers and market cap of c.€3,0trn� 275 global companies, 1,043 SMEs & micro caps and c.5,400 corporate, financials and government
bonds listed� Global leader in capital raising: c.€112bn in primary and secondary capital raised through equity and debt in
2015vs €104bn in 2014� Revenues +14.2% vs 2014
Trading
� Unique single order book and trading model with a diverse cash and derivatives trading community of 480 members
� Cash trading: #1 cash market in continental Europe with venues in Paris, Amsterdam, Brussels, Lisbon and London
� Derivatives trading: leading local derivatives platforms with diversified portfolio of equity options, key index contracts in CAC 40, AEX 25, BEL 20 and PSI 20, and benchmark French milling wheat contracts
� Bond trading: #4 bond market in continental Europe, strong ETF segment (volume +74% vs 2014)� #2 listed derivatives market in Continental Europe � Higher volumes +28% vs 2014 - Resilient Market Share of 63%� Cash trading revenues +19.1% vs 2014 – Derivatives trading -4.3% vs 2014
Market data & indices
� Provider of real-time, historic and reference data for Euronext cash and derivatives markets� Over 350 vendors disseminating data to 150,000 screens in more than 130 countries� Over 7,000 ETPs listed end of 2015, a 25% increase vs 2014� Sustained market data activity and promising start of our new global index server� Revenues up 6.9% vs 2014
Post-trade
� Cash and derivatives clearing long-term agreements with LCH.Clearnet SA, capturing derivatives revenue growth opportunity with no capital commitment
� Interbolsa as CSD providing settlement and custody services for Portuguese market� Clearing revenues up 7.2% vs 2014 adjusted thanks to favourable product mix, Interbolsa revenues still
constrained (down 7.3% vs 2014)
Marketsolutions & other
� UTP technology platform provided to third-party clients and partners and license services � Optiq programme to enhance performance of systems, time to market, stability and security� Revenues up 2.1% vs 2014, a €1.5 million non-recurring revenue offset the reduction in solution revenue
Cash: 38%Derivatives: 9%
6%
Clearing: 10% Settlement & Custody: 4%
14%
19%
5
Revenue
contribution

EURONEXT BUSINESS OVERVIEW

� Large diversity of sectors and segments joining our markets from SMEs to large caps and
mid size companies as well as large cross border deals
� High level of total corporate financing with €112 billion in 2015 compared with approx
€75bn during crisis years period from 2008-2013
� Sustained development of Enternext:
• Growing number of SMES listing for the 4th consecutive year, with €1.2 billion
raised through IPOs in 2015 vs €740m in 2014
• Launch of our Tech initiatives, TechShare, with first encouraging results : €900m
raised through IPOs of tech companies
� Moderate increase in annual fees, capped at 5%, after five year with no fee increase while
we have delivered new services in the meantime
A STRONG YEAR IN LISTING
8.9 7.9
95.5 103.8
2014 2015
Large Cap
SME
7
30.4 33.0
13.4 16.0
9.7
12.3 2.9
3.9 5.3
5.3
2014 2015
Bond Fees
Other
IPOs
Follow ons
Fixed fees
Listing Fees
Listing Activity (money raised in €bn)
Listing activity (number of listings)
€61.7m
€70.5m
29 34
16 18
2014 2015
Large Cap
SME
+14.2%
Amsterdam - IPO
February 2015
€126m raised
€196m m. cap
Brussels - IPOOctober 2015
€6.5m raised
€31.6m m. cap
Paris - IPOOctober 2015
€226m raised
€640m m. cap
Paris - Capital
increaseDecember 2015
€400m raised

SOLID PERFORMANCE IN CASH TRADING REVENUE
� Solid annual revenues of €197.2m, up +19.1% vs 2014 – with average daily volumes reaching €8.3 billion, up +28% compared to 2014. Best year for volumes since 2011, record year ever in number of transactions at 472 million, exceeding the previous record of 2011 by more than 7%
� Ongoing nurturing of the balance of market share and yield with carefully planned evolution of the blue chip liquidity scheme. Market share over 63% for 2015 despite intense competition for high volume yet mobile, low yield flow
� New tariff for equity fees due to be launched in March, to reduce complexity of our agency pricing while being revenue neutral
� Decrease in revenue per trade (from €0.50 in 2014 to €0.47 this year) resulting from higher trading volumes and increase in the SLP flow
Stable market share for the last four years
8
Superior market quality, depth and liquidity
0.50 0.47
2014 2015
20%
40%
60%
80%Euronext Market Share MTF Market Share
Blue Chips(31 Dec 2015)
Presence time at
EBBO (%)
EBBO with greatest size (%)
EBBO setter (%)
Relative spread (bps)
Displayed market
depth (€)
Euronext 82% 45% 64% 5.67 54 803
BATS Europe 27% 0% 3% 11.40 16 805
Chi-X 62% 4% 18% 7.00 23 885
Equiduct 5% 0% 1% 33.96 14 978
Turquoise 55% 2% 11% 7.13 18 279
Average daily turnover 2015/2014 (€mm)
6,480
6,022
352 64 42
8,282 7,572
613
63 33
TOTAL CASH EQUITIES ETF STRUCT. PRODS BONDS
2014 2015
+27.8% +25.7% +74.4% -0.9% -20.6%
Revenue per trade
(in Basis Point, Total cash trading revenues divided by value traded)

9
-
2 000
4 000
6 000
8 000
10 000
12 000
14 000
16 000
18 000
20 000
0
5
10
15
20
25
30
35
40 ADV (€m)
VIX Index
STOXX 50 Volatility
Vo
lati
lity
(N
om
ina
l te
rms)
AD
V (
€m
illio
n)
2014 2015 2016 YTD
ECB QE Greek
debt
stand-off
Greek crisis
resolution
Fed interest rate decision
China, commodities/ EM
crisis, banking stocks pressure
Calmer markets. IPO window
fully open
Global sell-off over fears of
slowing US economic growth,
Ukraine – Russia conflict ,
commodities, Greece.
Fears over EU
deflation
OUR BUSINESS IS RESILIENT
Source: Euronext, TAG Audit, Bloomberg as of February 2016
Note: Domestic equities (electronic order book and regulated reported deals.
Scope of MTFs – Smartpool, Chi-X, BATS, Turquoise, Equiduct, TOM MTF, NYSE Arca Europe
2014 Volatility Peaks
2015 Volatility Peaks
2014 ADV
2015 ADV
STOXX 50 Historic Volatility Peak Barrier
VIX Historic Volatility Peak Barrier
+26% ADV
2015 vs 2014
2016 ADV YTD
2016 Volatility Peaks
+8% ADV
2015FY vs 2016 YTD

ONGOING PERFORMANCE OF COMMODITIES LED DERIVATIVES
¹ Revenues divided by total derivatives number of contracts traded
10
Euronext – number of contracts traded (lots in mm)
0.32 0.33
2014 2015
Trading revenue decreased by 4.3% to €44.5 million.
� Strong year for our commodity franchise with volumes up 8.6% YoY:
� Volumes benefited from uncertainty on harvest due to adverse weather conditions. Strong performance of the rapeseed contract
� 14.3 million lots exchanges in 2015, an absolute record
� Targeting 3 major initiatives in adjacent markets in 2016 (o/w sugar already announced)
� Slight decrease in volumes on index options & futures (-4.8%)
� Individual equity products volumes decreased by 9.9%
� Built market share in NL back to 60% on average with continued momentum thanks to trading fee reductions for some targeted client flow
Clearing revenue were up +7.2% vs 2014 adjusted, to €51.9 million, benefiting from the strong performance of commodity products
0.34 0.38
2014 2015
16,4 17,9 14,6 14,8 17,2 14,0 15,1 17,7 16,0 16,0 15,6 13,3
21,4 17,416,9 17,2
18,315,9 15,5
17,115,5 14,3 16,3
14,0
2,62,1
2,9 2,93,2
2,4 3,73,9
3,1 3,44,4
3,3
Q1'13 Q2'13 Q3'13 Q4'13 Q1'14 Q2'14 Q3'14 Q4'14 Q1'15 Q2'15 Q3'15 Q4'15
Index Equity Commodities
Average daily volume 2015/2014 (‘000)
565
262184
67 52
529 235
183
55 56
TTL DERIVS. EQUITY OPTS INDEX FUTURES INDEX OPTS COMMODITIES
2014
2015
Trading revenue per lot1 Clearing revenue per lot1
SUSTAINED MARKET DATA & INDICES BUSINESS
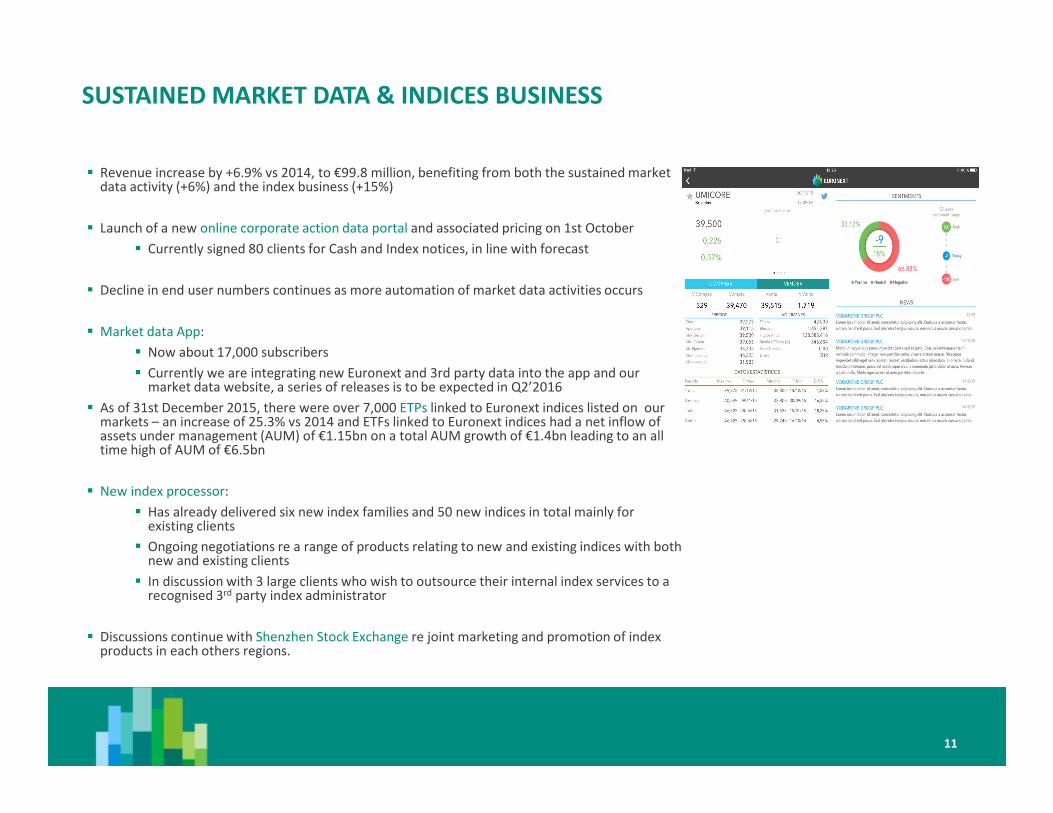
� Revenue increase by +6.9% vs 2014, to €99.8 million, benefiting from both the sustained market data activity (+6%) and the index business (+15%)
� Launch of a new online corporate action data portal and associated pricing on 1st October
� Currently signed 80 clients for Cash and Index notices, in line with forecast
� Decline in end user numbers continues as more automation of market data activities occurs
� Market data App:
� Now about 17,000 subscribers
� Currently we are integrating new Euronext and 3rd party data into the app and our market data website, a series of releases is to be expected in Q2’2016
� As of 31st December 2015, there were over 7,000 ETPs linked to Euronext indices listed on our markets – an increase of 25.3% vs 2014 and ETFs linked to Euronext indices had a net inflow of assets under management (AUM) of €1.15bn on a total AUM growth of €1.4bn leading to an all time high of AUM of €6.5bn
� New index processor:
� Has already delivered six new index families and 50 new indices in total mainly for existing clients
� Ongoing negotiations re a range of products relating to new and existing indices with both new and existing clients
� In discussion with 3 large clients who wish to outsource their internal index services to a recognised 3rd party index administrator
� Discussions continue with Shenzhen Stock Exchange re joint marketing and promotion of index products in each others regions.
11

SETTLEMENT & CUSTODY - MARKET SOLUTIONS ACTIVITIES
� Revenues down -7.3% to €19.7 million due to a reduction in settlement instructions, corporate actions and private debt assets under custody in Portugal
� Service level performance highly recognized by clients, namely Issuers and Financial Intermediaries, in the annual satisfaction survey
� Adaptation to TARGET2-Securities (T2S) on track for migration in March 2016 (all synchronization points met so far + successful migration weekend dress rehearsals with peers and customers)
� Revenues were up +2.1% vs 2014, to €34.1 million
� Managed Services revenue continues to grow with commercial market hosting up +16% vs 2014
� SFTI and Colo services also up from with a 13% Q-on-Q increase in the last quarter of the year
� SLE (market access) connections were also up slightly, +3% vs 2014
� Maintenance revenues from legacy platforms remains broadly stable, but project revenue is down, following the completion of some projects
21.3 19.7
2014 2015
12
17 February, 2016
Settlement & Custody Market solutions

FINANCIALS
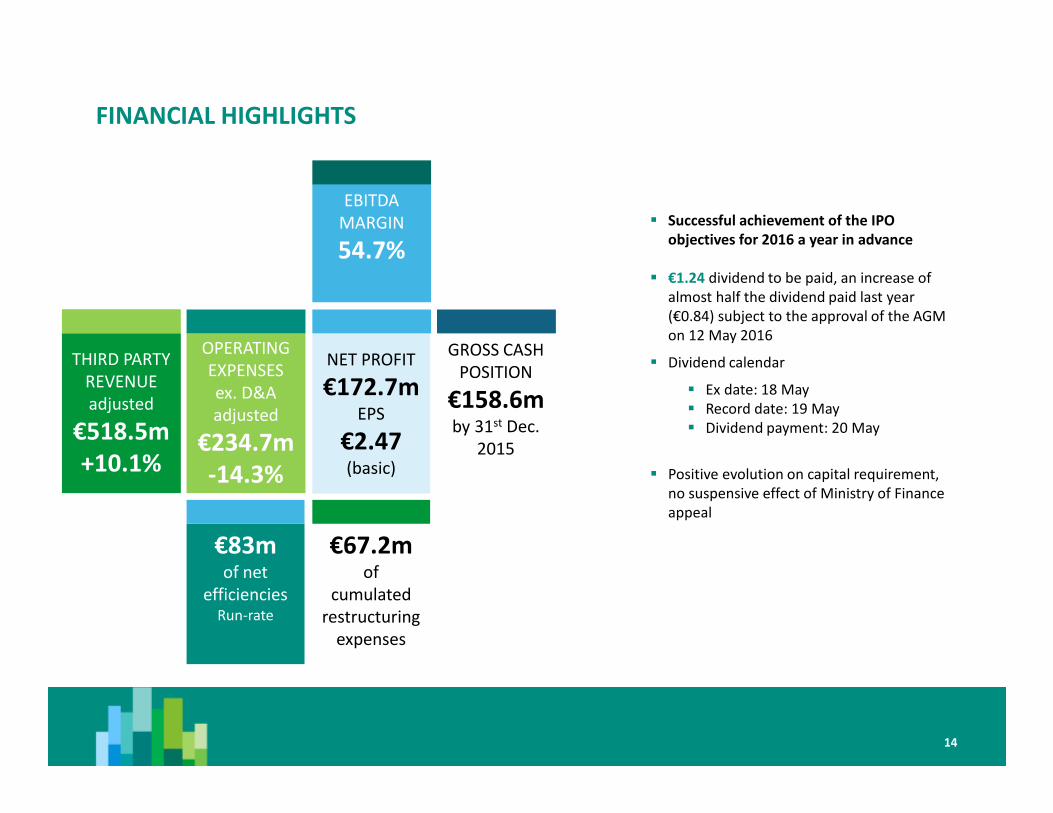
FINANCIAL HIGHLIGHTS
14
THIRD PARTY
REVENUE
adjusted
€518.5m
+10.1%
€83mof net
efficiencies Run-rate
OPERATING
EXPENSES
ex. D&A
adjusted
€234.7m
-14.3%
EBITDA
MARGIN
54.7%
NET PROFIT
€172.7mEPS
€2.47(basic)
GROSS CASH
POSITION
€158.6m by 31st Dec.
2015
€67.2mof
cumulated
restructuring
expenses
� Successful achievement of the IPO
objectives for 2016 a year in advance
� €1.24 dividend to be paid, an increase of
almost half the dividend paid last year
(€0.84) subject to the approval of the AGM
on 12 May 2016
� Dividend calendar
� Ex date: 18 May
� Record date: 19 May
� Dividend payment: 20 May
� Positive evolution on capital requirement,
no suspensive effect of Ministry of Finance
appeal

� Strong year for listing and for cash trading
� Robust market data & indices businesses (market data +6%, indices +15%)
� Market solutions benefiting from a €1.5 million non-recurring revenue offsetting the reduction in solution revenue
� ICE transitional revenues terminated starting January 2015
STRONG GROWTH IN THIRD PARTY REVENUES
(€mm)FY'15 FY’14
∆∆∆∆ FY’15 vs
FY’14
Listing 70.5 61.7 14.2%
Trading revenue 241.7 212.0 14.0%
o/w cash trading 197.2 165.6 19.1%
o/w derivatives trading 44.5 46.4 -4.3%
Market data & indices 99.8 93.3 6.9%
Post-trade 71.7 57.3 25.2%
o/w clearing reported 51.9 36.0 44.4%
o/w settlement & custody 19.7 21.3 -7.3%
Market solutions & other 34.1 33.4 2.1%
Other income 0.7 0.6 15.4%
Total third party revenue and
other income 518.5 458.5 13.1%
Clearing revenues - 12.5 n/a
Total adjusted third party
revenue and other income 518.5 471.0 10.1%
ICE transitional revenue - 34.0 n/a
Total revenue 518.5 505.0 2.7%
Adjusted revenues (unaudited)1
¹ A reconciliation of adjusted and estimated revenue to reported revenue for 2014, as well as a description of the related adjustment used to derive the adjusted revenue figures from reported
revenues are detailed in the press release. The adjusted revenues are not audited. They should not be considered as an alternative to, or more meaningful than, and should be read in conjunction
with, reported revenues and may not be indicative of future revenues. The estimated derivatives clearing revenues and expenses are not audited
Comments
15
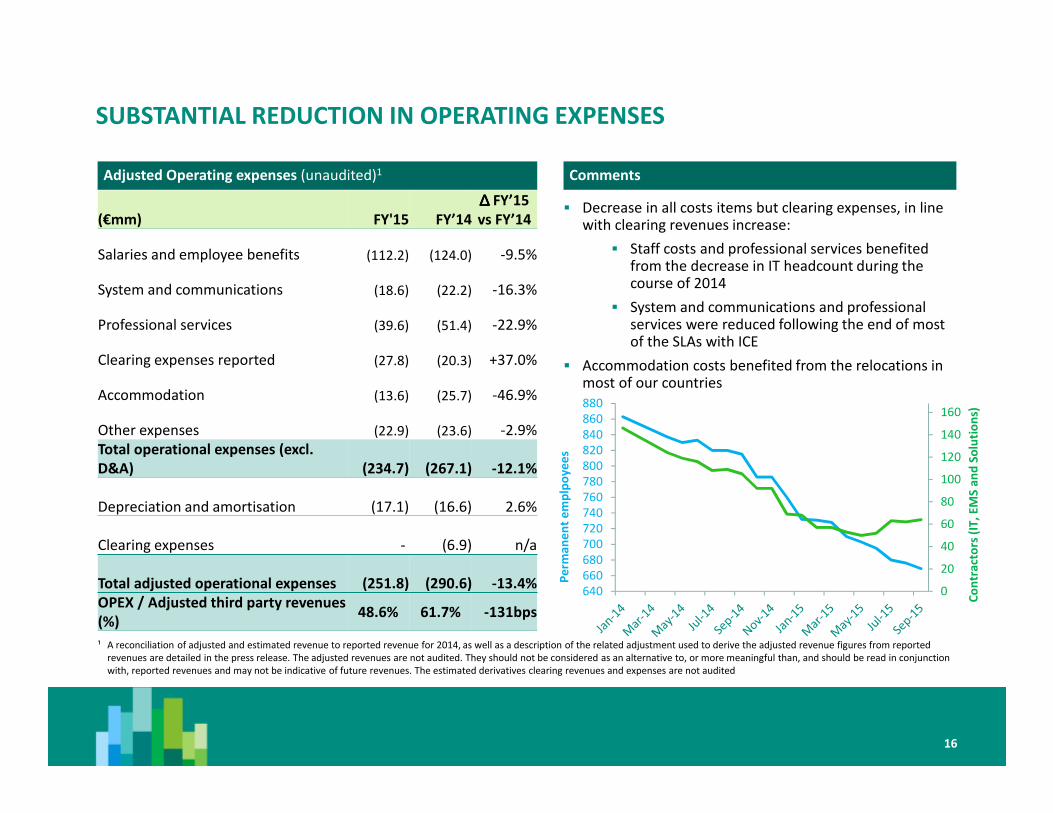
SUBSTANTIAL REDUCTION IN OPERATING EXPENSES
16
Adjusted Operating expenses (unaudited)1
� Decrease in all costs items but clearing expenses, in line with clearing revenues increase:
� Staff costs and professional services benefited from the decrease in IT headcount during the course of 2014
� System and communications and professional services were reduced following the end of most of the SLAs with ICE
� Accommodation costs benefited from the relocations in most of our countries
Comments
(€mm) FY'15 FY’14
∆∆∆∆ FY’15
vs FY’14
Salaries and employee benefits (112.2) (124.0) -9.5%
System and communications (18.6) (22.2) -16.3%
Professional services (39.6) (51.4) -22.9%
Clearing expenses reported (27.8) (20.3) +37.0%
Accommodation (13.6) (25.7) -46.9%
Other expenses (22.9) (23.6) -2.9%
Total operational expenses (excl.
D&A) (234.7) (267.1) -12.1%
Depreciation and amortisation (17.1) (16.6) 2.6%
Clearing expenses - (6.9) n/a
Total adjusted operational expenses (251.8) (290.6) -13.4%
OPEX / Adjusted third party revenues
(%)48.6% 61.7% -131bps
¹ A reconciliation of adjusted and estimated revenue to reported revenue for 2014, as well as a description of the related adjustment used to derive the adjusted revenue figures from reported
revenues are detailed in the press release. The adjusted revenues are not audited. They should not be considered as an alternative to, or more meaningful than, and should be read in conjunction
with, reported revenues and may not be indicative of future revenues. The estimated derivatives clearing revenues and expenses are not audited
0
20
40
60
80
100
120
140
160
640
660
680
700
720
740
760
780
800
820
840
860
880
Co
ntr
act
ors
(IT
, E
MS
an
d S
olu
tio
ns)
Pe
rma
ne
nt
em
plp
oy
ee
s

SIMPLIFIED INCOME STATEMENT
17
Income statement (unaudited)
(€mm) FY'15 FY’14
EBITDA 283.8 225.4
Margin 54.7% 45.8%
Depreciation and amortisation (17.1) (16.6)
Total expenses (251.8) (283.7)
Operating profit (before exceptional items) 266.8 208.8
Margin 51.4% 42.4%
Exceptional items (28.7) (44.6)
Operating profit 238.1 164.2
Net financing income/(expense) (4.1) (6.5)
Results from equity investments and other
income4.6 4.6
Profit before income tax 238.6 162.3
Income tax expense (65.9) (44.1)
Tax rate -27.6% -27.2%
Profit for the year 172.7 118.2
Comments
� EBITDA margin of 54.7% benefited from strong revenue performance and transformation of our cost structure
� Exceptional items of €28.7 million, mainly due to:
� Restructuring costs of €22.6 million (mainly for the staff restructuring in France)
� €5 million of provision for AMF litigation
� Income tax limited to 27.6% due to a €13.9 million release of provision for uncertain tax in Q4
� 2015 EPS of €2.47 basic & €2.46 diluted vs €1.69 (both basic & diluted) in 2014

BALANCE SHEET
18
(€mm) 31 Dec 2015 31 Dec 2014
Non-current assets
Property, plant and equipment 29 26
Goodwill and other intangibles 321 321
Equity investments 114 114
Other non-current assets 20 11
Current assets
Cash and cash equivalents 159 242
Other current assets 107 143
Total assets 750 857
Non-current liabilities
Borrowings 108 248
Other non-current liabilities 16 49
Current liabilities
Trade and other payables 106 126
Other current liabilities 73 92
Total liabilities 303 515
Total equity 447 342
Total equity and liabilities 750 857
Balance sheet summary (unaudited)
� Assets:
� Cash and cash equivalent of €159m at the end of the period due to:
� Partial debt repayment of €140m in March
� €58.8m dividend payment
� Cash tax payment of €58 million in the last quarter, as anticipated
� No other significant change to report
� Liabilities:
� Borrowings decreased by €140m due to the partial debt repayment
Comments

CASH FLOW & LIQUIDITY
Liquidity
(€mm) 2015 2014
Cash Beginning of the Year 241,6 80,8
Debt Repayment -140,0
Dividend -58,8
Cash accumulation 115,8 160,8
Cash End of the Year 158,6 241,6
Minimum Cash for operations -110,0 -110,0
Cash available 48,6 131,6
RCF 390,0 250,0
Current Liquidity 438,6 381,6
EBITDA 283,8 225,4
Total available debt (TL + RCF) 500,0 500,0
Loan covenant<2.5x 1,8 x 2,2 x
� Current liquidity consists of cash at the end of the year plus the
undrawn part of the RCF
� Cash available is the difference between the cash at bank and
the minimum operational cash we deem necessary to run our
business, repay loans and make scheduled dividend
distributions
� Based on the current EBITDA, drawing fully under the RCF would
imply that we would have remained neatly within the loan
covenant of 2.5x EBITDA
(€mm) FY'15 FY’14
Net cash provided by/(used in) operating activities 140.0 148.6
Net cash provided by/(used in) investing activities (5.3) (28.1)
o/w capital expenditures (20.3) (13.9)
Net cash provided by/(used in) financing activities (220.3) 39.9
Net increase/(decrease) in cash and cash equivalents (85.6) 160.3
Cash and cash equivalents – beginning of period 241.6 80.8
Cash and cash equivalents – end of period 158.6 241.6
Cash flow statement (unaudited)
� Operating cash-flow: 2015 profit before tax of €238.6 million,
negative impact from changes in working capital of -€28.5 million and
€92.2 million of income tax payments
� Investing Cash Flow: Capex for 2015: €20.3 million. Net purchase of
Financial investments increased in 2015 with €15.0 million, due to
return of three short term deposits amounting of €5.0 million each
� Financing Cash Flow: In 2015 part of the Term Loan has been repaid
for an amount of €140.0 million. Euronext’s share repurchase program
resulted in a movement of -€18.5 million in acquisition of own shares.
In 2015 Euronext paid €58.8 million of dividend to its shareholders.
The Employee stock transactions reflect the cash settlements of share
based payments
19

|
H1 ‘14
Q3 ‘14
Q4 ‘14
Q1 ‘15
Q2 ‘15
Q3 ‘15
Q4 ‘15
FINANCIAL MANAGEMENT DASHBOARD
Cumulated
efficiencies
(accrued basis)
Cumulated
restructuring
expenses
€ 38m
€ 45m
Run rate
savings
€ 51m
€ 63m € 90m
2016
TARGET
€ 29m
€ 26m
€ 22m
€ 20m
€ 44m
€ 38m
Third party
revenue growth
(adjusted)
+12.0% +11.9%+10.3%+6.9% +9.6%
EBITDA margin 46.7% 53.9%44.1%46.1% 52.2%
€500m
(5%
3-year
CAGR)
IT London
Simplification
+€ 20m
+€ 20m
Restructuring: real-estate reduction, restructuring, refresh of core trading infrastructure +€ 40m
~ 53%
€ 64m € 80m
20
€ 64m
+18.4%
€ 74m
€ 65m
58.0%
Some additional restructuring expenses
will be spent in the following years.
New strategic plan to be released in
the course of Q2
€ 77m
+1.4%
€ 83m
€ 67m
54.9%
�
�
�
�

CONCLUSION

FUNDAMENTAL EURONEXT ASSETS TO DRIVE FUTURE GROWTH
22
Euronext is now a fully
independent European
player
Euronext must continue to remain profitable and innovative to
future growth and shareholder return
Euronext’s model is
resilient & delivers
consistent top line growth
Ongoing macro uncertainties are a significant driver for Euronext
while its enhanced efficiency provides room to invest in growth
initiatives; revenue diversification will further increase resilience
Euronext can unleash
additional potential
revenue growth at local
level
Further client intimacy as well as close relationships with local
issuers, local investors and local stakeholders will enable superior
agility to improve time-to-market and effectiveness of our initiatives
Euronext is « united in
diversity »
Euronext’s federal model is best suited to contribute to the
construction of a true pan-European market
Strategic plan to be
announced in the course of
Q2
Euronext’s new strategic plan will be structured on two key pillars:
revenue growth and cost discipline; Euronext enjoys a strong
liquidity to support strategic flexibility