FULL YEAR 2016 RESULTS PRESENTATION(1 Jan ndash 31 Dec 2016)
23 February 2017
AGENDA
bull EXECUTIVE SUMMARY
bull FINANCIAL HIGHLIGHTS
bull SINGAPORE OVERVIEW
bull INTERNATIONAL OVERVIEW
bull HOTEL OPERATIONS
EXECUTIVE SUMMARY
Key Highlights
4^ Without factoring in fair value gains on investment properties Includes special interim dividend of 40 cents paid in Sep 2016
Creditable PATMI achieved despite headwinds and challengesndash $244 million for Q4 2016 (Q4 2015 $410 million)ndash $653 million for FY 2016 (FY 2015 $773 million)ndash Supported by divestures in City e-Solutions Limited in Q3 2016 and Exchange Tower
in Q4 2016 exiting of equity interest in Nouvel 18ndash Maiden profit contribution of Phase 1 of Suzhou Hong Leong City Center in Q4 2016
Record revenue achieved for FY 2016 - 182 increase to $39 billion - 365 increase in revenue for Q4 2016 $12 billion
Stellar performance of property development business segmentndash 73 of Q4 and 57 of FY 2016 pre-tax profits respectivelyndash 1017 units with sales value of approx $12 billion for FY 2016 in Singapore
South Beach integrated project fully completed JW Marriott Hotel Singapore South Beach soft opened in Dec 2016
Robust financial position maintained - $39 billion with net gearing ratio of 16^ as at 31 Dec 2016
Special final dividend of 40 cents per share in addition to the ordinary dividend of 80 cents per share Total dividends for 2016 160 cents (2015 160 cents)
No fair values adopted on investment properties
Investment properties are stated at cost less accumulated depreciation and accumulated impairment losses
70 to target with 3rd Profit Participation Securities (PPS) in 2016
$9776 millionRaised from PPS transactionand exited interest toluxury freehold residentialproject to a group of Singaporean investors
12
Strategic Thrusts for FY 2017Acquisitive Position with Value Driven Focus
Focus on assets with in-place income in Singapore and overseas $304 million investments in Q1 2017 to date Disciplined capital deployment ndash for physical
assets equities or debt instruments
Grow funds management and capital recycling programme PPS Traditional private equity structures
Future-proof business through investments in new economy platforms
RMB 72 millionInvestment for24 equity stake in Distrii Chinarsquos leading co-workingspace operator
pound58 millionAcquisition of 16 acre Ransomes Wharf sitein Battersea South West London
Artistrsquos Impression
Q1 2017 Acquisition Highlights
To date 19 Feb 2017
Artistrsquos Impression
RMB 900 millionAcquisition of Shanghaicommercial projectMeidao Business Plazain Hongqiao
FINANCIAL HIGHLIGHTS
Financial Highlights
NM Not Meaningful 14
Segment Financial Results
Incr (Decr) Incr (Decr)
Property Development 5981 2417 1475 2426 1158 1095
Inventory of Launched Residential Projects ndashAs of 31 Dec 2016
32
Singapore Property Development
Leasing strategy implemented ^ Based on launched units
Note Above excludes inventory from The Residences at W Singapore ndash Sentosa Cove (203 units) unlaunched projects Nouvel 18 (156 units) and New Futura (124 units)
Sheet1
110
115
120
125
130
135
140
145
Q112
Q212
Q312
Q412
Q113
Q213
Q313
Q413
Q114
Q214
Q314
Q414
Q115
Q215
Q315
Q415
Q116
Q216
Q316
Q416
Office Retail
Source URA Q4 2016
33
Singapore Commercial MarketProperty Price Index ndash Commercial (2012ndash 2016)
Q4 161226
Q4 16 1347
Q3 161223
Q3 16 1355
Source JLL Research Q4 2016
$974
$1051$1204
$1038$914
$790 $837$926
$850$777
000
200
400
600
800
1000
1200
1400
2012 2013 2014 2015 2016
Marina Bay Raffles Place(Grade A)
Whole Island
34
Singapore Office MarketAverage Office Rental in CBD (2012 ndash 2016)
Office Space Demand amp Supply (2012 ndash 2016)Private amp Public Sector
78254 80095 81300 81365 83206
7091372205 72980 73647 73938
30000
35000
40000
45000
50000
55000
60000
65000
70000
75000
80000
85000
2012 2013 2014 2015 2016
Cumulative Supply Occupancy
Source URA Q4 2016
Singapore Office Market
CDLrsquos Office Properties Occupancy
959(National Average = 889)
35
Occupancy as of 31 Dec 2016
2017 2018 2019
33 28 25
Expiry of NLA
36
CDLrsquos Office Space ndash Lease Expiry Profile (2017 ndash 2019)
Rental Properties
Office Portfolio NLA ~2300000 sq ft
16Properties^
959Occupancy
As of 31 December 2016
Note Properties include -Republic Plaza Central Mall (Office Tower) City House Fuji Xerox Towers Manulife Centre Palais Renaissance Tanglin Shopping Centre The Arcade Katong Shopping Centre Kingrsquos Centre 7 amp 9 Tampines Grande 11 Tampines Concourse Sunshine Plaza Fortune Centre Golden Mile Complex Central Mall Conservation Unit
Based on contractual expiry dates Renewals will be negotiated nearer to expiry Tenants may renew their leases or increasereduce space or exit ^ Properties include strata-titled units owned and managed by CDL
60052
61333
6365864271
65079
57060
58599
59955 5963260192
52000
54000
56000
58000
60000
62000
64000
66000
2012 2013 2014 2015 2016
Cumulative Supply Occupancy
Retail Space Demand amp Supply (2012 ndash 2016)Private amp Public Sector
Source URA Q4 2016
With effect from Q1 2014 the coverage of retail space has been expanded to include non-shop retail uses and data are available from2011 onwards
Singapore Retail Market
CDLrsquos Retail Properties Occupancy
964(National Average = 925)
37
Occupancy as of 31 Dec 2016
38
CDLrsquos Retail Space ndash Lease Expiry Profile (2017 ndash 2019)
2017 2018 2019
2332 31
Expiry of NLA
Rental Properties
Retail Portfolio NLA ~840000 sq ft
19Properties^
964Occupancy
As of 31 December 2016
Based on contractual expiry dates Renewals will be negotiated nearer to expiry Tenants may renew their leases or increasereduce space or exit ^ Properties include strata-titled units owned and managed by CDL
Note Properties include ndashRepublic Plaza Central Mall (Office Tower) City Square Mall Palais Renaissance Tanglin Shopping Centre The Arcade Katong Shopping Centre Kingrsquos Centre Quayside Isle Grand Copthorne Waterfront (Waterfront Plaza) City Plaza Golden Mile Complex Central Mall Conservation Unit 7 amp 9 Tampines Grande City House Fortune Centre Manulife Centre Fuji Xerox Towers
39
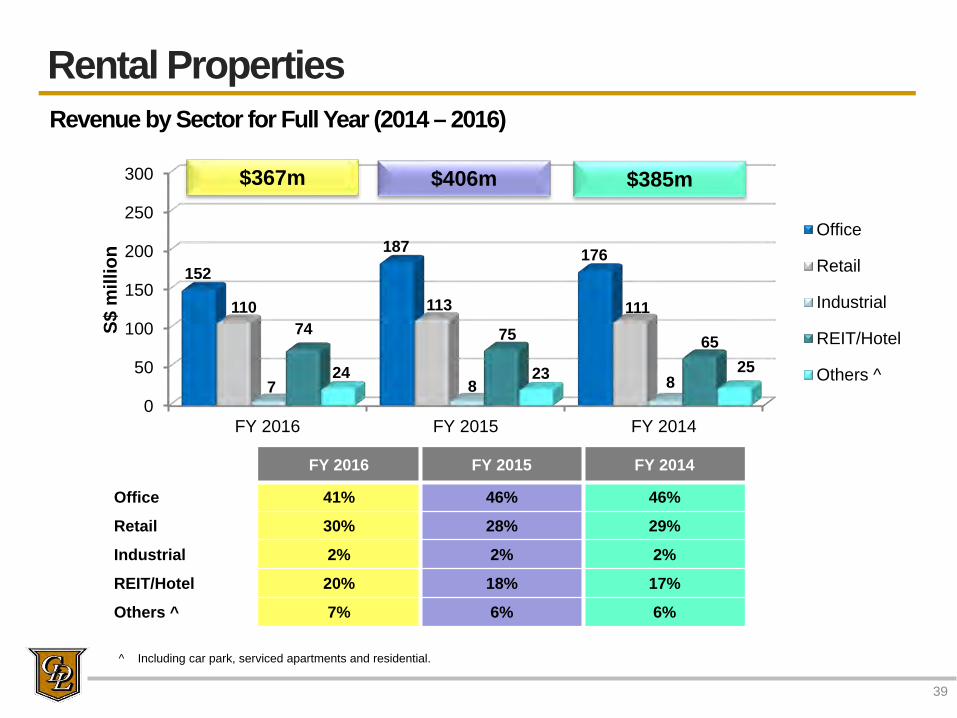
Revenue by Sector for Full Year (2014 ndash 2016)
0
50
100
150
200
250
300
FY 2016 FY 2015 FY 2014
152187 176
110 113 111
7 8 8
74 75 65
24 23 25
S$ m
illio
n
Office
Retail
Industrial
REITHotel
Others ^
$367m $406m $385m
FY 2016 FY 2015 FY 2014
Office 41 46 46
Retail 30 28 29
Industrial 2 2 2
REITHotel 20 18 17
Others ^ 7 6 6
^ Including car park serviced apartments and residential
Rental Properties
40
EBITDA by Sector for Full Year (2014 ndash 2016)
050
100150200250300350400450500550600
FY 2016 FY 2015 FY 2014
185
446 ~
10175 64 91
5 4 453 58 53
6 15 19
S$ m
illio
n
Office
Retail
Industrial
REITHotel
Others ^
$324m $587m $268m
FY 2016 FY 2015 FY 2014
Office 57 76 38
Retail 23 11 34
Industrial 2 - 1
REITHotel 16 10 20
Others ^ 2 3 7
~ Includes gain on sale of Profit Participation Securities^ Including car park serviced apartments and residential
Rental Properties
South Beach
41
JW Marriott Hotel Singapore South Beach
JW Marriott Hotel Singapore South Beach
Rebranded hotel soft opened in mid-Dec2016
Business performance is within expectations
Ongoing works at NCO Club are expected tocomplete by Q3 2017 along with theremodelled Ballroom
South Beach Residences
190-unit luxury residence may be launchedin 2H 2017 subject to market conditions
Fully Completed in December 2016
Strong Performance for Office amp Retail
South Beach Tower (510000 sq ft office space) and retail space are fully leased
INTERNATIONAL OVERVIEW
Projects Launched To Date
43
Project City Equity Stake
Total Units
Total Units Sold
Booked
Sold Est TotalSaleable
Area (sq ft)
ExpectedCompletion
Australia
Ivy and Eve Brisbane 33 472 450 95 348678 1H 2018
China
Hong Leong City Center (Phase 1)
Suzhou 100^ 1374 1038 76 1378891 Completed
Hong Leong City Center (Phase 2 ndash T2)
Suzhou 100^ 430 174 40 439716 Q4 2017
Hongqiao Royal Lake Shanghai 100 85 34 40 385394 Completed
China ndash Good Progress on Launched Luxury Projects
International Property Development
47
Shanghai ndash Hongqiao Royal Lake (御湖)
Eling Residences Chongqing
Stable sales despite tightening measures in Shanghai
34 units soldbooked with sales value of RMB 668 millionachieved to date
Chongqing ndash Eling Residences (鹅岭峰)
Launched in Oct 2016
8 units soldbooked with sales value of RMB 85 million ndashachieved highest average values of close to RMB 40000 psm
City Equity Stake
Total Units
Total Units Sold Booked
Sold
Expected Completion
Shanghai 100 85 34 40 Completed
Hongqiao Royal Lake Shanghai
City Equity Stake
Total Units
Total Units Sold Booked
Sold
Expected Completion
Chongqing 100 126 8 6 Q2 2017
Artistrsquos Impression
As of 19 Feb 2017
Chongqing ndash Huang Huayuan (黄花园)
Scheduled launch of mixed-use development with over 600 residential units in 2019
48
Over 150000 apartment listings spanning over 20 citiesin China
Offers one-stop solution for apartment owners andrental customers
Investment provides immediate entry into this fast-growing new economy sectorminus Complement business portfoliominus Contributes to future long-term recurring income stream
Synergies to be shared with the Grouprsquos properties inShanghai Suzhou and Chongqing
Strategic Acquisition of 20 Equity Stake in mamahome for RMB 100 million
Distrii ndash Leading Provider of Co-working Space Acquisition completed in Jan 2017
Currently 15 locations (13 Shanghai + 1 Beijing + 1 Hangzhou) 3700 seating capacity in total 10 locations in operation with 5 more locations to open in 1H 2017
Targeting to double the locations in China by end 2017
Current capacity of over 2200 seats has reached above 80 occupancy
Committed to lease over 60000 sq ft in Republic Plaza Expected to open in 1H 2018
Distrii Suhe Center Shanghai
Strategic Acquisition of 24 Equity Stake in Distrii for RMB 72 million
50
Purchase of a 100 equity stake in Shanghai MeidaoInvestment Co which owns the commercial projectthat is in the final stages of construction
Total transaction value of RMB 900 million throughCDL China Limited
Strategically located in Huacao Minhang Districtwithin the Hongqiao CBD ndash a new area established in2009 that spans 86 sq km and is one of Shanghairsquosfastest growing business areas
Project comprises five 9-storey office towers and twolevels of basement carpark with about 351 lots
Project has been approved for division into strata-titleunits
China ndashAcquisition of Shanghai Commercial Project for RMB 900 million
Artistrsquos ImpressionMeidao Business Plaza Shanghai
Meidao Business Plaza ShanghaiTenure Equity
StakeEst Total GFA
(sqm)Expected
Completion
50-year lease 100 32300 2H 2017
International Rental Properties
Artistrsquos Impression
Japan ndash Invested in 2 Prime Residential Projects in Tokyo
Located within prestigious Aoyama area withinMinato ward in Tokyo
Project targeted at high-end domestic and foreignbuyers
Good uptake with over 50 of units sold since itslaunch in Oct 2016
Tokyo ndashPark Court Aoyama The Tower
International Property Development
51
Artistrsquos ImpressionPark Court Aoyama The Tower Tokyo
Tokyo ndash ShirokaneTenure Equity Stake Site Area (sqm)
Freehold 947 16815
Discussions with potential JV partner for project development ongoing
City Equity Stake Total Units
Total Units Sold Expected Completion
Freehold 20 163 Over 50 1H 2018
As of 19 Feb 2017
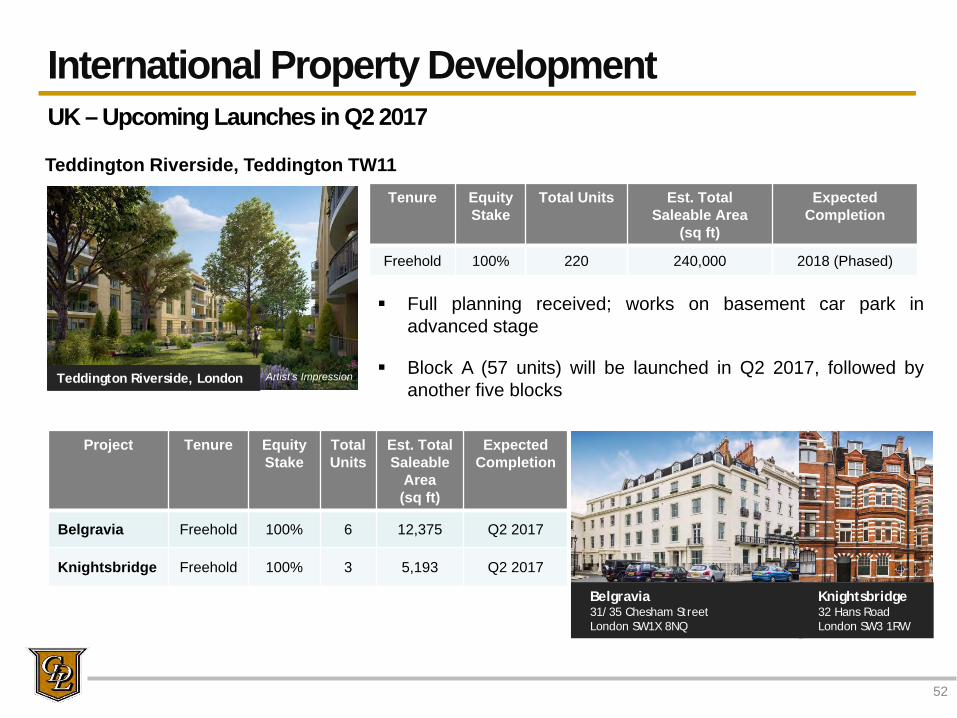
Teddington Riverside Teddington TW11
Full planning received works on basement car park inadvanced stage
Block A (57 units) will be launched in Q2 2017 followed byanother five blocks
International Property Development
52
UK ndash Upcoming Launches in Q2 2017
Artistrsquos Impression
Tenure EquityStake
Total Units Est TotalSaleable Area
(sq ft)
Expected Completion
Freehold 100 220 240000 2018 (Phased)
Teddington Riverside London
Project Tenure Equity Stake
Total Units
Est TotalSaleable
Area (sq ft)
Expected Completion
Belgravia Freehold 100 6 12375 Q2 2017
Knightsbridge Freehold 100 3 5193 Q2 2017
Belgravia3135 Chesham Street London SW1X 8NQ
Knightsbridge32 Hans Road London SW3 1RW
Chelsea 90-100 Sydney Street London SW3 6NJ
International Property Development
53
UK ndash Pipeline Projects
Tenure EquityStake
Total Units Est TotalSaleable Area
(sq ft)
Expected Completion
Freehold 100 9 16143 Q2 2018
Stag Brewery London
Tenure Equity Stake Est Total Saleable Area (sq ft)
Freehold 100 1000000 sq ft
Stag Brewery Mortlake London SW14
Advanced master plan at public consultation stage
Planning applications to be submitted by end Q2 2017
Proposed scheme to comprise two phases Parameter plan covering the entire site Detailed planning application for Phase 1Artistrsquos Impression
Artistrsquos Impression
Good progress on works
Expected completion in Q2 2018
International Property Development
54
Tenure Equity Stake Total Units Est GFA (sq ft)
Freehold 100 34 135000
28 Pavilion Road Knightsbridge London SW1
First luxury home care development to be built in Central Londonndash planning consent obtained
Project on target to commence demolition works in Q2 2017Artistrsquos ImpressionPavilion Road
UK ndash Pipeline Projects
Development House
Planning application to be submitted in Q2 2017
Existing 28000 sq ft remains fully leased and vacantpossession expected from Q2 2018
Development House Leonard Street in Shoreditch
Tenure Equity Stake Est Total Lettable Area (sq ft)
Freehold 100 90000 sq ft
Artistrsquos Impression
Artistrsquos Impression
UK ndashAcquisition of 16-acre Ransomes Wharf site for pound58 million
Located within Battersearsquos creative quarter on theRiver Thames
Est GDV of pound222 million
Contracts completed purchase to be phased overthe next 18 months
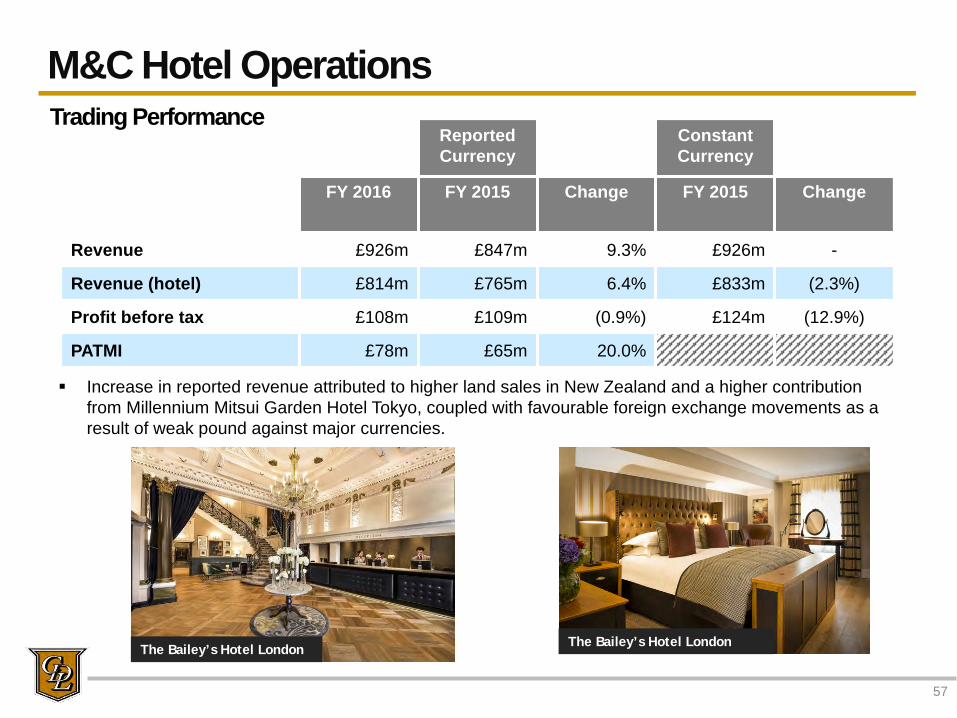
Profit before tax pound108m pound109m (09) pound124m (129)
PATMI pound78m pound65m 200
Trading Performance
The Baileyrsquos Hotel London The Baileyrsquos Hotel London
Increase in reported revenue attributed to higher land sales in New Zealand and a higher contribution from Millennium Mitsui Garden Hotel Tokyo coupled with favourable foreign exchange movements as a result of weak pound against major currencies
MampC Hotel Operations
58
Trading Performance
RevPAR in reported currency was up by 66 but in constant currency fell by 23 for FY 2016 as compared to the same period last year
FY 2016 Reported Currency Constant CurrencyNew York pound14564 uarr 19 darr 99Regional US pound5749 uarr175 uarr 40Total US pound8652 uarr 83 darr 42London pound10718 darr 14 darr 14Rest of Europe pound5261 uarr 20 darr 16Total Europe pound8024 darr 08 darr 20Singapore pound8021 uarr 05 darr 101Rest of Asia pound6063 uarr 116 uarr 19Total Asia pound6821 uarr 62 darr 40Australasia pound5840 uarr 348 uarr 209Total Group pound7671 uarr 66 darr 23 Millennium Seoul Hilton
Copthorne Hotel amp Resort Queenstown Lakefront
Sheet1
Developments ndash Progressing well
The lifestyle hotel and serviced apartment has 306 and 209keys respectively
The building permit approval for Seoul Yangdong developmentproject has been received on 25 January 2017 Additionalcertification processes are expected to complete by mid 2017
The main contract tender process is planned to complete bymid 2017 before construction work starts
Seoul South Korea
59
Comprises a 263-room hotel and a 250-unit residentialapartment block
The final planning approval has been received in December2016
Currently reviewing the project costing and specification whichis anticipated to take about 18 months to complete aftercommencement
Sunnyvale US
MampC Hotel Operations
MampC Hotel Operations
60
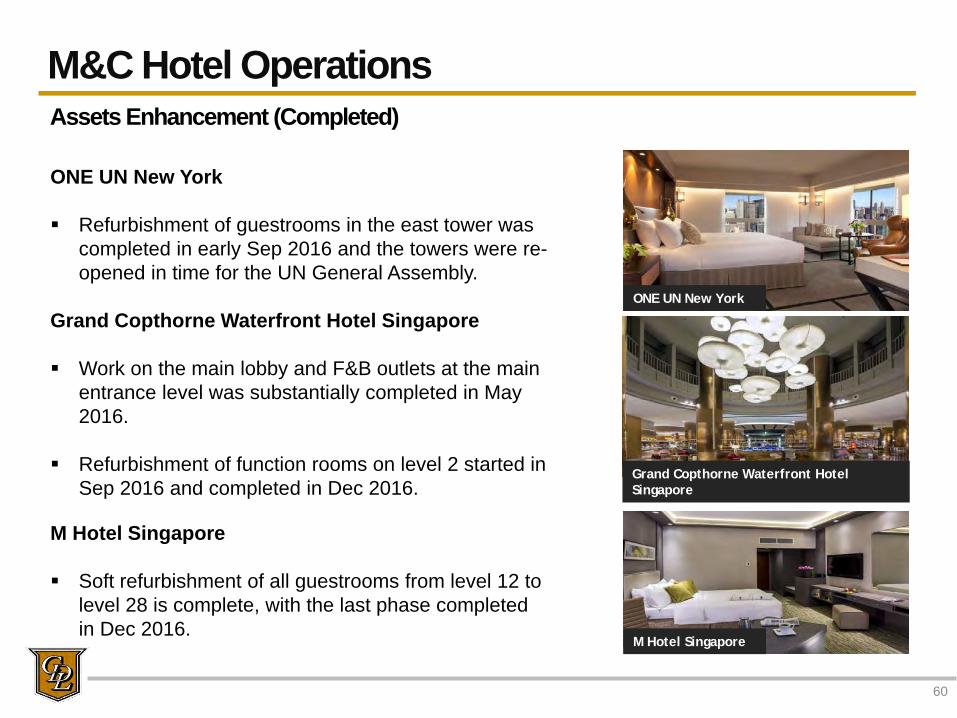
ONE UN New York
Refurbishment of guestrooms in the east tower was completed in early Sep 2016 and the towers were re-opened in time for the UN General Assembly
Assets Enhancement (Completed)
Grand Copthorne Waterfront Hotel Singapore
Work on the main lobby and FampB outlets at the main entrance level was substantially completed in May 2016
Refurbishment of function rooms on level 2 started in Sep 2016 and completed in Dec 2016
M Hotel Singapore
Soft refurbishment of all guestrooms from level 12 to level 28 is complete with the last phase completed in Dec 2016
ONE UN New York
Grand Copthorne Waterfront Hotel Singapore
M Hotel Singapore
MampC Hotel Operations
61
Grand Millennium Kuala Lumpur
Soft refurbishment of guestrooms from level 9 to level 19 was completed at the beginning of the 4th quarter of 2016
Remaining guestrooms at level 7 and level 8 is planned to be refurbished in the mid 2017
Assets Enhancement (On-going)
Grand Millennium Kuala Lumpur
Copthorne Hotel Auckland Harbour City
Copthorne Hotel Auckland Harbour City
Closed for a major refurbishment programme in Q3 2015 at an estimated cost of NZ$40 million
The hotel will be rebranded as M Social Hotel Auckland and is expected to re-open in 2nd quarter of 2017
Artistrsquos Impression
Artistrsquos Impression
31 Dec 31 Dec 31 Dec 31 DecHotel and Room Count 2016 2015 2016 2015By region New York 4 4 2238 2238 Regional US 15 15 4559 4463 London 8 8 2651 2651 Rest of Europe 19 18 3081 2867 Middle East 26 22 7805 6450 Singapore 7 6 3011 2716 Rest of Asia 27 26 10036 9430 Australasia 25 27 3641 3903 Total 131 126 37022 34718
PipelineBy region Middle East 17 16 5465 4663 Rest of Asia 4 3 1608 1674 Regional USA 1 1 263 263 Rest of Europe 1 - 153 - Total 23 20 7489 6600
Hotels Rooms
Hotel Room Count and Pipeline
MampC Hotel Operations
Mainly management contracts
62
Millennium Biltmore Hotel Los Angeles
Grand Millennium Auckland
Sheet1
CDL Hospitality Trusts
63
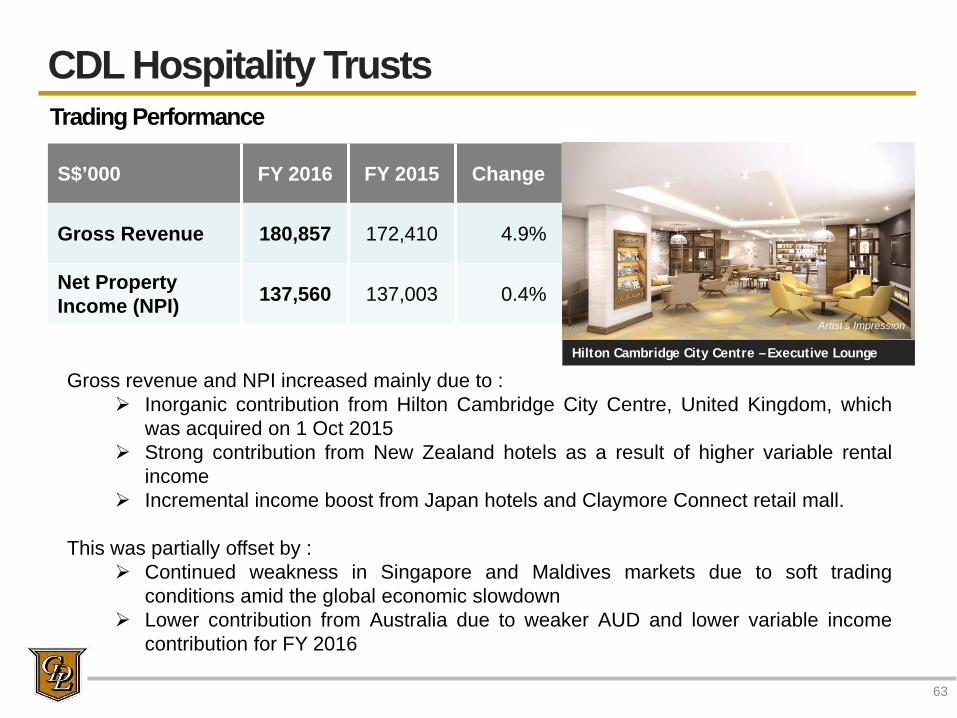
S$rsquo000 FY 2016 FY 2015 Change
Gross Revenue 180857 172410 49
Net Property Income (NPI) 137560 137003 04
Trading Performance
Hilton Cambridge City Centre ndash Executive Lounge
Artistrsquos Impression
Gross revenue and NPI increased mainly due to Inorganic contribution from Hilton Cambridge City Centre United Kingdom which
was acquired on 1 Oct 2015 Strong contribution from New Zealand hotels as a result of higher variable rental
income Incremental income boost from Japan hotels and Claymore Connect retail mall
This was partially offset by Continued weakness in Singapore and Maldives markets due to soft trading
conditions amid the global economic slowdown Lower contribution from Australia due to weaker AUD and lower variable income
contribution for FY 2016
Artistrsquos Impression
Disclaimer
This document may contain forward-looking statements that involve assumptions risks and uncertainties Actual future performance outcomes and results may differ materially from those expressed in forward-looking statements as a result of a number of risks uncertainties and assumptions Representative examples of these factors include (without limitation) general industry and economic conditions interest rate trends cost of capital and capital availability availability of real estate properties competition from other developments or companies shifts in customer demands customers and partners expected levels of occupancy rate property rental income charge out collections changes in operating expenses (including employee wages benefits and training costs) governmental and public policy changes and the continued availability of financing in the amounts and the terms necessary to support future business You are cautioned not to place undue reliance on these forward-looking statements which are based on the current view of management on future events Numbers in tables and charts may not add up due to rounding
Gramercy Park Singaporewwwcdlcomsg
Slide Number 1
Slide Number 2
Slide Number 3
Slide Number 4
Slide Number 5
Slide Number 6
Slide Number 7
Slide Number 8
Slide Number 9
Slide Number 10
Slide Number 11
Slide Number 12
Slide Number 13
Slide Number 14
Slide Number 15
Slide Number 16
Slide Number 17
Slide Number 18
Slide Number 19
Slide Number 20
Slide Number 21
Slide Number 22
Slide Number 23
Slide Number 24
Slide Number 25
Slide Number 26
Slide Number 27
Slide Number 28
Slide Number 29
Slide Number 30
Slide Number 31
Slide Number 32
Slide Number 33
Slide Number 34
Slide Number 35
Slide Number 36
Slide Number 37
Slide Number 38
Slide Number 39
Slide Number 40
Slide Number 41
Slide Number 42
Slide Number 43
Slide Number 44
Slide Number 45
Slide Number 46
Slide Number 47
Slide Number 48
Slide Number 49
Slide Number 50
Slide Number 51
Slide Number 52
Slide Number 53
Slide Number 54
Slide Number 55
Slide Number 56
Slide Number 57
Slide Number 58
Slide Number 59
Slide Number 60
Slide Number 61
Slide Number 62
Slide Number 63
Slide Number 64
Slide Number 65
Hotels
Rooms
31 Dec
31 Dec
31 Dec
31 Dec
Hotel and Room Count
2016
2015
2016
2015
By region
New York
4
4
2238
2238
Regional US
15
15
4559
4463
London
8
8
2651
2651
Rest of Europe
19
18
3081
2867
Middle East
26
22
7805
6450
Singapore
7
6
3011
2716
Rest of Asia
27
26
10036
9430
Australasia
25
27
3641
3903
Total
131
126
37022
34718
Pipeline
By region
Middle East
17
16
5465
4663
Rest of Asia
4
3
1608
1674
Regional USA
1
1
263
263
Rest of Europe
1
- 0
153
- 0
Total
23
20
7489
6600
FY 2016
Reported Currency
Constant Currency
New York
pound14564
uarr 19
darr 99
Regional US
pound5749
uarr175
uarr 40
Total US
pound8652
uarr 83
darr 42
London
pound10718
darr 14
darr 14
Rest of Europe
pound5261
uarr 20
darr 16
Total Europe
pound8024
darr 08
darr 20
Singapore
pound8021
uarr 05
darr 101
Rest of Asia
pound6063
uarr 116
uarr 19
Total Asia
pound6821
uarr 62
darr 40
Australasia
pound5840
uarr 348
uarr 209
Total Group
pound7671
uarr 66
darr 23
Project
Equity Stake
Total Units
Units Sold
Sold
Total Unsold Inventory
CDLrsquos Share of Unsold Inventory
St Regis Residences
33
173
161
93
12
4
The Oceanfront Sentosa Cove
50
264
263
99
1
05
One Shenton
100
341
327
96
14
14
Cliveden at Grange
100
110
44
40
66
66
UPRobertson Quay
100
70
57
81
13
13
Echelon
50
508
506
100
2
1
DNest
51
912
904
99
8
408
Jewel Buangkok
100
616
616
100
0
0
The Venue Shoppes
60
28
16
57
12
72
The Venue Residences
60
266
181
68
85
51
Coco Palms
51
944
865
92
79
4029
The Brownstone Executive Condo
70
638
519
81
119
833
The Criterion Executive Condo
70
505
179
35
326
2282
Gramercy Park
100
174
46
53^
41^
41^
(Phase 1 = 87-unit North Tower)
Forest Woods
50
519
382
74
137
685
Bartley Ridge
30
868
868
100
0
0
Commonwealth Towers
30
845
461
55
384
1152
TOTAL
7781
6395
1299
7373
Revenue
Profit Before Tax
Q4 2016
Q4 2016
Incr (Decr)
Q4 2016
Q4 2015
Incr (Decr)
$M
$M
$M
$M
Property Development
5981
2417
1475
2426
1158
1095
Hotel Operations(include CDL owned hotels)
4437
4627
(41)
(92)
91
NM
Rental Properties
887
1049
(154)
1008
3491
(711)
Others
365
457
(201)
(27)
(27)
-
- 0
11670
8550
365
3315
4713
(297)
FY 2016
FY 2015
Incr (Decr)
FY 2016
FY 2015
Incr (Decr)
$M
$M
$M
$M
Property Development
17447
10371
682
5197
3559
460
Hotel Operations(include CDL owned hotels)
16337
16981
(38)
1157
1709
(323)
Rental Properties
3669
4055
(95)
2073
4602
(550)
Others
1601
1634
(20)
713
(16)
NM
39054
33041
182
9140
9854
(72)
AGENDA
bull EXECUTIVE SUMMARY
bull FINANCIAL HIGHLIGHTS
bull SINGAPORE OVERVIEW
bull INTERNATIONAL OVERVIEW
bull HOTEL OPERATIONS
EXECUTIVE SUMMARY
Key Highlights
4^ Without factoring in fair value gains on investment properties Includes special interim dividend of 40 cents paid in Sep 2016
Creditable PATMI achieved despite headwinds and challengesndash $244 million for Q4 2016 (Q4 2015 $410 million)ndash $653 million for FY 2016 (FY 2015 $773 million)ndash Supported by divestures in City e-Solutions Limited in Q3 2016 and Exchange Tower
in Q4 2016 exiting of equity interest in Nouvel 18ndash Maiden profit contribution of Phase 1 of Suzhou Hong Leong City Center in Q4 2016
Record revenue achieved for FY 2016 - 182 increase to $39 billion - 365 increase in revenue for Q4 2016 $12 billion
Stellar performance of property development business segmentndash 73 of Q4 and 57 of FY 2016 pre-tax profits respectivelyndash 1017 units with sales value of approx $12 billion for FY 2016 in Singapore
South Beach integrated project fully completed JW Marriott Hotel Singapore South Beach soft opened in Dec 2016
Robust financial position maintained - $39 billion with net gearing ratio of 16^ as at 31 Dec 2016
Special final dividend of 40 cents per share in addition to the ordinary dividend of 80 cents per share Total dividends for 2016 160 cents (2015 160 cents)
No fair values adopted on investment properties
Investment properties are stated at cost less accumulated depreciation and accumulated impairment losses
70 to target with 3rd Profit Participation Securities (PPS) in 2016
$9776 millionRaised from PPS transactionand exited interest toluxury freehold residentialproject to a group of Singaporean investors
12
Strategic Thrusts for FY 2017Acquisitive Position with Value Driven Focus
Focus on assets with in-place income in Singapore and overseas $304 million investments in Q1 2017 to date Disciplined capital deployment ndash for physical
assets equities or debt instruments
Grow funds management and capital recycling programme PPS Traditional private equity structures
Future-proof business through investments in new economy platforms
RMB 72 millionInvestment for24 equity stake in Distrii Chinarsquos leading co-workingspace operator
pound58 millionAcquisition of 16 acre Ransomes Wharf sitein Battersea South West London
Artistrsquos Impression
Q1 2017 Acquisition Highlights
To date 19 Feb 2017
Artistrsquos Impression
RMB 900 millionAcquisition of Shanghaicommercial projectMeidao Business Plazain Hongqiao
FINANCIAL HIGHLIGHTS
Financial Highlights
NM Not Meaningful 14
Segment Financial Results
Incr (Decr) Incr (Decr)
Property Development 5981 2417 1475 2426 1158 1095
Inventory of Launched Residential Projects ndashAs of 31 Dec 2016
32
Singapore Property Development
Leasing strategy implemented ^ Based on launched units
Note Above excludes inventory from The Residences at W Singapore ndash Sentosa Cove (203 units) unlaunched projects Nouvel 18 (156 units) and New Futura (124 units)
Sheet1
110
115
120
125
130
135
140
145
Q112
Q212
Q312
Q412
Q113
Q213
Q313
Q413
Q114
Q214
Q314
Q414
Q115
Q215
Q315
Q415
Q116
Q216
Q316
Q416
Office Retail
Source URA Q4 2016
33
Singapore Commercial MarketProperty Price Index ndash Commercial (2012ndash 2016)
Q4 161226
Q4 16 1347
Q3 161223
Q3 16 1355
Source JLL Research Q4 2016
$974
$1051$1204
$1038$914
$790 $837$926
$850$777
000
200
400
600
800
1000
1200
1400
2012 2013 2014 2015 2016
Marina Bay Raffles Place(Grade A)
Whole Island
34
Singapore Office MarketAverage Office Rental in CBD (2012 ndash 2016)
Office Space Demand amp Supply (2012 ndash 2016)Private amp Public Sector
78254 80095 81300 81365 83206
7091372205 72980 73647 73938
30000
35000
40000
45000
50000
55000
60000
65000
70000
75000
80000
85000
2012 2013 2014 2015 2016
Cumulative Supply Occupancy
Source URA Q4 2016
Singapore Office Market
CDLrsquos Office Properties Occupancy
959(National Average = 889)
35
Occupancy as of 31 Dec 2016
2017 2018 2019
33 28 25
Expiry of NLA
36
CDLrsquos Office Space ndash Lease Expiry Profile (2017 ndash 2019)
Rental Properties
Office Portfolio NLA ~2300000 sq ft
16Properties^
959Occupancy
As of 31 December 2016
Note Properties include -Republic Plaza Central Mall (Office Tower) City House Fuji Xerox Towers Manulife Centre Palais Renaissance Tanglin Shopping Centre The Arcade Katong Shopping Centre Kingrsquos Centre 7 amp 9 Tampines Grande 11 Tampines Concourse Sunshine Plaza Fortune Centre Golden Mile Complex Central Mall Conservation Unit
Based on contractual expiry dates Renewals will be negotiated nearer to expiry Tenants may renew their leases or increasereduce space or exit ^ Properties include strata-titled units owned and managed by CDL
60052
61333
6365864271
65079
57060
58599
59955 5963260192
52000
54000
56000
58000
60000
62000
64000
66000
2012 2013 2014 2015 2016
Cumulative Supply Occupancy
Retail Space Demand amp Supply (2012 ndash 2016)Private amp Public Sector
Source URA Q4 2016
With effect from Q1 2014 the coverage of retail space has been expanded to include non-shop retail uses and data are available from2011 onwards
Singapore Retail Market
CDLrsquos Retail Properties Occupancy
964(National Average = 925)
37
Occupancy as of 31 Dec 2016
38
CDLrsquos Retail Space ndash Lease Expiry Profile (2017 ndash 2019)
2017 2018 2019
2332 31
Expiry of NLA
Rental Properties
Retail Portfolio NLA ~840000 sq ft
19Properties^
964Occupancy
As of 31 December 2016
Based on contractual expiry dates Renewals will be negotiated nearer to expiry Tenants may renew their leases or increasereduce space or exit ^ Properties include strata-titled units owned and managed by CDL
Note Properties include ndashRepublic Plaza Central Mall (Office Tower) City Square Mall Palais Renaissance Tanglin Shopping Centre The Arcade Katong Shopping Centre Kingrsquos Centre Quayside Isle Grand Copthorne Waterfront (Waterfront Plaza) City Plaza Golden Mile Complex Central Mall Conservation Unit 7 amp 9 Tampines Grande City House Fortune Centre Manulife Centre Fuji Xerox Towers
39
Revenue by Sector for Full Year (2014 ndash 2016)
0
50
100
150
200
250
300
FY 2016 FY 2015 FY 2014
152187 176
110 113 111
7 8 8
74 75 65
24 23 25
S$ m
illio
n
Office
Retail
Industrial
REITHotel
Others ^
$367m $406m $385m
FY 2016 FY 2015 FY 2014
Office 41 46 46
Retail 30 28 29
Industrial 2 2 2
REITHotel 20 18 17
Others ^ 7 6 6
^ Including car park serviced apartments and residential
Rental Properties
40
EBITDA by Sector for Full Year (2014 ndash 2016)
050
100150200250300350400450500550600
FY 2016 FY 2015 FY 2014
185
446 ~
10175 64 91
5 4 453 58 53
6 15 19
S$ m
illio
n
Office
Retail
Industrial
REITHotel
Others ^
$324m $587m $268m
FY 2016 FY 2015 FY 2014
Office 57 76 38
Retail 23 11 34
Industrial 2 - 1
REITHotel 16 10 20
Others ^ 2 3 7
~ Includes gain on sale of Profit Participation Securities^ Including car park serviced apartments and residential
Rental Properties
South Beach
41
JW Marriott Hotel Singapore South Beach
JW Marriott Hotel Singapore South Beach
Rebranded hotel soft opened in mid-Dec2016
Business performance is within expectations
Ongoing works at NCO Club are expected tocomplete by Q3 2017 along with theremodelled Ballroom
South Beach Residences
190-unit luxury residence may be launchedin 2H 2017 subject to market conditions
Fully Completed in December 2016
Strong Performance for Office amp Retail
South Beach Tower (510000 sq ft office space) and retail space are fully leased
INTERNATIONAL OVERVIEW
Projects Launched To Date
43
Project City Equity Stake
Total Units
Total Units Sold
Booked
Sold Est TotalSaleable
Area (sq ft)
ExpectedCompletion
Australia
Ivy and Eve Brisbane 33 472 450 95 348678 1H 2018
China
Hong Leong City Center (Phase 1)
Suzhou 100^ 1374 1038 76 1378891 Completed
Hong Leong City Center (Phase 2 ndash T2)
Suzhou 100^ 430 174 40 439716 Q4 2017
Hongqiao Royal Lake Shanghai 100 85 34 40 385394 Completed
China ndash Good Progress on Launched Luxury Projects
International Property Development
47
Shanghai ndash Hongqiao Royal Lake (御湖)
Eling Residences Chongqing
Stable sales despite tightening measures in Shanghai
34 units soldbooked with sales value of RMB 668 millionachieved to date
Chongqing ndash Eling Residences (鹅岭峰)
Launched in Oct 2016
8 units soldbooked with sales value of RMB 85 million ndashachieved highest average values of close to RMB 40000 psm
City Equity Stake
Total Units
Total Units Sold Booked
Sold
Expected Completion
Shanghai 100 85 34 40 Completed
Hongqiao Royal Lake Shanghai
City Equity Stake
Total Units
Total Units Sold Booked
Sold
Expected Completion
Chongqing 100 126 8 6 Q2 2017
Artistrsquos Impression
As of 19 Feb 2017
Chongqing ndash Huang Huayuan (黄花园)
Scheduled launch of mixed-use development with over 600 residential units in 2019
48
Over 150000 apartment listings spanning over 20 citiesin China
Offers one-stop solution for apartment owners andrental customers
Investment provides immediate entry into this fast-growing new economy sectorminus Complement business portfoliominus Contributes to future long-term recurring income stream
Synergies to be shared with the Grouprsquos properties inShanghai Suzhou and Chongqing
Strategic Acquisition of 20 Equity Stake in mamahome for RMB 100 million
Distrii ndash Leading Provider of Co-working Space Acquisition completed in Jan 2017
Currently 15 locations (13 Shanghai + 1 Beijing + 1 Hangzhou) 3700 seating capacity in total 10 locations in operation with 5 more locations to open in 1H 2017
Targeting to double the locations in China by end 2017
Current capacity of over 2200 seats has reached above 80 occupancy
Committed to lease over 60000 sq ft in Republic Plaza Expected to open in 1H 2018
Distrii Suhe Center Shanghai
Strategic Acquisition of 24 Equity Stake in Distrii for RMB 72 million
50
Purchase of a 100 equity stake in Shanghai MeidaoInvestment Co which owns the commercial projectthat is in the final stages of construction
Total transaction value of RMB 900 million throughCDL China Limited
Strategically located in Huacao Minhang Districtwithin the Hongqiao CBD ndash a new area established in2009 that spans 86 sq km and is one of Shanghairsquosfastest growing business areas
Project comprises five 9-storey office towers and twolevels of basement carpark with about 351 lots
Project has been approved for division into strata-titleunits
China ndashAcquisition of Shanghai Commercial Project for RMB 900 million
Artistrsquos ImpressionMeidao Business Plaza Shanghai
Meidao Business Plaza ShanghaiTenure Equity
StakeEst Total GFA
(sqm)Expected
Completion
50-year lease 100 32300 2H 2017
International Rental Properties
Artistrsquos Impression
Japan ndash Invested in 2 Prime Residential Projects in Tokyo
Located within prestigious Aoyama area withinMinato ward in Tokyo
Project targeted at high-end domestic and foreignbuyers
Good uptake with over 50 of units sold since itslaunch in Oct 2016
Tokyo ndashPark Court Aoyama The Tower
International Property Development
51
Artistrsquos ImpressionPark Court Aoyama The Tower Tokyo
Tokyo ndash ShirokaneTenure Equity Stake Site Area (sqm)
Freehold 947 16815
Discussions with potential JV partner for project development ongoing
City Equity Stake Total Units
Total Units Sold Expected Completion
Freehold 20 163 Over 50 1H 2018
As of 19 Feb 2017
Teddington Riverside Teddington TW11
Full planning received works on basement car park inadvanced stage
Block A (57 units) will be launched in Q2 2017 followed byanother five blocks
International Property Development
52
UK ndash Upcoming Launches in Q2 2017
Artistrsquos Impression
Tenure EquityStake
Total Units Est TotalSaleable Area
(sq ft)
Expected Completion
Freehold 100 220 240000 2018 (Phased)
Teddington Riverside London
Project Tenure Equity Stake
Total Units
Est TotalSaleable
Area (sq ft)
Expected Completion
Belgravia Freehold 100 6 12375 Q2 2017
Knightsbridge Freehold 100 3 5193 Q2 2017
Belgravia3135 Chesham Street London SW1X 8NQ
Knightsbridge32 Hans Road London SW3 1RW
Chelsea 90-100 Sydney Street London SW3 6NJ
International Property Development
53
UK ndash Pipeline Projects
Tenure EquityStake
Total Units Est TotalSaleable Area
(sq ft)
Expected Completion
Freehold 100 9 16143 Q2 2018
Stag Brewery London
Tenure Equity Stake Est Total Saleable Area (sq ft)
Freehold 100 1000000 sq ft
Stag Brewery Mortlake London SW14
Advanced master plan at public consultation stage
Planning applications to be submitted by end Q2 2017
Proposed scheme to comprise two phases Parameter plan covering the entire site Detailed planning application for Phase 1Artistrsquos Impression
Artistrsquos Impression
Good progress on works
Expected completion in Q2 2018
International Property Development
54
Tenure Equity Stake Total Units Est GFA (sq ft)
Freehold 100 34 135000
28 Pavilion Road Knightsbridge London SW1
First luxury home care development to be built in Central Londonndash planning consent obtained
Project on target to commence demolition works in Q2 2017Artistrsquos ImpressionPavilion Road
UK ndash Pipeline Projects
Development House
Planning application to be submitted in Q2 2017
Existing 28000 sq ft remains fully leased and vacantpossession expected from Q2 2018
Development House Leonard Street in Shoreditch
Tenure Equity Stake Est Total Lettable Area (sq ft)
Freehold 100 90000 sq ft
Artistrsquos Impression
Artistrsquos Impression
UK ndashAcquisition of 16-acre Ransomes Wharf site for pound58 million
Located within Battersearsquos creative quarter on theRiver Thames
Est GDV of pound222 million
Contracts completed purchase to be phased overthe next 18 months
Profit before tax pound108m pound109m (09) pound124m (129)
PATMI pound78m pound65m 200
Trading Performance
The Baileyrsquos Hotel London The Baileyrsquos Hotel London
Increase in reported revenue attributed to higher land sales in New Zealand and a higher contribution from Millennium Mitsui Garden Hotel Tokyo coupled with favourable foreign exchange movements as a result of weak pound against major currencies
MampC Hotel Operations
58
Trading Performance
RevPAR in reported currency was up by 66 but in constant currency fell by 23 for FY 2016 as compared to the same period last year
FY 2016 Reported Currency Constant CurrencyNew York pound14564 uarr 19 darr 99Regional US pound5749 uarr175 uarr 40Total US pound8652 uarr 83 darr 42London pound10718 darr 14 darr 14Rest of Europe pound5261 uarr 20 darr 16Total Europe pound8024 darr 08 darr 20Singapore pound8021 uarr 05 darr 101Rest of Asia pound6063 uarr 116 uarr 19Total Asia pound6821 uarr 62 darr 40Australasia pound5840 uarr 348 uarr 209Total Group pound7671 uarr 66 darr 23 Millennium Seoul Hilton
Copthorne Hotel amp Resort Queenstown Lakefront
Sheet1
Developments ndash Progressing well
The lifestyle hotel and serviced apartment has 306 and 209keys respectively
The building permit approval for Seoul Yangdong developmentproject has been received on 25 January 2017 Additionalcertification processes are expected to complete by mid 2017
The main contract tender process is planned to complete bymid 2017 before construction work starts
Seoul South Korea
59
Comprises a 263-room hotel and a 250-unit residentialapartment block
The final planning approval has been received in December2016
Currently reviewing the project costing and specification whichis anticipated to take about 18 months to complete aftercommencement
Sunnyvale US
MampC Hotel Operations
MampC Hotel Operations
60
ONE UN New York
Refurbishment of guestrooms in the east tower was completed in early Sep 2016 and the towers were re-opened in time for the UN General Assembly
Assets Enhancement (Completed)
Grand Copthorne Waterfront Hotel Singapore
Work on the main lobby and FampB outlets at the main entrance level was substantially completed in May 2016
Refurbishment of function rooms on level 2 started in Sep 2016 and completed in Dec 2016
M Hotel Singapore
Soft refurbishment of all guestrooms from level 12 to level 28 is complete with the last phase completed in Dec 2016
ONE UN New York
Grand Copthorne Waterfront Hotel Singapore
M Hotel Singapore
MampC Hotel Operations
61
Grand Millennium Kuala Lumpur
Soft refurbishment of guestrooms from level 9 to level 19 was completed at the beginning of the 4th quarter of 2016
Remaining guestrooms at level 7 and level 8 is planned to be refurbished in the mid 2017
Assets Enhancement (On-going)
Grand Millennium Kuala Lumpur
Copthorne Hotel Auckland Harbour City
Copthorne Hotel Auckland Harbour City
Closed for a major refurbishment programme in Q3 2015 at an estimated cost of NZ$40 million
The hotel will be rebranded as M Social Hotel Auckland and is expected to re-open in 2nd quarter of 2017
Artistrsquos Impression
Artistrsquos Impression
31 Dec 31 Dec 31 Dec 31 DecHotel and Room Count 2016 2015 2016 2015By region New York 4 4 2238 2238 Regional US 15 15 4559 4463 London 8 8 2651 2651 Rest of Europe 19 18 3081 2867 Middle East 26 22 7805 6450 Singapore 7 6 3011 2716 Rest of Asia 27 26 10036 9430 Australasia 25 27 3641 3903 Total 131 126 37022 34718
PipelineBy region Middle East 17 16 5465 4663 Rest of Asia 4 3 1608 1674 Regional USA 1 1 263 263 Rest of Europe 1 - 153 - Total 23 20 7489 6600
Hotels Rooms
Hotel Room Count and Pipeline
MampC Hotel Operations
Mainly management contracts
62
Millennium Biltmore Hotel Los Angeles
Grand Millennium Auckland
Sheet1
CDL Hospitality Trusts
63
S$rsquo000 FY 2016 FY 2015 Change
Gross Revenue 180857 172410 49
Net Property Income (NPI) 137560 137003 04
Trading Performance
Hilton Cambridge City Centre ndash Executive Lounge
Artistrsquos Impression
Gross revenue and NPI increased mainly due to Inorganic contribution from Hilton Cambridge City Centre United Kingdom which
was acquired on 1 Oct 2015 Strong contribution from New Zealand hotels as a result of higher variable rental
income Incremental income boost from Japan hotels and Claymore Connect retail mall
This was partially offset by Continued weakness in Singapore and Maldives markets due to soft trading
conditions amid the global economic slowdown Lower contribution from Australia due to weaker AUD and lower variable income
contribution for FY 2016
Artistrsquos Impression
Disclaimer
This document may contain forward-looking statements that involve assumptions risks and uncertainties Actual future performance outcomes and results may differ materially from those expressed in forward-looking statements as a result of a number of risks uncertainties and assumptions Representative examples of these factors include (without limitation) general industry and economic conditions interest rate trends cost of capital and capital availability availability of real estate properties competition from other developments or companies shifts in customer demands customers and partners expected levels of occupancy rate property rental income charge out collections changes in operating expenses (including employee wages benefits and training costs) governmental and public policy changes and the continued availability of financing in the amounts and the terms necessary to support future business You are cautioned not to place undue reliance on these forward-looking statements which are based on the current view of management on future events Numbers in tables and charts may not add up due to rounding
Gramercy Park Singaporewwwcdlcomsg
Slide Number 1
Slide Number 2
Slide Number 3
Slide Number 4
Slide Number 5
Slide Number 6
Slide Number 7
Slide Number 8
Slide Number 9
Slide Number 10
Slide Number 11
Slide Number 12
Slide Number 13
Slide Number 14
Slide Number 15
Slide Number 16
Slide Number 17
Slide Number 18
Slide Number 19
Slide Number 20
Slide Number 21
Slide Number 22
Slide Number 23
Slide Number 24
Slide Number 25
Slide Number 26
Slide Number 27
Slide Number 28
Slide Number 29
Slide Number 30
Slide Number 31
Slide Number 32
Slide Number 33
Slide Number 34
Slide Number 35
Slide Number 36
Slide Number 37
Slide Number 38
Slide Number 39
Slide Number 40
Slide Number 41
Slide Number 42
Slide Number 43
Slide Number 44
Slide Number 45
Slide Number 46
Slide Number 47
Slide Number 48
Slide Number 49
Slide Number 50
Slide Number 51
Slide Number 52
Slide Number 53
Slide Number 54
Slide Number 55
Slide Number 56
Slide Number 57
Slide Number 58
Slide Number 59
Slide Number 60
Slide Number 61
Slide Number 62
Slide Number 63
Slide Number 64
Slide Number 65
Hotels
Rooms
31 Dec
31 Dec
31 Dec
31 Dec
Hotel and Room Count
2016
2015
2016
2015
By region
New York
4
4
2238
2238
Regional US
15
15
4559
4463
London
8
8
2651
2651
Rest of Europe
19
18
3081
2867
Middle East
26
22
7805
6450
Singapore
7
6
3011
2716
Rest of Asia
27
26
10036
9430
Australasia
25
27
3641
3903
Total
131
126
37022
34718
Pipeline
By region
Middle East
17
16
5465
4663
Rest of Asia
4
3
1608
1674
Regional USA
1
1
263
263
Rest of Europe
1
- 0
153
- 0
Total
23
20
7489
6600
FY 2016
Reported Currency
Constant Currency
New York
pound14564
uarr 19
darr 99
Regional US
pound5749
uarr175
uarr 40
Total US
pound8652
uarr 83
darr 42
London
pound10718
darr 14
darr 14
Rest of Europe
pound5261
uarr 20
darr 16
Total Europe
pound8024
darr 08
darr 20
Singapore
pound8021
uarr 05
darr 101
Rest of Asia
pound6063
uarr 116
uarr 19
Total Asia
pound6821
uarr 62
darr 40
Australasia
pound5840
uarr 348
uarr 209
Total Group
pound7671
uarr 66
darr 23
Project
Equity Stake
Total Units
Units Sold
Sold
Total Unsold Inventory
CDLrsquos Share of Unsold Inventory
St Regis Residences
33
173
161
93
12
4
The Oceanfront Sentosa Cove
50
264
263
99
1
05
One Shenton
100
341
327
96
14
14
Cliveden at Grange
100
110
44
40
66
66
UPRobertson Quay
100
70
57
81
13
13
Echelon
50
508
506
100
2
1
DNest
51
912
904
99
8
408
Jewel Buangkok
100
616
616
100
0
0
The Venue Shoppes
60
28
16
57
12
72
The Venue Residences
60
266
181
68
85
51
Coco Palms
51
944
865
92
79
4029
The Brownstone Executive Condo
70
638
519
81
119
833
The Criterion Executive Condo
70
505
179
35
326
2282
Gramercy Park
100
174
46
53^
41^
41^
(Phase 1 = 87-unit North Tower)
Forest Woods
50
519
382
74
137
685
Bartley Ridge
30
868
868
100
0
0
Commonwealth Towers
30
845
461
55
384
1152
TOTAL
7781
6395
1299
7373
Revenue
Profit Before Tax
Q4 2016
Q4 2016
Incr (Decr)
Q4 2016
Q4 2015
Incr (Decr)
$M
$M
$M
$M
Property Development
5981
2417
1475
2426
1158
1095
Hotel Operations(include CDL owned hotels)
4437
4627
(41)
(92)
91
NM
Rental Properties
887
1049
(154)
1008
3491
(711)
Others
365
457
(201)
(27)
(27)
-
- 0
11670
8550
365
3315
4713
(297)
FY 2016
FY 2015
Incr (Decr)
FY 2016
FY 2015
Incr (Decr)
$M
$M
$M
$M
Property Development
17447
10371
682
5197
3559
460
Hotel Operations(include CDL owned hotels)
16337
16981
(38)
1157
1709
(323)
Rental Properties
3669
4055
(95)
2073
4602
(550)
Others
1601
1634
(20)
713
(16)
NM
39054
33041
182
9140
9854
(72)
Portfolio Composition ndash FY 2016
6
Earnings before interest tax depreciation and amortisation^ Excludes tax recoverable and deferred tax asset
70 to target with 3rd Profit Participation Securities (PPS) in 2016
$9776 millionRaised from PPS transactionand exited interest toluxury freehold residentialproject to a group of Singaporean investors
12
Strategic Thrusts for FY 2017Acquisitive Position with Value Driven Focus
Focus on assets with in-place income in Singapore and overseas $304 million investments in Q1 2017 to date Disciplined capital deployment ndash for physical
assets equities or debt instruments
Grow funds management and capital recycling programme PPS Traditional private equity structures
Future-proof business through investments in new economy platforms
RMB 72 millionInvestment for24 equity stake in Distrii Chinarsquos leading co-workingspace operator
pound58 millionAcquisition of 16 acre Ransomes Wharf sitein Battersea South West London
Artistrsquos Impression
Q1 2017 Acquisition Highlights
To date 19 Feb 2017
Artistrsquos Impression
RMB 900 millionAcquisition of Shanghaicommercial projectMeidao Business Plazain Hongqiao
FINANCIAL HIGHLIGHTS
Financial Highlights
NM Not Meaningful 14
Segment Financial Results
Incr (Decr) Incr (Decr)
Property Development 5981 2417 1475 2426 1158 1095
Inventory of Launched Residential Projects ndashAs of 31 Dec 2016
32
Singapore Property Development
Leasing strategy implemented ^ Based on launched units
Note Above excludes inventory from The Residences at W Singapore ndash Sentosa Cove (203 units) unlaunched projects Nouvel 18 (156 units) and New Futura (124 units)
Sheet1
110
115
120
125
130
135
140
145
Q112
Q212
Q312
Q412
Q113
Q213
Q313
Q413
Q114
Q214
Q314
Q414
Q115
Q215
Q315
Q415
Q116
Q216
Q316
Q416
Office Retail
Source URA Q4 2016
33
Singapore Commercial MarketProperty Price Index ndash Commercial (2012ndash 2016)
Q4 161226
Q4 16 1347
Q3 161223
Q3 16 1355
Source JLL Research Q4 2016
$974
$1051$1204
$1038$914
$790 $837$926
$850$777
000
200
400
600
800
1000
1200
1400
2012 2013 2014 2015 2016
Marina Bay Raffles Place(Grade A)
Whole Island
34
Singapore Office MarketAverage Office Rental in CBD (2012 ndash 2016)
Office Space Demand amp Supply (2012 ndash 2016)Private amp Public Sector
78254 80095 81300 81365 83206
7091372205 72980 73647 73938
30000
35000
40000
45000
50000
55000
60000
65000
70000
75000
80000
85000
2012 2013 2014 2015 2016
Cumulative Supply Occupancy
Source URA Q4 2016
Singapore Office Market
CDLrsquos Office Properties Occupancy
959(National Average = 889)
35
Occupancy as of 31 Dec 2016
2017 2018 2019
33 28 25
Expiry of NLA
36
CDLrsquos Office Space ndash Lease Expiry Profile (2017 ndash 2019)
Rental Properties
Office Portfolio NLA ~2300000 sq ft
16Properties^
959Occupancy
As of 31 December 2016
Note Properties include -Republic Plaza Central Mall (Office Tower) City House Fuji Xerox Towers Manulife Centre Palais Renaissance Tanglin Shopping Centre The Arcade Katong Shopping Centre Kingrsquos Centre 7 amp 9 Tampines Grande 11 Tampines Concourse Sunshine Plaza Fortune Centre Golden Mile Complex Central Mall Conservation Unit
Based on contractual expiry dates Renewals will be negotiated nearer to expiry Tenants may renew their leases or increasereduce space or exit ^ Properties include strata-titled units owned and managed by CDL
60052
61333
6365864271
65079
57060
58599
59955 5963260192
52000
54000
56000
58000
60000
62000
64000
66000
2012 2013 2014 2015 2016
Cumulative Supply Occupancy
Retail Space Demand amp Supply (2012 ndash 2016)Private amp Public Sector
Source URA Q4 2016
With effect from Q1 2014 the coverage of retail space has been expanded to include non-shop retail uses and data are available from2011 onwards
Singapore Retail Market
CDLrsquos Retail Properties Occupancy
964(National Average = 925)
37
Occupancy as of 31 Dec 2016
38
CDLrsquos Retail Space ndash Lease Expiry Profile (2017 ndash 2019)
2017 2018 2019
2332 31
Expiry of NLA
Rental Properties
Retail Portfolio NLA ~840000 sq ft
19Properties^
964Occupancy
As of 31 December 2016
Based on contractual expiry dates Renewals will be negotiated nearer to expiry Tenants may renew their leases or increasereduce space or exit ^ Properties include strata-titled units owned and managed by CDL
Note Properties include ndashRepublic Plaza Central Mall (Office Tower) City Square Mall Palais Renaissance Tanglin Shopping Centre The Arcade Katong Shopping Centre Kingrsquos Centre Quayside Isle Grand Copthorne Waterfront (Waterfront Plaza) City Plaza Golden Mile Complex Central Mall Conservation Unit 7 amp 9 Tampines Grande City House Fortune Centre Manulife Centre Fuji Xerox Towers
39
Revenue by Sector for Full Year (2014 ndash 2016)
0
50
100
150
200
250
300
FY 2016 FY 2015 FY 2014
152187 176
110 113 111
7 8 8
74 75 65
24 23 25
S$ m
illio
n
Office
Retail
Industrial
REITHotel
Others ^
$367m $406m $385m
FY 2016 FY 2015 FY 2014
Office 41 46 46
Retail 30 28 29
Industrial 2 2 2
REITHotel 20 18 17
Others ^ 7 6 6
^ Including car park serviced apartments and residential
Rental Properties
40
EBITDA by Sector for Full Year (2014 ndash 2016)
050
100150200250300350400450500550600
FY 2016 FY 2015 FY 2014
185
446 ~
10175 64 91
5 4 453 58 53
6 15 19
S$ m
illio
n
Office
Retail
Industrial
REITHotel
Others ^
$324m $587m $268m
FY 2016 FY 2015 FY 2014
Office 57 76 38
Retail 23 11 34
Industrial 2 - 1
REITHotel 16 10 20
Others ^ 2 3 7
~ Includes gain on sale of Profit Participation Securities^ Including car park serviced apartments and residential
Rental Properties
South Beach
41
JW Marriott Hotel Singapore South Beach
JW Marriott Hotel Singapore South Beach
Rebranded hotel soft opened in mid-Dec2016
Business performance is within expectations
Ongoing works at NCO Club are expected tocomplete by Q3 2017 along with theremodelled Ballroom
South Beach Residences
190-unit luxury residence may be launchedin 2H 2017 subject to market conditions
Fully Completed in December 2016
Strong Performance for Office amp Retail
South Beach Tower (510000 sq ft office space) and retail space are fully leased
INTERNATIONAL OVERVIEW
Projects Launched To Date
43
Project City Equity Stake
Total Units
Total Units Sold
Booked
Sold Est TotalSaleable
Area (sq ft)
ExpectedCompletion
Australia
Ivy and Eve Brisbane 33 472 450 95 348678 1H 2018
China
Hong Leong City Center (Phase 1)
Suzhou 100^ 1374 1038 76 1378891 Completed
Hong Leong City Center (Phase 2 ndash T2)
Suzhou 100^ 430 174 40 439716 Q4 2017
Hongqiao Royal Lake Shanghai 100 85 34 40 385394 Completed
China ndash Good Progress on Launched Luxury Projects
International Property Development
47
Shanghai ndash Hongqiao Royal Lake (御湖)
Eling Residences Chongqing
Stable sales despite tightening measures in Shanghai
34 units soldbooked with sales value of RMB 668 millionachieved to date
Chongqing ndash Eling Residences (鹅岭峰)
Launched in Oct 2016
8 units soldbooked with sales value of RMB 85 million ndashachieved highest average values of close to RMB 40000 psm
City Equity Stake
Total Units
Total Units Sold Booked
Sold
Expected Completion
Shanghai 100 85 34 40 Completed
Hongqiao Royal Lake Shanghai
City Equity Stake
Total Units
Total Units Sold Booked
Sold
Expected Completion
Chongqing 100 126 8 6 Q2 2017
Artistrsquos Impression
As of 19 Feb 2017
Chongqing ndash Huang Huayuan (黄花园)
Scheduled launch of mixed-use development with over 600 residential units in 2019
48
Over 150000 apartment listings spanning over 20 citiesin China
Offers one-stop solution for apartment owners andrental customers
Investment provides immediate entry into this fast-growing new economy sectorminus Complement business portfoliominus Contributes to future long-term recurring income stream
Synergies to be shared with the Grouprsquos properties inShanghai Suzhou and Chongqing
Strategic Acquisition of 20 Equity Stake in mamahome for RMB 100 million
Distrii ndash Leading Provider of Co-working Space Acquisition completed in Jan 2017
Currently 15 locations (13 Shanghai + 1 Beijing + 1 Hangzhou) 3700 seating capacity in total 10 locations in operation with 5 more locations to open in 1H 2017
Targeting to double the locations in China by end 2017
Current capacity of over 2200 seats has reached above 80 occupancy
Committed to lease over 60000 sq ft in Republic Plaza Expected to open in 1H 2018
Distrii Suhe Center Shanghai
Strategic Acquisition of 24 Equity Stake in Distrii for RMB 72 million
50
Purchase of a 100 equity stake in Shanghai MeidaoInvestment Co which owns the commercial projectthat is in the final stages of construction
Total transaction value of RMB 900 million throughCDL China Limited
Strategically located in Huacao Minhang Districtwithin the Hongqiao CBD ndash a new area established in2009 that spans 86 sq km and is one of Shanghairsquosfastest growing business areas
Project comprises five 9-storey office towers and twolevels of basement carpark with about 351 lots
Project has been approved for division into strata-titleunits
China ndashAcquisition of Shanghai Commercial Project for RMB 900 million
Artistrsquos ImpressionMeidao Business Plaza Shanghai
Meidao Business Plaza ShanghaiTenure Equity
StakeEst Total GFA
(sqm)Expected
Completion
50-year lease 100 32300 2H 2017
International Rental Properties
Artistrsquos Impression
Japan ndash Invested in 2 Prime Residential Projects in Tokyo
Located within prestigious Aoyama area withinMinato ward in Tokyo
Project targeted at high-end domestic and foreignbuyers
Good uptake with over 50 of units sold since itslaunch in Oct 2016
Tokyo ndashPark Court Aoyama The Tower
International Property Development
51
Artistrsquos ImpressionPark Court Aoyama The Tower Tokyo
Tokyo ndash ShirokaneTenure Equity Stake Site Area (sqm)
Freehold 947 16815
Discussions with potential JV partner for project development ongoing
City Equity Stake Total Units
Total Units Sold Expected Completion
Freehold 20 163 Over 50 1H 2018
As of 19 Feb 2017
Teddington Riverside Teddington TW11
Full planning received works on basement car park inadvanced stage
Block A (57 units) will be launched in Q2 2017 followed byanother five blocks
International Property Development
52
UK ndash Upcoming Launches in Q2 2017
Artistrsquos Impression
Tenure EquityStake
Total Units Est TotalSaleable Area
(sq ft)
Expected Completion
Freehold 100 220 240000 2018 (Phased)
Teddington Riverside London
Project Tenure Equity Stake
Total Units
Est TotalSaleable
Area (sq ft)
Expected Completion
Belgravia Freehold 100 6 12375 Q2 2017
Knightsbridge Freehold 100 3 5193 Q2 2017
Belgravia3135 Chesham Street London SW1X 8NQ
Knightsbridge32 Hans Road London SW3 1RW
Chelsea 90-100 Sydney Street London SW3 6NJ
International Property Development
53
UK ndash Pipeline Projects
Tenure EquityStake
Total Units Est TotalSaleable Area
(sq ft)
Expected Completion
Freehold 100 9 16143 Q2 2018
Stag Brewery London
Tenure Equity Stake Est Total Saleable Area (sq ft)
Freehold 100 1000000 sq ft
Stag Brewery Mortlake London SW14
Advanced master plan at public consultation stage
Planning applications to be submitted by end Q2 2017
Proposed scheme to comprise two phases Parameter plan covering the entire site Detailed planning application for Phase 1Artistrsquos Impression
Artistrsquos Impression
Good progress on works
Expected completion in Q2 2018
International Property Development
54
Tenure Equity Stake Total Units Est GFA (sq ft)
Freehold 100 34 135000
28 Pavilion Road Knightsbridge London SW1
First luxury home care development to be built in Central Londonndash planning consent obtained
Project on target to commence demolition works in Q2 2017Artistrsquos ImpressionPavilion Road
UK ndash Pipeline Projects
Development House
Planning application to be submitted in Q2 2017
Existing 28000 sq ft remains fully leased and vacantpossession expected from Q2 2018
Development House Leonard Street in Shoreditch
Tenure Equity Stake Est Total Lettable Area (sq ft)
Freehold 100 90000 sq ft
Artistrsquos Impression
Artistrsquos Impression
UK ndashAcquisition of 16-acre Ransomes Wharf site for pound58 million
Located within Battersearsquos creative quarter on theRiver Thames
Est GDV of pound222 million
Contracts completed purchase to be phased overthe next 18 months
Profit before tax pound108m pound109m (09) pound124m (129)
PATMI pound78m pound65m 200
Trading Performance
The Baileyrsquos Hotel London The Baileyrsquos Hotel London
Increase in reported revenue attributed to higher land sales in New Zealand and a higher contribution from Millennium Mitsui Garden Hotel Tokyo coupled with favourable foreign exchange movements as a result of weak pound against major currencies
MampC Hotel Operations
58
Trading Performance
RevPAR in reported currency was up by 66 but in constant currency fell by 23 for FY 2016 as compared to the same period last year
FY 2016 Reported Currency Constant CurrencyNew York pound14564 uarr 19 darr 99Regional US pound5749 uarr175 uarr 40Total US pound8652 uarr 83 darr 42London pound10718 darr 14 darr 14Rest of Europe pound5261 uarr 20 darr 16Total Europe pound8024 darr 08 darr 20Singapore pound8021 uarr 05 darr 101Rest of Asia pound6063 uarr 116 uarr 19Total Asia pound6821 uarr 62 darr 40Australasia pound5840 uarr 348 uarr 209Total Group pound7671 uarr 66 darr 23 Millennium Seoul Hilton
Copthorne Hotel amp Resort Queenstown Lakefront
Sheet1
Developments ndash Progressing well
The lifestyle hotel and serviced apartment has 306 and 209keys respectively
The building permit approval for Seoul Yangdong developmentproject has been received on 25 January 2017 Additionalcertification processes are expected to complete by mid 2017
The main contract tender process is planned to complete bymid 2017 before construction work starts
Seoul South Korea
59
Comprises a 263-room hotel and a 250-unit residentialapartment block
The final planning approval has been received in December2016
Currently reviewing the project costing and specification whichis anticipated to take about 18 months to complete aftercommencement
Sunnyvale US
MampC Hotel Operations
MampC Hotel Operations
60
ONE UN New York
Refurbishment of guestrooms in the east tower was completed in early Sep 2016 and the towers were re-opened in time for the UN General Assembly
Assets Enhancement (Completed)
Grand Copthorne Waterfront Hotel Singapore
Work on the main lobby and FampB outlets at the main entrance level was substantially completed in May 2016
Refurbishment of function rooms on level 2 started in Sep 2016 and completed in Dec 2016
M Hotel Singapore
Soft refurbishment of all guestrooms from level 12 to level 28 is complete with the last phase completed in Dec 2016
ONE UN New York
Grand Copthorne Waterfront Hotel Singapore
M Hotel Singapore
MampC Hotel Operations
61
Grand Millennium Kuala Lumpur
Soft refurbishment of guestrooms from level 9 to level 19 was completed at the beginning of the 4th quarter of 2016
Remaining guestrooms at level 7 and level 8 is planned to be refurbished in the mid 2017
Assets Enhancement (On-going)
Grand Millennium Kuala Lumpur
Copthorne Hotel Auckland Harbour City
Copthorne Hotel Auckland Harbour City
Closed for a major refurbishment programme in Q3 2015 at an estimated cost of NZ$40 million
The hotel will be rebranded as M Social Hotel Auckland and is expected to re-open in 2nd quarter of 2017
Artistrsquos Impression
Artistrsquos Impression
31 Dec 31 Dec 31 Dec 31 DecHotel and Room Count 2016 2015 2016 2015By region New York 4 4 2238 2238 Regional US 15 15 4559 4463 London 8 8 2651 2651 Rest of Europe 19 18 3081 2867 Middle East 26 22 7805 6450 Singapore 7 6 3011 2716 Rest of Asia 27 26 10036 9430 Australasia 25 27 3641 3903 Total 131 126 37022 34718
PipelineBy region Middle East 17 16 5465 4663 Rest of Asia 4 3 1608 1674 Regional USA 1 1 263 263 Rest of Europe 1 - 153 - Total 23 20 7489 6600
Hotels Rooms
Hotel Room Count and Pipeline
MampC Hotel Operations
Mainly management contracts
62
Millennium Biltmore Hotel Los Angeles
Grand Millennium Auckland
Sheet1
CDL Hospitality Trusts
63
S$rsquo000 FY 2016 FY 2015 Change
Gross Revenue 180857 172410 49
Net Property Income (NPI) 137560 137003 04
Trading Performance
Hilton Cambridge City Centre ndash Executive Lounge
Artistrsquos Impression
Gross revenue and NPI increased mainly due to Inorganic contribution from Hilton Cambridge City Centre United Kingdom which
was acquired on 1 Oct 2015 Strong contribution from New Zealand hotels as a result of higher variable rental
income Incremental income boost from Japan hotels and Claymore Connect retail mall
This was partially offset by Continued weakness in Singapore and Maldives markets due to soft trading
conditions amid the global economic slowdown Lower contribution from Australia due to weaker AUD and lower variable income
contribution for FY 2016
Artistrsquos Impression
Disclaimer
This document may contain forward-looking statements that involve assumptions risks and uncertainties Actual future performance outcomes and results may differ materially from those expressed in forward-looking statements as a result of a number of risks uncertainties and assumptions Representative examples of these factors include (without limitation) general industry and economic conditions interest rate trends cost of capital and capital availability availability of real estate properties competition from other developments or companies shifts in customer demands customers and partners expected levels of occupancy rate property rental income charge out collections changes in operating expenses (including employee wages benefits and training costs) governmental and public policy changes and the continued availability of financing in the amounts and the terms necessary to support future business You are cautioned not to place undue reliance on these forward-looking statements which are based on the current view of management on future events Numbers in tables and charts may not add up due to rounding
Gramercy Park Singaporewwwcdlcomsg
Slide Number 1
Slide Number 2
Slide Number 3
Slide Number 4
Slide Number 5
Slide Number 6
Slide Number 7
Slide Number 8
Slide Number 9
Slide Number 10
Slide Number 11
Slide Number 12
Slide Number 13
Slide Number 14
Slide Number 15
Slide Number 16
Slide Number 17
Slide Number 18
Slide Number 19
Slide Number 20
Slide Number 21
Slide Number 22
Slide Number 23
Slide Number 24
Slide Number 25
Slide Number 26
Slide Number 27
Slide Number 28
Slide Number 29
Slide Number 30
Slide Number 31
Slide Number 32
Slide Number 33
Slide Number 34
Slide Number 35
Slide Number 36
Slide Number 37
Slide Number 38
Slide Number 39
Slide Number 40
Slide Number 41
Slide Number 42
Slide Number 43
Slide Number 44
Slide Number 45
Slide Number 46
Slide Number 47
Slide Number 48
Slide Number 49
Slide Number 50
Slide Number 51
Slide Number 52
Slide Number 53
Slide Number 54
Slide Number 55
Slide Number 56
Slide Number 57
Slide Number 58
Slide Number 59
Slide Number 60
Slide Number 61
Slide Number 62
Slide Number 63
Slide Number 64
Slide Number 65
Hotels
Rooms
31 Dec
31 Dec
31 Dec
31 Dec
Hotel and Room Count
2016
2015
2016
2015
By region
New York
4
4
2238
2238
Regional US
15
15
4559
4463
London
8
8
2651
2651
Rest of Europe
19
18
3081
2867
Middle East
26
22
7805
6450
Singapore
7
6
3011
2716
Rest of Asia
27
26
10036
9430
Australasia
25
27
3641
3903
Total
131
126
37022
34718
Pipeline
By region
Middle East
17
16
5465
4663
Rest of Asia
4
3
1608
1674
Regional USA
1
1
263
263
Rest of Europe
1
- 0
153
- 0
Total
23
20
7489
6600
FY 2016
Reported Currency
Constant Currency
New York
pound14564
uarr 19
darr 99
Regional US
pound5749
uarr175
uarr 40
Total US
pound8652
uarr 83
darr 42
London
pound10718
darr 14
darr 14
Rest of Europe
pound5261
uarr 20
darr 16
Total Europe
pound8024
darr 08
darr 20
Singapore
pound8021
uarr 05
darr 101
Rest of Asia
pound6063
uarr 116
uarr 19
Total Asia
pound6821
uarr 62
darr 40
Australasia
pound5840
uarr 348
uarr 209
Total Group
pound7671
uarr 66
darr 23
Project
Equity Stake
Total Units
Units Sold
Sold
Total Unsold Inventory
CDLrsquos Share of Unsold Inventory
St Regis Residences
33
173
161
93
12
4
The Oceanfront Sentosa Cove
50
264
263
99
1
05
One Shenton
100
341
327
96
14
14
Cliveden at Grange
100
110
44
40
66
66
UPRobertson Quay
100
70
57
81
13
13
Echelon
50
508
506
100
2
1
DNest
51
912
904
99
8
408
Jewel Buangkok
100
616
616
100
0
0
The Venue Shoppes
60
28
16
57
12
72
The Venue Residences
60
266
181
68
85
51
Coco Palms
51
944
865
92
79
4029
The Brownstone Executive Condo
70
638
519
81
119
833
The Criterion Executive Condo
70
505
179
35
326
2282
Gramercy Park
100
174
46
53^
41^
41^
(Phase 1 = 87-unit North Tower)
Forest Woods
50
519
382
74
137
685
Bartley Ridge
30
868
868
100
0
0
Commonwealth Towers
30
845
461
55
384
1152
TOTAL
7781
6395
1299
7373
Revenue
Profit Before Tax
Q4 2016
Q4 2016
Incr (Decr)
Q4 2016
Q4 2015
Incr (Decr)
$M
$M
$M
$M
Property Development
5981
2417
1475
2426
1158
1095
Hotel Operations(include CDL owned hotels)
4437
4627
(41)
(92)
91
NM
Rental Properties
887
1049
(154)
1008
3491
(711)
Others
365
457
(201)
(27)
(27)
-
- 0
11670
8550
365
3315
4713
(297)
FY 2016
FY 2015
Incr (Decr)
FY 2016
FY 2015
Incr (Decr)
$M
$M
$M
$M
Property Development
17447
10371
682
5197
3559
460
Hotel Operations(include CDL owned hotels)
16337
16981
(38)
1157
1709
(323)
Rental Properties
3669
4055
(95)
2073
4602
(550)
Others
1601
1634
(20)
713
(16)
NM
39054
33041
182
9140
9854
(72)
7
Portfolio Composition ndash FY 2016EBITDA Total Assets
Overseas45
Local55
bull Stability from Recurring Income segments comprising 55 of EBITDA 52 of Total Assets(excluding tax recoverable and deferred tax asset)
bull De-risking Singapore exposure via growing international segments which accounts for 58of EBITDA and 45 of Total Assets
Local42
Overseas58
Diversified Land BankLand Area (as of 31 Dec 2016) ndash CDLrsquos Attributable Share
70 to target with 3rd Profit Participation Securities (PPS) in 2016
$9776 millionRaised from PPS transactionand exited interest toluxury freehold residentialproject to a group of Singaporean investors
12
Strategic Thrusts for FY 2017Acquisitive Position with Value Driven Focus
Focus on assets with in-place income in Singapore and overseas $304 million investments in Q1 2017 to date Disciplined capital deployment ndash for physical
assets equities or debt instruments
Grow funds management and capital recycling programme PPS Traditional private equity structures
Future-proof business through investments in new economy platforms
RMB 72 millionInvestment for24 equity stake in Distrii Chinarsquos leading co-workingspace operator
pound58 millionAcquisition of 16 acre Ransomes Wharf sitein Battersea South West London
Artistrsquos Impression
Q1 2017 Acquisition Highlights
To date 19 Feb 2017
Artistrsquos Impression
RMB 900 millionAcquisition of Shanghaicommercial projectMeidao Business Plazain Hongqiao
FINANCIAL HIGHLIGHTS
Financial Highlights
NM Not Meaningful 14
Segment Financial Results
Incr (Decr) Incr (Decr)
Property Development 5981 2417 1475 2426 1158 1095
Inventory of Launched Residential Projects ndashAs of 31 Dec 2016
32
Singapore Property Development
Leasing strategy implemented ^ Based on launched units
Note Above excludes inventory from The Residences at W Singapore ndash Sentosa Cove (203 units) unlaunched projects Nouvel 18 (156 units) and New Futura (124 units)
Sheet1
110
115
120
125
130
135
140
145
Q112
Q212
Q312
Q412
Q113
Q213
Q313
Q413
Q114
Q214
Q314
Q414
Q115
Q215
Q315
Q415
Q116
Q216
Q316
Q416
Office Retail
Source URA Q4 2016
33
Singapore Commercial MarketProperty Price Index ndash Commercial (2012ndash 2016)
Q4 161226
Q4 16 1347
Q3 161223
Q3 16 1355
Source JLL Research Q4 2016
$974
$1051$1204
$1038$914
$790 $837$926
$850$777
000
200
400
600
800
1000
1200
1400
2012 2013 2014 2015 2016
Marina Bay Raffles Place(Grade A)
Whole Island
34
Singapore Office MarketAverage Office Rental in CBD (2012 ndash 2016)
Office Space Demand amp Supply (2012 ndash 2016)Private amp Public Sector
78254 80095 81300 81365 83206
7091372205 72980 73647 73938
30000
35000
40000
45000
50000
55000
60000
65000
70000
75000
80000
85000
2012 2013 2014 2015 2016
Cumulative Supply Occupancy
Source URA Q4 2016
Singapore Office Market
CDLrsquos Office Properties Occupancy
959(National Average = 889)
35
Occupancy as of 31 Dec 2016
2017 2018 2019
33 28 25
Expiry of NLA
36
CDLrsquos Office Space ndash Lease Expiry Profile (2017 ndash 2019)
Rental Properties
Office Portfolio NLA ~2300000 sq ft
16Properties^
959Occupancy
As of 31 December 2016
Note Properties include -Republic Plaza Central Mall (Office Tower) City House Fuji Xerox Towers Manulife Centre Palais Renaissance Tanglin Shopping Centre The Arcade Katong Shopping Centre Kingrsquos Centre 7 amp 9 Tampines Grande 11 Tampines Concourse Sunshine Plaza Fortune Centre Golden Mile Complex Central Mall Conservation Unit
Based on contractual expiry dates Renewals will be negotiated nearer to expiry Tenants may renew their leases or increasereduce space or exit ^ Properties include strata-titled units owned and managed by CDL
60052
61333
6365864271
65079
57060
58599
59955 5963260192
52000
54000
56000
58000
60000
62000
64000
66000
2012 2013 2014 2015 2016
Cumulative Supply Occupancy
Retail Space Demand amp Supply (2012 ndash 2016)Private amp Public Sector
Source URA Q4 2016
With effect from Q1 2014 the coverage of retail space has been expanded to include non-shop retail uses and data are available from2011 onwards
Singapore Retail Market
CDLrsquos Retail Properties Occupancy
964(National Average = 925)
37
Occupancy as of 31 Dec 2016
38
CDLrsquos Retail Space ndash Lease Expiry Profile (2017 ndash 2019)
2017 2018 2019
2332 31
Expiry of NLA
Rental Properties
Retail Portfolio NLA ~840000 sq ft
19Properties^
964Occupancy
As of 31 December 2016
Based on contractual expiry dates Renewals will be negotiated nearer to expiry Tenants may renew their leases or increasereduce space or exit ^ Properties include strata-titled units owned and managed by CDL
Note Properties include ndashRepublic Plaza Central Mall (Office Tower) City Square Mall Palais Renaissance Tanglin Shopping Centre The Arcade Katong Shopping Centre Kingrsquos Centre Quayside Isle Grand Copthorne Waterfront (Waterfront Plaza) City Plaza Golden Mile Complex Central Mall Conservation Unit 7 amp 9 Tampines Grande City House Fortune Centre Manulife Centre Fuji Xerox Towers
39
Revenue by Sector for Full Year (2014 ndash 2016)
0
50
100
150
200
250
300
FY 2016 FY 2015 FY 2014
152187 176
110 113 111
7 8 8
74 75 65
24 23 25
S$ m
illio
n
Office
Retail
Industrial
REITHotel
Others ^
$367m $406m $385m
FY 2016 FY 2015 FY 2014
Office 41 46 46
Retail 30 28 29
Industrial 2 2 2
REITHotel 20 18 17
Others ^ 7 6 6
^ Including car park serviced apartments and residential
Rental Properties
40
EBITDA by Sector for Full Year (2014 ndash 2016)
050
100150200250300350400450500550600
FY 2016 FY 2015 FY 2014
185
446 ~
10175 64 91
5 4 453 58 53
6 15 19
S$ m
illio
n
Office
Retail
Industrial
REITHotel
Others ^
$324m $587m $268m
FY 2016 FY 2015 FY 2014
Office 57 76 38
Retail 23 11 34
Industrial 2 - 1
REITHotel 16 10 20
Others ^ 2 3 7
~ Includes gain on sale of Profit Participation Securities^ Including car park serviced apartments and residential
Rental Properties
South Beach
41
JW Marriott Hotel Singapore South Beach
JW Marriott Hotel Singapore South Beach
Rebranded hotel soft opened in mid-Dec2016
Business performance is within expectations
Ongoing works at NCO Club are expected tocomplete by Q3 2017 along with theremodelled Ballroom
South Beach Residences
190-unit luxury residence may be launchedin 2H 2017 subject to market conditions
Fully Completed in December 2016
Strong Performance for Office amp Retail
South Beach Tower (510000 sq ft office space) and retail space are fully leased
INTERNATIONAL OVERVIEW
Projects Launched To Date
43
Project City Equity Stake
Total Units
Total Units Sold
Booked
Sold Est TotalSaleable
Area (sq ft)
ExpectedCompletion
Australia
Ivy and Eve Brisbane 33 472 450 95 348678 1H 2018
China
Hong Leong City Center (Phase 1)
Suzhou 100^ 1374 1038 76 1378891 Completed
Hong Leong City Center (Phase 2 ndash T2)
Suzhou 100^ 430 174 40 439716 Q4 2017
Hongqiao Royal Lake Shanghai 100 85 34 40 385394 Completed
China ndash Good Progress on Launched Luxury Projects
International Property Development
47
Shanghai ndash Hongqiao Royal Lake (御湖)
Eling Residences Chongqing
Stable sales despite tightening measures in Shanghai
34 units soldbooked with sales value of RMB 668 millionachieved to date
Chongqing ndash Eling Residences (鹅岭峰)
Launched in Oct 2016
8 units soldbooked with sales value of RMB 85 million ndashachieved highest average values of close to RMB 40000 psm
City Equity Stake
Total Units
Total Units Sold Booked
Sold
Expected Completion
Shanghai 100 85 34 40 Completed
Hongqiao Royal Lake Shanghai
City Equity Stake
Total Units
Total Units Sold Booked
Sold
Expected Completion
Chongqing 100 126 8 6 Q2 2017
Artistrsquos Impression
As of 19 Feb 2017
Chongqing ndash Huang Huayuan (黄花园)
Scheduled launch of mixed-use development with over 600 residential units in 2019
48
Over 150000 apartment listings spanning over 20 citiesin China
Offers one-stop solution for apartment owners andrental customers
Investment provides immediate entry into this fast-growing new economy sectorminus Complement business portfoliominus Contributes to future long-term recurring income stream
Synergies to be shared with the Grouprsquos properties inShanghai Suzhou and Chongqing
Strategic Acquisition of 20 Equity Stake in mamahome for RMB 100 million
Distrii ndash Leading Provider of Co-working Space Acquisition completed in Jan 2017
Currently 15 locations (13 Shanghai + 1 Beijing + 1 Hangzhou) 3700 seating capacity in total 10 locations in operation with 5 more locations to open in 1H 2017
Targeting to double the locations in China by end 2017
Current capacity of over 2200 seats has reached above 80 occupancy
Committed to lease over 60000 sq ft in Republic Plaza Expected to open in 1H 2018
Distrii Suhe Center Shanghai
Strategic Acquisition of 24 Equity Stake in Distrii for RMB 72 million
50
Purchase of a 100 equity stake in Shanghai MeidaoInvestment Co which owns the commercial projectthat is in the final stages of construction
Total transaction value of RMB 900 million throughCDL China Limited
Strategically located in Huacao Minhang Districtwithin the Hongqiao CBD ndash a new area established in2009 that spans 86 sq km and is one of Shanghairsquosfastest growing business areas
Project comprises five 9-storey office towers and twolevels of basement carpark with about 351 lots
Project has been approved for division into strata-titleunits
China ndashAcquisition of Shanghai Commercial Project for RMB 900 million
Artistrsquos ImpressionMeidao Business Plaza Shanghai
Meidao Business Plaza ShanghaiTenure Equity
StakeEst Total GFA
(sqm)Expected
Completion
50-year lease 100 32300 2H 2017
International Rental Properties
Artistrsquos Impression
Japan ndash Invested in 2 Prime Residential Projects in Tokyo
Located within prestigious Aoyama area withinMinato ward in Tokyo
Project targeted at high-end domestic and foreignbuyers
Good uptake with over 50 of units sold since itslaunch in Oct 2016
Tokyo ndashPark Court Aoyama The Tower
International Property Development
51
Artistrsquos ImpressionPark Court Aoyama The Tower Tokyo
Tokyo ndash ShirokaneTenure Equity Stake Site Area (sqm)
Freehold 947 16815
Discussions with potential JV partner for project development ongoing
City Equity Stake Total Units
Total Units Sold Expected Completion
Freehold 20 163 Over 50 1H 2018
As of 19 Feb 2017
Teddington Riverside Teddington TW11
Full planning received works on basement car park inadvanced stage
Block A (57 units) will be launched in Q2 2017 followed byanother five blocks
International Property Development
52
UK ndash Upcoming Launches in Q2 2017
Artistrsquos Impression
Tenure EquityStake
Total Units Est TotalSaleable Area
(sq ft)
Expected Completion
Freehold 100 220 240000 2018 (Phased)
Teddington Riverside London
Project Tenure Equity Stake
Total Units
Est TotalSaleable
Area (sq ft)
Expected Completion
Belgravia Freehold 100 6 12375 Q2 2017
Knightsbridge Freehold 100 3 5193 Q2 2017
Belgravia3135 Chesham Street London SW1X 8NQ
Knightsbridge32 Hans Road London SW3 1RW
Chelsea 90-100 Sydney Street London SW3 6NJ
International Property Development
53
UK ndash Pipeline Projects
Tenure EquityStake
Total Units Est TotalSaleable Area
(sq ft)
Expected Completion
Freehold 100 9 16143 Q2 2018
Stag Brewery London
Tenure Equity Stake Est Total Saleable Area (sq ft)
Freehold 100 1000000 sq ft
Stag Brewery Mortlake London SW14
Advanced master plan at public consultation stage
Planning applications to be submitted by end Q2 2017
Proposed scheme to comprise two phases Parameter plan covering the entire site Detailed planning application for Phase 1Artistrsquos Impression
Artistrsquos Impression
Good progress on works
Expected completion in Q2 2018
International Property Development
54
Tenure Equity Stake Total Units Est GFA (sq ft)
Freehold 100 34 135000
28 Pavilion Road Knightsbridge London SW1
First luxury home care development to be built in Central Londonndash planning consent obtained
Project on target to commence demolition works in Q2 2017Artistrsquos ImpressionPavilion Road
UK ndash Pipeline Projects
Development House
Planning application to be submitted in Q2 2017
Existing 28000 sq ft remains fully leased and vacantpossession expected from Q2 2018
Development House Leonard Street in Shoreditch
Tenure Equity Stake Est Total Lettable Area (sq ft)
Freehold 100 90000 sq ft
Artistrsquos Impression
Artistrsquos Impression
UK ndashAcquisition of 16-acre Ransomes Wharf site for pound58 million
Located within Battersearsquos creative quarter on theRiver Thames
Est GDV of pound222 million
Contracts completed purchase to be phased overthe next 18 months
Profit before tax pound108m pound109m (09) pound124m (129)
PATMI pound78m pound65m 200
Trading Performance
The Baileyrsquos Hotel London The Baileyrsquos Hotel London
Increase in reported revenue attributed to higher land sales in New Zealand and a higher contribution from Millennium Mitsui Garden Hotel Tokyo coupled with favourable foreign exchange movements as a result of weak pound against major currencies
MampC Hotel Operations
58
Trading Performance
RevPAR in reported currency was up by 66 but in constant currency fell by 23 for FY 2016 as compared to the same period last year
FY 2016 Reported Currency Constant CurrencyNew York pound14564 uarr 19 darr 99Regional US pound5749 uarr175 uarr 40Total US pound8652 uarr 83 darr 42London pound10718 darr 14 darr 14Rest of Europe pound5261 uarr 20 darr 16Total Europe pound8024 darr 08 darr 20Singapore pound8021 uarr 05 darr 101Rest of Asia pound6063 uarr 116 uarr 19Total Asia pound6821 uarr 62 darr 40Australasia pound5840 uarr 348 uarr 209Total Group pound7671 uarr 66 darr 23 Millennium Seoul Hilton
Copthorne Hotel amp Resort Queenstown Lakefront
Sheet1
Developments ndash Progressing well
The lifestyle hotel and serviced apartment has 306 and 209keys respectively
The building permit approval for Seoul Yangdong developmentproject has been received on 25 January 2017 Additionalcertification processes are expected to complete by mid 2017
The main contract tender process is planned to complete bymid 2017 before construction work starts
Seoul South Korea
59
Comprises a 263-room hotel and a 250-unit residentialapartment block
The final planning approval has been received in December2016
Currently reviewing the project costing and specification whichis anticipated to take about 18 months to complete aftercommencement
Sunnyvale US
MampC Hotel Operations
MampC Hotel Operations
60
ONE UN New York
Refurbishment of guestrooms in the east tower was completed in early Sep 2016 and the towers were re-opened in time for the UN General Assembly
Assets Enhancement (Completed)
Grand Copthorne Waterfront Hotel Singapore
Work on the main lobby and FampB outlets at the main entrance level was substantially completed in May 2016
Refurbishment of function rooms on level 2 started in Sep 2016 and completed in Dec 2016
M Hotel Singapore
Soft refurbishment of all guestrooms from level 12 to level 28 is complete with the last phase completed in Dec 2016
ONE UN New York
Grand Copthorne Waterfront Hotel Singapore
M Hotel Singapore
MampC Hotel Operations
61
Grand Millennium Kuala Lumpur
Soft refurbishment of guestrooms from level 9 to level 19 was completed at the beginning of the 4th quarter of 2016
Remaining guestrooms at level 7 and level 8 is planned to be refurbished in the mid 2017
Assets Enhancement (On-going)
Grand Millennium Kuala Lumpur
Copthorne Hotel Auckland Harbour City
Copthorne Hotel Auckland Harbour City
Closed for a major refurbishment programme in Q3 2015 at an estimated cost of NZ$40 million
The hotel will be rebranded as M Social Hotel Auckland and is expected to re-open in 2nd quarter of 2017
Artistrsquos Impression
Artistrsquos Impression
31 Dec 31 Dec 31 Dec 31 DecHotel and Room Count 2016 2015 2016 2015By region New York 4 4 2238 2238 Regional US 15 15 4559 4463 London 8 8 2651 2651 Rest of Europe 19 18 3081 2867 Middle East 26 22 7805 6450 Singapore 7 6 3011 2716 Rest of Asia 27 26 10036 9430 Australasia 25 27 3641 3903 Total 131 126 37022 34718
PipelineBy region Middle East 17 16 5465 4663 Rest of Asia 4 3 1608 1674 Regional USA 1 1 263 263 Rest of Europe 1 - 153 - Total 23 20 7489 6600
Hotels Rooms
Hotel Room Count and Pipeline
MampC Hotel Operations
Mainly management contracts
62
Millennium Biltmore Hotel Los Angeles
Grand Millennium Auckland
Sheet1
CDL Hospitality Trusts
63
S$rsquo000 FY 2016 FY 2015 Change
Gross Revenue 180857 172410 49
Net Property Income (NPI) 137560 137003 04
Trading Performance
Hilton Cambridge City Centre ndash Executive Lounge
Artistrsquos Impression
Gross revenue and NPI increased mainly due to Inorganic contribution from Hilton Cambridge City Centre United Kingdom which
was acquired on 1 Oct 2015 Strong contribution from New Zealand hotels as a result of higher variable rental
income Incremental income boost from Japan hotels and Claymore Connect retail mall
This was partially offset by Continued weakness in Singapore and Maldives markets due to soft trading
conditions amid the global economic slowdown Lower contribution from Australia due to weaker AUD and lower variable income
contribution for FY 2016
Artistrsquos Impression
Disclaimer
This document may contain forward-looking statements that involve assumptions risks and uncertainties Actual future performance outcomes and results may differ materially from those expressed in forward-looking statements as a result of a number of risks uncertainties and assumptions Representative examples of these factors include (without limitation) general industry and economic conditions interest rate trends cost of capital and capital availability availability of real estate properties competition from other developments or companies shifts in customer demands customers and partners expected levels of occupancy rate property rental income charge out collections changes in operating expenses (including employee wages benefits and training costs) governmental and public policy changes and the continued availability of financing in the amounts and the terms necessary to support future business You are cautioned not to place undue reliance on these forward-looking statements which are based on the current view of management on future events Numbers in tables and charts may not add up due to rounding
Gramercy Park Singaporewwwcdlcomsg
Slide Number 1
Slide Number 2
Slide Number 3
Slide Number 4
Slide Number 5
Slide Number 6
Slide Number 7
Slide Number 8
Slide Number 9
Slide Number 10
Slide Number 11
Slide Number 12
Slide Number 13
Slide Number 14
Slide Number 15
Slide Number 16
Slide Number 17
Slide Number 18
Slide Number 19
Slide Number 20
Slide Number 21
Slide Number 22
Slide Number 23
Slide Number 24
Slide Number 25
Slide Number 26
Slide Number 27
Slide Number 28
Slide Number 29
Slide Number 30
Slide Number 31
Slide Number 32
Slide Number 33
Slide Number 34
Slide Number 35
Slide Number 36
Slide Number 37
Slide Number 38
Slide Number 39
Slide Number 40
Slide Number 41
Slide Number 42
Slide Number 43
Slide Number 44
Slide Number 45
Slide Number 46
Slide Number 47
Slide Number 48
Slide Number 49
Slide Number 50
Slide Number 51
Slide Number 52
Slide Number 53
Slide Number 54
Slide Number 55
Slide Number 56
Slide Number 57
Slide Number 58
Slide Number 59
Slide Number 60
Slide Number 61
Slide Number 62
Slide Number 63
Slide Number 64
Slide Number 65
Hotels
Rooms
31 Dec
31 Dec
31 Dec
31 Dec
Hotel and Room Count
2016
2015
2016
2015
By region
New York
4
4
2238
2238
Regional US
15
15
4559
4463
London
8
8
2651
2651
Rest of Europe
19
18
3081
2867
Middle East
26
22
7805
6450
Singapore
7
6
3011
2716
Rest of Asia
27
26
10036
9430
Australasia
25
27
3641
3903
Total
131
126
37022
34718
Pipeline
By region
Middle East
17
16
5465
4663
Rest of Asia
4
3
1608
1674
Regional USA
1
1
263
263
Rest of Europe
1
- 0
153
- 0
Total
23
20
7489
6600
FY 2016
Reported Currency
Constant Currency
New York
pound14564
uarr 19
darr 99
Regional US
pound5749
uarr175
uarr 40
Total US
pound8652
uarr 83
darr 42
London
pound10718
darr 14
darr 14
Rest of Europe
pound5261
uarr 20
darr 16
Total Europe
pound8024
darr 08
darr 20
Singapore
pound8021
uarr 05
darr 101
Rest of Asia
pound6063
uarr 116
uarr 19
Total Asia
pound6821
uarr 62
darr 40
Australasia
pound5840
uarr 348
uarr 209
Total Group
pound7671
uarr 66
darr 23
Project
Equity Stake
Total Units
Units Sold
Sold
Total Unsold Inventory
CDLrsquos Share of Unsold Inventory
St Regis Residences
33
173
161
93
12
4
The Oceanfront Sentosa Cove
50
264
263
99
1
05
One Shenton
100
341
327
96
14
14
Cliveden at Grange
100
110
44
40
66
66
UPRobertson Quay
100
70
57
81
13
13
Echelon
50
508
506
100
2
1
DNest
51
912
904
99
8
408
Jewel Buangkok
100
616
616
100
0
0
The Venue Shoppes
60
28
16
57
12
72
The Venue Residences
60
266
181
68
85
51
Coco Palms
51
944
865
92
79
4029
The Brownstone Executive Condo
70
638
519
81
119
833
The Criterion Executive Condo
70
505
179
35
326
2282
Gramercy Park
100
174
46
53^
41^
41^
(Phase 1 = 87-unit North Tower)
Forest Woods
50
519
382
74
137
685
Bartley Ridge
30
868
868
100
0
0
Commonwealth Towers
30
845
461
55
384
1152
TOTAL
7781
6395
1299
7373
Revenue
Profit Before Tax
Q4 2016
Q4 2016
Incr (Decr)
Q4 2016
Q4 2015
Incr (Decr)
$M
$M
$M
$M
Property Development
5981
2417
1475
2426
1158
1095
Hotel Operations(include CDL owned hotels)
4437
4627
(41)
(92)
91
NM
Rental Properties
887
1049
(154)
1008
3491
(711)
Others
365
457
(201)
(27)
(27)
-
- 0
11670
8550
365
3315
4713
(297)
FY 2016
FY 2015
Incr (Decr)
FY 2016
FY 2015
Incr (Decr)
$M
$M
$M
$M
Property Development
17447
10371
682
5197
3559
460
Hotel Operations(include CDL owned hotels)
16337
16981
(38)
1157
1709
(323)
Rental Properties
3669
4055
(95)
2073
4602
(550)
Others
1601
1634
(20)
713
(16)
NM
39054
33041
182
9140
9854
(72)
Diversified Land BankLand Area (as of 31 Dec 2016) ndash CDLrsquos Attributable Share
70 to target with 3rd Profit Participation Securities (PPS) in 2016
$9776 millionRaised from PPS transactionand exited interest toluxury freehold residentialproject to a group of Singaporean investors
12
Strategic Thrusts for FY 2017Acquisitive Position with Value Driven Focus
Focus on assets with in-place income in Singapore and overseas $304 million investments in Q1 2017 to date Disciplined capital deployment ndash for physical
assets equities or debt instruments
Grow funds management and capital recycling programme PPS Traditional private equity structures
Future-proof business through investments in new economy platforms
RMB 72 millionInvestment for24 equity stake in Distrii Chinarsquos leading co-workingspace operator
pound58 millionAcquisition of 16 acre Ransomes Wharf sitein Battersea South West London
Artistrsquos Impression
Q1 2017 Acquisition Highlights
To date 19 Feb 2017
Artistrsquos Impression
RMB 900 millionAcquisition of Shanghaicommercial projectMeidao Business Plazain Hongqiao
FINANCIAL HIGHLIGHTS
Financial Highlights
NM Not Meaningful 14
Segment Financial Results
Incr (Decr) Incr (Decr)
Property Development 5981 2417 1475 2426 1158 1095
Inventory of Launched Residential Projects ndashAs of 31 Dec 2016
32
Singapore Property Development
Leasing strategy implemented ^ Based on launched units
Note Above excludes inventory from The Residences at W Singapore ndash Sentosa Cove (203 units) unlaunched projects Nouvel 18 (156 units) and New Futura (124 units)
Sheet1
110
115
120
125
130
135
140
145
Q112
Q212
Q312
Q412
Q113
Q213
Q313
Q413
Q114
Q214
Q314
Q414
Q115
Q215
Q315
Q415
Q116
Q216
Q316
Q416
Office Retail
Source URA Q4 2016
33
Singapore Commercial MarketProperty Price Index ndash Commercial (2012ndash 2016)
Q4 161226
Q4 16 1347
Q3 161223
Q3 16 1355
Source JLL Research Q4 2016
$974
$1051$1204
$1038$914
$790 $837$926
$850$777
000
200
400
600
800
1000
1200
1400
2012 2013 2014 2015 2016
Marina Bay Raffles Place(Grade A)
Whole Island
34
Singapore Office MarketAverage Office Rental in CBD (2012 ndash 2016)
Office Space Demand amp Supply (2012 ndash 2016)Private amp Public Sector
78254 80095 81300 81365 83206
7091372205 72980 73647 73938
30000
35000
40000
45000
50000
55000
60000
65000
70000
75000
80000
85000
2012 2013 2014 2015 2016
Cumulative Supply Occupancy
Source URA Q4 2016
Singapore Office Market
CDLrsquos Office Properties Occupancy
959(National Average = 889)
35
Occupancy as of 31 Dec 2016
2017 2018 2019
33 28 25
Expiry of NLA
36
CDLrsquos Office Space ndash Lease Expiry Profile (2017 ndash 2019)
Rental Properties
Office Portfolio NLA ~2300000 sq ft
16Properties^
959Occupancy
As of 31 December 2016
Note Properties include -Republic Plaza Central Mall (Office Tower) City House Fuji Xerox Towers Manulife Centre Palais Renaissance Tanglin Shopping Centre The Arcade Katong Shopping Centre Kingrsquos Centre 7 amp 9 Tampines Grande 11 Tampines Concourse Sunshine Plaza Fortune Centre Golden Mile Complex Central Mall Conservation Unit
Based on contractual expiry dates Renewals will be negotiated nearer to expiry Tenants may renew their leases or increasereduce space or exit ^ Properties include strata-titled units owned and managed by CDL
60052
61333
6365864271
65079
57060
58599
59955 5963260192
52000
54000
56000
58000
60000
62000
64000
66000
2012 2013 2014 2015 2016
Cumulative Supply Occupancy
Retail Space Demand amp Supply (2012 ndash 2016)Private amp Public Sector
Source URA Q4 2016
With effect from Q1 2014 the coverage of retail space has been expanded to include non-shop retail uses and data are available from2011 onwards
Singapore Retail Market
CDLrsquos Retail Properties Occupancy
964(National Average = 925)
37
Occupancy as of 31 Dec 2016
38
CDLrsquos Retail Space ndash Lease Expiry Profile (2017 ndash 2019)
2017 2018 2019
2332 31
Expiry of NLA
Rental Properties
Retail Portfolio NLA ~840000 sq ft
19Properties^
964Occupancy
As of 31 December 2016
Based on contractual expiry dates Renewals will be negotiated nearer to expiry Tenants may renew their leases or increasereduce space or exit ^ Properties include strata-titled units owned and managed by CDL
Note Properties include ndashRepublic Plaza Central Mall (Office Tower) City Square Mall Palais Renaissance Tanglin Shopping Centre The Arcade Katong Shopping Centre Kingrsquos Centre Quayside Isle Grand Copthorne Waterfront (Waterfront Plaza) City Plaza Golden Mile Complex Central Mall Conservation Unit 7 amp 9 Tampines Grande City House Fortune Centre Manulife Centre Fuji Xerox Towers
39
Revenue by Sector for Full Year (2014 ndash 2016)
0
50
100
150
200
250
300
FY 2016 FY 2015 FY 2014
152187 176
110 113 111
7 8 8
74 75 65
24 23 25
S$ m
illio
n
Office
Retail
Industrial
REITHotel
Others ^
$367m $406m $385m
FY 2016 FY 2015 FY 2014
Office 41 46 46
Retail 30 28 29
Industrial 2 2 2
REITHotel 20 18 17
Others ^ 7 6 6
^ Including car park serviced apartments and residential
Rental Properties
40
EBITDA by Sector for Full Year (2014 ndash 2016)
050
100150200250300350400450500550600
FY 2016 FY 2015 FY 2014
185
446 ~
10175 64 91
5 4 453 58 53
6 15 19
S$ m
illio
n
Office
Retail
Industrial
REITHotel
Others ^
$324m $587m $268m
FY 2016 FY 2015 FY 2014
Office 57 76 38
Retail 23 11 34
Industrial 2 - 1
REITHotel 16 10 20
Others ^ 2 3 7
~ Includes gain on sale of Profit Participation Securities^ Including car park serviced apartments and residential
Rental Properties
South Beach
41
JW Marriott Hotel Singapore South Beach
JW Marriott Hotel Singapore South Beach
Rebranded hotel soft opened in mid-Dec2016
Business performance is within expectations
Ongoing works at NCO Club are expected tocomplete by Q3 2017 along with theremodelled Ballroom
South Beach Residences
190-unit luxury residence may be launchedin 2H 2017 subject to market conditions
Fully Completed in December 2016
Strong Performance for Office amp Retail
South Beach Tower (510000 sq ft office space) and retail space are fully leased
INTERNATIONAL OVERVIEW
Projects Launched To Date
43
Project City Equity Stake
Total Units
Total Units Sold
Booked
Sold Est TotalSaleable
Area (sq ft)
ExpectedCompletion
Australia
Ivy and Eve Brisbane 33 472 450 95 348678 1H 2018
China
Hong Leong City Center (Phase 1)
Suzhou 100^ 1374 1038 76 1378891 Completed
Hong Leong City Center (Phase 2 ndash T2)
Suzhou 100^ 430 174 40 439716 Q4 2017
Hongqiao Royal Lake Shanghai 100 85 34 40 385394 Completed
China ndash Good Progress on Launched Luxury Projects
International Property Development
47
Shanghai ndash Hongqiao Royal Lake (御湖)
Eling Residences Chongqing
Stable sales despite tightening measures in Shanghai
34 units soldbooked with sales value of RMB 668 millionachieved to date
Chongqing ndash Eling Residences (鹅岭峰)
Launched in Oct 2016
8 units soldbooked with sales value of RMB 85 million ndashachieved highest average values of close to RMB 40000 psm
City Equity Stake
Total Units
Total Units Sold Booked
Sold
Expected Completion
Shanghai 100 85 34 40 Completed
Hongqiao Royal Lake Shanghai
City Equity Stake
Total Units
Total Units Sold Booked
Sold
Expected Completion
Chongqing 100 126 8 6 Q2 2017
Artistrsquos Impression
As of 19 Feb 2017
Chongqing ndash Huang Huayuan (黄花园)
Scheduled launch of mixed-use development with over 600 residential units in 2019
48
Over 150000 apartment listings spanning over 20 citiesin China
Offers one-stop solution for apartment owners andrental customers
Investment provides immediate entry into this fast-growing new economy sectorminus Complement business portfoliominus Contributes to future long-term recurring income stream
Synergies to be shared with the Grouprsquos properties inShanghai Suzhou and Chongqing
Strategic Acquisition of 20 Equity Stake in mamahome for RMB 100 million
Distrii ndash Leading Provider of Co-working Space Acquisition completed in Jan 2017
Currently 15 locations (13 Shanghai + 1 Beijing + 1 Hangzhou) 3700 seating capacity in total 10 locations in operation with 5 more locations to open in 1H 2017
Targeting to double the locations in China by end 2017
Current capacity of over 2200 seats has reached above 80 occupancy
Committed to lease over 60000 sq ft in Republic Plaza Expected to open in 1H 2018
Distrii Suhe Center Shanghai
Strategic Acquisition of 24 Equity Stake in Distrii for RMB 72 million
50
Purchase of a 100 equity stake in Shanghai MeidaoInvestment Co which owns the commercial projectthat is in the final stages of construction
Total transaction value of RMB 900 million throughCDL China Limited
Strategically located in Huacao Minhang Districtwithin the Hongqiao CBD ndash a new area established in2009 that spans 86 sq km and is one of Shanghairsquosfastest growing business areas
Project comprises five 9-storey office towers and twolevels of basement carpark with about 351 lots
Project has been approved for division into strata-titleunits
China ndashAcquisition of Shanghai Commercial Project for RMB 900 million
Artistrsquos ImpressionMeidao Business Plaza Shanghai
Meidao Business Plaza ShanghaiTenure Equity
StakeEst Total GFA
(sqm)Expected
Completion
50-year lease 100 32300 2H 2017
International Rental Properties
Artistrsquos Impression
Japan ndash Invested in 2 Prime Residential Projects in Tokyo
Located within prestigious Aoyama area withinMinato ward in Tokyo
Project targeted at high-end domestic and foreignbuyers
Good uptake with over 50 of units sold since itslaunch in Oct 2016
Tokyo ndashPark Court Aoyama The Tower
International Property Development
51
Artistrsquos ImpressionPark Court Aoyama The Tower Tokyo
Tokyo ndash ShirokaneTenure Equity Stake Site Area (sqm)
Freehold 947 16815
Discussions with potential JV partner for project development ongoing
City Equity Stake Total Units
Total Units Sold Expected Completion
Freehold 20 163 Over 50 1H 2018
As of 19 Feb 2017
Teddington Riverside Teddington TW11
Full planning received works on basement car park inadvanced stage
Block A (57 units) will be launched in Q2 2017 followed byanother five blocks
International Property Development
52
UK ndash Upcoming Launches in Q2 2017
Artistrsquos Impression
Tenure EquityStake
Total Units Est TotalSaleable Area
(sq ft)
Expected Completion
Freehold 100 220 240000 2018 (Phased)
Teddington Riverside London
Project Tenure Equity Stake
Total Units
Est TotalSaleable
Area (sq ft)
Expected Completion
Belgravia Freehold 100 6 12375 Q2 2017
Knightsbridge Freehold 100 3 5193 Q2 2017
Belgravia3135 Chesham Street London SW1X 8NQ
Knightsbridge32 Hans Road London SW3 1RW
Chelsea 90-100 Sydney Street London SW3 6NJ
International Property Development
53
UK ndash Pipeline Projects
Tenure EquityStake
Total Units Est TotalSaleable Area
(sq ft)
Expected Completion
Freehold 100 9 16143 Q2 2018
Stag Brewery London
Tenure Equity Stake Est Total Saleable Area (sq ft)
Freehold 100 1000000 sq ft
Stag Brewery Mortlake London SW14
Advanced master plan at public consultation stage
Planning applications to be submitted by end Q2 2017
Proposed scheme to comprise two phases Parameter plan covering the entire site Detailed planning application for Phase 1Artistrsquos Impression
Artistrsquos Impression
Good progress on works
Expected completion in Q2 2018
International Property Development
54
Tenure Equity Stake Total Units Est GFA (sq ft)
Freehold 100 34 135000
28 Pavilion Road Knightsbridge London SW1
First luxury home care development to be built in Central Londonndash planning consent obtained
Project on target to commence demolition works in Q2 2017Artistrsquos ImpressionPavilion Road
UK ndash Pipeline Projects
Development House
Planning application to be submitted in Q2 2017
Existing 28000 sq ft remains fully leased and vacantpossession expected from Q2 2018
Development House Leonard Street in Shoreditch
Tenure Equity Stake Est Total Lettable Area (sq ft)
Freehold 100 90000 sq ft
Artistrsquos Impression
Artistrsquos Impression
UK ndashAcquisition of 16-acre Ransomes Wharf site for pound58 million
Located within Battersearsquos creative quarter on theRiver Thames
Est GDV of pound222 million
Contracts completed purchase to be phased overthe next 18 months
Profit before tax pound108m pound109m (09) pound124m (129)
PATMI pound78m pound65m 200
Trading Performance
The Baileyrsquos Hotel London The Baileyrsquos Hotel London
Increase in reported revenue attributed to higher land sales in New Zealand and a higher contribution from Millennium Mitsui Garden Hotel Tokyo coupled with favourable foreign exchange movements as a result of weak pound against major currencies
MampC Hotel Operations
58
Trading Performance
RevPAR in reported currency was up by 66 but in constant currency fell by 23 for FY 2016 as compared to the same period last year
FY 2016 Reported Currency Constant CurrencyNew York pound14564 uarr 19 darr 99Regional US pound5749 uarr175 uarr 40Total US pound8652 uarr 83 darr 42London pound10718 darr 14 darr 14Rest of Europe pound5261 uarr 20 darr 16Total Europe pound8024 darr 08 darr 20Singapore pound8021 uarr 05 darr 101Rest of Asia pound6063 uarr 116 uarr 19Total Asia pound6821 uarr 62 darr 40Australasia pound5840 uarr 348 uarr 209Total Group pound7671 uarr 66 darr 23 Millennium Seoul Hilton
Copthorne Hotel amp Resort Queenstown Lakefront
Sheet1
Developments ndash Progressing well
The lifestyle hotel and serviced apartment has 306 and 209keys respectively
The building permit approval for Seoul Yangdong developmentproject has been received on 25 January 2017 Additionalcertification processes are expected to complete by mid 2017
The main contract tender process is planned to complete bymid 2017 before construction work starts
Seoul South Korea
59
Comprises a 263-room hotel and a 250-unit residentialapartment block
The final planning approval has been received in December2016
Currently reviewing the project costing and specification whichis anticipated to take about 18 months to complete aftercommencement
Sunnyvale US
MampC Hotel Operations
MampC Hotel Operations
60
ONE UN New York
Refurbishment of guestrooms in the east tower was completed in early Sep 2016 and the towers were re-opened in time for the UN General Assembly
Assets Enhancement (Completed)
Grand Copthorne Waterfront Hotel Singapore
Work on the main lobby and FampB outlets at the main entrance level was substantially completed in May 2016
Refurbishment of function rooms on level 2 started in Sep 2016 and completed in Dec 2016
M Hotel Singapore
Soft refurbishment of all guestrooms from level 12 to level 28 is complete with the last phase completed in Dec 2016
ONE UN New York
Grand Copthorne Waterfront Hotel Singapore
M Hotel Singapore
MampC Hotel Operations
61
Grand Millennium Kuala Lumpur
Soft refurbishment of guestrooms from level 9 to level 19 was completed at the beginning of the 4th quarter of 2016
Remaining guestrooms at level 7 and level 8 is planned to be refurbished in the mid 2017
Assets Enhancement (On-going)
Grand Millennium Kuala Lumpur
Copthorne Hotel Auckland Harbour City
Copthorne Hotel Auckland Harbour City
Closed for a major refurbishment programme in Q3 2015 at an estimated cost of NZ$40 million
The hotel will be rebranded as M Social Hotel Auckland and is expected to re-open in 2nd quarter of 2017
Artistrsquos Impression
Artistrsquos Impression
31 Dec 31 Dec 31 Dec 31 DecHotel and Room Count 2016 2015 2016 2015By region New York 4 4 2238 2238 Regional US 15 15 4559 4463 London 8 8 2651 2651 Rest of Europe 19 18 3081 2867 Middle East 26 22 7805 6450 Singapore 7 6 3011 2716 Rest of Asia 27 26 10036 9430 Australasia 25 27 3641 3903 Total 131 126 37022 34718
PipelineBy region Middle East 17 16 5465 4663 Rest of Asia 4 3 1608 1674 Regional USA 1 1 263 263 Rest of Europe 1 - 153 - Total 23 20 7489 6600
Hotels Rooms
Hotel Room Count and Pipeline
MampC Hotel Operations
Mainly management contracts
62
Millennium Biltmore Hotel Los Angeles
Grand Millennium Auckland
Sheet1
CDL Hospitality Trusts
63
S$rsquo000 FY 2016 FY 2015 Change
Gross Revenue 180857 172410 49
Net Property Income (NPI) 137560 137003 04
Trading Performance
Hilton Cambridge City Centre ndash Executive Lounge
Artistrsquos Impression
Gross revenue and NPI increased mainly due to Inorganic contribution from Hilton Cambridge City Centre United Kingdom which
was acquired on 1 Oct 2015 Strong contribution from New Zealand hotels as a result of higher variable rental
income Incremental income boost from Japan hotels and Claymore Connect retail mall
This was partially offset by Continued weakness in Singapore and Maldives markets due to soft trading
conditions amid the global economic slowdown Lower contribution from Australia due to weaker AUD and lower variable income
contribution for FY 2016
Artistrsquos Impression
Disclaimer
This document may contain forward-looking statements that involve assumptions risks and uncertainties Actual future performance outcomes and results may differ materially from those expressed in forward-looking statements as a result of a number of risks uncertainties and assumptions Representative examples of these factors include (without limitation) general industry and economic conditions interest rate trends cost of capital and capital availability availability of real estate properties competition from other developments or companies shifts in customer demands customers and partners expected levels of occupancy rate property rental income charge out collections changes in operating expenses (including employee wages benefits and training costs) governmental and public policy changes and the continued availability of financing in the amounts and the terms necessary to support future business You are cautioned not to place undue reliance on these forward-looking statements which are based on the current view of management on future events Numbers in tables and charts may not add up due to rounding
Gramercy Park Singaporewwwcdlcomsg
Slide Number 1
Slide Number 2
Slide Number 3
Slide Number 4
Slide Number 5
Slide Number 6
Slide Number 7
Slide Number 8
Slide Number 9
Slide Number 10
Slide Number 11
Slide Number 12
Slide Number 13
Slide Number 14
Slide Number 15
Slide Number 16
Slide Number 17
Slide Number 18
Slide Number 19
Slide Number 20
Slide Number 21
Slide Number 22
Slide Number 23
Slide Number 24
Slide Number 25
Slide Number 26
Slide Number 27
Slide Number 28
Slide Number 29
Slide Number 30
Slide Number 31
Slide Number 32
Slide Number 33
Slide Number 34
Slide Number 35
Slide Number 36
Slide Number 37
Slide Number 38
Slide Number 39
Slide Number 40
Slide Number 41
Slide Number 42
Slide Number 43
Slide Number 44
Slide Number 45
Slide Number 46
Slide Number 47
Slide Number 48
Slide Number 49
Slide Number 50
Slide Number 51
Slide Number 52
Slide Number 53
Slide Number 54
Slide Number 55
Slide Number 56
Slide Number 57
Slide Number 58
Slide Number 59
Slide Number 60
Slide Number 61
Slide Number 62
Slide Number 63
Slide Number 64
Slide Number 65
Hotels
Rooms
31 Dec
31 Dec
31 Dec
31 Dec
Hotel and Room Count
2016
2015
2016
2015
By region
New York
4
4
2238
2238
Regional US
15
15
4559
4463
London
8
8
2651
2651
Rest of Europe
19
18
3081
2867
Middle East
26
22
7805
6450
Singapore
7
6
3011
2716
Rest of Asia
27
26
10036
9430
Australasia
25
27
3641
3903
Total
131
126
37022
34718
Pipeline
By region
Middle East
17
16
5465
4663
Rest of Asia
4
3
1608
1674
Regional USA
1
1
263
263
Rest of Europe
1
- 0
153
- 0
Total
23
20
7489
6600
FY 2016
Reported Currency
Constant Currency
New York
pound14564
uarr 19
darr 99
Regional US
pound5749
uarr175
uarr 40
Total US
pound8652
uarr 83
darr 42
London
pound10718
darr 14
darr 14
Rest of Europe
pound5261
uarr 20
darr 16
Total Europe
pound8024
darr 08
darr 20
Singapore
pound8021
uarr 05
darr 101
Rest of Asia
pound6063
uarr 116
uarr 19
Total Asia
pound6821
uarr 62
darr 40
Australasia
pound5840
uarr 348
uarr 209
Total Group
pound7671
uarr 66
darr 23
Project
Equity Stake
Total Units
Units Sold
Sold
Total Unsold Inventory
CDLrsquos Share of Unsold Inventory
St Regis Residences
33
173
161
93
12
4
The Oceanfront Sentosa Cove
50
264
263
99
1
05
One Shenton
100
341
327
96
14
14
Cliveden at Grange
100
110
44
40
66
66
UPRobertson Quay
100
70
57
81
13
13
Echelon
50
508
506
100
2
1
DNest
51
912
904
99
8
408
Jewel Buangkok
100
616
616
100
0
0
The Venue Shoppes
60
28
16
57
12
72
The Venue Residences
60
266
181
68
85
51
Coco Palms
51
944
865
92
79
4029
The Brownstone Executive Condo
70
638
519
81
119
833
The Criterion Executive Condo
70
505
179
35
326
2282
Gramercy Park
100
174
46
53^
41^
41^
(Phase 1 = 87-unit North Tower)
Forest Woods
50
519
382
74
137
685
Bartley Ridge
30
868
868
100
0
0
Commonwealth Towers
30
845
461
55
384
1152
TOTAL
7781
6395
1299
7373
Revenue
Profit Before Tax
Q4 2016
Q4 2016
Incr (Decr)
Q4 2016
Q4 2015
Incr (Decr)
$M
$M
$M
$M
Property Development
5981
2417
1475
2426
1158
1095
Hotel Operations(include CDL owned hotels)
4437
4627
(41)
(92)
91
NM
Rental Properties
887
1049
(154)
1008
3491
(711)
Others
365
457
(201)
(27)
(27)
-
- 0
11670
8550
365
3315
4713
(297)
FY 2016
FY 2015
Incr (Decr)
FY 2016
FY 2015
Incr (Decr)
$M
$M
$M
$M
Property Development
17447
10371
682
5197
3559
460
Hotel Operations(include CDL owned hotels)
16337
16981
(38)
1157
1709
(323)
Rental Properties
3669
4055
(95)
2073
4602
(550)
Others
1601
1634
(20)
713
(16)
NM
39054
33041
182
9140
9854
(72)
On target to meet $5 billion in Acquisition Objective by end 2018
10
Geographical Diversification
00
10
20
30
40
50
60
2014 2015 2016 2017 2018
ACQUISITIONS $ BILLION
13
23
50
25
RMB 100 millionInvestment for20 equity stake in mamahome Chinarsquos fast growing onlineapartment rental platform
pound374 millionAcquisition of Development House anexisting office buildingin Shoreditch north ofCity of London
Acquisition of 20 equity stake in luxury Tokyo residential project Park Court Aoyama The Tower with total GDV of over JPY 50 billion
Artistrsquos Impression
FY 2016 Acquisition Highlights
Artistrsquos Impression
Artistrsquos Impression
On target to raise $5 billion in Funds under Management (FUM) by end 2018
70 to target with 3rd Profit Participation Securities (PPS) in 2016
$9776 millionRaised from PPS transactionand exited interest toluxury freehold residentialproject to a group of Singaporean investors
12
Strategic Thrusts for FY 2017Acquisitive Position with Value Driven Focus
Focus on assets with in-place income in Singapore and overseas $304 million investments in Q1 2017 to date Disciplined capital deployment ndash for physical
assets equities or debt instruments
Grow funds management and capital recycling programme PPS Traditional private equity structures
Future-proof business through investments in new economy platforms
RMB 72 millionInvestment for24 equity stake in Distrii Chinarsquos leading co-workingspace operator
pound58 millionAcquisition of 16 acre Ransomes Wharf sitein Battersea South West London
Artistrsquos Impression
Q1 2017 Acquisition Highlights
To date 19 Feb 2017
Artistrsquos Impression
RMB 900 millionAcquisition of Shanghaicommercial projectMeidao Business Plazain Hongqiao
FINANCIAL HIGHLIGHTS
Financial Highlights
NM Not Meaningful 14
Segment Financial Results
Incr (Decr) Incr (Decr)
Property Development 5981 2417 1475 2426 1158 1095
Inventory of Launched Residential Projects ndashAs of 31 Dec 2016
32
Singapore Property Development
Leasing strategy implemented ^ Based on launched units
Note Above excludes inventory from The Residences at W Singapore ndash Sentosa Cove (203 units) unlaunched projects Nouvel 18 (156 units) and New Futura (124 units)
Sheet1
110
115
120
125
130
135
140
145
Q112
Q212
Q312
Q412
Q113
Q213
Q313
Q413
Q114
Q214
Q314
Q414
Q115
Q215
Q315
Q415
Q116
Q216
Q316
Q416
Office Retail
Source URA Q4 2016
33
Singapore Commercial MarketProperty Price Index ndash Commercial (2012ndash 2016)
Q4 161226
Q4 16 1347
Q3 161223
Q3 16 1355
Source JLL Research Q4 2016
$974
$1051$1204
$1038$914
$790 $837$926
$850$777
000
200
400
600
800
1000
1200
1400
2012 2013 2014 2015 2016
Marina Bay Raffles Place(Grade A)
Whole Island
34
Singapore Office MarketAverage Office Rental in CBD (2012 ndash 2016)
Office Space Demand amp Supply (2012 ndash 2016)Private amp Public Sector
78254 80095 81300 81365 83206
7091372205 72980 73647 73938
30000
35000
40000
45000
50000
55000
60000
65000
70000
75000
80000
85000
2012 2013 2014 2015 2016
Cumulative Supply Occupancy
Source URA Q4 2016
Singapore Office Market
CDLrsquos Office Properties Occupancy
959(National Average = 889)
35
Occupancy as of 31 Dec 2016
2017 2018 2019
33 28 25
Expiry of NLA
36
CDLrsquos Office Space ndash Lease Expiry Profile (2017 ndash 2019)
Rental Properties
Office Portfolio NLA ~2300000 sq ft
16Properties^
959Occupancy
As of 31 December 2016
Note Properties include -Republic Plaza Central Mall (Office Tower) City House Fuji Xerox Towers Manulife Centre Palais Renaissance Tanglin Shopping Centre The Arcade Katong Shopping Centre Kingrsquos Centre 7 amp 9 Tampines Grande 11 Tampines Concourse Sunshine Plaza Fortune Centre Golden Mile Complex Central Mall Conservation Unit
Based on contractual expiry dates Renewals will be negotiated nearer to expiry Tenants may renew their leases or increasereduce space or exit ^ Properties include strata-titled units owned and managed by CDL
60052
61333
6365864271
65079
57060
58599
59955 5963260192
52000
54000
56000
58000
60000
62000
64000
66000
2012 2013 2014 2015 2016
Cumulative Supply Occupancy
Retail Space Demand amp Supply (2012 ndash 2016)Private amp Public Sector
Source URA Q4 2016
With effect from Q1 2014 the coverage of retail space has been expanded to include non-shop retail uses and data are available from2011 onwards
Singapore Retail Market
CDLrsquos Retail Properties Occupancy
964(National Average = 925)
37
Occupancy as of 31 Dec 2016
38
CDLrsquos Retail Space ndash Lease Expiry Profile (2017 ndash 2019)
2017 2018 2019
2332 31
Expiry of NLA
Rental Properties
Retail Portfolio NLA ~840000 sq ft
19Properties^
964Occupancy
As of 31 December 2016
Based on contractual expiry dates Renewals will be negotiated nearer to expiry Tenants may renew their leases or increasereduce space or exit ^ Properties include strata-titled units owned and managed by CDL
Note Properties include ndashRepublic Plaza Central Mall (Office Tower) City Square Mall Palais Renaissance Tanglin Shopping Centre The Arcade Katong Shopping Centre Kingrsquos Centre Quayside Isle Grand Copthorne Waterfront (Waterfront Plaza) City Plaza Golden Mile Complex Central Mall Conservation Unit 7 amp 9 Tampines Grande City House Fortune Centre Manulife Centre Fuji Xerox Towers
39
Revenue by Sector for Full Year (2014 ndash 2016)
0
50
100
150
200
250
300
FY 2016 FY 2015 FY 2014
152187 176
110 113 111
7 8 8
74 75 65
24 23 25
S$ m
illio
n
Office
Retail
Industrial
REITHotel
Others ^
$367m $406m $385m
FY 2016 FY 2015 FY 2014
Office 41 46 46
Retail 30 28 29
Industrial 2 2 2
REITHotel 20 18 17
Others ^ 7 6 6
^ Including car park serviced apartments and residential
Rental Properties
40
EBITDA by Sector for Full Year (2014 ndash 2016)
050
100150200250300350400450500550600
FY 2016 FY 2015 FY 2014
185
446 ~
10175 64 91
5 4 453 58 53
6 15 19
S$ m
illio
n
Office
Retail
Industrial
REITHotel
Others ^
$324m $587m $268m
FY 2016 FY 2015 FY 2014
Office 57 76 38
Retail 23 11 34
Industrial 2 - 1
REITHotel 16 10 20
Others ^ 2 3 7
~ Includes gain on sale of Profit Participation Securities^ Including car park serviced apartments and residential
Rental Properties
South Beach
41
JW Marriott Hotel Singapore South Beach
JW Marriott Hotel Singapore South Beach
Rebranded hotel soft opened in mid-Dec2016
Business performance is within expectations
Ongoing works at NCO Club are expected tocomplete by Q3 2017 along with theremodelled Ballroom
South Beach Residences
190-unit luxury residence may be launchedin 2H 2017 subject to market conditions
Fully Completed in December 2016
Strong Performance for Office amp Retail
South Beach Tower (510000 sq ft office space) and retail space are fully leased
INTERNATIONAL OVERVIEW
Projects Launched To Date
43
Project City Equity Stake
Total Units
Total Units Sold
Booked
Sold Est TotalSaleable
Area (sq ft)
ExpectedCompletion
Australia
Ivy and Eve Brisbane 33 472 450 95 348678 1H 2018
China
Hong Leong City Center (Phase 1)
Suzhou 100^ 1374 1038 76 1378891 Completed
Hong Leong City Center (Phase 2 ndash T2)
Suzhou 100^ 430 174 40 439716 Q4 2017
Hongqiao Royal Lake Shanghai 100 85 34 40 385394 Completed
China ndash Good Progress on Launched Luxury Projects
International Property Development
47
Shanghai ndash Hongqiao Royal Lake (御湖)
Eling Residences Chongqing
Stable sales despite tightening measures in Shanghai
34 units soldbooked with sales value of RMB 668 millionachieved to date
Chongqing ndash Eling Residences (鹅岭峰)
Launched in Oct 2016
8 units soldbooked with sales value of RMB 85 million ndashachieved highest average values of close to RMB 40000 psm
City Equity Stake
Total Units
Total Units Sold Booked
Sold
Expected Completion
Shanghai 100 85 34 40 Completed
Hongqiao Royal Lake Shanghai
City Equity Stake
Total Units
Total Units Sold Booked
Sold
Expected Completion
Chongqing 100 126 8 6 Q2 2017
Artistrsquos Impression
As of 19 Feb 2017
Chongqing ndash Huang Huayuan (黄花园)
Scheduled launch of mixed-use development with over 600 residential units in 2019
48
Over 150000 apartment listings spanning over 20 citiesin China
Offers one-stop solution for apartment owners andrental customers
Investment provides immediate entry into this fast-growing new economy sectorminus Complement business portfoliominus Contributes to future long-term recurring income stream
Synergies to be shared with the Grouprsquos properties inShanghai Suzhou and Chongqing
Strategic Acquisition of 20 Equity Stake in mamahome for RMB 100 million
Distrii ndash Leading Provider of Co-working Space Acquisition completed in Jan 2017
Currently 15 locations (13 Shanghai + 1 Beijing + 1 Hangzhou) 3700 seating capacity in total 10 locations in operation with 5 more locations to open in 1H 2017
Targeting to double the locations in China by end 2017
Current capacity of over 2200 seats has reached above 80 occupancy
Committed to lease over 60000 sq ft in Republic Plaza Expected to open in 1H 2018
Distrii Suhe Center Shanghai
Strategic Acquisition of 24 Equity Stake in Distrii for RMB 72 million
50
Purchase of a 100 equity stake in Shanghai MeidaoInvestment Co which owns the commercial projectthat is in the final stages of construction
Total transaction value of RMB 900 million throughCDL China Limited
Strategically located in Huacao Minhang Districtwithin the Hongqiao CBD ndash a new area established in2009 that spans 86 sq km and is one of Shanghairsquosfastest growing business areas
Project comprises five 9-storey office towers and twolevels of basement carpark with about 351 lots
Project has been approved for division into strata-titleunits
China ndashAcquisition of Shanghai Commercial Project for RMB 900 million
Artistrsquos ImpressionMeidao Business Plaza Shanghai
Meidao Business Plaza ShanghaiTenure Equity
StakeEst Total GFA
(sqm)Expected
Completion
50-year lease 100 32300 2H 2017
International Rental Properties
Artistrsquos Impression
Japan ndash Invested in 2 Prime Residential Projects in Tokyo
Located within prestigious Aoyama area withinMinato ward in Tokyo
Project targeted at high-end domestic and foreignbuyers
Good uptake with over 50 of units sold since itslaunch in Oct 2016
Tokyo ndashPark Court Aoyama The Tower
International Property Development
51
Artistrsquos ImpressionPark Court Aoyama The Tower Tokyo
Tokyo ndash ShirokaneTenure Equity Stake Site Area (sqm)
Freehold 947 16815
Discussions with potential JV partner for project development ongoing
City Equity Stake Total Units
Total Units Sold Expected Completion
Freehold 20 163 Over 50 1H 2018
As of 19 Feb 2017
Teddington Riverside Teddington TW11
Full planning received works on basement car park inadvanced stage
Block A (57 units) will be launched in Q2 2017 followed byanother five blocks
International Property Development
52
UK ndash Upcoming Launches in Q2 2017
Artistrsquos Impression
Tenure EquityStake
Total Units Est TotalSaleable Area
(sq ft)
Expected Completion
Freehold 100 220 240000 2018 (Phased)
Teddington Riverside London
Project Tenure Equity Stake
Total Units
Est TotalSaleable
Area (sq ft)
Expected Completion
Belgravia Freehold 100 6 12375 Q2 2017
Knightsbridge Freehold 100 3 5193 Q2 2017
Belgravia3135 Chesham Street London SW1X 8NQ
Knightsbridge32 Hans Road London SW3 1RW
Chelsea 90-100 Sydney Street London SW3 6NJ
International Property Development
53
UK ndash Pipeline Projects
Tenure EquityStake
Total Units Est TotalSaleable Area
(sq ft)
Expected Completion
Freehold 100 9 16143 Q2 2018
Stag Brewery London
Tenure Equity Stake Est Total Saleable Area (sq ft)
Freehold 100 1000000 sq ft
Stag Brewery Mortlake London SW14
Advanced master plan at public consultation stage
Planning applications to be submitted by end Q2 2017
Proposed scheme to comprise two phases Parameter plan covering the entire site Detailed planning application for Phase 1Artistrsquos Impression
Artistrsquos Impression
Good progress on works
Expected completion in Q2 2018
International Property Development
54
Tenure Equity Stake Total Units Est GFA (sq ft)
Freehold 100 34 135000
28 Pavilion Road Knightsbridge London SW1
First luxury home care development to be built in Central Londonndash planning consent obtained
Project on target to commence demolition works in Q2 2017Artistrsquos ImpressionPavilion Road
UK ndash Pipeline Projects
Development House
Planning application to be submitted in Q2 2017
Existing 28000 sq ft remains fully leased and vacantpossession expected from Q2 2018
Development House Leonard Street in Shoreditch
Tenure Equity Stake Est Total Lettable Area (sq ft)
Freehold 100 90000 sq ft
Artistrsquos Impression
Artistrsquos Impression
UK ndashAcquisition of 16-acre Ransomes Wharf site for pound58 million
Located within Battersearsquos creative quarter on theRiver Thames
Est GDV of pound222 million
Contracts completed purchase to be phased overthe next 18 months
Profit before tax pound108m pound109m (09) pound124m (129)
PATMI pound78m pound65m 200
Trading Performance
The Baileyrsquos Hotel London The Baileyrsquos Hotel London
Increase in reported revenue attributed to higher land sales in New Zealand and a higher contribution from Millennium Mitsui Garden Hotel Tokyo coupled with favourable foreign exchange movements as a result of weak pound against major currencies
MampC Hotel Operations
58
Trading Performance
RevPAR in reported currency was up by 66 but in constant currency fell by 23 for FY 2016 as compared to the same period last year
FY 2016 Reported Currency Constant CurrencyNew York pound14564 uarr 19 darr 99Regional US pound5749 uarr175 uarr 40Total US pound8652 uarr 83 darr 42London pound10718 darr 14 darr 14Rest of Europe pound5261 uarr 20 darr 16Total Europe pound8024 darr 08 darr 20Singapore pound8021 uarr 05 darr 101Rest of Asia pound6063 uarr 116 uarr 19Total Asia pound6821 uarr 62 darr 40Australasia pound5840 uarr 348 uarr 209Total Group pound7671 uarr 66 darr 23 Millennium Seoul Hilton
Copthorne Hotel amp Resort Queenstown Lakefront
Sheet1
Developments ndash Progressing well
The lifestyle hotel and serviced apartment has 306 and 209keys respectively
The building permit approval for Seoul Yangdong developmentproject has been received on 25 January 2017 Additionalcertification processes are expected to complete by mid 2017
The main contract tender process is planned to complete bymid 2017 before construction work starts
Seoul South Korea
59
Comprises a 263-room hotel and a 250-unit residentialapartment block
The final planning approval has been received in December2016
Currently reviewing the project costing and specification whichis anticipated to take about 18 months to complete aftercommencement
Sunnyvale US
MampC Hotel Operations
MampC Hotel Operations
60
ONE UN New York
Refurbishment of guestrooms in the east tower was completed in early Sep 2016 and the towers were re-opened in time for the UN General Assembly
Assets Enhancement (Completed)
Grand Copthorne Waterfront Hotel Singapore
Work on the main lobby and FampB outlets at the main entrance level was substantially completed in May 2016
Refurbishment of function rooms on level 2 started in Sep 2016 and completed in Dec 2016
M Hotel Singapore
Soft refurbishment of all guestrooms from level 12 to level 28 is complete with the last phase completed in Dec 2016
ONE UN New York
Grand Copthorne Waterfront Hotel Singapore
M Hotel Singapore
MampC Hotel Operations
61
Grand Millennium Kuala Lumpur
Soft refurbishment of guestrooms from level 9 to level 19 was completed at the beginning of the 4th quarter of 2016
Remaining guestrooms at level 7 and level 8 is planned to be refurbished in the mid 2017
Assets Enhancement (On-going)
Grand Millennium Kuala Lumpur
Copthorne Hotel Auckland Harbour City
Copthorne Hotel Auckland Harbour City
Closed for a major refurbishment programme in Q3 2015 at an estimated cost of NZ$40 million
The hotel will be rebranded as M Social Hotel Auckland and is expected to re-open in 2nd quarter of 2017
Artistrsquos Impression
Artistrsquos Impression
31 Dec 31 Dec 31 Dec 31 DecHotel and Room Count 2016 2015 2016 2015By region New York 4 4 2238 2238 Regional US 15 15 4559 4463 London 8 8 2651 2651 Rest of Europe 19 18 3081 2867 Middle East 26 22 7805 6450 Singapore 7 6 3011 2716 Rest of Asia 27 26 10036 9430 Australasia 25 27 3641 3903 Total 131 126 37022 34718
PipelineBy region Middle East 17 16 5465 4663 Rest of Asia 4 3 1608 1674 Regional USA 1 1 263 263 Rest of Europe 1 - 153 - Total 23 20 7489 6600
Hotels Rooms
Hotel Room Count and Pipeline
MampC Hotel Operations
Mainly management contracts
62
Millennium Biltmore Hotel Los Angeles
Grand Millennium Auckland
Sheet1
CDL Hospitality Trusts
63
S$rsquo000 FY 2016 FY 2015 Change
Gross Revenue 180857 172410 49
Net Property Income (NPI) 137560 137003 04
Trading Performance
Hilton Cambridge City Centre ndash Executive Lounge
Artistrsquos Impression
Gross revenue and NPI increased mainly due to Inorganic contribution from Hilton Cambridge City Centre United Kingdom which
was acquired on 1 Oct 2015 Strong contribution from New Zealand hotels as a result of higher variable rental
income Incremental income boost from Japan hotels and Claymore Connect retail mall
This was partially offset by Continued weakness in Singapore and Maldives markets due to soft trading
conditions amid the global economic slowdown Lower contribution from Australia due to weaker AUD and lower variable income
contribution for FY 2016
Artistrsquos Impression
Disclaimer
This document may contain forward-looking statements that involve assumptions risks and uncertainties Actual future performance outcomes and results may differ materially from those expressed in forward-looking statements as a result of a number of risks uncertainties and assumptions Representative examples of these factors include (without limitation) general industry and economic conditions interest rate trends cost of capital and capital availability availability of real estate properties competition from other developments or companies shifts in customer demands customers and partners expected levels of occupancy rate property rental income charge out collections changes in operating expenses (including employee wages benefits and training costs) governmental and public policy changes and the continued availability of financing in the amounts and the terms necessary to support future business You are cautioned not to place undue reliance on these forward-looking statements which are based on the current view of management on future events Numbers in tables and charts may not add up due to rounding
Gramercy Park Singaporewwwcdlcomsg
Slide Number 1
Slide Number 2
Slide Number 3
Slide Number 4
Slide Number 5
Slide Number 6
Slide Number 7
Slide Number 8
Slide Number 9
Slide Number 10
Slide Number 11
Slide Number 12
Slide Number 13
Slide Number 14
Slide Number 15
Slide Number 16
Slide Number 17
Slide Number 18
Slide Number 19
Slide Number 20
Slide Number 21
Slide Number 22
Slide Number 23
Slide Number 24
Slide Number 25
Slide Number 26
Slide Number 27
Slide Number 28
Slide Number 29
Slide Number 30
Slide Number 31
Slide Number 32
Slide Number 33
Slide Number 34
Slide Number 35
Slide Number 36
Slide Number 37
Slide Number 38
Slide Number 39
Slide Number 40
Slide Number 41
Slide Number 42
Slide Number 43
Slide Number 44
Slide Number 45
Slide Number 46
Slide Number 47
Slide Number 48
Slide Number 49
Slide Number 50
Slide Number 51
Slide Number 52
Slide Number 53
Slide Number 54
Slide Number 55
Slide Number 56
Slide Number 57
Slide Number 58
Slide Number 59
Slide Number 60
Slide Number 61
Slide Number 62
Slide Number 63
Slide Number 64
Slide Number 65
Hotels
Rooms
31 Dec
31 Dec
31 Dec
31 Dec
Hotel and Room Count
2016
2015
2016
2015
By region
New York
4
4
2238
2238
Regional US
15
15
4559
4463
London
8
8
2651
2651
Rest of Europe
19
18
3081
2867
Middle East
26
22
7805
6450
Singapore
7
6
3011
2716
Rest of Asia
27
26
10036
9430
Australasia
25
27
3641
3903
Total
131
126
37022
34718
Pipeline
By region
Middle East
17
16
5465
4663
Rest of Asia
4
3
1608
1674
Regional USA
1
1
263
263
Rest of Europe
1
- 0
153
- 0
Total
23
20
7489
6600
FY 2016
Reported Currency
Constant Currency
New York
pound14564
uarr 19
darr 99
Regional US
pound5749
uarr175
uarr 40
Total US
pound8652
uarr 83
darr 42
London
pound10718
darr 14
darr 14
Rest of Europe
pound5261
uarr 20
darr 16
Total Europe
pound8024
darr 08
darr 20
Singapore
pound8021
uarr 05
darr 101
Rest of Asia
pound6063
uarr 116
uarr 19
Total Asia
pound6821
uarr 62
darr 40
Australasia
pound5840
uarr 348
uarr 209
Total Group
pound7671
uarr 66
darr 23
Project
Equity Stake
Total Units
Units Sold
Sold
Total Unsold Inventory
CDLrsquos Share of Unsold Inventory
St Regis Residences
33
173
161
93
12
4
The Oceanfront Sentosa Cove
50
264
263
99
1
05
One Shenton
100
341
327
96
14
14
Cliveden at Grange
100
110
44
40
66
66
UPRobertson Quay
100
70
57
81
13
13
Echelon
50
508
506
100
2
1
DNest
51
912
904
99
8
408
Jewel Buangkok
100
616
616
100
0
0
The Venue Shoppes
60
28
16
57
12
72
The Venue Residences
60
266
181
68
85
51
Coco Palms
51
944
865
92
79
4029
The Brownstone Executive Condo
70
638
519
81
119
833
The Criterion Executive Condo
70
505
179
35
326
2282
Gramercy Park
100
174
46
53^
41^
41^
(Phase 1 = 87-unit North Tower)
Forest Woods
50
519
382
74
137
685
Bartley Ridge
30
868
868
100
0
0
Commonwealth Towers
30
845
461
55
384
1152
TOTAL
7781
6395
1299
7373
Revenue
Profit Before Tax
Q4 2016
Q4 2016
Incr (Decr)
Q4 2016
Q4 2015
Incr (Decr)
$M
$M
$M
$M
Property Development
5981
2417
1475
2426
1158
1095
Hotel Operations(include CDL owned hotels)
4437
4627
(41)
(92)
91
NM
Rental Properties
887
1049
(154)
1008
3491
(711)
Others
365
457
(201)
(27)
(27)
-
- 0
11670
8550
365
3315
4713
(297)
FY 2016
FY 2015
Incr (Decr)
FY 2016
FY 2015
Incr (Decr)
$M
$M
$M
$M
Property Development
17447
10371
682
5197
3559
460
Hotel Operations(include CDL owned hotels)
16337
16981
(38)
1157
1709
(323)
Rental Properties
3669
4055
(95)
2073
4602
(550)
Others
1601
1634
(20)
713
(16)
NM
39054
33041
182
9140
9854
(72)
Artistrsquos Impression
Artistrsquos Impression
On target to raise $5 billion in Funds under Management (FUM) by end 2018
70 to target with 3rd Profit Participation Securities (PPS) in 2016
$9776 millionRaised from PPS transactionand exited interest toluxury freehold residentialproject to a group of Singaporean investors
12
Strategic Thrusts for FY 2017Acquisitive Position with Value Driven Focus
Focus on assets with in-place income in Singapore and overseas $304 million investments in Q1 2017 to date Disciplined capital deployment ndash for physical
assets equities or debt instruments
Grow funds management and capital recycling programme PPS Traditional private equity structures
Future-proof business through investments in new economy platforms
RMB 72 millionInvestment for24 equity stake in Distrii Chinarsquos leading co-workingspace operator
pound58 millionAcquisition of 16 acre Ransomes Wharf sitein Battersea South West London
Artistrsquos Impression
Q1 2017 Acquisition Highlights
To date 19 Feb 2017
Artistrsquos Impression
RMB 900 millionAcquisition of Shanghaicommercial projectMeidao Business Plazain Hongqiao
FINANCIAL HIGHLIGHTS
Financial Highlights
NM Not Meaningful 14
Segment Financial Results
Incr (Decr) Incr (Decr)
Property Development 5981 2417 1475 2426 1158 1095
Inventory of Launched Residential Projects ndashAs of 31 Dec 2016
32
Singapore Property Development
Leasing strategy implemented ^ Based on launched units
Note Above excludes inventory from The Residences at W Singapore ndash Sentosa Cove (203 units) unlaunched projects Nouvel 18 (156 units) and New Futura (124 units)
Sheet1
110
115
120
125
130
135
140
145
Q112
Q212
Q312
Q412
Q113
Q213
Q313
Q413
Q114
Q214
Q314
Q414
Q115
Q215
Q315
Q415
Q116
Q216
Q316
Q416
Office Retail
Source URA Q4 2016
33
Singapore Commercial MarketProperty Price Index ndash Commercial (2012ndash 2016)
Q4 161226
Q4 16 1347
Q3 161223
Q3 16 1355
Source JLL Research Q4 2016
$974
$1051$1204
$1038$914
$790 $837$926
$850$777
000
200
400
600
800
1000
1200
1400
2012 2013 2014 2015 2016
Marina Bay Raffles Place(Grade A)
Whole Island
34
Singapore Office MarketAverage Office Rental in CBD (2012 ndash 2016)
Office Space Demand amp Supply (2012 ndash 2016)Private amp Public Sector
78254 80095 81300 81365 83206
7091372205 72980 73647 73938
30000
35000
40000
45000
50000
55000
60000
65000
70000
75000
80000
85000
2012 2013 2014 2015 2016
Cumulative Supply Occupancy
Source URA Q4 2016
Singapore Office Market
CDLrsquos Office Properties Occupancy
959(National Average = 889)
35
Occupancy as of 31 Dec 2016
2017 2018 2019
33 28 25
Expiry of NLA
36
CDLrsquos Office Space ndash Lease Expiry Profile (2017 ndash 2019)
Rental Properties
Office Portfolio NLA ~2300000 sq ft
16Properties^
959Occupancy
As of 31 December 2016
Note Properties include -Republic Plaza Central Mall (Office Tower) City House Fuji Xerox Towers Manulife Centre Palais Renaissance Tanglin Shopping Centre The Arcade Katong Shopping Centre Kingrsquos Centre 7 amp 9 Tampines Grande 11 Tampines Concourse Sunshine Plaza Fortune Centre Golden Mile Complex Central Mall Conservation Unit
Based on contractual expiry dates Renewals will be negotiated nearer to expiry Tenants may renew their leases or increasereduce space or exit ^ Properties include strata-titled units owned and managed by CDL
60052
61333
6365864271
65079
57060
58599
59955 5963260192
52000
54000
56000
58000
60000
62000
64000
66000
2012 2013 2014 2015 2016
Cumulative Supply Occupancy
Retail Space Demand amp Supply (2012 ndash 2016)Private amp Public Sector
Source URA Q4 2016
With effect from Q1 2014 the coverage of retail space has been expanded to include non-shop retail uses and data are available from2011 onwards
Singapore Retail Market
CDLrsquos Retail Properties Occupancy
964(National Average = 925)
37
Occupancy as of 31 Dec 2016
38
CDLrsquos Retail Space ndash Lease Expiry Profile (2017 ndash 2019)
2017 2018 2019
2332 31
Expiry of NLA
Rental Properties
Retail Portfolio NLA ~840000 sq ft
19Properties^
964Occupancy
As of 31 December 2016
Based on contractual expiry dates Renewals will be negotiated nearer to expiry Tenants may renew their leases or increasereduce space or exit ^ Properties include strata-titled units owned and managed by CDL
Note Properties include ndashRepublic Plaza Central Mall (Office Tower) City Square Mall Palais Renaissance Tanglin Shopping Centre The Arcade Katong Shopping Centre Kingrsquos Centre Quayside Isle Grand Copthorne Waterfront (Waterfront Plaza) City Plaza Golden Mile Complex Central Mall Conservation Unit 7 amp 9 Tampines Grande City House Fortune Centre Manulife Centre Fuji Xerox Towers
39
Revenue by Sector for Full Year (2014 ndash 2016)
0
50
100
150
200
250
300
FY 2016 FY 2015 FY 2014
152187 176
110 113 111
7 8 8
74 75 65
24 23 25
S$ m
illio
n
Office
Retail
Industrial
REITHotel
Others ^
$367m $406m $385m
FY 2016 FY 2015 FY 2014
Office 41 46 46
Retail 30 28 29
Industrial 2 2 2
REITHotel 20 18 17
Others ^ 7 6 6
^ Including car park serviced apartments and residential
Rental Properties
40
EBITDA by Sector for Full Year (2014 ndash 2016)
050
100150200250300350400450500550600
FY 2016 FY 2015 FY 2014
185
446 ~
10175 64 91
5 4 453 58 53
6 15 19
S$ m
illio
n
Office
Retail
Industrial
REITHotel
Others ^
$324m $587m $268m
FY 2016 FY 2015 FY 2014
Office 57 76 38
Retail 23 11 34
Industrial 2 - 1
REITHotel 16 10 20
Others ^ 2 3 7
~ Includes gain on sale of Profit Participation Securities^ Including car park serviced apartments and residential
Rental Properties
South Beach
41
JW Marriott Hotel Singapore South Beach
JW Marriott Hotel Singapore South Beach
Rebranded hotel soft opened in mid-Dec2016
Business performance is within expectations
Ongoing works at NCO Club are expected tocomplete by Q3 2017 along with theremodelled Ballroom
South Beach Residences
190-unit luxury residence may be launchedin 2H 2017 subject to market conditions
Fully Completed in December 2016
Strong Performance for Office amp Retail
South Beach Tower (510000 sq ft office space) and retail space are fully leased
INTERNATIONAL OVERVIEW
Projects Launched To Date
43
Project City Equity Stake
Total Units
Total Units Sold
Booked
Sold Est TotalSaleable
Area (sq ft)
ExpectedCompletion
Australia
Ivy and Eve Brisbane 33 472 450 95 348678 1H 2018
China
Hong Leong City Center (Phase 1)
Suzhou 100^ 1374 1038 76 1378891 Completed
Hong Leong City Center (Phase 2 ndash T2)
Suzhou 100^ 430 174 40 439716 Q4 2017
Hongqiao Royal Lake Shanghai 100 85 34 40 385394 Completed
China ndash Good Progress on Launched Luxury Projects
International Property Development
47
Shanghai ndash Hongqiao Royal Lake (御湖)
Eling Residences Chongqing
Stable sales despite tightening measures in Shanghai
34 units soldbooked with sales value of RMB 668 millionachieved to date
Chongqing ndash Eling Residences (鹅岭峰)
Launched in Oct 2016
8 units soldbooked with sales value of RMB 85 million ndashachieved highest average values of close to RMB 40000 psm
City Equity Stake
Total Units
Total Units Sold Booked
Sold
Expected Completion
Shanghai 100 85 34 40 Completed
Hongqiao Royal Lake Shanghai
City Equity Stake
Total Units
Total Units Sold Booked
Sold
Expected Completion
Chongqing 100 126 8 6 Q2 2017
Artistrsquos Impression
As of 19 Feb 2017
Chongqing ndash Huang Huayuan (黄花园)
Scheduled launch of mixed-use development with over 600 residential units in 2019
48
Over 150000 apartment listings spanning over 20 citiesin China
Offers one-stop solution for apartment owners andrental customers
Investment provides immediate entry into this fast-growing new economy sectorminus Complement business portfoliominus Contributes to future long-term recurring income stream
Synergies to be shared with the Grouprsquos properties inShanghai Suzhou and Chongqing
Strategic Acquisition of 20 Equity Stake in mamahome for RMB 100 million
Distrii ndash Leading Provider of Co-working Space Acquisition completed in Jan 2017
Currently 15 locations (13 Shanghai + 1 Beijing + 1 Hangzhou) 3700 seating capacity in total 10 locations in operation with 5 more locations to open in 1H 2017
Targeting to double the locations in China by end 2017
Current capacity of over 2200 seats has reached above 80 occupancy
Committed to lease over 60000 sq ft in Republic Plaza Expected to open in 1H 2018
Distrii Suhe Center Shanghai
Strategic Acquisition of 24 Equity Stake in Distrii for RMB 72 million
50
Purchase of a 100 equity stake in Shanghai MeidaoInvestment Co which owns the commercial projectthat is in the final stages of construction
Total transaction value of RMB 900 million throughCDL China Limited
Strategically located in Huacao Minhang Districtwithin the Hongqiao CBD ndash a new area established in2009 that spans 86 sq km and is one of Shanghairsquosfastest growing business areas
Project comprises five 9-storey office towers and twolevels of basement carpark with about 351 lots
Project has been approved for division into strata-titleunits
China ndashAcquisition of Shanghai Commercial Project for RMB 900 million
Artistrsquos ImpressionMeidao Business Plaza Shanghai
Meidao Business Plaza ShanghaiTenure Equity
StakeEst Total GFA
(sqm)Expected
Completion
50-year lease 100 32300 2H 2017
International Rental Properties
Artistrsquos Impression
Japan ndash Invested in 2 Prime Residential Projects in Tokyo
Located within prestigious Aoyama area withinMinato ward in Tokyo
Project targeted at high-end domestic and foreignbuyers
Good uptake with over 50 of units sold since itslaunch in Oct 2016
Tokyo ndashPark Court Aoyama The Tower
International Property Development
51
Artistrsquos ImpressionPark Court Aoyama The Tower Tokyo
Tokyo ndash ShirokaneTenure Equity Stake Site Area (sqm)
Freehold 947 16815
Discussions with potential JV partner for project development ongoing
City Equity Stake Total Units
Total Units Sold Expected Completion
Freehold 20 163 Over 50 1H 2018
As of 19 Feb 2017
Teddington Riverside Teddington TW11
Full planning received works on basement car park inadvanced stage
Block A (57 units) will be launched in Q2 2017 followed byanother five blocks
International Property Development
52
UK ndash Upcoming Launches in Q2 2017
Artistrsquos Impression
Tenure EquityStake
Total Units Est TotalSaleable Area
(sq ft)
Expected Completion
Freehold 100 220 240000 2018 (Phased)
Teddington Riverside London
Project Tenure Equity Stake
Total Units
Est TotalSaleable
Area (sq ft)
Expected Completion
Belgravia Freehold 100 6 12375 Q2 2017
Knightsbridge Freehold 100 3 5193 Q2 2017
Belgravia3135 Chesham Street London SW1X 8NQ
Knightsbridge32 Hans Road London SW3 1RW
Chelsea 90-100 Sydney Street London SW3 6NJ
International Property Development
53
UK ndash Pipeline Projects
Tenure EquityStake
Total Units Est TotalSaleable Area
(sq ft)
Expected Completion
Freehold 100 9 16143 Q2 2018
Stag Brewery London
Tenure Equity Stake Est Total Saleable Area (sq ft)
Freehold 100 1000000 sq ft
Stag Brewery Mortlake London SW14
Advanced master plan at public consultation stage
Planning applications to be submitted by end Q2 2017
Proposed scheme to comprise two phases Parameter plan covering the entire site Detailed planning application for Phase 1Artistrsquos Impression
Artistrsquos Impression
Good progress on works
Expected completion in Q2 2018
International Property Development
54
Tenure Equity Stake Total Units Est GFA (sq ft)
Freehold 100 34 135000
28 Pavilion Road Knightsbridge London SW1
First luxury home care development to be built in Central Londonndash planning consent obtained
Project on target to commence demolition works in Q2 2017Artistrsquos ImpressionPavilion Road
UK ndash Pipeline Projects
Development House
Planning application to be submitted in Q2 2017
Existing 28000 sq ft remains fully leased and vacantpossession expected from Q2 2018
Development House Leonard Street in Shoreditch
Tenure Equity Stake Est Total Lettable Area (sq ft)
Freehold 100 90000 sq ft
Artistrsquos Impression
Artistrsquos Impression
UK ndashAcquisition of 16-acre Ransomes Wharf site for pound58 million
Located within Battersearsquos creative quarter on theRiver Thames
Est GDV of pound222 million
Contracts completed purchase to be phased overthe next 18 months
Profit before tax pound108m pound109m (09) pound124m (129)
PATMI pound78m pound65m 200
Trading Performance
The Baileyrsquos Hotel London The Baileyrsquos Hotel London
Increase in reported revenue attributed to higher land sales in New Zealand and a higher contribution from Millennium Mitsui Garden Hotel Tokyo coupled with favourable foreign exchange movements as a result of weak pound against major currencies
MampC Hotel Operations
58
Trading Performance
RevPAR in reported currency was up by 66 but in constant currency fell by 23 for FY 2016 as compared to the same period last year
FY 2016 Reported Currency Constant CurrencyNew York pound14564 uarr 19 darr 99Regional US pound5749 uarr175 uarr 40Total US pound8652 uarr 83 darr 42London pound10718 darr 14 darr 14Rest of Europe pound5261 uarr 20 darr 16Total Europe pound8024 darr 08 darr 20Singapore pound8021 uarr 05 darr 101Rest of Asia pound6063 uarr 116 uarr 19Total Asia pound6821 uarr 62 darr 40Australasia pound5840 uarr 348 uarr 209Total Group pound7671 uarr 66 darr 23 Millennium Seoul Hilton
Copthorne Hotel amp Resort Queenstown Lakefront
Sheet1
Developments ndash Progressing well
The lifestyle hotel and serviced apartment has 306 and 209keys respectively
The building permit approval for Seoul Yangdong developmentproject has been received on 25 January 2017 Additionalcertification processes are expected to complete by mid 2017
The main contract tender process is planned to complete bymid 2017 before construction work starts
Seoul South Korea
59
Comprises a 263-room hotel and a 250-unit residentialapartment block
The final planning approval has been received in December2016
Currently reviewing the project costing and specification whichis anticipated to take about 18 months to complete aftercommencement
Sunnyvale US
MampC Hotel Operations
MampC Hotel Operations
60
ONE UN New York
Refurbishment of guestrooms in the east tower was completed in early Sep 2016 and the towers were re-opened in time for the UN General Assembly
Assets Enhancement (Completed)
Grand Copthorne Waterfront Hotel Singapore
Work on the main lobby and FampB outlets at the main entrance level was substantially completed in May 2016
Refurbishment of function rooms on level 2 started in Sep 2016 and completed in Dec 2016
M Hotel Singapore
Soft refurbishment of all guestrooms from level 12 to level 28 is complete with the last phase completed in Dec 2016
ONE UN New York
Grand Copthorne Waterfront Hotel Singapore
M Hotel Singapore
MampC Hotel Operations
61
Grand Millennium Kuala Lumpur
Soft refurbishment of guestrooms from level 9 to level 19 was completed at the beginning of the 4th quarter of 2016
Remaining guestrooms at level 7 and level 8 is planned to be refurbished in the mid 2017
Assets Enhancement (On-going)
Grand Millennium Kuala Lumpur
Copthorne Hotel Auckland Harbour City
Copthorne Hotel Auckland Harbour City
Closed for a major refurbishment programme in Q3 2015 at an estimated cost of NZ$40 million
The hotel will be rebranded as M Social Hotel Auckland and is expected to re-open in 2nd quarter of 2017
Artistrsquos Impression
Artistrsquos Impression
31 Dec 31 Dec 31 Dec 31 DecHotel and Room Count 2016 2015 2016 2015By region New York 4 4 2238 2238 Regional US 15 15 4559 4463 London 8 8 2651 2651 Rest of Europe 19 18 3081 2867 Middle East 26 22 7805 6450 Singapore 7 6 3011 2716 Rest of Asia 27 26 10036 9430 Australasia 25 27 3641 3903 Total 131 126 37022 34718
PipelineBy region Middle East 17 16 5465 4663 Rest of Asia 4 3 1608 1674 Regional USA 1 1 263 263 Rest of Europe 1 - 153 - Total 23 20 7489 6600
Hotels Rooms
Hotel Room Count and Pipeline
MampC Hotel Operations
Mainly management contracts
62
Millennium Biltmore Hotel Los Angeles
Grand Millennium Auckland
Sheet1
CDL Hospitality Trusts
63
S$rsquo000 FY 2016 FY 2015 Change
Gross Revenue 180857 172410 49
Net Property Income (NPI) 137560 137003 04
Trading Performance
Hilton Cambridge City Centre ndash Executive Lounge
Artistrsquos Impression
Gross revenue and NPI increased mainly due to Inorganic contribution from Hilton Cambridge City Centre United Kingdom which
was acquired on 1 Oct 2015 Strong contribution from New Zealand hotels as a result of higher variable rental
income Incremental income boost from Japan hotels and Claymore Connect retail mall
This was partially offset by Continued weakness in Singapore and Maldives markets due to soft trading
conditions amid the global economic slowdown Lower contribution from Australia due to weaker AUD and lower variable income
contribution for FY 2016
Artistrsquos Impression
Disclaimer
This document may contain forward-looking statements that involve assumptions risks and uncertainties Actual future performance outcomes and results may differ materially from those expressed in forward-looking statements as a result of a number of risks uncertainties and assumptions Representative examples of these factors include (without limitation) general industry and economic conditions interest rate trends cost of capital and capital availability availability of real estate properties competition from other developments or companies shifts in customer demands customers and partners expected levels of occupancy rate property rental income charge out collections changes in operating expenses (including employee wages benefits and training costs) governmental and public policy changes and the continued availability of financing in the amounts and the terms necessary to support future business You are cautioned not to place undue reliance on these forward-looking statements which are based on the current view of management on future events Numbers in tables and charts may not add up due to rounding
Gramercy Park Singaporewwwcdlcomsg
Slide Number 1
Slide Number 2
Slide Number 3
Slide Number 4
Slide Number 5
Slide Number 6
Slide Number 7
Slide Number 8
Slide Number 9
Slide Number 10
Slide Number 11
Slide Number 12
Slide Number 13
Slide Number 14
Slide Number 15
Slide Number 16
Slide Number 17
Slide Number 18
Slide Number 19
Slide Number 20
Slide Number 21
Slide Number 22
Slide Number 23
Slide Number 24
Slide Number 25
Slide Number 26
Slide Number 27
Slide Number 28
Slide Number 29
Slide Number 30
Slide Number 31
Slide Number 32
Slide Number 33
Slide Number 34
Slide Number 35
Slide Number 36
Slide Number 37
Slide Number 38
Slide Number 39
Slide Number 40
Slide Number 41
Slide Number 42
Slide Number 43
Slide Number 44
Slide Number 45
Slide Number 46
Slide Number 47
Slide Number 48
Slide Number 49
Slide Number 50
Slide Number 51
Slide Number 52
Slide Number 53
Slide Number 54
Slide Number 55
Slide Number 56
Slide Number 57
Slide Number 58
Slide Number 59
Slide Number 60
Slide Number 61
Slide Number 62
Slide Number 63
Slide Number 64
Slide Number 65
Hotels
Rooms
31 Dec
31 Dec
31 Dec
31 Dec
Hotel and Room Count
2016
2015
2016
2015
By region
New York
4
4
2238
2238
Regional US
15
15
4559
4463
London
8
8
2651
2651
Rest of Europe
19
18
3081
2867
Middle East
26
22
7805
6450
Singapore
7
6
3011
2716
Rest of Asia
27
26
10036
9430
Australasia
25
27
3641
3903
Total
131
126
37022
34718
Pipeline
By region
Middle East
17
16
5465
4663
Rest of Asia
4
3
1608
1674
Regional USA
1
1
263
263
Rest of Europe
1
- 0
153
- 0
Total
23
20
7489
6600
FY 2016
Reported Currency
Constant Currency
New York
pound14564
uarr 19
darr 99
Regional US
pound5749
uarr175
uarr 40
Total US
pound8652
uarr 83
darr 42
London
pound10718
darr 14
darr 14
Rest of Europe
pound5261
uarr 20
darr 16
Total Europe
pound8024
darr 08
darr 20
Singapore
pound8021
uarr 05
darr 101
Rest of Asia
pound6063
uarr 116
uarr 19
Total Asia
pound6821
uarr 62
darr 40
Australasia
pound5840
uarr 348
uarr 209
Total Group
pound7671
uarr 66
darr 23
Project
Equity Stake
Total Units
Units Sold
Sold
Total Unsold Inventory
CDLrsquos Share of Unsold Inventory
St Regis Residences
33
173
161
93
12
4
The Oceanfront Sentosa Cove
50
264
263
99
1
05
One Shenton
100
341
327
96
14
14
Cliveden at Grange
100
110
44
40
66
66
UPRobertson Quay
100
70
57
81
13
13
Echelon
50
508
506
100
2
1
DNest
51
912
904
99
8
408
Jewel Buangkok
100
616
616
100
0
0
The Venue Shoppes
60
28
16
57
12
72
The Venue Residences
60
266
181
68
85
51
Coco Palms
51
944
865
92
79
4029
The Brownstone Executive Condo
70
638
519
81
119
833
The Criterion Executive Condo
70
505
179
35
326
2282
Gramercy Park
100
174
46
53^
41^
41^
(Phase 1 = 87-unit North Tower)
Forest Woods
50
519
382
74
137
685
Bartley Ridge
30
868
868
100
0
0
Commonwealth Towers
30
845
461
55
384
1152
TOTAL
7781
6395
1299
7373
Revenue
Profit Before Tax
Q4 2016
Q4 2016
Incr (Decr)
Q4 2016
Q4 2015
Incr (Decr)
$M
$M
$M
$M
Property Development
5981
2417
1475
2426
1158
1095
Hotel Operations(include CDL owned hotels)
4437
4627
(41)
(92)
91
NM
Rental Properties
887
1049
(154)
1008
3491
(711)
Others
365
457
(201)
(27)
(27)
-
- 0
11670
8550
365
3315
4713
(297)
FY 2016
FY 2015
Incr (Decr)
FY 2016
FY 2015
Incr (Decr)
$M
$M
$M
$M
Property Development
17447
10371
682
5197
3559
460
Hotel Operations(include CDL owned hotels)
16337
16981
(38)
1157
1709
(323)
Rental Properties
3669
4055
(95)
2073
4602
(550)
Others
1601
1634
(20)
713
(16)
NM
39054
33041
182
9140
9854
(72)
12
Strategic Thrusts for FY 2017Acquisitive Position with Value Driven Focus
Focus on assets with in-place income in Singapore and overseas $304 million investments in Q1 2017 to date Disciplined capital deployment ndash for physical
assets equities or debt instruments
Grow funds management and capital recycling programme PPS Traditional private equity structures
Future-proof business through investments in new economy platforms
RMB 72 millionInvestment for24 equity stake in Distrii Chinarsquos leading co-workingspace operator
pound58 millionAcquisition of 16 acre Ransomes Wharf sitein Battersea South West London
Artistrsquos Impression
Q1 2017 Acquisition Highlights
To date 19 Feb 2017
Artistrsquos Impression
RMB 900 millionAcquisition of Shanghaicommercial projectMeidao Business Plazain Hongqiao
FINANCIAL HIGHLIGHTS
Financial Highlights
NM Not Meaningful 14
Segment Financial Results
Incr (Decr) Incr (Decr)
Property Development 5981 2417 1475 2426 1158 1095
Inventory of Launched Residential Projects ndashAs of 31 Dec 2016
32
Singapore Property Development
Leasing strategy implemented ^ Based on launched units
Note Above excludes inventory from The Residences at W Singapore ndash Sentosa Cove (203 units) unlaunched projects Nouvel 18 (156 units) and New Futura (124 units)
Sheet1
110
115
120
125
130
135
140
145
Q112
Q212
Q312
Q412
Q113
Q213
Q313
Q413
Q114
Q214
Q314
Q414
Q115
Q215
Q315
Q415
Q116
Q216
Q316
Q416
Office Retail
Source URA Q4 2016
33
Singapore Commercial MarketProperty Price Index ndash Commercial (2012ndash 2016)
Q4 161226
Q4 16 1347
Q3 161223
Q3 16 1355
Source JLL Research Q4 2016
$974
$1051$1204
$1038$914
$790 $837$926
$850$777
000
200
400
600
800
1000
1200
1400
2012 2013 2014 2015 2016
Marina Bay Raffles Place(Grade A)
Whole Island
34
Singapore Office MarketAverage Office Rental in CBD (2012 ndash 2016)
Office Space Demand amp Supply (2012 ndash 2016)Private amp Public Sector
78254 80095 81300 81365 83206
7091372205 72980 73647 73938
30000
35000
40000
45000
50000
55000
60000
65000
70000
75000
80000
85000
2012 2013 2014 2015 2016
Cumulative Supply Occupancy
Source URA Q4 2016
Singapore Office Market
CDLrsquos Office Properties Occupancy
959(National Average = 889)
35
Occupancy as of 31 Dec 2016
2017 2018 2019
33 28 25
Expiry of NLA
36
CDLrsquos Office Space ndash Lease Expiry Profile (2017 ndash 2019)
Rental Properties
Office Portfolio NLA ~2300000 sq ft
16Properties^
959Occupancy
As of 31 December 2016
Note Properties include -Republic Plaza Central Mall (Office Tower) City House Fuji Xerox Towers Manulife Centre Palais Renaissance Tanglin Shopping Centre The Arcade Katong Shopping Centre Kingrsquos Centre 7 amp 9 Tampines Grande 11 Tampines Concourse Sunshine Plaza Fortune Centre Golden Mile Complex Central Mall Conservation Unit
Based on contractual expiry dates Renewals will be negotiated nearer to expiry Tenants may renew their leases or increasereduce space or exit ^ Properties include strata-titled units owned and managed by CDL
60052
61333
6365864271
65079
57060
58599
59955 5963260192
52000
54000
56000
58000
60000
62000
64000
66000
2012 2013 2014 2015 2016
Cumulative Supply Occupancy
Retail Space Demand amp Supply (2012 ndash 2016)Private amp Public Sector
Source URA Q4 2016
With effect from Q1 2014 the coverage of retail space has been expanded to include non-shop retail uses and data are available from2011 onwards
Singapore Retail Market
CDLrsquos Retail Properties Occupancy
964(National Average = 925)
37
Occupancy as of 31 Dec 2016
38
CDLrsquos Retail Space ndash Lease Expiry Profile (2017 ndash 2019)
2017 2018 2019
2332 31
Expiry of NLA
Rental Properties
Retail Portfolio NLA ~840000 sq ft
19Properties^
964Occupancy
As of 31 December 2016
Based on contractual expiry dates Renewals will be negotiated nearer to expiry Tenants may renew their leases or increasereduce space or exit ^ Properties include strata-titled units owned and managed by CDL
Note Properties include ndashRepublic Plaza Central Mall (Office Tower) City Square Mall Palais Renaissance Tanglin Shopping Centre The Arcade Katong Shopping Centre Kingrsquos Centre Quayside Isle Grand Copthorne Waterfront (Waterfront Plaza) City Plaza Golden Mile Complex Central Mall Conservation Unit 7 amp 9 Tampines Grande City House Fortune Centre Manulife Centre Fuji Xerox Towers
39
Revenue by Sector for Full Year (2014 ndash 2016)
0
50
100
150
200
250
300
FY 2016 FY 2015 FY 2014
152187 176
110 113 111
7 8 8
74 75 65
24 23 25
S$ m
illio
n
Office
Retail
Industrial
REITHotel
Others ^
$367m $406m $385m
FY 2016 FY 2015 FY 2014
Office 41 46 46
Retail 30 28 29
Industrial 2 2 2
REITHotel 20 18 17
Others ^ 7 6 6
^ Including car park serviced apartments and residential
Rental Properties
40
EBITDA by Sector for Full Year (2014 ndash 2016)
050
100150200250300350400450500550600
FY 2016 FY 2015 FY 2014
185
446 ~
10175 64 91
5 4 453 58 53
6 15 19
S$ m
illio
n
Office
Retail
Industrial
REITHotel
Others ^
$324m $587m $268m
FY 2016 FY 2015 FY 2014
Office 57 76 38
Retail 23 11 34
Industrial 2 - 1
REITHotel 16 10 20
Others ^ 2 3 7
~ Includes gain on sale of Profit Participation Securities^ Including car park serviced apartments and residential
Rental Properties
South Beach
41
JW Marriott Hotel Singapore South Beach
JW Marriott Hotel Singapore South Beach
Rebranded hotel soft opened in mid-Dec2016
Business performance is within expectations
Ongoing works at NCO Club are expected tocomplete by Q3 2017 along with theremodelled Ballroom
South Beach Residences
190-unit luxury residence may be launchedin 2H 2017 subject to market conditions
Fully Completed in December 2016
Strong Performance for Office amp Retail
South Beach Tower (510000 sq ft office space) and retail space are fully leased
INTERNATIONAL OVERVIEW
Projects Launched To Date
43
Project City Equity Stake
Total Units
Total Units Sold
Booked
Sold Est TotalSaleable
Area (sq ft)
ExpectedCompletion
Australia
Ivy and Eve Brisbane 33 472 450 95 348678 1H 2018
China
Hong Leong City Center (Phase 1)
Suzhou 100^ 1374 1038 76 1378891 Completed
Hong Leong City Center (Phase 2 ndash T2)
Suzhou 100^ 430 174 40 439716 Q4 2017
Hongqiao Royal Lake Shanghai 100 85 34 40 385394 Completed
China ndash Good Progress on Launched Luxury Projects
International Property Development
47
Shanghai ndash Hongqiao Royal Lake (御湖)
Eling Residences Chongqing
Stable sales despite tightening measures in Shanghai
34 units soldbooked with sales value of RMB 668 millionachieved to date
Chongqing ndash Eling Residences (鹅岭峰)
Launched in Oct 2016
8 units soldbooked with sales value of RMB 85 million ndashachieved highest average values of close to RMB 40000 psm
City Equity Stake
Total Units
Total Units Sold Booked
Sold
Expected Completion
Shanghai 100 85 34 40 Completed
Hongqiao Royal Lake Shanghai
City Equity Stake
Total Units
Total Units Sold Booked
Sold
Expected Completion
Chongqing 100 126 8 6 Q2 2017
Artistrsquos Impression
As of 19 Feb 2017
Chongqing ndash Huang Huayuan (黄花园)
Scheduled launch of mixed-use development with over 600 residential units in 2019
48
Over 150000 apartment listings spanning over 20 citiesin China
Offers one-stop solution for apartment owners andrental customers
Investment provides immediate entry into this fast-growing new economy sectorminus Complement business portfoliominus Contributes to future long-term recurring income stream
Synergies to be shared with the Grouprsquos properties inShanghai Suzhou and Chongqing
Strategic Acquisition of 20 Equity Stake in mamahome for RMB 100 million
Distrii ndash Leading Provider of Co-working Space Acquisition completed in Jan 2017
Currently 15 locations (13 Shanghai + 1 Beijing + 1 Hangzhou) 3700 seating capacity in total 10 locations in operation with 5 more locations to open in 1H 2017
Targeting to double the locations in China by end 2017
Current capacity of over 2200 seats has reached above 80 occupancy
Committed to lease over 60000 sq ft in Republic Plaza Expected to open in 1H 2018
Distrii Suhe Center Shanghai
Strategic Acquisition of 24 Equity Stake in Distrii for RMB 72 million
50
Purchase of a 100 equity stake in Shanghai MeidaoInvestment Co which owns the commercial projectthat is in the final stages of construction
Total transaction value of RMB 900 million throughCDL China Limited
Strategically located in Huacao Minhang Districtwithin the Hongqiao CBD ndash a new area established in2009 that spans 86 sq km and is one of Shanghairsquosfastest growing business areas
Project comprises five 9-storey office towers and twolevels of basement carpark with about 351 lots
Project has been approved for division into strata-titleunits
China ndashAcquisition of Shanghai Commercial Project for RMB 900 million
Artistrsquos ImpressionMeidao Business Plaza Shanghai
Meidao Business Plaza ShanghaiTenure Equity
StakeEst Total GFA
(sqm)Expected
Completion
50-year lease 100 32300 2H 2017
International Rental Properties
Artistrsquos Impression
Japan ndash Invested in 2 Prime Residential Projects in Tokyo
Located within prestigious Aoyama area withinMinato ward in Tokyo
Project targeted at high-end domestic and foreignbuyers
Good uptake with over 50 of units sold since itslaunch in Oct 2016
Tokyo ndashPark Court Aoyama The Tower
International Property Development
51
Artistrsquos ImpressionPark Court Aoyama The Tower Tokyo
Tokyo ndash ShirokaneTenure Equity Stake Site Area (sqm)
Freehold 947 16815
Discussions with potential JV partner for project development ongoing
City Equity Stake Total Units
Total Units Sold Expected Completion
Freehold 20 163 Over 50 1H 2018
As of 19 Feb 2017
Teddington Riverside Teddington TW11
Full planning received works on basement car park inadvanced stage
Block A (57 units) will be launched in Q2 2017 followed byanother five blocks
International Property Development
52
UK ndash Upcoming Launches in Q2 2017
Artistrsquos Impression
Tenure EquityStake
Total Units Est TotalSaleable Area
(sq ft)
Expected Completion
Freehold 100 220 240000 2018 (Phased)
Teddington Riverside London
Project Tenure Equity Stake
Total Units
Est TotalSaleable
Area (sq ft)
Expected Completion
Belgravia Freehold 100 6 12375 Q2 2017
Knightsbridge Freehold 100 3 5193 Q2 2017
Belgravia3135 Chesham Street London SW1X 8NQ
Knightsbridge32 Hans Road London SW3 1RW
Chelsea 90-100 Sydney Street London SW3 6NJ
International Property Development
53
UK ndash Pipeline Projects
Tenure EquityStake
Total Units Est TotalSaleable Area
(sq ft)
Expected Completion
Freehold 100 9 16143 Q2 2018
Stag Brewery London
Tenure Equity Stake Est Total Saleable Area (sq ft)
Freehold 100 1000000 sq ft
Stag Brewery Mortlake London SW14
Advanced master plan at public consultation stage
Planning applications to be submitted by end Q2 2017
Proposed scheme to comprise two phases Parameter plan covering the entire site Detailed planning application for Phase 1Artistrsquos Impression
Artistrsquos Impression
Good progress on works
Expected completion in Q2 2018
International Property Development
54
Tenure Equity Stake Total Units Est GFA (sq ft)
Freehold 100 34 135000
28 Pavilion Road Knightsbridge London SW1
First luxury home care development to be built in Central Londonndash planning consent obtained
Project on target to commence demolition works in Q2 2017Artistrsquos ImpressionPavilion Road
UK ndash Pipeline Projects
Development House
Planning application to be submitted in Q2 2017
Existing 28000 sq ft remains fully leased and vacantpossession expected from Q2 2018
Development House Leonard Street in Shoreditch
Tenure Equity Stake Est Total Lettable Area (sq ft)
Freehold 100 90000 sq ft
Artistrsquos Impression
Artistrsquos Impression
UK ndashAcquisition of 16-acre Ransomes Wharf site for pound58 million
Located within Battersearsquos creative quarter on theRiver Thames
Est GDV of pound222 million
Contracts completed purchase to be phased overthe next 18 months
Profit before tax pound108m pound109m (09) pound124m (129)
PATMI pound78m pound65m 200
Trading Performance
The Baileyrsquos Hotel London The Baileyrsquos Hotel London
Increase in reported revenue attributed to higher land sales in New Zealand and a higher contribution from Millennium Mitsui Garden Hotel Tokyo coupled with favourable foreign exchange movements as a result of weak pound against major currencies
MampC Hotel Operations
58
Trading Performance
RevPAR in reported currency was up by 66 but in constant currency fell by 23 for FY 2016 as compared to the same period last year
FY 2016 Reported Currency Constant CurrencyNew York pound14564 uarr 19 darr 99Regional US pound5749 uarr175 uarr 40Total US pound8652 uarr 83 darr 42London pound10718 darr 14 darr 14Rest of Europe pound5261 uarr 20 darr 16Total Europe pound8024 darr 08 darr 20Singapore pound8021 uarr 05 darr 101Rest of Asia pound6063 uarr 116 uarr 19Total Asia pound6821 uarr 62 darr 40Australasia pound5840 uarr 348 uarr 209Total Group pound7671 uarr 66 darr 23 Millennium Seoul Hilton
Copthorne Hotel amp Resort Queenstown Lakefront
Sheet1
Developments ndash Progressing well
The lifestyle hotel and serviced apartment has 306 and 209keys respectively
The building permit approval for Seoul Yangdong developmentproject has been received on 25 January 2017 Additionalcertification processes are expected to complete by mid 2017
The main contract tender process is planned to complete bymid 2017 before construction work starts
Seoul South Korea
59
Comprises a 263-room hotel and a 250-unit residentialapartment block
The final planning approval has been received in December2016
Currently reviewing the project costing and specification whichis anticipated to take about 18 months to complete aftercommencement
Sunnyvale US
MampC Hotel Operations
MampC Hotel Operations
60
ONE UN New York
Refurbishment of guestrooms in the east tower was completed in early Sep 2016 and the towers were re-opened in time for the UN General Assembly
Assets Enhancement (Completed)
Grand Copthorne Waterfront Hotel Singapore
Work on the main lobby and FampB outlets at the main entrance level was substantially completed in May 2016
Refurbishment of function rooms on level 2 started in Sep 2016 and completed in Dec 2016
M Hotel Singapore
Soft refurbishment of all guestrooms from level 12 to level 28 is complete with the last phase completed in Dec 2016
ONE UN New York
Grand Copthorne Waterfront Hotel Singapore
M Hotel Singapore
MampC Hotel Operations
61
Grand Millennium Kuala Lumpur
Soft refurbishment of guestrooms from level 9 to level 19 was completed at the beginning of the 4th quarter of 2016
Remaining guestrooms at level 7 and level 8 is planned to be refurbished in the mid 2017
Assets Enhancement (On-going)
Grand Millennium Kuala Lumpur
Copthorne Hotel Auckland Harbour City
Copthorne Hotel Auckland Harbour City
Closed for a major refurbishment programme in Q3 2015 at an estimated cost of NZ$40 million
The hotel will be rebranded as M Social Hotel Auckland and is expected to re-open in 2nd quarter of 2017
Artistrsquos Impression
Artistrsquos Impression
31 Dec 31 Dec 31 Dec 31 DecHotel and Room Count 2016 2015 2016 2015By region New York 4 4 2238 2238 Regional US 15 15 4559 4463 London 8 8 2651 2651 Rest of Europe 19 18 3081 2867 Middle East 26 22 7805 6450 Singapore 7 6 3011 2716 Rest of Asia 27 26 10036 9430 Australasia 25 27 3641 3903 Total 131 126 37022 34718
PipelineBy region Middle East 17 16 5465 4663 Rest of Asia 4 3 1608 1674 Regional USA 1 1 263 263 Rest of Europe 1 - 153 - Total 23 20 7489 6600
Hotels Rooms
Hotel Room Count and Pipeline
MampC Hotel Operations
Mainly management contracts
62
Millennium Biltmore Hotel Los Angeles
Grand Millennium Auckland
Sheet1
CDL Hospitality Trusts
63
S$rsquo000 FY 2016 FY 2015 Change
Gross Revenue 180857 172410 49
Net Property Income (NPI) 137560 137003 04
Trading Performance
Hilton Cambridge City Centre ndash Executive Lounge
Artistrsquos Impression
Gross revenue and NPI increased mainly due to Inorganic contribution from Hilton Cambridge City Centre United Kingdom which
was acquired on 1 Oct 2015 Strong contribution from New Zealand hotels as a result of higher variable rental
income Incremental income boost from Japan hotels and Claymore Connect retail mall
This was partially offset by Continued weakness in Singapore and Maldives markets due to soft trading
conditions amid the global economic slowdown Lower contribution from Australia due to weaker AUD and lower variable income
contribution for FY 2016
Artistrsquos Impression
Disclaimer
This document may contain forward-looking statements that involve assumptions risks and uncertainties Actual future performance outcomes and results may differ materially from those expressed in forward-looking statements as a result of a number of risks uncertainties and assumptions Representative examples of these factors include (without limitation) general industry and economic conditions interest rate trends cost of capital and capital availability availability of real estate properties competition from other developments or companies shifts in customer demands customers and partners expected levels of occupancy rate property rental income charge out collections changes in operating expenses (including employee wages benefits and training costs) governmental and public policy changes and the continued availability of financing in the amounts and the terms necessary to support future business You are cautioned not to place undue reliance on these forward-looking statements which are based on the current view of management on future events Numbers in tables and charts may not add up due to rounding
Gramercy Park Singaporewwwcdlcomsg
Slide Number 1
Slide Number 2
Slide Number 3
Slide Number 4
Slide Number 5
Slide Number 6
Slide Number 7
Slide Number 8
Slide Number 9
Slide Number 10
Slide Number 11
Slide Number 12
Slide Number 13
Slide Number 14
Slide Number 15
Slide Number 16
Slide Number 17
Slide Number 18
Slide Number 19
Slide Number 20
Slide Number 21
Slide Number 22
Slide Number 23
Slide Number 24
Slide Number 25
Slide Number 26
Slide Number 27
Slide Number 28
Slide Number 29
Slide Number 30
Slide Number 31
Slide Number 32
Slide Number 33
Slide Number 34
Slide Number 35
Slide Number 36
Slide Number 37
Slide Number 38
Slide Number 39
Slide Number 40
Slide Number 41
Slide Number 42
Slide Number 43
Slide Number 44
Slide Number 45
Slide Number 46
Slide Number 47
Slide Number 48
Slide Number 49
Slide Number 50
Slide Number 51
Slide Number 52
Slide Number 53
Slide Number 54
Slide Number 55
Slide Number 56
Slide Number 57
Slide Number 58
Slide Number 59
Slide Number 60
Slide Number 61
Slide Number 62
Slide Number 63
Slide Number 64
Slide Number 65
Hotels
Rooms
31 Dec
31 Dec
31 Dec
31 Dec
Hotel and Room Count
2016
2015
2016
2015
By region
New York
4
4
2238
2238
Regional US
15
15
4559
4463
London
8
8
2651
2651
Rest of Europe
19
18
3081
2867
Middle East
26
22
7805
6450
Singapore
7
6
3011
2716
Rest of Asia
27
26
10036
9430
Australasia
25
27
3641
3903
Total
131
126
37022
34718
Pipeline
By region
Middle East
17
16
5465
4663
Rest of Asia
4
3
1608
1674
Regional USA
1
1
263
263
Rest of Europe
1
- 0
153
- 0
Total
23
20
7489
6600
FY 2016
Reported Currency
Constant Currency
New York
pound14564
uarr 19
darr 99
Regional US
pound5749
uarr175
uarr 40
Total US
pound8652
uarr 83
darr 42
London
pound10718
darr 14
darr 14
Rest of Europe
pound5261
uarr 20
darr 16
Total Europe
pound8024
darr 08
darr 20
Singapore
pound8021
uarr 05
darr 101
Rest of Asia
pound6063
uarr 116
uarr 19
Total Asia
pound6821
uarr 62
darr 40
Australasia
pound5840
uarr 348
uarr 209
Total Group
pound7671
uarr 66
darr 23
Project
Equity Stake
Total Units
Units Sold
Sold
Total Unsold Inventory
CDLrsquos Share of Unsold Inventory
St Regis Residences
33
173
161
93
12
4
The Oceanfront Sentosa Cove
50
264
263
99
1
05
One Shenton
100
341
327
96
14
14
Cliveden at Grange
100
110
44
40
66
66
UPRobertson Quay
100
70
57
81
13
13
Echelon
50
508
506
100
2
1
DNest
51
912
904
99
8
408
Jewel Buangkok
100
616
616
100
0
0
The Venue Shoppes
60
28
16
57
12
72
The Venue Residences
60
266
181
68
85
51
Coco Palms
51
944
865
92
79
4029
The Brownstone Executive Condo
70
638
519
81
119
833
The Criterion Executive Condo
70
505
179
35
326
2282
Gramercy Park
100
174
46
53^
41^
41^
(Phase 1 = 87-unit North Tower)
Forest Woods
50
519
382
74
137
685
Bartley Ridge
30
868
868
100
0
0
Commonwealth Towers
30
845
461
55
384
1152
TOTAL
7781
6395
1299
7373
Revenue
Profit Before Tax
Q4 2016
Q4 2016
Incr (Decr)
Q4 2016
Q4 2015
Incr (Decr)
$M
$M
$M
$M
Property Development
5981
2417
1475
2426
1158
1095
Hotel Operations(include CDL owned hotels)
4437
4627
(41)
(92)
91
NM
Rental Properties
887
1049
(154)
1008
3491
(711)
Others
365
457
(201)
(27)
(27)
-
- 0
11670
8550
365
3315
4713
(297)
FY 2016
FY 2015
Incr (Decr)
FY 2016
FY 2015
Incr (Decr)
$M
$M
$M
$M
Property Development
17447
10371
682
5197
3559
460
Hotel Operations(include CDL owned hotels)
16337
16981
(38)
1157
1709
(323)
Rental Properties
3669
4055
(95)
2073
4602
(550)
Others
1601
1634
(20)
713
(16)
NM
39054
33041
182
9140
9854
(72)
15
Revenue by Segment for 4th Quarter (2014 ndash 2016)
Financial Highlights
0
100
200
300
400
500
600
700
Q4 2016 Q4 2015 Q4 2014
598
242 246
444 463 464
89 105 103 36 45 34
$ m
illio
n
Property Development Hotel Operations Rental Properties Others
$1167m $855m $847m
Q4 2016 Q4 2015 Q4 2014
Property Development 51 28 29
Hotel Operations 38 54 55
Rental Properties 8 12 12
Others 3 6 4
Financial Highlights
16
Profit Before Tax by Segment for 4th Quarter (2014 ndash 2016)
(50)0
50100150200250300350400450
Q4 2016 Q4 2015 Q4 2014
243
116
251
(9)
9
139 101
349
41
(3) (3)
6
$ m
illio
n
Property Development Hotel Operations Rental Properties Others
$332m $471m $437m
Q4 2016 Q4 2015 Q4 2014
Property Development 73 25 57
Hotel Operations (3) 2 32
Rental Properties 31 74 10
Others (1) (1) 1
Financial Highlights
17
EBITDA by Segment for 4th Quarter (2014 ndash 2016)
Q4 2016 Q4 2015 Q4 2014
Property Development 60 21 50
Hotel Operations 9 8 35
Rental Properties 31 70 14
Others - 1 1
050
100150200250300350400
Q4 2016 Q4 2015 Q4 2014
251
116
262
38 42
180
130
382
74
(1)
3 7
$ m
illio
n
Property Development Hotel Operations Rental Properties Others
$418m $543m $523m
Financial Highlights
18
Revenue by Segment for Full Year (2014 ndash 2016)
0200400600800
100012001400160018002000
FY 2016 FY 2015 FY 2014
1745
1037
1581 1633 1698 1678
367 406 385 160 163 120
$ m
illio
n
Property Development Hotel Operations Rental Properties Others
$3905m $3304m $3764m
FY 2016 FY 2015 FY 2014
Property Development 45 32 42
Hotel Operations 42 51 45
Rental Properties 9 12 10
Others 4 5 3
Financial Highlights
19
Profit Before Tax by Segment for Full Year (2014 ndash 2016)
(100)
0
100
200
300
400
500
600
700
FY 2016 FY 2015 FY 2014
520
356
532
116 171
333
207
460
146 71
(2) (7)
$ m
illio
n
Property Development Hotel Operations Rental Properties Others
$914m $985m $1004m
FY 2016 FY 2015 FY 2014
Property Development 57 36 53
Hotel Operations 13 17 33
Rental Properties 23 47 15
Others 7 - (1)
Financial Highlights
20
EBITDA by Segment for Full Year (2014 ndash 2016)
FY 2016 FY 2015 FY 2014
Property Development 45 29 43
Hotel Operations 22 24 36
Rental Properties 27 46 21
Others 6 1 -
0
100
200
300
400
500
600
700
FY 2016 FY 2015 FY 2014
550
364
557
264 304
463
324
587
268
78 17 6
$ m
illio
n
Property Development Hotel Operations Rental Properties Others
$1216m $1272m $1294m
Financial HighlightsCapital Management
21
As at 311216 As at 311215
Gross borrowings $5752m $6503m
Cash and cash equivalents (include restricted deposits of $214m classified in other non-current assets)
$3887m $3565m
Net borrowings $1865m $2938m
Net gearing ratio without taking in fair value gains on investment properties 16 26
Interest cover ratio 125 x 130 x
Financial Highlights
Debt Expiry Profile Debt MaturityPrudent Capital Management
22
1535
995
467 360 202 -
250
320
295 428
260 640
0
500
1000
1500
2000
2017 2018 2019 2020 2021 2022onwards
Bond Bank Loan
Deb
t $ m
illio
n
Debt Currency Mix
31122015 31122016
Average Borrowing Cost 22 22
Secured Borrowings 18 16
31
2313
33
Within 1 year
1 to 2 years
2 to 3 years
More than 3years
53
11
13
11
75 SGD
GBP
USD
JPY
RMB
Others
SINGAPORE OVERVIEW
Source URA Q4 2016
Based on Revised PPI
24
Property Price Index ndash Residential (2012 ndash 2016)
Singapore Property Market
100
120
140
160
180
Q112
Q212
Q312
Q412
Q113
Q213
Q313
Q413
Q114
Q214
Q314
Q414
Q115
Q215
Q315
Q415
Q116
Q216
Q316
Q416
All Residential
Q4 161372
Q3 161379
0
2000
4000
6000
8000
10000
12000
14000
16000
18000
20000
22000
24000
2012 2013 2014 2015 2016
21478
15885
7693 7056 7877
22197
14948
7316 74407972
New Units Launched New Units Sold
Source URA Q4 2016
New Units Launched
(excl EC units)
New UnitsSold Directly By
Developers (excl EC units)
2012 21478 22197
2013 15885 14948
2014 7693 7316
2015 7056 7440
2016 7877 7972
25
Singapore Property MarketNo of New Private Residential Units Launched vs Units Sold (2012 ndash 2016)
0
4000
8000
12000
16000
20000
2012 2013 2014 2015 2016
Not Launched
Launched amp Unsold
Num
ber o
f Uni
ts
17467
Source URA Q4 2016
16587
Launched amp Unsold
Not Launched
Total
2012 5137 8807 13944
2013 6124 11343 17467
2014 5750 10837 16587
2015 5736 9763 15499
2016 5206 7035 12241
26
13944
Singapore Property MarketNo of Uncompleted Private Residential Units Available (2012 ndash 2016)
Launch timing unknown and may not materialise
15499
12241
Includes share of JV partners
Singapore Property DevelopmentResidential Units Sold
27
Sales Value$rsquo000
No ofUnits
TotalArea Sold
(sq ft)
FY 2016 $ 1245723 1017 974666
FY 2015 $ 691507 674 712558
Gramercy Park ndash Positive Response to Phase 1
28
Singapore Property Development
Project Location Tenure Equity Stake
Total Units
Total Units Sold
Sold
Total Saleable Area (sq ft)
Gramercy Park Grange Road Freehold 100 174 56 32 368743
As of 19 Feb 2017
Phase 2 Launch by 1H 2017
Good uptake with 56 units sold to date
All 87 units in North Tower released to date (64 sold)
87-unit South Tower (Phase 2) slated for launch by 1H 2017
Gramercy Park
One of 2016rsquos Bestselling Residential Projects
29
Singapore Property Development
Artistrsquos Impression
Artistrsquos ImpressionForest Woods
Project Location Tenure Equity Stake
Total Units
Total Units Sold
Sold
Total Saleable Area (sq ft)
Expected TOP
Forest Woods LorongLew Lian
99-year leasehold
50 519 392 76 431265 2021
As of 19 Feb 2017
Strong Uptake
Launched in Oct 2016 and 76 soldto-date
Achieved average selling price of about$1400 psf
All 1-bedroom + study 2-bedroomapartment types and penthouses havebeen sold
Remaining units comprise of 2-bedroom + study to 4-bedroom unittypes
Completed Residential Projects in 2016
30
Project Location Equity Stake
Total Units
Sold
TOPObtained
HAUSSERANGOONGARDEN
Serangoon Garden Close
70 97 Terraces
100 Mar 2016
The Inflora Flora Drive 33 396 100 Apr 2016
Gramercy Park Grange Road 100 174 32 May 2016
Lush Acres(Executive Condo)
Fernvale Close 100 380 100 Jun 2016
Jewel Buangkok Compassvale Bow 100 616 100 Aug 2016
Echelon Alexandra View 50 508 99 Sep 2016
Bartley Ridge Mount Vernon Road
30 868 100 Oct 2016
South Beach Residences Beach Road 501 190 -^ Dec 2016
Singapore Property Development
Echelon
As of 19 Feb 2017^ Not launched yet
Upcoming Residential Project Launch for 2H 2017 (Subject to market conditions)
31
Singapore Property Development
Artistrsquos Impression
Upmarket freehold condominium in District 9 designedby world-renowned architect SOM
Comprises 124 units in two iconic 36-storey towers withsix sky terraces
5-minutes walk from Orchard Road
All apartments enjoy private lift access and are fittedwith premium finishes and branded appliances
Artistrsquos ImpressionNew Futura
Project Location Tenure Equity Stake
Total Units
Gross Floor Area (sqm)
Expected TOP
New Futura Leonie Hill Road Freehold 100 124 23066 2017
Inventory of Launched Residential Projects ndashAs of 31 Dec 2016
32
Singapore Property Development
Leasing strategy implemented ^ Based on launched units
Note Above excludes inventory from The Residences at W Singapore ndash Sentosa Cove (203 units) unlaunched projects Nouvel 18 (156 units) and New Futura (124 units)
Sheet1
110
115
120
125
130
135
140
145
Q112
Q212
Q312
Q412
Q113
Q213
Q313
Q413
Q114
Q214
Q314
Q414
Q115
Q215
Q315
Q415
Q116
Q216
Q316
Q416
Office Retail
Source URA Q4 2016
33
Singapore Commercial MarketProperty Price Index ndash Commercial (2012ndash 2016)
Q4 161226
Q4 16 1347
Q3 161223
Q3 16 1355
Source JLL Research Q4 2016
$974
$1051$1204
$1038$914
$790 $837$926
$850$777
000
200
400
600
800
1000
1200
1400
2012 2013 2014 2015 2016
Marina Bay Raffles Place(Grade A)
Whole Island
34
Singapore Office MarketAverage Office Rental in CBD (2012 ndash 2016)
Office Space Demand amp Supply (2012 ndash 2016)Private amp Public Sector
78254 80095 81300 81365 83206
7091372205 72980 73647 73938
30000
35000
40000
45000
50000
55000
60000
65000
70000
75000
80000
85000
2012 2013 2014 2015 2016
Cumulative Supply Occupancy
Source URA Q4 2016
Singapore Office Market
CDLrsquos Office Properties Occupancy
959(National Average = 889)
35
Occupancy as of 31 Dec 2016
2017 2018 2019
33 28 25
Expiry of NLA
36
CDLrsquos Office Space ndash Lease Expiry Profile (2017 ndash 2019)
Rental Properties
Office Portfolio NLA ~2300000 sq ft
16Properties^
959Occupancy
As of 31 December 2016
Note Properties include -Republic Plaza Central Mall (Office Tower) City House Fuji Xerox Towers Manulife Centre Palais Renaissance Tanglin Shopping Centre The Arcade Katong Shopping Centre Kingrsquos Centre 7 amp 9 Tampines Grande 11 Tampines Concourse Sunshine Plaza Fortune Centre Golden Mile Complex Central Mall Conservation Unit
Based on contractual expiry dates Renewals will be negotiated nearer to expiry Tenants may renew their leases or increasereduce space or exit ^ Properties include strata-titled units owned and managed by CDL
60052
61333
6365864271
65079
57060
58599
59955 5963260192
52000
54000
56000
58000
60000
62000
64000
66000
2012 2013 2014 2015 2016
Cumulative Supply Occupancy
Retail Space Demand amp Supply (2012 ndash 2016)Private amp Public Sector
Source URA Q4 2016
With effect from Q1 2014 the coverage of retail space has been expanded to include non-shop retail uses and data are available from2011 onwards
Singapore Retail Market
CDLrsquos Retail Properties Occupancy
964(National Average = 925)
37
Occupancy as of 31 Dec 2016
38
CDLrsquos Retail Space ndash Lease Expiry Profile (2017 ndash 2019)
2017 2018 2019
2332 31
Expiry of NLA
Rental Properties
Retail Portfolio NLA ~840000 sq ft
19Properties^
964Occupancy
As of 31 December 2016
Based on contractual expiry dates Renewals will be negotiated nearer to expiry Tenants may renew their leases or increasereduce space or exit ^ Properties include strata-titled units owned and managed by CDL
Note Properties include ndashRepublic Plaza Central Mall (Office Tower) City Square Mall Palais Renaissance Tanglin Shopping Centre The Arcade Katong Shopping Centre Kingrsquos Centre Quayside Isle Grand Copthorne Waterfront (Waterfront Plaza) City Plaza Golden Mile Complex Central Mall Conservation Unit 7 amp 9 Tampines Grande City House Fortune Centre Manulife Centre Fuji Xerox Towers
39
Revenue by Sector for Full Year (2014 ndash 2016)
0
50
100
150
200
250
300
FY 2016 FY 2015 FY 2014
152187 176
110 113 111
7 8 8
74 75 65
24 23 25
S$ m
illio
n
Office
Retail
Industrial
REITHotel
Others ^
$367m $406m $385m
FY 2016 FY 2015 FY 2014
Office 41 46 46
Retail 30 28 29
Industrial 2 2 2
REITHotel 20 18 17
Others ^ 7 6 6
^ Including car park serviced apartments and residential
Rental Properties
40
EBITDA by Sector for Full Year (2014 ndash 2016)
050
100150200250300350400450500550600
FY 2016 FY 2015 FY 2014
185
446 ~
10175 64 91
5 4 453 58 53
6 15 19
S$ m
illio
n
Office
Retail
Industrial
REITHotel
Others ^
$324m $587m $268m
FY 2016 FY 2015 FY 2014
Office 57 76 38
Retail 23 11 34
Industrial 2 - 1
REITHotel 16 10 20
Others ^ 2 3 7
~ Includes gain on sale of Profit Participation Securities^ Including car park serviced apartments and residential
Rental Properties
South Beach
41
JW Marriott Hotel Singapore South Beach
JW Marriott Hotel Singapore South Beach
Rebranded hotel soft opened in mid-Dec2016
Business performance is within expectations
Ongoing works at NCO Club are expected tocomplete by Q3 2017 along with theremodelled Ballroom
South Beach Residences
190-unit luxury residence may be launchedin 2H 2017 subject to market conditions
Fully Completed in December 2016
Strong Performance for Office amp Retail
South Beach Tower (510000 sq ft office space) and retail space are fully leased
INTERNATIONAL OVERVIEW
Projects Launched To Date
43
Project City Equity Stake
Total Units
Total Units Sold
Booked
Sold Est TotalSaleable
Area (sq ft)
ExpectedCompletion
Australia
Ivy and Eve Brisbane 33 472 450 95 348678 1H 2018
China
Hong Leong City Center (Phase 1)
Suzhou 100^ 1374 1038 76 1378891 Completed
Hong Leong City Center (Phase 2 ndash T2)
Suzhou 100^ 430 174 40 439716 Q4 2017
Hongqiao Royal Lake Shanghai 100 85 34 40 385394 Completed
China ndash Good Progress on Launched Luxury Projects
International Property Development
47
Shanghai ndash Hongqiao Royal Lake (御湖)
Eling Residences Chongqing
Stable sales despite tightening measures in Shanghai
34 units soldbooked with sales value of RMB 668 millionachieved to date
Chongqing ndash Eling Residences (鹅岭峰)
Launched in Oct 2016
8 units soldbooked with sales value of RMB 85 million ndashachieved highest average values of close to RMB 40000 psm
City Equity Stake
Total Units
Total Units Sold Booked
Sold
Expected Completion
Shanghai 100 85 34 40 Completed
Hongqiao Royal Lake Shanghai
City Equity Stake
Total Units
Total Units Sold Booked
Sold
Expected Completion
Chongqing 100 126 8 6 Q2 2017
Artistrsquos Impression
As of 19 Feb 2017
Chongqing ndash Huang Huayuan (黄花园)
Scheduled launch of mixed-use development with over 600 residential units in 2019
48
Over 150000 apartment listings spanning over 20 citiesin China
Offers one-stop solution for apartment owners andrental customers
Investment provides immediate entry into this fast-growing new economy sectorminus Complement business portfoliominus Contributes to future long-term recurring income stream
Synergies to be shared with the Grouprsquos properties inShanghai Suzhou and Chongqing
Strategic Acquisition of 20 Equity Stake in mamahome for RMB 100 million
Distrii ndash Leading Provider of Co-working Space Acquisition completed in Jan 2017
Currently 15 locations (13 Shanghai + 1 Beijing + 1 Hangzhou) 3700 seating capacity in total 10 locations in operation with 5 more locations to open in 1H 2017
Targeting to double the locations in China by end 2017
Current capacity of over 2200 seats has reached above 80 occupancy
Committed to lease over 60000 sq ft in Republic Plaza Expected to open in 1H 2018
Distrii Suhe Center Shanghai
Strategic Acquisition of 24 Equity Stake in Distrii for RMB 72 million
50
Purchase of a 100 equity stake in Shanghai MeidaoInvestment Co which owns the commercial projectthat is in the final stages of construction
Total transaction value of RMB 900 million throughCDL China Limited
Strategically located in Huacao Minhang Districtwithin the Hongqiao CBD ndash a new area established in2009 that spans 86 sq km and is one of Shanghairsquosfastest growing business areas
Project comprises five 9-storey office towers and twolevels of basement carpark with about 351 lots
Project has been approved for division into strata-titleunits
China ndashAcquisition of Shanghai Commercial Project for RMB 900 million
Artistrsquos ImpressionMeidao Business Plaza Shanghai
Meidao Business Plaza ShanghaiTenure Equity
StakeEst Total GFA
(sqm)Expected
Completion
50-year lease 100 32300 2H 2017
International Rental Properties
Artistrsquos Impression
Japan ndash Invested in 2 Prime Residential Projects in Tokyo
Located within prestigious Aoyama area withinMinato ward in Tokyo
Project targeted at high-end domestic and foreignbuyers
Good uptake with over 50 of units sold since itslaunch in Oct 2016
Tokyo ndashPark Court Aoyama The Tower
International Property Development
51
Artistrsquos ImpressionPark Court Aoyama The Tower Tokyo
Tokyo ndash ShirokaneTenure Equity Stake Site Area (sqm)
Freehold 947 16815
Discussions with potential JV partner for project development ongoing
City Equity Stake Total Units
Total Units Sold Expected Completion
Freehold 20 163 Over 50 1H 2018
As of 19 Feb 2017
Teddington Riverside Teddington TW11
Full planning received works on basement car park inadvanced stage
Block A (57 units) will be launched in Q2 2017 followed byanother five blocks
International Property Development
52
UK ndash Upcoming Launches in Q2 2017
Artistrsquos Impression
Tenure EquityStake
Total Units Est TotalSaleable Area
(sq ft)
Expected Completion
Freehold 100 220 240000 2018 (Phased)
Teddington Riverside London
Project Tenure Equity Stake
Total Units
Est TotalSaleable
Area (sq ft)
Expected Completion
Belgravia Freehold 100 6 12375 Q2 2017
Knightsbridge Freehold 100 3 5193 Q2 2017
Belgravia3135 Chesham Street London SW1X 8NQ
Knightsbridge32 Hans Road London SW3 1RW
Chelsea 90-100 Sydney Street London SW3 6NJ
International Property Development
53
UK ndash Pipeline Projects
Tenure EquityStake
Total Units Est TotalSaleable Area
(sq ft)
Expected Completion
Freehold 100 9 16143 Q2 2018
Stag Brewery London
Tenure Equity Stake Est Total Saleable Area (sq ft)
Freehold 100 1000000 sq ft
Stag Brewery Mortlake London SW14
Advanced master plan at public consultation stage
Planning applications to be submitted by end Q2 2017
Proposed scheme to comprise two phases Parameter plan covering the entire site Detailed planning application for Phase 1Artistrsquos Impression
Artistrsquos Impression
Good progress on works
Expected completion in Q2 2018
International Property Development
54
Tenure Equity Stake Total Units Est GFA (sq ft)
Freehold 100 34 135000
28 Pavilion Road Knightsbridge London SW1
First luxury home care development to be built in Central Londonndash planning consent obtained
Project on target to commence demolition works in Q2 2017Artistrsquos ImpressionPavilion Road
UK ndash Pipeline Projects
Development House
Planning application to be submitted in Q2 2017
Existing 28000 sq ft remains fully leased and vacantpossession expected from Q2 2018
Development House Leonard Street in Shoreditch
Tenure Equity Stake Est Total Lettable Area (sq ft)
Freehold 100 90000 sq ft
Artistrsquos Impression
Artistrsquos Impression
UK ndashAcquisition of 16-acre Ransomes Wharf site for pound58 million
Located within Battersearsquos creative quarter on theRiver Thames
Est GDV of pound222 million
Contracts completed purchase to be phased overthe next 18 months
Profit before tax pound108m pound109m (09) pound124m (129)
PATMI pound78m pound65m 200
Trading Performance
The Baileyrsquos Hotel London The Baileyrsquos Hotel London
Increase in reported revenue attributed to higher land sales in New Zealand and a higher contribution from Millennium Mitsui Garden Hotel Tokyo coupled with favourable foreign exchange movements as a result of weak pound against major currencies
MampC Hotel Operations
58
Trading Performance
RevPAR in reported currency was up by 66 but in constant currency fell by 23 for FY 2016 as compared to the same period last year
FY 2016 Reported Currency Constant CurrencyNew York pound14564 uarr 19 darr 99Regional US pound5749 uarr175 uarr 40Total US pound8652 uarr 83 darr 42London pound10718 darr 14 darr 14Rest of Europe pound5261 uarr 20 darr 16Total Europe pound8024 darr 08 darr 20Singapore pound8021 uarr 05 darr 101Rest of Asia pound6063 uarr 116 uarr 19Total Asia pound6821 uarr 62 darr 40Australasia pound5840 uarr 348 uarr 209Total Group pound7671 uarr 66 darr 23 Millennium Seoul Hilton
Copthorne Hotel amp Resort Queenstown Lakefront
Sheet1
Developments ndash Progressing well
The lifestyle hotel and serviced apartment has 306 and 209keys respectively
The building permit approval for Seoul Yangdong developmentproject has been received on 25 January 2017 Additionalcertification processes are expected to complete by mid 2017
The main contract tender process is planned to complete bymid 2017 before construction work starts
Seoul South Korea
59
Comprises a 263-room hotel and a 250-unit residentialapartment block
The final planning approval has been received in December2016
Currently reviewing the project costing and specification whichis anticipated to take about 18 months to complete aftercommencement
Sunnyvale US
MampC Hotel Operations
MampC Hotel Operations
60
ONE UN New York
Refurbishment of guestrooms in the east tower was completed in early Sep 2016 and the towers were re-opened in time for the UN General Assembly
Assets Enhancement (Completed)
Grand Copthorne Waterfront Hotel Singapore
Work on the main lobby and FampB outlets at the main entrance level was substantially completed in May 2016
Refurbishment of function rooms on level 2 started in Sep 2016 and completed in Dec 2016
M Hotel Singapore
Soft refurbishment of all guestrooms from level 12 to level 28 is complete with the last phase completed in Dec 2016
ONE UN New York
Grand Copthorne Waterfront Hotel Singapore
M Hotel Singapore
MampC Hotel Operations
61
Grand Millennium Kuala Lumpur
Soft refurbishment of guestrooms from level 9 to level 19 was completed at the beginning of the 4th quarter of 2016
Remaining guestrooms at level 7 and level 8 is planned to be refurbished in the mid 2017
Assets Enhancement (On-going)
Grand Millennium Kuala Lumpur
Copthorne Hotel Auckland Harbour City
Copthorne Hotel Auckland Harbour City
Closed for a major refurbishment programme in Q3 2015 at an estimated cost of NZ$40 million
The hotel will be rebranded as M Social Hotel Auckland and is expected to re-open in 2nd quarter of 2017
Artistrsquos Impression
Artistrsquos Impression
31 Dec 31 Dec 31 Dec 31 DecHotel and Room Count 2016 2015 2016 2015By region New York 4 4 2238 2238 Regional US 15 15 4559 4463 London 8 8 2651 2651 Rest of Europe 19 18 3081 2867 Middle East 26 22 7805 6450 Singapore 7 6 3011 2716 Rest of Asia 27 26 10036 9430 Australasia 25 27 3641 3903 Total 131 126 37022 34718
PipelineBy region Middle East 17 16 5465 4663 Rest of Asia 4 3 1608 1674 Regional USA 1 1 263 263 Rest of Europe 1 - 153 - Total 23 20 7489 6600
Hotels Rooms
Hotel Room Count and Pipeline
MampC Hotel Operations
Mainly management contracts
62
Millennium Biltmore Hotel Los Angeles
Grand Millennium Auckland
Sheet1
CDL Hospitality Trusts
63
S$rsquo000 FY 2016 FY 2015 Change
Gross Revenue 180857 172410 49
Net Property Income (NPI) 137560 137003 04
Trading Performance
Hilton Cambridge City Centre ndash Executive Lounge
Artistrsquos Impression
Gross revenue and NPI increased mainly due to Inorganic contribution from Hilton Cambridge City Centre United Kingdom which
was acquired on 1 Oct 2015 Strong contribution from New Zealand hotels as a result of higher variable rental
income Incremental income boost from Japan hotels and Claymore Connect retail mall
This was partially offset by Continued weakness in Singapore and Maldives markets due to soft trading
conditions amid the global economic slowdown Lower contribution from Australia due to weaker AUD and lower variable income
contribution for FY 2016
Artistrsquos Impression
Disclaimer
This document may contain forward-looking statements that involve assumptions risks and uncertainties Actual future performance outcomes and results may differ materially from those expressed in forward-looking statements as a result of a number of risks uncertainties and assumptions Representative examples of these factors include (without limitation) general industry and economic conditions interest rate trends cost of capital and capital availability availability of real estate properties competition from other developments or companies shifts in customer demands customers and partners expected levels of occupancy rate property rental income charge out collections changes in operating expenses (including employee wages benefits and training costs) governmental and public policy changes and the continued availability of financing in the amounts and the terms necessary to support future business You are cautioned not to place undue reliance on these forward-looking statements which are based on the current view of management on future events Numbers in tables and charts may not add up due to rounding
Gramercy Park Singaporewwwcdlcomsg
Slide Number 1
Slide Number 2
Slide Number 3
Slide Number 4
Slide Number 5
Slide Number 6
Slide Number 7
Slide Number 8
Slide Number 9
Slide Number 10
Slide Number 11
Slide Number 12
Slide Number 13
Slide Number 14
Slide Number 15
Slide Number 16
Slide Number 17
Slide Number 18
Slide Number 19
Slide Number 20
Slide Number 21
Slide Number 22
Slide Number 23
Slide Number 24
Slide Number 25
Slide Number 26
Slide Number 27
Slide Number 28
Slide Number 29
Slide Number 30
Slide Number 31
Slide Number 32
Slide Number 33
Slide Number 34
Slide Number 35
Slide Number 36
Slide Number 37
Slide Number 38
Slide Number 39
Slide Number 40
Slide Number 41
Slide Number 42
Slide Number 43
Slide Number 44
Slide Number 45
Slide Number 46
Slide Number 47
Slide Number 48
Slide Number 49
Slide Number 50
Slide Number 51
Slide Number 52
Slide Number 53
Slide Number 54
Slide Number 55
Slide Number 56
Slide Number 57
Slide Number 58
Slide Number 59
Slide Number 60
Slide Number 61
Slide Number 62
Slide Number 63
Slide Number 64
Slide Number 65
Hotels
Rooms
31 Dec
31 Dec
31 Dec
31 Dec
Hotel and Room Count
2016
2015
2016
2015
By region
New York
4
4
2238
2238
Regional US
15
15
4559
4463
London
8
8
2651
2651
Rest of Europe
19
18
3081
2867
Middle East
26
22
7805
6450
Singapore
7
6
3011
2716
Rest of Asia
27
26
10036
9430
Australasia
25
27
3641
3903
Total
131
126
37022
34718
Pipeline
By region
Middle East
17
16
5465
4663
Rest of Asia
4
3
1608
1674
Regional USA
1
1
263
263
Rest of Europe
1
- 0
153
- 0
Total
23
20
7489
6600
FY 2016
Reported Currency
Constant Currency
New York
pound14564
uarr 19
darr 99
Regional US
pound5749
uarr175
uarr 40
Total US
pound8652
uarr 83
darr 42
London
pound10718
darr 14
darr 14
Rest of Europe
pound5261
uarr 20
darr 16
Total Europe
pound8024
darr 08
darr 20
Singapore
pound8021
uarr 05
darr 101
Rest of Asia
pound6063
uarr 116
uarr 19
Total Asia
pound6821
uarr 62
darr 40
Australasia
pound5840
uarr 348
uarr 209
Total Group
pound7671
uarr 66
darr 23
Project
Equity Stake
Total Units
Units Sold
Sold
Total Unsold Inventory
CDLrsquos Share of Unsold Inventory
St Regis Residences
33
173
161
93
12
4
The Oceanfront Sentosa Cove
50
264
263
99
1
05
One Shenton
100
341
327
96
14
14
Cliveden at Grange
100
110
44
40
66
66
UPRobertson Quay
100
70
57
81
13
13
Echelon
50
508
506
100
2
1
DNest
51
912
904
99
8
408
Jewel Buangkok
100
616
616
100
0
0
The Venue Shoppes
60
28
16
57
12
72
The Venue Residences
60
266
181
68
85
51
Coco Palms
51
944
865
92
79
4029
The Brownstone Executive Condo
70
638
519
81
119
833
The Criterion Executive Condo
70
505
179
35
326
2282
Gramercy Park
100
174
46
53^
41^
41^
(Phase 1 = 87-unit North Tower)
Forest Woods
50
519
382
74
137
685
Bartley Ridge
30
868
868
100
0
0
Commonwealth Towers
30
845
461
55
384
1152
TOTAL
7781
6395
1299
7373
Financial Highlights
16
Profit Before Tax by Segment for 4th Quarter (2014 ndash 2016)
(50)0
50100150200250300350400450
Q4 2016 Q4 2015 Q4 2014
243
116
251
(9)
9
139 101
349
41
(3) (3)
6
$ m
illio
n
Property Development Hotel Operations Rental Properties Others
$332m $471m $437m
Q4 2016 Q4 2015 Q4 2014
Property Development 73 25 57
Hotel Operations (3) 2 32
Rental Properties 31 74 10
Others (1) (1) 1
Financial Highlights
17
EBITDA by Segment for 4th Quarter (2014 ndash 2016)
Q4 2016 Q4 2015 Q4 2014
Property Development 60 21 50
Hotel Operations 9 8 35
Rental Properties 31 70 14
Others - 1 1
050
100150200250300350400
Q4 2016 Q4 2015 Q4 2014
251
116
262
38 42
180
130
382
74
(1)
3 7
$ m
illio
n
Property Development Hotel Operations Rental Properties Others
$418m $543m $523m
Financial Highlights
18
Revenue by Segment for Full Year (2014 ndash 2016)
0200400600800
100012001400160018002000
FY 2016 FY 2015 FY 2014
1745
1037
1581 1633 1698 1678
367 406 385 160 163 120
$ m
illio
n
Property Development Hotel Operations Rental Properties Others
$3905m $3304m $3764m
FY 2016 FY 2015 FY 2014
Property Development 45 32 42
Hotel Operations 42 51 45
Rental Properties 9 12 10
Others 4 5 3
Financial Highlights
19
Profit Before Tax by Segment for Full Year (2014 ndash 2016)
(100)
0
100
200
300
400
500
600
700
FY 2016 FY 2015 FY 2014
520
356
532
116 171
333
207
460
146 71
(2) (7)
$ m
illio
n
Property Development Hotel Operations Rental Properties Others
$914m $985m $1004m
FY 2016 FY 2015 FY 2014
Property Development 57 36 53
Hotel Operations 13 17 33
Rental Properties 23 47 15
Others 7 - (1)
Financial Highlights
20
EBITDA by Segment for Full Year (2014 ndash 2016)
FY 2016 FY 2015 FY 2014
Property Development 45 29 43
Hotel Operations 22 24 36
Rental Properties 27 46 21
Others 6 1 -
0
100
200
300
400
500
600
700
FY 2016 FY 2015 FY 2014
550
364
557
264 304
463
324
587
268
78 17 6
$ m
illio
n
Property Development Hotel Operations Rental Properties Others
$1216m $1272m $1294m
Financial HighlightsCapital Management
21
As at 311216 As at 311215
Gross borrowings $5752m $6503m
Cash and cash equivalents (include restricted deposits of $214m classified in other non-current assets)
$3887m $3565m
Net borrowings $1865m $2938m
Net gearing ratio without taking in fair value gains on investment properties 16 26
Interest cover ratio 125 x 130 x
Financial Highlights
Debt Expiry Profile Debt MaturityPrudent Capital Management
22
1535
995
467 360 202 -
250
320
295 428
260 640
0
500
1000
1500
2000
2017 2018 2019 2020 2021 2022onwards
Bond Bank Loan
Deb
t $ m
illio
n
Debt Currency Mix
31122015 31122016
Average Borrowing Cost 22 22
Secured Borrowings 18 16
31
2313
33
Within 1 year
1 to 2 years
2 to 3 years
More than 3years
53
11
13
11
75 SGD
GBP
USD
JPY
RMB
Others
SINGAPORE OVERVIEW
Source URA Q4 2016
Based on Revised PPI
24
Property Price Index ndash Residential (2012 ndash 2016)
Singapore Property Market
100
120
140
160
180
Q112
Q212
Q312
Q412
Q113
Q213
Q313
Q413
Q114
Q214
Q314
Q414
Q115
Q215
Q315
Q415
Q116
Q216
Q316
Q416
All Residential
Q4 161372
Q3 161379
0
2000
4000
6000
8000
10000
12000
14000
16000
18000
20000
22000
24000
2012 2013 2014 2015 2016
21478
15885
7693 7056 7877
22197
14948
7316 74407972
New Units Launched New Units Sold
Source URA Q4 2016
New Units Launched
(excl EC units)
New UnitsSold Directly By
Developers (excl EC units)
2012 21478 22197
2013 15885 14948
2014 7693 7316
2015 7056 7440
2016 7877 7972
25
Singapore Property MarketNo of New Private Residential Units Launched vs Units Sold (2012 ndash 2016)
0
4000
8000
12000
16000
20000
2012 2013 2014 2015 2016
Not Launched
Launched amp Unsold
Num
ber o
f Uni
ts
17467
Source URA Q4 2016
16587
Launched amp Unsold
Not Launched
Total
2012 5137 8807 13944
2013 6124 11343 17467
2014 5750 10837 16587
2015 5736 9763 15499
2016 5206 7035 12241
26
13944
Singapore Property MarketNo of Uncompleted Private Residential Units Available (2012 ndash 2016)
Launch timing unknown and may not materialise
15499
12241
Includes share of JV partners
Singapore Property DevelopmentResidential Units Sold
27
Sales Value$rsquo000
No ofUnits
TotalArea Sold
(sq ft)
FY 2016 $ 1245723 1017 974666
FY 2015 $ 691507 674 712558
Gramercy Park ndash Positive Response to Phase 1
28
Singapore Property Development
Project Location Tenure Equity Stake
Total Units
Total Units Sold
Sold
Total Saleable Area (sq ft)
Gramercy Park Grange Road Freehold 100 174 56 32 368743
As of 19 Feb 2017
Phase 2 Launch by 1H 2017
Good uptake with 56 units sold to date
All 87 units in North Tower released to date (64 sold)
87-unit South Tower (Phase 2) slated for launch by 1H 2017
Gramercy Park
One of 2016rsquos Bestselling Residential Projects
29
Singapore Property Development
Artistrsquos Impression
Artistrsquos ImpressionForest Woods
Project Location Tenure Equity Stake
Total Units
Total Units Sold
Sold
Total Saleable Area (sq ft)
Expected TOP
Forest Woods LorongLew Lian
99-year leasehold
50 519 392 76 431265 2021
As of 19 Feb 2017
Strong Uptake
Launched in Oct 2016 and 76 soldto-date
Achieved average selling price of about$1400 psf
All 1-bedroom + study 2-bedroomapartment types and penthouses havebeen sold
Remaining units comprise of 2-bedroom + study to 4-bedroom unittypes
Completed Residential Projects in 2016
30
Project Location Equity Stake
Total Units
Sold
TOPObtained
HAUSSERANGOONGARDEN
Serangoon Garden Close
70 97 Terraces
100 Mar 2016
The Inflora Flora Drive 33 396 100 Apr 2016
Gramercy Park Grange Road 100 174 32 May 2016
Lush Acres(Executive Condo)
Fernvale Close 100 380 100 Jun 2016
Jewel Buangkok Compassvale Bow 100 616 100 Aug 2016
Echelon Alexandra View 50 508 99 Sep 2016
Bartley Ridge Mount Vernon Road
30 868 100 Oct 2016
South Beach Residences Beach Road 501 190 -^ Dec 2016
Singapore Property Development
Echelon
As of 19 Feb 2017^ Not launched yet
Upcoming Residential Project Launch for 2H 2017 (Subject to market conditions)
31
Singapore Property Development
Artistrsquos Impression
Upmarket freehold condominium in District 9 designedby world-renowned architect SOM
Comprises 124 units in two iconic 36-storey towers withsix sky terraces
5-minutes walk from Orchard Road
All apartments enjoy private lift access and are fittedwith premium finishes and branded appliances
Artistrsquos ImpressionNew Futura
Project Location Tenure Equity Stake
Total Units
Gross Floor Area (sqm)
Expected TOP
New Futura Leonie Hill Road Freehold 100 124 23066 2017
Inventory of Launched Residential Projects ndashAs of 31 Dec 2016
32
Singapore Property Development
Leasing strategy implemented ^ Based on launched units
Note Above excludes inventory from The Residences at W Singapore ndash Sentosa Cove (203 units) unlaunched projects Nouvel 18 (156 units) and New Futura (124 units)
Sheet1
110
115
120
125
130
135
140
145
Q112
Q212
Q312
Q412
Q113
Q213
Q313
Q413
Q114
Q214
Q314
Q414
Q115
Q215
Q315
Q415
Q116
Q216
Q316
Q416
Office Retail
Source URA Q4 2016
33
Singapore Commercial MarketProperty Price Index ndash Commercial (2012ndash 2016)
Q4 161226
Q4 16 1347
Q3 161223
Q3 16 1355
Source JLL Research Q4 2016
$974
$1051$1204
$1038$914
$790 $837$926
$850$777
000
200
400
600
800
1000
1200
1400
2012 2013 2014 2015 2016
Marina Bay Raffles Place(Grade A)
Whole Island
34
Singapore Office MarketAverage Office Rental in CBD (2012 ndash 2016)
Office Space Demand amp Supply (2012 ndash 2016)Private amp Public Sector
78254 80095 81300 81365 83206
7091372205 72980 73647 73938
30000
35000
40000
45000
50000
55000
60000
65000
70000
75000
80000
85000
2012 2013 2014 2015 2016
Cumulative Supply Occupancy
Source URA Q4 2016
Singapore Office Market
CDLrsquos Office Properties Occupancy
959(National Average = 889)
35
Occupancy as of 31 Dec 2016
2017 2018 2019
33 28 25
Expiry of NLA
36
CDLrsquos Office Space ndash Lease Expiry Profile (2017 ndash 2019)
Rental Properties
Office Portfolio NLA ~2300000 sq ft
16Properties^
959Occupancy
As of 31 December 2016
Note Properties include -Republic Plaza Central Mall (Office Tower) City House Fuji Xerox Towers Manulife Centre Palais Renaissance Tanglin Shopping Centre The Arcade Katong Shopping Centre Kingrsquos Centre 7 amp 9 Tampines Grande 11 Tampines Concourse Sunshine Plaza Fortune Centre Golden Mile Complex Central Mall Conservation Unit
Based on contractual expiry dates Renewals will be negotiated nearer to expiry Tenants may renew their leases or increasereduce space or exit ^ Properties include strata-titled units owned and managed by CDL
60052
61333
6365864271
65079
57060
58599
59955 5963260192
52000
54000
56000
58000
60000
62000
64000
66000
2012 2013 2014 2015 2016
Cumulative Supply Occupancy
Retail Space Demand amp Supply (2012 ndash 2016)Private amp Public Sector
Source URA Q4 2016
With effect from Q1 2014 the coverage of retail space has been expanded to include non-shop retail uses and data are available from2011 onwards
Singapore Retail Market
CDLrsquos Retail Properties Occupancy
964(National Average = 925)
37
Occupancy as of 31 Dec 2016
38
CDLrsquos Retail Space ndash Lease Expiry Profile (2017 ndash 2019)
2017 2018 2019
2332 31
Expiry of NLA
Rental Properties
Retail Portfolio NLA ~840000 sq ft
19Properties^
964Occupancy
As of 31 December 2016
Based on contractual expiry dates Renewals will be negotiated nearer to expiry Tenants may renew their leases or increasereduce space or exit ^ Properties include strata-titled units owned and managed by CDL
Note Properties include ndashRepublic Plaza Central Mall (Office Tower) City Square Mall Palais Renaissance Tanglin Shopping Centre The Arcade Katong Shopping Centre Kingrsquos Centre Quayside Isle Grand Copthorne Waterfront (Waterfront Plaza) City Plaza Golden Mile Complex Central Mall Conservation Unit 7 amp 9 Tampines Grande City House Fortune Centre Manulife Centre Fuji Xerox Towers
39
Revenue by Sector for Full Year (2014 ndash 2016)
0
50
100
150
200
250
300
FY 2016 FY 2015 FY 2014
152187 176
110 113 111
7 8 8
74 75 65
24 23 25
S$ m
illio
n
Office
Retail
Industrial
REITHotel
Others ^
$367m $406m $385m
FY 2016 FY 2015 FY 2014
Office 41 46 46
Retail 30 28 29
Industrial 2 2 2
REITHotel 20 18 17
Others ^ 7 6 6
^ Including car park serviced apartments and residential
Rental Properties
40
EBITDA by Sector for Full Year (2014 ndash 2016)
050
100150200250300350400450500550600
FY 2016 FY 2015 FY 2014
185
446 ~
10175 64 91
5 4 453 58 53
6 15 19
S$ m
illio
n
Office
Retail
Industrial
REITHotel
Others ^
$324m $587m $268m
FY 2016 FY 2015 FY 2014
Office 57 76 38
Retail 23 11 34
Industrial 2 - 1
REITHotel 16 10 20
Others ^ 2 3 7
~ Includes gain on sale of Profit Participation Securities^ Including car park serviced apartments and residential
Rental Properties
South Beach
41
JW Marriott Hotel Singapore South Beach
JW Marriott Hotel Singapore South Beach
Rebranded hotel soft opened in mid-Dec2016
Business performance is within expectations
Ongoing works at NCO Club are expected tocomplete by Q3 2017 along with theremodelled Ballroom
South Beach Residences
190-unit luxury residence may be launchedin 2H 2017 subject to market conditions
Fully Completed in December 2016
Strong Performance for Office amp Retail
South Beach Tower (510000 sq ft office space) and retail space are fully leased
INTERNATIONAL OVERVIEW
Projects Launched To Date
43
Project City Equity Stake
Total Units
Total Units Sold
Booked
Sold Est TotalSaleable
Area (sq ft)
ExpectedCompletion
Australia
Ivy and Eve Brisbane 33 472 450 95 348678 1H 2018
China
Hong Leong City Center (Phase 1)
Suzhou 100^ 1374 1038 76 1378891 Completed
Hong Leong City Center (Phase 2 ndash T2)
Suzhou 100^ 430 174 40 439716 Q4 2017
Hongqiao Royal Lake Shanghai 100 85 34 40 385394 Completed
China ndash Good Progress on Launched Luxury Projects
International Property Development
47
Shanghai ndash Hongqiao Royal Lake (御湖)
Eling Residences Chongqing
Stable sales despite tightening measures in Shanghai
34 units soldbooked with sales value of RMB 668 millionachieved to date
Chongqing ndash Eling Residences (鹅岭峰)
Launched in Oct 2016
8 units soldbooked with sales value of RMB 85 million ndashachieved highest average values of close to RMB 40000 psm
City Equity Stake
Total Units
Total Units Sold Booked
Sold
Expected Completion
Shanghai 100 85 34 40 Completed
Hongqiao Royal Lake Shanghai
City Equity Stake
Total Units
Total Units Sold Booked
Sold
Expected Completion
Chongqing 100 126 8 6 Q2 2017
Artistrsquos Impression
As of 19 Feb 2017
Chongqing ndash Huang Huayuan (黄花园)
Scheduled launch of mixed-use development with over 600 residential units in 2019
48
Over 150000 apartment listings spanning over 20 citiesin China
Offers one-stop solution for apartment owners andrental customers
Investment provides immediate entry into this fast-growing new economy sectorminus Complement business portfoliominus Contributes to future long-term recurring income stream
Synergies to be shared with the Grouprsquos properties inShanghai Suzhou and Chongqing
Strategic Acquisition of 20 Equity Stake in mamahome for RMB 100 million
Distrii ndash Leading Provider of Co-working Space Acquisition completed in Jan 2017
Currently 15 locations (13 Shanghai + 1 Beijing + 1 Hangzhou) 3700 seating capacity in total 10 locations in operation with 5 more locations to open in 1H 2017
Targeting to double the locations in China by end 2017
Current capacity of over 2200 seats has reached above 80 occupancy
Committed to lease over 60000 sq ft in Republic Plaza Expected to open in 1H 2018
Distrii Suhe Center Shanghai
Strategic Acquisition of 24 Equity Stake in Distrii for RMB 72 million
50
Purchase of a 100 equity stake in Shanghai MeidaoInvestment Co which owns the commercial projectthat is in the final stages of construction
Total transaction value of RMB 900 million throughCDL China Limited
Strategically located in Huacao Minhang Districtwithin the Hongqiao CBD ndash a new area established in2009 that spans 86 sq km and is one of Shanghairsquosfastest growing business areas
Project comprises five 9-storey office towers and twolevels of basement carpark with about 351 lots
Project has been approved for division into strata-titleunits
China ndashAcquisition of Shanghai Commercial Project for RMB 900 million
Artistrsquos ImpressionMeidao Business Plaza Shanghai
Meidao Business Plaza ShanghaiTenure Equity
StakeEst Total GFA
(sqm)Expected
Completion
50-year lease 100 32300 2H 2017
International Rental Properties
Artistrsquos Impression
Japan ndash Invested in 2 Prime Residential Projects in Tokyo
Located within prestigious Aoyama area withinMinato ward in Tokyo
Project targeted at high-end domestic and foreignbuyers
Good uptake with over 50 of units sold since itslaunch in Oct 2016
Tokyo ndashPark Court Aoyama The Tower
International Property Development
51
Artistrsquos ImpressionPark Court Aoyama The Tower Tokyo
Tokyo ndash ShirokaneTenure Equity Stake Site Area (sqm)
Freehold 947 16815
Discussions with potential JV partner for project development ongoing
City Equity Stake Total Units
Total Units Sold Expected Completion
Freehold 20 163 Over 50 1H 2018
As of 19 Feb 2017
Teddington Riverside Teddington TW11
Full planning received works on basement car park inadvanced stage
Block A (57 units) will be launched in Q2 2017 followed byanother five blocks
International Property Development
52
UK ndash Upcoming Launches in Q2 2017
Artistrsquos Impression
Tenure EquityStake
Total Units Est TotalSaleable Area
(sq ft)
Expected Completion
Freehold 100 220 240000 2018 (Phased)
Teddington Riverside London
Project Tenure Equity Stake
Total Units
Est TotalSaleable
Area (sq ft)
Expected Completion
Belgravia Freehold 100 6 12375 Q2 2017
Knightsbridge Freehold 100 3 5193 Q2 2017
Belgravia3135 Chesham Street London SW1X 8NQ
Knightsbridge32 Hans Road London SW3 1RW
Chelsea 90-100 Sydney Street London SW3 6NJ
International Property Development
53
UK ndash Pipeline Projects
Tenure EquityStake
Total Units Est TotalSaleable Area
(sq ft)
Expected Completion
Freehold 100 9 16143 Q2 2018
Stag Brewery London
Tenure Equity Stake Est Total Saleable Area (sq ft)
Freehold 100 1000000 sq ft
Stag Brewery Mortlake London SW14
Advanced master plan at public consultation stage
Planning applications to be submitted by end Q2 2017
Proposed scheme to comprise two phases Parameter plan covering the entire site Detailed planning application for Phase 1Artistrsquos Impression
Artistrsquos Impression
Good progress on works
Expected completion in Q2 2018
International Property Development
54
Tenure Equity Stake Total Units Est GFA (sq ft)
Freehold 100 34 135000
28 Pavilion Road Knightsbridge London SW1
First luxury home care development to be built in Central Londonndash planning consent obtained
Project on target to commence demolition works in Q2 2017Artistrsquos ImpressionPavilion Road
UK ndash Pipeline Projects
Development House
Planning application to be submitted in Q2 2017
Existing 28000 sq ft remains fully leased and vacantpossession expected from Q2 2018
Development House Leonard Street in Shoreditch
Tenure Equity Stake Est Total Lettable Area (sq ft)
Freehold 100 90000 sq ft
Artistrsquos Impression
Artistrsquos Impression
UK ndashAcquisition of 16-acre Ransomes Wharf site for pound58 million
Located within Battersearsquos creative quarter on theRiver Thames
Est GDV of pound222 million
Contracts completed purchase to be phased overthe next 18 months
Profit before tax pound108m pound109m (09) pound124m (129)
PATMI pound78m pound65m 200
Trading Performance
The Baileyrsquos Hotel London The Baileyrsquos Hotel London
Increase in reported revenue attributed to higher land sales in New Zealand and a higher contribution from Millennium Mitsui Garden Hotel Tokyo coupled with favourable foreign exchange movements as a result of weak pound against major currencies
MampC Hotel Operations
58
Trading Performance
RevPAR in reported currency was up by 66 but in constant currency fell by 23 for FY 2016 as compared to the same period last year
FY 2016 Reported Currency Constant CurrencyNew York pound14564 uarr 19 darr 99Regional US pound5749 uarr175 uarr 40Total US pound8652 uarr 83 darr 42London pound10718 darr 14 darr 14Rest of Europe pound5261 uarr 20 darr 16Total Europe pound8024 darr 08 darr 20Singapore pound8021 uarr 05 darr 101Rest of Asia pound6063 uarr 116 uarr 19Total Asia pound6821 uarr 62 darr 40Australasia pound5840 uarr 348 uarr 209Total Group pound7671 uarr 66 darr 23 Millennium Seoul Hilton
Copthorne Hotel amp Resort Queenstown Lakefront
Sheet1
Developments ndash Progressing well
The lifestyle hotel and serviced apartment has 306 and 209keys respectively
The building permit approval for Seoul Yangdong developmentproject has been received on 25 January 2017 Additionalcertification processes are expected to complete by mid 2017
The main contract tender process is planned to complete bymid 2017 before construction work starts
Seoul South Korea
59
Comprises a 263-room hotel and a 250-unit residentialapartment block
The final planning approval has been received in December2016
Currently reviewing the project costing and specification whichis anticipated to take about 18 months to complete aftercommencement
Sunnyvale US
MampC Hotel Operations
MampC Hotel Operations
60
ONE UN New York
Refurbishment of guestrooms in the east tower was completed in early Sep 2016 and the towers were re-opened in time for the UN General Assembly
Assets Enhancement (Completed)
Grand Copthorne Waterfront Hotel Singapore
Work on the main lobby and FampB outlets at the main entrance level was substantially completed in May 2016
Refurbishment of function rooms on level 2 started in Sep 2016 and completed in Dec 2016
M Hotel Singapore
Soft refurbishment of all guestrooms from level 12 to level 28 is complete with the last phase completed in Dec 2016
ONE UN New York
Grand Copthorne Waterfront Hotel Singapore
M Hotel Singapore
MampC Hotel Operations
61
Grand Millennium Kuala Lumpur
Soft refurbishment of guestrooms from level 9 to level 19 was completed at the beginning of the 4th quarter of 2016
Remaining guestrooms at level 7 and level 8 is planned to be refurbished in the mid 2017
Assets Enhancement (On-going)
Grand Millennium Kuala Lumpur
Copthorne Hotel Auckland Harbour City
Copthorne Hotel Auckland Harbour City
Closed for a major refurbishment programme in Q3 2015 at an estimated cost of NZ$40 million
The hotel will be rebranded as M Social Hotel Auckland and is expected to re-open in 2nd quarter of 2017
Artistrsquos Impression
Artistrsquos Impression
31 Dec 31 Dec 31 Dec 31 DecHotel and Room Count 2016 2015 2016 2015By region New York 4 4 2238 2238 Regional US 15 15 4559 4463 London 8 8 2651 2651 Rest of Europe 19 18 3081 2867 Middle East 26 22 7805 6450 Singapore 7 6 3011 2716 Rest of Asia 27 26 10036 9430 Australasia 25 27 3641 3903 Total 131 126 37022 34718
PipelineBy region Middle East 17 16 5465 4663 Rest of Asia 4 3 1608 1674 Regional USA 1 1 263 263 Rest of Europe 1 - 153 - Total 23 20 7489 6600
Hotels Rooms
Hotel Room Count and Pipeline
MampC Hotel Operations
Mainly management contracts
62
Millennium Biltmore Hotel Los Angeles
Grand Millennium Auckland
Sheet1
CDL Hospitality Trusts
63
S$rsquo000 FY 2016 FY 2015 Change
Gross Revenue 180857 172410 49
Net Property Income (NPI) 137560 137003 04
Trading Performance
Hilton Cambridge City Centre ndash Executive Lounge
Artistrsquos Impression
Gross revenue and NPI increased mainly due to Inorganic contribution from Hilton Cambridge City Centre United Kingdom which
was acquired on 1 Oct 2015 Strong contribution from New Zealand hotels as a result of higher variable rental
income Incremental income boost from Japan hotels and Claymore Connect retail mall
This was partially offset by Continued weakness in Singapore and Maldives markets due to soft trading
conditions amid the global economic slowdown Lower contribution from Australia due to weaker AUD and lower variable income
contribution for FY 2016
Artistrsquos Impression
Disclaimer
This document may contain forward-looking statements that involve assumptions risks and uncertainties Actual future performance outcomes and results may differ materially from those expressed in forward-looking statements as a result of a number of risks uncertainties and assumptions Representative examples of these factors include (without limitation) general industry and economic conditions interest rate trends cost of capital and capital availability availability of real estate properties competition from other developments or companies shifts in customer demands customers and partners expected levels of occupancy rate property rental income charge out collections changes in operating expenses (including employee wages benefits and training costs) governmental and public policy changes and the continued availability of financing in the amounts and the terms necessary to support future business You are cautioned not to place undue reliance on these forward-looking statements which are based on the current view of management on future events Numbers in tables and charts may not add up due to rounding
Gramercy Park Singaporewwwcdlcomsg
Slide Number 1
Slide Number 2
Slide Number 3
Slide Number 4
Slide Number 5
Slide Number 6
Slide Number 7
Slide Number 8
Slide Number 9
Slide Number 10
Slide Number 11
Slide Number 12
Slide Number 13
Slide Number 14
Slide Number 15
Slide Number 16
Slide Number 17
Slide Number 18
Slide Number 19
Slide Number 20
Slide Number 21
Slide Number 22
Slide Number 23
Slide Number 24
Slide Number 25
Slide Number 26
Slide Number 27
Slide Number 28
Slide Number 29
Slide Number 30
Slide Number 31
Slide Number 32
Slide Number 33
Slide Number 34
Slide Number 35
Slide Number 36
Slide Number 37
Slide Number 38
Slide Number 39
Slide Number 40
Slide Number 41
Slide Number 42
Slide Number 43
Slide Number 44
Slide Number 45
Slide Number 46
Slide Number 47
Slide Number 48
Slide Number 49
Slide Number 50
Slide Number 51
Slide Number 52
Slide Number 53
Slide Number 54
Slide Number 55
Slide Number 56
Slide Number 57
Slide Number 58
Slide Number 59
Slide Number 60
Slide Number 61
Slide Number 62
Slide Number 63
Slide Number 64
Slide Number 65
Hotels
Rooms
31 Dec
31 Dec
31 Dec
31 Dec
Hotel and Room Count
2016
2015
2016
2015
By region
New York
4
4
2238
2238
Regional US
15
15
4559
4463
London
8
8
2651
2651
Rest of Europe
19
18
3081
2867
Middle East
26
22
7805
6450
Singapore
7
6
3011
2716
Rest of Asia
27
26
10036
9430
Australasia
25
27
3641
3903
Total
131
126
37022
34718
Pipeline
By region
Middle East
17
16
5465
4663
Rest of Asia
4
3
1608
1674
Regional USA
1
1
263
263
Rest of Europe
1
- 0
153
- 0
Total
23
20
7489
6600
FY 2016
Reported Currency
Constant Currency
New York
pound14564
uarr 19
darr 99
Regional US
pound5749
uarr175
uarr 40
Total US
pound8652
uarr 83
darr 42
London
pound10718
darr 14
darr 14
Rest of Europe
pound5261
uarr 20
darr 16
Total Europe
pound8024
darr 08
darr 20
Singapore
pound8021
uarr 05
darr 101
Rest of Asia
pound6063
uarr 116
uarr 19
Total Asia
pound6821
uarr 62
darr 40
Australasia
pound5840
uarr 348
uarr 209
Total Group
pound7671
uarr 66
darr 23
Project
Equity Stake
Total Units
Units Sold
Sold
Total Unsold Inventory
CDLrsquos Share of Unsold Inventory
St Regis Residences
33
173
161
93
12
4
The Oceanfront Sentosa Cove
50
264
263
99
1
05
One Shenton
100
341
327
96
14
14
Cliveden at Grange
100
110
44
40
66
66
UPRobertson Quay
100
70
57
81
13
13
Echelon
50
508
506
100
2
1
DNest
51
912
904
99
8
408
Jewel Buangkok
100
616
616
100
0
0
The Venue Shoppes
60
28
16
57
12
72
The Venue Residences
60
266
181
68
85
51
Coco Palms
51
944
865
92
79
4029
The Brownstone Executive Condo
70
638
519
81
119
833
The Criterion Executive Condo
70
505
179
35
326
2282
Gramercy Park
100
174
46
53^
41^
41^
(Phase 1 = 87-unit North Tower)
Forest Woods
50
519
382
74
137
685
Bartley Ridge
30
868
868
100
0
0
Commonwealth Towers
30
845
461
55
384
1152
TOTAL
7781
6395
1299
7373
Financial Highlights
17
EBITDA by Segment for 4th Quarter (2014 ndash 2016)
Q4 2016 Q4 2015 Q4 2014
Property Development 60 21 50
Hotel Operations 9 8 35
Rental Properties 31 70 14
Others - 1 1
050
100150200250300350400
Q4 2016 Q4 2015 Q4 2014
251
116
262
38 42
180
130
382
74
(1)
3 7
$ m
illio
n
Property Development Hotel Operations Rental Properties Others
$418m $543m $523m
Financial Highlights
18
Revenue by Segment for Full Year (2014 ndash 2016)
0200400600800
100012001400160018002000
FY 2016 FY 2015 FY 2014
1745
1037
1581 1633 1698 1678
367 406 385 160 163 120
$ m
illio
n
Property Development Hotel Operations Rental Properties Others
$3905m $3304m $3764m
FY 2016 FY 2015 FY 2014
Property Development 45 32 42
Hotel Operations 42 51 45
Rental Properties 9 12 10
Others 4 5 3
Financial Highlights
19
Profit Before Tax by Segment for Full Year (2014 ndash 2016)
(100)
0
100
200
300
400
500
600
700
FY 2016 FY 2015 FY 2014
520
356
532
116 171
333
207
460
146 71
(2) (7)
$ m
illio
n
Property Development Hotel Operations Rental Properties Others
$914m $985m $1004m
FY 2016 FY 2015 FY 2014
Property Development 57 36 53
Hotel Operations 13 17 33
Rental Properties 23 47 15
Others 7 - (1)
Financial Highlights
20
EBITDA by Segment for Full Year (2014 ndash 2016)
FY 2016 FY 2015 FY 2014
Property Development 45 29 43
Hotel Operations 22 24 36
Rental Properties 27 46 21
Others 6 1 -
0
100
200
300
400
500
600
700
FY 2016 FY 2015 FY 2014
550
364
557
264 304
463
324
587
268
78 17 6
$ m
illio
n
Property Development Hotel Operations Rental Properties Others
$1216m $1272m $1294m
Financial HighlightsCapital Management
21
As at 311216 As at 311215
Gross borrowings $5752m $6503m
Cash and cash equivalents (include restricted deposits of $214m classified in other non-current assets)
$3887m $3565m
Net borrowings $1865m $2938m
Net gearing ratio without taking in fair value gains on investment properties 16 26
Interest cover ratio 125 x 130 x
Financial Highlights
Debt Expiry Profile Debt MaturityPrudent Capital Management
22
1535
995
467 360 202 -
250
320
295 428
260 640
0
500
1000
1500
2000
2017 2018 2019 2020 2021 2022onwards
Bond Bank Loan
Deb
t $ m
illio
n
Debt Currency Mix
31122015 31122016
Average Borrowing Cost 22 22
Secured Borrowings 18 16
31
2313
33
Within 1 year
1 to 2 years
2 to 3 years
More than 3years
53
11
13
11
75 SGD
GBP
USD
JPY
RMB
Others
SINGAPORE OVERVIEW
Source URA Q4 2016
Based on Revised PPI
24
Property Price Index ndash Residential (2012 ndash 2016)
Singapore Property Market
100
120
140
160
180
Q112
Q212
Q312
Q412
Q113
Q213
Q313
Q413
Q114
Q214
Q314
Q414
Q115
Q215
Q315
Q415
Q116
Q216
Q316
Q416
All Residential
Q4 161372
Q3 161379
0
2000
4000
6000
8000
10000
12000
14000
16000
18000
20000
22000
24000
2012 2013 2014 2015 2016
21478
15885
7693 7056 7877
22197
14948
7316 74407972
New Units Launched New Units Sold
Source URA Q4 2016
New Units Launched
(excl EC units)
New UnitsSold Directly By
Developers (excl EC units)
2012 21478 22197
2013 15885 14948
2014 7693 7316
2015 7056 7440
2016 7877 7972
25
Singapore Property MarketNo of New Private Residential Units Launched vs Units Sold (2012 ndash 2016)
0
4000
8000
12000
16000
20000
2012 2013 2014 2015 2016
Not Launched
Launched amp Unsold
Num
ber o
f Uni
ts
17467
Source URA Q4 2016
16587
Launched amp Unsold
Not Launched
Total
2012 5137 8807 13944
2013 6124 11343 17467
2014 5750 10837 16587
2015 5736 9763 15499
2016 5206 7035 12241
26
13944
Singapore Property MarketNo of Uncompleted Private Residential Units Available (2012 ndash 2016)
Launch timing unknown and may not materialise
15499
12241
Includes share of JV partners
Singapore Property DevelopmentResidential Units Sold
27
Sales Value$rsquo000
No ofUnits
TotalArea Sold
(sq ft)
FY 2016 $ 1245723 1017 974666
FY 2015 $ 691507 674 712558
Gramercy Park ndash Positive Response to Phase 1
28
Singapore Property Development
Project Location Tenure Equity Stake
Total Units
Total Units Sold
Sold
Total Saleable Area (sq ft)
Gramercy Park Grange Road Freehold 100 174 56 32 368743
As of 19 Feb 2017
Phase 2 Launch by 1H 2017
Good uptake with 56 units sold to date
All 87 units in North Tower released to date (64 sold)
87-unit South Tower (Phase 2) slated for launch by 1H 2017
Gramercy Park
One of 2016rsquos Bestselling Residential Projects
29
Singapore Property Development
Artistrsquos Impression
Artistrsquos ImpressionForest Woods
Project Location Tenure Equity Stake
Total Units
Total Units Sold
Sold
Total Saleable Area (sq ft)
Expected TOP
Forest Woods LorongLew Lian
99-year leasehold
50 519 392 76 431265 2021
As of 19 Feb 2017
Strong Uptake
Launched in Oct 2016 and 76 soldto-date
Achieved average selling price of about$1400 psf
All 1-bedroom + study 2-bedroomapartment types and penthouses havebeen sold
Remaining units comprise of 2-bedroom + study to 4-bedroom unittypes
Completed Residential Projects in 2016
30
Project Location Equity Stake
Total Units
Sold
TOPObtained
HAUSSERANGOONGARDEN
Serangoon Garden Close
70 97 Terraces
100 Mar 2016
The Inflora Flora Drive 33 396 100 Apr 2016
Gramercy Park Grange Road 100 174 32 May 2016
Lush Acres(Executive Condo)
Fernvale Close 100 380 100 Jun 2016
Jewel Buangkok Compassvale Bow 100 616 100 Aug 2016
Echelon Alexandra View 50 508 99 Sep 2016
Bartley Ridge Mount Vernon Road
30 868 100 Oct 2016
South Beach Residences Beach Road 501 190 -^ Dec 2016
Singapore Property Development
Echelon
As of 19 Feb 2017^ Not launched yet
Upcoming Residential Project Launch for 2H 2017 (Subject to market conditions)
31
Singapore Property Development
Artistrsquos Impression
Upmarket freehold condominium in District 9 designedby world-renowned architect SOM
Comprises 124 units in two iconic 36-storey towers withsix sky terraces
5-minutes walk from Orchard Road
All apartments enjoy private lift access and are fittedwith premium finishes and branded appliances
Artistrsquos ImpressionNew Futura
Project Location Tenure Equity Stake
Total Units
Gross Floor Area (sqm)
Expected TOP
New Futura Leonie Hill Road Freehold 100 124 23066 2017
Inventory of Launched Residential Projects ndashAs of 31 Dec 2016
32
Singapore Property Development
Leasing strategy implemented ^ Based on launched units
Note Above excludes inventory from The Residences at W Singapore ndash Sentosa Cove (203 units) unlaunched projects Nouvel 18 (156 units) and New Futura (124 units)
Sheet1
110
115
120
125
130
135
140
145
Q112
Q212
Q312
Q412
Q113
Q213
Q313
Q413
Q114
Q214
Q314
Q414
Q115
Q215
Q315
Q415
Q116
Q216
Q316
Q416
Office Retail
Source URA Q4 2016
33
Singapore Commercial MarketProperty Price Index ndash Commercial (2012ndash 2016)
Q4 161226
Q4 16 1347
Q3 161223
Q3 16 1355
Source JLL Research Q4 2016
$974
$1051$1204
$1038$914
$790 $837$926
$850$777
000
200
400
600
800
1000
1200
1400
2012 2013 2014 2015 2016
Marina Bay Raffles Place(Grade A)
Whole Island
34
Singapore Office MarketAverage Office Rental in CBD (2012 ndash 2016)
Office Space Demand amp Supply (2012 ndash 2016)Private amp Public Sector
78254 80095 81300 81365 83206
7091372205 72980 73647 73938
30000
35000
40000
45000
50000
55000
60000
65000
70000
75000
80000
85000
2012 2013 2014 2015 2016
Cumulative Supply Occupancy
Source URA Q4 2016
Singapore Office Market
CDLrsquos Office Properties Occupancy
959(National Average = 889)
35
Occupancy as of 31 Dec 2016
2017 2018 2019
33 28 25
Expiry of NLA
36
CDLrsquos Office Space ndash Lease Expiry Profile (2017 ndash 2019)
Rental Properties
Office Portfolio NLA ~2300000 sq ft
16Properties^
959Occupancy
As of 31 December 2016
Note Properties include -Republic Plaza Central Mall (Office Tower) City House Fuji Xerox Towers Manulife Centre Palais Renaissance Tanglin Shopping Centre The Arcade Katong Shopping Centre Kingrsquos Centre 7 amp 9 Tampines Grande 11 Tampines Concourse Sunshine Plaza Fortune Centre Golden Mile Complex Central Mall Conservation Unit
Based on contractual expiry dates Renewals will be negotiated nearer to expiry Tenants may renew their leases or increasereduce space or exit ^ Properties include strata-titled units owned and managed by CDL
60052
61333
6365864271
65079
57060
58599
59955 5963260192
52000
54000
56000
58000
60000
62000
64000
66000
2012 2013 2014 2015 2016
Cumulative Supply Occupancy
Retail Space Demand amp Supply (2012 ndash 2016)Private amp Public Sector
Source URA Q4 2016
With effect from Q1 2014 the coverage of retail space has been expanded to include non-shop retail uses and data are available from2011 onwards
Singapore Retail Market
CDLrsquos Retail Properties Occupancy
964(National Average = 925)
37
Occupancy as of 31 Dec 2016
38
CDLrsquos Retail Space ndash Lease Expiry Profile (2017 ndash 2019)
2017 2018 2019
2332 31
Expiry of NLA
Rental Properties
Retail Portfolio NLA ~840000 sq ft
19Properties^
964Occupancy
As of 31 December 2016
Based on contractual expiry dates Renewals will be negotiated nearer to expiry Tenants may renew their leases or increasereduce space or exit ^ Properties include strata-titled units owned and managed by CDL
Note Properties include ndashRepublic Plaza Central Mall (Office Tower) City Square Mall Palais Renaissance Tanglin Shopping Centre The Arcade Katong Shopping Centre Kingrsquos Centre Quayside Isle Grand Copthorne Waterfront (Waterfront Plaza) City Plaza Golden Mile Complex Central Mall Conservation Unit 7 amp 9 Tampines Grande City House Fortune Centre Manulife Centre Fuji Xerox Towers
39
Revenue by Sector for Full Year (2014 ndash 2016)
0
50
100
150
200
250
300
FY 2016 FY 2015 FY 2014
152187 176
110 113 111
7 8 8
74 75 65
24 23 25
S$ m
illio
n
Office
Retail
Industrial
REITHotel
Others ^
$367m $406m $385m
FY 2016 FY 2015 FY 2014
Office 41 46 46
Retail 30 28 29
Industrial 2 2 2
REITHotel 20 18 17
Others ^ 7 6 6
^ Including car park serviced apartments and residential
Rental Properties
40
EBITDA by Sector for Full Year (2014 ndash 2016)
050
100150200250300350400450500550600
FY 2016 FY 2015 FY 2014
185
446 ~
10175 64 91
5 4 453 58 53
6 15 19
S$ m
illio
n
Office
Retail
Industrial
REITHotel
Others ^
$324m $587m $268m
FY 2016 FY 2015 FY 2014
Office 57 76 38
Retail 23 11 34
Industrial 2 - 1
REITHotel 16 10 20
Others ^ 2 3 7
~ Includes gain on sale of Profit Participation Securities^ Including car park serviced apartments and residential
Rental Properties
South Beach
41
JW Marriott Hotel Singapore South Beach
JW Marriott Hotel Singapore South Beach
Rebranded hotel soft opened in mid-Dec2016
Business performance is within expectations
Ongoing works at NCO Club are expected tocomplete by Q3 2017 along with theremodelled Ballroom
South Beach Residences
190-unit luxury residence may be launchedin 2H 2017 subject to market conditions
Fully Completed in December 2016
Strong Performance for Office amp Retail
South Beach Tower (510000 sq ft office space) and retail space are fully leased
INTERNATIONAL OVERVIEW
Projects Launched To Date
43
Project City Equity Stake
Total Units
Total Units Sold
Booked
Sold Est TotalSaleable
Area (sq ft)
ExpectedCompletion
Australia
Ivy and Eve Brisbane 33 472 450 95 348678 1H 2018
China
Hong Leong City Center (Phase 1)
Suzhou 100^ 1374 1038 76 1378891 Completed
Hong Leong City Center (Phase 2 ndash T2)
Suzhou 100^ 430 174 40 439716 Q4 2017
Hongqiao Royal Lake Shanghai 100 85 34 40 385394 Completed
China ndash Good Progress on Launched Luxury Projects
International Property Development
47
Shanghai ndash Hongqiao Royal Lake (御湖)
Eling Residences Chongqing
Stable sales despite tightening measures in Shanghai
34 units soldbooked with sales value of RMB 668 millionachieved to date
Chongqing ndash Eling Residences (鹅岭峰)
Launched in Oct 2016
8 units soldbooked with sales value of RMB 85 million ndashachieved highest average values of close to RMB 40000 psm
City Equity Stake
Total Units
Total Units Sold Booked
Sold
Expected Completion
Shanghai 100 85 34 40 Completed
Hongqiao Royal Lake Shanghai
City Equity Stake
Total Units
Total Units Sold Booked
Sold
Expected Completion
Chongqing 100 126 8 6 Q2 2017
Artistrsquos Impression
As of 19 Feb 2017
Chongqing ndash Huang Huayuan (黄花园)
Scheduled launch of mixed-use development with over 600 residential units in 2019
48
Over 150000 apartment listings spanning over 20 citiesin China
Offers one-stop solution for apartment owners andrental customers
Investment provides immediate entry into this fast-growing new economy sectorminus Complement business portfoliominus Contributes to future long-term recurring income stream
Synergies to be shared with the Grouprsquos properties inShanghai Suzhou and Chongqing
Strategic Acquisition of 20 Equity Stake in mamahome for RMB 100 million
Distrii ndash Leading Provider of Co-working Space Acquisition completed in Jan 2017
Currently 15 locations (13 Shanghai + 1 Beijing + 1 Hangzhou) 3700 seating capacity in total 10 locations in operation with 5 more locations to open in 1H 2017
Targeting to double the locations in China by end 2017
Current capacity of over 2200 seats has reached above 80 occupancy
Committed to lease over 60000 sq ft in Republic Plaza Expected to open in 1H 2018
Distrii Suhe Center Shanghai
Strategic Acquisition of 24 Equity Stake in Distrii for RMB 72 million
50
Purchase of a 100 equity stake in Shanghai MeidaoInvestment Co which owns the commercial projectthat is in the final stages of construction
Total transaction value of RMB 900 million throughCDL China Limited
Strategically located in Huacao Minhang Districtwithin the Hongqiao CBD ndash a new area established in2009 that spans 86 sq km and is one of Shanghairsquosfastest growing business areas
Project comprises five 9-storey office towers and twolevels of basement carpark with about 351 lots
Project has been approved for division into strata-titleunits
China ndashAcquisition of Shanghai Commercial Project for RMB 900 million
Artistrsquos ImpressionMeidao Business Plaza Shanghai
Meidao Business Plaza ShanghaiTenure Equity
StakeEst Total GFA
(sqm)Expected
Completion
50-year lease 100 32300 2H 2017
International Rental Properties
Artistrsquos Impression
Japan ndash Invested in 2 Prime Residential Projects in Tokyo
Located within prestigious Aoyama area withinMinato ward in Tokyo
Project targeted at high-end domestic and foreignbuyers
Good uptake with over 50 of units sold since itslaunch in Oct 2016
Tokyo ndashPark Court Aoyama The Tower
International Property Development
51
Artistrsquos ImpressionPark Court Aoyama The Tower Tokyo
Tokyo ndash ShirokaneTenure Equity Stake Site Area (sqm)
Freehold 947 16815
Discussions with potential JV partner for project development ongoing
City Equity Stake Total Units
Total Units Sold Expected Completion
Freehold 20 163 Over 50 1H 2018
As of 19 Feb 2017
Teddington Riverside Teddington TW11
Full planning received works on basement car park inadvanced stage
Block A (57 units) will be launched in Q2 2017 followed byanother five blocks
International Property Development
52
UK ndash Upcoming Launches in Q2 2017
Artistrsquos Impression
Tenure EquityStake
Total Units Est TotalSaleable Area
(sq ft)
Expected Completion
Freehold 100 220 240000 2018 (Phased)
Teddington Riverside London
Project Tenure Equity Stake
Total Units
Est TotalSaleable
Area (sq ft)
Expected Completion
Belgravia Freehold 100 6 12375 Q2 2017
Knightsbridge Freehold 100 3 5193 Q2 2017
Belgravia3135 Chesham Street London SW1X 8NQ
Knightsbridge32 Hans Road London SW3 1RW
Chelsea 90-100 Sydney Street London SW3 6NJ
International Property Development
53
UK ndash Pipeline Projects
Tenure EquityStake
Total Units Est TotalSaleable Area
(sq ft)
Expected Completion
Freehold 100 9 16143 Q2 2018
Stag Brewery London
Tenure Equity Stake Est Total Saleable Area (sq ft)
Freehold 100 1000000 sq ft
Stag Brewery Mortlake London SW14
Advanced master plan at public consultation stage
Planning applications to be submitted by end Q2 2017
Proposed scheme to comprise two phases Parameter plan covering the entire site Detailed planning application for Phase 1Artistrsquos Impression
Artistrsquos Impression
Good progress on works
Expected completion in Q2 2018
International Property Development
54
Tenure Equity Stake Total Units Est GFA (sq ft)
Freehold 100 34 135000
28 Pavilion Road Knightsbridge London SW1
First luxury home care development to be built in Central Londonndash planning consent obtained
Project on target to commence demolition works in Q2 2017Artistrsquos ImpressionPavilion Road
UK ndash Pipeline Projects
Development House
Planning application to be submitted in Q2 2017
Existing 28000 sq ft remains fully leased and vacantpossession expected from Q2 2018
Development House Leonard Street in Shoreditch
Tenure Equity Stake Est Total Lettable Area (sq ft)
Freehold 100 90000 sq ft
Artistrsquos Impression
Artistrsquos Impression
UK ndashAcquisition of 16-acre Ransomes Wharf site for pound58 million
Located within Battersearsquos creative quarter on theRiver Thames
Est GDV of pound222 million
Contracts completed purchase to be phased overthe next 18 months
Profit before tax pound108m pound109m (09) pound124m (129)
PATMI pound78m pound65m 200
Trading Performance
The Baileyrsquos Hotel London The Baileyrsquos Hotel London
Increase in reported revenue attributed to higher land sales in New Zealand and a higher contribution from Millennium Mitsui Garden Hotel Tokyo coupled with favourable foreign exchange movements as a result of weak pound against major currencies
MampC Hotel Operations
58
Trading Performance
RevPAR in reported currency was up by 66 but in constant currency fell by 23 for FY 2016 as compared to the same period last year
FY 2016 Reported Currency Constant CurrencyNew York pound14564 uarr 19 darr 99Regional US pound5749 uarr175 uarr 40Total US pound8652 uarr 83 darr 42London pound10718 darr 14 darr 14Rest of Europe pound5261 uarr 20 darr 16Total Europe pound8024 darr 08 darr 20Singapore pound8021 uarr 05 darr 101Rest of Asia pound6063 uarr 116 uarr 19Total Asia pound6821 uarr 62 darr 40Australasia pound5840 uarr 348 uarr 209Total Group pound7671 uarr 66 darr 23 Millennium Seoul Hilton
Copthorne Hotel amp Resort Queenstown Lakefront
Sheet1
Developments ndash Progressing well
The lifestyle hotel and serviced apartment has 306 and 209keys respectively
The building permit approval for Seoul Yangdong developmentproject has been received on 25 January 2017 Additionalcertification processes are expected to complete by mid 2017
The main contract tender process is planned to complete bymid 2017 before construction work starts
Seoul South Korea
59
Comprises a 263-room hotel and a 250-unit residentialapartment block
The final planning approval has been received in December2016
Currently reviewing the project costing and specification whichis anticipated to take about 18 months to complete aftercommencement
Sunnyvale US
MampC Hotel Operations
MampC Hotel Operations
60
ONE UN New York
Refurbishment of guestrooms in the east tower was completed in early Sep 2016 and the towers were re-opened in time for the UN General Assembly
Assets Enhancement (Completed)
Grand Copthorne Waterfront Hotel Singapore
Work on the main lobby and FampB outlets at the main entrance level was substantially completed in May 2016
Refurbishment of function rooms on level 2 started in Sep 2016 and completed in Dec 2016
M Hotel Singapore
Soft refurbishment of all guestrooms from level 12 to level 28 is complete with the last phase completed in Dec 2016
ONE UN New York
Grand Copthorne Waterfront Hotel Singapore
M Hotel Singapore
MampC Hotel Operations
61
Grand Millennium Kuala Lumpur
Soft refurbishment of guestrooms from level 9 to level 19 was completed at the beginning of the 4th quarter of 2016
Remaining guestrooms at level 7 and level 8 is planned to be refurbished in the mid 2017
Assets Enhancement (On-going)
Grand Millennium Kuala Lumpur
Copthorne Hotel Auckland Harbour City
Copthorne Hotel Auckland Harbour City
Closed for a major refurbishment programme in Q3 2015 at an estimated cost of NZ$40 million
The hotel will be rebranded as M Social Hotel Auckland and is expected to re-open in 2nd quarter of 2017
Artistrsquos Impression
Artistrsquos Impression
31 Dec 31 Dec 31 Dec 31 DecHotel and Room Count 2016 2015 2016 2015By region New York 4 4 2238 2238 Regional US 15 15 4559 4463 London 8 8 2651 2651 Rest of Europe 19 18 3081 2867 Middle East 26 22 7805 6450 Singapore 7 6 3011 2716 Rest of Asia 27 26 10036 9430 Australasia 25 27 3641 3903 Total 131 126 37022 34718
PipelineBy region Middle East 17 16 5465 4663 Rest of Asia 4 3 1608 1674 Regional USA 1 1 263 263 Rest of Europe 1 - 153 - Total 23 20 7489 6600
Hotels Rooms
Hotel Room Count and Pipeline
MampC Hotel Operations
Mainly management contracts
62
Millennium Biltmore Hotel Los Angeles
Grand Millennium Auckland
Sheet1
CDL Hospitality Trusts
63
S$rsquo000 FY 2016 FY 2015 Change
Gross Revenue 180857 172410 49
Net Property Income (NPI) 137560 137003 04
Trading Performance
Hilton Cambridge City Centre ndash Executive Lounge
Artistrsquos Impression
Gross revenue and NPI increased mainly due to Inorganic contribution from Hilton Cambridge City Centre United Kingdom which
was acquired on 1 Oct 2015 Strong contribution from New Zealand hotels as a result of higher variable rental
income Incremental income boost from Japan hotels and Claymore Connect retail mall
This was partially offset by Continued weakness in Singapore and Maldives markets due to soft trading
conditions amid the global economic slowdown Lower contribution from Australia due to weaker AUD and lower variable income
contribution for FY 2016
Artistrsquos Impression
Disclaimer
This document may contain forward-looking statements that involve assumptions risks and uncertainties Actual future performance outcomes and results may differ materially from those expressed in forward-looking statements as a result of a number of risks uncertainties and assumptions Representative examples of these factors include (without limitation) general industry and economic conditions interest rate trends cost of capital and capital availability availability of real estate properties competition from other developments or companies shifts in customer demands customers and partners expected levels of occupancy rate property rental income charge out collections changes in operating expenses (including employee wages benefits and training costs) governmental and public policy changes and the continued availability of financing in the amounts and the terms necessary to support future business You are cautioned not to place undue reliance on these forward-looking statements which are based on the current view of management on future events Numbers in tables and charts may not add up due to rounding
Gramercy Park Singaporewwwcdlcomsg
Slide Number 1
Slide Number 2
Slide Number 3
Slide Number 4
Slide Number 5
Slide Number 6
Slide Number 7
Slide Number 8
Slide Number 9
Slide Number 10
Slide Number 11
Slide Number 12
Slide Number 13
Slide Number 14
Slide Number 15
Slide Number 16
Slide Number 17
Slide Number 18
Slide Number 19
Slide Number 20
Slide Number 21
Slide Number 22
Slide Number 23
Slide Number 24
Slide Number 25
Slide Number 26
Slide Number 27
Slide Number 28
Slide Number 29
Slide Number 30
Slide Number 31
Slide Number 32
Slide Number 33
Slide Number 34
Slide Number 35
Slide Number 36
Slide Number 37
Slide Number 38
Slide Number 39
Slide Number 40
Slide Number 41
Slide Number 42
Slide Number 43
Slide Number 44
Slide Number 45
Slide Number 46
Slide Number 47
Slide Number 48
Slide Number 49
Slide Number 50
Slide Number 51
Slide Number 52
Slide Number 53
Slide Number 54
Slide Number 55
Slide Number 56
Slide Number 57
Slide Number 58
Slide Number 59
Slide Number 60
Slide Number 61
Slide Number 62
Slide Number 63
Slide Number 64
Slide Number 65
Hotels
Rooms
31 Dec
31 Dec
31 Dec
31 Dec
Hotel and Room Count
2016
2015
2016
2015
By region
New York
4
4
2238
2238
Regional US
15
15
4559
4463
London
8
8
2651
2651
Rest of Europe
19
18
3081
2867
Middle East
26
22
7805
6450
Singapore
7
6
3011
2716
Rest of Asia
27
26
10036
9430
Australasia
25
27
3641
3903
Total
131
126
37022
34718
Pipeline
By region
Middle East
17
16
5465
4663
Rest of Asia
4
3
1608
1674
Regional USA
1
1
263
263
Rest of Europe
1
- 0
153
- 0
Total
23
20
7489
6600
FY 2016
Reported Currency
Constant Currency
New York
pound14564
uarr 19
darr 99
Regional US
pound5749
uarr175
uarr 40
Total US
pound8652
uarr 83
darr 42
London
pound10718
darr 14
darr 14
Rest of Europe
pound5261
uarr 20
darr 16
Total Europe
pound8024
darr 08
darr 20
Singapore
pound8021
uarr 05
darr 101
Rest of Asia
pound6063
uarr 116
uarr 19
Total Asia
pound6821
uarr 62
darr 40
Australasia
pound5840
uarr 348
uarr 209
Total Group
pound7671
uarr 66
darr 23
Project
Equity Stake
Total Units
Units Sold
Sold
Total Unsold Inventory
CDLrsquos Share of Unsold Inventory
St Regis Residences
33
173
161
93
12
4
The Oceanfront Sentosa Cove
50
264
263
99
1
05
One Shenton
100
341
327
96
14
14
Cliveden at Grange
100
110
44
40
66
66
UPRobertson Quay
100
70
57
81
13
13
Echelon
50
508
506
100
2
1
DNest
51
912
904
99
8
408
Jewel Buangkok
100
616
616
100
0
0
The Venue Shoppes
60
28
16
57
12
72
The Venue Residences
60
266
181
68
85
51
Coco Palms
51
944
865
92
79
4029
The Brownstone Executive Condo
70
638
519
81
119
833
The Criterion Executive Condo
70
505
179
35
326
2282
Gramercy Park
100
174
46
53^
41^
41^
(Phase 1 = 87-unit North Tower)
Forest Woods
50
519
382
74
137
685
Bartley Ridge
30
868
868
100
0
0
Commonwealth Towers
30
845
461
55
384
1152
TOTAL
7781
6395
1299
7373
Financial Highlights
18
Revenue by Segment for Full Year (2014 ndash 2016)
0200400600800
100012001400160018002000
FY 2016 FY 2015 FY 2014
1745
1037
1581 1633 1698 1678
367 406 385 160 163 120
$ m
illio
n
Property Development Hotel Operations Rental Properties Others
$3905m $3304m $3764m
FY 2016 FY 2015 FY 2014
Property Development 45 32 42
Hotel Operations 42 51 45
Rental Properties 9 12 10
Others 4 5 3
Financial Highlights
19
Profit Before Tax by Segment for Full Year (2014 ndash 2016)
(100)
0
100
200
300
400
500
600
700
FY 2016 FY 2015 FY 2014
520
356
532
116 171
333
207
460
146 71
(2) (7)
$ m
illio
n
Property Development Hotel Operations Rental Properties Others
$914m $985m $1004m
FY 2016 FY 2015 FY 2014
Property Development 57 36 53
Hotel Operations 13 17 33
Rental Properties 23 47 15
Others 7 - (1)
Financial Highlights
20
EBITDA by Segment for Full Year (2014 ndash 2016)
FY 2016 FY 2015 FY 2014
Property Development 45 29 43
Hotel Operations 22 24 36
Rental Properties 27 46 21
Others 6 1 -
0
100
200
300
400
500
600
700
FY 2016 FY 2015 FY 2014
550
364
557
264 304
463
324
587
268
78 17 6
$ m
illio
n
Property Development Hotel Operations Rental Properties Others
$1216m $1272m $1294m
Financial HighlightsCapital Management
21
As at 311216 As at 311215
Gross borrowings $5752m $6503m
Cash and cash equivalents (include restricted deposits of $214m classified in other non-current assets)
$3887m $3565m
Net borrowings $1865m $2938m
Net gearing ratio without taking in fair value gains on investment properties 16 26
Interest cover ratio 125 x 130 x
Financial Highlights
Debt Expiry Profile Debt MaturityPrudent Capital Management
22
1535
995
467 360 202 -
250
320
295 428
260 640
0
500
1000
1500
2000
2017 2018 2019 2020 2021 2022onwards
Bond Bank Loan
Deb
t $ m
illio
n
Debt Currency Mix
31122015 31122016
Average Borrowing Cost 22 22
Secured Borrowings 18 16
31
2313
33
Within 1 year
1 to 2 years
2 to 3 years
More than 3years
53
11
13
11
75 SGD
GBP
USD
JPY
RMB
Others
SINGAPORE OVERVIEW
Source URA Q4 2016
Based on Revised PPI
24
Property Price Index ndash Residential (2012 ndash 2016)
Singapore Property Market
100
120
140
160
180
Q112
Q212
Q312
Q412
Q113
Q213
Q313
Q413
Q114
Q214
Q314
Q414
Q115
Q215
Q315
Q415
Q116
Q216
Q316
Q416
All Residential
Q4 161372
Q3 161379
0
2000
4000
6000
8000
10000
12000
14000
16000
18000
20000
22000
24000
2012 2013 2014 2015 2016
21478
15885
7693 7056 7877
22197
14948
7316 74407972
New Units Launched New Units Sold
Source URA Q4 2016
New Units Launched
(excl EC units)
New UnitsSold Directly By
Developers (excl EC units)
2012 21478 22197
2013 15885 14948
2014 7693 7316
2015 7056 7440
2016 7877 7972
25
Singapore Property MarketNo of New Private Residential Units Launched vs Units Sold (2012 ndash 2016)
0
4000
8000
12000
16000
20000
2012 2013 2014 2015 2016
Not Launched
Launched amp Unsold
Num
ber o
f Uni
ts
17467
Source URA Q4 2016
16587
Launched amp Unsold
Not Launched
Total
2012 5137 8807 13944
2013 6124 11343 17467
2014 5750 10837 16587
2015 5736 9763 15499
2016 5206 7035 12241
26
13944
Singapore Property MarketNo of Uncompleted Private Residential Units Available (2012 ndash 2016)
Launch timing unknown and may not materialise
15499
12241
Includes share of JV partners
Singapore Property DevelopmentResidential Units Sold
27
Sales Value$rsquo000
No ofUnits
TotalArea Sold
(sq ft)
FY 2016 $ 1245723 1017 974666
FY 2015 $ 691507 674 712558
Gramercy Park ndash Positive Response to Phase 1
28
Singapore Property Development
Project Location Tenure Equity Stake
Total Units
Total Units Sold
Sold
Total Saleable Area (sq ft)
Gramercy Park Grange Road Freehold 100 174 56 32 368743
As of 19 Feb 2017
Phase 2 Launch by 1H 2017
Good uptake with 56 units sold to date
All 87 units in North Tower released to date (64 sold)
87-unit South Tower (Phase 2) slated for launch by 1H 2017
Gramercy Park
One of 2016rsquos Bestselling Residential Projects
29
Singapore Property Development
Artistrsquos Impression
Artistrsquos ImpressionForest Woods
Project Location Tenure Equity Stake
Total Units
Total Units Sold
Sold
Total Saleable Area (sq ft)
Expected TOP
Forest Woods LorongLew Lian
99-year leasehold
50 519 392 76 431265 2021
As of 19 Feb 2017
Strong Uptake
Launched in Oct 2016 and 76 soldto-date
Achieved average selling price of about$1400 psf
All 1-bedroom + study 2-bedroomapartment types and penthouses havebeen sold
Remaining units comprise of 2-bedroom + study to 4-bedroom unittypes
Completed Residential Projects in 2016
30
Project Location Equity Stake
Total Units
Sold
TOPObtained
HAUSSERANGOONGARDEN
Serangoon Garden Close
70 97 Terraces
100 Mar 2016
The Inflora Flora Drive 33 396 100 Apr 2016
Gramercy Park Grange Road 100 174 32 May 2016
Lush Acres(Executive Condo)
Fernvale Close 100 380 100 Jun 2016
Jewel Buangkok Compassvale Bow 100 616 100 Aug 2016
Echelon Alexandra View 50 508 99 Sep 2016
Bartley Ridge Mount Vernon Road
30 868 100 Oct 2016
South Beach Residences Beach Road 501 190 -^ Dec 2016
Singapore Property Development
Echelon
As of 19 Feb 2017^ Not launched yet
Upcoming Residential Project Launch for 2H 2017 (Subject to market conditions)
31
Singapore Property Development
Artistrsquos Impression
Upmarket freehold condominium in District 9 designedby world-renowned architect SOM
Comprises 124 units in two iconic 36-storey towers withsix sky terraces
5-minutes walk from Orchard Road
All apartments enjoy private lift access and are fittedwith premium finishes and branded appliances
Artistrsquos ImpressionNew Futura
Project Location Tenure Equity Stake
Total Units
Gross Floor Area (sqm)
Expected TOP
New Futura Leonie Hill Road Freehold 100 124 23066 2017
Inventory of Launched Residential Projects ndashAs of 31 Dec 2016
32
Singapore Property Development
Leasing strategy implemented ^ Based on launched units
Note Above excludes inventory from The Residences at W Singapore ndash Sentosa Cove (203 units) unlaunched projects Nouvel 18 (156 units) and New Futura (124 units)
Sheet1
110
115
120
125
130
135
140
145
Q112
Q212
Q312
Q412
Q113
Q213
Q313
Q413
Q114
Q214
Q314
Q414
Q115
Q215
Q315
Q415
Q116
Q216
Q316
Q416
Office Retail
Source URA Q4 2016
33
Singapore Commercial MarketProperty Price Index ndash Commercial (2012ndash 2016)
Q4 161226
Q4 16 1347
Q3 161223
Q3 16 1355
Source JLL Research Q4 2016
$974
$1051$1204
$1038$914
$790 $837$926
$850$777
000
200
400
600
800
1000
1200
1400
2012 2013 2014 2015 2016
Marina Bay Raffles Place(Grade A)
Whole Island
34
Singapore Office MarketAverage Office Rental in CBD (2012 ndash 2016)
Office Space Demand amp Supply (2012 ndash 2016)Private amp Public Sector
78254 80095 81300 81365 83206
7091372205 72980 73647 73938
30000
35000
40000
45000
50000
55000
60000
65000
70000
75000
80000
85000
2012 2013 2014 2015 2016
Cumulative Supply Occupancy
Source URA Q4 2016
Singapore Office Market
CDLrsquos Office Properties Occupancy
959(National Average = 889)
35
Occupancy as of 31 Dec 2016
2017 2018 2019
33 28 25
Expiry of NLA
36
CDLrsquos Office Space ndash Lease Expiry Profile (2017 ndash 2019)
Rental Properties
Office Portfolio NLA ~2300000 sq ft
16Properties^
959Occupancy
As of 31 December 2016
Note Properties include -Republic Plaza Central Mall (Office Tower) City House Fuji Xerox Towers Manulife Centre Palais Renaissance Tanglin Shopping Centre The Arcade Katong Shopping Centre Kingrsquos Centre 7 amp 9 Tampines Grande 11 Tampines Concourse Sunshine Plaza Fortune Centre Golden Mile Complex Central Mall Conservation Unit
Based on contractual expiry dates Renewals will be negotiated nearer to expiry Tenants may renew their leases or increasereduce space or exit ^ Properties include strata-titled units owned and managed by CDL
60052
61333
6365864271
65079
57060
58599
59955 5963260192
52000
54000
56000
58000
60000
62000
64000
66000
2012 2013 2014 2015 2016
Cumulative Supply Occupancy
Retail Space Demand amp Supply (2012 ndash 2016)Private amp Public Sector
Source URA Q4 2016
With effect from Q1 2014 the coverage of retail space has been expanded to include non-shop retail uses and data are available from2011 onwards
Singapore Retail Market
CDLrsquos Retail Properties Occupancy
964(National Average = 925)
37
Occupancy as of 31 Dec 2016
38
CDLrsquos Retail Space ndash Lease Expiry Profile (2017 ndash 2019)
2017 2018 2019
2332 31
Expiry of NLA
Rental Properties
Retail Portfolio NLA ~840000 sq ft
19Properties^
964Occupancy
As of 31 December 2016
Based on contractual expiry dates Renewals will be negotiated nearer to expiry Tenants may renew their leases or increasereduce space or exit ^ Properties include strata-titled units owned and managed by CDL
Note Properties include ndashRepublic Plaza Central Mall (Office Tower) City Square Mall Palais Renaissance Tanglin Shopping Centre The Arcade Katong Shopping Centre Kingrsquos Centre Quayside Isle Grand Copthorne Waterfront (Waterfront Plaza) City Plaza Golden Mile Complex Central Mall Conservation Unit 7 amp 9 Tampines Grande City House Fortune Centre Manulife Centre Fuji Xerox Towers
39
Revenue by Sector for Full Year (2014 ndash 2016)
0
50
100
150
200
250
300
FY 2016 FY 2015 FY 2014
152187 176
110 113 111
7 8 8
74 75 65
24 23 25
S$ m
illio
n
Office
Retail
Industrial
REITHotel
Others ^
$367m $406m $385m
FY 2016 FY 2015 FY 2014
Office 41 46 46
Retail 30 28 29
Industrial 2 2 2
REITHotel 20 18 17
Others ^ 7 6 6
^ Including car park serviced apartments and residential
Rental Properties
40
EBITDA by Sector for Full Year (2014 ndash 2016)
050
100150200250300350400450500550600
FY 2016 FY 2015 FY 2014
185
446 ~
10175 64 91
5 4 453 58 53
6 15 19
S$ m
illio
n
Office
Retail
Industrial
REITHotel
Others ^
$324m $587m $268m
FY 2016 FY 2015 FY 2014
Office 57 76 38
Retail 23 11 34
Industrial 2 - 1
REITHotel 16 10 20
Others ^ 2 3 7
~ Includes gain on sale of Profit Participation Securities^ Including car park serviced apartments and residential
Rental Properties
South Beach
41
JW Marriott Hotel Singapore South Beach
JW Marriott Hotel Singapore South Beach
Rebranded hotel soft opened in mid-Dec2016
Business performance is within expectations
Ongoing works at NCO Club are expected tocomplete by Q3 2017 along with theremodelled Ballroom
South Beach Residences
190-unit luxury residence may be launchedin 2H 2017 subject to market conditions
Fully Completed in December 2016
Strong Performance for Office amp Retail
South Beach Tower (510000 sq ft office space) and retail space are fully leased
INTERNATIONAL OVERVIEW
Projects Launched To Date
43
Project City Equity Stake
Total Units
Total Units Sold
Booked
Sold Est TotalSaleable
Area (sq ft)
ExpectedCompletion
Australia
Ivy and Eve Brisbane 33 472 450 95 348678 1H 2018
China
Hong Leong City Center (Phase 1)
Suzhou 100^ 1374 1038 76 1378891 Completed
Hong Leong City Center (Phase 2 ndash T2)
Suzhou 100^ 430 174 40 439716 Q4 2017
Hongqiao Royal Lake Shanghai 100 85 34 40 385394 Completed
China ndash Good Progress on Launched Luxury Projects
International Property Development
47
Shanghai ndash Hongqiao Royal Lake (御湖)
Eling Residences Chongqing
Stable sales despite tightening measures in Shanghai
34 units soldbooked with sales value of RMB 668 millionachieved to date
Chongqing ndash Eling Residences (鹅岭峰)
Launched in Oct 2016
8 units soldbooked with sales value of RMB 85 million ndashachieved highest average values of close to RMB 40000 psm
City Equity Stake
Total Units
Total Units Sold Booked
Sold
Expected Completion
Shanghai 100 85 34 40 Completed
Hongqiao Royal Lake Shanghai
City Equity Stake
Total Units
Total Units Sold Booked
Sold
Expected Completion
Chongqing 100 126 8 6 Q2 2017
Artistrsquos Impression
As of 19 Feb 2017
Chongqing ndash Huang Huayuan (黄花园)
Scheduled launch of mixed-use development with over 600 residential units in 2019
48
Over 150000 apartment listings spanning over 20 citiesin China
Offers one-stop solution for apartment owners andrental customers
Investment provides immediate entry into this fast-growing new economy sectorminus Complement business portfoliominus Contributes to future long-term recurring income stream
Synergies to be shared with the Grouprsquos properties inShanghai Suzhou and Chongqing
Strategic Acquisition of 20 Equity Stake in mamahome for RMB 100 million
Distrii ndash Leading Provider of Co-working Space Acquisition completed in Jan 2017
Currently 15 locations (13 Shanghai + 1 Beijing + 1 Hangzhou) 3700 seating capacity in total 10 locations in operation with 5 more locations to open in 1H 2017
Targeting to double the locations in China by end 2017
Current capacity of over 2200 seats has reached above 80 occupancy
Committed to lease over 60000 sq ft in Republic Plaza Expected to open in 1H 2018
Distrii Suhe Center Shanghai
Strategic Acquisition of 24 Equity Stake in Distrii for RMB 72 million
50
Purchase of a 100 equity stake in Shanghai MeidaoInvestment Co which owns the commercial projectthat is in the final stages of construction
Total transaction value of RMB 900 million throughCDL China Limited
Strategically located in Huacao Minhang Districtwithin the Hongqiao CBD ndash a new area established in2009 that spans 86 sq km and is one of Shanghairsquosfastest growing business areas
Project comprises five 9-storey office towers and twolevels of basement carpark with about 351 lots
Project has been approved for division into strata-titleunits
China ndashAcquisition of Shanghai Commercial Project for RMB 900 million
Artistrsquos ImpressionMeidao Business Plaza Shanghai
Meidao Business Plaza ShanghaiTenure Equity
StakeEst Total GFA
(sqm)Expected
Completion
50-year lease 100 32300 2H 2017
International Rental Properties
Artistrsquos Impression
Japan ndash Invested in 2 Prime Residential Projects in Tokyo
Located within prestigious Aoyama area withinMinato ward in Tokyo
Project targeted at high-end domestic and foreignbuyers
Good uptake with over 50 of units sold since itslaunch in Oct 2016
Tokyo ndashPark Court Aoyama The Tower
International Property Development
51
Artistrsquos ImpressionPark Court Aoyama The Tower Tokyo
Tokyo ndash ShirokaneTenure Equity Stake Site Area (sqm)
Freehold 947 16815
Discussions with potential JV partner for project development ongoing
City Equity Stake Total Units
Total Units Sold Expected Completion
Freehold 20 163 Over 50 1H 2018
As of 19 Feb 2017
Teddington Riverside Teddington TW11
Full planning received works on basement car park inadvanced stage
Block A (57 units) will be launched in Q2 2017 followed byanother five blocks
International Property Development
52
UK ndash Upcoming Launches in Q2 2017
Artistrsquos Impression
Tenure EquityStake
Total Units Est TotalSaleable Area
(sq ft)
Expected Completion
Freehold 100 220 240000 2018 (Phased)
Teddington Riverside London
Project Tenure Equity Stake
Total Units
Est TotalSaleable
Area (sq ft)
Expected Completion
Belgravia Freehold 100 6 12375 Q2 2017
Knightsbridge Freehold 100 3 5193 Q2 2017
Belgravia3135 Chesham Street London SW1X 8NQ
Knightsbridge32 Hans Road London SW3 1RW
Chelsea 90-100 Sydney Street London SW3 6NJ
International Property Development
53
UK ndash Pipeline Projects
Tenure EquityStake
Total Units Est TotalSaleable Area
(sq ft)
Expected Completion
Freehold 100 9 16143 Q2 2018
Stag Brewery London
Tenure Equity Stake Est Total Saleable Area (sq ft)
Freehold 100 1000000 sq ft
Stag Brewery Mortlake London SW14
Advanced master plan at public consultation stage
Planning applications to be submitted by end Q2 2017
Proposed scheme to comprise two phases Parameter plan covering the entire site Detailed planning application for Phase 1Artistrsquos Impression
Artistrsquos Impression
Good progress on works
Expected completion in Q2 2018
International Property Development
54
Tenure Equity Stake Total Units Est GFA (sq ft)
Freehold 100 34 135000
28 Pavilion Road Knightsbridge London SW1
First luxury home care development to be built in Central Londonndash planning consent obtained
Project on target to commence demolition works in Q2 2017Artistrsquos ImpressionPavilion Road
UK ndash Pipeline Projects
Development House
Planning application to be submitted in Q2 2017
Existing 28000 sq ft remains fully leased and vacantpossession expected from Q2 2018
Development House Leonard Street in Shoreditch
Tenure Equity Stake Est Total Lettable Area (sq ft)
Freehold 100 90000 sq ft
Artistrsquos Impression
Artistrsquos Impression
UK ndashAcquisition of 16-acre Ransomes Wharf site for pound58 million
Located within Battersearsquos creative quarter on theRiver Thames
Est GDV of pound222 million
Contracts completed purchase to be phased overthe next 18 months
Profit before tax pound108m pound109m (09) pound124m (129)
PATMI pound78m pound65m 200
Trading Performance
The Baileyrsquos Hotel London The Baileyrsquos Hotel London
Increase in reported revenue attributed to higher land sales in New Zealand and a higher contribution from Millennium Mitsui Garden Hotel Tokyo coupled with favourable foreign exchange movements as a result of weak pound against major currencies
MampC Hotel Operations
58
Trading Performance
RevPAR in reported currency was up by 66 but in constant currency fell by 23 for FY 2016 as compared to the same period last year
FY 2016 Reported Currency Constant CurrencyNew York pound14564 uarr 19 darr 99Regional US pound5749 uarr175 uarr 40Total US pound8652 uarr 83 darr 42London pound10718 darr 14 darr 14Rest of Europe pound5261 uarr 20 darr 16Total Europe pound8024 darr 08 darr 20Singapore pound8021 uarr 05 darr 101Rest of Asia pound6063 uarr 116 uarr 19Total Asia pound6821 uarr 62 darr 40Australasia pound5840 uarr 348 uarr 209Total Group pound7671 uarr 66 darr 23 Millennium Seoul Hilton
Copthorne Hotel amp Resort Queenstown Lakefront
Sheet1
Developments ndash Progressing well
The lifestyle hotel and serviced apartment has 306 and 209keys respectively
The building permit approval for Seoul Yangdong developmentproject has been received on 25 January 2017 Additionalcertification processes are expected to complete by mid 2017
The main contract tender process is planned to complete bymid 2017 before construction work starts
Seoul South Korea
59
Comprises a 263-room hotel and a 250-unit residentialapartment block
The final planning approval has been received in December2016
Currently reviewing the project costing and specification whichis anticipated to take about 18 months to complete aftercommencement
Sunnyvale US
MampC Hotel Operations
MampC Hotel Operations
60
ONE UN New York
Refurbishment of guestrooms in the east tower was completed in early Sep 2016 and the towers were re-opened in time for the UN General Assembly
Assets Enhancement (Completed)
Grand Copthorne Waterfront Hotel Singapore
Work on the main lobby and FampB outlets at the main entrance level was substantially completed in May 2016
Refurbishment of function rooms on level 2 started in Sep 2016 and completed in Dec 2016
M Hotel Singapore
Soft refurbishment of all guestrooms from level 12 to level 28 is complete with the last phase completed in Dec 2016
ONE UN New York
Grand Copthorne Waterfront Hotel Singapore
M Hotel Singapore
MampC Hotel Operations
61
Grand Millennium Kuala Lumpur
Soft refurbishment of guestrooms from level 9 to level 19 was completed at the beginning of the 4th quarter of 2016
Remaining guestrooms at level 7 and level 8 is planned to be refurbished in the mid 2017
Assets Enhancement (On-going)
Grand Millennium Kuala Lumpur
Copthorne Hotel Auckland Harbour City
Copthorne Hotel Auckland Harbour City
Closed for a major refurbishment programme in Q3 2015 at an estimated cost of NZ$40 million
The hotel will be rebranded as M Social Hotel Auckland and is expected to re-open in 2nd quarter of 2017
Artistrsquos Impression
Artistrsquos Impression
31 Dec 31 Dec 31 Dec 31 DecHotel and Room Count 2016 2015 2016 2015By region New York 4 4 2238 2238 Regional US 15 15 4559 4463 London 8 8 2651 2651 Rest of Europe 19 18 3081 2867 Middle East 26 22 7805 6450 Singapore 7 6 3011 2716 Rest of Asia 27 26 10036 9430 Australasia 25 27 3641 3903 Total 131 126 37022 34718
PipelineBy region Middle East 17 16 5465 4663 Rest of Asia 4 3 1608 1674 Regional USA 1 1 263 263 Rest of Europe 1 - 153 - Total 23 20 7489 6600
Hotels Rooms
Hotel Room Count and Pipeline
MampC Hotel Operations
Mainly management contracts
62
Millennium Biltmore Hotel Los Angeles
Grand Millennium Auckland
Sheet1
CDL Hospitality Trusts
63
S$rsquo000 FY 2016 FY 2015 Change
Gross Revenue 180857 172410 49
Net Property Income (NPI) 137560 137003 04
Trading Performance
Hilton Cambridge City Centre ndash Executive Lounge
Artistrsquos Impression
Gross revenue and NPI increased mainly due to Inorganic contribution from Hilton Cambridge City Centre United Kingdom which
was acquired on 1 Oct 2015 Strong contribution from New Zealand hotels as a result of higher variable rental
income Incremental income boost from Japan hotels and Claymore Connect retail mall
This was partially offset by Continued weakness in Singapore and Maldives markets due to soft trading
conditions amid the global economic slowdown Lower contribution from Australia due to weaker AUD and lower variable income
contribution for FY 2016
Artistrsquos Impression
Disclaimer
This document may contain forward-looking statements that involve assumptions risks and uncertainties Actual future performance outcomes and results may differ materially from those expressed in forward-looking statements as a result of a number of risks uncertainties and assumptions Representative examples of these factors include (without limitation) general industry and economic conditions interest rate trends cost of capital and capital availability availability of real estate properties competition from other developments or companies shifts in customer demands customers and partners expected levels of occupancy rate property rental income charge out collections changes in operating expenses (including employee wages benefits and training costs) governmental and public policy changes and the continued availability of financing in the amounts and the terms necessary to support future business You are cautioned not to place undue reliance on these forward-looking statements which are based on the current view of management on future events Numbers in tables and charts may not add up due to rounding
Gramercy Park Singaporewwwcdlcomsg
Slide Number 1
Slide Number 2
Slide Number 3
Slide Number 4
Slide Number 5
Slide Number 6
Slide Number 7
Slide Number 8
Slide Number 9
Slide Number 10
Slide Number 11
Slide Number 12
Slide Number 13
Slide Number 14
Slide Number 15
Slide Number 16
Slide Number 17
Slide Number 18
Slide Number 19
Slide Number 20
Slide Number 21
Slide Number 22
Slide Number 23
Slide Number 24
Slide Number 25
Slide Number 26
Slide Number 27
Slide Number 28
Slide Number 29
Slide Number 30
Slide Number 31
Slide Number 32
Slide Number 33
Slide Number 34
Slide Number 35
Slide Number 36
Slide Number 37
Slide Number 38
Slide Number 39
Slide Number 40
Slide Number 41
Slide Number 42
Slide Number 43
Slide Number 44
Slide Number 45
Slide Number 46
Slide Number 47
Slide Number 48
Slide Number 49
Slide Number 50
Slide Number 51
Slide Number 52
Slide Number 53
Slide Number 54
Slide Number 55
Slide Number 56
Slide Number 57
Slide Number 58
Slide Number 59
Slide Number 60
Slide Number 61
Slide Number 62
Slide Number 63
Slide Number 64
Slide Number 65
Hotels
Rooms
31 Dec
31 Dec
31 Dec
31 Dec
Hotel and Room Count
2016
2015
2016
2015
By region
New York
4
4
2238
2238
Regional US
15
15
4559
4463
London
8
8
2651
2651
Rest of Europe
19
18
3081
2867
Middle East
26
22
7805
6450
Singapore
7
6
3011
2716
Rest of Asia
27
26
10036
9430
Australasia
25
27
3641
3903
Total
131
126
37022
34718
Pipeline
By region
Middle East
17
16
5465
4663
Rest of Asia
4
3
1608
1674
Regional USA
1
1
263
263
Rest of Europe
1
- 0
153
- 0
Total
23
20
7489
6600
FY 2016
Reported Currency
Constant Currency
New York
pound14564
uarr 19
darr 99
Regional US
pound5749
uarr175
uarr 40
Total US
pound8652
uarr 83
darr 42
London
pound10718
darr 14
darr 14
Rest of Europe
pound5261
uarr 20
darr 16
Total Europe
pound8024
darr 08
darr 20
Singapore
pound8021
uarr 05
darr 101
Rest of Asia
pound6063
uarr 116
uarr 19
Total Asia
pound6821
uarr 62
darr 40
Australasia
pound5840
uarr 348
uarr 209
Total Group
pound7671
uarr 66
darr 23
Project
Equity Stake
Total Units
Units Sold
Sold
Total Unsold Inventory
CDLrsquos Share of Unsold Inventory
St Regis Residences
33
173
161
93
12
4
The Oceanfront Sentosa Cove
50
264
263
99
1
05
One Shenton
100
341
327
96
14
14
Cliveden at Grange
100
110
44
40
66
66
UPRobertson Quay
100
70
57
81
13
13
Echelon
50
508
506
100
2
1
DNest
51
912
904
99
8
408
Jewel Buangkok
100
616
616
100
0
0
The Venue Shoppes
60
28
16
57
12
72
The Venue Residences
60
266
181
68
85
51
Coco Palms
51
944
865
92
79
4029
The Brownstone Executive Condo
70
638
519
81
119
833
The Criterion Executive Condo
70
505
179
35
326
2282
Gramercy Park
100
174
46
53^
41^
41^
(Phase 1 = 87-unit North Tower)
Forest Woods
50
519
382
74
137
685
Bartley Ridge
30
868
868
100
0
0
Commonwealth Towers
30
845
461
55
384
1152
TOTAL
7781
6395
1299
7373
Financial Highlights
19
Profit Before Tax by Segment for Full Year (2014 ndash 2016)
(100)
0
100
200
300
400
500
600
700
FY 2016 FY 2015 FY 2014
520
356
532
116 171
333
207
460
146 71
(2) (7)
$ m
illio
n
Property Development Hotel Operations Rental Properties Others
$914m $985m $1004m
FY 2016 FY 2015 FY 2014
Property Development 57 36 53
Hotel Operations 13 17 33
Rental Properties 23 47 15
Others 7 - (1)
Financial Highlights
20
EBITDA by Segment for Full Year (2014 ndash 2016)
FY 2016 FY 2015 FY 2014
Property Development 45 29 43
Hotel Operations 22 24 36
Rental Properties 27 46 21
Others 6 1 -
0
100
200
300
400
500
600
700
FY 2016 FY 2015 FY 2014
550
364
557
264 304
463
324
587
268
78 17 6
$ m
illio
n
Property Development Hotel Operations Rental Properties Others
$1216m $1272m $1294m
Financial HighlightsCapital Management
21
As at 311216 As at 311215
Gross borrowings $5752m $6503m
Cash and cash equivalents (include restricted deposits of $214m classified in other non-current assets)
$3887m $3565m
Net borrowings $1865m $2938m
Net gearing ratio without taking in fair value gains on investment properties 16 26
Interest cover ratio 125 x 130 x
Financial Highlights
Debt Expiry Profile Debt MaturityPrudent Capital Management
22
1535
995
467 360 202 -
250
320
295 428
260 640
0
500
1000
1500
2000
2017 2018 2019 2020 2021 2022onwards
Bond Bank Loan
Deb
t $ m
illio
n
Debt Currency Mix
31122015 31122016
Average Borrowing Cost 22 22
Secured Borrowings 18 16
31
2313
33
Within 1 year
1 to 2 years
2 to 3 years
More than 3years
53
11
13
11
75 SGD
GBP
USD
JPY
RMB
Others
SINGAPORE OVERVIEW
Source URA Q4 2016
Based on Revised PPI
24
Property Price Index ndash Residential (2012 ndash 2016)
Singapore Property Market
100
120
140
160
180
Q112
Q212
Q312
Q412
Q113
Q213
Q313
Q413
Q114
Q214
Q314
Q414
Q115
Q215
Q315
Q415
Q116
Q216
Q316
Q416
All Residential
Q4 161372
Q3 161379
0
2000
4000
6000
8000
10000
12000
14000
16000
18000
20000
22000
24000
2012 2013 2014 2015 2016
21478
15885
7693 7056 7877
22197
14948
7316 74407972
New Units Launched New Units Sold
Source URA Q4 2016
New Units Launched
(excl EC units)
New UnitsSold Directly By
Developers (excl EC units)
2012 21478 22197
2013 15885 14948
2014 7693 7316
2015 7056 7440
2016 7877 7972
25
Singapore Property MarketNo of New Private Residential Units Launched vs Units Sold (2012 ndash 2016)
0
4000
8000
12000
16000
20000
2012 2013 2014 2015 2016
Not Launched
Launched amp Unsold
Num
ber o
f Uni
ts
17467
Source URA Q4 2016
16587
Launched amp Unsold
Not Launched
Total
2012 5137 8807 13944
2013 6124 11343 17467
2014 5750 10837 16587
2015 5736 9763 15499
2016 5206 7035 12241
26
13944
Singapore Property MarketNo of Uncompleted Private Residential Units Available (2012 ndash 2016)
Launch timing unknown and may not materialise
15499
12241
Includes share of JV partners
Singapore Property DevelopmentResidential Units Sold
27
Sales Value$rsquo000
No ofUnits
TotalArea Sold
(sq ft)
FY 2016 $ 1245723 1017 974666
FY 2015 $ 691507 674 712558
Gramercy Park ndash Positive Response to Phase 1
28
Singapore Property Development
Project Location Tenure Equity Stake
Total Units
Total Units Sold
Sold
Total Saleable Area (sq ft)
Gramercy Park Grange Road Freehold 100 174 56 32 368743
As of 19 Feb 2017
Phase 2 Launch by 1H 2017
Good uptake with 56 units sold to date
All 87 units in North Tower released to date (64 sold)
87-unit South Tower (Phase 2) slated for launch by 1H 2017
Gramercy Park
One of 2016rsquos Bestselling Residential Projects
29
Singapore Property Development
Artistrsquos Impression
Artistrsquos ImpressionForest Woods
Project Location Tenure Equity Stake
Total Units
Total Units Sold
Sold
Total Saleable Area (sq ft)
Expected TOP
Forest Woods LorongLew Lian
99-year leasehold
50 519 392 76 431265 2021
As of 19 Feb 2017
Strong Uptake
Launched in Oct 2016 and 76 soldto-date
Achieved average selling price of about$1400 psf
All 1-bedroom + study 2-bedroomapartment types and penthouses havebeen sold
Remaining units comprise of 2-bedroom + study to 4-bedroom unittypes
Completed Residential Projects in 2016
30
Project Location Equity Stake
Total Units
Sold
TOPObtained
HAUSSERANGOONGARDEN
Serangoon Garden Close
70 97 Terraces
100 Mar 2016
The Inflora Flora Drive 33 396 100 Apr 2016
Gramercy Park Grange Road 100 174 32 May 2016
Lush Acres(Executive Condo)
Fernvale Close 100 380 100 Jun 2016
Jewel Buangkok Compassvale Bow 100 616 100 Aug 2016
Echelon Alexandra View 50 508 99 Sep 2016
Bartley Ridge Mount Vernon Road
30 868 100 Oct 2016
South Beach Residences Beach Road 501 190 -^ Dec 2016
Singapore Property Development
Echelon
As of 19 Feb 2017^ Not launched yet
Upcoming Residential Project Launch for 2H 2017 (Subject to market conditions)
31
Singapore Property Development
Artistrsquos Impression
Upmarket freehold condominium in District 9 designedby world-renowned architect SOM
Comprises 124 units in two iconic 36-storey towers withsix sky terraces
5-minutes walk from Orchard Road
All apartments enjoy private lift access and are fittedwith premium finishes and branded appliances
Artistrsquos ImpressionNew Futura
Project Location Tenure Equity Stake
Total Units
Gross Floor Area (sqm)
Expected TOP
New Futura Leonie Hill Road Freehold 100 124 23066 2017
Inventory of Launched Residential Projects ndashAs of 31 Dec 2016
32
Singapore Property Development
Leasing strategy implemented ^ Based on launched units
Note Above excludes inventory from The Residences at W Singapore ndash Sentosa Cove (203 units) unlaunched projects Nouvel 18 (156 units) and New Futura (124 units)
Sheet1
110
115
120
125
130
135
140
145
Q112
Q212
Q312
Q412
Q113
Q213
Q313
Q413
Q114
Q214
Q314
Q414
Q115
Q215
Q315
Q415
Q116
Q216
Q316
Q416
Office Retail
Source URA Q4 2016
33
Singapore Commercial MarketProperty Price Index ndash Commercial (2012ndash 2016)
Q4 161226
Q4 16 1347
Q3 161223
Q3 16 1355
Source JLL Research Q4 2016
$974
$1051$1204
$1038$914
$790 $837$926
$850$777
000
200
400
600
800
1000
1200
1400
2012 2013 2014 2015 2016
Marina Bay Raffles Place(Grade A)
Whole Island
34
Singapore Office MarketAverage Office Rental in CBD (2012 ndash 2016)
Office Space Demand amp Supply (2012 ndash 2016)Private amp Public Sector
78254 80095 81300 81365 83206
7091372205 72980 73647 73938
30000
35000
40000
45000
50000
55000
60000
65000
70000
75000
80000
85000
2012 2013 2014 2015 2016
Cumulative Supply Occupancy
Source URA Q4 2016
Singapore Office Market
CDLrsquos Office Properties Occupancy
959(National Average = 889)
35
Occupancy as of 31 Dec 2016
2017 2018 2019
33 28 25
Expiry of NLA
36
CDLrsquos Office Space ndash Lease Expiry Profile (2017 ndash 2019)
Rental Properties
Office Portfolio NLA ~2300000 sq ft
16Properties^
959Occupancy
As of 31 December 2016
Note Properties include -Republic Plaza Central Mall (Office Tower) City House Fuji Xerox Towers Manulife Centre Palais Renaissance Tanglin Shopping Centre The Arcade Katong Shopping Centre Kingrsquos Centre 7 amp 9 Tampines Grande 11 Tampines Concourse Sunshine Plaza Fortune Centre Golden Mile Complex Central Mall Conservation Unit
Based on contractual expiry dates Renewals will be negotiated nearer to expiry Tenants may renew their leases or increasereduce space or exit ^ Properties include strata-titled units owned and managed by CDL
60052
61333
6365864271
65079
57060
58599
59955 5963260192
52000
54000
56000
58000
60000
62000
64000
66000
2012 2013 2014 2015 2016
Cumulative Supply Occupancy
Retail Space Demand amp Supply (2012 ndash 2016)Private amp Public Sector
Source URA Q4 2016
With effect from Q1 2014 the coverage of retail space has been expanded to include non-shop retail uses and data are available from2011 onwards
Singapore Retail Market
CDLrsquos Retail Properties Occupancy
964(National Average = 925)
37
Occupancy as of 31 Dec 2016
38
CDLrsquos Retail Space ndash Lease Expiry Profile (2017 ndash 2019)
2017 2018 2019
2332 31
Expiry of NLA
Rental Properties
Retail Portfolio NLA ~840000 sq ft
19Properties^
964Occupancy
As of 31 December 2016
Based on contractual expiry dates Renewals will be negotiated nearer to expiry Tenants may renew their leases or increasereduce space or exit ^ Properties include strata-titled units owned and managed by CDL
Note Properties include ndashRepublic Plaza Central Mall (Office Tower) City Square Mall Palais Renaissance Tanglin Shopping Centre The Arcade Katong Shopping Centre Kingrsquos Centre Quayside Isle Grand Copthorne Waterfront (Waterfront Plaza) City Plaza Golden Mile Complex Central Mall Conservation Unit 7 amp 9 Tampines Grande City House Fortune Centre Manulife Centre Fuji Xerox Towers
39
Revenue by Sector for Full Year (2014 ndash 2016)
0
50
100
150
200
250
300
FY 2016 FY 2015 FY 2014
152187 176
110 113 111
7 8 8
74 75 65
24 23 25
S$ m
illio
n
Office
Retail
Industrial
REITHotel
Others ^
$367m $406m $385m
FY 2016 FY 2015 FY 2014
Office 41 46 46
Retail 30 28 29
Industrial 2 2 2
REITHotel 20 18 17
Others ^ 7 6 6
^ Including car park serviced apartments and residential
Rental Properties
40
EBITDA by Sector for Full Year (2014 ndash 2016)
050
100150200250300350400450500550600
FY 2016 FY 2015 FY 2014
185
446 ~
10175 64 91
5 4 453 58 53
6 15 19
S$ m
illio
n
Office
Retail
Industrial
REITHotel
Others ^
$324m $587m $268m
FY 2016 FY 2015 FY 2014
Office 57 76 38
Retail 23 11 34
Industrial 2 - 1
REITHotel 16 10 20
Others ^ 2 3 7
~ Includes gain on sale of Profit Participation Securities^ Including car park serviced apartments and residential
Rental Properties
South Beach
41
JW Marriott Hotel Singapore South Beach
JW Marriott Hotel Singapore South Beach
Rebranded hotel soft opened in mid-Dec2016
Business performance is within expectations
Ongoing works at NCO Club are expected tocomplete by Q3 2017 along with theremodelled Ballroom
South Beach Residences
190-unit luxury residence may be launchedin 2H 2017 subject to market conditions
Fully Completed in December 2016
Strong Performance for Office amp Retail
South Beach Tower (510000 sq ft office space) and retail space are fully leased
INTERNATIONAL OVERVIEW
Projects Launched To Date
43
Project City Equity Stake
Total Units
Total Units Sold
Booked
Sold Est TotalSaleable
Area (sq ft)
ExpectedCompletion
Australia
Ivy and Eve Brisbane 33 472 450 95 348678 1H 2018
China
Hong Leong City Center (Phase 1)
Suzhou 100^ 1374 1038 76 1378891 Completed
Hong Leong City Center (Phase 2 ndash T2)
Suzhou 100^ 430 174 40 439716 Q4 2017
Hongqiao Royal Lake Shanghai 100 85 34 40 385394 Completed
China ndash Good Progress on Launched Luxury Projects
International Property Development
47
Shanghai ndash Hongqiao Royal Lake (御湖)
Eling Residences Chongqing
Stable sales despite tightening measures in Shanghai
34 units soldbooked with sales value of RMB 668 millionachieved to date
Chongqing ndash Eling Residences (鹅岭峰)
Launched in Oct 2016
8 units soldbooked with sales value of RMB 85 million ndashachieved highest average values of close to RMB 40000 psm
City Equity Stake
Total Units
Total Units Sold Booked
Sold
Expected Completion
Shanghai 100 85 34 40 Completed
Hongqiao Royal Lake Shanghai
City Equity Stake
Total Units
Total Units Sold Booked
Sold
Expected Completion
Chongqing 100 126 8 6 Q2 2017
Artistrsquos Impression
As of 19 Feb 2017
Chongqing ndash Huang Huayuan (黄花园)
Scheduled launch of mixed-use development with over 600 residential units in 2019
48
Over 150000 apartment listings spanning over 20 citiesin China
Offers one-stop solution for apartment owners andrental customers
Investment provides immediate entry into this fast-growing new economy sectorminus Complement business portfoliominus Contributes to future long-term recurring income stream
Synergies to be shared with the Grouprsquos properties inShanghai Suzhou and Chongqing
Strategic Acquisition of 20 Equity Stake in mamahome for RMB 100 million
Distrii ndash Leading Provider of Co-working Space Acquisition completed in Jan 2017
Currently 15 locations (13 Shanghai + 1 Beijing + 1 Hangzhou) 3700 seating capacity in total 10 locations in operation with 5 more locations to open in 1H 2017
Targeting to double the locations in China by end 2017
Current capacity of over 2200 seats has reached above 80 occupancy
Committed to lease over 60000 sq ft in Republic Plaza Expected to open in 1H 2018
Distrii Suhe Center Shanghai
Strategic Acquisition of 24 Equity Stake in Distrii for RMB 72 million
50
Purchase of a 100 equity stake in Shanghai MeidaoInvestment Co which owns the commercial projectthat is in the final stages of construction
Total transaction value of RMB 900 million throughCDL China Limited
Strategically located in Huacao Minhang Districtwithin the Hongqiao CBD ndash a new area established in2009 that spans 86 sq km and is one of Shanghairsquosfastest growing business areas
Project comprises five 9-storey office towers and twolevels of basement carpark with about 351 lots
Project has been approved for division into strata-titleunits
China ndashAcquisition of Shanghai Commercial Project for RMB 900 million
Artistrsquos ImpressionMeidao Business Plaza Shanghai
Meidao Business Plaza ShanghaiTenure Equity
StakeEst Total GFA
(sqm)Expected
Completion
50-year lease 100 32300 2H 2017
International Rental Properties
Artistrsquos Impression
Japan ndash Invested in 2 Prime Residential Projects in Tokyo
Located within prestigious Aoyama area withinMinato ward in Tokyo
Project targeted at high-end domestic and foreignbuyers
Good uptake with over 50 of units sold since itslaunch in Oct 2016
Tokyo ndashPark Court Aoyama The Tower
International Property Development
51
Artistrsquos ImpressionPark Court Aoyama The Tower Tokyo
Tokyo ndash ShirokaneTenure Equity Stake Site Area (sqm)
Freehold 947 16815
Discussions with potential JV partner for project development ongoing
City Equity Stake Total Units
Total Units Sold Expected Completion
Freehold 20 163 Over 50 1H 2018
As of 19 Feb 2017
Teddington Riverside Teddington TW11
Full planning received works on basement car park inadvanced stage
Block A (57 units) will be launched in Q2 2017 followed byanother five blocks
International Property Development
52
UK ndash Upcoming Launches in Q2 2017
Artistrsquos Impression
Tenure EquityStake
Total Units Est TotalSaleable Area
(sq ft)
Expected Completion
Freehold 100 220 240000 2018 (Phased)
Teddington Riverside London
Project Tenure Equity Stake
Total Units
Est TotalSaleable
Area (sq ft)
Expected Completion
Belgravia Freehold 100 6 12375 Q2 2017
Knightsbridge Freehold 100 3 5193 Q2 2017
Belgravia3135 Chesham Street London SW1X 8NQ
Knightsbridge32 Hans Road London SW3 1RW
Chelsea 90-100 Sydney Street London SW3 6NJ
International Property Development
53
UK ndash Pipeline Projects
Tenure EquityStake
Total Units Est TotalSaleable Area
(sq ft)
Expected Completion
Freehold 100 9 16143 Q2 2018
Stag Brewery London
Tenure Equity Stake Est Total Saleable Area (sq ft)
Freehold 100 1000000 sq ft
Stag Brewery Mortlake London SW14
Advanced master plan at public consultation stage
Planning applications to be submitted by end Q2 2017
Proposed scheme to comprise two phases Parameter plan covering the entire site Detailed planning application for Phase 1Artistrsquos Impression
Artistrsquos Impression
Good progress on works
Expected completion in Q2 2018
International Property Development
54
Tenure Equity Stake Total Units Est GFA (sq ft)
Freehold 100 34 135000
28 Pavilion Road Knightsbridge London SW1
First luxury home care development to be built in Central Londonndash planning consent obtained
Project on target to commence demolition works in Q2 2017Artistrsquos ImpressionPavilion Road
UK ndash Pipeline Projects
Development House
Planning application to be submitted in Q2 2017
Existing 28000 sq ft remains fully leased and vacantpossession expected from Q2 2018
Development House Leonard Street in Shoreditch
Tenure Equity Stake Est Total Lettable Area (sq ft)
Freehold 100 90000 sq ft
Artistrsquos Impression
Artistrsquos Impression
UK ndashAcquisition of 16-acre Ransomes Wharf site for pound58 million
Located within Battersearsquos creative quarter on theRiver Thames
Est GDV of pound222 million
Contracts completed purchase to be phased overthe next 18 months
Profit before tax pound108m pound109m (09) pound124m (129)
PATMI pound78m pound65m 200
Trading Performance
The Baileyrsquos Hotel London The Baileyrsquos Hotel London
Increase in reported revenue attributed to higher land sales in New Zealand and a higher contribution from Millennium Mitsui Garden Hotel Tokyo coupled with favourable foreign exchange movements as a result of weak pound against major currencies
MampC Hotel Operations
58
Trading Performance
RevPAR in reported currency was up by 66 but in constant currency fell by 23 for FY 2016 as compared to the same period last year
FY 2016 Reported Currency Constant CurrencyNew York pound14564 uarr 19 darr 99Regional US pound5749 uarr175 uarr 40Total US pound8652 uarr 83 darr 42London pound10718 darr 14 darr 14Rest of Europe pound5261 uarr 20 darr 16Total Europe pound8024 darr 08 darr 20Singapore pound8021 uarr 05 darr 101Rest of Asia pound6063 uarr 116 uarr 19Total Asia pound6821 uarr 62 darr 40Australasia pound5840 uarr 348 uarr 209Total Group pound7671 uarr 66 darr 23 Millennium Seoul Hilton
Copthorne Hotel amp Resort Queenstown Lakefront
Sheet1
Developments ndash Progressing well
The lifestyle hotel and serviced apartment has 306 and 209keys respectively
The building permit approval for Seoul Yangdong developmentproject has been received on 25 January 2017 Additionalcertification processes are expected to complete by mid 2017
The main contract tender process is planned to complete bymid 2017 before construction work starts
Seoul South Korea
59
Comprises a 263-room hotel and a 250-unit residentialapartment block
The final planning approval has been received in December2016
Currently reviewing the project costing and specification whichis anticipated to take about 18 months to complete aftercommencement
Sunnyvale US
MampC Hotel Operations
MampC Hotel Operations
60
ONE UN New York
Refurbishment of guestrooms in the east tower was completed in early Sep 2016 and the towers were re-opened in time for the UN General Assembly
Assets Enhancement (Completed)
Grand Copthorne Waterfront Hotel Singapore
Work on the main lobby and FampB outlets at the main entrance level was substantially completed in May 2016
Refurbishment of function rooms on level 2 started in Sep 2016 and completed in Dec 2016
M Hotel Singapore
Soft refurbishment of all guestrooms from level 12 to level 28 is complete with the last phase completed in Dec 2016
ONE UN New York
Grand Copthorne Waterfront Hotel Singapore
M Hotel Singapore
MampC Hotel Operations
61
Grand Millennium Kuala Lumpur
Soft refurbishment of guestrooms from level 9 to level 19 was completed at the beginning of the 4th quarter of 2016
Remaining guestrooms at level 7 and level 8 is planned to be refurbished in the mid 2017
Assets Enhancement (On-going)
Grand Millennium Kuala Lumpur
Copthorne Hotel Auckland Harbour City
Copthorne Hotel Auckland Harbour City
Closed for a major refurbishment programme in Q3 2015 at an estimated cost of NZ$40 million
The hotel will be rebranded as M Social Hotel Auckland and is expected to re-open in 2nd quarter of 2017
Artistrsquos Impression
Artistrsquos Impression
31 Dec 31 Dec 31 Dec 31 DecHotel and Room Count 2016 2015 2016 2015By region New York 4 4 2238 2238 Regional US 15 15 4559 4463 London 8 8 2651 2651 Rest of Europe 19 18 3081 2867 Middle East 26 22 7805 6450 Singapore 7 6 3011 2716 Rest of Asia 27 26 10036 9430 Australasia 25 27 3641 3903 Total 131 126 37022 34718
PipelineBy region Middle East 17 16 5465 4663 Rest of Asia 4 3 1608 1674 Regional USA 1 1 263 263 Rest of Europe 1 - 153 - Total 23 20 7489 6600
Hotels Rooms
Hotel Room Count and Pipeline
MampC Hotel Operations
Mainly management contracts
62
Millennium Biltmore Hotel Los Angeles
Grand Millennium Auckland
Sheet1
CDL Hospitality Trusts
63
S$rsquo000 FY 2016 FY 2015 Change
Gross Revenue 180857 172410 49
Net Property Income (NPI) 137560 137003 04
Trading Performance
Hilton Cambridge City Centre ndash Executive Lounge
Artistrsquos Impression
Gross revenue and NPI increased mainly due to Inorganic contribution from Hilton Cambridge City Centre United Kingdom which
was acquired on 1 Oct 2015 Strong contribution from New Zealand hotels as a result of higher variable rental
income Incremental income boost from Japan hotels and Claymore Connect retail mall
This was partially offset by Continued weakness in Singapore and Maldives markets due to soft trading
conditions amid the global economic slowdown Lower contribution from Australia due to weaker AUD and lower variable income
contribution for FY 2016
Artistrsquos Impression
Disclaimer
This document may contain forward-looking statements that involve assumptions risks and uncertainties Actual future performance outcomes and results may differ materially from those expressed in forward-looking statements as a result of a number of risks uncertainties and assumptions Representative examples of these factors include (without limitation) general industry and economic conditions interest rate trends cost of capital and capital availability availability of real estate properties competition from other developments or companies shifts in customer demands customers and partners expected levels of occupancy rate property rental income charge out collections changes in operating expenses (including employee wages benefits and training costs) governmental and public policy changes and the continued availability of financing in the amounts and the terms necessary to support future business You are cautioned not to place undue reliance on these forward-looking statements which are based on the current view of management on future events Numbers in tables and charts may not add up due to rounding
Gramercy Park Singaporewwwcdlcomsg
Slide Number 1
Slide Number 2
Slide Number 3
Slide Number 4
Slide Number 5
Slide Number 6
Slide Number 7
Slide Number 8
Slide Number 9
Slide Number 10
Slide Number 11
Slide Number 12
Slide Number 13
Slide Number 14
Slide Number 15
Slide Number 16
Slide Number 17
Slide Number 18
Slide Number 19
Slide Number 20
Slide Number 21
Slide Number 22
Slide Number 23
Slide Number 24
Slide Number 25
Slide Number 26
Slide Number 27
Slide Number 28
Slide Number 29
Slide Number 30
Slide Number 31
Slide Number 32
Slide Number 33
Slide Number 34
Slide Number 35
Slide Number 36
Slide Number 37
Slide Number 38
Slide Number 39
Slide Number 40
Slide Number 41
Slide Number 42
Slide Number 43
Slide Number 44
Slide Number 45
Slide Number 46
Slide Number 47
Slide Number 48
Slide Number 49
Slide Number 50
Slide Number 51
Slide Number 52
Slide Number 53
Slide Number 54
Slide Number 55
Slide Number 56
Slide Number 57
Slide Number 58
Slide Number 59
Slide Number 60
Slide Number 61
Slide Number 62
Slide Number 63
Slide Number 64
Slide Number 65
Hotels
Rooms
31 Dec
31 Dec
31 Dec
31 Dec
Hotel and Room Count
2016
2015
2016
2015
By region
New York
4
4
2238
2238
Regional US
15
15
4559
4463
London
8
8
2651
2651
Rest of Europe
19
18
3081
2867
Middle East
26
22
7805
6450
Singapore
7
6
3011
2716
Rest of Asia
27
26
10036
9430
Australasia
25
27
3641
3903
Total
131
126
37022
34718
Pipeline
By region
Middle East
17
16
5465
4663
Rest of Asia
4
3
1608
1674
Regional USA
1
1
263
263
Rest of Europe
1
- 0
153
- 0
Total
23
20
7489
6600
FY 2016
Reported Currency
Constant Currency
New York
pound14564
uarr 19
darr 99
Regional US
pound5749
uarr175
uarr 40
Total US
pound8652
uarr 83
darr 42
London
pound10718
darr 14
darr 14
Rest of Europe
pound5261
uarr 20
darr 16
Total Europe
pound8024
darr 08
darr 20
Singapore
pound8021
uarr 05
darr 101
Rest of Asia
pound6063
uarr 116
uarr 19
Total Asia
pound6821
uarr 62
darr 40
Australasia
pound5840
uarr 348
uarr 209
Total Group
pound7671
uarr 66
darr 23
Project
Equity Stake
Total Units
Units Sold
Sold
Total Unsold Inventory
CDLrsquos Share of Unsold Inventory
St Regis Residences
33
173
161
93
12
4
The Oceanfront Sentosa Cove
50
264
263
99
1
05
One Shenton
100
341
327
96
14
14
Cliveden at Grange
100
110
44
40
66
66
UPRobertson Quay
100
70
57
81
13
13
Echelon
50
508
506
100
2
1
DNest
51
912
904
99
8
408
Jewel Buangkok
100
616
616
100
0
0
The Venue Shoppes
60
28
16
57
12
72
The Venue Residences
60
266
181
68
85
51
Coco Palms
51
944
865
92
79
4029
The Brownstone Executive Condo
70
638
519
81
119
833
The Criterion Executive Condo
70
505
179
35
326
2282
Gramercy Park
100
174
46
53^
41^
41^
(Phase 1 = 87-unit North Tower)
Forest Woods
50
519
382
74
137
685
Bartley Ridge
30
868
868
100
0
0
Commonwealth Towers
30
845
461
55
384
1152
TOTAL
7781
6395
1299
7373
Financial Highlights
20
EBITDA by Segment for Full Year (2014 ndash 2016)
FY 2016 FY 2015 FY 2014
Property Development 45 29 43
Hotel Operations 22 24 36
Rental Properties 27 46 21
Others 6 1 -
0
100
200
300
400
500
600
700
FY 2016 FY 2015 FY 2014
550
364
557
264 304
463
324
587
268
78 17 6
$ m
illio
n
Property Development Hotel Operations Rental Properties Others
$1216m $1272m $1294m
Financial HighlightsCapital Management
21
As at 311216 As at 311215
Gross borrowings $5752m $6503m
Cash and cash equivalents (include restricted deposits of $214m classified in other non-current assets)
$3887m $3565m
Net borrowings $1865m $2938m
Net gearing ratio without taking in fair value gains on investment properties 16 26
Interest cover ratio 125 x 130 x
Financial Highlights
Debt Expiry Profile Debt MaturityPrudent Capital Management
22
1535
995
467 360 202 -
250
320
295 428
260 640
0
500
1000
1500
2000
2017 2018 2019 2020 2021 2022onwards
Bond Bank Loan
Deb
t $ m
illio
n
Debt Currency Mix
31122015 31122016
Average Borrowing Cost 22 22
Secured Borrowings 18 16
31
2313
33
Within 1 year
1 to 2 years
2 to 3 years
More than 3years
53
11
13
11
75 SGD
GBP
USD
JPY
RMB
Others
SINGAPORE OVERVIEW
Source URA Q4 2016
Based on Revised PPI
24
Property Price Index ndash Residential (2012 ndash 2016)
Singapore Property Market
100
120
140
160
180
Q112
Q212
Q312
Q412
Q113
Q213
Q313
Q413
Q114
Q214
Q314
Q414
Q115
Q215
Q315
Q415
Q116
Q216
Q316
Q416
All Residential
Q4 161372
Q3 161379
0
2000
4000
6000
8000
10000
12000
14000
16000
18000
20000
22000
24000
2012 2013 2014 2015 2016
21478
15885
7693 7056 7877
22197
14948
7316 74407972
New Units Launched New Units Sold
Source URA Q4 2016
New Units Launched
(excl EC units)
New UnitsSold Directly By
Developers (excl EC units)
2012 21478 22197
2013 15885 14948
2014 7693 7316
2015 7056 7440
2016 7877 7972
25
Singapore Property MarketNo of New Private Residential Units Launched vs Units Sold (2012 ndash 2016)
0
4000
8000
12000
16000
20000
2012 2013 2014 2015 2016
Not Launched
Launched amp Unsold
Num
ber o
f Uni
ts
17467
Source URA Q4 2016
16587
Launched amp Unsold
Not Launched
Total
2012 5137 8807 13944
2013 6124 11343 17467
2014 5750 10837 16587
2015 5736 9763 15499
2016 5206 7035 12241
26
13944
Singapore Property MarketNo of Uncompleted Private Residential Units Available (2012 ndash 2016)
Launch timing unknown and may not materialise
15499
12241
Includes share of JV partners
Singapore Property DevelopmentResidential Units Sold
27
Sales Value$rsquo000
No ofUnits
TotalArea Sold
(sq ft)
FY 2016 $ 1245723 1017 974666
FY 2015 $ 691507 674 712558
Gramercy Park ndash Positive Response to Phase 1
28
Singapore Property Development
Project Location Tenure Equity Stake
Total Units
Total Units Sold
Sold
Total Saleable Area (sq ft)
Gramercy Park Grange Road Freehold 100 174 56 32 368743
As of 19 Feb 2017
Phase 2 Launch by 1H 2017
Good uptake with 56 units sold to date
All 87 units in North Tower released to date (64 sold)
87-unit South Tower (Phase 2) slated for launch by 1H 2017
Gramercy Park
One of 2016rsquos Bestselling Residential Projects
29
Singapore Property Development
Artistrsquos Impression
Artistrsquos ImpressionForest Woods
Project Location Tenure Equity Stake
Total Units
Total Units Sold
Sold
Total Saleable Area (sq ft)
Expected TOP
Forest Woods LorongLew Lian
99-year leasehold
50 519 392 76 431265 2021
As of 19 Feb 2017
Strong Uptake
Launched in Oct 2016 and 76 soldto-date
Achieved average selling price of about$1400 psf
All 1-bedroom + study 2-bedroomapartment types and penthouses havebeen sold
Remaining units comprise of 2-bedroom + study to 4-bedroom unittypes
Completed Residential Projects in 2016
30
Project Location Equity Stake
Total Units
Sold
TOPObtained
HAUSSERANGOONGARDEN
Serangoon Garden Close
70 97 Terraces
100 Mar 2016
The Inflora Flora Drive 33 396 100 Apr 2016
Gramercy Park Grange Road 100 174 32 May 2016
Lush Acres(Executive Condo)
Fernvale Close 100 380 100 Jun 2016
Jewel Buangkok Compassvale Bow 100 616 100 Aug 2016
Echelon Alexandra View 50 508 99 Sep 2016
Bartley Ridge Mount Vernon Road
30 868 100 Oct 2016
South Beach Residences Beach Road 501 190 -^ Dec 2016
Singapore Property Development
Echelon
As of 19 Feb 2017^ Not launched yet
Upcoming Residential Project Launch for 2H 2017 (Subject to market conditions)
31
Singapore Property Development
Artistrsquos Impression
Upmarket freehold condominium in District 9 designedby world-renowned architect SOM
Comprises 124 units in two iconic 36-storey towers withsix sky terraces
5-minutes walk from Orchard Road
All apartments enjoy private lift access and are fittedwith premium finishes and branded appliances
Artistrsquos ImpressionNew Futura
Project Location Tenure Equity Stake
Total Units
Gross Floor Area (sqm)
Expected TOP
New Futura Leonie Hill Road Freehold 100 124 23066 2017
Inventory of Launched Residential Projects ndashAs of 31 Dec 2016
32
Singapore Property Development
Leasing strategy implemented ^ Based on launched units
Note Above excludes inventory from The Residences at W Singapore ndash Sentosa Cove (203 units) unlaunched projects Nouvel 18 (156 units) and New Futura (124 units)
Sheet1
110
115
120
125
130
135
140
145
Q112
Q212
Q312
Q412
Q113
Q213
Q313
Q413
Q114
Q214
Q314
Q414
Q115
Q215
Q315
Q415
Q116
Q216
Q316
Q416
Office Retail
Source URA Q4 2016
33
Singapore Commercial MarketProperty Price Index ndash Commercial (2012ndash 2016)
Q4 161226
Q4 16 1347
Q3 161223
Q3 16 1355
Source JLL Research Q4 2016
$974
$1051$1204
$1038$914
$790 $837$926
$850$777
000
200
400
600
800
1000
1200
1400
2012 2013 2014 2015 2016
Marina Bay Raffles Place(Grade A)
Whole Island
34
Singapore Office MarketAverage Office Rental in CBD (2012 ndash 2016)
Office Space Demand amp Supply (2012 ndash 2016)Private amp Public Sector
78254 80095 81300 81365 83206
7091372205 72980 73647 73938
30000
35000
40000
45000
50000
55000
60000
65000
70000
75000
80000
85000
2012 2013 2014 2015 2016
Cumulative Supply Occupancy
Source URA Q4 2016
Singapore Office Market
CDLrsquos Office Properties Occupancy
959(National Average = 889)
35
Occupancy as of 31 Dec 2016
2017 2018 2019
33 28 25
Expiry of NLA
36
CDLrsquos Office Space ndash Lease Expiry Profile (2017 ndash 2019)
Rental Properties
Office Portfolio NLA ~2300000 sq ft
16Properties^
959Occupancy
As of 31 December 2016
Note Properties include -Republic Plaza Central Mall (Office Tower) City House Fuji Xerox Towers Manulife Centre Palais Renaissance Tanglin Shopping Centre The Arcade Katong Shopping Centre Kingrsquos Centre 7 amp 9 Tampines Grande 11 Tampines Concourse Sunshine Plaza Fortune Centre Golden Mile Complex Central Mall Conservation Unit
Based on contractual expiry dates Renewals will be negotiated nearer to expiry Tenants may renew their leases or increasereduce space or exit ^ Properties include strata-titled units owned and managed by CDL
60052
61333
6365864271
65079
57060
58599
59955 5963260192
52000
54000
56000
58000
60000
62000
64000
66000
2012 2013 2014 2015 2016
Cumulative Supply Occupancy
Retail Space Demand amp Supply (2012 ndash 2016)Private amp Public Sector
Source URA Q4 2016
With effect from Q1 2014 the coverage of retail space has been expanded to include non-shop retail uses and data are available from2011 onwards
Singapore Retail Market
CDLrsquos Retail Properties Occupancy
964(National Average = 925)
37
Occupancy as of 31 Dec 2016
38
CDLrsquos Retail Space ndash Lease Expiry Profile (2017 ndash 2019)
2017 2018 2019
2332 31
Expiry of NLA
Rental Properties
Retail Portfolio NLA ~840000 sq ft
19Properties^
964Occupancy
As of 31 December 2016
Based on contractual expiry dates Renewals will be negotiated nearer to expiry Tenants may renew their leases or increasereduce space or exit ^ Properties include strata-titled units owned and managed by CDL
Note Properties include ndashRepublic Plaza Central Mall (Office Tower) City Square Mall Palais Renaissance Tanglin Shopping Centre The Arcade Katong Shopping Centre Kingrsquos Centre Quayside Isle Grand Copthorne Waterfront (Waterfront Plaza) City Plaza Golden Mile Complex Central Mall Conservation Unit 7 amp 9 Tampines Grande City House Fortune Centre Manulife Centre Fuji Xerox Towers
39
Revenue by Sector for Full Year (2014 ndash 2016)
0
50
100
150
200
250
300
FY 2016 FY 2015 FY 2014
152187 176
110 113 111
7 8 8
74 75 65
24 23 25
S$ m
illio
n
Office
Retail
Industrial
REITHotel
Others ^
$367m $406m $385m
FY 2016 FY 2015 FY 2014
Office 41 46 46
Retail 30 28 29
Industrial 2 2 2
REITHotel 20 18 17
Others ^ 7 6 6
^ Including car park serviced apartments and residential
Rental Properties
40
EBITDA by Sector for Full Year (2014 ndash 2016)
050
100150200250300350400450500550600
FY 2016 FY 2015 FY 2014
185
446 ~
10175 64 91
5 4 453 58 53
6 15 19
S$ m
illio
n
Office
Retail
Industrial
REITHotel
Others ^
$324m $587m $268m
FY 2016 FY 2015 FY 2014
Office 57 76 38
Retail 23 11 34
Industrial 2 - 1
REITHotel 16 10 20
Others ^ 2 3 7
~ Includes gain on sale of Profit Participation Securities^ Including car park serviced apartments and residential
Rental Properties
South Beach
41
JW Marriott Hotel Singapore South Beach
JW Marriott Hotel Singapore South Beach
Rebranded hotel soft opened in mid-Dec2016
Business performance is within expectations
Ongoing works at NCO Club are expected tocomplete by Q3 2017 along with theremodelled Ballroom
South Beach Residences
190-unit luxury residence may be launchedin 2H 2017 subject to market conditions
Fully Completed in December 2016
Strong Performance for Office amp Retail
South Beach Tower (510000 sq ft office space) and retail space are fully leased
INTERNATIONAL OVERVIEW
Projects Launched To Date
43
Project City Equity Stake
Total Units
Total Units Sold
Booked
Sold Est TotalSaleable
Area (sq ft)
ExpectedCompletion
Australia
Ivy and Eve Brisbane 33 472 450 95 348678 1H 2018
China
Hong Leong City Center (Phase 1)
Suzhou 100^ 1374 1038 76 1378891 Completed
Hong Leong City Center (Phase 2 ndash T2)
Suzhou 100^ 430 174 40 439716 Q4 2017
Hongqiao Royal Lake Shanghai 100 85 34 40 385394 Completed
China ndash Good Progress on Launched Luxury Projects
International Property Development
47
Shanghai ndash Hongqiao Royal Lake (御湖)
Eling Residences Chongqing
Stable sales despite tightening measures in Shanghai
34 units soldbooked with sales value of RMB 668 millionachieved to date
Chongqing ndash Eling Residences (鹅岭峰)
Launched in Oct 2016
8 units soldbooked with sales value of RMB 85 million ndashachieved highest average values of close to RMB 40000 psm
City Equity Stake
Total Units
Total Units Sold Booked
Sold
Expected Completion
Shanghai 100 85 34 40 Completed
Hongqiao Royal Lake Shanghai
City Equity Stake
Total Units
Total Units Sold Booked
Sold
Expected Completion
Chongqing 100 126 8 6 Q2 2017
Artistrsquos Impression
As of 19 Feb 2017
Chongqing ndash Huang Huayuan (黄花园)
Scheduled launch of mixed-use development with over 600 residential units in 2019
48
Over 150000 apartment listings spanning over 20 citiesin China
Offers one-stop solution for apartment owners andrental customers
Investment provides immediate entry into this fast-growing new economy sectorminus Complement business portfoliominus Contributes to future long-term recurring income stream
Synergies to be shared with the Grouprsquos properties inShanghai Suzhou and Chongqing
Strategic Acquisition of 20 Equity Stake in mamahome for RMB 100 million
Distrii ndash Leading Provider of Co-working Space Acquisition completed in Jan 2017
Currently 15 locations (13 Shanghai + 1 Beijing + 1 Hangzhou) 3700 seating capacity in total 10 locations in operation with 5 more locations to open in 1H 2017
Targeting to double the locations in China by end 2017
Current capacity of over 2200 seats has reached above 80 occupancy
Committed to lease over 60000 sq ft in Republic Plaza Expected to open in 1H 2018
Distrii Suhe Center Shanghai
Strategic Acquisition of 24 Equity Stake in Distrii for RMB 72 million
50
Purchase of a 100 equity stake in Shanghai MeidaoInvestment Co which owns the commercial projectthat is in the final stages of construction
Total transaction value of RMB 900 million throughCDL China Limited
Strategically located in Huacao Minhang Districtwithin the Hongqiao CBD ndash a new area established in2009 that spans 86 sq km and is one of Shanghairsquosfastest growing business areas
Project comprises five 9-storey office towers and twolevels of basement carpark with about 351 lots
Project has been approved for division into strata-titleunits
China ndashAcquisition of Shanghai Commercial Project for RMB 900 million
Artistrsquos ImpressionMeidao Business Plaza Shanghai
Meidao Business Plaza ShanghaiTenure Equity
StakeEst Total GFA
(sqm)Expected
Completion
50-year lease 100 32300 2H 2017
International Rental Properties
Artistrsquos Impression
Japan ndash Invested in 2 Prime Residential Projects in Tokyo
Located within prestigious Aoyama area withinMinato ward in Tokyo
Project targeted at high-end domestic and foreignbuyers
Good uptake with over 50 of units sold since itslaunch in Oct 2016
Tokyo ndashPark Court Aoyama The Tower
International Property Development
51
Artistrsquos ImpressionPark Court Aoyama The Tower Tokyo
Tokyo ndash ShirokaneTenure Equity Stake Site Area (sqm)
Freehold 947 16815
Discussions with potential JV partner for project development ongoing
City Equity Stake Total Units
Total Units Sold Expected Completion
Freehold 20 163 Over 50 1H 2018
As of 19 Feb 2017
Teddington Riverside Teddington TW11
Full planning received works on basement car park inadvanced stage
Block A (57 units) will be launched in Q2 2017 followed byanother five blocks
International Property Development
52
UK ndash Upcoming Launches in Q2 2017
Artistrsquos Impression
Tenure EquityStake
Total Units Est TotalSaleable Area
(sq ft)
Expected Completion
Freehold 100 220 240000 2018 (Phased)
Teddington Riverside London
Project Tenure Equity Stake
Total Units
Est TotalSaleable
Area (sq ft)
Expected Completion
Belgravia Freehold 100 6 12375 Q2 2017
Knightsbridge Freehold 100 3 5193 Q2 2017
Belgravia3135 Chesham Street London SW1X 8NQ
Knightsbridge32 Hans Road London SW3 1RW
Chelsea 90-100 Sydney Street London SW3 6NJ
International Property Development
53
UK ndash Pipeline Projects
Tenure EquityStake
Total Units Est TotalSaleable Area
(sq ft)
Expected Completion
Freehold 100 9 16143 Q2 2018
Stag Brewery London
Tenure Equity Stake Est Total Saleable Area (sq ft)
Freehold 100 1000000 sq ft
Stag Brewery Mortlake London SW14
Advanced master plan at public consultation stage
Planning applications to be submitted by end Q2 2017
Proposed scheme to comprise two phases Parameter plan covering the entire site Detailed planning application for Phase 1Artistrsquos Impression
Artistrsquos Impression
Good progress on works
Expected completion in Q2 2018
International Property Development
54
Tenure Equity Stake Total Units Est GFA (sq ft)
Freehold 100 34 135000
28 Pavilion Road Knightsbridge London SW1
First luxury home care development to be built in Central Londonndash planning consent obtained
Project on target to commence demolition works in Q2 2017Artistrsquos ImpressionPavilion Road
UK ndash Pipeline Projects
Development House
Planning application to be submitted in Q2 2017
Existing 28000 sq ft remains fully leased and vacantpossession expected from Q2 2018
Development House Leonard Street in Shoreditch
Tenure Equity Stake Est Total Lettable Area (sq ft)
Freehold 100 90000 sq ft
Artistrsquos Impression
Artistrsquos Impression
UK ndashAcquisition of 16-acre Ransomes Wharf site for pound58 million
Located within Battersearsquos creative quarter on theRiver Thames
Est GDV of pound222 million
Contracts completed purchase to be phased overthe next 18 months
Profit before tax pound108m pound109m (09) pound124m (129)
PATMI pound78m pound65m 200
Trading Performance
The Baileyrsquos Hotel London The Baileyrsquos Hotel London
Increase in reported revenue attributed to higher land sales in New Zealand and a higher contribution from Millennium Mitsui Garden Hotel Tokyo coupled with favourable foreign exchange movements as a result of weak pound against major currencies
MampC Hotel Operations
58
Trading Performance
RevPAR in reported currency was up by 66 but in constant currency fell by 23 for FY 2016 as compared to the same period last year
FY 2016 Reported Currency Constant CurrencyNew York pound14564 uarr 19 darr 99Regional US pound5749 uarr175 uarr 40Total US pound8652 uarr 83 darr 42London pound10718 darr 14 darr 14Rest of Europe pound5261 uarr 20 darr 16Total Europe pound8024 darr 08 darr 20Singapore pound8021 uarr 05 darr 101Rest of Asia pound6063 uarr 116 uarr 19Total Asia pound6821 uarr 62 darr 40Australasia pound5840 uarr 348 uarr 209Total Group pound7671 uarr 66 darr 23 Millennium Seoul Hilton
Copthorne Hotel amp Resort Queenstown Lakefront
Sheet1
Developments ndash Progressing well
The lifestyle hotel and serviced apartment has 306 and 209keys respectively
The building permit approval for Seoul Yangdong developmentproject has been received on 25 January 2017 Additionalcertification processes are expected to complete by mid 2017
The main contract tender process is planned to complete bymid 2017 before construction work starts
Seoul South Korea
59
Comprises a 263-room hotel and a 250-unit residentialapartment block
The final planning approval has been received in December2016
Currently reviewing the project costing and specification whichis anticipated to take about 18 months to complete aftercommencement
Sunnyvale US
MampC Hotel Operations
MampC Hotel Operations
60
ONE UN New York
Refurbishment of guestrooms in the east tower was completed in early Sep 2016 and the towers were re-opened in time for the UN General Assembly
Assets Enhancement (Completed)
Grand Copthorne Waterfront Hotel Singapore
Work on the main lobby and FampB outlets at the main entrance level was substantially completed in May 2016
Refurbishment of function rooms on level 2 started in Sep 2016 and completed in Dec 2016
M Hotel Singapore
Soft refurbishment of all guestrooms from level 12 to level 28 is complete with the last phase completed in Dec 2016
ONE UN New York
Grand Copthorne Waterfront Hotel Singapore
M Hotel Singapore
MampC Hotel Operations
61
Grand Millennium Kuala Lumpur
Soft refurbishment of guestrooms from level 9 to level 19 was completed at the beginning of the 4th quarter of 2016
Remaining guestrooms at level 7 and level 8 is planned to be refurbished in the mid 2017
Assets Enhancement (On-going)
Grand Millennium Kuala Lumpur
Copthorne Hotel Auckland Harbour City
Copthorne Hotel Auckland Harbour City
Closed for a major refurbishment programme in Q3 2015 at an estimated cost of NZ$40 million
The hotel will be rebranded as M Social Hotel Auckland and is expected to re-open in 2nd quarter of 2017
Artistrsquos Impression
Artistrsquos Impression
31 Dec 31 Dec 31 Dec 31 DecHotel and Room Count 2016 2015 2016 2015By region New York 4 4 2238 2238 Regional US 15 15 4559 4463 London 8 8 2651 2651 Rest of Europe 19 18 3081 2867 Middle East 26 22 7805 6450 Singapore 7 6 3011 2716 Rest of Asia 27 26 10036 9430 Australasia 25 27 3641 3903 Total 131 126 37022 34718
PipelineBy region Middle East 17 16 5465 4663 Rest of Asia 4 3 1608 1674 Regional USA 1 1 263 263 Rest of Europe 1 - 153 - Total 23 20 7489 6600
Hotels Rooms
Hotel Room Count and Pipeline
MampC Hotel Operations
Mainly management contracts
62
Millennium Biltmore Hotel Los Angeles
Grand Millennium Auckland
Sheet1
CDL Hospitality Trusts
63
S$rsquo000 FY 2016 FY 2015 Change
Gross Revenue 180857 172410 49
Net Property Income (NPI) 137560 137003 04
Trading Performance
Hilton Cambridge City Centre ndash Executive Lounge
Artistrsquos Impression
Gross revenue and NPI increased mainly due to Inorganic contribution from Hilton Cambridge City Centre United Kingdom which
was acquired on 1 Oct 2015 Strong contribution from New Zealand hotels as a result of higher variable rental
income Incremental income boost from Japan hotels and Claymore Connect retail mall
This was partially offset by Continued weakness in Singapore and Maldives markets due to soft trading
conditions amid the global economic slowdown Lower contribution from Australia due to weaker AUD and lower variable income
contribution for FY 2016
Artistrsquos Impression
Disclaimer
This document may contain forward-looking statements that involve assumptions risks and uncertainties Actual future performance outcomes and results may differ materially from those expressed in forward-looking statements as a result of a number of risks uncertainties and assumptions Representative examples of these factors include (without limitation) general industry and economic conditions interest rate trends cost of capital and capital availability availability of real estate properties competition from other developments or companies shifts in customer demands customers and partners expected levels of occupancy rate property rental income charge out collections changes in operating expenses (including employee wages benefits and training costs) governmental and public policy changes and the continued availability of financing in the amounts and the terms necessary to support future business You are cautioned not to place undue reliance on these forward-looking statements which are based on the current view of management on future events Numbers in tables and charts may not add up due to rounding
Gramercy Park Singaporewwwcdlcomsg
Slide Number 1
Slide Number 2
Slide Number 3
Slide Number 4
Slide Number 5
Slide Number 6
Slide Number 7
Slide Number 8
Slide Number 9
Slide Number 10
Slide Number 11
Slide Number 12
Slide Number 13
Slide Number 14
Slide Number 15
Slide Number 16
Slide Number 17
Slide Number 18
Slide Number 19
Slide Number 20
Slide Number 21
Slide Number 22
Slide Number 23
Slide Number 24
Slide Number 25
Slide Number 26
Slide Number 27
Slide Number 28
Slide Number 29
Slide Number 30
Slide Number 31
Slide Number 32
Slide Number 33
Slide Number 34
Slide Number 35
Slide Number 36
Slide Number 37
Slide Number 38
Slide Number 39
Slide Number 40
Slide Number 41
Slide Number 42
Slide Number 43
Slide Number 44
Slide Number 45
Slide Number 46
Slide Number 47
Slide Number 48
Slide Number 49
Slide Number 50
Slide Number 51
Slide Number 52
Slide Number 53
Slide Number 54
Slide Number 55
Slide Number 56
Slide Number 57
Slide Number 58
Slide Number 59
Slide Number 60
Slide Number 61
Slide Number 62
Slide Number 63
Slide Number 64
Slide Number 65
Hotels
Rooms
31 Dec
31 Dec
31 Dec
31 Dec
Hotel and Room Count
2016
2015
2016
2015
By region
New York
4
4
2238
2238
Regional US
15
15
4559
4463
London
8
8
2651
2651
Rest of Europe
19
18
3081
2867
Middle East
26
22
7805
6450
Singapore
7
6
3011
2716
Rest of Asia
27
26
10036
9430
Australasia
25
27
3641
3903
Total
131
126
37022
34718
Pipeline
By region
Middle East
17
16
5465
4663
Rest of Asia
4
3
1608
1674
Regional USA
1
1
263
263
Rest of Europe
1
- 0
153
- 0
Total
23
20
7489
6600
FY 2016
Reported Currency
Constant Currency
New York
pound14564
uarr 19
darr 99
Regional US
pound5749
uarr175
uarr 40
Total US
pound8652
uarr 83
darr 42
London
pound10718
darr 14
darr 14
Rest of Europe
pound5261
uarr 20
darr 16
Total Europe
pound8024
darr 08
darr 20
Singapore
pound8021
uarr 05
darr 101
Rest of Asia
pound6063
uarr 116
uarr 19
Total Asia
pound6821
uarr 62
darr 40
Australasia
pound5840
uarr 348
uarr 209
Total Group
pound7671
uarr 66
darr 23
Project
Equity Stake
Total Units
Units Sold
Sold
Total Unsold Inventory
CDLrsquos Share of Unsold Inventory
St Regis Residences
33
173
161
93
12
4
The Oceanfront Sentosa Cove
50
264
263
99
1
05
One Shenton
100
341
327
96
14
14
Cliveden at Grange
100
110
44
40
66
66
UPRobertson Quay
100
70
57
81
13
13
Echelon
50
508
506
100
2
1
DNest
51
912
904
99
8
408
Jewel Buangkok
100
616
616
100
0
0
The Venue Shoppes
60
28
16
57
12
72
The Venue Residences
60
266
181
68
85
51
Coco Palms
51
944
865
92
79
4029
The Brownstone Executive Condo
70
638
519
81
119
833
The Criterion Executive Condo
70
505
179
35
326
2282
Gramercy Park
100
174
46
53^
41^
41^
(Phase 1 = 87-unit North Tower)
Forest Woods
50
519
382
74
137
685
Bartley Ridge
30
868
868
100
0
0
Commonwealth Towers
30
845
461
55
384
1152
TOTAL
7781
6395
1299
7373
Source URA Q4 2016
Based on Revised PPI
24
Property Price Index ndash Residential (2012 ndash 2016)
Singapore Property Market
100
120
140
160
180
Q112
Q212
Q312
Q412
Q113
Q213
Q313
Q413
Q114
Q214
Q314
Q414
Q115
Q215
Q315
Q415
Q116
Q216
Q316
Q416
All Residential
Q4 161372
Q3 161379
0
2000
4000
6000
8000
10000
12000
14000
16000
18000
20000
22000
24000
2012 2013 2014 2015 2016
21478
15885
7693 7056 7877
22197
14948
7316 74407972
New Units Launched New Units Sold
Source URA Q4 2016
New Units Launched
(excl EC units)
New UnitsSold Directly By
Developers (excl EC units)
2012 21478 22197
2013 15885 14948
2014 7693 7316
2015 7056 7440
2016 7877 7972
25
Singapore Property MarketNo of New Private Residential Units Launched vs Units Sold (2012 ndash 2016)
0
4000
8000
12000
16000
20000
2012 2013 2014 2015 2016
Not Launched
Launched amp Unsold
Num
ber o
f Uni
ts
17467
Source URA Q4 2016
16587
Launched amp Unsold
Not Launched
Total
2012 5137 8807 13944
2013 6124 11343 17467
2014 5750 10837 16587
2015 5736 9763 15499
2016 5206 7035 12241
26
13944
Singapore Property MarketNo of Uncompleted Private Residential Units Available (2012 ndash 2016)
Launch timing unknown and may not materialise
15499
12241
Includes share of JV partners
Singapore Property DevelopmentResidential Units Sold
27
Sales Value$rsquo000
No ofUnits
TotalArea Sold
(sq ft)
FY 2016 $ 1245723 1017 974666
FY 2015 $ 691507 674 712558
Gramercy Park ndash Positive Response to Phase 1
28
Singapore Property Development
Project Location Tenure Equity Stake
Total Units
Total Units Sold
Sold
Total Saleable Area (sq ft)
Gramercy Park Grange Road Freehold 100 174 56 32 368743
As of 19 Feb 2017
Phase 2 Launch by 1H 2017
Good uptake with 56 units sold to date
All 87 units in North Tower released to date (64 sold)
87-unit South Tower (Phase 2) slated for launch by 1H 2017
Gramercy Park
One of 2016rsquos Bestselling Residential Projects
29
Singapore Property Development
Artistrsquos Impression
Artistrsquos ImpressionForest Woods
Project Location Tenure Equity Stake
Total Units
Total Units Sold
Sold
Total Saleable Area (sq ft)
Expected TOP
Forest Woods LorongLew Lian
99-year leasehold
50 519 392 76 431265 2021
As of 19 Feb 2017
Strong Uptake
Launched in Oct 2016 and 76 soldto-date
Achieved average selling price of about$1400 psf
All 1-bedroom + study 2-bedroomapartment types and penthouses havebeen sold
Remaining units comprise of 2-bedroom + study to 4-bedroom unittypes
Completed Residential Projects in 2016
30
Project Location Equity Stake
Total Units
Sold
TOPObtained
HAUSSERANGOONGARDEN
Serangoon Garden Close
70 97 Terraces
100 Mar 2016
The Inflora Flora Drive 33 396 100 Apr 2016
Gramercy Park Grange Road 100 174 32 May 2016
Lush Acres(Executive Condo)
Fernvale Close 100 380 100 Jun 2016
Jewel Buangkok Compassvale Bow 100 616 100 Aug 2016
Echelon Alexandra View 50 508 99 Sep 2016
Bartley Ridge Mount Vernon Road
30 868 100 Oct 2016
South Beach Residences Beach Road 501 190 -^ Dec 2016
Singapore Property Development
Echelon
As of 19 Feb 2017^ Not launched yet
Upcoming Residential Project Launch for 2H 2017 (Subject to market conditions)
31
Singapore Property Development
Artistrsquos Impression
Upmarket freehold condominium in District 9 designedby world-renowned architect SOM
Comprises 124 units in two iconic 36-storey towers withsix sky terraces
5-minutes walk from Orchard Road
All apartments enjoy private lift access and are fittedwith premium finishes and branded appliances
Artistrsquos ImpressionNew Futura
Project Location Tenure Equity Stake
Total Units
Gross Floor Area (sqm)
Expected TOP
New Futura Leonie Hill Road Freehold 100 124 23066 2017
Inventory of Launched Residential Projects ndashAs of 31 Dec 2016
32
Singapore Property Development
Leasing strategy implemented ^ Based on launched units
Note Above excludes inventory from The Residences at W Singapore ndash Sentosa Cove (203 units) unlaunched projects Nouvel 18 (156 units) and New Futura (124 units)
Sheet1
110
115
120
125
130
135
140
145
Q112
Q212
Q312
Q412
Q113
Q213
Q313
Q413
Q114
Q214
Q314
Q414
Q115
Q215
Q315
Q415
Q116
Q216
Q316
Q416
Office Retail
Source URA Q4 2016
33
Singapore Commercial MarketProperty Price Index ndash Commercial (2012ndash 2016)
Q4 161226
Q4 16 1347
Q3 161223
Q3 16 1355
Source JLL Research Q4 2016
$974
$1051$1204
$1038$914
$790 $837$926
$850$777
000
200
400
600
800
1000
1200
1400
2012 2013 2014 2015 2016
Marina Bay Raffles Place(Grade A)
Whole Island
34
Singapore Office MarketAverage Office Rental in CBD (2012 ndash 2016)
Office Space Demand amp Supply (2012 ndash 2016)Private amp Public Sector
78254 80095 81300 81365 83206
7091372205 72980 73647 73938
30000
35000
40000
45000
50000
55000
60000
65000
70000
75000
80000
85000
2012 2013 2014 2015 2016
Cumulative Supply Occupancy
Source URA Q4 2016
Singapore Office Market
CDLrsquos Office Properties Occupancy
959(National Average = 889)
35
Occupancy as of 31 Dec 2016
2017 2018 2019
33 28 25
Expiry of NLA
36
CDLrsquos Office Space ndash Lease Expiry Profile (2017 ndash 2019)
Rental Properties
Office Portfolio NLA ~2300000 sq ft
16Properties^
959Occupancy
As of 31 December 2016
Note Properties include -Republic Plaza Central Mall (Office Tower) City House Fuji Xerox Towers Manulife Centre Palais Renaissance Tanglin Shopping Centre The Arcade Katong Shopping Centre Kingrsquos Centre 7 amp 9 Tampines Grande 11 Tampines Concourse Sunshine Plaza Fortune Centre Golden Mile Complex Central Mall Conservation Unit
Based on contractual expiry dates Renewals will be negotiated nearer to expiry Tenants may renew their leases or increasereduce space or exit ^ Properties include strata-titled units owned and managed by CDL
60052
61333
6365864271
65079
57060
58599
59955 5963260192
52000
54000
56000
58000
60000
62000
64000
66000
2012 2013 2014 2015 2016
Cumulative Supply Occupancy
Retail Space Demand amp Supply (2012 ndash 2016)Private amp Public Sector
Source URA Q4 2016
With effect from Q1 2014 the coverage of retail space has been expanded to include non-shop retail uses and data are available from2011 onwards
Singapore Retail Market
CDLrsquos Retail Properties Occupancy
964(National Average = 925)
37
Occupancy as of 31 Dec 2016
38
CDLrsquos Retail Space ndash Lease Expiry Profile (2017 ndash 2019)
2017 2018 2019
2332 31
Expiry of NLA
Rental Properties
Retail Portfolio NLA ~840000 sq ft
19Properties^
964Occupancy
As of 31 December 2016
Based on contractual expiry dates Renewals will be negotiated nearer to expiry Tenants may renew their leases or increasereduce space or exit ^ Properties include strata-titled units owned and managed by CDL
Note Properties include ndashRepublic Plaza Central Mall (Office Tower) City Square Mall Palais Renaissance Tanglin Shopping Centre The Arcade Katong Shopping Centre Kingrsquos Centre Quayside Isle Grand Copthorne Waterfront (Waterfront Plaza) City Plaza Golden Mile Complex Central Mall Conservation Unit 7 amp 9 Tampines Grande City House Fortune Centre Manulife Centre Fuji Xerox Towers
39
Revenue by Sector for Full Year (2014 ndash 2016)
0
50
100
150
200
250
300
FY 2016 FY 2015 FY 2014
152187 176
110 113 111
7 8 8
74 75 65
24 23 25
S$ m
illio
n
Office
Retail
Industrial
REITHotel
Others ^
$367m $406m $385m
FY 2016 FY 2015 FY 2014
Office 41 46 46
Retail 30 28 29
Industrial 2 2 2
REITHotel 20 18 17
Others ^ 7 6 6
^ Including car park serviced apartments and residential
Rental Properties
40
EBITDA by Sector for Full Year (2014 ndash 2016)
050
100150200250300350400450500550600
FY 2016 FY 2015 FY 2014
185
446 ~
10175 64 91
5 4 453 58 53
6 15 19
S$ m
illio
n
Office
Retail
Industrial
REITHotel
Others ^
$324m $587m $268m
FY 2016 FY 2015 FY 2014
Office 57 76 38
Retail 23 11 34
Industrial 2 - 1
REITHotel 16 10 20
Others ^ 2 3 7
~ Includes gain on sale of Profit Participation Securities^ Including car park serviced apartments and residential
Rental Properties
South Beach
41
JW Marriott Hotel Singapore South Beach
JW Marriott Hotel Singapore South Beach
Rebranded hotel soft opened in mid-Dec2016
Business performance is within expectations
Ongoing works at NCO Club are expected tocomplete by Q3 2017 along with theremodelled Ballroom
South Beach Residences
190-unit luxury residence may be launchedin 2H 2017 subject to market conditions
Fully Completed in December 2016
Strong Performance for Office amp Retail
South Beach Tower (510000 sq ft office space) and retail space are fully leased
INTERNATIONAL OVERVIEW
Projects Launched To Date
43
Project City Equity Stake
Total Units
Total Units Sold
Booked
Sold Est TotalSaleable
Area (sq ft)
ExpectedCompletion
Australia
Ivy and Eve Brisbane 33 472 450 95 348678 1H 2018
China
Hong Leong City Center (Phase 1)
Suzhou 100^ 1374 1038 76 1378891 Completed
Hong Leong City Center (Phase 2 ndash T2)
Suzhou 100^ 430 174 40 439716 Q4 2017
Hongqiao Royal Lake Shanghai 100 85 34 40 385394 Completed
China ndash Good Progress on Launched Luxury Projects
International Property Development
47
Shanghai ndash Hongqiao Royal Lake (御湖)
Eling Residences Chongqing
Stable sales despite tightening measures in Shanghai
34 units soldbooked with sales value of RMB 668 millionachieved to date
Chongqing ndash Eling Residences (鹅岭峰)
Launched in Oct 2016
8 units soldbooked with sales value of RMB 85 million ndashachieved highest average values of close to RMB 40000 psm
City Equity Stake
Total Units
Total Units Sold Booked
Sold
Expected Completion
Shanghai 100 85 34 40 Completed
Hongqiao Royal Lake Shanghai
City Equity Stake
Total Units
Total Units Sold Booked
Sold
Expected Completion
Chongqing 100 126 8 6 Q2 2017
Artistrsquos Impression
As of 19 Feb 2017
Chongqing ndash Huang Huayuan (黄花园)
Scheduled launch of mixed-use development with over 600 residential units in 2019
48
Over 150000 apartment listings spanning over 20 citiesin China
Offers one-stop solution for apartment owners andrental customers
Investment provides immediate entry into this fast-growing new economy sectorminus Complement business portfoliominus Contributes to future long-term recurring income stream
Synergies to be shared with the Grouprsquos properties inShanghai Suzhou and Chongqing
Strategic Acquisition of 20 Equity Stake in mamahome for RMB 100 million
Distrii ndash Leading Provider of Co-working Space Acquisition completed in Jan 2017
Currently 15 locations (13 Shanghai + 1 Beijing + 1 Hangzhou) 3700 seating capacity in total 10 locations in operation with 5 more locations to open in 1H 2017
Targeting to double the locations in China by end 2017
Current capacity of over 2200 seats has reached above 80 occupancy
Committed to lease over 60000 sq ft in Republic Plaza Expected to open in 1H 2018
Distrii Suhe Center Shanghai
Strategic Acquisition of 24 Equity Stake in Distrii for RMB 72 million
50
Purchase of a 100 equity stake in Shanghai MeidaoInvestment Co which owns the commercial projectthat is in the final stages of construction
Total transaction value of RMB 900 million throughCDL China Limited
Strategically located in Huacao Minhang Districtwithin the Hongqiao CBD ndash a new area established in2009 that spans 86 sq km and is one of Shanghairsquosfastest growing business areas
Project comprises five 9-storey office towers and twolevels of basement carpark with about 351 lots
Project has been approved for division into strata-titleunits
China ndashAcquisition of Shanghai Commercial Project for RMB 900 million
Artistrsquos ImpressionMeidao Business Plaza Shanghai
Meidao Business Plaza ShanghaiTenure Equity
StakeEst Total GFA
(sqm)Expected
Completion
50-year lease 100 32300 2H 2017
International Rental Properties
Artistrsquos Impression
Japan ndash Invested in 2 Prime Residential Projects in Tokyo
Located within prestigious Aoyama area withinMinato ward in Tokyo
Project targeted at high-end domestic and foreignbuyers
Good uptake with over 50 of units sold since itslaunch in Oct 2016
Tokyo ndashPark Court Aoyama The Tower
International Property Development
51
Artistrsquos ImpressionPark Court Aoyama The Tower Tokyo
Tokyo ndash ShirokaneTenure Equity Stake Site Area (sqm)
Freehold 947 16815
Discussions with potential JV partner for project development ongoing
City Equity Stake Total Units
Total Units Sold Expected Completion
Freehold 20 163 Over 50 1H 2018
As of 19 Feb 2017
Teddington Riverside Teddington TW11
Full planning received works on basement car park inadvanced stage
Block A (57 units) will be launched in Q2 2017 followed byanother five blocks
International Property Development
52
UK ndash Upcoming Launches in Q2 2017
Artistrsquos Impression
Tenure EquityStake
Total Units Est TotalSaleable Area
(sq ft)
Expected Completion
Freehold 100 220 240000 2018 (Phased)
Teddington Riverside London
Project Tenure Equity Stake
Total Units
Est TotalSaleable
Area (sq ft)
Expected Completion
Belgravia Freehold 100 6 12375 Q2 2017
Knightsbridge Freehold 100 3 5193 Q2 2017
Belgravia3135 Chesham Street London SW1X 8NQ
Knightsbridge32 Hans Road London SW3 1RW
Chelsea 90-100 Sydney Street London SW3 6NJ
International Property Development
53
UK ndash Pipeline Projects
Tenure EquityStake
Total Units Est TotalSaleable Area
(sq ft)
Expected Completion
Freehold 100 9 16143 Q2 2018
Stag Brewery London
Tenure Equity Stake Est Total Saleable Area (sq ft)
Freehold 100 1000000 sq ft
Stag Brewery Mortlake London SW14
Advanced master plan at public consultation stage
Planning applications to be submitted by end Q2 2017
Proposed scheme to comprise two phases Parameter plan covering the entire site Detailed planning application for Phase 1Artistrsquos Impression
Artistrsquos Impression
Good progress on works
Expected completion in Q2 2018
International Property Development
54
Tenure Equity Stake Total Units Est GFA (sq ft)
Freehold 100 34 135000
28 Pavilion Road Knightsbridge London SW1
First luxury home care development to be built in Central Londonndash planning consent obtained
Project on target to commence demolition works in Q2 2017Artistrsquos ImpressionPavilion Road
UK ndash Pipeline Projects
Development House
Planning application to be submitted in Q2 2017
Existing 28000 sq ft remains fully leased and vacantpossession expected from Q2 2018
Development House Leonard Street in Shoreditch
Tenure Equity Stake Est Total Lettable Area (sq ft)
Freehold 100 90000 sq ft
Artistrsquos Impression
Artistrsquos Impression
UK ndashAcquisition of 16-acre Ransomes Wharf site for pound58 million
Located within Battersearsquos creative quarter on theRiver Thames
Est GDV of pound222 million
Contracts completed purchase to be phased overthe next 18 months
Profit before tax pound108m pound109m (09) pound124m (129)
PATMI pound78m pound65m 200
Trading Performance
The Baileyrsquos Hotel London The Baileyrsquos Hotel London
Increase in reported revenue attributed to higher land sales in New Zealand and a higher contribution from Millennium Mitsui Garden Hotel Tokyo coupled with favourable foreign exchange movements as a result of weak pound against major currencies
MampC Hotel Operations
58
Trading Performance
RevPAR in reported currency was up by 66 but in constant currency fell by 23 for FY 2016 as compared to the same period last year
FY 2016 Reported Currency Constant CurrencyNew York pound14564 uarr 19 darr 99Regional US pound5749 uarr175 uarr 40Total US pound8652 uarr 83 darr 42London pound10718 darr 14 darr 14Rest of Europe pound5261 uarr 20 darr 16Total Europe pound8024 darr 08 darr 20Singapore pound8021 uarr 05 darr 101Rest of Asia pound6063 uarr 116 uarr 19Total Asia pound6821 uarr 62 darr 40Australasia pound5840 uarr 348 uarr 209Total Group pound7671 uarr 66 darr 23 Millennium Seoul Hilton
Copthorne Hotel amp Resort Queenstown Lakefront
Sheet1
Developments ndash Progressing well
The lifestyle hotel and serviced apartment has 306 and 209keys respectively
The building permit approval for Seoul Yangdong developmentproject has been received on 25 January 2017 Additionalcertification processes are expected to complete by mid 2017
The main contract tender process is planned to complete bymid 2017 before construction work starts
Seoul South Korea
59
Comprises a 263-room hotel and a 250-unit residentialapartment block
The final planning approval has been received in December2016
Currently reviewing the project costing and specification whichis anticipated to take about 18 months to complete aftercommencement
Sunnyvale US
MampC Hotel Operations
MampC Hotel Operations
60
ONE UN New York
Refurbishment of guestrooms in the east tower was completed in early Sep 2016 and the towers were re-opened in time for the UN General Assembly
Assets Enhancement (Completed)
Grand Copthorne Waterfront Hotel Singapore
Work on the main lobby and FampB outlets at the main entrance level was substantially completed in May 2016
Refurbishment of function rooms on level 2 started in Sep 2016 and completed in Dec 2016
M Hotel Singapore
Soft refurbishment of all guestrooms from level 12 to level 28 is complete with the last phase completed in Dec 2016
ONE UN New York
Grand Copthorne Waterfront Hotel Singapore
M Hotel Singapore
MampC Hotel Operations
61
Grand Millennium Kuala Lumpur
Soft refurbishment of guestrooms from level 9 to level 19 was completed at the beginning of the 4th quarter of 2016
Remaining guestrooms at level 7 and level 8 is planned to be refurbished in the mid 2017
Assets Enhancement (On-going)
Grand Millennium Kuala Lumpur
Copthorne Hotel Auckland Harbour City
Copthorne Hotel Auckland Harbour City
Closed for a major refurbishment programme in Q3 2015 at an estimated cost of NZ$40 million
The hotel will be rebranded as M Social Hotel Auckland and is expected to re-open in 2nd quarter of 2017
Artistrsquos Impression
Artistrsquos Impression
31 Dec 31 Dec 31 Dec 31 DecHotel and Room Count 2016 2015 2016 2015By region New York 4 4 2238 2238 Regional US 15 15 4559 4463 London 8 8 2651 2651 Rest of Europe 19 18 3081 2867 Middle East 26 22 7805 6450 Singapore 7 6 3011 2716 Rest of Asia 27 26 10036 9430 Australasia 25 27 3641 3903 Total 131 126 37022 34718
PipelineBy region Middle East 17 16 5465 4663 Rest of Asia 4 3 1608 1674 Regional USA 1 1 263 263 Rest of Europe 1 - 153 - Total 23 20 7489 6600
Hotels Rooms
Hotel Room Count and Pipeline
MampC Hotel Operations
Mainly management contracts
62
Millennium Biltmore Hotel Los Angeles
Grand Millennium Auckland
Sheet1
CDL Hospitality Trusts
63
S$rsquo000 FY 2016 FY 2015 Change
Gross Revenue 180857 172410 49
Net Property Income (NPI) 137560 137003 04
Trading Performance
Hilton Cambridge City Centre ndash Executive Lounge
Artistrsquos Impression
Gross revenue and NPI increased mainly due to Inorganic contribution from Hilton Cambridge City Centre United Kingdom which
was acquired on 1 Oct 2015 Strong contribution from New Zealand hotels as a result of higher variable rental
income Incremental income boost from Japan hotels and Claymore Connect retail mall
This was partially offset by Continued weakness in Singapore and Maldives markets due to soft trading
conditions amid the global economic slowdown Lower contribution from Australia due to weaker AUD and lower variable income
contribution for FY 2016
Artistrsquos Impression
Disclaimer
This document may contain forward-looking statements that involve assumptions risks and uncertainties Actual future performance outcomes and results may differ materially from those expressed in forward-looking statements as a result of a number of risks uncertainties and assumptions Representative examples of these factors include (without limitation) general industry and economic conditions interest rate trends cost of capital and capital availability availability of real estate properties competition from other developments or companies shifts in customer demands customers and partners expected levels of occupancy rate property rental income charge out collections changes in operating expenses (including employee wages benefits and training costs) governmental and public policy changes and the continued availability of financing in the amounts and the terms necessary to support future business You are cautioned not to place undue reliance on these forward-looking statements which are based on the current view of management on future events Numbers in tables and charts may not add up due to rounding
Gramercy Park Singaporewwwcdlcomsg
Slide Number 1
Slide Number 2
Slide Number 3
Slide Number 4
Slide Number 5
Slide Number 6
Slide Number 7
Slide Number 8
Slide Number 9
Slide Number 10
Slide Number 11
Slide Number 12
Slide Number 13
Slide Number 14
Slide Number 15
Slide Number 16
Slide Number 17
Slide Number 18
Slide Number 19
Slide Number 20
Slide Number 21
Slide Number 22
Slide Number 23
Slide Number 24
Slide Number 25
Slide Number 26
Slide Number 27
Slide Number 28
Slide Number 29
Slide Number 30
Slide Number 31
Slide Number 32
Slide Number 33
Slide Number 34
Slide Number 35
Slide Number 36
Slide Number 37
Slide Number 38
Slide Number 39
Slide Number 40
Slide Number 41
Slide Number 42
Slide Number 43
Slide Number 44
Slide Number 45
Slide Number 46
Slide Number 47
Slide Number 48
Slide Number 49
Slide Number 50
Slide Number 51
Slide Number 52
Slide Number 53
Slide Number 54
Slide Number 55
Slide Number 56
Slide Number 57
Slide Number 58
Slide Number 59
Slide Number 60
Slide Number 61
Slide Number 62
Slide Number 63
Slide Number 64
Slide Number 65
Hotels
Rooms
31 Dec
31 Dec
31 Dec
31 Dec
Hotel and Room Count
2016
2015
2016
2015
By region
New York
4
4
2238
2238
Regional US
15
15
4559
4463
London
8
8
2651
2651
Rest of Europe
19
18
3081
2867
Middle East
26
22
7805
6450
Singapore
7
6
3011
2716
Rest of Asia
27
26
10036
9430
Australasia
25
27
3641
3903
Total
131
126
37022
34718
Pipeline
By region
Middle East
17
16
5465
4663
Rest of Asia
4
3
1608
1674
Regional USA
1
1
263
263
Rest of Europe
1
- 0
153
- 0
Total
23
20
7489
6600
FY 2016
Reported Currency
Constant Currency
New York
pound14564
uarr 19
darr 99
Regional US
pound5749
uarr175
uarr 40
Total US
pound8652
uarr 83
darr 42
London
pound10718
darr 14
darr 14
Rest of Europe
pound5261
uarr 20
darr 16
Total Europe
pound8024
darr 08
darr 20
Singapore
pound8021
uarr 05
darr 101
Rest of Asia
pound6063
uarr 116
uarr 19
Total Asia
pound6821
uarr 62
darr 40
Australasia
pound5840
uarr 348
uarr 209
Total Group
pound7671
uarr 66
darr 23
Project
Equity Stake
Total Units
Units Sold
Sold
Total Unsold Inventory
CDLrsquos Share of Unsold Inventory
St Regis Residences
33
173
161
93
12
4
The Oceanfront Sentosa Cove
50
264
263
99
1
05
One Shenton
100
341
327
96
14
14
Cliveden at Grange
100
110
44
40
66
66
UPRobertson Quay
100
70
57
81
13
13
Echelon
50
508
506
100
2
1
DNest
51
912
904
99
8
408
Jewel Buangkok
100
616
616
100
0
0
The Venue Shoppes
60
28
16
57
12
72
The Venue Residences
60
266
181
68
85
51
Coco Palms
51
944
865
92
79
4029
The Brownstone Executive Condo
70
638
519
81
119
833
The Criterion Executive Condo
70
505
179
35
326
2282
Gramercy Park
100
174
46
53^
41^
41^
(Phase 1 = 87-unit North Tower)
Forest Woods
50
519
382
74
137
685
Bartley Ridge
30
868
868
100
0
0
Commonwealth Towers
30
845
461
55
384
1152
TOTAL
7781
6395
1299
7373
0
4000
8000
12000
16000
20000
2012 2013 2014 2015 2016
Not Launched
Launched amp Unsold
Num
ber o
f Uni
ts
17467
Source URA Q4 2016
16587
Launched amp Unsold
Not Launched
Total
2012 5137 8807 13944
2013 6124 11343 17467
2014 5750 10837 16587
2015 5736 9763 15499
2016 5206 7035 12241
26
13944
Singapore Property MarketNo of Uncompleted Private Residential Units Available (2012 ndash 2016)
Launch timing unknown and may not materialise
15499
12241
Includes share of JV partners
Singapore Property DevelopmentResidential Units Sold
27
Sales Value$rsquo000
No ofUnits
TotalArea Sold
(sq ft)
FY 2016 $ 1245723 1017 974666
FY 2015 $ 691507 674 712558
Gramercy Park ndash Positive Response to Phase 1
28
Singapore Property Development
Project Location Tenure Equity Stake
Total Units
Total Units Sold
Sold
Total Saleable Area (sq ft)
Gramercy Park Grange Road Freehold 100 174 56 32 368743
As of 19 Feb 2017
Phase 2 Launch by 1H 2017
Good uptake with 56 units sold to date
All 87 units in North Tower released to date (64 sold)
87-unit South Tower (Phase 2) slated for launch by 1H 2017
Gramercy Park
One of 2016rsquos Bestselling Residential Projects
29
Singapore Property Development
Artistrsquos Impression
Artistrsquos ImpressionForest Woods
Project Location Tenure Equity Stake
Total Units
Total Units Sold
Sold
Total Saleable Area (sq ft)
Expected TOP
Forest Woods LorongLew Lian
99-year leasehold
50 519 392 76 431265 2021
As of 19 Feb 2017
Strong Uptake
Launched in Oct 2016 and 76 soldto-date
Achieved average selling price of about$1400 psf
All 1-bedroom + study 2-bedroomapartment types and penthouses havebeen sold
Remaining units comprise of 2-bedroom + study to 4-bedroom unittypes
Completed Residential Projects in 2016
30
Project Location Equity Stake
Total Units
Sold
TOPObtained
HAUSSERANGOONGARDEN
Serangoon Garden Close
70 97 Terraces
100 Mar 2016
The Inflora Flora Drive 33 396 100 Apr 2016
Gramercy Park Grange Road 100 174 32 May 2016
Lush Acres(Executive Condo)
Fernvale Close 100 380 100 Jun 2016
Jewel Buangkok Compassvale Bow 100 616 100 Aug 2016
Echelon Alexandra View 50 508 99 Sep 2016
Bartley Ridge Mount Vernon Road
30 868 100 Oct 2016
South Beach Residences Beach Road 501 190 -^ Dec 2016
Singapore Property Development
Echelon
As of 19 Feb 2017^ Not launched yet
Upcoming Residential Project Launch for 2H 2017 (Subject to market conditions)
31
Singapore Property Development
Artistrsquos Impression
Upmarket freehold condominium in District 9 designedby world-renowned architect SOM
Comprises 124 units in two iconic 36-storey towers withsix sky terraces
5-minutes walk from Orchard Road
All apartments enjoy private lift access and are fittedwith premium finishes and branded appliances
Artistrsquos ImpressionNew Futura
Project Location Tenure Equity Stake
Total Units
Gross Floor Area (sqm)
Expected TOP
New Futura Leonie Hill Road Freehold 100 124 23066 2017
Inventory of Launched Residential Projects ndashAs of 31 Dec 2016
32
Singapore Property Development
Leasing strategy implemented ^ Based on launched units
Note Above excludes inventory from The Residences at W Singapore ndash Sentosa Cove (203 units) unlaunched projects Nouvel 18 (156 units) and New Futura (124 units)
Sheet1
110
115
120
125
130
135
140
145
Q112
Q212
Q312
Q412
Q113
Q213
Q313
Q413
Q114
Q214
Q314
Q414
Q115
Q215
Q315
Q415
Q116
Q216
Q316
Q416
Office Retail
Source URA Q4 2016
33
Singapore Commercial MarketProperty Price Index ndash Commercial (2012ndash 2016)
Q4 161226
Q4 16 1347
Q3 161223
Q3 16 1355
Source JLL Research Q4 2016
$974
$1051$1204
$1038$914
$790 $837$926
$850$777
000
200
400
600
800
1000
1200
1400
2012 2013 2014 2015 2016
Marina Bay Raffles Place(Grade A)
Whole Island
34
Singapore Office MarketAverage Office Rental in CBD (2012 ndash 2016)
Office Space Demand amp Supply (2012 ndash 2016)Private amp Public Sector
78254 80095 81300 81365 83206
7091372205 72980 73647 73938
30000
35000
40000
45000
50000
55000
60000
65000
70000
75000
80000
85000
2012 2013 2014 2015 2016
Cumulative Supply Occupancy
Source URA Q4 2016
Singapore Office Market
CDLrsquos Office Properties Occupancy
959(National Average = 889)
35
Occupancy as of 31 Dec 2016
2017 2018 2019
33 28 25
Expiry of NLA
36
CDLrsquos Office Space ndash Lease Expiry Profile (2017 ndash 2019)
Rental Properties
Office Portfolio NLA ~2300000 sq ft
16Properties^
959Occupancy
As of 31 December 2016
Note Properties include -Republic Plaza Central Mall (Office Tower) City House Fuji Xerox Towers Manulife Centre Palais Renaissance Tanglin Shopping Centre The Arcade Katong Shopping Centre Kingrsquos Centre 7 amp 9 Tampines Grande 11 Tampines Concourse Sunshine Plaza Fortune Centre Golden Mile Complex Central Mall Conservation Unit
Based on contractual expiry dates Renewals will be negotiated nearer to expiry Tenants may renew their leases or increasereduce space or exit ^ Properties include strata-titled units owned and managed by CDL
60052
61333
6365864271
65079
57060
58599
59955 5963260192
52000
54000
56000
58000
60000
62000
64000
66000
2012 2013 2014 2015 2016
Cumulative Supply Occupancy
Retail Space Demand amp Supply (2012 ndash 2016)Private amp Public Sector
Source URA Q4 2016
With effect from Q1 2014 the coverage of retail space has been expanded to include non-shop retail uses and data are available from2011 onwards
Singapore Retail Market
CDLrsquos Retail Properties Occupancy
964(National Average = 925)
37
Occupancy as of 31 Dec 2016
38
CDLrsquos Retail Space ndash Lease Expiry Profile (2017 ndash 2019)
2017 2018 2019
2332 31
Expiry of NLA
Rental Properties
Retail Portfolio NLA ~840000 sq ft
19Properties^
964Occupancy
As of 31 December 2016
Based on contractual expiry dates Renewals will be negotiated nearer to expiry Tenants may renew their leases or increasereduce space or exit ^ Properties include strata-titled units owned and managed by CDL
Note Properties include ndashRepublic Plaza Central Mall (Office Tower) City Square Mall Palais Renaissance Tanglin Shopping Centre The Arcade Katong Shopping Centre Kingrsquos Centre Quayside Isle Grand Copthorne Waterfront (Waterfront Plaza) City Plaza Golden Mile Complex Central Mall Conservation Unit 7 amp 9 Tampines Grande City House Fortune Centre Manulife Centre Fuji Xerox Towers
39
Revenue by Sector for Full Year (2014 ndash 2016)
0
50
100
150
200
250
300
FY 2016 FY 2015 FY 2014
152187 176
110 113 111
7 8 8
74 75 65
24 23 25
S$ m
illio
n
Office
Retail
Industrial
REITHotel
Others ^
$367m $406m $385m
FY 2016 FY 2015 FY 2014
Office 41 46 46
Retail 30 28 29
Industrial 2 2 2
REITHotel 20 18 17
Others ^ 7 6 6
^ Including car park serviced apartments and residential
Rental Properties
40
EBITDA by Sector for Full Year (2014 ndash 2016)
050
100150200250300350400450500550600
FY 2016 FY 2015 FY 2014
185
446 ~
10175 64 91
5 4 453 58 53
6 15 19
S$ m
illio
n
Office
Retail
Industrial
REITHotel
Others ^
$324m $587m $268m
FY 2016 FY 2015 FY 2014
Office 57 76 38
Retail 23 11 34
Industrial 2 - 1
REITHotel 16 10 20
Others ^ 2 3 7
~ Includes gain on sale of Profit Participation Securities^ Including car park serviced apartments and residential
Rental Properties
South Beach
41
JW Marriott Hotel Singapore South Beach
JW Marriott Hotel Singapore South Beach
Rebranded hotel soft opened in mid-Dec2016
Business performance is within expectations
Ongoing works at NCO Club are expected tocomplete by Q3 2017 along with theremodelled Ballroom
South Beach Residences
190-unit luxury residence may be launchedin 2H 2017 subject to market conditions
Fully Completed in December 2016
Strong Performance for Office amp Retail
South Beach Tower (510000 sq ft office space) and retail space are fully leased
INTERNATIONAL OVERVIEW
Projects Launched To Date
43
Project City Equity Stake
Total Units
Total Units Sold
Booked
Sold Est TotalSaleable
Area (sq ft)
ExpectedCompletion
Australia
Ivy and Eve Brisbane 33 472 450 95 348678 1H 2018
China
Hong Leong City Center (Phase 1)
Suzhou 100^ 1374 1038 76 1378891 Completed
Hong Leong City Center (Phase 2 ndash T2)
Suzhou 100^ 430 174 40 439716 Q4 2017
Hongqiao Royal Lake Shanghai 100 85 34 40 385394 Completed
China ndash Good Progress on Launched Luxury Projects
International Property Development
47
Shanghai ndash Hongqiao Royal Lake (御湖)
Eling Residences Chongqing
Stable sales despite tightening measures in Shanghai
34 units soldbooked with sales value of RMB 668 millionachieved to date
Chongqing ndash Eling Residences (鹅岭峰)
Launched in Oct 2016
8 units soldbooked with sales value of RMB 85 million ndashachieved highest average values of close to RMB 40000 psm
City Equity Stake
Total Units
Total Units Sold Booked
Sold
Expected Completion
Shanghai 100 85 34 40 Completed
Hongqiao Royal Lake Shanghai
City Equity Stake
Total Units
Total Units Sold Booked
Sold
Expected Completion
Chongqing 100 126 8 6 Q2 2017
Artistrsquos Impression
As of 19 Feb 2017
Chongqing ndash Huang Huayuan (黄花园)
Scheduled launch of mixed-use development with over 600 residential units in 2019
48
Over 150000 apartment listings spanning over 20 citiesin China
Offers one-stop solution for apartment owners andrental customers
Investment provides immediate entry into this fast-growing new economy sectorminus Complement business portfoliominus Contributes to future long-term recurring income stream
Synergies to be shared with the Grouprsquos properties inShanghai Suzhou and Chongqing
Strategic Acquisition of 20 Equity Stake in mamahome for RMB 100 million
Distrii ndash Leading Provider of Co-working Space Acquisition completed in Jan 2017
Currently 15 locations (13 Shanghai + 1 Beijing + 1 Hangzhou) 3700 seating capacity in total 10 locations in operation with 5 more locations to open in 1H 2017
Targeting to double the locations in China by end 2017
Current capacity of over 2200 seats has reached above 80 occupancy
Committed to lease over 60000 sq ft in Republic Plaza Expected to open in 1H 2018
Distrii Suhe Center Shanghai
Strategic Acquisition of 24 Equity Stake in Distrii for RMB 72 million
50
Purchase of a 100 equity stake in Shanghai MeidaoInvestment Co which owns the commercial projectthat is in the final stages of construction
Total transaction value of RMB 900 million throughCDL China Limited
Strategically located in Huacao Minhang Districtwithin the Hongqiao CBD ndash a new area established in2009 that spans 86 sq km and is one of Shanghairsquosfastest growing business areas
Project comprises five 9-storey office towers and twolevels of basement carpark with about 351 lots
Project has been approved for division into strata-titleunits
China ndashAcquisition of Shanghai Commercial Project for RMB 900 million
Artistrsquos ImpressionMeidao Business Plaza Shanghai
Meidao Business Plaza ShanghaiTenure Equity
StakeEst Total GFA
(sqm)Expected
Completion
50-year lease 100 32300 2H 2017
International Rental Properties
Artistrsquos Impression
Japan ndash Invested in 2 Prime Residential Projects in Tokyo
Located within prestigious Aoyama area withinMinato ward in Tokyo
Project targeted at high-end domestic and foreignbuyers
Good uptake with over 50 of units sold since itslaunch in Oct 2016
Tokyo ndashPark Court Aoyama The Tower
International Property Development
51
Artistrsquos ImpressionPark Court Aoyama The Tower Tokyo
Tokyo ndash ShirokaneTenure Equity Stake Site Area (sqm)
Freehold 947 16815
Discussions with potential JV partner for project development ongoing
City Equity Stake Total Units
Total Units Sold Expected Completion
Freehold 20 163 Over 50 1H 2018
As of 19 Feb 2017
Teddington Riverside Teddington TW11
Full planning received works on basement car park inadvanced stage
Block A (57 units) will be launched in Q2 2017 followed byanother five blocks
International Property Development
52
UK ndash Upcoming Launches in Q2 2017
Artistrsquos Impression
Tenure EquityStake
Total Units Est TotalSaleable Area
(sq ft)
Expected Completion
Freehold 100 220 240000 2018 (Phased)
Teddington Riverside London
Project Tenure Equity Stake
Total Units
Est TotalSaleable
Area (sq ft)
Expected Completion
Belgravia Freehold 100 6 12375 Q2 2017
Knightsbridge Freehold 100 3 5193 Q2 2017
Belgravia3135 Chesham Street London SW1X 8NQ
Knightsbridge32 Hans Road London SW3 1RW
Chelsea 90-100 Sydney Street London SW3 6NJ
International Property Development
53
UK ndash Pipeline Projects
Tenure EquityStake
Total Units Est TotalSaleable Area
(sq ft)
Expected Completion
Freehold 100 9 16143 Q2 2018
Stag Brewery London
Tenure Equity Stake Est Total Saleable Area (sq ft)
Freehold 100 1000000 sq ft
Stag Brewery Mortlake London SW14
Advanced master plan at public consultation stage
Planning applications to be submitted by end Q2 2017
Proposed scheme to comprise two phases Parameter plan covering the entire site Detailed planning application for Phase 1Artistrsquos Impression
Artistrsquos Impression
Good progress on works
Expected completion in Q2 2018
International Property Development
54
Tenure Equity Stake Total Units Est GFA (sq ft)
Freehold 100 34 135000
28 Pavilion Road Knightsbridge London SW1
First luxury home care development to be built in Central Londonndash planning consent obtained
Project on target to commence demolition works in Q2 2017Artistrsquos ImpressionPavilion Road
UK ndash Pipeline Projects
Development House
Planning application to be submitted in Q2 2017
Existing 28000 sq ft remains fully leased and vacantpossession expected from Q2 2018
Development House Leonard Street in Shoreditch
Tenure Equity Stake Est Total Lettable Area (sq ft)
Freehold 100 90000 sq ft
Artistrsquos Impression
Artistrsquos Impression
UK ndashAcquisition of 16-acre Ransomes Wharf site for pound58 million
Located within Battersearsquos creative quarter on theRiver Thames
Est GDV of pound222 million
Contracts completed purchase to be phased overthe next 18 months
Profit before tax pound108m pound109m (09) pound124m (129)
PATMI pound78m pound65m 200
Trading Performance
The Baileyrsquos Hotel London The Baileyrsquos Hotel London
Increase in reported revenue attributed to higher land sales in New Zealand and a higher contribution from Millennium Mitsui Garden Hotel Tokyo coupled with favourable foreign exchange movements as a result of weak pound against major currencies
MampC Hotel Operations
58
Trading Performance
RevPAR in reported currency was up by 66 but in constant currency fell by 23 for FY 2016 as compared to the same period last year
FY 2016 Reported Currency Constant CurrencyNew York pound14564 uarr 19 darr 99Regional US pound5749 uarr175 uarr 40Total US pound8652 uarr 83 darr 42London pound10718 darr 14 darr 14Rest of Europe pound5261 uarr 20 darr 16Total Europe pound8024 darr 08 darr 20Singapore pound8021 uarr 05 darr 101Rest of Asia pound6063 uarr 116 uarr 19Total Asia pound6821 uarr 62 darr 40Australasia pound5840 uarr 348 uarr 209Total Group pound7671 uarr 66 darr 23 Millennium Seoul Hilton
Copthorne Hotel amp Resort Queenstown Lakefront
Sheet1
Developments ndash Progressing well
The lifestyle hotel and serviced apartment has 306 and 209keys respectively
The building permit approval for Seoul Yangdong developmentproject has been received on 25 January 2017 Additionalcertification processes are expected to complete by mid 2017
The main contract tender process is planned to complete bymid 2017 before construction work starts
Seoul South Korea
59
Comprises a 263-room hotel and a 250-unit residentialapartment block
The final planning approval has been received in December2016
Currently reviewing the project costing and specification whichis anticipated to take about 18 months to complete aftercommencement
Sunnyvale US
MampC Hotel Operations
MampC Hotel Operations
60
ONE UN New York
Refurbishment of guestrooms in the east tower was completed in early Sep 2016 and the towers were re-opened in time for the UN General Assembly
Assets Enhancement (Completed)
Grand Copthorne Waterfront Hotel Singapore
Work on the main lobby and FampB outlets at the main entrance level was substantially completed in May 2016
Refurbishment of function rooms on level 2 started in Sep 2016 and completed in Dec 2016
M Hotel Singapore
Soft refurbishment of all guestrooms from level 12 to level 28 is complete with the last phase completed in Dec 2016
ONE UN New York
Grand Copthorne Waterfront Hotel Singapore
M Hotel Singapore
MampC Hotel Operations
61
Grand Millennium Kuala Lumpur
Soft refurbishment of guestrooms from level 9 to level 19 was completed at the beginning of the 4th quarter of 2016
Remaining guestrooms at level 7 and level 8 is planned to be refurbished in the mid 2017
Assets Enhancement (On-going)
Grand Millennium Kuala Lumpur
Copthorne Hotel Auckland Harbour City
Copthorne Hotel Auckland Harbour City
Closed for a major refurbishment programme in Q3 2015 at an estimated cost of NZ$40 million
The hotel will be rebranded as M Social Hotel Auckland and is expected to re-open in 2nd quarter of 2017
Artistrsquos Impression
Artistrsquos Impression
31 Dec 31 Dec 31 Dec 31 DecHotel and Room Count 2016 2015 2016 2015By region New York 4 4 2238 2238 Regional US 15 15 4559 4463 London 8 8 2651 2651 Rest of Europe 19 18 3081 2867 Middle East 26 22 7805 6450 Singapore 7 6 3011 2716 Rest of Asia 27 26 10036 9430 Australasia 25 27 3641 3903 Total 131 126 37022 34718
PipelineBy region Middle East 17 16 5465 4663 Rest of Asia 4 3 1608 1674 Regional USA 1 1 263 263 Rest of Europe 1 - 153 - Total 23 20 7489 6600
Hotels Rooms
Hotel Room Count and Pipeline
MampC Hotel Operations
Mainly management contracts
62
Millennium Biltmore Hotel Los Angeles
Grand Millennium Auckland
Sheet1
CDL Hospitality Trusts
63
S$rsquo000 FY 2016 FY 2015 Change
Gross Revenue 180857 172410 49
Net Property Income (NPI) 137560 137003 04
Trading Performance
Hilton Cambridge City Centre ndash Executive Lounge
Artistrsquos Impression
Gross revenue and NPI increased mainly due to Inorganic contribution from Hilton Cambridge City Centre United Kingdom which
was acquired on 1 Oct 2015 Strong contribution from New Zealand hotels as a result of higher variable rental
income Incremental income boost from Japan hotels and Claymore Connect retail mall
This was partially offset by Continued weakness in Singapore and Maldives markets due to soft trading
conditions amid the global economic slowdown Lower contribution from Australia due to weaker AUD and lower variable income
contribution for FY 2016
Artistrsquos Impression
Disclaimer
This document may contain forward-looking statements that involve assumptions risks and uncertainties Actual future performance outcomes and results may differ materially from those expressed in forward-looking statements as a result of a number of risks uncertainties and assumptions Representative examples of these factors include (without limitation) general industry and economic conditions interest rate trends cost of capital and capital availability availability of real estate properties competition from other developments or companies shifts in customer demands customers and partners expected levels of occupancy rate property rental income charge out collections changes in operating expenses (including employee wages benefits and training costs) governmental and public policy changes and the continued availability of financing in the amounts and the terms necessary to support future business You are cautioned not to place undue reliance on these forward-looking statements which are based on the current view of management on future events Numbers in tables and charts may not add up due to rounding
Gramercy Park Singaporewwwcdlcomsg
Slide Number 1
Slide Number 2
Slide Number 3
Slide Number 4
Slide Number 5
Slide Number 6
Slide Number 7
Slide Number 8
Slide Number 9
Slide Number 10
Slide Number 11
Slide Number 12
Slide Number 13
Slide Number 14
Slide Number 15
Slide Number 16
Slide Number 17
Slide Number 18
Slide Number 19
Slide Number 20
Slide Number 21
Slide Number 22
Slide Number 23
Slide Number 24
Slide Number 25
Slide Number 26
Slide Number 27
Slide Number 28
Slide Number 29
Slide Number 30
Slide Number 31
Slide Number 32
Slide Number 33
Slide Number 34
Slide Number 35
Slide Number 36
Slide Number 37
Slide Number 38
Slide Number 39
Slide Number 40
Slide Number 41
Slide Number 42
Slide Number 43
Slide Number 44
Slide Number 45
Slide Number 46
Slide Number 47
Slide Number 48
Slide Number 49
Slide Number 50
Slide Number 51
Slide Number 52
Slide Number 53
Slide Number 54
Slide Number 55
Slide Number 56
Slide Number 57
Slide Number 58
Slide Number 59
Slide Number 60
Slide Number 61
Slide Number 62
Slide Number 63
Slide Number 64
Slide Number 65
Hotels
Rooms
31 Dec
31 Dec
31 Dec
31 Dec
Hotel and Room Count
2016
2015
2016
2015
By region
New York
4
4
2238
2238
Regional US
15
15
4559
4463
London
8
8
2651
2651
Rest of Europe
19
18
3081
2867
Middle East
26
22
7805
6450
Singapore
7
6
3011
2716
Rest of Asia
27
26
10036
9430
Australasia
25
27
3641
3903
Total
131
126
37022
34718
Pipeline
By region
Middle East
17
16
5465
4663
Rest of Asia
4
3
1608
1674
Regional USA
1
1
263
263
Rest of Europe
1
- 0
153
- 0
Total
23
20
7489
6600
FY 2016
Reported Currency
Constant Currency
New York
pound14564
uarr 19
darr 99
Regional US
pound5749
uarr175
uarr 40
Total US
pound8652
uarr 83
darr 42
London
pound10718
darr 14
darr 14
Rest of Europe
pound5261
uarr 20
darr 16
Total Europe
pound8024
darr 08
darr 20
Singapore
pound8021
uarr 05
darr 101
Rest of Asia
pound6063
uarr 116
uarr 19
Total Asia
pound6821
uarr 62
darr 40
Australasia
pound5840
uarr 348
uarr 209
Total Group
pound7671
uarr 66
darr 23
Project
Equity Stake
Total Units
Units Sold
Sold
Total Unsold Inventory
CDLrsquos Share of Unsold Inventory
St Regis Residences
33
173
161
93
12
4
The Oceanfront Sentosa Cove
50
264
263
99
1
05
One Shenton
100
341
327
96
14
14
Cliveden at Grange
100
110
44
40
66
66
UPRobertson Quay
100
70
57
81
13
13
Echelon
50
508
506
100
2
1
DNest
51
912
904
99
8
408
Jewel Buangkok
100
616
616
100
0
0
The Venue Shoppes
60
28
16
57
12
72
The Venue Residences
60
266
181
68
85
51
Coco Palms
51
944
865
92
79
4029
The Brownstone Executive Condo
70
638
519
81
119
833
The Criterion Executive Condo
70
505
179
35
326
2282
Gramercy Park
100
174
46
53^
41^
41^
(Phase 1 = 87-unit North Tower)
Forest Woods
50
519
382
74
137
685
Bartley Ridge
30
868
868
100
0
0
Commonwealth Towers
30
845
461
55
384
1152
TOTAL
7781
6395
1299
7373
Upcoming Residential Project Launch for 2H 2017 (Subject to market conditions)
31
Singapore Property Development
Artistrsquos Impression
Upmarket freehold condominium in District 9 designedby world-renowned architect SOM
Comprises 124 units in two iconic 36-storey towers withsix sky terraces
5-minutes walk from Orchard Road
All apartments enjoy private lift access and are fittedwith premium finishes and branded appliances
Artistrsquos ImpressionNew Futura
Project Location Tenure Equity Stake
Total Units
Gross Floor Area (sqm)
Expected TOP
New Futura Leonie Hill Road Freehold 100 124 23066 2017
Inventory of Launched Residential Projects ndashAs of 31 Dec 2016
32
Singapore Property Development
Leasing strategy implemented ^ Based on launched units
Note Above excludes inventory from The Residences at W Singapore ndash Sentosa Cove (203 units) unlaunched projects Nouvel 18 (156 units) and New Futura (124 units)
Sheet1
110
115
120
125
130
135
140
145
Q112
Q212
Q312
Q412
Q113
Q213
Q313
Q413
Q114
Q214
Q314
Q414
Q115
Q215
Q315
Q415
Q116
Q216
Q316
Q416
Office Retail
Source URA Q4 2016
33
Singapore Commercial MarketProperty Price Index ndash Commercial (2012ndash 2016)
Q4 161226
Q4 16 1347
Q3 161223
Q3 16 1355
Source JLL Research Q4 2016
$974
$1051$1204
$1038$914
$790 $837$926
$850$777
000
200
400
600
800
1000
1200
1400
2012 2013 2014 2015 2016
Marina Bay Raffles Place(Grade A)
Whole Island
34
Singapore Office MarketAverage Office Rental in CBD (2012 ndash 2016)
Office Space Demand amp Supply (2012 ndash 2016)Private amp Public Sector
78254 80095 81300 81365 83206
7091372205 72980 73647 73938
30000
35000
40000
45000
50000
55000
60000
65000
70000
75000
80000
85000
2012 2013 2014 2015 2016
Cumulative Supply Occupancy
Source URA Q4 2016
Singapore Office Market
CDLrsquos Office Properties Occupancy
959(National Average = 889)
35
Occupancy as of 31 Dec 2016
2017 2018 2019
33 28 25
Expiry of NLA
36
CDLrsquos Office Space ndash Lease Expiry Profile (2017 ndash 2019)
Rental Properties
Office Portfolio NLA ~2300000 sq ft
16Properties^
959Occupancy
As of 31 December 2016
Note Properties include -Republic Plaza Central Mall (Office Tower) City House Fuji Xerox Towers Manulife Centre Palais Renaissance Tanglin Shopping Centre The Arcade Katong Shopping Centre Kingrsquos Centre 7 amp 9 Tampines Grande 11 Tampines Concourse Sunshine Plaza Fortune Centre Golden Mile Complex Central Mall Conservation Unit
Based on contractual expiry dates Renewals will be negotiated nearer to expiry Tenants may renew their leases or increasereduce space or exit ^ Properties include strata-titled units owned and managed by CDL
60052
61333
6365864271
65079
57060
58599
59955 5963260192
52000
54000
56000
58000
60000
62000
64000
66000
2012 2013 2014 2015 2016
Cumulative Supply Occupancy
Retail Space Demand amp Supply (2012 ndash 2016)Private amp Public Sector
Source URA Q4 2016
With effect from Q1 2014 the coverage of retail space has been expanded to include non-shop retail uses and data are available from2011 onwards
Singapore Retail Market
CDLrsquos Retail Properties Occupancy
964(National Average = 925)
37
Occupancy as of 31 Dec 2016
38
CDLrsquos Retail Space ndash Lease Expiry Profile (2017 ndash 2019)
2017 2018 2019
2332 31
Expiry of NLA
Rental Properties
Retail Portfolio NLA ~840000 sq ft
19Properties^
964Occupancy
As of 31 December 2016
Based on contractual expiry dates Renewals will be negotiated nearer to expiry Tenants may renew their leases or increasereduce space or exit ^ Properties include strata-titled units owned and managed by CDL
Note Properties include ndashRepublic Plaza Central Mall (Office Tower) City Square Mall Palais Renaissance Tanglin Shopping Centre The Arcade Katong Shopping Centre Kingrsquos Centre Quayside Isle Grand Copthorne Waterfront (Waterfront Plaza) City Plaza Golden Mile Complex Central Mall Conservation Unit 7 amp 9 Tampines Grande City House Fortune Centre Manulife Centre Fuji Xerox Towers
39
Revenue by Sector for Full Year (2014 ndash 2016)
0
50
100
150
200
250
300
FY 2016 FY 2015 FY 2014
152187 176
110 113 111
7 8 8
74 75 65
24 23 25
S$ m
illio
n
Office
Retail
Industrial
REITHotel
Others ^
$367m $406m $385m
FY 2016 FY 2015 FY 2014
Office 41 46 46
Retail 30 28 29
Industrial 2 2 2
REITHotel 20 18 17
Others ^ 7 6 6
^ Including car park serviced apartments and residential
Rental Properties
40
EBITDA by Sector for Full Year (2014 ndash 2016)
050
100150200250300350400450500550600
FY 2016 FY 2015 FY 2014
185
446 ~
10175 64 91
5 4 453 58 53
6 15 19
S$ m
illio
n
Office
Retail
Industrial
REITHotel
Others ^
$324m $587m $268m
FY 2016 FY 2015 FY 2014
Office 57 76 38
Retail 23 11 34
Industrial 2 - 1
REITHotel 16 10 20
Others ^ 2 3 7
~ Includes gain on sale of Profit Participation Securities^ Including car park serviced apartments and residential
Rental Properties
South Beach
41
JW Marriott Hotel Singapore South Beach
JW Marriott Hotel Singapore South Beach
Rebranded hotel soft opened in mid-Dec2016
Business performance is within expectations
Ongoing works at NCO Club are expected tocomplete by Q3 2017 along with theremodelled Ballroom
South Beach Residences
190-unit luxury residence may be launchedin 2H 2017 subject to market conditions
Fully Completed in December 2016
Strong Performance for Office amp Retail
South Beach Tower (510000 sq ft office space) and retail space are fully leased
INTERNATIONAL OVERVIEW
Projects Launched To Date
43
Project City Equity Stake
Total Units
Total Units Sold
Booked
Sold Est TotalSaleable
Area (sq ft)
ExpectedCompletion
Australia
Ivy and Eve Brisbane 33 472 450 95 348678 1H 2018
China
Hong Leong City Center (Phase 1)
Suzhou 100^ 1374 1038 76 1378891 Completed
Hong Leong City Center (Phase 2 ndash T2)
Suzhou 100^ 430 174 40 439716 Q4 2017
Hongqiao Royal Lake Shanghai 100 85 34 40 385394 Completed
China ndash Good Progress on Launched Luxury Projects
International Property Development
47
Shanghai ndash Hongqiao Royal Lake (御湖)
Eling Residences Chongqing
Stable sales despite tightening measures in Shanghai
34 units soldbooked with sales value of RMB 668 millionachieved to date
Chongqing ndash Eling Residences (鹅岭峰)
Launched in Oct 2016
8 units soldbooked with sales value of RMB 85 million ndashachieved highest average values of close to RMB 40000 psm
City Equity Stake
Total Units
Total Units Sold Booked
Sold
Expected Completion
Shanghai 100 85 34 40 Completed
Hongqiao Royal Lake Shanghai
City Equity Stake
Total Units
Total Units Sold Booked
Sold
Expected Completion
Chongqing 100 126 8 6 Q2 2017
Artistrsquos Impression
As of 19 Feb 2017
Chongqing ndash Huang Huayuan (黄花园)
Scheduled launch of mixed-use development with over 600 residential units in 2019
48
Over 150000 apartment listings spanning over 20 citiesin China
Offers one-stop solution for apartment owners andrental customers
Investment provides immediate entry into this fast-growing new economy sectorminus Complement business portfoliominus Contributes to future long-term recurring income stream
Synergies to be shared with the Grouprsquos properties inShanghai Suzhou and Chongqing
Strategic Acquisition of 20 Equity Stake in mamahome for RMB 100 million
Distrii ndash Leading Provider of Co-working Space Acquisition completed in Jan 2017
Currently 15 locations (13 Shanghai + 1 Beijing + 1 Hangzhou) 3700 seating capacity in total 10 locations in operation with 5 more locations to open in 1H 2017
Targeting to double the locations in China by end 2017
Current capacity of over 2200 seats has reached above 80 occupancy
Committed to lease over 60000 sq ft in Republic Plaza Expected to open in 1H 2018
Distrii Suhe Center Shanghai
Strategic Acquisition of 24 Equity Stake in Distrii for RMB 72 million
50
Purchase of a 100 equity stake in Shanghai MeidaoInvestment Co which owns the commercial projectthat is in the final stages of construction
Total transaction value of RMB 900 million throughCDL China Limited
Strategically located in Huacao Minhang Districtwithin the Hongqiao CBD ndash a new area established in2009 that spans 86 sq km and is one of Shanghairsquosfastest growing business areas
Project comprises five 9-storey office towers and twolevels of basement carpark with about 351 lots
Project has been approved for division into strata-titleunits
China ndashAcquisition of Shanghai Commercial Project for RMB 900 million
Artistrsquos ImpressionMeidao Business Plaza Shanghai
Meidao Business Plaza ShanghaiTenure Equity
StakeEst Total GFA
(sqm)Expected
Completion
50-year lease 100 32300 2H 2017
International Rental Properties
Artistrsquos Impression
Japan ndash Invested in 2 Prime Residential Projects in Tokyo
Located within prestigious Aoyama area withinMinato ward in Tokyo
Project targeted at high-end domestic and foreignbuyers
Good uptake with over 50 of units sold since itslaunch in Oct 2016
Tokyo ndashPark Court Aoyama The Tower
International Property Development
51
Artistrsquos ImpressionPark Court Aoyama The Tower Tokyo
Tokyo ndash ShirokaneTenure Equity Stake Site Area (sqm)
Freehold 947 16815
Discussions with potential JV partner for project development ongoing
City Equity Stake Total Units
Total Units Sold Expected Completion
Freehold 20 163 Over 50 1H 2018
As of 19 Feb 2017
Teddington Riverside Teddington TW11
Full planning received works on basement car park inadvanced stage
Block A (57 units) will be launched in Q2 2017 followed byanother five blocks
International Property Development
52
UK ndash Upcoming Launches in Q2 2017
Artistrsquos Impression
Tenure EquityStake
Total Units Est TotalSaleable Area
(sq ft)
Expected Completion
Freehold 100 220 240000 2018 (Phased)
Teddington Riverside London
Project Tenure Equity Stake
Total Units
Est TotalSaleable
Area (sq ft)
Expected Completion
Belgravia Freehold 100 6 12375 Q2 2017
Knightsbridge Freehold 100 3 5193 Q2 2017
Belgravia3135 Chesham Street London SW1X 8NQ
Knightsbridge32 Hans Road London SW3 1RW
Chelsea 90-100 Sydney Street London SW3 6NJ
International Property Development
53
UK ndash Pipeline Projects
Tenure EquityStake
Total Units Est TotalSaleable Area
(sq ft)
Expected Completion
Freehold 100 9 16143 Q2 2018
Stag Brewery London
Tenure Equity Stake Est Total Saleable Area (sq ft)
Freehold 100 1000000 sq ft
Stag Brewery Mortlake London SW14
Advanced master plan at public consultation stage
Planning applications to be submitted by end Q2 2017
Proposed scheme to comprise two phases Parameter plan covering the entire site Detailed planning application for Phase 1Artistrsquos Impression
Artistrsquos Impression
Good progress on works
Expected completion in Q2 2018
International Property Development
54
Tenure Equity Stake Total Units Est GFA (sq ft)
Freehold 100 34 135000
28 Pavilion Road Knightsbridge London SW1
First luxury home care development to be built in Central Londonndash planning consent obtained
Project on target to commence demolition works in Q2 2017Artistrsquos ImpressionPavilion Road
UK ndash Pipeline Projects
Development House
Planning application to be submitted in Q2 2017
Existing 28000 sq ft remains fully leased and vacantpossession expected from Q2 2018
Development House Leonard Street in Shoreditch
Tenure Equity Stake Est Total Lettable Area (sq ft)
Freehold 100 90000 sq ft
Artistrsquos Impression
Artistrsquos Impression
UK ndashAcquisition of 16-acre Ransomes Wharf site for pound58 million
Located within Battersearsquos creative quarter on theRiver Thames
Est GDV of pound222 million
Contracts completed purchase to be phased overthe next 18 months
Profit before tax pound108m pound109m (09) pound124m (129)
PATMI pound78m pound65m 200
Trading Performance
The Baileyrsquos Hotel London The Baileyrsquos Hotel London
Increase in reported revenue attributed to higher land sales in New Zealand and a higher contribution from Millennium Mitsui Garden Hotel Tokyo coupled with favourable foreign exchange movements as a result of weak pound against major currencies
MampC Hotel Operations
58
Trading Performance
RevPAR in reported currency was up by 66 but in constant currency fell by 23 for FY 2016 as compared to the same period last year
FY 2016 Reported Currency Constant CurrencyNew York pound14564 uarr 19 darr 99Regional US pound5749 uarr175 uarr 40Total US pound8652 uarr 83 darr 42London pound10718 darr 14 darr 14Rest of Europe pound5261 uarr 20 darr 16Total Europe pound8024 darr 08 darr 20Singapore pound8021 uarr 05 darr 101Rest of Asia pound6063 uarr 116 uarr 19Total Asia pound6821 uarr 62 darr 40Australasia pound5840 uarr 348 uarr 209Total Group pound7671 uarr 66 darr 23 Millennium Seoul Hilton
Copthorne Hotel amp Resort Queenstown Lakefront
Sheet1
Developments ndash Progressing well
The lifestyle hotel and serviced apartment has 306 and 209keys respectively
The building permit approval for Seoul Yangdong developmentproject has been received on 25 January 2017 Additionalcertification processes are expected to complete by mid 2017
The main contract tender process is planned to complete bymid 2017 before construction work starts
Seoul South Korea
59
Comprises a 263-room hotel and a 250-unit residentialapartment block
The final planning approval has been received in December2016
Currently reviewing the project costing and specification whichis anticipated to take about 18 months to complete aftercommencement
Sunnyvale US
MampC Hotel Operations
MampC Hotel Operations
60
ONE UN New York
Refurbishment of guestrooms in the east tower was completed in early Sep 2016 and the towers were re-opened in time for the UN General Assembly
Assets Enhancement (Completed)
Grand Copthorne Waterfront Hotel Singapore
Work on the main lobby and FampB outlets at the main entrance level was substantially completed in May 2016
Refurbishment of function rooms on level 2 started in Sep 2016 and completed in Dec 2016
M Hotel Singapore
Soft refurbishment of all guestrooms from level 12 to level 28 is complete with the last phase completed in Dec 2016
ONE UN New York
Grand Copthorne Waterfront Hotel Singapore
M Hotel Singapore
MampC Hotel Operations
61
Grand Millennium Kuala Lumpur
Soft refurbishment of guestrooms from level 9 to level 19 was completed at the beginning of the 4th quarter of 2016
Remaining guestrooms at level 7 and level 8 is planned to be refurbished in the mid 2017
Assets Enhancement (On-going)
Grand Millennium Kuala Lumpur
Copthorne Hotel Auckland Harbour City
Copthorne Hotel Auckland Harbour City
Closed for a major refurbishment programme in Q3 2015 at an estimated cost of NZ$40 million
The hotel will be rebranded as M Social Hotel Auckland and is expected to re-open in 2nd quarter of 2017
Artistrsquos Impression
Artistrsquos Impression
31 Dec 31 Dec 31 Dec 31 DecHotel and Room Count 2016 2015 2016 2015By region New York 4 4 2238 2238 Regional US 15 15 4559 4463 London 8 8 2651 2651 Rest of Europe 19 18 3081 2867 Middle East 26 22 7805 6450 Singapore 7 6 3011 2716 Rest of Asia 27 26 10036 9430 Australasia 25 27 3641 3903 Total 131 126 37022 34718
PipelineBy region Middle East 17 16 5465 4663 Rest of Asia 4 3 1608 1674 Regional USA 1 1 263 263 Rest of Europe 1 - 153 - Total 23 20 7489 6600
Hotels Rooms
Hotel Room Count and Pipeline
MampC Hotel Operations
Mainly management contracts
62
Millennium Biltmore Hotel Los Angeles
Grand Millennium Auckland
Sheet1
CDL Hospitality Trusts
63
S$rsquo000 FY 2016 FY 2015 Change
Gross Revenue 180857 172410 49
Net Property Income (NPI) 137560 137003 04
Trading Performance
Hilton Cambridge City Centre ndash Executive Lounge
Artistrsquos Impression
Gross revenue and NPI increased mainly due to Inorganic contribution from Hilton Cambridge City Centre United Kingdom which
was acquired on 1 Oct 2015 Strong contribution from New Zealand hotels as a result of higher variable rental
income Incremental income boost from Japan hotels and Claymore Connect retail mall
This was partially offset by Continued weakness in Singapore and Maldives markets due to soft trading
conditions amid the global economic slowdown Lower contribution from Australia due to weaker AUD and lower variable income
contribution for FY 2016
Artistrsquos Impression
Disclaimer
This document may contain forward-looking statements that involve assumptions risks and uncertainties Actual future performance outcomes and results may differ materially from those expressed in forward-looking statements as a result of a number of risks uncertainties and assumptions Representative examples of these factors include (without limitation) general industry and economic conditions interest rate trends cost of capital and capital availability availability of real estate properties competition from other developments or companies shifts in customer demands customers and partners expected levels of occupancy rate property rental income charge out collections changes in operating expenses (including employee wages benefits and training costs) governmental and public policy changes and the continued availability of financing in the amounts and the terms necessary to support future business You are cautioned not to place undue reliance on these forward-looking statements which are based on the current view of management on future events Numbers in tables and charts may not add up due to rounding
Gramercy Park Singaporewwwcdlcomsg
Slide Number 1
Slide Number 2
Slide Number 3
Slide Number 4
Slide Number 5
Slide Number 6
Slide Number 7
Slide Number 8
Slide Number 9
Slide Number 10
Slide Number 11
Slide Number 12
Slide Number 13
Slide Number 14
Slide Number 15
Slide Number 16
Slide Number 17
Slide Number 18
Slide Number 19
Slide Number 20
Slide Number 21
Slide Number 22
Slide Number 23
Slide Number 24
Slide Number 25
Slide Number 26
Slide Number 27
Slide Number 28
Slide Number 29
Slide Number 30
Slide Number 31
Slide Number 32
Slide Number 33
Slide Number 34
Slide Number 35
Slide Number 36
Slide Number 37
Slide Number 38
Slide Number 39
Slide Number 40
Slide Number 41
Slide Number 42
Slide Number 43
Slide Number 44
Slide Number 45
Slide Number 46
Slide Number 47
Slide Number 48
Slide Number 49
Slide Number 50
Slide Number 51
Slide Number 52
Slide Number 53
Slide Number 54
Slide Number 55
Slide Number 56
Slide Number 57
Slide Number 58
Slide Number 59
Slide Number 60
Slide Number 61
Slide Number 62
Slide Number 63
Slide Number 64
Slide Number 65
Hotels
Rooms
31 Dec
31 Dec
31 Dec
31 Dec
Hotel and Room Count
2016
2015
2016
2015
By region
New York
4
4
2238
2238
Regional US
15
15
4559
4463
London
8
8
2651
2651
Rest of Europe
19
18
3081
2867
Middle East
26
22
7805
6450
Singapore
7
6
3011
2716
Rest of Asia
27
26
10036
9430
Australasia
25
27
3641
3903
Total
131
126
37022
34718
Pipeline
By region
Middle East
17
16
5465
4663
Rest of Asia
4
3
1608
1674
Regional USA
1
1
263
263
Rest of Europe
1
- 0
153
- 0
Total
23
20
7489
6600
FY 2016
Reported Currency
Constant Currency
New York
pound14564
uarr 19
darr 99
Regional US
pound5749
uarr175
uarr 40
Total US
pound8652
uarr 83
darr 42
London
pound10718
darr 14
darr 14
Rest of Europe
pound5261
uarr 20
darr 16
Total Europe
pound8024
darr 08
darr 20
Singapore
pound8021
uarr 05
darr 101
Rest of Asia
pound6063
uarr 116
uarr 19
Total Asia
pound6821
uarr 62
darr 40
Australasia
pound5840
uarr 348
uarr 209
Total Group
pound7671
uarr 66
darr 23
Project
Equity Stake
Total Units
Units Sold
Sold
Total Unsold Inventory
CDLrsquos Share of Unsold Inventory
St Regis Residences
33
173
161
93
12
4
The Oceanfront Sentosa Cove
50
264
263
99
1
05
One Shenton
100
341
327
96
14
14
Cliveden at Grange
100
110
44
40
66
66
UPRobertson Quay
100
70
57
81
13
13
Echelon
50
508
506
100
2
1
DNest
51
912
904
99
8
408
Jewel Buangkok
100
616
616
100
0
0
The Venue Shoppes
60
28
16
57
12
72
The Venue Residences
60
266
181
68
85
51
Coco Palms
51
944
865
92
79
4029
The Brownstone Executive Condo
70
638
519
81
119
833
The Criterion Executive Condo
70
505
179
35
326
2282
Gramercy Park
100
174
46
53^
41^
41^
(Phase 1 = 87-unit North Tower)
Forest Woods
50
519
382
74
137
685
Bartley Ridge
30
868
868
100
0
0
Commonwealth Towers
30
845
461
55
384
1152
TOTAL
7781
6395
1299
7373
110
115
120
125
130
135
140
145
Q112
Q212
Q312
Q412
Q113
Q213
Q313
Q413
Q114
Q214
Q314
Q414
Q115
Q215
Q315
Q415
Q116
Q216
Q316
Q416
Office Retail
Source URA Q4 2016
33
Singapore Commercial MarketProperty Price Index ndash Commercial (2012ndash 2016)
Q4 161226
Q4 16 1347
Q3 161223
Q3 16 1355
Source JLL Research Q4 2016
$974
$1051$1204
$1038$914
$790 $837$926
$850$777
000
200
400
600
800
1000
1200
1400
2012 2013 2014 2015 2016
Marina Bay Raffles Place(Grade A)
Whole Island
34
Singapore Office MarketAverage Office Rental in CBD (2012 ndash 2016)
Office Space Demand amp Supply (2012 ndash 2016)Private amp Public Sector
78254 80095 81300 81365 83206
7091372205 72980 73647 73938
30000
35000
40000
45000
50000
55000
60000
65000
70000
75000
80000
85000
2012 2013 2014 2015 2016
Cumulative Supply Occupancy
Source URA Q4 2016
Singapore Office Market
CDLrsquos Office Properties Occupancy
959(National Average = 889)
35
Occupancy as of 31 Dec 2016
2017 2018 2019
33 28 25
Expiry of NLA
36
CDLrsquos Office Space ndash Lease Expiry Profile (2017 ndash 2019)
Rental Properties
Office Portfolio NLA ~2300000 sq ft
16Properties^
959Occupancy
As of 31 December 2016
Note Properties include -Republic Plaza Central Mall (Office Tower) City House Fuji Xerox Towers Manulife Centre Palais Renaissance Tanglin Shopping Centre The Arcade Katong Shopping Centre Kingrsquos Centre 7 amp 9 Tampines Grande 11 Tampines Concourse Sunshine Plaza Fortune Centre Golden Mile Complex Central Mall Conservation Unit
Based on contractual expiry dates Renewals will be negotiated nearer to expiry Tenants may renew their leases or increasereduce space or exit ^ Properties include strata-titled units owned and managed by CDL
60052
61333
6365864271
65079
57060
58599
59955 5963260192
52000
54000
56000
58000
60000
62000
64000
66000
2012 2013 2014 2015 2016
Cumulative Supply Occupancy
Retail Space Demand amp Supply (2012 ndash 2016)Private amp Public Sector
Source URA Q4 2016
With effect from Q1 2014 the coverage of retail space has been expanded to include non-shop retail uses and data are available from2011 onwards
Singapore Retail Market
CDLrsquos Retail Properties Occupancy
964(National Average = 925)
37
Occupancy as of 31 Dec 2016
38
CDLrsquos Retail Space ndash Lease Expiry Profile (2017 ndash 2019)
2017 2018 2019
2332 31
Expiry of NLA
Rental Properties
Retail Portfolio NLA ~840000 sq ft
19Properties^
964Occupancy
As of 31 December 2016
Based on contractual expiry dates Renewals will be negotiated nearer to expiry Tenants may renew their leases or increasereduce space or exit ^ Properties include strata-titled units owned and managed by CDL
Note Properties include ndashRepublic Plaza Central Mall (Office Tower) City Square Mall Palais Renaissance Tanglin Shopping Centre The Arcade Katong Shopping Centre Kingrsquos Centre Quayside Isle Grand Copthorne Waterfront (Waterfront Plaza) City Plaza Golden Mile Complex Central Mall Conservation Unit 7 amp 9 Tampines Grande City House Fortune Centre Manulife Centre Fuji Xerox Towers
39
Revenue by Sector for Full Year (2014 ndash 2016)
0
50
100
150
200
250
300
FY 2016 FY 2015 FY 2014
152187 176
110 113 111
7 8 8
74 75 65
24 23 25
S$ m
illio
n
Office
Retail
Industrial
REITHotel
Others ^
$367m $406m $385m
FY 2016 FY 2015 FY 2014
Office 41 46 46
Retail 30 28 29
Industrial 2 2 2
REITHotel 20 18 17
Others ^ 7 6 6
^ Including car park serviced apartments and residential
Rental Properties
40
EBITDA by Sector for Full Year (2014 ndash 2016)
050
100150200250300350400450500550600
FY 2016 FY 2015 FY 2014
185
446 ~
10175 64 91
5 4 453 58 53
6 15 19
S$ m
illio
n
Office
Retail
Industrial
REITHotel
Others ^
$324m $587m $268m
FY 2016 FY 2015 FY 2014
Office 57 76 38
Retail 23 11 34
Industrial 2 - 1
REITHotel 16 10 20
Others ^ 2 3 7
~ Includes gain on sale of Profit Participation Securities^ Including car park serviced apartments and residential
Rental Properties
South Beach
41
JW Marriott Hotel Singapore South Beach
JW Marriott Hotel Singapore South Beach
Rebranded hotel soft opened in mid-Dec2016
Business performance is within expectations
Ongoing works at NCO Club are expected tocomplete by Q3 2017 along with theremodelled Ballroom
South Beach Residences
190-unit luxury residence may be launchedin 2H 2017 subject to market conditions
Fully Completed in December 2016
Strong Performance for Office amp Retail
South Beach Tower (510000 sq ft office space) and retail space are fully leased
INTERNATIONAL OVERVIEW
Projects Launched To Date
43
Project City Equity Stake
Total Units
Total Units Sold
Booked
Sold Est TotalSaleable
Area (sq ft)
ExpectedCompletion
Australia
Ivy and Eve Brisbane 33 472 450 95 348678 1H 2018
China
Hong Leong City Center (Phase 1)
Suzhou 100^ 1374 1038 76 1378891 Completed
Hong Leong City Center (Phase 2 ndash T2)
Suzhou 100^ 430 174 40 439716 Q4 2017
Hongqiao Royal Lake Shanghai 100 85 34 40 385394 Completed
China ndash Good Progress on Launched Luxury Projects
International Property Development
47
Shanghai ndash Hongqiao Royal Lake (御湖)
Eling Residences Chongqing
Stable sales despite tightening measures in Shanghai
34 units soldbooked with sales value of RMB 668 millionachieved to date
Chongqing ndash Eling Residences (鹅岭峰)
Launched in Oct 2016
8 units soldbooked with sales value of RMB 85 million ndashachieved highest average values of close to RMB 40000 psm
City Equity Stake
Total Units
Total Units Sold Booked
Sold
Expected Completion
Shanghai 100 85 34 40 Completed
Hongqiao Royal Lake Shanghai
City Equity Stake
Total Units
Total Units Sold Booked
Sold
Expected Completion
Chongqing 100 126 8 6 Q2 2017
Artistrsquos Impression
As of 19 Feb 2017
Chongqing ndash Huang Huayuan (黄花园)
Scheduled launch of mixed-use development with over 600 residential units in 2019
48
Over 150000 apartment listings spanning over 20 citiesin China
Offers one-stop solution for apartment owners andrental customers
Investment provides immediate entry into this fast-growing new economy sectorminus Complement business portfoliominus Contributes to future long-term recurring income stream
Synergies to be shared with the Grouprsquos properties inShanghai Suzhou and Chongqing
Strategic Acquisition of 20 Equity Stake in mamahome for RMB 100 million
Distrii ndash Leading Provider of Co-working Space Acquisition completed in Jan 2017
Currently 15 locations (13 Shanghai + 1 Beijing + 1 Hangzhou) 3700 seating capacity in total 10 locations in operation with 5 more locations to open in 1H 2017
Targeting to double the locations in China by end 2017
Current capacity of over 2200 seats has reached above 80 occupancy
Committed to lease over 60000 sq ft in Republic Plaza Expected to open in 1H 2018
Distrii Suhe Center Shanghai
Strategic Acquisition of 24 Equity Stake in Distrii for RMB 72 million
50
Purchase of a 100 equity stake in Shanghai MeidaoInvestment Co which owns the commercial projectthat is in the final stages of construction
Total transaction value of RMB 900 million throughCDL China Limited
Strategically located in Huacao Minhang Districtwithin the Hongqiao CBD ndash a new area established in2009 that spans 86 sq km and is one of Shanghairsquosfastest growing business areas
Project comprises five 9-storey office towers and twolevels of basement carpark with about 351 lots
Project has been approved for division into strata-titleunits
China ndashAcquisition of Shanghai Commercial Project for RMB 900 million
Artistrsquos ImpressionMeidao Business Plaza Shanghai
Meidao Business Plaza ShanghaiTenure Equity
StakeEst Total GFA
(sqm)Expected
Completion
50-year lease 100 32300 2H 2017
International Rental Properties
Artistrsquos Impression
Japan ndash Invested in 2 Prime Residential Projects in Tokyo
Located within prestigious Aoyama area withinMinato ward in Tokyo
Project targeted at high-end domestic and foreignbuyers
Good uptake with over 50 of units sold since itslaunch in Oct 2016
Tokyo ndashPark Court Aoyama The Tower
International Property Development
51
Artistrsquos ImpressionPark Court Aoyama The Tower Tokyo
Tokyo ndash ShirokaneTenure Equity Stake Site Area (sqm)
Freehold 947 16815
Discussions with potential JV partner for project development ongoing
City Equity Stake Total Units
Total Units Sold Expected Completion
Freehold 20 163 Over 50 1H 2018
As of 19 Feb 2017
Teddington Riverside Teddington TW11
Full planning received works on basement car park inadvanced stage
Block A (57 units) will be launched in Q2 2017 followed byanother five blocks
International Property Development
52
UK ndash Upcoming Launches in Q2 2017
Artistrsquos Impression
Tenure EquityStake
Total Units Est TotalSaleable Area
(sq ft)
Expected Completion
Freehold 100 220 240000 2018 (Phased)
Teddington Riverside London
Project Tenure Equity Stake
Total Units
Est TotalSaleable
Area (sq ft)
Expected Completion
Belgravia Freehold 100 6 12375 Q2 2017
Knightsbridge Freehold 100 3 5193 Q2 2017
Belgravia3135 Chesham Street London SW1X 8NQ
Knightsbridge32 Hans Road London SW3 1RW
Chelsea 90-100 Sydney Street London SW3 6NJ
International Property Development
53
UK ndash Pipeline Projects
Tenure EquityStake
Total Units Est TotalSaleable Area
(sq ft)
Expected Completion
Freehold 100 9 16143 Q2 2018
Stag Brewery London
Tenure Equity Stake Est Total Saleable Area (sq ft)
Freehold 100 1000000 sq ft
Stag Brewery Mortlake London SW14
Advanced master plan at public consultation stage
Planning applications to be submitted by end Q2 2017
Proposed scheme to comprise two phases Parameter plan covering the entire site Detailed planning application for Phase 1Artistrsquos Impression
Artistrsquos Impression
Good progress on works
Expected completion in Q2 2018
International Property Development
54
Tenure Equity Stake Total Units Est GFA (sq ft)
Freehold 100 34 135000
28 Pavilion Road Knightsbridge London SW1
First luxury home care development to be built in Central Londonndash planning consent obtained
Project on target to commence demolition works in Q2 2017Artistrsquos ImpressionPavilion Road
UK ndash Pipeline Projects
Development House
Planning application to be submitted in Q2 2017
Existing 28000 sq ft remains fully leased and vacantpossession expected from Q2 2018
Development House Leonard Street in Shoreditch
Tenure Equity Stake Est Total Lettable Area (sq ft)
Freehold 100 90000 sq ft
Artistrsquos Impression
Artistrsquos Impression
UK ndashAcquisition of 16-acre Ransomes Wharf site for pound58 million
Located within Battersearsquos creative quarter on theRiver Thames
Est GDV of pound222 million
Contracts completed purchase to be phased overthe next 18 months
Profit before tax pound108m pound109m (09) pound124m (129)
PATMI pound78m pound65m 200
Trading Performance
The Baileyrsquos Hotel London The Baileyrsquos Hotel London
Increase in reported revenue attributed to higher land sales in New Zealand and a higher contribution from Millennium Mitsui Garden Hotel Tokyo coupled with favourable foreign exchange movements as a result of weak pound against major currencies
MampC Hotel Operations
58
Trading Performance
RevPAR in reported currency was up by 66 but in constant currency fell by 23 for FY 2016 as compared to the same period last year
FY 2016 Reported Currency Constant CurrencyNew York pound14564 uarr 19 darr 99Regional US pound5749 uarr175 uarr 40Total US pound8652 uarr 83 darr 42London pound10718 darr 14 darr 14Rest of Europe pound5261 uarr 20 darr 16Total Europe pound8024 darr 08 darr 20Singapore pound8021 uarr 05 darr 101Rest of Asia pound6063 uarr 116 uarr 19Total Asia pound6821 uarr 62 darr 40Australasia pound5840 uarr 348 uarr 209Total Group pound7671 uarr 66 darr 23 Millennium Seoul Hilton
Copthorne Hotel amp Resort Queenstown Lakefront
Sheet1
Developments ndash Progressing well
The lifestyle hotel and serviced apartment has 306 and 209keys respectively
The building permit approval for Seoul Yangdong developmentproject has been received on 25 January 2017 Additionalcertification processes are expected to complete by mid 2017
The main contract tender process is planned to complete bymid 2017 before construction work starts
Seoul South Korea
59
Comprises a 263-room hotel and a 250-unit residentialapartment block
The final planning approval has been received in December2016
Currently reviewing the project costing and specification whichis anticipated to take about 18 months to complete aftercommencement
Sunnyvale US
MampC Hotel Operations
MampC Hotel Operations
60
ONE UN New York
Refurbishment of guestrooms in the east tower was completed in early Sep 2016 and the towers were re-opened in time for the UN General Assembly
Assets Enhancement (Completed)
Grand Copthorne Waterfront Hotel Singapore
Work on the main lobby and FampB outlets at the main entrance level was substantially completed in May 2016
Refurbishment of function rooms on level 2 started in Sep 2016 and completed in Dec 2016
M Hotel Singapore
Soft refurbishment of all guestrooms from level 12 to level 28 is complete with the last phase completed in Dec 2016
ONE UN New York
Grand Copthorne Waterfront Hotel Singapore
M Hotel Singapore
MampC Hotel Operations
61
Grand Millennium Kuala Lumpur
Soft refurbishment of guestrooms from level 9 to level 19 was completed at the beginning of the 4th quarter of 2016
Remaining guestrooms at level 7 and level 8 is planned to be refurbished in the mid 2017
Assets Enhancement (On-going)
Grand Millennium Kuala Lumpur
Copthorne Hotel Auckland Harbour City
Copthorne Hotel Auckland Harbour City
Closed for a major refurbishment programme in Q3 2015 at an estimated cost of NZ$40 million
The hotel will be rebranded as M Social Hotel Auckland and is expected to re-open in 2nd quarter of 2017
Artistrsquos Impression
Artistrsquos Impression
31 Dec 31 Dec 31 Dec 31 DecHotel and Room Count 2016 2015 2016 2015By region New York 4 4 2238 2238 Regional US 15 15 4559 4463 London 8 8 2651 2651 Rest of Europe 19 18 3081 2867 Middle East 26 22 7805 6450 Singapore 7 6 3011 2716 Rest of Asia 27 26 10036 9430 Australasia 25 27 3641 3903 Total 131 126 37022 34718
PipelineBy region Middle East 17 16 5465 4663 Rest of Asia 4 3 1608 1674 Regional USA 1 1 263 263 Rest of Europe 1 - 153 - Total 23 20 7489 6600
Hotels Rooms
Hotel Room Count and Pipeline
MampC Hotel Operations
Mainly management contracts
62
Millennium Biltmore Hotel Los Angeles
Grand Millennium Auckland
Sheet1
CDL Hospitality Trusts
63
S$rsquo000 FY 2016 FY 2015 Change
Gross Revenue 180857 172410 49
Net Property Income (NPI) 137560 137003 04
Trading Performance
Hilton Cambridge City Centre ndash Executive Lounge
Artistrsquos Impression
Gross revenue and NPI increased mainly due to Inorganic contribution from Hilton Cambridge City Centre United Kingdom which
was acquired on 1 Oct 2015 Strong contribution from New Zealand hotels as a result of higher variable rental
income Incremental income boost from Japan hotels and Claymore Connect retail mall
This was partially offset by Continued weakness in Singapore and Maldives markets due to soft trading
conditions amid the global economic slowdown Lower contribution from Australia due to weaker AUD and lower variable income
contribution for FY 2016
Artistrsquos Impression
Disclaimer
This document may contain forward-looking statements that involve assumptions risks and uncertainties Actual future performance outcomes and results may differ materially from those expressed in forward-looking statements as a result of a number of risks uncertainties and assumptions Representative examples of these factors include (without limitation) general industry and economic conditions interest rate trends cost of capital and capital availability availability of real estate properties competition from other developments or companies shifts in customer demands customers and partners expected levels of occupancy rate property rental income charge out collections changes in operating expenses (including employee wages benefits and training costs) governmental and public policy changes and the continued availability of financing in the amounts and the terms necessary to support future business You are cautioned not to place undue reliance on these forward-looking statements which are based on the current view of management on future events Numbers in tables and charts may not add up due to rounding
Gramercy Park Singaporewwwcdlcomsg
Slide Number 1
Slide Number 2
Slide Number 3
Slide Number 4
Slide Number 5
Slide Number 6
Slide Number 7
Slide Number 8
Slide Number 9
Slide Number 10
Slide Number 11
Slide Number 12
Slide Number 13
Slide Number 14
Slide Number 15
Slide Number 16
Slide Number 17
Slide Number 18
Slide Number 19
Slide Number 20
Slide Number 21
Slide Number 22
Slide Number 23
Slide Number 24
Slide Number 25
Slide Number 26
Slide Number 27
Slide Number 28
Slide Number 29
Slide Number 30
Slide Number 31
Slide Number 32
Slide Number 33
Slide Number 34
Slide Number 35
Slide Number 36
Slide Number 37
Slide Number 38
Slide Number 39
Slide Number 40
Slide Number 41
Slide Number 42
Slide Number 43
Slide Number 44
Slide Number 45
Slide Number 46
Slide Number 47
Slide Number 48
Slide Number 49
Slide Number 50
Slide Number 51
Slide Number 52
Slide Number 53
Slide Number 54
Slide Number 55
Slide Number 56
Slide Number 57
Slide Number 58
Slide Number 59
Slide Number 60
Slide Number 61
Slide Number 62
Slide Number 63
Slide Number 64
Slide Number 65
Hotels
Rooms
31 Dec
31 Dec
31 Dec
31 Dec
Hotel and Room Count
2016
2015
2016
2015
By region
New York
4
4
2238
2238
Regional US
15
15
4559
4463
London
8
8
2651
2651
Rest of Europe
19
18
3081
2867
Middle East
26
22
7805
6450
Singapore
7
6
3011
2716
Rest of Asia
27
26
10036
9430
Australasia
25
27
3641
3903
Total
131
126
37022
34718
Pipeline
By region
Middle East
17
16
5465
4663
Rest of Asia
4
3
1608
1674
Regional USA
1
1
263
263
Rest of Europe
1
- 0
153
- 0
Total
23
20
7489
6600
FY 2016
Reported Currency
Constant Currency
New York
pound14564
uarr 19
darr 99
Regional US
pound5749
uarr175
uarr 40
Total US
pound8652
uarr 83
darr 42
London
pound10718
darr 14
darr 14
Rest of Europe
pound5261
uarr 20
darr 16
Total Europe
pound8024
darr 08
darr 20
Singapore
pound8021
uarr 05
darr 101
Rest of Asia
pound6063
uarr 116
uarr 19
Total Asia
pound6821
uarr 62
darr 40
Australasia
pound5840
uarr 348
uarr 209
Total Group
pound7671
uarr 66
darr 23
2017 2018 2019
33 28 25
Expiry of NLA
36
CDLrsquos Office Space ndash Lease Expiry Profile (2017 ndash 2019)
Rental Properties
Office Portfolio NLA ~2300000 sq ft
16Properties^
959Occupancy
As of 31 December 2016
Note Properties include -Republic Plaza Central Mall (Office Tower) City House Fuji Xerox Towers Manulife Centre Palais Renaissance Tanglin Shopping Centre The Arcade Katong Shopping Centre Kingrsquos Centre 7 amp 9 Tampines Grande 11 Tampines Concourse Sunshine Plaza Fortune Centre Golden Mile Complex Central Mall Conservation Unit
Based on contractual expiry dates Renewals will be negotiated nearer to expiry Tenants may renew their leases or increasereduce space or exit ^ Properties include strata-titled units owned and managed by CDL
60052
61333
6365864271
65079
57060
58599
59955 5963260192
52000
54000
56000
58000
60000
62000
64000
66000
2012 2013 2014 2015 2016
Cumulative Supply Occupancy
Retail Space Demand amp Supply (2012 ndash 2016)Private amp Public Sector
Source URA Q4 2016
With effect from Q1 2014 the coverage of retail space has been expanded to include non-shop retail uses and data are available from2011 onwards
Singapore Retail Market
CDLrsquos Retail Properties Occupancy
964(National Average = 925)
37
Occupancy as of 31 Dec 2016
38
CDLrsquos Retail Space ndash Lease Expiry Profile (2017 ndash 2019)
2017 2018 2019
2332 31
Expiry of NLA
Rental Properties
Retail Portfolio NLA ~840000 sq ft
19Properties^
964Occupancy
As of 31 December 2016
Based on contractual expiry dates Renewals will be negotiated nearer to expiry Tenants may renew their leases or increasereduce space or exit ^ Properties include strata-titled units owned and managed by CDL
Note Properties include ndashRepublic Plaza Central Mall (Office Tower) City Square Mall Palais Renaissance Tanglin Shopping Centre The Arcade Katong Shopping Centre Kingrsquos Centre Quayside Isle Grand Copthorne Waterfront (Waterfront Plaza) City Plaza Golden Mile Complex Central Mall Conservation Unit 7 amp 9 Tampines Grande City House Fortune Centre Manulife Centre Fuji Xerox Towers
39
Revenue by Sector for Full Year (2014 ndash 2016)
0
50
100
150
200
250
300
FY 2016 FY 2015 FY 2014
152187 176
110 113 111
7 8 8
74 75 65
24 23 25
S$ m
illio
n
Office
Retail
Industrial
REITHotel
Others ^
$367m $406m $385m
FY 2016 FY 2015 FY 2014
Office 41 46 46
Retail 30 28 29
Industrial 2 2 2
REITHotel 20 18 17
Others ^ 7 6 6
^ Including car park serviced apartments and residential
Rental Properties
40
EBITDA by Sector for Full Year (2014 ndash 2016)
050
100150200250300350400450500550600
FY 2016 FY 2015 FY 2014
185
446 ~
10175 64 91
5 4 453 58 53
6 15 19
S$ m
illio
n
Office
Retail
Industrial
REITHotel
Others ^
$324m $587m $268m
FY 2016 FY 2015 FY 2014
Office 57 76 38
Retail 23 11 34
Industrial 2 - 1
REITHotel 16 10 20
Others ^ 2 3 7
~ Includes gain on sale of Profit Participation Securities^ Including car park serviced apartments and residential
Rental Properties
South Beach
41
JW Marriott Hotel Singapore South Beach
JW Marriott Hotel Singapore South Beach
Rebranded hotel soft opened in mid-Dec2016
Business performance is within expectations
Ongoing works at NCO Club are expected tocomplete by Q3 2017 along with theremodelled Ballroom
South Beach Residences
190-unit luxury residence may be launchedin 2H 2017 subject to market conditions
Fully Completed in December 2016
Strong Performance for Office amp Retail
South Beach Tower (510000 sq ft office space) and retail space are fully leased
INTERNATIONAL OVERVIEW
Projects Launched To Date
43
Project City Equity Stake
Total Units
Total Units Sold
Booked
Sold Est TotalSaleable
Area (sq ft)
ExpectedCompletion
Australia
Ivy and Eve Brisbane 33 472 450 95 348678 1H 2018
China
Hong Leong City Center (Phase 1)
Suzhou 100^ 1374 1038 76 1378891 Completed
Hong Leong City Center (Phase 2 ndash T2)
Suzhou 100^ 430 174 40 439716 Q4 2017
Hongqiao Royal Lake Shanghai 100 85 34 40 385394 Completed
China ndash Good Progress on Launched Luxury Projects
International Property Development
47
Shanghai ndash Hongqiao Royal Lake (御湖)
Eling Residences Chongqing
Stable sales despite tightening measures in Shanghai
34 units soldbooked with sales value of RMB 668 millionachieved to date
Chongqing ndash Eling Residences (鹅岭峰)
Launched in Oct 2016
8 units soldbooked with sales value of RMB 85 million ndashachieved highest average values of close to RMB 40000 psm
City Equity Stake
Total Units
Total Units Sold Booked
Sold
Expected Completion
Shanghai 100 85 34 40 Completed
Hongqiao Royal Lake Shanghai
City Equity Stake
Total Units
Total Units Sold Booked
Sold
Expected Completion
Chongqing 100 126 8 6 Q2 2017
Artistrsquos Impression
As of 19 Feb 2017
Chongqing ndash Huang Huayuan (黄花园)
Scheduled launch of mixed-use development with over 600 residential units in 2019
48
Over 150000 apartment listings spanning over 20 citiesin China
Offers one-stop solution for apartment owners andrental customers
Investment provides immediate entry into this fast-growing new economy sectorminus Complement business portfoliominus Contributes to future long-term recurring income stream
Synergies to be shared with the Grouprsquos properties inShanghai Suzhou and Chongqing
Strategic Acquisition of 20 Equity Stake in mamahome for RMB 100 million
Distrii ndash Leading Provider of Co-working Space Acquisition completed in Jan 2017
Currently 15 locations (13 Shanghai + 1 Beijing + 1 Hangzhou) 3700 seating capacity in total 10 locations in operation with 5 more locations to open in 1H 2017
Targeting to double the locations in China by end 2017
Current capacity of over 2200 seats has reached above 80 occupancy
Committed to lease over 60000 sq ft in Republic Plaza Expected to open in 1H 2018
Distrii Suhe Center Shanghai
Strategic Acquisition of 24 Equity Stake in Distrii for RMB 72 million
50
Purchase of a 100 equity stake in Shanghai MeidaoInvestment Co which owns the commercial projectthat is in the final stages of construction
Total transaction value of RMB 900 million throughCDL China Limited
Strategically located in Huacao Minhang Districtwithin the Hongqiao CBD ndash a new area established in2009 that spans 86 sq km and is one of Shanghairsquosfastest growing business areas
Project comprises five 9-storey office towers and twolevels of basement carpark with about 351 lots
Project has been approved for division into strata-titleunits
China ndashAcquisition of Shanghai Commercial Project for RMB 900 million
Artistrsquos ImpressionMeidao Business Plaza Shanghai
Meidao Business Plaza ShanghaiTenure Equity
StakeEst Total GFA
(sqm)Expected
Completion
50-year lease 100 32300 2H 2017
International Rental Properties
Artistrsquos Impression
Japan ndash Invested in 2 Prime Residential Projects in Tokyo
Located within prestigious Aoyama area withinMinato ward in Tokyo
Project targeted at high-end domestic and foreignbuyers
Good uptake with over 50 of units sold since itslaunch in Oct 2016
Tokyo ndashPark Court Aoyama The Tower
International Property Development
51
Artistrsquos ImpressionPark Court Aoyama The Tower Tokyo
Tokyo ndash ShirokaneTenure Equity Stake Site Area (sqm)
Freehold 947 16815
Discussions with potential JV partner for project development ongoing
City Equity Stake Total Units
Total Units Sold Expected Completion
Freehold 20 163 Over 50 1H 2018
As of 19 Feb 2017
Teddington Riverside Teddington TW11
Full planning received works on basement car park inadvanced stage
Block A (57 units) will be launched in Q2 2017 followed byanother five blocks
International Property Development
52
UK ndash Upcoming Launches in Q2 2017
Artistrsquos Impression
Tenure EquityStake
Total Units Est TotalSaleable Area
(sq ft)
Expected Completion
Freehold 100 220 240000 2018 (Phased)
Teddington Riverside London
Project Tenure Equity Stake
Total Units
Est TotalSaleable
Area (sq ft)
Expected Completion
Belgravia Freehold 100 6 12375 Q2 2017
Knightsbridge Freehold 100 3 5193 Q2 2017
Belgravia3135 Chesham Street London SW1X 8NQ
Knightsbridge32 Hans Road London SW3 1RW
Chelsea 90-100 Sydney Street London SW3 6NJ
International Property Development
53
UK ndash Pipeline Projects
Tenure EquityStake
Total Units Est TotalSaleable Area
(sq ft)
Expected Completion
Freehold 100 9 16143 Q2 2018
Stag Brewery London
Tenure Equity Stake Est Total Saleable Area (sq ft)
Freehold 100 1000000 sq ft
Stag Brewery Mortlake London SW14
Advanced master plan at public consultation stage
Planning applications to be submitted by end Q2 2017
Proposed scheme to comprise two phases Parameter plan covering the entire site Detailed planning application for Phase 1Artistrsquos Impression
Artistrsquos Impression
Good progress on works
Expected completion in Q2 2018
International Property Development
54
Tenure Equity Stake Total Units Est GFA (sq ft)
Freehold 100 34 135000
28 Pavilion Road Knightsbridge London SW1
First luxury home care development to be built in Central Londonndash planning consent obtained
Project on target to commence demolition works in Q2 2017Artistrsquos ImpressionPavilion Road
UK ndash Pipeline Projects
Development House
Planning application to be submitted in Q2 2017
Existing 28000 sq ft remains fully leased and vacantpossession expected from Q2 2018
Development House Leonard Street in Shoreditch
Tenure Equity Stake Est Total Lettable Area (sq ft)
Freehold 100 90000 sq ft
Artistrsquos Impression
Artistrsquos Impression
UK ndashAcquisition of 16-acre Ransomes Wharf site for pound58 million
Located within Battersearsquos creative quarter on theRiver Thames
Est GDV of pound222 million
Contracts completed purchase to be phased overthe next 18 months
Profit before tax pound108m pound109m (09) pound124m (129)
PATMI pound78m pound65m 200
Trading Performance
The Baileyrsquos Hotel London The Baileyrsquos Hotel London
Increase in reported revenue attributed to higher land sales in New Zealand and a higher contribution from Millennium Mitsui Garden Hotel Tokyo coupled with favourable foreign exchange movements as a result of weak pound against major currencies
MampC Hotel Operations
58
Trading Performance
RevPAR in reported currency was up by 66 but in constant currency fell by 23 for FY 2016 as compared to the same period last year
FY 2016 Reported Currency Constant CurrencyNew York pound14564 uarr 19 darr 99Regional US pound5749 uarr175 uarr 40Total US pound8652 uarr 83 darr 42London pound10718 darr 14 darr 14Rest of Europe pound5261 uarr 20 darr 16Total Europe pound8024 darr 08 darr 20Singapore pound8021 uarr 05 darr 101Rest of Asia pound6063 uarr 116 uarr 19Total Asia pound6821 uarr 62 darr 40Australasia pound5840 uarr 348 uarr 209Total Group pound7671 uarr 66 darr 23 Millennium Seoul Hilton
Copthorne Hotel amp Resort Queenstown Lakefront
Sheet1
Developments ndash Progressing well
The lifestyle hotel and serviced apartment has 306 and 209keys respectively
The building permit approval for Seoul Yangdong developmentproject has been received on 25 January 2017 Additionalcertification processes are expected to complete by mid 2017
The main contract tender process is planned to complete bymid 2017 before construction work starts
Seoul South Korea
59
Comprises a 263-room hotel and a 250-unit residentialapartment block
The final planning approval has been received in December2016
Currently reviewing the project costing and specification whichis anticipated to take about 18 months to complete aftercommencement
Sunnyvale US
MampC Hotel Operations
MampC Hotel Operations
60
ONE UN New York
Refurbishment of guestrooms in the east tower was completed in early Sep 2016 and the towers were re-opened in time for the UN General Assembly
Assets Enhancement (Completed)
Grand Copthorne Waterfront Hotel Singapore
Work on the main lobby and FampB outlets at the main entrance level was substantially completed in May 2016
Refurbishment of function rooms on level 2 started in Sep 2016 and completed in Dec 2016
M Hotel Singapore
Soft refurbishment of all guestrooms from level 12 to level 28 is complete with the last phase completed in Dec 2016
ONE UN New York
Grand Copthorne Waterfront Hotel Singapore
M Hotel Singapore
MampC Hotel Operations
61
Grand Millennium Kuala Lumpur
Soft refurbishment of guestrooms from level 9 to level 19 was completed at the beginning of the 4th quarter of 2016
Remaining guestrooms at level 7 and level 8 is planned to be refurbished in the mid 2017
Assets Enhancement (On-going)
Grand Millennium Kuala Lumpur
Copthorne Hotel Auckland Harbour City
Copthorne Hotel Auckland Harbour City
Closed for a major refurbishment programme in Q3 2015 at an estimated cost of NZ$40 million
The hotel will be rebranded as M Social Hotel Auckland and is expected to re-open in 2nd quarter of 2017
Artistrsquos Impression
Artistrsquos Impression
31 Dec 31 Dec 31 Dec 31 DecHotel and Room Count 2016 2015 2016 2015By region New York 4 4 2238 2238 Regional US 15 15 4559 4463 London 8 8 2651 2651 Rest of Europe 19 18 3081 2867 Middle East 26 22 7805 6450 Singapore 7 6 3011 2716 Rest of Asia 27 26 10036 9430 Australasia 25 27 3641 3903 Total 131 126 37022 34718
PipelineBy region Middle East 17 16 5465 4663 Rest of Asia 4 3 1608 1674 Regional USA 1 1 263 263 Rest of Europe 1 - 153 - Total 23 20 7489 6600
Hotels Rooms
Hotel Room Count and Pipeline
MampC Hotel Operations
Mainly management contracts
62
Millennium Biltmore Hotel Los Angeles
Grand Millennium Auckland
Sheet1
CDL Hospitality Trusts
63
S$rsquo000 FY 2016 FY 2015 Change
Gross Revenue 180857 172410 49
Net Property Income (NPI) 137560 137003 04
Trading Performance
Hilton Cambridge City Centre ndash Executive Lounge
Artistrsquos Impression
Gross revenue and NPI increased mainly due to Inorganic contribution from Hilton Cambridge City Centre United Kingdom which
was acquired on 1 Oct 2015 Strong contribution from New Zealand hotels as a result of higher variable rental
income Incremental income boost from Japan hotels and Claymore Connect retail mall
This was partially offset by Continued weakness in Singapore and Maldives markets due to soft trading
conditions amid the global economic slowdown Lower contribution from Australia due to weaker AUD and lower variable income
contribution for FY 2016
Artistrsquos Impression
Disclaimer
This document may contain forward-looking statements that involve assumptions risks and uncertainties Actual future performance outcomes and results may differ materially from those expressed in forward-looking statements as a result of a number of risks uncertainties and assumptions Representative examples of these factors include (without limitation) general industry and economic conditions interest rate trends cost of capital and capital availability availability of real estate properties competition from other developments or companies shifts in customer demands customers and partners expected levels of occupancy rate property rental income charge out collections changes in operating expenses (including employee wages benefits and training costs) governmental and public policy changes and the continued availability of financing in the amounts and the terms necessary to support future business You are cautioned not to place undue reliance on these forward-looking statements which are based on the current view of management on future events Numbers in tables and charts may not add up due to rounding
Gramercy Park Singaporewwwcdlcomsg
Slide Number 1
Slide Number 2
Slide Number 3
Slide Number 4
Slide Number 5
Slide Number 6
Slide Number 7
Slide Number 8
Slide Number 9
Slide Number 10
Slide Number 11
Slide Number 12
Slide Number 13
Slide Number 14
Slide Number 15
Slide Number 16
Slide Number 17
Slide Number 18
Slide Number 19
Slide Number 20
Slide Number 21
Slide Number 22
Slide Number 23
Slide Number 24
Slide Number 25
Slide Number 26
Slide Number 27
Slide Number 28
Slide Number 29
Slide Number 30
Slide Number 31
Slide Number 32
Slide Number 33
Slide Number 34
Slide Number 35
Slide Number 36
Slide Number 37
Slide Number 38
Slide Number 39
Slide Number 40
Slide Number 41
Slide Number 42
Slide Number 43
Slide Number 44
Slide Number 45
Slide Number 46
Slide Number 47
Slide Number 48
Slide Number 49
Slide Number 50
Slide Number 51
Slide Number 52
Slide Number 53
Slide Number 54
Slide Number 55
Slide Number 56
Slide Number 57
Slide Number 58
Slide Number 59
Slide Number 60
Slide Number 61
Slide Number 62
Slide Number 63
Slide Number 64
Slide Number 65
Hotels
Rooms
31 Dec
31 Dec
31 Dec
31 Dec
Hotel and Room Count
2016
2015
2016
2015
By region
New York
4
4
2238
2238
Regional US
15
15
4559
4463
London
8
8
2651
2651
Rest of Europe
19
18
3081
2867
Middle East
26
22
7805
6450
Singapore
7
6
3011
2716
Rest of Asia
27
26
10036
9430
Australasia
25
27
3641
3903
Total
131
126
37022
34718
Pipeline
By region
Middle East
17
16
5465
4663
Rest of Asia
4
3
1608
1674
Regional USA
1
1
263
263
Rest of Europe
1
- 0
153
- 0
Total
23
20
7489
6600
FY 2016
Reported Currency
Constant Currency
New York
pound14564
uarr 19
darr 99
Regional US
pound5749
uarr175
uarr 40
Total US
pound8652
uarr 83
darr 42
London
pound10718
darr 14
darr 14
Rest of Europe
pound5261
uarr 20
darr 16
Total Europe
pound8024
darr 08
darr 20
Singapore
pound8021
uarr 05
darr 101
Rest of Asia
pound6063
uarr 116
uarr 19
Total Asia
pound6821
uarr 62
darr 40
Australasia
pound5840
uarr 348
uarr 209
Total Group
pound7671
uarr 66
darr 23
44
International Property DevelopmentUnlaunched Residential Projects
China ndash Good Progress on Launched Luxury Projects
International Property Development
47
Shanghai ndash Hongqiao Royal Lake (御湖)
Eling Residences Chongqing
Stable sales despite tightening measures in Shanghai
34 units soldbooked with sales value of RMB 668 millionachieved to date
Chongqing ndash Eling Residences (鹅岭峰)
Launched in Oct 2016
8 units soldbooked with sales value of RMB 85 million ndashachieved highest average values of close to RMB 40000 psm
City Equity Stake
Total Units
Total Units Sold Booked
Sold
Expected Completion
Shanghai 100 85 34 40 Completed
Hongqiao Royal Lake Shanghai
City Equity Stake
Total Units
Total Units Sold Booked
Sold
Expected Completion
Chongqing 100 126 8 6 Q2 2017
Artistrsquos Impression
As of 19 Feb 2017
Chongqing ndash Huang Huayuan (黄花园)
Scheduled launch of mixed-use development with over 600 residential units in 2019
48
Over 150000 apartment listings spanning over 20 citiesin China
Offers one-stop solution for apartment owners andrental customers
Investment provides immediate entry into this fast-growing new economy sectorminus Complement business portfoliominus Contributes to future long-term recurring income stream
Synergies to be shared with the Grouprsquos properties inShanghai Suzhou and Chongqing
Strategic Acquisition of 20 Equity Stake in mamahome for RMB 100 million
Distrii ndash Leading Provider of Co-working Space Acquisition completed in Jan 2017
Currently 15 locations (13 Shanghai + 1 Beijing + 1 Hangzhou) 3700 seating capacity in total 10 locations in operation with 5 more locations to open in 1H 2017
Targeting to double the locations in China by end 2017
Current capacity of over 2200 seats has reached above 80 occupancy
Committed to lease over 60000 sq ft in Republic Plaza Expected to open in 1H 2018
Distrii Suhe Center Shanghai
Strategic Acquisition of 24 Equity Stake in Distrii for RMB 72 million
50
Purchase of a 100 equity stake in Shanghai MeidaoInvestment Co which owns the commercial projectthat is in the final stages of construction
Total transaction value of RMB 900 million throughCDL China Limited
Strategically located in Huacao Minhang Districtwithin the Hongqiao CBD ndash a new area established in2009 that spans 86 sq km and is one of Shanghairsquosfastest growing business areas
Project comprises five 9-storey office towers and twolevels of basement carpark with about 351 lots
Project has been approved for division into strata-titleunits
China ndashAcquisition of Shanghai Commercial Project for RMB 900 million
Artistrsquos ImpressionMeidao Business Plaza Shanghai
Meidao Business Plaza ShanghaiTenure Equity
StakeEst Total GFA
(sqm)Expected
Completion
50-year lease 100 32300 2H 2017
International Rental Properties
Artistrsquos Impression
Japan ndash Invested in 2 Prime Residential Projects in Tokyo
Located within prestigious Aoyama area withinMinato ward in Tokyo
Project targeted at high-end domestic and foreignbuyers
Good uptake with over 50 of units sold since itslaunch in Oct 2016
Tokyo ndashPark Court Aoyama The Tower
International Property Development
51
Artistrsquos ImpressionPark Court Aoyama The Tower Tokyo
Tokyo ndash ShirokaneTenure Equity Stake Site Area (sqm)
Freehold 947 16815
Discussions with potential JV partner for project development ongoing
City Equity Stake Total Units
Total Units Sold Expected Completion
Freehold 20 163 Over 50 1H 2018
As of 19 Feb 2017
Teddington Riverside Teddington TW11
Full planning received works on basement car park inadvanced stage
Block A (57 units) will be launched in Q2 2017 followed byanother five blocks
International Property Development
52
UK ndash Upcoming Launches in Q2 2017
Artistrsquos Impression
Tenure EquityStake
Total Units Est TotalSaleable Area
(sq ft)
Expected Completion
Freehold 100 220 240000 2018 (Phased)
Teddington Riverside London
Project Tenure Equity Stake
Total Units
Est TotalSaleable
Area (sq ft)
Expected Completion
Belgravia Freehold 100 6 12375 Q2 2017
Knightsbridge Freehold 100 3 5193 Q2 2017
Belgravia3135 Chesham Street London SW1X 8NQ
Knightsbridge32 Hans Road London SW3 1RW
Chelsea 90-100 Sydney Street London SW3 6NJ
International Property Development
53
UK ndash Pipeline Projects
Tenure EquityStake
Total Units Est TotalSaleable Area
(sq ft)
Expected Completion
Freehold 100 9 16143 Q2 2018
Stag Brewery London
Tenure Equity Stake Est Total Saleable Area (sq ft)
Freehold 100 1000000 sq ft
Stag Brewery Mortlake London SW14
Advanced master plan at public consultation stage
Planning applications to be submitted by end Q2 2017
Proposed scheme to comprise two phases Parameter plan covering the entire site Detailed planning application for Phase 1Artistrsquos Impression
Artistrsquos Impression
Good progress on works
Expected completion in Q2 2018
International Property Development
54
Tenure Equity Stake Total Units Est GFA (sq ft)
Freehold 100 34 135000
28 Pavilion Road Knightsbridge London SW1
First luxury home care development to be built in Central Londonndash planning consent obtained
Project on target to commence demolition works in Q2 2017Artistrsquos ImpressionPavilion Road
UK ndash Pipeline Projects
Development House
Planning application to be submitted in Q2 2017
Existing 28000 sq ft remains fully leased and vacantpossession expected from Q2 2018
Development House Leonard Street in Shoreditch
Tenure Equity Stake Est Total Lettable Area (sq ft)
Freehold 100 90000 sq ft
Artistrsquos Impression
Artistrsquos Impression
UK ndashAcquisition of 16-acre Ransomes Wharf site for pound58 million
Located within Battersearsquos creative quarter on theRiver Thames
Est GDV of pound222 million
Contracts completed purchase to be phased overthe next 18 months
Profit before tax pound108m pound109m (09) pound124m (129)
PATMI pound78m pound65m 200
Trading Performance
The Baileyrsquos Hotel London The Baileyrsquos Hotel London
Increase in reported revenue attributed to higher land sales in New Zealand and a higher contribution from Millennium Mitsui Garden Hotel Tokyo coupled with favourable foreign exchange movements as a result of weak pound against major currencies
MampC Hotel Operations
58
Trading Performance
RevPAR in reported currency was up by 66 but in constant currency fell by 23 for FY 2016 as compared to the same period last year
FY 2016 Reported Currency Constant CurrencyNew York pound14564 uarr 19 darr 99Regional US pound5749 uarr175 uarr 40Total US pound8652 uarr 83 darr 42London pound10718 darr 14 darr 14Rest of Europe pound5261 uarr 20 darr 16Total Europe pound8024 darr 08 darr 20Singapore pound8021 uarr 05 darr 101Rest of Asia pound6063 uarr 116 uarr 19Total Asia pound6821 uarr 62 darr 40Australasia pound5840 uarr 348 uarr 209Total Group pound7671 uarr 66 darr 23 Millennium Seoul Hilton
Copthorne Hotel amp Resort Queenstown Lakefront
Sheet1
Developments ndash Progressing well
The lifestyle hotel and serviced apartment has 306 and 209keys respectively
The building permit approval for Seoul Yangdong developmentproject has been received on 25 January 2017 Additionalcertification processes are expected to complete by mid 2017
The main contract tender process is planned to complete bymid 2017 before construction work starts
Seoul South Korea
59
Comprises a 263-room hotel and a 250-unit residentialapartment block
The final planning approval has been received in December2016
Currently reviewing the project costing and specification whichis anticipated to take about 18 months to complete aftercommencement
Sunnyvale US
MampC Hotel Operations
MampC Hotel Operations
60
ONE UN New York
Refurbishment of guestrooms in the east tower was completed in early Sep 2016 and the towers were re-opened in time for the UN General Assembly
Assets Enhancement (Completed)
Grand Copthorne Waterfront Hotel Singapore
Work on the main lobby and FampB outlets at the main entrance level was substantially completed in May 2016
Refurbishment of function rooms on level 2 started in Sep 2016 and completed in Dec 2016
M Hotel Singapore
Soft refurbishment of all guestrooms from level 12 to level 28 is complete with the last phase completed in Dec 2016
ONE UN New York
Grand Copthorne Waterfront Hotel Singapore
M Hotel Singapore
MampC Hotel Operations
61
Grand Millennium Kuala Lumpur
Soft refurbishment of guestrooms from level 9 to level 19 was completed at the beginning of the 4th quarter of 2016
Remaining guestrooms at level 7 and level 8 is planned to be refurbished in the mid 2017
Assets Enhancement (On-going)
Grand Millennium Kuala Lumpur
Copthorne Hotel Auckland Harbour City
Copthorne Hotel Auckland Harbour City
Closed for a major refurbishment programme in Q3 2015 at an estimated cost of NZ$40 million
The hotel will be rebranded as M Social Hotel Auckland and is expected to re-open in 2nd quarter of 2017
Artistrsquos Impression
Artistrsquos Impression
31 Dec 31 Dec 31 Dec 31 DecHotel and Room Count 2016 2015 2016 2015By region New York 4 4 2238 2238 Regional US 15 15 4559 4463 London 8 8 2651 2651 Rest of Europe 19 18 3081 2867 Middle East 26 22 7805 6450 Singapore 7 6 3011 2716 Rest of Asia 27 26 10036 9430 Australasia 25 27 3641 3903 Total 131 126 37022 34718
PipelineBy region Middle East 17 16 5465 4663 Rest of Asia 4 3 1608 1674 Regional USA 1 1 263 263 Rest of Europe 1 - 153 - Total 23 20 7489 6600
Hotels Rooms
Hotel Room Count and Pipeline
MampC Hotel Operations
Mainly management contracts
62
Millennium Biltmore Hotel Los Angeles
Grand Millennium Auckland
Sheet1
CDL Hospitality Trusts
63
S$rsquo000 FY 2016 FY 2015 Change
Gross Revenue 180857 172410 49
Net Property Income (NPI) 137560 137003 04
Trading Performance
Hilton Cambridge City Centre ndash Executive Lounge
Artistrsquos Impression
Gross revenue and NPI increased mainly due to Inorganic contribution from Hilton Cambridge City Centre United Kingdom which
was acquired on 1 Oct 2015 Strong contribution from New Zealand hotels as a result of higher variable rental
income Incremental income boost from Japan hotels and Claymore Connect retail mall
This was partially offset by Continued weakness in Singapore and Maldives markets due to soft trading
conditions amid the global economic slowdown Lower contribution from Australia due to weaker AUD and lower variable income
contribution for FY 2016
Artistrsquos Impression
Disclaimer
This document may contain forward-looking statements that involve assumptions risks and uncertainties Actual future performance outcomes and results may differ materially from those expressed in forward-looking statements as a result of a number of risks uncertainties and assumptions Representative examples of these factors include (without limitation) general industry and economic conditions interest rate trends cost of capital and capital availability availability of real estate properties competition from other developments or companies shifts in customer demands customers and partners expected levels of occupancy rate property rental income charge out collections changes in operating expenses (including employee wages benefits and training costs) governmental and public policy changes and the continued availability of financing in the amounts and the terms necessary to support future business You are cautioned not to place undue reliance on these forward-looking statements which are based on the current view of management on future events Numbers in tables and charts may not add up due to rounding
Gramercy Park Singaporewwwcdlcomsg
Slide Number 1
Slide Number 2
Slide Number 3
Slide Number 4
Slide Number 5
Slide Number 6
Slide Number 7
Slide Number 8
Slide Number 9
Slide Number 10
Slide Number 11
Slide Number 12
Slide Number 13
Slide Number 14
Slide Number 15
Slide Number 16
Slide Number 17
Slide Number 18
Slide Number 19
Slide Number 20
Slide Number 21
Slide Number 22
Slide Number 23
Slide Number 24
Slide Number 25
Slide Number 26
Slide Number 27
Slide Number 28
Slide Number 29
Slide Number 30
Slide Number 31
Slide Number 32
Slide Number 33
Slide Number 34
Slide Number 35
Slide Number 36
Slide Number 37
Slide Number 38
Slide Number 39
Slide Number 40
Slide Number 41
Slide Number 42
Slide Number 43
Slide Number 44
Slide Number 45
Slide Number 46
Slide Number 47
Slide Number 48
Slide Number 49
Slide Number 50
Slide Number 51
Slide Number 52
Slide Number 53
Slide Number 54
Slide Number 55
Slide Number 56
Slide Number 57
Slide Number 58
Slide Number 59
Slide Number 60
Slide Number 61
Slide Number 62
Slide Number 63
Slide Number 64
Slide Number 65
Hotels
Rooms
31 Dec
31 Dec
31 Dec
31 Dec
Hotel and Room Count
2016
2015
2016
2015
By region
New York
4
4
2238
2238
Regional US
15
15
4559
4463
London
8
8
2651
2651
Rest of Europe
19
18
3081
2867
Middle East
26
22
7805
6450
Singapore
7
6
3011
2716
Rest of Asia
27
26
10036
9430
Australasia
25
27
3641
3903
Total
131
126
37022
34718
Pipeline
By region
Middle East
17
16
5465
4663
Rest of Asia
4
3
1608
1674
Regional USA
1
1
263
263
Rest of Europe
1
- 0
153
- 0
Total
23
20
7489
6600
FY 2016
Reported Currency
Constant Currency
New York
pound14564
uarr 19
darr 99
Regional US
pound5749
uarr175
uarr 40
Total US
pound8652
uarr 83
darr 42
London
pound10718
darr 14
darr 14
Rest of Europe
pound5261
uarr 20
darr 16
Total Europe
pound8024
darr 08
darr 20
Singapore
pound8021
uarr 05
darr 101
Rest of Asia
pound6063
uarr 116
uarr 19
Total Asia
pound6821
uarr 62
darr 40
Australasia
pound5840
uarr 348
uarr 209
Total Group
pound7671
uarr 66
darr 23
Australia
International Property Development
45
Merivale Street Residential Project ndash Ivy and Eve
City Equity Stake
Total Units
Total Units Sold
Sold
Expected Completion
Brisbane 33 472 450 95 1H 2018
Freehold project with two 30-storey towers of 1- 2- and 3-bedroom apartments in the heart of South Bank
Strong sales bookings with approx 95 of project sold todate
Construction commenced in late 2015 on track forcompletion in early 2018
Profits will be recognised upon hand over of the units
Effective economic interest is ~49
Artistrsquos ImpressionIvy and Eve Brisbane
As of 19 Feb 2017
China ndash Maiden Profits Recognised in Q4 2016
Suzhou ndash Hong Leong City Center (丰隆城市中心)
International Property Development
46
Hong Leong City Center Suzhou
Mixed-use waterfront project in Suzhou Industrial Park Phase 1 Tower 1 (462-unit residential) amp Tower 3 (912-unit
China ndash Good Progress on Launched Luxury Projects
International Property Development
47
Shanghai ndash Hongqiao Royal Lake (御湖)
Eling Residences Chongqing
Stable sales despite tightening measures in Shanghai
34 units soldbooked with sales value of RMB 668 millionachieved to date
Chongqing ndash Eling Residences (鹅岭峰)
Launched in Oct 2016
8 units soldbooked with sales value of RMB 85 million ndashachieved highest average values of close to RMB 40000 psm
City Equity Stake
Total Units
Total Units Sold Booked
Sold
Expected Completion
Shanghai 100 85 34 40 Completed
Hongqiao Royal Lake Shanghai
City Equity Stake
Total Units
Total Units Sold Booked
Sold
Expected Completion
Chongqing 100 126 8 6 Q2 2017
Artistrsquos Impression
As of 19 Feb 2017
Chongqing ndash Huang Huayuan (黄花园)
Scheduled launch of mixed-use development with over 600 residential units in 2019
48
Over 150000 apartment listings spanning over 20 citiesin China
Offers one-stop solution for apartment owners andrental customers
Investment provides immediate entry into this fast-growing new economy sectorminus Complement business portfoliominus Contributes to future long-term recurring income stream
Synergies to be shared with the Grouprsquos properties inShanghai Suzhou and Chongqing
Strategic Acquisition of 20 Equity Stake in mamahome for RMB 100 million
Distrii ndash Leading Provider of Co-working Space Acquisition completed in Jan 2017
Currently 15 locations (13 Shanghai + 1 Beijing + 1 Hangzhou) 3700 seating capacity in total 10 locations in operation with 5 more locations to open in 1H 2017
Targeting to double the locations in China by end 2017
Current capacity of over 2200 seats has reached above 80 occupancy
Committed to lease over 60000 sq ft in Republic Plaza Expected to open in 1H 2018
Distrii Suhe Center Shanghai
Strategic Acquisition of 24 Equity Stake in Distrii for RMB 72 million
50
Purchase of a 100 equity stake in Shanghai MeidaoInvestment Co which owns the commercial projectthat is in the final stages of construction
Total transaction value of RMB 900 million throughCDL China Limited
Strategically located in Huacao Minhang Districtwithin the Hongqiao CBD ndash a new area established in2009 that spans 86 sq km and is one of Shanghairsquosfastest growing business areas
Project comprises five 9-storey office towers and twolevels of basement carpark with about 351 lots
Project has been approved for division into strata-titleunits
China ndashAcquisition of Shanghai Commercial Project for RMB 900 million
Artistrsquos ImpressionMeidao Business Plaza Shanghai
Meidao Business Plaza ShanghaiTenure Equity
StakeEst Total GFA
(sqm)Expected
Completion
50-year lease 100 32300 2H 2017
International Rental Properties
Artistrsquos Impression
Japan ndash Invested in 2 Prime Residential Projects in Tokyo
Located within prestigious Aoyama area withinMinato ward in Tokyo
Project targeted at high-end domestic and foreignbuyers
Good uptake with over 50 of units sold since itslaunch in Oct 2016
Tokyo ndashPark Court Aoyama The Tower
International Property Development
51
Artistrsquos ImpressionPark Court Aoyama The Tower Tokyo
Tokyo ndash ShirokaneTenure Equity Stake Site Area (sqm)
Freehold 947 16815
Discussions with potential JV partner for project development ongoing
City Equity Stake Total Units
Total Units Sold Expected Completion
Freehold 20 163 Over 50 1H 2018
As of 19 Feb 2017
Teddington Riverside Teddington TW11
Full planning received works on basement car park inadvanced stage
Block A (57 units) will be launched in Q2 2017 followed byanother five blocks
International Property Development
52
UK ndash Upcoming Launches in Q2 2017
Artistrsquos Impression
Tenure EquityStake
Total Units Est TotalSaleable Area
(sq ft)
Expected Completion
Freehold 100 220 240000 2018 (Phased)
Teddington Riverside London
Project Tenure Equity Stake
Total Units
Est TotalSaleable
Area (sq ft)
Expected Completion
Belgravia Freehold 100 6 12375 Q2 2017
Knightsbridge Freehold 100 3 5193 Q2 2017
Belgravia3135 Chesham Street London SW1X 8NQ
Knightsbridge32 Hans Road London SW3 1RW
Chelsea 90-100 Sydney Street London SW3 6NJ
International Property Development
53
UK ndash Pipeline Projects
Tenure EquityStake
Total Units Est TotalSaleable Area
(sq ft)
Expected Completion
Freehold 100 9 16143 Q2 2018
Stag Brewery London
Tenure Equity Stake Est Total Saleable Area (sq ft)
Freehold 100 1000000 sq ft
Stag Brewery Mortlake London SW14
Advanced master plan at public consultation stage
Planning applications to be submitted by end Q2 2017
Proposed scheme to comprise two phases Parameter plan covering the entire site Detailed planning application for Phase 1Artistrsquos Impression
Artistrsquos Impression
Good progress on works
Expected completion in Q2 2018
International Property Development
54
Tenure Equity Stake Total Units Est GFA (sq ft)
Freehold 100 34 135000
28 Pavilion Road Knightsbridge London SW1
First luxury home care development to be built in Central Londonndash planning consent obtained
Project on target to commence demolition works in Q2 2017Artistrsquos ImpressionPavilion Road
UK ndash Pipeline Projects
Development House
Planning application to be submitted in Q2 2017
Existing 28000 sq ft remains fully leased and vacantpossession expected from Q2 2018
Development House Leonard Street in Shoreditch
Tenure Equity Stake Est Total Lettable Area (sq ft)
Freehold 100 90000 sq ft
Artistrsquos Impression
Artistrsquos Impression
UK ndashAcquisition of 16-acre Ransomes Wharf site for pound58 million
Located within Battersearsquos creative quarter on theRiver Thames
Est GDV of pound222 million
Contracts completed purchase to be phased overthe next 18 months
Profit before tax pound108m pound109m (09) pound124m (129)
PATMI pound78m pound65m 200
Trading Performance
The Baileyrsquos Hotel London The Baileyrsquos Hotel London
Increase in reported revenue attributed to higher land sales in New Zealand and a higher contribution from Millennium Mitsui Garden Hotel Tokyo coupled with favourable foreign exchange movements as a result of weak pound against major currencies
MampC Hotel Operations
58
Trading Performance
RevPAR in reported currency was up by 66 but in constant currency fell by 23 for FY 2016 as compared to the same period last year
FY 2016 Reported Currency Constant CurrencyNew York pound14564 uarr 19 darr 99Regional US pound5749 uarr175 uarr 40Total US pound8652 uarr 83 darr 42London pound10718 darr 14 darr 14Rest of Europe pound5261 uarr 20 darr 16Total Europe pound8024 darr 08 darr 20Singapore pound8021 uarr 05 darr 101Rest of Asia pound6063 uarr 116 uarr 19Total Asia pound6821 uarr 62 darr 40Australasia pound5840 uarr 348 uarr 209Total Group pound7671 uarr 66 darr 23 Millennium Seoul Hilton
Copthorne Hotel amp Resort Queenstown Lakefront
Sheet1
Developments ndash Progressing well
The lifestyle hotel and serviced apartment has 306 and 209keys respectively
The building permit approval for Seoul Yangdong developmentproject has been received on 25 January 2017 Additionalcertification processes are expected to complete by mid 2017
The main contract tender process is planned to complete bymid 2017 before construction work starts
Seoul South Korea
59
Comprises a 263-room hotel and a 250-unit residentialapartment block
The final planning approval has been received in December2016
Currently reviewing the project costing and specification whichis anticipated to take about 18 months to complete aftercommencement
Sunnyvale US
MampC Hotel Operations
MampC Hotel Operations
60
ONE UN New York
Refurbishment of guestrooms in the east tower was completed in early Sep 2016 and the towers were re-opened in time for the UN General Assembly
Assets Enhancement (Completed)
Grand Copthorne Waterfront Hotel Singapore
Work on the main lobby and FampB outlets at the main entrance level was substantially completed in May 2016
Refurbishment of function rooms on level 2 started in Sep 2016 and completed in Dec 2016
M Hotel Singapore
Soft refurbishment of all guestrooms from level 12 to level 28 is complete with the last phase completed in Dec 2016
ONE UN New York
Grand Copthorne Waterfront Hotel Singapore
M Hotel Singapore
MampC Hotel Operations
61
Grand Millennium Kuala Lumpur
Soft refurbishment of guestrooms from level 9 to level 19 was completed at the beginning of the 4th quarter of 2016
Remaining guestrooms at level 7 and level 8 is planned to be refurbished in the mid 2017
Assets Enhancement (On-going)
Grand Millennium Kuala Lumpur
Copthorne Hotel Auckland Harbour City
Copthorne Hotel Auckland Harbour City
Closed for a major refurbishment programme in Q3 2015 at an estimated cost of NZ$40 million
The hotel will be rebranded as M Social Hotel Auckland and is expected to re-open in 2nd quarter of 2017
Artistrsquos Impression
Artistrsquos Impression
31 Dec 31 Dec 31 Dec 31 DecHotel and Room Count 2016 2015 2016 2015By region New York 4 4 2238 2238 Regional US 15 15 4559 4463 London 8 8 2651 2651 Rest of Europe 19 18 3081 2867 Middle East 26 22 7805 6450 Singapore 7 6 3011 2716 Rest of Asia 27 26 10036 9430 Australasia 25 27 3641 3903 Total 131 126 37022 34718
PipelineBy region Middle East 17 16 5465 4663 Rest of Asia 4 3 1608 1674 Regional USA 1 1 263 263 Rest of Europe 1 - 153 - Total 23 20 7489 6600
Hotels Rooms
Hotel Room Count and Pipeline
MampC Hotel Operations
Mainly management contracts
62
Millennium Biltmore Hotel Los Angeles
Grand Millennium Auckland
Sheet1
CDL Hospitality Trusts
63
S$rsquo000 FY 2016 FY 2015 Change
Gross Revenue 180857 172410 49
Net Property Income (NPI) 137560 137003 04
Trading Performance
Hilton Cambridge City Centre ndash Executive Lounge
Artistrsquos Impression
Gross revenue and NPI increased mainly due to Inorganic contribution from Hilton Cambridge City Centre United Kingdom which
was acquired on 1 Oct 2015 Strong contribution from New Zealand hotels as a result of higher variable rental
income Incremental income boost from Japan hotels and Claymore Connect retail mall
This was partially offset by Continued weakness in Singapore and Maldives markets due to soft trading
conditions amid the global economic slowdown Lower contribution from Australia due to weaker AUD and lower variable income
contribution for FY 2016
Artistrsquos Impression
Disclaimer
This document may contain forward-looking statements that involve assumptions risks and uncertainties Actual future performance outcomes and results may differ materially from those expressed in forward-looking statements as a result of a number of risks uncertainties and assumptions Representative examples of these factors include (without limitation) general industry and economic conditions interest rate trends cost of capital and capital availability availability of real estate properties competition from other developments or companies shifts in customer demands customers and partners expected levels of occupancy rate property rental income charge out collections changes in operating expenses (including employee wages benefits and training costs) governmental and public policy changes and the continued availability of financing in the amounts and the terms necessary to support future business You are cautioned not to place undue reliance on these forward-looking statements which are based on the current view of management on future events Numbers in tables and charts may not add up due to rounding
Gramercy Park Singaporewwwcdlcomsg
Slide Number 1
Slide Number 2
Slide Number 3
Slide Number 4
Slide Number 5
Slide Number 6
Slide Number 7
Slide Number 8
Slide Number 9
Slide Number 10
Slide Number 11
Slide Number 12
Slide Number 13
Slide Number 14
Slide Number 15
Slide Number 16
Slide Number 17
Slide Number 18
Slide Number 19
Slide Number 20
Slide Number 21
Slide Number 22
Slide Number 23
Slide Number 24
Slide Number 25
Slide Number 26
Slide Number 27
Slide Number 28
Slide Number 29
Slide Number 30
Slide Number 31
Slide Number 32
Slide Number 33
Slide Number 34
Slide Number 35
Slide Number 36
Slide Number 37
Slide Number 38
Slide Number 39
Slide Number 40
Slide Number 41
Slide Number 42
Slide Number 43
Slide Number 44
Slide Number 45
Slide Number 46
Slide Number 47
Slide Number 48
Slide Number 49
Slide Number 50
Slide Number 51
Slide Number 52
Slide Number 53
Slide Number 54
Slide Number 55
Slide Number 56
Slide Number 57
Slide Number 58
Slide Number 59
Slide Number 60
Slide Number 61
Slide Number 62
Slide Number 63
Slide Number 64
Slide Number 65
Hotels
Rooms
31 Dec
31 Dec
31 Dec
31 Dec
Hotel and Room Count
2016
2015
2016
2015
By region
New York
4
4
2238
2238
Regional US
15
15
4559
4463
London
8
8
2651
2651
Rest of Europe
19
18
3081
2867
Middle East
26
22
7805
6450
Singapore
7
6
3011
2716
Rest of Asia
27
26
10036
9430
Australasia
25
27
3641
3903
Total
131
126
37022
34718
Pipeline
By region
Middle East
17
16
5465
4663
Rest of Asia
4
3
1608
1674
Regional USA
1
1
263
263
Rest of Europe
1
- 0
153
- 0
Total
23
20
7489
6600
FY 2016
Reported Currency
Constant Currency
New York
pound14564
uarr 19
darr 99
Regional US
pound5749
uarr175
uarr 40
Total US
pound8652
uarr 83
darr 42
London
pound10718
darr 14
darr 14
Rest of Europe
pound5261
uarr 20
darr 16
Total Europe
pound8024
darr 08
darr 20
Singapore
pound8021
uarr 05
darr 101
Rest of Asia
pound6063
uarr 116
uarr 19
Total Asia
pound6821
uarr 62
darr 40
Australasia
pound5840
uarr 348
uarr 209
Total Group
pound7671
uarr 66
darr 23
49
International Investment Platforms
Distrii ndash Leading Provider of Co-working Space Acquisition completed in Jan 2017
Currently 15 locations (13 Shanghai + 1 Beijing + 1 Hangzhou) 3700 seating capacity in total 10 locations in operation with 5 more locations to open in 1H 2017
Targeting to double the locations in China by end 2017
Current capacity of over 2200 seats has reached above 80 occupancy
Committed to lease over 60000 sq ft in Republic Plaza Expected to open in 1H 2018
Distrii Suhe Center Shanghai
Strategic Acquisition of 24 Equity Stake in Distrii for RMB 72 million
50
Purchase of a 100 equity stake in Shanghai MeidaoInvestment Co which owns the commercial projectthat is in the final stages of construction
Total transaction value of RMB 900 million throughCDL China Limited
Strategically located in Huacao Minhang Districtwithin the Hongqiao CBD ndash a new area established in2009 that spans 86 sq km and is one of Shanghairsquosfastest growing business areas
Project comprises five 9-storey office towers and twolevels of basement carpark with about 351 lots
Project has been approved for division into strata-titleunits
China ndashAcquisition of Shanghai Commercial Project for RMB 900 million
Artistrsquos ImpressionMeidao Business Plaza Shanghai
Meidao Business Plaza ShanghaiTenure Equity
StakeEst Total GFA
(sqm)Expected
Completion
50-year lease 100 32300 2H 2017
International Rental Properties
Artistrsquos Impression
Japan ndash Invested in 2 Prime Residential Projects in Tokyo
Located within prestigious Aoyama area withinMinato ward in Tokyo
Project targeted at high-end domestic and foreignbuyers
Good uptake with over 50 of units sold since itslaunch in Oct 2016
Tokyo ndashPark Court Aoyama The Tower
International Property Development
51
Artistrsquos ImpressionPark Court Aoyama The Tower Tokyo
Tokyo ndash ShirokaneTenure Equity Stake Site Area (sqm)
Freehold 947 16815
Discussions with potential JV partner for project development ongoing
City Equity Stake Total Units
Total Units Sold Expected Completion
Freehold 20 163 Over 50 1H 2018
As of 19 Feb 2017
Teddington Riverside Teddington TW11
Full planning received works on basement car park inadvanced stage
Block A (57 units) will be launched in Q2 2017 followed byanother five blocks
International Property Development
52
UK ndash Upcoming Launches in Q2 2017
Artistrsquos Impression
Tenure EquityStake
Total Units Est TotalSaleable Area
(sq ft)
Expected Completion
Freehold 100 220 240000 2018 (Phased)
Teddington Riverside London
Project Tenure Equity Stake
Total Units
Est TotalSaleable
Area (sq ft)
Expected Completion
Belgravia Freehold 100 6 12375 Q2 2017
Knightsbridge Freehold 100 3 5193 Q2 2017
Belgravia3135 Chesham Street London SW1X 8NQ
Knightsbridge32 Hans Road London SW3 1RW
Chelsea 90-100 Sydney Street London SW3 6NJ
International Property Development
53
UK ndash Pipeline Projects
Tenure EquityStake
Total Units Est TotalSaleable Area
(sq ft)
Expected Completion
Freehold 100 9 16143 Q2 2018
Stag Brewery London
Tenure Equity Stake Est Total Saleable Area (sq ft)
Freehold 100 1000000 sq ft
Stag Brewery Mortlake London SW14
Advanced master plan at public consultation stage
Planning applications to be submitted by end Q2 2017
Proposed scheme to comprise two phases Parameter plan covering the entire site Detailed planning application for Phase 1Artistrsquos Impression
Artistrsquos Impression
Good progress on works
Expected completion in Q2 2018
International Property Development
54
Tenure Equity Stake Total Units Est GFA (sq ft)
Freehold 100 34 135000
28 Pavilion Road Knightsbridge London SW1
First luxury home care development to be built in Central Londonndash planning consent obtained
Project on target to commence demolition works in Q2 2017Artistrsquos ImpressionPavilion Road
UK ndash Pipeline Projects
Development House
Planning application to be submitted in Q2 2017
Existing 28000 sq ft remains fully leased and vacantpossession expected from Q2 2018
Development House Leonard Street in Shoreditch
Tenure Equity Stake Est Total Lettable Area (sq ft)
Freehold 100 90000 sq ft
Artistrsquos Impression
Artistrsquos Impression
UK ndashAcquisition of 16-acre Ransomes Wharf site for pound58 million
Located within Battersearsquos creative quarter on theRiver Thames
Est GDV of pound222 million
Contracts completed purchase to be phased overthe next 18 months
Profit before tax pound108m pound109m (09) pound124m (129)
PATMI pound78m pound65m 200
Trading Performance
The Baileyrsquos Hotel London The Baileyrsquos Hotel London
Increase in reported revenue attributed to higher land sales in New Zealand and a higher contribution from Millennium Mitsui Garden Hotel Tokyo coupled with favourable foreign exchange movements as a result of weak pound against major currencies
MampC Hotel Operations
58
Trading Performance
RevPAR in reported currency was up by 66 but in constant currency fell by 23 for FY 2016 as compared to the same period last year
FY 2016 Reported Currency Constant CurrencyNew York pound14564 uarr 19 darr 99Regional US pound5749 uarr175 uarr 40Total US pound8652 uarr 83 darr 42London pound10718 darr 14 darr 14Rest of Europe pound5261 uarr 20 darr 16Total Europe pound8024 darr 08 darr 20Singapore pound8021 uarr 05 darr 101Rest of Asia pound6063 uarr 116 uarr 19Total Asia pound6821 uarr 62 darr 40Australasia pound5840 uarr 348 uarr 209Total Group pound7671 uarr 66 darr 23 Millennium Seoul Hilton
Copthorne Hotel amp Resort Queenstown Lakefront
Sheet1
Developments ndash Progressing well
The lifestyle hotel and serviced apartment has 306 and 209keys respectively
The building permit approval for Seoul Yangdong developmentproject has been received on 25 January 2017 Additionalcertification processes are expected to complete by mid 2017
The main contract tender process is planned to complete bymid 2017 before construction work starts
Seoul South Korea
59
Comprises a 263-room hotel and a 250-unit residentialapartment block
The final planning approval has been received in December2016
Currently reviewing the project costing and specification whichis anticipated to take about 18 months to complete aftercommencement
Sunnyvale US
MampC Hotel Operations
MampC Hotel Operations
60
ONE UN New York
Refurbishment of guestrooms in the east tower was completed in early Sep 2016 and the towers were re-opened in time for the UN General Assembly
Assets Enhancement (Completed)
Grand Copthorne Waterfront Hotel Singapore
Work on the main lobby and FampB outlets at the main entrance level was substantially completed in May 2016
Refurbishment of function rooms on level 2 started in Sep 2016 and completed in Dec 2016
M Hotel Singapore
Soft refurbishment of all guestrooms from level 12 to level 28 is complete with the last phase completed in Dec 2016
ONE UN New York
Grand Copthorne Waterfront Hotel Singapore
M Hotel Singapore
MampC Hotel Operations
61
Grand Millennium Kuala Lumpur
Soft refurbishment of guestrooms from level 9 to level 19 was completed at the beginning of the 4th quarter of 2016
Remaining guestrooms at level 7 and level 8 is planned to be refurbished in the mid 2017
Assets Enhancement (On-going)
Grand Millennium Kuala Lumpur
Copthorne Hotel Auckland Harbour City
Copthorne Hotel Auckland Harbour City
Closed for a major refurbishment programme in Q3 2015 at an estimated cost of NZ$40 million
The hotel will be rebranded as M Social Hotel Auckland and is expected to re-open in 2nd quarter of 2017
Artistrsquos Impression
Artistrsquos Impression
31 Dec 31 Dec 31 Dec 31 DecHotel and Room Count 2016 2015 2016 2015By region New York 4 4 2238 2238 Regional US 15 15 4559 4463 London 8 8 2651 2651 Rest of Europe 19 18 3081 2867 Middle East 26 22 7805 6450 Singapore 7 6 3011 2716 Rest of Asia 27 26 10036 9430 Australasia 25 27 3641 3903 Total 131 126 37022 34718
PipelineBy region Middle East 17 16 5465 4663 Rest of Asia 4 3 1608 1674 Regional USA 1 1 263 263 Rest of Europe 1 - 153 - Total 23 20 7489 6600
Hotels Rooms
Hotel Room Count and Pipeline
MampC Hotel Operations
Mainly management contracts
62
Millennium Biltmore Hotel Los Angeles
Grand Millennium Auckland
Sheet1
CDL Hospitality Trusts
63
S$rsquo000 FY 2016 FY 2015 Change
Gross Revenue 180857 172410 49
Net Property Income (NPI) 137560 137003 04
Trading Performance
Hilton Cambridge City Centre ndash Executive Lounge
Artistrsquos Impression
Gross revenue and NPI increased mainly due to Inorganic contribution from Hilton Cambridge City Centre United Kingdom which
was acquired on 1 Oct 2015 Strong contribution from New Zealand hotels as a result of higher variable rental
income Incremental income boost from Japan hotels and Claymore Connect retail mall
This was partially offset by Continued weakness in Singapore and Maldives markets due to soft trading
conditions amid the global economic slowdown Lower contribution from Australia due to weaker AUD and lower variable income
contribution for FY 2016
Artistrsquos Impression
Disclaimer
This document may contain forward-looking statements that involve assumptions risks and uncertainties Actual future performance outcomes and results may differ materially from those expressed in forward-looking statements as a result of a number of risks uncertainties and assumptions Representative examples of these factors include (without limitation) general industry and economic conditions interest rate trends cost of capital and capital availability availability of real estate properties competition from other developments or companies shifts in customer demands customers and partners expected levels of occupancy rate property rental income charge out collections changes in operating expenses (including employee wages benefits and training costs) governmental and public policy changes and the continued availability of financing in the amounts and the terms necessary to support future business You are cautioned not to place undue reliance on these forward-looking statements which are based on the current view of management on future events Numbers in tables and charts may not add up due to rounding
Gramercy Park Singaporewwwcdlcomsg
Slide Number 1
Slide Number 2
Slide Number 3
Slide Number 4
Slide Number 5
Slide Number 6
Slide Number 7
Slide Number 8
Slide Number 9
Slide Number 10
Slide Number 11
Slide Number 12
Slide Number 13
Slide Number 14
Slide Number 15
Slide Number 16
Slide Number 17
Slide Number 18
Slide Number 19
Slide Number 20
Slide Number 21
Slide Number 22
Slide Number 23
Slide Number 24
Slide Number 25
Slide Number 26
Slide Number 27
Slide Number 28
Slide Number 29
Slide Number 30
Slide Number 31
Slide Number 32
Slide Number 33
Slide Number 34
Slide Number 35
Slide Number 36
Slide Number 37
Slide Number 38
Slide Number 39
Slide Number 40
Slide Number 41
Slide Number 42
Slide Number 43
Slide Number 44
Slide Number 45
Slide Number 46
Slide Number 47
Slide Number 48
Slide Number 49
Slide Number 50
Slide Number 51
Slide Number 52
Slide Number 53
Slide Number 54
Slide Number 55
Slide Number 56
Slide Number 57
Slide Number 58
Slide Number 59
Slide Number 60
Slide Number 61
Slide Number 62
Slide Number 63
Slide Number 64
Slide Number 65
Hotels
Rooms
31 Dec
31 Dec
31 Dec
31 Dec
Hotel and Room Count
2016
2015
2016
2015
By region
New York
4
4
2238
2238
Regional US
15
15
4559
4463
London
8
8
2651
2651
Rest of Europe
19
18
3081
2867
Middle East
26
22
7805
6450
Singapore
7
6
3011
2716
Rest of Asia
27
26
10036
9430
Australasia
25
27
3641
3903
Total
131
126
37022
34718
Pipeline
By region
Middle East
17
16
5465
4663
Rest of Asia
4
3
1608
1674
Regional USA
1
1
263
263
Rest of Europe
1
- 0
153
- 0
Total
23
20
7489
6600
FY 2016
Reported Currency
Constant Currency
New York
pound14564
uarr 19
darr 99
Regional US
pound5749
uarr175
uarr 40
Total US
pound8652
uarr 83
darr 42
London
pound10718
darr 14
darr 14
Rest of Europe
pound5261
uarr 20
darr 16
Total Europe
pound8024
darr 08
darr 20
Singapore
pound8021
uarr 05
darr 101
Rest of Asia
pound6063
uarr 116
uarr 19
Total Asia
pound6821
uarr 62
darr 40
Australasia
pound5840
uarr 348
uarr 209
Total Group
pound7671
uarr 66
darr 23
Artistrsquos Impression
Japan ndash Invested in 2 Prime Residential Projects in Tokyo
Located within prestigious Aoyama area withinMinato ward in Tokyo
Project targeted at high-end domestic and foreignbuyers
Good uptake with over 50 of units sold since itslaunch in Oct 2016
Tokyo ndashPark Court Aoyama The Tower
International Property Development
51
Artistrsquos ImpressionPark Court Aoyama The Tower Tokyo
Tokyo ndash ShirokaneTenure Equity Stake Site Area (sqm)
Freehold 947 16815
Discussions with potential JV partner for project development ongoing
City Equity Stake Total Units
Total Units Sold Expected Completion
Freehold 20 163 Over 50 1H 2018
As of 19 Feb 2017
Teddington Riverside Teddington TW11
Full planning received works on basement car park inadvanced stage
Block A (57 units) will be launched in Q2 2017 followed byanother five blocks
International Property Development
52
UK ndash Upcoming Launches in Q2 2017
Artistrsquos Impression
Tenure EquityStake
Total Units Est TotalSaleable Area
(sq ft)
Expected Completion
Freehold 100 220 240000 2018 (Phased)
Teddington Riverside London
Project Tenure Equity Stake
Total Units
Est TotalSaleable
Area (sq ft)
Expected Completion
Belgravia Freehold 100 6 12375 Q2 2017
Knightsbridge Freehold 100 3 5193 Q2 2017
Belgravia3135 Chesham Street London SW1X 8NQ
Knightsbridge32 Hans Road London SW3 1RW
Chelsea 90-100 Sydney Street London SW3 6NJ
International Property Development
53
UK ndash Pipeline Projects
Tenure EquityStake
Total Units Est TotalSaleable Area
(sq ft)
Expected Completion
Freehold 100 9 16143 Q2 2018
Stag Brewery London
Tenure Equity Stake Est Total Saleable Area (sq ft)
Freehold 100 1000000 sq ft
Stag Brewery Mortlake London SW14
Advanced master plan at public consultation stage
Planning applications to be submitted by end Q2 2017
Proposed scheme to comprise two phases Parameter plan covering the entire site Detailed planning application for Phase 1Artistrsquos Impression
Artistrsquos Impression
Good progress on works
Expected completion in Q2 2018
International Property Development
54
Tenure Equity Stake Total Units Est GFA (sq ft)
Freehold 100 34 135000
28 Pavilion Road Knightsbridge London SW1
First luxury home care development to be built in Central Londonndash planning consent obtained
Project on target to commence demolition works in Q2 2017Artistrsquos ImpressionPavilion Road
UK ndash Pipeline Projects
Development House
Planning application to be submitted in Q2 2017
Existing 28000 sq ft remains fully leased and vacantpossession expected from Q2 2018
Development House Leonard Street in Shoreditch
Tenure Equity Stake Est Total Lettable Area (sq ft)
Freehold 100 90000 sq ft
Artistrsquos Impression
Artistrsquos Impression
UK ndashAcquisition of 16-acre Ransomes Wharf site for pound58 million
Located within Battersearsquos creative quarter on theRiver Thames
Est GDV of pound222 million
Contracts completed purchase to be phased overthe next 18 months
Profit before tax pound108m pound109m (09) pound124m (129)
PATMI pound78m pound65m 200
Trading Performance
The Baileyrsquos Hotel London The Baileyrsquos Hotel London
Increase in reported revenue attributed to higher land sales in New Zealand and a higher contribution from Millennium Mitsui Garden Hotel Tokyo coupled with favourable foreign exchange movements as a result of weak pound against major currencies
MampC Hotel Operations
58
Trading Performance
RevPAR in reported currency was up by 66 but in constant currency fell by 23 for FY 2016 as compared to the same period last year
FY 2016 Reported Currency Constant CurrencyNew York pound14564 uarr 19 darr 99Regional US pound5749 uarr175 uarr 40Total US pound8652 uarr 83 darr 42London pound10718 darr 14 darr 14Rest of Europe pound5261 uarr 20 darr 16Total Europe pound8024 darr 08 darr 20Singapore pound8021 uarr 05 darr 101Rest of Asia pound6063 uarr 116 uarr 19Total Asia pound6821 uarr 62 darr 40Australasia pound5840 uarr 348 uarr 209Total Group pound7671 uarr 66 darr 23 Millennium Seoul Hilton
Copthorne Hotel amp Resort Queenstown Lakefront
Sheet1
Developments ndash Progressing well
The lifestyle hotel and serviced apartment has 306 and 209keys respectively
The building permit approval for Seoul Yangdong developmentproject has been received on 25 January 2017 Additionalcertification processes are expected to complete by mid 2017
The main contract tender process is planned to complete bymid 2017 before construction work starts
Seoul South Korea
59
Comprises a 263-room hotel and a 250-unit residentialapartment block
The final planning approval has been received in December2016
Currently reviewing the project costing and specification whichis anticipated to take about 18 months to complete aftercommencement
Sunnyvale US
MampC Hotel Operations
MampC Hotel Operations
60
ONE UN New York
Refurbishment of guestrooms in the east tower was completed in early Sep 2016 and the towers were re-opened in time for the UN General Assembly
Assets Enhancement (Completed)
Grand Copthorne Waterfront Hotel Singapore
Work on the main lobby and FampB outlets at the main entrance level was substantially completed in May 2016
Refurbishment of function rooms on level 2 started in Sep 2016 and completed in Dec 2016
M Hotel Singapore
Soft refurbishment of all guestrooms from level 12 to level 28 is complete with the last phase completed in Dec 2016
ONE UN New York
Grand Copthorne Waterfront Hotel Singapore
M Hotel Singapore
MampC Hotel Operations
61
Grand Millennium Kuala Lumpur
Soft refurbishment of guestrooms from level 9 to level 19 was completed at the beginning of the 4th quarter of 2016
Remaining guestrooms at level 7 and level 8 is planned to be refurbished in the mid 2017
Assets Enhancement (On-going)
Grand Millennium Kuala Lumpur
Copthorne Hotel Auckland Harbour City
Copthorne Hotel Auckland Harbour City
Closed for a major refurbishment programme in Q3 2015 at an estimated cost of NZ$40 million
The hotel will be rebranded as M Social Hotel Auckland and is expected to re-open in 2nd quarter of 2017
Artistrsquos Impression
Artistrsquos Impression
31 Dec 31 Dec 31 Dec 31 DecHotel and Room Count 2016 2015 2016 2015By region New York 4 4 2238 2238 Regional US 15 15 4559 4463 London 8 8 2651 2651 Rest of Europe 19 18 3081 2867 Middle East 26 22 7805 6450 Singapore 7 6 3011 2716 Rest of Asia 27 26 10036 9430 Australasia 25 27 3641 3903 Total 131 126 37022 34718
PipelineBy region Middle East 17 16 5465 4663 Rest of Asia 4 3 1608 1674 Regional USA 1 1 263 263 Rest of Europe 1 - 153 - Total 23 20 7489 6600
Hotels Rooms
Hotel Room Count and Pipeline
MampC Hotel Operations
Mainly management contracts
62
Millennium Biltmore Hotel Los Angeles
Grand Millennium Auckland
Sheet1
CDL Hospitality Trusts
63
S$rsquo000 FY 2016 FY 2015 Change
Gross Revenue 180857 172410 49
Net Property Income (NPI) 137560 137003 04
Trading Performance
Hilton Cambridge City Centre ndash Executive Lounge
Artistrsquos Impression
Gross revenue and NPI increased mainly due to Inorganic contribution from Hilton Cambridge City Centre United Kingdom which
was acquired on 1 Oct 2015 Strong contribution from New Zealand hotels as a result of higher variable rental
income Incremental income boost from Japan hotels and Claymore Connect retail mall
This was partially offset by Continued weakness in Singapore and Maldives markets due to soft trading
conditions amid the global economic slowdown Lower contribution from Australia due to weaker AUD and lower variable income
contribution for FY 2016
Artistrsquos Impression
Disclaimer
This document may contain forward-looking statements that involve assumptions risks and uncertainties Actual future performance outcomes and results may differ materially from those expressed in forward-looking statements as a result of a number of risks uncertainties and assumptions Representative examples of these factors include (without limitation) general industry and economic conditions interest rate trends cost of capital and capital availability availability of real estate properties competition from other developments or companies shifts in customer demands customers and partners expected levels of occupancy rate property rental income charge out collections changes in operating expenses (including employee wages benefits and training costs) governmental and public policy changes and the continued availability of financing in the amounts and the terms necessary to support future business You are cautioned not to place undue reliance on these forward-looking statements which are based on the current view of management on future events Numbers in tables and charts may not add up due to rounding
Gramercy Park Singaporewwwcdlcomsg
Slide Number 1
Slide Number 2
Slide Number 3
Slide Number 4
Slide Number 5
Slide Number 6
Slide Number 7
Slide Number 8
Slide Number 9
Slide Number 10
Slide Number 11
Slide Number 12
Slide Number 13
Slide Number 14
Slide Number 15
Slide Number 16
Slide Number 17
Slide Number 18
Slide Number 19
Slide Number 20
Slide Number 21
Slide Number 22
Slide Number 23
Slide Number 24
Slide Number 25
Slide Number 26
Slide Number 27
Slide Number 28
Slide Number 29
Slide Number 30
Slide Number 31
Slide Number 32
Slide Number 33
Slide Number 34
Slide Number 35
Slide Number 36
Slide Number 37
Slide Number 38
Slide Number 39
Slide Number 40
Slide Number 41
Slide Number 42
Slide Number 43
Slide Number 44
Slide Number 45
Slide Number 46
Slide Number 47
Slide Number 48
Slide Number 49
Slide Number 50
Slide Number 51
Slide Number 52
Slide Number 53
Slide Number 54
Slide Number 55
Slide Number 56
Slide Number 57
Slide Number 58
Slide Number 59
Slide Number 60
Slide Number 61
Slide Number 62
Slide Number 63
Slide Number 64
Slide Number 65
Hotels
Rooms
31 Dec
31 Dec
31 Dec
31 Dec
Hotel and Room Count
2016
2015
2016
2015
By region
New York
4
4
2238
2238
Regional US
15
15
4559
4463
London
8
8
2651
2651
Rest of Europe
19
18
3081
2867
Middle East
26
22
7805
6450
Singapore
7
6
3011
2716
Rest of Asia
27
26
10036
9430
Australasia
25
27
3641
3903
Total
131
126
37022
34718
Pipeline
By region
Middle East
17
16
5465
4663
Rest of Asia
4
3
1608
1674
Regional USA
1
1
263
263
Rest of Europe
1
- 0
153
- 0
Total
23
20
7489
6600
FY 2016
Reported Currency
Constant Currency
New York
pound14564
uarr 19
darr 99
Regional US
pound5749
uarr175
uarr 40
Total US
pound8652
uarr 83
darr 42
London
pound10718
darr 14
darr 14
Rest of Europe
pound5261
uarr 20
darr 16
Total Europe
pound8024
darr 08
darr 20
Singapore
pound8021
uarr 05
darr 101
Rest of Asia
pound6063
uarr 116
uarr 19
Total Asia
pound6821
uarr 62
darr 40
Australasia
pound5840
uarr 348
uarr 209
Total Group
pound7671
uarr 66
darr 23
Artistrsquos Impression
UK ndashAcquisition of 16-acre Ransomes Wharf site for pound58 million
Located within Battersearsquos creative quarter on theRiver Thames
Est GDV of pound222 million
Contracts completed purchase to be phased overthe next 18 months
Profit before tax pound108m pound109m (09) pound124m (129)
PATMI pound78m pound65m 200
Trading Performance
The Baileyrsquos Hotel London The Baileyrsquos Hotel London
Increase in reported revenue attributed to higher land sales in New Zealand and a higher contribution from Millennium Mitsui Garden Hotel Tokyo coupled with favourable foreign exchange movements as a result of weak pound against major currencies
MampC Hotel Operations
58
Trading Performance
RevPAR in reported currency was up by 66 but in constant currency fell by 23 for FY 2016 as compared to the same period last year
FY 2016 Reported Currency Constant CurrencyNew York pound14564 uarr 19 darr 99Regional US pound5749 uarr175 uarr 40Total US pound8652 uarr 83 darr 42London pound10718 darr 14 darr 14Rest of Europe pound5261 uarr 20 darr 16Total Europe pound8024 darr 08 darr 20Singapore pound8021 uarr 05 darr 101Rest of Asia pound6063 uarr 116 uarr 19Total Asia pound6821 uarr 62 darr 40Australasia pound5840 uarr 348 uarr 209Total Group pound7671 uarr 66 darr 23 Millennium Seoul Hilton
Copthorne Hotel amp Resort Queenstown Lakefront
Sheet1
Developments ndash Progressing well
The lifestyle hotel and serviced apartment has 306 and 209keys respectively
The building permit approval for Seoul Yangdong developmentproject has been received on 25 January 2017 Additionalcertification processes are expected to complete by mid 2017
The main contract tender process is planned to complete bymid 2017 before construction work starts
Seoul South Korea
59
Comprises a 263-room hotel and a 250-unit residentialapartment block
The final planning approval has been received in December2016
Currently reviewing the project costing and specification whichis anticipated to take about 18 months to complete aftercommencement
Sunnyvale US
MampC Hotel Operations
MampC Hotel Operations
60
ONE UN New York
Refurbishment of guestrooms in the east tower was completed in early Sep 2016 and the towers were re-opened in time for the UN General Assembly
Assets Enhancement (Completed)
Grand Copthorne Waterfront Hotel Singapore
Work on the main lobby and FampB outlets at the main entrance level was substantially completed in May 2016
Refurbishment of function rooms on level 2 started in Sep 2016 and completed in Dec 2016
M Hotel Singapore
Soft refurbishment of all guestrooms from level 12 to level 28 is complete with the last phase completed in Dec 2016
ONE UN New York
Grand Copthorne Waterfront Hotel Singapore
M Hotel Singapore
MampC Hotel Operations
61
Grand Millennium Kuala Lumpur
Soft refurbishment of guestrooms from level 9 to level 19 was completed at the beginning of the 4th quarter of 2016
Remaining guestrooms at level 7 and level 8 is planned to be refurbished in the mid 2017
Assets Enhancement (On-going)
Grand Millennium Kuala Lumpur
Copthorne Hotel Auckland Harbour City
Copthorne Hotel Auckland Harbour City
Closed for a major refurbishment programme in Q3 2015 at an estimated cost of NZ$40 million
The hotel will be rebranded as M Social Hotel Auckland and is expected to re-open in 2nd quarter of 2017
Artistrsquos Impression
Artistrsquos Impression
31 Dec 31 Dec 31 Dec 31 DecHotel and Room Count 2016 2015 2016 2015By region New York 4 4 2238 2238 Regional US 15 15 4559 4463 London 8 8 2651 2651 Rest of Europe 19 18 3081 2867 Middle East 26 22 7805 6450 Singapore 7 6 3011 2716 Rest of Asia 27 26 10036 9430 Australasia 25 27 3641 3903 Total 131 126 37022 34718
PipelineBy region Middle East 17 16 5465 4663 Rest of Asia 4 3 1608 1674 Regional USA 1 1 263 263 Rest of Europe 1 - 153 - Total 23 20 7489 6600
Hotels Rooms
Hotel Room Count and Pipeline
MampC Hotel Operations
Mainly management contracts
62
Millennium Biltmore Hotel Los Angeles
Grand Millennium Auckland
Sheet1
CDL Hospitality Trusts
63
S$rsquo000 FY 2016 FY 2015 Change
Gross Revenue 180857 172410 49
Net Property Income (NPI) 137560 137003 04
Trading Performance
Hilton Cambridge City Centre ndash Executive Lounge
Artistrsquos Impression
Gross revenue and NPI increased mainly due to Inorganic contribution from Hilton Cambridge City Centre United Kingdom which
was acquired on 1 Oct 2015 Strong contribution from New Zealand hotels as a result of higher variable rental
income Incremental income boost from Japan hotels and Claymore Connect retail mall
This was partially offset by Continued weakness in Singapore and Maldives markets due to soft trading
conditions amid the global economic slowdown Lower contribution from Australia due to weaker AUD and lower variable income
contribution for FY 2016
Artistrsquos Impression
Disclaimer
This document may contain forward-looking statements that involve assumptions risks and uncertainties Actual future performance outcomes and results may differ materially from those expressed in forward-looking statements as a result of a number of risks uncertainties and assumptions Representative examples of these factors include (without limitation) general industry and economic conditions interest rate trends cost of capital and capital availability availability of real estate properties competition from other developments or companies shifts in customer demands customers and partners expected levels of occupancy rate property rental income charge out collections changes in operating expenses (including employee wages benefits and training costs) governmental and public policy changes and the continued availability of financing in the amounts and the terms necessary to support future business You are cautioned not to place undue reliance on these forward-looking statements which are based on the current view of management on future events Numbers in tables and charts may not add up due to rounding
Gramercy Park Singaporewwwcdlcomsg
Slide Number 1
Slide Number 2
Slide Number 3
Slide Number 4
Slide Number 5
Slide Number 6
Slide Number 7
Slide Number 8
Slide Number 9
Slide Number 10
Slide Number 11
Slide Number 12
Slide Number 13
Slide Number 14
Slide Number 15
Slide Number 16
Slide Number 17
Slide Number 18
Slide Number 19
Slide Number 20
Slide Number 21
Slide Number 22
Slide Number 23
Slide Number 24
Slide Number 25
Slide Number 26
Slide Number 27
Slide Number 28
Slide Number 29
Slide Number 30
Slide Number 31
Slide Number 32
Slide Number 33
Slide Number 34
Slide Number 35
Slide Number 36
Slide Number 37
Slide Number 38
Slide Number 39
Slide Number 40
Slide Number 41
Slide Number 42
Slide Number 43
Slide Number 44
Slide Number 45
Slide Number 46
Slide Number 47
Slide Number 48
Slide Number 49
Slide Number 50
Slide Number 51
Slide Number 52
Slide Number 53
Slide Number 54
Slide Number 55
Slide Number 56
Slide Number 57
Slide Number 58
Slide Number 59
Slide Number 60
Slide Number 61
Slide Number 62
Slide Number 63
Slide Number 64
Slide Number 65
Hotels
Rooms
31 Dec
31 Dec
31 Dec
31 Dec
Hotel and Room Count
2016
2015
2016
2015
By region
New York
4
4
2238
2238
Regional US
15
15
4559
4463
London
8
8
2651
2651
Rest of Europe
19
18
3081
2867
Middle East
26
22
7805
6450
Singapore
7
6
3011
2716
Rest of Asia
27
26
10036
9430
Australasia
25
27
3641
3903
Total
131
126
37022
34718
Pipeline
By region
Middle East
17
16
5465
4663
Rest of Asia
4
3
1608
1674
Regional USA
1
1
263
263
Rest of Europe
1
- 0
153
- 0
Total
23
20
7489
6600
FY 2016
Reported Currency
Constant Currency
New York
pound14564
uarr 19
darr 99
Regional US
pound5749
uarr175
uarr 40
Total US
pound8652
uarr 83
darr 42
London
pound10718
darr 14
darr 14
Rest of Europe
pound5261
uarr 20
darr 16
Total Europe
pound8024
darr 08
darr 20
Singapore
pound8021
uarr 05
darr 101
Rest of Asia
pound6063
uarr 116
uarr 19
Total Asia
pound6821
uarr 62
darr 40
Australasia
pound5840
uarr 348
uarr 209
Total Group
pound7671
uarr 66
darr 23
MampC Hotel Operations
58
Trading Performance
RevPAR in reported currency was up by 66 but in constant currency fell by 23 for FY 2016 as compared to the same period last year
FY 2016 Reported Currency Constant CurrencyNew York pound14564 uarr 19 darr 99Regional US pound5749 uarr175 uarr 40Total US pound8652 uarr 83 darr 42London pound10718 darr 14 darr 14Rest of Europe pound5261 uarr 20 darr 16Total Europe pound8024 darr 08 darr 20Singapore pound8021 uarr 05 darr 101Rest of Asia pound6063 uarr 116 uarr 19Total Asia pound6821 uarr 62 darr 40Australasia pound5840 uarr 348 uarr 209Total Group pound7671 uarr 66 darr 23 Millennium Seoul Hilton
Copthorne Hotel amp Resort Queenstown Lakefront
Sheet1
Developments ndash Progressing well
The lifestyle hotel and serviced apartment has 306 and 209keys respectively
The building permit approval for Seoul Yangdong developmentproject has been received on 25 January 2017 Additionalcertification processes are expected to complete by mid 2017
The main contract tender process is planned to complete bymid 2017 before construction work starts
Seoul South Korea
59
Comprises a 263-room hotel and a 250-unit residentialapartment block
The final planning approval has been received in December2016
Currently reviewing the project costing and specification whichis anticipated to take about 18 months to complete aftercommencement
Sunnyvale US
MampC Hotel Operations
MampC Hotel Operations
60
ONE UN New York
Refurbishment of guestrooms in the east tower was completed in early Sep 2016 and the towers were re-opened in time for the UN General Assembly
Assets Enhancement (Completed)
Grand Copthorne Waterfront Hotel Singapore
Work on the main lobby and FampB outlets at the main entrance level was substantially completed in May 2016
Refurbishment of function rooms on level 2 started in Sep 2016 and completed in Dec 2016
M Hotel Singapore
Soft refurbishment of all guestrooms from level 12 to level 28 is complete with the last phase completed in Dec 2016
ONE UN New York
Grand Copthorne Waterfront Hotel Singapore
M Hotel Singapore
MampC Hotel Operations
61
Grand Millennium Kuala Lumpur
Soft refurbishment of guestrooms from level 9 to level 19 was completed at the beginning of the 4th quarter of 2016
Remaining guestrooms at level 7 and level 8 is planned to be refurbished in the mid 2017
Assets Enhancement (On-going)
Grand Millennium Kuala Lumpur
Copthorne Hotel Auckland Harbour City
Copthorne Hotel Auckland Harbour City
Closed for a major refurbishment programme in Q3 2015 at an estimated cost of NZ$40 million
The hotel will be rebranded as M Social Hotel Auckland and is expected to re-open in 2nd quarter of 2017
Artistrsquos Impression
Artistrsquos Impression
31 Dec 31 Dec 31 Dec 31 DecHotel and Room Count 2016 2015 2016 2015By region New York 4 4 2238 2238 Regional US 15 15 4559 4463 London 8 8 2651 2651 Rest of Europe 19 18 3081 2867 Middle East 26 22 7805 6450 Singapore 7 6 3011 2716 Rest of Asia 27 26 10036 9430 Australasia 25 27 3641 3903 Total 131 126 37022 34718
PipelineBy region Middle East 17 16 5465 4663 Rest of Asia 4 3 1608 1674 Regional USA 1 1 263 263 Rest of Europe 1 - 153 - Total 23 20 7489 6600
Hotels Rooms
Hotel Room Count and Pipeline
MampC Hotel Operations
Mainly management contracts
62
Millennium Biltmore Hotel Los Angeles
Grand Millennium Auckland
Sheet1
CDL Hospitality Trusts
63
S$rsquo000 FY 2016 FY 2015 Change
Gross Revenue 180857 172410 49
Net Property Income (NPI) 137560 137003 04
Trading Performance
Hilton Cambridge City Centre ndash Executive Lounge
Artistrsquos Impression
Gross revenue and NPI increased mainly due to Inorganic contribution from Hilton Cambridge City Centre United Kingdom which
was acquired on 1 Oct 2015 Strong contribution from New Zealand hotels as a result of higher variable rental
income Incremental income boost from Japan hotels and Claymore Connect retail mall
This was partially offset by Continued weakness in Singapore and Maldives markets due to soft trading
conditions amid the global economic slowdown Lower contribution from Australia due to weaker AUD and lower variable income
contribution for FY 2016
Artistrsquos Impression
Disclaimer
This document may contain forward-looking statements that involve assumptions risks and uncertainties Actual future performance outcomes and results may differ materially from those expressed in forward-looking statements as a result of a number of risks uncertainties and assumptions Representative examples of these factors include (without limitation) general industry and economic conditions interest rate trends cost of capital and capital availability availability of real estate properties competition from other developments or companies shifts in customer demands customers and partners expected levels of occupancy rate property rental income charge out collections changes in operating expenses (including employee wages benefits and training costs) governmental and public policy changes and the continued availability of financing in the amounts and the terms necessary to support future business You are cautioned not to place undue reliance on these forward-looking statements which are based on the current view of management on future events Numbers in tables and charts may not add up due to rounding
Gramercy Park Singaporewwwcdlcomsg
Slide Number 1
Slide Number 2
Slide Number 3
Slide Number 4
Slide Number 5
Slide Number 6
Slide Number 7
Slide Number 8
Slide Number 9
Slide Number 10
Slide Number 11
Slide Number 12
Slide Number 13
Slide Number 14
Slide Number 15
Slide Number 16
Slide Number 17
Slide Number 18
Slide Number 19
Slide Number 20
Slide Number 21
Slide Number 22
Slide Number 23
Slide Number 24
Slide Number 25
Slide Number 26
Slide Number 27
Slide Number 28
Slide Number 29
Slide Number 30
Slide Number 31
Slide Number 32
Slide Number 33
Slide Number 34
Slide Number 35
Slide Number 36
Slide Number 37
Slide Number 38
Slide Number 39
Slide Number 40
Slide Number 41
Slide Number 42
Slide Number 43
Slide Number 44
Slide Number 45
Slide Number 46
Slide Number 47
Slide Number 48
Slide Number 49
Slide Number 50
Slide Number 51
Slide Number 52
Slide Number 53
Slide Number 54
Slide Number 55
Slide Number 56
Slide Number 57
Slide Number 58
Slide Number 59
Slide Number 60
Slide Number 61
Slide Number 62
Slide Number 63
Slide Number 64
Slide Number 65
Hotels
Rooms
31 Dec
31 Dec
31 Dec
31 Dec
Hotel and Room Count
2016
2015
2016
2015
By region
New York
4
4
2238
2238
Regional US
15
15
4559
4463
London
8
8
2651
2651
Rest of Europe
19
18
3081
2867
Middle East
26
22
7805
6450
Singapore
7
6
3011
2716
Rest of Asia
27
26
10036
9430
Australasia
25
27
3641
3903
Total
131
126
37022
34718
Pipeline
By region
Middle East
17
16
5465
4663
Rest of Asia
4
3
1608
1674
Regional USA
1
1
263
263
Rest of Europe
1
- 0
153
- 0
Total
23
20
7489
6600
FY 2016
Reported Currency
Constant Currency
New York
pound14564
uarr 19
darr 99
Regional US
pound5749
uarr175
uarr 40
Total US
pound8652
uarr 83
darr 42
London
pound10718
darr 14
darr 14
Rest of Europe
pound5261
uarr 20
darr 16
Total Europe
pound8024
darr 08
darr 20
Singapore
pound8021
uarr 05
darr 101
Rest of Asia
pound6063
uarr 116
uarr 19
Total Asia
pound6821
uarr 62
darr 40
Australasia
pound5840
uarr 348
uarr 209
Total Group
pound7671
uarr 66
darr 23
Developments ndash Progressing well
The lifestyle hotel and serviced apartment has 306 and 209keys respectively
The building permit approval for Seoul Yangdong developmentproject has been received on 25 January 2017 Additionalcertification processes are expected to complete by mid 2017
The main contract tender process is planned to complete bymid 2017 before construction work starts
Seoul South Korea
59
Comprises a 263-room hotel and a 250-unit residentialapartment block
The final planning approval has been received in December2016
Currently reviewing the project costing and specification whichis anticipated to take about 18 months to complete aftercommencement
Sunnyvale US
MampC Hotel Operations
MampC Hotel Operations
60
ONE UN New York
Refurbishment of guestrooms in the east tower was completed in early Sep 2016 and the towers were re-opened in time for the UN General Assembly
Assets Enhancement (Completed)
Grand Copthorne Waterfront Hotel Singapore
Work on the main lobby and FampB outlets at the main entrance level was substantially completed in May 2016
Refurbishment of function rooms on level 2 started in Sep 2016 and completed in Dec 2016
M Hotel Singapore
Soft refurbishment of all guestrooms from level 12 to level 28 is complete with the last phase completed in Dec 2016
ONE UN New York
Grand Copthorne Waterfront Hotel Singapore
M Hotel Singapore
MampC Hotel Operations
61
Grand Millennium Kuala Lumpur
Soft refurbishment of guestrooms from level 9 to level 19 was completed at the beginning of the 4th quarter of 2016
Remaining guestrooms at level 7 and level 8 is planned to be refurbished in the mid 2017
Assets Enhancement (On-going)
Grand Millennium Kuala Lumpur
Copthorne Hotel Auckland Harbour City
Copthorne Hotel Auckland Harbour City
Closed for a major refurbishment programme in Q3 2015 at an estimated cost of NZ$40 million
The hotel will be rebranded as M Social Hotel Auckland and is expected to re-open in 2nd quarter of 2017
Artistrsquos Impression
Artistrsquos Impression
31 Dec 31 Dec 31 Dec 31 DecHotel and Room Count 2016 2015 2016 2015By region New York 4 4 2238 2238 Regional US 15 15 4559 4463 London 8 8 2651 2651 Rest of Europe 19 18 3081 2867 Middle East 26 22 7805 6450 Singapore 7 6 3011 2716 Rest of Asia 27 26 10036 9430 Australasia 25 27 3641 3903 Total 131 126 37022 34718
PipelineBy region Middle East 17 16 5465 4663 Rest of Asia 4 3 1608 1674 Regional USA 1 1 263 263 Rest of Europe 1 - 153 - Total 23 20 7489 6600
Hotels Rooms
Hotel Room Count and Pipeline
MampC Hotel Operations
Mainly management contracts
62
Millennium Biltmore Hotel Los Angeles
Grand Millennium Auckland
Sheet1
CDL Hospitality Trusts
63
S$rsquo000 FY 2016 FY 2015 Change
Gross Revenue 180857 172410 49
Net Property Income (NPI) 137560 137003 04
Trading Performance
Hilton Cambridge City Centre ndash Executive Lounge
Artistrsquos Impression
Gross revenue and NPI increased mainly due to Inorganic contribution from Hilton Cambridge City Centre United Kingdom which
was acquired on 1 Oct 2015 Strong contribution from New Zealand hotels as a result of higher variable rental
income Incremental income boost from Japan hotels and Claymore Connect retail mall
This was partially offset by Continued weakness in Singapore and Maldives markets due to soft trading
conditions amid the global economic slowdown Lower contribution from Australia due to weaker AUD and lower variable income
contribution for FY 2016
Artistrsquos Impression
Disclaimer
This document may contain forward-looking statements that involve assumptions risks and uncertainties Actual future performance outcomes and results may differ materially from those expressed in forward-looking statements as a result of a number of risks uncertainties and assumptions Representative examples of these factors include (without limitation) general industry and economic conditions interest rate trends cost of capital and capital availability availability of real estate properties competition from other developments or companies shifts in customer demands customers and partners expected levels of occupancy rate property rental income charge out collections changes in operating expenses (including employee wages benefits and training costs) governmental and public policy changes and the continued availability of financing in the amounts and the terms necessary to support future business You are cautioned not to place undue reliance on these forward-looking statements which are based on the current view of management on future events Numbers in tables and charts may not add up due to rounding
Gramercy Park Singaporewwwcdlcomsg
Slide Number 1
Slide Number 2
Slide Number 3
Slide Number 4
Slide Number 5
Slide Number 6
Slide Number 7
Slide Number 8
Slide Number 9
Slide Number 10
Slide Number 11
Slide Number 12
Slide Number 13
Slide Number 14
Slide Number 15
Slide Number 16
Slide Number 17
Slide Number 18
Slide Number 19
Slide Number 20
Slide Number 21
Slide Number 22
Slide Number 23
Slide Number 24
Slide Number 25
Slide Number 26
Slide Number 27
Slide Number 28
Slide Number 29
Slide Number 30
Slide Number 31
Slide Number 32
Slide Number 33
Slide Number 34
Slide Number 35
Slide Number 36
Slide Number 37
Slide Number 38
Slide Number 39
Slide Number 40
Slide Number 41
Slide Number 42
Slide Number 43
Slide Number 44
Slide Number 45
Slide Number 46
Slide Number 47
Slide Number 48
Slide Number 49
Slide Number 50
Slide Number 51
Slide Number 52
Slide Number 53
Slide Number 54
Slide Number 55
Slide Number 56
Slide Number 57
Slide Number 58
Slide Number 59
Slide Number 60
Slide Number 61
Slide Number 62
Slide Number 63
Slide Number 64
Slide Number 65
Hotels
Rooms
31 Dec
31 Dec
31 Dec
31 Dec
Hotel and Room Count
2016
2015
2016
2015
By region
New York
4
4
2238
2238
Regional US
15
15
4559
4463
London
8
8
2651
2651
Rest of Europe
19
18
3081
2867
Middle East
26
22
7805
6450
Singapore
7
6
3011
2716
Rest of Asia
27
26
10036
9430
Australasia
25
27
3641
3903
Total
131
126
37022
34718
Pipeline
By region
Middle East
17
16
5465
4663
Rest of Asia
4
3
1608
1674
Regional USA
1
1
263
263
Rest of Europe
1
- 0
153
- 0
Total
23
20
7489
6600
MampC Hotel Operations
61
Grand Millennium Kuala Lumpur
Soft refurbishment of guestrooms from level 9 to level 19 was completed at the beginning of the 4th quarter of 2016
Remaining guestrooms at level 7 and level 8 is planned to be refurbished in the mid 2017
Assets Enhancement (On-going)
Grand Millennium Kuala Lumpur
Copthorne Hotel Auckland Harbour City
Copthorne Hotel Auckland Harbour City
Closed for a major refurbishment programme in Q3 2015 at an estimated cost of NZ$40 million
The hotel will be rebranded as M Social Hotel Auckland and is expected to re-open in 2nd quarter of 2017
Artistrsquos Impression
Artistrsquos Impression
31 Dec 31 Dec 31 Dec 31 DecHotel and Room Count 2016 2015 2016 2015By region New York 4 4 2238 2238 Regional US 15 15 4559 4463 London 8 8 2651 2651 Rest of Europe 19 18 3081 2867 Middle East 26 22 7805 6450 Singapore 7 6 3011 2716 Rest of Asia 27 26 10036 9430 Australasia 25 27 3641 3903 Total 131 126 37022 34718
PipelineBy region Middle East 17 16 5465 4663 Rest of Asia 4 3 1608 1674 Regional USA 1 1 263 263 Rest of Europe 1 - 153 - Total 23 20 7489 6600
Hotels Rooms
Hotel Room Count and Pipeline
MampC Hotel Operations
Mainly management contracts
62
Millennium Biltmore Hotel Los Angeles
Grand Millennium Auckland
Sheet1
CDL Hospitality Trusts
63
S$rsquo000 FY 2016 FY 2015 Change
Gross Revenue 180857 172410 49
Net Property Income (NPI) 137560 137003 04
Trading Performance
Hilton Cambridge City Centre ndash Executive Lounge
Artistrsquos Impression
Gross revenue and NPI increased mainly due to Inorganic contribution from Hilton Cambridge City Centre United Kingdom which
was acquired on 1 Oct 2015 Strong contribution from New Zealand hotels as a result of higher variable rental
income Incremental income boost from Japan hotels and Claymore Connect retail mall
This was partially offset by Continued weakness in Singapore and Maldives markets due to soft trading
conditions amid the global economic slowdown Lower contribution from Australia due to weaker AUD and lower variable income
contribution for FY 2016
Artistrsquos Impression
Disclaimer
This document may contain forward-looking statements that involve assumptions risks and uncertainties Actual future performance outcomes and results may differ materially from those expressed in forward-looking statements as a result of a number of risks uncertainties and assumptions Representative examples of these factors include (without limitation) general industry and economic conditions interest rate trends cost of capital and capital availability availability of real estate properties competition from other developments or companies shifts in customer demands customers and partners expected levels of occupancy rate property rental income charge out collections changes in operating expenses (including employee wages benefits and training costs) governmental and public policy changes and the continued availability of financing in the amounts and the terms necessary to support future business You are cautioned not to place undue reliance on these forward-looking statements which are based on the current view of management on future events Numbers in tables and charts may not add up due to rounding
Gramercy Park Singaporewwwcdlcomsg
Slide Number 1
Slide Number 2
Slide Number 3
Slide Number 4
Slide Number 5
Slide Number 6
Slide Number 7
Slide Number 8
Slide Number 9
Slide Number 10
Slide Number 11
Slide Number 12
Slide Number 13
Slide Number 14
Slide Number 15
Slide Number 16
Slide Number 17
Slide Number 18
Slide Number 19
Slide Number 20
Slide Number 21
Slide Number 22
Slide Number 23
Slide Number 24
Slide Number 25
Slide Number 26
Slide Number 27
Slide Number 28
Slide Number 29
Slide Number 30
Slide Number 31
Slide Number 32
Slide Number 33
Slide Number 34
Slide Number 35
Slide Number 36
Slide Number 37
Slide Number 38
Slide Number 39
Slide Number 40
Slide Number 41
Slide Number 42
Slide Number 43
Slide Number 44
Slide Number 45
Slide Number 46
Slide Number 47
Slide Number 48
Slide Number 49
Slide Number 50
Slide Number 51
Slide Number 52
Slide Number 53
Slide Number 54
Slide Number 55
Slide Number 56
Slide Number 57
Slide Number 58
Slide Number 59
Slide Number 60
Slide Number 61
Slide Number 62
Slide Number 63
Slide Number 64
Slide Number 65
Hotels
Rooms
31 Dec
31 Dec
31 Dec
31 Dec
Hotel and Room Count
2016
2015
2016
2015
By region
New York
4
4
2238
2238
Regional US
15
15
4559
4463
London
8
8
2651
2651
Rest of Europe
19
18
3081
2867
Middle East
26
22
7805
6450
Singapore
7
6
3011
2716
Rest of Asia
27
26
10036
9430
Australasia
25
27
3641
3903
Total
131
126
37022
34718
Pipeline
By region
Middle East
17
16
5465
4663
Rest of Asia
4
3
1608
1674
Regional USA
1
1
263
263
Rest of Europe
1
- 0
153
- 0
Total
23
20
7489
6600
Artistrsquos Impression
Artistrsquos Impression
31 Dec 31 Dec 31 Dec 31 DecHotel and Room Count 2016 2015 2016 2015By region New York 4 4 2238 2238 Regional US 15 15 4559 4463 London 8 8 2651 2651 Rest of Europe 19 18 3081 2867 Middle East 26 22 7805 6450 Singapore 7 6 3011 2716 Rest of Asia 27 26 10036 9430 Australasia 25 27 3641 3903 Total 131 126 37022 34718
PipelineBy region Middle East 17 16 5465 4663 Rest of Asia 4 3 1608 1674 Regional USA 1 1 263 263 Rest of Europe 1 - 153 - Total 23 20 7489 6600
Hotels Rooms
Hotel Room Count and Pipeline
MampC Hotel Operations
Mainly management contracts
62
Millennium Biltmore Hotel Los Angeles
Grand Millennium Auckland
Sheet1
CDL Hospitality Trusts
63
S$rsquo000 FY 2016 FY 2015 Change
Gross Revenue 180857 172410 49
Net Property Income (NPI) 137560 137003 04
Trading Performance
Hilton Cambridge City Centre ndash Executive Lounge
Artistrsquos Impression
Gross revenue and NPI increased mainly due to Inorganic contribution from Hilton Cambridge City Centre United Kingdom which
was acquired on 1 Oct 2015 Strong contribution from New Zealand hotels as a result of higher variable rental
income Incremental income boost from Japan hotels and Claymore Connect retail mall
This was partially offset by Continued weakness in Singapore and Maldives markets due to soft trading
conditions amid the global economic slowdown Lower contribution from Australia due to weaker AUD and lower variable income
contribution for FY 2016
Artistrsquos Impression
Disclaimer
This document may contain forward-looking statements that involve assumptions risks and uncertainties Actual future performance outcomes and results may differ materially from those expressed in forward-looking statements as a result of a number of risks uncertainties and assumptions Representative examples of these factors include (without limitation) general industry and economic conditions interest rate trends cost of capital and capital availability availability of real estate properties competition from other developments or companies shifts in customer demands customers and partners expected levels of occupancy rate property rental income charge out collections changes in operating expenses (including employee wages benefits and training costs) governmental and public policy changes and the continued availability of financing in the amounts and the terms necessary to support future business You are cautioned not to place undue reliance on these forward-looking statements which are based on the current view of management on future events Numbers in tables and charts may not add up due to rounding
Gramercy Park Singaporewwwcdlcomsg
Slide Number 1
Slide Number 2
Slide Number 3
Slide Number 4
Slide Number 5
Slide Number 6
Slide Number 7
Slide Number 8
Slide Number 9
Slide Number 10
Slide Number 11
Slide Number 12
Slide Number 13
Slide Number 14
Slide Number 15
Slide Number 16
Slide Number 17
Slide Number 18
Slide Number 19
Slide Number 20
Slide Number 21
Slide Number 22
Slide Number 23
Slide Number 24
Slide Number 25
Slide Number 26
Slide Number 27
Slide Number 28
Slide Number 29
Slide Number 30
Slide Number 31
Slide Number 32
Slide Number 33
Slide Number 34
Slide Number 35
Slide Number 36
Slide Number 37
Slide Number 38
Slide Number 39
Slide Number 40
Slide Number 41
Slide Number 42
Slide Number 43
Slide Number 44
Slide Number 45
Slide Number 46
Slide Number 47
Slide Number 48
Slide Number 49
Slide Number 50
Slide Number 51
Slide Number 52
Slide Number 53
Slide Number 54
Slide Number 55
Slide Number 56
Slide Number 57
Slide Number 58
Slide Number 59
Slide Number 60
Slide Number 61
Slide Number 62
Slide Number 63
Slide Number 64
Slide Number 65
Hotels
Rooms
31 Dec
31 Dec
31 Dec
31 Dec
Hotel and Room Count
2016
2015
2016
2015
By region
New York
4
4
2238
2238
Regional US
15
15
4559
4463
London
8
8
2651
2651
Rest of Europe
19
18
3081
2867
Middle East
26
22
7805
6450
Singapore
7
6
3011
2716
Rest of Asia
27
26
10036
9430
Australasia
25
27
3641
3903
Total
131
126
37022
34718
Pipeline
By region
Middle East
17
16
5465
4663
Rest of Asia
4
3
1608
1674
Regional USA
1
1
263
263
Rest of Europe
1
- 0
153
- 0
Total
23
20
7489
6600
CDL Hospitality Trusts
63
S$rsquo000 FY 2016 FY 2015 Change
Gross Revenue 180857 172410 49
Net Property Income (NPI) 137560 137003 04
Trading Performance
Hilton Cambridge City Centre ndash Executive Lounge
Artistrsquos Impression
Gross revenue and NPI increased mainly due to Inorganic contribution from Hilton Cambridge City Centre United Kingdom which
was acquired on 1 Oct 2015 Strong contribution from New Zealand hotels as a result of higher variable rental
income Incremental income boost from Japan hotels and Claymore Connect retail mall
This was partially offset by Continued weakness in Singapore and Maldives markets due to soft trading
conditions amid the global economic slowdown Lower contribution from Australia due to weaker AUD and lower variable income
contribution for FY 2016
Artistrsquos Impression
Disclaimer
This document may contain forward-looking statements that involve assumptions risks and uncertainties Actual future performance outcomes and results may differ materially from those expressed in forward-looking statements as a result of a number of risks uncertainties and assumptions Representative examples of these factors include (without limitation) general industry and economic conditions interest rate trends cost of capital and capital availability availability of real estate properties competition from other developments or companies shifts in customer demands customers and partners expected levels of occupancy rate property rental income charge out collections changes in operating expenses (including employee wages benefits and training costs) governmental and public policy changes and the continued availability of financing in the amounts and the terms necessary to support future business You are cautioned not to place undue reliance on these forward-looking statements which are based on the current view of management on future events Numbers in tables and charts may not add up due to rounding
Gramercy Park Singaporewwwcdlcomsg
Slide Number 1
Slide Number 2
Slide Number 3
Slide Number 4
Slide Number 5
Slide Number 6
Slide Number 7
Slide Number 8
Slide Number 9
Slide Number 10
Slide Number 11
Slide Number 12
Slide Number 13
Slide Number 14
Slide Number 15
Slide Number 16
Slide Number 17
Slide Number 18
Slide Number 19
Slide Number 20
Slide Number 21
Slide Number 22
Slide Number 23
Slide Number 24
Slide Number 25
Slide Number 26
Slide Number 27
Slide Number 28
Slide Number 29
Slide Number 30
Slide Number 31
Slide Number 32
Slide Number 33
Slide Number 34
Slide Number 35
Slide Number 36
Slide Number 37
Slide Number 38
Slide Number 39
Slide Number 40
Slide Number 41
Slide Number 42
Slide Number 43
Slide Number 44
Slide Number 45
Slide Number 46
Slide Number 47
Slide Number 48
Slide Number 49
Slide Number 50
Slide Number 51
Slide Number 52
Slide Number 53
Slide Number 54
Slide Number 55
Slide Number 56
Slide Number 57
Slide Number 58
Slide Number 59
Slide Number 60
Slide Number 61
Slide Number 62
Slide Number 63
Slide Number 64
Slide Number 65
Disclaimer
This document may contain forward-looking statements that involve assumptions risks and uncertainties Actual future performance outcomes and results may differ materially from those expressed in forward-looking statements as a result of a number of risks uncertainties and assumptions Representative examples of these factors include (without limitation) general industry and economic conditions interest rate trends cost of capital and capital availability availability of real estate properties competition from other developments or companies shifts in customer demands customers and partners expected levels of occupancy rate property rental income charge out collections changes in operating expenses (including employee wages benefits and training costs) governmental and public policy changes and the continued availability of financing in the amounts and the terms necessary to support future business You are cautioned not to place undue reliance on these forward-looking statements which are based on the current view of management on future events Numbers in tables and charts may not add up due to rounding