full year 2017 podcast ad revenue study - iab.com€¦ · june 2018 full year 2017 podcast ad...
TRANSCRIPT

June 2018
Full Year 2017 Podcast Ad Revenue Study:An Analysis of the US Podcast Advertising Industry
An industry survey sponsored by the Interactive Advertising Bureau (IAB) and PricewaterhouseCoopers (PwC)

Background
Survey Scope & Methodology
Executive Summary
Study Findings
• Year-on-year growth
• Year-on-year growth trends
• Quarterly trends
• Three year forecast
• Revenue by Campaign Type
• Revenue by Ad Type
• Revenue by Buy Type
• Revenue by Pricing Model
• Revenue by Delivery Mechanism
• Revenue by Content Genre
• Revenue by Industry Category
Glossary of Relevant Advertising Terminology
About
Contact
Outline
FY 2017 Podcast Ad Revenue Study, June 20182

The Podcast Advertising Revenue Study was initiated by the Interactive Advertising Bureau’s (IAB) Audio Industry Working Group in 2017. This study utilizes data and information reported directly from companies selling advertising on podcast platforms. The results reported are considered to be a reasonable measurement of podcast advertising revenues because much of the data is compiled directly from the revenue generating companies.
Background
About the Podcast Advertising Revenue Study
FY 2017 Podcast Ad Revenue Study, June 20183

Survey scope
The Podcast Advertising Revenue Study is part of an ongoing IAB mission to provide a barometer of podcast advertising growth.
To achieve differentiation from existing estimates and accomplish industry-wide acceptance, key aspects of the survey include:
• Obtaining revenue data directly from companies generating podcast (publishers and advertising networks) advertising revenues;
• Acquiring supplemental and non-participating company data and applying a conservative revenue estimate;
• Designing the process to maintain participant anonymity and only release aggregate data;
• Excluding podcast advertising revenues generated outside of the United States.
Methodology
The methodology employed here is similar to the methodology that has been used to conduct the half-year and full-year internet advertising revenue report since 1996.
The reporting process includes:
• Compiling a database of the largest podcast advertising revenue generators, which are believed to make up a significant portion of the overall market;
• Conducting a quantitative mailing survey with leading industry players, including podcast publishers and ad networks;
• Requesting and compiling several specific data items, including quarterly net commissionable advertising revenue by delivery mechanism, advertisement type, campaign type, buy type, pricing model, podcast content genre, and advertising industry category;
• Performing a podcast advertising market sizing to deliver a reasonable estimate of the market in the United States, inclusive of non-survey participating companies;
• Analyzing the findings, identifying and reporting key trends.
&
FY 2017 Podcast Ad Revenue Study, June 2018
Survey Scope & Methodology
4

FY 2017 Podcast Ad Revenue Study, June 2018
Executive Summary
2017 full year highlights
Key trends underlying FY 2017 results
Self-reported podcast advertising revenues (“revenues”) in the United States totaled $257.4 million for the full year (“FY”) of 2017, in a market estimated to total $313.9 million.
• FY 2017 results are comprised of self-reported data from 19 companies that generate revenue from podcast advertising in the US, versus 20 companies in 2016.
• Self-reported year-on-year revenue increased 117% in 2017, from FY 2016’s self-reported revenue of $118.8 million.
• Total market year-on-year revenue estimate increased 86% in 2017, from FY 2016’s total market estimate of $169.1 million.
• Total market year-on-year revenue is estimated to grow by 28% in 2018, from FY 2017’s total market estimate of $313.9 million.
5

FY 2017 Podcast Ad Revenue Study, June 2018
Year-on-year growth from 2016 and 2017 was significant for both self-reported revenues (117%) and the total market estimate (86%).
6
$118.9
$169.1
$257.4
$313.9
$0.0
$50.0
$100.0
$150.0
$200.0
$250.0
$300.0
$350.0
Self-Reported Revenues Total Market Estimate
Self-reported revenues and total market estimates, 2016 and 2017 (in millions)
FY 2016 FY 2017
117%
86%
Self-reported advertising revenues represent the companies surveyed, less than 100% of the total podcast advertising marketTotal Market Estimate represents 100% of the US total podcast advertising market

Self-reported revenues have increased 275% from 2015 to 2017. 2017 self-reported actual revenues were 17% above the 2017 self-reported estimate of $220 million.
7
$68.6
$118.9
$257.4
$0.0
$50.0
$100.0
$150.0
$200.0
$250.0
$300.0
FY 2015 FY 2016 FY 2017
Self-Reported Podcast Advertising Revenue, 2015 - 2017 (in millions)
73%
117%
FY 2017 Podcast Ad Revenue Study, June 2018
Self-reported advertising revenues represent the companies surveyed, less than 100% of the total podcast advertising market

Self-reported advertising revenues represent the companies surveyed, less than 100% of the total podcast advertising market
* CQGR – Compound Quarterly Growth Rate
FY 2017 Podcast Ad Revenue Study, June 2018
Self-reported podcast advertising revenue continued to rise steadily, growing 94% between Q4 2016 and Q4 2017 and yielding an 18% compound quarterly growth rate.
$12.1 $15.7 $18.2 $22.6 $22.8$27.6 $28.7
$39.8
$51.9$60.6
$67.8$77.1
$0.0
$10.0
$20.0
$30.0
$40.0
$50.0
$60.0
$70.0
$80.0
$90.0
Q1 2015 Q2 2015 Q3 2015 Q4 2015 Q1 2016 Q2 2016 Q3 2016 Q4 2016 Q1 2017 Q2 2017 Q3 2017 Q4 2017
Self-reported podcast advertising revenue, by Quarter, 2015 – 2017 (in millions)
8

*2017 - 2020 revenues are an estimate based total market sizing, not self-reported revenuesMarket Sizing represents an estimate of the total US total podcast advertising market
FY 2017 Podcast Ad Revenue Study, June 2018
US podcast advertising revenue is expected to grow more than 110% by 202o, to $659.0 million.
9
$313.9
$402.0
$514.5
$659.0
$0.0
$100.0
$200.0
$300.0
$400.0
$500.0
$600.0
$700.0
FY 2017* FY 2018* FY 2019* FY 2020*
Market Sizing (in millions)
111%

Revenue by Campaign Type – 2016 to 2017
By campaign type, Direct response ads continue to make up the majority of category revenue; however, they decreased from 73.0% of total revenues in 2016 to 64.2% of total revenues in 2017. From 2016 to 2017, Brand Awareness ad revenue representation increased from 25.4% to 29.2%, respectively; and, finally Branded Content ad revenue representation increased from 2016’s 1.5% to 6.5% in 2017.
FY 2017 Podcast Ad Revenue Study, June 2018
73.0%
25.4%
1.5%0.0%
2016
Direct Response Ad Brand Awareness Ad
Branded Content Product Placement
64.2%
29.2%
6.5% 0.0%
2017
Direct Response Ad Brand Awareness Ad
Branded Content Product Placement
10Revenue breakouts represent self-reporting companies, less than 100% of the total podcast advertising market

Revenue by Ad Type* – 2017
Host Read Ads continue to be the preferred Ad Type, representing more than two-thirds of ad types in 2017. Supplied Ads (Radio), appearing on the study survey for the first time this year, represented half of a percent of revenue generating ad types.
FY 2017 Podcast Ad Revenue Study, June 2018
32.7%
66.9%
0.5%2017
Announcer-read / Pre-Produced Ads Host-Read Ads Supplied Ads (Radio) Supplied Ads (Non-radio)
11
*New question asked on the FY 2017 study survey; data was not collected in PY
Revenue breakouts represent self-reporting companies, less than 100% of the total podcast advertising market

Revenue by Buy Type* – 2017
Annual and Quarterly Buys make up more than 70% of Buy Types.
FY 2017 Podcast Ad Revenue Study, June 2018
37.5%
33.1%
23.8%
0.7% 5.0%
2017
Annual Quarterly Remnant / Transactional / Scattered Programmatic Other
12
*New question asked on the FY 2017 study survey; data was not collected in PY
Revenue breakouts represent self-reporting companies, less than 100% of the total podcast advertising market

Revenue by Pricing Model* – 2017
Cost per thousand is the dominant pricing model in 2017, representing 85% of purchased ads
FY 2017 Podcast Ad Revenue Study, June 2018
7.9%
85.1%
0.0%
1.7% 5.3%
2017
Series ownership Cost per thousand Cost per listen Cost per acquisition Flat fee
13
*New question asked on the FY 2017 study survey; data was not collected in PY
Revenue breakouts represent self-reporting companies, less than 100% of the total podcast advertising market
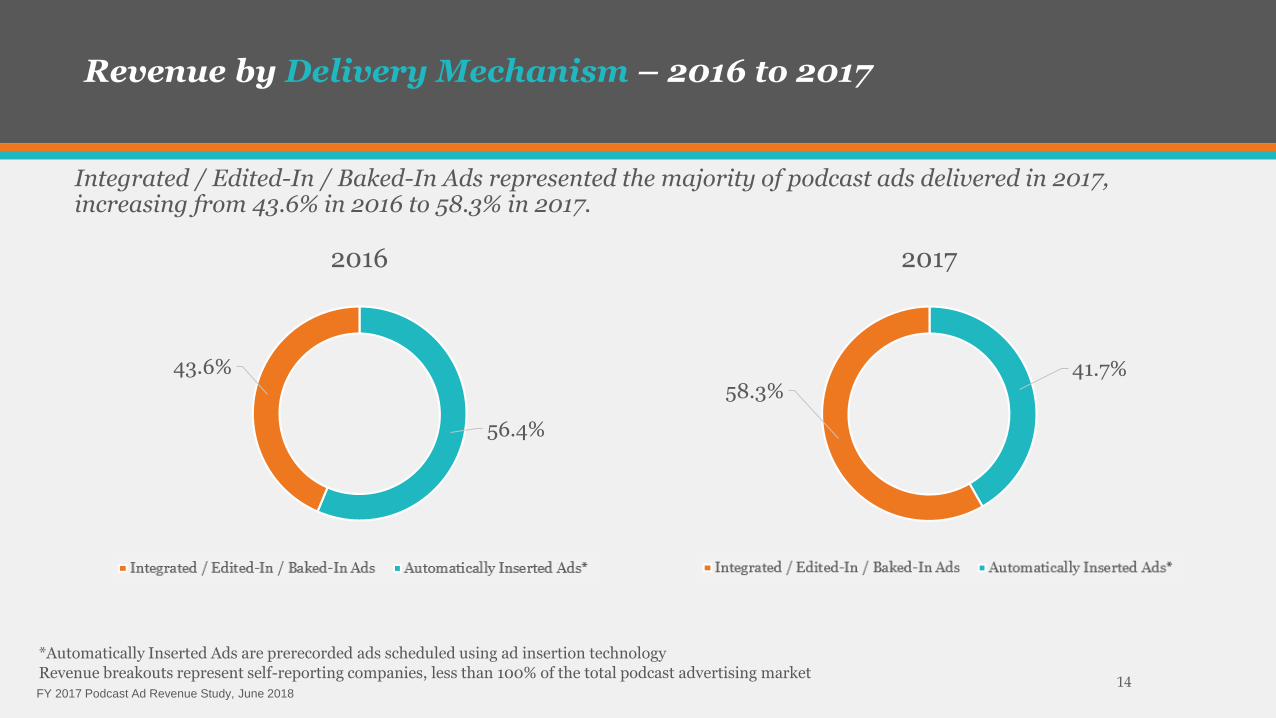
Revenue by Delivery Mechanism – 2016 to 2017
Integrated / Edited-In / Baked-In Ads represented the majority of podcast ads delivered in 2017, increasing from 43.6% in 2016 to 58.3% in 2017.
FY 2017 Podcast Ad Revenue Study, June 2018
56.4%
43.6%
2016
41.7%58.3%
2017
14
*Automatically Inserted Ads are prerecorded ads scheduled using ad insertion technology
Revenue breakouts represent self-reporting companies, less than 100% of the total podcast advertising market

Revenue by Content Genre – 2017
Of the 14 content genres measured, the top four constituted more than 50% of advertising revenue captured.
FY 2017 Podcast Ad Revenue Study, June 2018
Revenue (by Content Genre)
Arts & Entertainment 16.8%
Technology 14.6%
News / Politics / Current Events 13.3%
Business 11.1%
Comedy 10.6%
Education 9.6%
True Crime 7.2%
Lifestyle 6.2%
Sports 3.8%
Other 3.8%
Health & Medicine 1.3%
Scripted Fiction 0.9%
Games & Hobbies 0.7%
Children's Programming 0.1%
56% of captured advertising revenue
15Revenue breakouts represent self-reporting companies, less than 100% of the total podcast advertising market

Revenue by Industry Category – 2017
Of the 13 industry categories measured, the top four represented nearly 60% of advertising revenue captured, with Financial Services serving as the category leader.
FY 2017 Podcast Ad Revenue Study, June 2018
Revenue (by Industry Category)
Financial Services 18.1%
Retail (Direct to Consumer) 16.2%
Arts & Entertainment 12.5%
Business-to-Business 12.3%
Other 12.2%
Automotive / Automotive Services 6.4%
Retail (Brick & Mortar / ecommerce) 6.3%
Telecommunications 4.0%
Corporate 3.6%
Beverage / Restaurants 3.3%
Consumer Packaged Goods 3.1%
Travel and Tourism 1.2%
Pharmaceuticals, Healthcare, Drugs, and Remedies 0.7%
59% of captured advertising revenue
16Revenue breakouts represent self-reporting companies, less than 100% of the total podcast advertising market

Terminology Definition Survey Options
Delivery MechanismMeans by which podcast advertising is inserted into the audience ready audio content
• Automatically Inserted Ads – Prerecorded ads inserted at the time of file request – download or stream - using ad insertion technology• Integrated / Edited-In / Baked-In Ads - Ads that are integrated into the edited podcast file, as part of the episode content
Campaign Type
Category of marketing effort that coordinates messaging presented to the podcast audience
• Direct Response Ad - An ad that proposes a specific action that is tracked and measured by the advertiser using a unique code or URL• Brand Awareness Ad - An ad that attempts to generate brand awareness. Includes ads which propose a general action that is not tracked
using a unique code or URL (e.g. Tune-In Ads)• Branded Content - Podcast content that is paid for by an advertiser and identified as an advertisement• Product Placement - A paid mention of a brand in a podcast program, presented as part of the podcast content, but which does
not disturb the flow of the dialogue. Advertiser disclaimer is often presented separate and apart from the paid brand mention
Ad TypeMethod of podcast advertisingcontent presentation
• Host-read Ads - Host read ads that are native to the podcast's content • Announcer-read / Producer-read Ads - Pre-recorded ads that are incorporated into the podcast's content• Supplied Ads (Radio) - Pre-recorded ads that were specifically created for radio broadcast and are also incorporated into the podcast's
content• Supplied Ads (Non-Radio) - Pre-recorded ads over which the podcast team had no creative or production control; but, were not created
specifically for radio broadcast
Buy TypeMeans by which podcast advertising inventory is procured by the advertiser
• RFP-Driven - the purchase of advertising through a formal bidding process• Annual - the purchase of advertising based on annual rates / rate card• Quarterly - the purchase of advertising based on quarterly rates / rate card• Remnant / Transactional / Scattered - the purchase of advertising that is remaindered on an as-needed basis• Programmatic - the purchase of advertising that is facilitated via an automated bidding system• Other - the purchase of advertising not covered by one of the Buy Types listed above
Pricing ModelPurchase options available to advertisers to accommodate various budgeting strategies
• Series Ownership - Price determined based upon cost to exclusively advertise during a series• Cost per Thousand - Price determined based on verifiable podcast downloads• Cost per Listen - Price determined based on verifiable podcast listens• Cost per Acquisition - Price determined based upon pre-defined, verifiable listener action(s)• Flat Fee - Price determined based upon pre-defined, static value
17
Glossary of Relevant Advertising Terminology
FY 2017 Podcast Ad Revenue Study, June 2018

Terminology Definition Survey Options
Content GenreCategories of thematic subject matter into which podcast programming may be assigned
• Arts & Entertainment (Streaming Services, Movies, Dance, Theater, Concerts, Opera, Amusement Parks, Games, Books - Audio and Bound, Music, Magazines, Newspapers, Websites, Apps, DVDs, Radio and Television Networks / Stations / Programming)
• Business• Children's Programming• Comedy• Education (History, Sciences, Mathematics)• Games & Hobbies (DIY, Video games, Board Games, Cooking)• Health & Medicine• Lifestyle (Travel, Pets, Self-Help, Relationships, Religion, Spirituality)• News / Politics / Current Events• Scripted Fiction• Sports• Technology• True Crime• Other (please specify: ______________)
Industry CategoryCategories of economic activity into which podcast advertisers may be grouped
• Arts & Entertainment (Streaming Services, Movies, Dance, Theater, Concerts, Opera, Amusement Parks, Games, Books - Audio and Bound, Music, Magazines, Newspapers, Websites, Apps, DVDs, Radio and Television Networks/Stations/Programming)
• Automotive / Automotive Services• Beverage / Restaurants• Business-to-Business (B2B)• Consumer Packaged Goods (CPG)• Corporate • Financial Services (Banks, Insurance, Securities, Mortgages, Financial Services Software) • Pharmaceuticals, Healthcare, Drugs, and Remedies• Retail (Brick & Mortar / ecommerce)• Retail (Direct to Consumer)• Telecommunications (Telephony, Mobile Service Providers, Cable/Satellite TV services, ISPs, Wireless)• Travel and Tourism (Resorts/Hotels/Airlines) • Other (please specify: ______________)
Glossary of Relevant Advertising Terminology
FY 2017 Podcast Ad Revenue Study, June 2018 18

FY 2017 Podcast Ad Revenue Study, June 2018
About
The Interactive Advertising Bureau (IAB) empowers the media and marketing industries to thrive in the digital economy. It is comprised of more than 650 leading media and technology companies that are responsible for selling, distributing and optimizing digital advertising and marketing. Together, they account for 86 percent of online advertising in the United States. Working with its member companies, the IAB evaluates and recommends standards and practices and fields critical research on interactive advertising.
The IAB is committed to professional development, elevating the knowledge, skills, and expertise of individuals across the digital marketing industry. The IAB also educates marketers, agencies, media companies and the wider business community about the value of interactive advertising. Founded in 1996, the IAB is headquartered in New York City.
With approximately 1,200 practitioners serving Technology, Media, and Telecommunications (TMT) clients in the United States, PricewaterhouseCoopers (PwC) is deeply committed to providing clients with industry experience and resources. In recent years, our pioneering work in TMT has included developing strategies to leverage digital technology, identifying new sources of financing, and marketplace positioning in industries characterized by consolidation and transformation.
PwC’s experience reaches across all geographies and segments of the TMT sector, including broadband, wireless, the internet, music, film, television, publishing, advertising, gaming, theme parks, computers and networking, and software. With thousands of practitioners around the world, we're always close at hand to provide deep industry knowledge and resources.
IAB PwC
19
Kristina SruoginisResearch Director, [email protected]
Jennifer LaneAudio Industry Lead, [email protected]
David SilvermanPartner, Assurance [email protected]
Brian GaffneyManager, Advisory [email protected]
FY 2017 Podcast Ad Revenue Study, June 2018
Contacts
PwC and the IAB have exercised reasonable care in the collecting, processing, and reporting of this information but have not independently verified, validated, or audited the data to verify the accuracy or completeness of the information. PwC and the IAB give no express or implied warranties, including but not limited to any warranties of merchantability or fitness for a particular purpose or use and shall not be liable to any entity or person using this document, or have any liability with respect to this document. Only aggregate results are published and individual company information is held exclusively with PwC. This report is for general purposes only, and is not a substitute for consultation with professional advisors.
© 2018 PwC. All rights reserved. PwC refers to the US member firm or one of its subsidiaries or affiliates, and may sometimes refer to the PwC network. Each member firm is a separate legal entity. Please see www.pwc.com/structure for further details.