full year presentation to holders of our £450m 3.375%
TRANSCRIPT

Full Year Presentation to holders of our£450m 3.375% bonds due 2025£300m 2.375% Green bonds due 2027£250m 3.000% Green bonds due 2031
19 May 2021

Key messages p3
Full year to 25th February 2021 p4
Looking forward p12
Force for Good p19
Credit highlights p23
2
Contents
Presented by Nicholas Cadbury

3
Key messages
Full year to 25 February 2021Operations
• Rapid and decisive response to COVID-19
• Out-performed competitors and market share gains
Balance sheet and liquidity
• £1bn equity issue
• Fitch downgrade from BBB to BBB–, not unexpected in the circumstances, we are pleased that outlook is ‘stable’
• High liquidity, assisted by Green bond issues
• Reduced growth CapEx, but maintained appropriate level to position ourselves for the upturn in the UK and Germany
• Strong lending bank support: RCF maturity extended and covenants waived/amended
• £4.2bn freehold and long leasehold real estate book value
• Focus on cash flow and returning to investment grade metrics
Looking forward
• Brand strength and commercial initiatives driving demand
• Investing in refurbishments and marketing, and focus on opening UK pipeline at good returns
• Expanding pipeline in Germany
• Focus on efficiencies: new 3-year £100m cost saving programme
• Well-invested estate is poised to benefit from cyclical recovery as markets and economies reopen
• Force For Good sustainability programme underpins strategy and operations
Premier Inn market share gains in the UK and building a national network in Germany

FULL YEAR TO 25 FEBRUARY 2021
444

Rapid and decisive action to protect the business
40%
1% 2% 3%
24%
51%
58%52%
35%31%
23%29%
33%
UK Premier Inn: Resilient occupancy levels despite COVID-19 impact
5
First lockdown
starts
Lockdown restrictions
eased
Second lockdown
Third lockdown
Mar 20 Apr 20 May 20 Jun 20 Jul 20 Aug 20 Sep 20 Oct 20 Nov 20 Dec 20
National restrictions introduced
Jan 21 Feb 21
Premier Inn UK occupancy levels:
Mar 21
(normal occupancy levels in the high 70%s)
Protecting customers and staff Acting responsibly Protecting liquidity and strengthening financial position

Aug 20 Sep 20 Oct 20 Nov 20 Dec 20 Jan 21 Feb 21
1: STR data, full inventory basis, M&E excludes Premier Inn2: STR data, revenue share of total UK market. Premier Inn market share in FY20: 7.2%
UK Premier Inn: Material outperformance vs. broader market
6
Outperformance vs. the M&E hotel market
Strong brand and direct distribution is driving material outperformance in the UK
PI market share2 10.8% 10.7% 11.0% 13.6% 11.7% 13.7% 14.7%
Benefitting from a higher level of competitors’ temporary closures
PI outperformance1 5.2% 7.9% 8.4% 10.4% 10.5% 4.8% 5.2%
Leisure travel not permitted / restricted
Seasonally lower occupancy levels
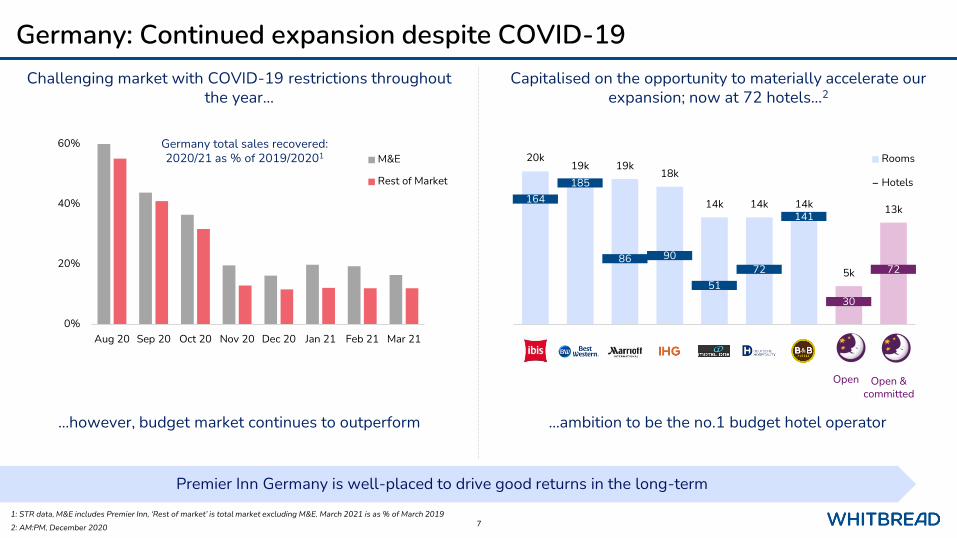
Germany: Continued expansion despite COVID-19
7
0%
20%
40%
60%
Aug 20 Sep 20 Oct 20 Nov 20 Dec 20 Jan 21 Feb 21 Mar 21
M&E
Rest of Market
1: STR data, M&E includes Premier Inn, ‘Rest of market’ is total market excluding M&E. March 2021 is as % of March 20192: AM:PM, December 2020
Challenging market with COVID-19 restrictions throughout the year…
Premier Inn Germany is well-placed to drive good returns in the long-term
Capitalised on the opportunity to materially accelerate our expansion; now at 72 hotels…2
Germany total sales recovered: 2020/21 as % of 2019/20201
…however, budget market continues to outperform
20k19k 19k
18k
14k 14k 14k
5k
13k164
185
86 90
5172
141
30
72
0
50
100
150
200
250
0
5000
10000
15000
20000
25000
Ibis
Bes
tW
este
rn
Mar
rio
tt
IHG
Mo
tel O
ne
Deu
tsch
eH
osp
ital
ity
B&
B
Op
en
Op
en +
co
mm
itte
d
Rooms
Hotels
Open Open & committed
…ambition to be the no.1 budget hotel operator

Financial performance reflects lockdown closures
8
COVID-19 impact
Includes £138.3m benefit from the UK Government’s Job Retention Scheme
Discretionary cost savings, reductions in revenue-driven costs of sales, and the benefit of the UK business rates holiday
Includes a non-cash impairment charge of £348.0m, largely as a result of the COVID-19 pandemic
Reduced, but continued, capex
High liquidity, low debt, aided by equity and bond issues
£m FY21 FY20
Statutory revenue 589.4 2,071.5
Adjusted revenue 588.9 2,062.1
Other income (excl. rental income) 154.0 13.9
Operating costs (937.8) (1,323.3)
Adjusted EBITDAR (194.9) 752.7
Adjusted (loss) / profit before tax (635.1) 358.3
Statutory (loss) / profit before tax (1,007.4) 280.0
Cash capital expenditure1 230.6 587.7
Cash and cash equivalents 1,256.0 502.6
RCF (undrawn) 950.0 950.0
Net (debt) (46.5) (322.9)
1: Includes net cash on acquisitions of £1.1m in FY21 and Fox acquisition in FY20

Actions taken to protect cash
9
£m
Cash outflow reflects COVID-19 restrictions. UK hotels cashflow positive when leisure travel permitted August to October
Working capital outflow driven by:• £71.2m net customer deposit outflow• £14.0m amount due re UK Government Job Retention Scheme• £15.5m reduction in VAT creditor driven by reduced revenue
Adjusted EBITDAR
Change in working capital
Net turnover & rental income
IFRS 16 interest &
lease repayments
Operating cashflow
Interest (ex IFRS 16)
Corporate taxes
Capex: maintenance
Capex: expansionary
Other1 Cashflow before shareholder
returns / receipts and debt
Rights Issue Debt repayment
Green Bond Issue
FY21 cashflow
Net (debt) / cash movement2
£mCash and cash equivalents 1,256.0Undrawn RCF 950.0Total 2,206.0
Available liquidity£mNet debt at start of year (322.9)Cash flow 748.1Debt repayment 75.1Bond Issue (546.8)Net debt at end of year (46.5)
1: Other includes: other non cash, pension, disposal proceeds and acquisitions2: Pre IFRS 16

£45m
£83m
£70m
£37m
FY22-24
FY21
FY20
FY19
FY18
FY17
Actions taken to protect liquidity and financial position
10
• £1bn Rights Issue in June 2020
• Discretionary P&L spend paused and capex reduced
• Executive pay reductions, salaried staff pay freeze and dividends suspended
• Employee costs:
• Central office headcount reduced by 13%
• New flexible labour model introduced
• Optimised minimum contracted hours
• Government support:
• Business rates holiday in UK: c.£120m
• Furlough scheme in UK and Kurzarbeit in Germany: c.£140m
• £550m Green Bonds issued in February 2021
STRONG TRACK RECORD OF MATERIAL COST SAVINGSFY21 ACTIONS TO REDUCE COSTS AND PRESERVE CASH
3 year programme to deliver £100m permanent efficiencies
£40m1
Protecting liquidity and taking actions to ensure we exit the crisis as a leaner, stronger and more resilient business
New 3-year £100m efficiency programme
• International procurement
• Site optimisation
• Aligning hotel and restaurant operations
• Labour model efficiencies e.g. shift patterns
+ flexible labour model benefits
1: Of which £15m are ongoing cost savings

50%
59%
50%
41%
Total estate(open and committed)
Open estate
1. Includes impact of hedging using cross currency swaps and excludes unamortised fees associated with debt instruments2. Covenant waivers obtained on USPP, and pension scheme until March 2022. RCF waivers extended until March 20233. Existing covenants are temporarily replaced with new covenants during waiver period: maximum net debt less than £2bn, minimum liquidity headroom of £400m, suspension of dividend
Strong balance sheet and maturity profile
11
Property backed balance sheet
Strong liquidity position with over £2bn available funds at the balance sheet date
Freehold
UK
Germany
Whitbread
55%
61%
45%
39%
Total estate(open and committed)
Open estate
21%
28%
79%
72%
Total estate(open and committed)
Open estate
Open estate
Total estate(open and committed)
Open estate
Total estate(open and committed)
Open estate
Total estate(open and committed)
Leasehold
0
200
400
600
800
2021 2022 2023 2024 2025 2026 2027 2028 2029 2030 2031
Private PlacementUndrawn RCFPublic Bond (uncovenanted)Green Bond (uncovenanted)
£m
£950m until Dec 21£850m until Sep 22£725m thereafter
Repaid March 2021
Debt maturity profile 1, 2, 3
Mature in FY22
• Dividends suspended until 2023 when the RCF covenant waiver period ends
BALANCED DEBT MATURITY PROFILEPROPERTY: OPERATIONAL AND FINANCIAL FLEXIBILITY

LOOKING FORWARD
121212

1: Source: company data and AM:PM, February 20212: Source: company data and estimates
57%48%
2010 2019
13
UK: Brand, scale and operating model underpins strong performanceUK’s largest hotel chain…by a clear margin1 UK’s favourite hotel brand…by a clear margin
Enhanced structural opportunities provide clear runway for growth
Scale delivers efficiency and customer choice
Winner of YouGov best value hotel chain for the 10th year running
Drives efficiency and winning customer proposition
Drives brand loyalty and direct distribution
Growth through existing pipeline and estate optimisation
61% freehold39% leasehold
Track record of efficiencies
100% of hotel staff directly employed
Only 1% distribution through OTAs
79k
44k
18k9k
Premier Inn Travelodge Holiday Inn Express Ibis
Independent decline from 57% of the market in 2010 to 48% in 20192
Number of rooms
Best-in-class operations – ownership model
79k Current network
> 12k Committed pipeline
> 19k Additional potential
Potential Premier Inn room network > 110k

-12%
-8%
-4%
0%
4%
8%
12%
2008 2009 2010 2011 2012 2013 2014 2015 2016 2017 2018 2019
Branded BudgetOther branded and independents
1: Company data2: STR data, M&E includes Premier Inn, ‘Rest of market’ is total market excluding M&E. March 2021 data is as % of March 2019
UK: Budget model is higher growth and more resilient in downturns
14
Historic: Branded budget sector has grown faster than the rest of the market in every year since 2009
UK total booked room % annual growth1
0%
10%
20%
30%
40%
50%
60%
Aug 20 Sep 20 Oct 20 Nov 20 Dec 20 Jan 21 Feb 21 Mar 21
Midscale & EconomyRest of Market
Present: Midscale & Economy sector is materially outperforming the rest of the hotel market
UK total sales recovered: 2020/21 as % of 2019/202

56%
50%
44%
50%
Market
PI
Over-indexing in UK regions, that will recover faster than
London
UK: Broad and diversified customer mix is resilient
Source: PI data for the 12 months ending Feb 2020, Market for calendar year 2019, based on room nights sold
Over-indexing in domestic demand that will recover faster than international
Even split of leisure and business customers
15
Flexible model caters for a wide range of customer types
Regions vs London Domestic vs Inbound Leisure vs Business
71%
83%
29%
17%
Market
PI
63%
90%
37%
10%
Market
PI
PI RegionsPI LondonMarket RegionsMarket London
PI DomesticPI InboundMarket DomesticMarket Inbound
PI Business: TradesPI Business: Office-basedMarket Business Split
50% 50%
Market
PI
Broad business mix is resilient
Trades vs Office-based
PI LeisurePI BusinessMarket LeisureMarket Business
Greater proportion of office-based

[Ambition to be the no.1 budget hotel operator
16
Germany: Opportunity to replicate Premier Inn’s UK successMaterial growth in the estate during lockdown
March 2020 February 2021
30 operational / 42 pipeline hotels6 open / 46 pipeline hotels
Replicate our UK model
High levels of domestic business and leisure travel
Great locations. Nearly all Tier 1 and Tier 2 city centres
A structurally attractive market with no clear market leader and
over 70% independents
Clear indications of COVID-19 induced competitor constraints
Great room quality
Hamburg
Munich
Frankfurt
Freiberg
Hamburg
Frankfurt
SaarbruckenNuremberg
Cologne
DusseldorfDresden
Berlin
Leipzig
Stuttgart
Munich
EssenBraunschweig
Freiburg
Hannover
Heidelberg
Passau
Wuppertal
80%72%
2010 2019
Enhanced structural opportunities provide clear runway for growthIndependent decline from 80% of the
market in 2010 to 72% in 20191Potential Premier Inn room network > 60k
5k Current network
> 8k Committed pipeline
> 47k Additional potential
Source: Company data and estimates

0
100
200
300
400
500
600
700
FY19 FY20 FY21 FY22 FY23+
17
£462m
£588m
£231m
Return to normal levels
• UK: organic investment; 12k pipeline - £300m capex over a c.4 year period
• Germany: investment in estate expansion; 8k pipeline - £300m capex over a c.6 year period
• Essential repairs and maintenance capex of c.£45-50m per annum and an ongoing level of IT maintenance spend
• Rigorous investment return targets
Investing across the business in a measured wayDISCIPLINED CAPITAL EXPENDITURE FY22 AND BEYOND
c.£350m
Committed growth capex of £600m at good returns
New capacity: UK and Germany
2,906
710
c.2-3,000
FY20 FY21 FY22
693
3,795
c.2,000
FY20 FY21 FY22
2
3
3
1
1: FY20 – 2,376 net rooms, 2,570 net rooms excluding franchise disposals 2: FY21 - 171 net rooms3: Of which, 732 Centro rooms in FY21 and 103 Centro rooms in FY22
UK Germany

Focus on return to investment grade metrics
18
3.3x
(0.4)x
2.6x
(1.0)x
0.0x
1.0x
2.0x
3.0x
4.0x
FY18 FY19 FY20 FY21 FY22 onwards
Investment grade metric: 3.5x
Financial strength and flexibility is important to support our strategy
Evolution of lease adjusted net debt : FFO
• Significant cash outflows during FY21 put pressure on near-term leverage
• £1bn rights issue proceeds support the balance sheet in the near-term
• Target return to 3.5x adjusted net debt : FFO by FY23

FORCE FOR GOOD
191919

Green Bond Framework
20
ICMA Category for use of proceeds Eligibility criteria Example Green project Reporting metric Relevant SDG
Green construction Green buildings
Investment and expenditures relating to the properties built, fitted out to, or operated to BREEAM standards (Very Good and above), LEED (Platinum or above) or EPC (B or above)
Build and fit out of utility efficient buildings to BREEAM, or LEED or EPC standards as noted
Number (or %) of sites built, fitted out or operated to BREEAM very good standard or above, LEED platinum or above and EPC B or above
Investment and expenditures relating to water saving projects Installation of greywater systems to enable water recycling. Reduce water leaks to reduce commodity wastage Water usage avoidance (m3)
Green operation
Energy efficiency
Investment and expenditures relating to electricity efficiency projects Electricity efficiency projects across the estate kWh electricity avoidance
Investment and expenditures relating to installation of heat pumps Electrification of sites through the use of ground or air source heat pumps Greenhouse gas emissions avoided (TCO2e)
Investment and expenditures relating to installation of electric cookers Electrification of sites through electric cooker installation, removing gas usage Greenhouse gas emissions avoided (TCO2e)
Investment and expenditures relating to installation of electric power storage at Premier Inn sites in Germany Installation of electric power storage system in German sites Greenhouse gas emissions avoided (TCO2e)
Clean transportationInvestment and expenditures relating to the installation and running of EV charge points across the estate in the UK and Germany and any investment in electric only vehicles
Installation of EV charge points to support the UK Governments Green Revolution plan and investment in electric only vehicles No. of EV charge points installed
Renewable energy Investment and expenditures relating to purchase of renewable energy across estate in the UK and Germany
Procurement of 100% renewable energy (certified from wind, solar or hydro origins) across our utility purchased PI&R estate including installation of PV across suitable existing sites
Greenhouse gas emissions avoided (TCO2e)
Pollution prevention and control
Expenditures relating to reduction in waste to landfill through recycling
Waste management to reduce landfill and obtain a positive environmental benefit via recycling Greenhouse gas emissions avoided (TCO2e)
Sustainable procurement
Environmentally sustainable management of loving natural resources and land use
Expenditures relating to procurement of sustainable timber FSC and PEFC certified timber for fixtures, fittings and consumable products within the estate
% of fixtures, fittings and consumables suppliers that comply with timber policy
Expenditures relating to procurement of sustainable cotton Use of sustainably sourced cotton (procured directly and through our laundry contracts) through the Better Cotton Initiative (BCI) or equivalent standard % of certified materials sourced
Expenditures relating to procurement of sustainable fish to standards that protect aquatic biodiversity Procurement of sustainable fish accredited to MSC, ASC or equivalent standard % of fish sustainably sourced
• Published February 2021
• Second Option Provider: Sustainalytics
• Eligible green projects aligned to United Nations’ goals
• Progress reported against these on an annual basis

A Force for Good: Operating responsibly and sustainably
21
Being a Force for Good in all we do supports our vision of enabling people to live and work well
Our sustainability programme has been in operation for over 10 years and runs through everything we do
TARGETS
Eliminateunnecessary
single-use plastic by 2025
50% carbon emissions
intensity reduction by 2025, net-zero
by 2040
Reduce food waste by 50% by
2030
Raise £20m for GOSH
100% critical commodities
sourced responsibly
Reduction in sugar, salt and
calories across our menus
Stretching Diversity and
Inclusion targets
No waste to landfill
OPPORTUNITY COMMUNITY RESPONSIBILITY
No barriers to entry and no limitations to
ambition
Meaningful contributions to the
customers and communities we
serve
Operating in a way that respects people
and the planet
Championing inclusivity and
improving diversity
Industry-leading training and
development
Team member wellbeing
considered in everything we do
Positive contributions to the
communities we serve
Supporting our charity partner to meet their mission
Supporting the wellbeing of our
guests and customers
Sourcing responsibly and
with integrity
Reducing our environmental
impact
Always doing business in the right
way

A Force for Good: Operating responsibly and sustainably
22
Clear objectives and measurable targets to help us meet our goals
KEY ACHIEVEMENTS
No. 1
11 years
£18m
500,000
39%
100%
HOSPITALITY APPRENTICESHIP
PROVIDER
RAISED FOR GREAT ORMOND STREET HOSPITAL
CHILDREN’S CHARITY
REDUCTION IN CARBON EMISSIONS IN
3 YEARS
AS TOP EMPLOYER MEALS DONATED TO CHARITY PARTNERS
DIRECT SUPPLIERS GIVEN SUSTAINABILITY
RISK ASSESSMENT
OPPORTUNITY COMMUNITY RESPONSIBILITY
GREEN BOND ISSUANCE

CREDIT HIGHLIGHTS
232323

Credit highlights
24
Largest hotel operator in the UK with the strongest brand
Vertically integrated model affords control over best-in-class operations and is a competitive advantage over peers
Effective direct digital distribution platforms affording cost efficiency and ownership of the customer relationship
Broad customer reach across regions and defensive domestic/inbound and business/leisure mix
Positioned in budget sector which is fastest growing and outperforms in downturns
Attractive structural growth opportunities remain intact, including in Germany where the business is well placed to replicate its
success in the UK
Decisive and effective actions taken to mitigate business and financial disruption from COVID-19 and protect stakeholders, along with
longstanding proven ability to manage costs through a cycle
Experienced management team
A ‘Force for Good’ - robust and longstanding sustainability policies which run through everything we do and are recognised via external
accreditations
Board intention to maintain investment grade metrics over the medium term
Conservative balance sheet and financial flexibility afforded by freehold property backing
1
2
3
4
5
6
7
8
9
10
11

Q&A
252525

Nothing contained in this presentation is intended to constitute an offer, invitation or inducement to engage in an investment activity for the purposes ofthe prohibition on financial promotions under the Financial Services and Markets Act 2000. In making this presentation available, Whitbread plc makes norecommendation to purchase, sell or otherwise deal in shares in Whitbread plc or any other securities or investments whatsoever and you should neitherrely nor act upon, directly or indirectly, any of the information contained in this presentation in respect of such investment activity.
No representations, express or implied, are given in, or in respect of, this presentation. To the extent permitted by law, Whitbread plc, and its subsidiaries,shareholders, affiliates, representatives, partners, directors, officers, employees, advisors or agents shall not be liable for any direct, indirect orconsequential loss or loss of profit arising from the use of this presentation, its content or otherwise arising in connection therewith.
Certain statements included or incorporated by reference within this presentation may constitute “forward looking statements” in respect of Whitbreadplc’s operations, performance, prospects and/or financial condition. Such statements are based on Whitbread plc’s current expectations and beliefsconcerning future events and are subject to a number of known and unknown risks and uncertainties that could cause actual events or results to differmaterially from any expected future events or results referred to in these forward looking statements. Such statements are also based on numerousassumptions regarding Whitbread plc’s present and future strategy and the environment in which it operates, which may not be accurate. Whitbread plcundertakes no obligation to update any forward looking statements contained in this presentation or any other forward looking statements it may make.
Nothing in this presentation should be construed as a profit forecast. Past performance cannot be relied upon as a guide to future performance andpersons needing advice should consult an independent financial advisor.
Cautionary statement
26