full-year report - h&m report 2016 (1 dec 2015 - 30 nov 2016) 3 continued strong expansion –...
TRANSCRIPT

Full-year report 2016 (1 Dec 2015 – 30 Nov 2016)
Q4
H & M Hennes & Mauritz AB
Full-year report
Full-year (1 December 2015 — 30 November 2016)
The H&M group’s sales including VAT increased by 7 percent in local currencies during the
financial year. Converted into SEK, sales including VAT increased by 6 percent to
SEK 222,865 m (209,921). Sales excluding VAT amounted to SEK 192,267 m (180,861).
Gross profit increased to SEK 106,177 m (103,167). This corresponds to a gross margin of
55.2 percent (57.0).
Profit after financial items amounted to SEK 24,039 m (27,242). The group’s profit after tax
amounted to SEK 18,636 m (20,898), corresponding to SEK 11.26 (12.63) per share. Profits
during the year were negatively affected by increased mark-downs but also by higher
purchasing costs from the strengthened US dollar.
Very strong expansion during the year with a total net addition of 427 (413) new stores and
11 new H&M online markets. At the end of the financial year H&M had 35 online markets and
the number of stores amounted to 4,351 in 64 markets.
13,000 new jobs were created in the H&M group in 2016. The number of employees
amounted to more than 161,000 (148,000) at the end of the financial year.
Continued strong online development for all brands both as regards sales and profitability.
Strong sales growth for COS, & Other Stories, Monki, Weekday and H&M Home.
Fourth quarter (1 September 2016 — 30 November 2016)
The H&M group’s sales including VAT increased by 7 percent in local currencies during the
fourth quarter. Converted into SEK, sales including VAT increased by 8 percent to
SEK 61,098 m (56,477). Sales excluding VAT amounted to SEK 52,720 m (48,694).
Gross profit increased to SEK 30,027 m (27,997). This corresponds to a gross margin of
57.0 percent (57.5).
Profit after financial items increased to SEK 7,409 m (7,148). The group’s profit after tax
increased to SEK 5,914 m (5,526), corresponding to SEK 3.57 (3.34) per share.
A very good start for H&M’s new markets, Cyprus and New Zealand, as well as for H&M’s
latest online roll-outs in Canada and South Korea.
The Board of Directors proposes a dividend of SEK 9.75 (9.75) per share for the 2015/2016
financial year. The Board of Directors proposes that the dividend is to be paid in two
instalments during the year – in May and in November.
New growth target: to increase the H&M group’s sales by 10 – 15 percent in local currencies
per year with continued high profitability.
The H&M group’s sales including VAT in December 2016 increased by 6 percent in local
currencies compared to the same month the previous year. Converted into SEK the increase
was 10 percent.
The H&M group’s sales including VAT in the period 1 January to 29 January 2017 increased by
11 percent in local currencies compared to the same period the previous year. For January as
a whole there is a negative calendar effect of approximately 2 percentage points, which
occurs at the end of the month.
The H&M group plans to open approximately 430 new stores net in the 2016/2017 financial
year. Kazakhstan, Colombia, Iceland, Vietnam and Georgia are planned to become new
H&M markets. In addition, H&M plans to continue its online roll-out into six new markets:
Turkey, Taiwan, Hong Kong, Macau, Singapore and Malaysia.
The H&M group plans to launch one or two new brands in 2017.
SEK 223 billion Sales incl VAT
4,351 stores in 64 markets
& Other Stories

Full-year report 2016 (1 Dec 2015 - 30 Nov 2016)
2
Comments by Karl-Johan Persson, CEO “2016 was an eventful year which included many positive things but also challenges for us as well
as for the industry. During the year, we opened 427 new stores net worldwide and added three
new markets, and we also rolled out our online store to 11 additional markets. This means that H&M
is now present in 64 markets of which 35 offer e-commerce. We welcomed more than 13,000 new
colleagues which means there are now more than 161,000 colleagues in the group.
Our sales increased by 7 percent in local currencies to SEK 223 billion - our highest annual turnover
to date - although sales performance was lower than planned, which led to increased mark-downs.
This, combined with the fact that the strong US dollar made our purchases more expensive, had a
negative impact on our profit development for the full year. However, profits improved in the
fourth quarter.
The year was characterised by the shift in the industry towards an ever growing online market and
by digitalisation. We are very pleased that our online business developed very well for all our
brands, both as regards sales and profitability. From an already high level we took further market
share, which clearly proves that our investments in our online business have been successful. Our
brands COS, & Other Stories, Monki, Weekday and H&M Home had apart from strong online sales
growth also very good store sales.
It is also positive that sales developed well for H&M in our well-established markets such as
Sweden and the other Scandinavian countries and in Russia, Turkey and Canada, but also in our
newer markets such as India, Australia, South Africa, Mexico, Chile and Peru.
For fashion retail in general, 2016 was at the same time a challenging year in which various external
factors - including geopolitical events - had a negative impact on retail trade in many markets. This
was particularly visible in France, Germany, Switzerland and Italy as well as in the US and in China.
Since these markets represent a large share of our sales, this consequently had a great impact on
our overall sales development. However, during the year we also identified areas within our
customer offering, store experience and supply chain where we could have done better – and
where we are now methodically ensuring improvements.
Exciting development phase
We have a highly developed online business model and today our online sales already represent a
significant share of our total sales in several markets. We are in an exciting development phase as
we continue with the investments that we have been making for the past few years in digitalisation
and infrastructure in the following focus areas:
- Omni-channel strategy: We have a clear omni-channel strategy in which we are
integrating the digital and physical world in order to offer customers a more seamless
shopping experience. This includes online purchases and online returns in stores, click &
collect, mobile payments, further development of the customer club and use of the
mobile in stores for increased service.
- Supply chain: We are upgrading our supply chain to make it even faster and more flexible
– which includes investments in technology such as RFID and automatised warehouses.
We are also adding new delivery options for customers, such as next day delivery which
we now offer in five markets, and we have also started offering time-slot deliveries in
Japan.
- Advanced analytics provide an important support for our operations. The algorithms we
have started to use will contribute to improvements within everything from assortment
planning and logistics to sales.
The investments in these areas ensure that we are well positioned for continued long-term and
profitable growth. This also includes our strong expansion both through new stores and new online
markets.
H&M

Full-year report 2016 (1 Dec 2015 - 30 Nov 2016)
3
Continued strong expansion – rephrased growth target
In the light of this development, it is natural for us to rephrase our growth target. This means that
our previous target of increasing the number of stores by 10 to 15 percent per year will instead
become a sales target that includes both stores and online sales. Our new growth target which
applies for 2017 and going forward is for the H&M group’s sales to increase by 10 to 15 percent in
local currencies per year with continued high profitability.
Today we have a strong store portfolio with more than 4,300 stores which gives us a unique
proximity to our customers. Being close to the customers is key to success and even more
important as the physical and the digital world become increasingly integrated. The stores that we
are opening have very favourable and flexible leases, are in good locations and are profitable with a
short payback period. In view of this, it is only natural for us to continue expanding with our physical
stores too.
In 2017 we plan to open approximately 430 new stores net. We will enter five new bricks-and-
mortar markets – Kazakhstan, Colombia, Iceland, Vietnam and Georgia – and six new H&M online
markets – Turkey, Taiwan, Hong Kong, Macau, Singapore and Malaysia.
Alongside opening new stores, we will also review the existing store portfolio to make sure that we
have the optimal mix of brands, space and number of stores in each market. This will lead to
re-locations, adding new store space and also closures. Most of the new stores in 2017 will be H&M
stores and approximately 70 to 80 stores will consist of our other brands.
H&M Home is developing very well and has great potential for further growth. Going forward we
will therefore open standalone H&M Home stores and profile H&M Home even more as a
standalone brand.
In 2017 we are looking forward to delivering strong collections and customer experiences and
launching one or two new brands. This, combined with the ongoing improvements and our
investments in the omni-channel offering, the supply chain and advanced analytics make us
positive towards our opportunities for reaching our newly rephrased growth target, both in 2017
and going forward.”
SEK m
Q4
2016
Q4
2015
Full year
2016
Full year
2015
Net sales 52,720 48,694 192,267 180,861
Gross profit 30,027 27,997 106,177 103,167
gross margin, % 57.0 57.5 55.2 57.0
Operating profit 7,354 7,084 23,823 26,942
operating margin, % 13.9 14.5 12.4 14.9
Net financial items 55 64 216 300
Profit after financial items 7,409 7,148 24,039 27,242
Tax -1,495 -1,622 -5,403 -6,344
Profit for the period 5,914 5,526 18,636 20,898
Earnings per share, SEK 3.57 3.34 11.26 12.63
Full-year report 2016 (1 Dec 2015 - 30 Nov 2016)
4
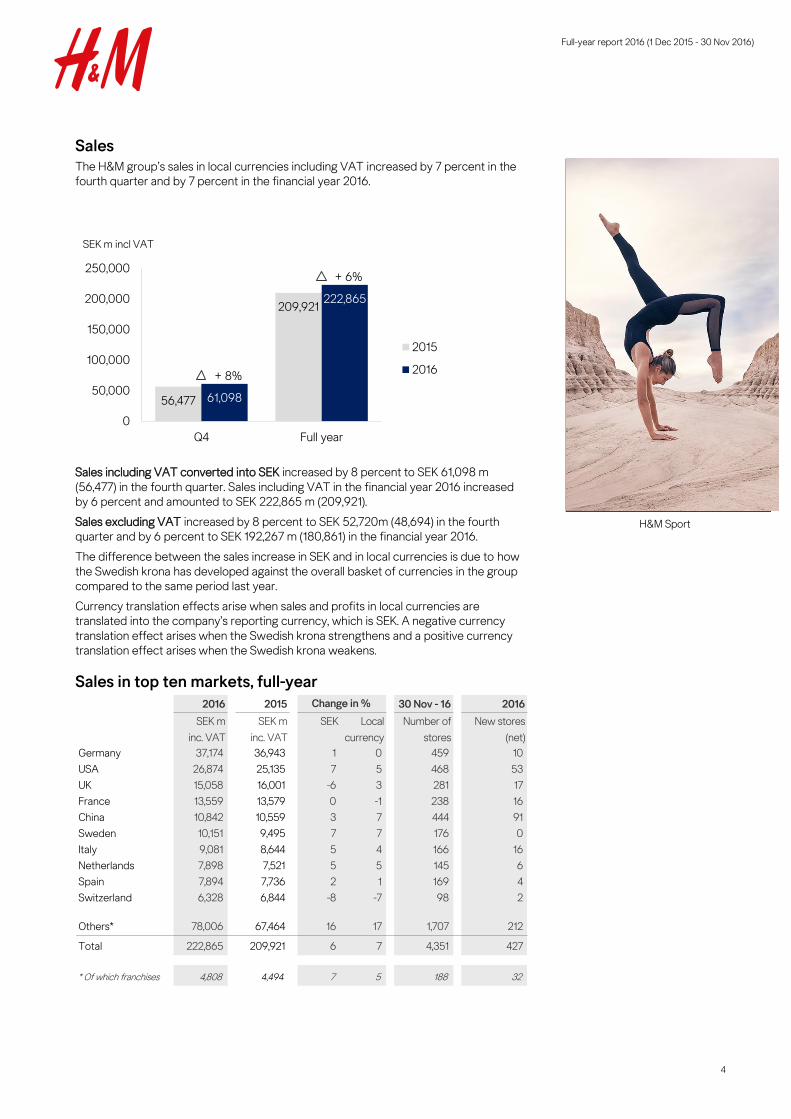
Sales
The H&M group’s sales in local currencies including VAT increased by 7 percent in the
fourth quarter and by 7 percent in the financial year 2016.
Sales including VAT converted into SEK increased by 8 percent to SEK 61,098 m
(56,477) in the fourth quarter. Sales including VAT in the financial year 2016 increased
by 6 percent and amounted to SEK 222,865 m (209,921).
Sales excluding VAT increased by 8 percent to SEK 52,720m (48,694) in the fourth
quarter and by 6 percent to SEK 192,267 m (180,861) in the financial year 2016.
The difference between the sales increase in SEK and in local currencies is due to how
the Swedish krona has developed against the overall basket of currencies in the group
compared to the same period last year.
Currency translation effects arise when sales and profits in local currencies are
translated into the company’s reporting currency, which is SEK. A negative currency
translation effect arises when the Swedish krona strengthens and a positive currency
translation effect arises when the Swedish krona weakens.
Sales in top ten markets, full-year
56,477
209,921
61,098
222,865
+ 8%
+ 6%
0
50,000
100,000
150,000
200,000
250,000
Q4 Full year
SEK m incl VAT
2015
2016
2016 2015 30 Nov - 16 2016
SEK m
inc. VAT
SEK m
inc. VAT
SEK Local
currency
Number of
stores
New stores
(net)
Germany 37,174 36,943 1 0 459 10
USA 26,874 25,135 7 5 468 53
UK 15,058 16,001 -6 3 281 17
France 13,559 13,579 0 -1 238 16
China 10,842 10,559 3 7 444 91
Sweden 10,151 9,495 7 7 176 0
Italy 9,081 8,644 5 4 166 16
Netherlands 7,898 7,521 5 5 145 6
Spain 7,894 7,736 2 1 169 4
Switzerland 6,328 6,844 -8 -7 98 2
Others* 78,006 67,464 16 17 1,707 212
Total 222,865 209,921 6 7 4,351 427
* Of which franchises 4,808 4,494 7 5 188 32
Change in %
H&M Sport

Full-year report 2016 (1 Dec 2015 - 30 Nov 2016)
5
Gross profit and gross margin
H&M’s gross profit and gross margin are a result of many different factors, internal as
well as external, and are mostly affected by the decisions that H&M takes in line with its
strategy to always have the best customer offering in each individual market – based on
the combination of fashion, quality, price and sustainability.
Gross profit increased to SEK 30,027 m (27,997) in the fourth quarter, corresponding to
a gross margin of 57.0 percent (57.5). For the financial year, gross profit increased to
SEK 106,177 m (103,167), corresponding to a gross margin of 55.2 percent (57.0).
Mark-downs in relation to sales increased by 0.6 percentage points in the fourth quarter
2016 compared to the corresponding quarter in 2015. The increase in Q4 is mostly
explained by increased mark-down activities for autumn garments that did not sell as
well as planned due to the warm start of the autumn.
Overall, the market situation as regards external factors such as cost inflation and
purchasing currencies continued to be slightly negative during the purchasing period
for the fourth quarter compared to the corresponding purchasing period in the previous
year.
For purchases made for the first quarter 2017, the overall market situation for the
external factors is again considered slightly negative overall compared to the
corresponding purchasing period the previous year.
27,997
103,167
30,027
106,177
0
20,000
40,000
60,000
80,000
100,000
120,000
Q4 Full year
Gross profit SEK m
2015
2016
57.5% 57.0%
57.0%55.2%
H&M

Full-year report 2016 (1 Dec 2015 - 30 Nov 2016)
6
Selling and administrative expenses
Cost control in the group remains good. For the fourth quarter of 2016, selling and
administrative expenses increased by 8 percent in SEK and by 7 percent in local
currencies compared to the fourth quarter last year.
Selling and administrative expenses for the full-year increased by 8 percent in SEK and
by 9 percent in local currencies.
Profit after financial items
Profit after financial items in the fourth quarter 2016 increased to SEK 7,409 m (7,148).
Profit after financial items in the full-year amounted to SEK 24,039 m (27,242).
Mark-downs increased during the year due to a lower sales increase than planned. In
addition, the strong US dollar made the group’s purchases more expensive. However,
in the fourth quarter earnings improved.
No new allocation has been made to the H&M Incentive Program (HIP) – which is aimed
at all employees of the H&M group, in all countries, working in all positions and at all pay
levels – for full-year 2016. Allocations are made to the programme if there has been an
increase in the company’s profits after tax between two consecutive financial years.
Since HIP’s assets are invested in H&M shares, the participants in HIP – i.e. H&M’s
employees - benefit each year from the dividend paid to the company’s shareholders.
HIP holds approximately 7 million H&M shares in total.
20,913
76,225
22,673
82,354
+ 8%
+ 8%
0
25,000
50,000
75,000
100,000
Q4 Full year
SEK m
2015
2016
7,148
27,242
7,409
24,039
+ 4%
- 12%
0
5,000
10,000
15,000
20,000
25,000
30,000
Q4 Full year
SEK m
2015
2016
&Other Stories

Full-year report 2016 (1 Dec 2015 - 30 Nov 2016)
7
Stock-in-trade
Stock-in-trade amounted to SEK 31,732 m (24,833), an increase of 28 percent in SEK
and 26 percent in local currencies compared to the same time the previous year.
The increase in the stock-in-trade is explained by the group’s continued strong
expansion, but is also due to the fact that the sales development was lower than
planned. This led to that the stock-in-trade as of 30 November 2016 being too high,
which is expected to result in costs for mark-downs increasing by approximately
0.5 percentage points in relation to sales in the first quarter of 2017 compared to the
corresponding quarter of 2016. Apart from these factors, the composition of the stock-
in-trade is deemed to be good.
The stock-in-trade amounted to 16.5 percent (13.7) of sales excluding VAT and
32.2 percent (28.9) of total assets.
Expansion
In the light of the development phase that the industry and the H&M group is going
through with an ever growing online market and digitalisation, it is natural to rephrase
the previous growth target. This means that the previous target of increasing the
number of stores by 10 - 15 percent per year will instead become a sales target that
includes both stores and online sales. The new growth target which applies for the
financial year of 2016/2017 and going forward is that the H&M group’s sales shall
increase by 10 - 15 percent in local currencies per year with continued high profitability.
In 2017 the H&M group plans to open approximately 430 new stores net and enter five
new markets – Kazakhstan, Colombia, Iceland, Vietnam and Georgia – and continue its
online roll-out to six new online markets: Turkey, Taiwan, Hong Kong, Macau, Singapore
and Malaysia.
Most of the new stores in 2017 will be H&M stores and approximately 70 to 80 stores
will consist of the other brands in the group.
H&M Home will also continue its rapid expansion, with approximately 50 new
H&M Home departments planned for 2017. Today H&M Home is present in more than
40 markets in a total of 269 H&M stores.
24,833
31,732
+ 28%
0
5,000
10,000
15,000
20,000
25,000
30,000
35,000
30 November
SEK m
2015
2016
COS

Full-year report 2016 (1 Dec 2015 - 30 Nov 2016)
8
Store count by brand
In the financial year 2016, the group opened 497 (472) stores and closed 70 (59) stores,
i.e. a net increase of 427 (413) new stores. The group had 4,351 (3,924) stores as of
30 November 2016, of which 188 were franchise stores.
Store count by region
Expansion
2016*
Expansion
2017
Brand Store Online New markets New markets
H&M 64 35 Store: Puerto Rico, New
Zealand, Cyprus
Online: Slovenia, Croatia,
Estonia, Latvia, Lithuania,
Luxembourg, Ireland, Japan,
Greece, Canada, South Korea
Store: Kazakhstan, Colombia,
Iceland, Vietnam, Georgia
Online: Turkey, Taiwan, Hong
Kong, Macau, Singapore,
Malaysia
COS 33 19 Store: Czech Republic,
Romania, Latvia
Store: Malaysia**, Israel
(franchise)
Monki 13 19 Store: Austria -
Weekday 7 18 Store: Austria, Belgium Store: UK
& Other Stories 11 14 Store: Poland
Online: Poland
Store: Ireland**, Finland,
South Korea, United Arab
Emirates (franchise)
Cheap Monday 3 18 - -
** Opened in December 2016
* Opened by 30 Nov - 2016, during the year Puerto Rico has been redefined to be a separate online
market.
Number of
markets
Brand Q4 Full year 30 Nov - 2016 30 Nov - 2015
H&M 178 352 3,962 3,610
COS 17 41 194 153
Monki 8 12 118 106
Weekday 5 8 28 20
& Other Stories 9 15 45 30
Cheap Monday -1 -1 4 5
Total 216 427 4,351 3,924
New Stores 2016 (net) Total No of stores
Region Q4 Full year 30 Nov - 2016 30 Nov - 2015
Europe & Africa 98 170 2,884 2,714
Asia & Oceania 78 182 877 695
North & South America 40 75 590 515
Total 216 427 4,351 3,924
New Stores 2016 (net) Total No of stores
H&M Home

Full-year report 2016 (1 Dec 2015 - 30 Nov 2016)
9
Tax
The H&M group’s final tax rate for the 2015/2016 financial year was 22.5 percent (23.3).
The final outcome of the tax rate for the year depends on the results of the group’s
various companies, the corporate tax rates in each country and any taxes relating to
previous years. The H&M group’s tax rate is expected to be approximately 22.5 – 23.5
percent for the 2016/2017 financial year. In the first, second and third quarter of 2017 an
estimated tax rate of 23.5 percent will be used.
Employees The average number of employees in the group, converted into full-time positions, was
114,586 (104,634), of which 8,933 (8,061) are employed in Sweden.
Current quarter As previously communicated, sales including VAT in December 2016 increased by
6 percent in local currencies for the H&M group compared to the same month the
previous year. Converted into SEK the increase was 10 percent.
The H&M group’s sales including VAT in the period 1 January to 29 January 2017
increased by 11 percent in local currencies compared to the same period the previous
year. For January as a whole there is a negative calendar effect of approximately
2 percentage points, which occurs at the end of the month.
Since the stock-in-trade as of 30 November 2016 was too high – costs for mark-downs
are expected to increase by approximately 0.5 percentage points in relation to sales in
the first quarter of 2017 compared to the corresponding quarter of 2016.
Dividend policy and dividend proposal H&M’s financial goals are to enable the company to continue enjoying good growth and
to be ready to exploit business opportunities. It is essential that, as in the past, the
expansion proceeds with a continued high degree of financial strength and continued
freedom of action. Based on this policy, the board of directors has decided that the
total dividend should equal about half of the profit after tax. In addition, the board may
propose that any surplus liquidity is also distributed.
The board of directors has decided to propose a dividend of SEK 9.75 (9.75) to the
annual general meeting on 10 May 2017, corresponding to 87 percent (77) of the profit
after tax.
Many companies in the US and Europe divide their dividends into quarterly or semi-
annual payments. In Sweden too, there are larger companies which pay their dividend in
more than one instalment. Until now H&M has paid its dividends in conjunction with the
annual general meeting in the spring. H&M’s board of directors is to propose to the
annual general meeting that the dividend is paid out semi-annually in future, i.e. one
instalment in the spring and one in the autumn, since this is more cost efficient for the
company and also simplifies liquidity planning during the year.
The record date proposed for the first dividend payment of SEK 4.90 per share is
12 May 2017. This would then be paid out on 17 May 2017.
The record date proposed for the second dividend payment of SEK 4.85 is
14 November 2017. This would then be paid out on 17 November 2017.
The board of directors is of the opinion that the proposed distribution of earnings is
justifiable taking into consideration the financial position and continued freedom of
action of the group and the parent company and observing the requirements that the
nature and extent of the business, its risks and future expansion plans impose on the
group’s and the parent company’s equity and liquidity.
Annual general meeting 2017
The 2017 annual general meeting will be held at 3 p.m. on Wednesday 10 May in the
Erling Persson Hall, Aula Medica, Karolinska Institutet, Solna.

Full-year report 2016 (1 Dec 2015 - 30 Nov 2016)
10
Annual Report 2016 The Annual Report and the Corporate Governance Report are expected to be
published on 31 March 2017 on hm.com and will be sent out by post to shareholders
that have so requested. The documents will also be available at the company’s head
office.
Accounting principles The group applies International Financial Reporting Standards (IFRS) as adopted by the
EU. This report has been prepared according to IAS 34 Interim Financial Reporting as
well as the Swedish Annual Accounts Act.
The accounting principles and calculation methods applied in this report are unchanged
from those used in the preparation of the annual report and consolidated financial
statements for 2014/2015 which are described in Note 1 – Accounting principles.
H & M Hennes & Mauritz AB’s financial instruments consist of accounts receivable, other
receivables, cash and cash equivalents, accounts payable, accrued trade payables,
interest-bearing securities and currency derivatives. Currency derivatives are measured
at fair value based on input data corresponding to level 2 of IFRS 13. As of 30 November
2016, forward contracts with a positive market value amount to SEK 848 m (707), which
is reported under other current receivables. Forward contracts with a negative market
value amount to SEK 1,176 m (302), which is reported under other current liabilities.
Other financial assets and liabilities have short terms. It is therefore judged that the fair
values of these financial instruments are approximately equal to their book values.
The parent company applies the Swedish Annual Accounts Act and the Swedish
Financial Reporting Board’s recommendation RFR 2 Accounting for Legal Entities, which
essentially involves applying IFRS. In accordance with RFR 2, the parent company does
not apply IAS 39 to the measurement of financial instruments; nor does it capitalise
development expenditure.
For definitions see page 24.
Risks and uncertainties
A number of factors may affect H&M’s results and business. Many of these can be dealt
with through internal routines, while certain others are affected more by external
influences. There are risks and uncertainties related to fashion, weather conditions,
negative macroeconomic changes, geopolitical risks, sustainability and external factors
in production countries, trade interventions, foreign currency and tax but also in
connection with expansion into new markets, the launch of new concepts, changes in
consumer behaviour and how the brand is managed. There are also some risks related
to the group’s reputation, so called “reputational risks”.
For a more detailed description of risks and uncertainties, refer to the administration
report and to note 2 in the annual report and consolidated accounts for 2015.
Calendar 30 March 2017 Three-month report, 1 Dec 2016 – 28 Feb 2017
10 May 2017 Annual General Meeting 2017, in the Erling Persson
Hall, Aula Medica, Karolinska Institutet, Solna at 3 p.m.
29 June 2017 Six-month report, 1 Dec 2016 – 31 May 2017
28 September 2017 Nine-month report, 1 Dec 2016 – 31 August 2017
Stockholm, 30 January 2017
Board of Directors

Full-year report 2016 (1 Dec 2015 - 30 Nov 2016)
11
Contact Nils Vinge, IR +46-8-796 52 50
Karl-Johan Persson, CEO +46-8-796 55 00 (switchboard)
Jyrki Tervonen, CFO +46-8-796 55 00 (switchboard)
Invitation to press and telephone conference in conjunction to the full-year report is
available on hm.com.
H & M Hennes & Mauritz AB (publ)
SE-106 38 Stockholm
Phone: +46-8-796 55 00, Fax: +46-8-24 80 78, E-mail: [email protected]
Registered office: Stockholm, Reg. No. 556042-7220
Information in this full-year report is that which H & M Hennes & Mauritz AB (publ) is required to disclose under Sweden’s Securities
Market Act and the EU Market Abuse Regulation (596/2014/EU). The information was submitted for publication by the
abovementioned persons at 8.00 (CET) on 31 January 2017. This full-year report and other information about H&M, is available at
www.hm.com
H & M Hennes & Mauritz AB (publ) was founded in Sweden in 1947 and is quoted on Nasdaq Stockholm. The H&M’s business idea is to offer fashion and quality at the
best price in a sustainable way. In addition to H&M, the group includes the brands COS, Monki, Weekday, Cheap Monday, & Other Stories as well as H&M Home. The
H&M group has more than 4,300 stores in 64 markets including franchise markets. In 2016, sales including VAT amounted to SEK 223 billion and the number of
employees was more than 161,000. For further information, visit www.hm.com.
Full-year report 2016 (1 Dec 2015 –30 November 2016)
12
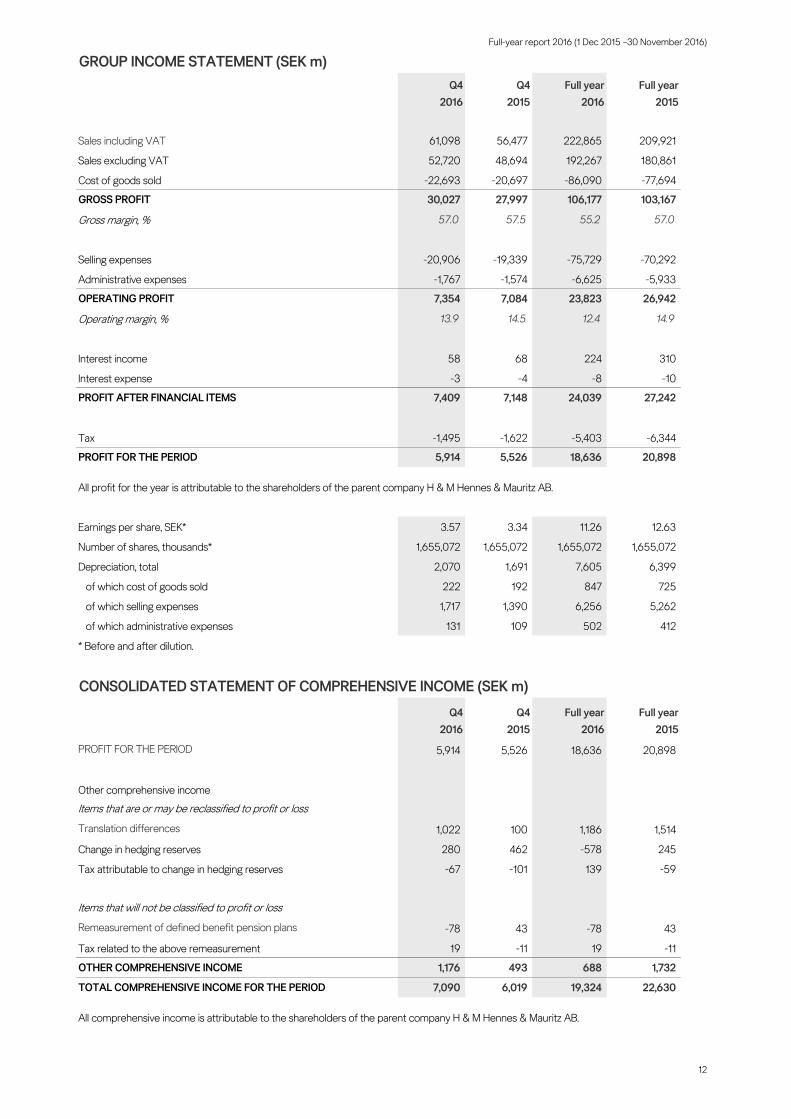
GROUP INCOME STATEMENT (SEK m)
Sales including VAT 61,098 56,477 222,865 209,921
Sales excluding VAT 52,720 48,694 192,267 180,861
Cost of goods sold -22,693 -20,697 -86,090 -77,694
GROSS PROFIT 30,027 27,997 106,177 103,167
Gross margin, % 57.0 57.5 55.2 57.0
Selling expenses -20,906 -19,339 -75,729 -70,292
Administrative expenses -1,767 -1,574 -6,625 -5,933
OPERATING PROFIT 7,354 7,084 23,823 26,942
Operating margin, % 13.9 14.5 12.4 14.9
Interest income 58 68 224 310
Interest expense -3 -4 -8 -10
PROFIT AFTER FINANCIAL ITEMS 7,409 7,148 24,039 27,242
Tax -1,495 -1,622 -5,403 -6,344
PROFIT FOR THE PERIOD 5,914 5,526 18,636 20,898
All profit for the year is attributable to the shareholders of the parent company H & M Hennes & Mauritz AB.
Earnings per share, SEK* 3.57 3.34 11.26 12.63
Number of shares, thousands* 1,655,072 1,655,072 1,655,072 1,655,072
Depreciation, total 2,070 1,691 7,605 6,399
of which cost of goods sold 222 192 847 725
of which selling expenses 1,717 1,390 6,256 5,262
of which administrative expenses 131 109 502 412
* Before and after dilution.
CONSOLIDATED STATEMENT OF COMPREHENSIVE INCOME (SEK m)
Q4
2016
Q4
2015
Full year
2016
Full year
2015
PROFIT FOR THE PERIOD 5,914 5,526 18,636 20,898
Other comprehensive income
Items that are or may be reclassified to profit or loss
Translation differences 1,022 100 1,186 1,514
Change in hedging reserves 280 462 -578 245
Tax attributable to change in hedging reserves -67 -101 139 -59
Items that will not be classified to profit or loss
Remeasurement of defined benefit pension plans -78 43 -78 43
Tax related to the above remeasurement 19 -11 19 -11
OTHER COMPREHENSIVE INCOME 1,176 493 688 1,732
TOTAL COMPREHENSIVE INCOME FOR THE PERIOD 7,090 6,019 19,324 22,630
All comprehensive income is attributable to the shareholders of the parent company H & M Hennes & Mauritz AB.
Q4
2016
Q4
2015
Full year
2016
Full year
2015
Full-year report 2016 (1 Dec 2015 –30 November 2016)
13
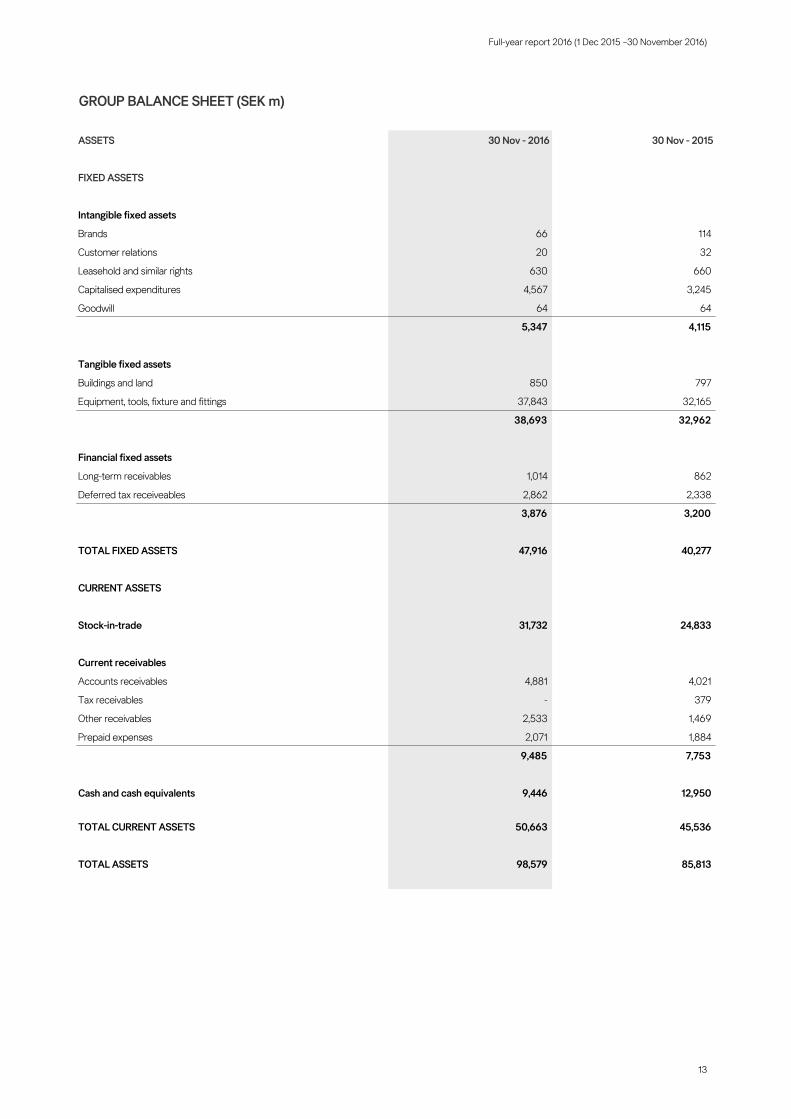
GROUP BALANCE SHEET (SEK m)
ASSETS 30 Nov - 2016 30 Nov - 2015
FIXED ASSETS
Intangible fixed assets
Brands 66 114
Customer relations 20 32
Leasehold and similar rights 630 660
Capitalised expenditures 4,567 3,245
Goodwill 64 64
5,347 4,115
Tangible fixed assets
Buildings and land 850 797
Equipment, tools, fixture and fittings 37,843 32,165
38,693 32,962
Financial fixed assets
Long-term receivables 1,014 862
Deferred tax receiveables 2,862 2,338
3,876 3,200
TOTAL FIXED ASSETS 47,916 40,277
CURRENT ASSETS
Stock-in-trade 31,732 24,833
Current receivables
Accounts receivables 4,881 4,021
Tax receivables - 379
Other receivables 2,533 1,469
Prepaid expenses 2,071 1,884
9,485 7,753
Cash and cash equivalents 9,446 12,950
TOTAL CURRENT ASSETS 50,663 45,536
TOTAL ASSETS 98,579 85,813

Full-year report 2016 (1 Dec 2015 –30 November 2016)
14
GROUP BALANCE SHEET (SEK m)
EQUITY AND LIABILITIES 30 Nov - 2016 30 Nov - 2015
EQUITY
Share capital 207 207
Reserves 2,651 1,904
Retained earnings 58,378 55,938
EQUITY 61,236 58,049
LIABILITIES
Long-term liabilities
Provisions for pensions* 527 449
Deferred tax liabilities 4,898 4,378
Other interest-bearing liabilities* 213 -
5,638 4,827
Current liabilities
Accounts payable 7,262 6,000
Tax liabilities 434 -
Liabilities to credit institutions** 2,068 -
Interest-bearing liabilities** 59 -
Other liabilities 5,036 3,192
Accrued expenses and prepaid income 16,846 13,745
31,705 22,937
TOTAL LIABILITIES 37,343 27,764
TOTAL EQUITY AND LIABILITIES 98,579 85,813
* Interest-bearing long-term liabilities amounts to SEK 740 m (449).
** Interest-bearing current liabilities amounts to SEK 2,127 m (0).

Full-year report 2016 (1 Dec 2015 –30 November 2016)
15
GROUP CHANGES IN EQUITY (SEK m)
Share
capital
Translation
effects
Hedgings
reserves
Retained
earnings
Total
shareholders
equity
Shareholder's equity, 1 December 2015 207 1,663 241 55,938 58,049
Profit for the year - - - 18,636 18,636
Other comprehensive income
Translation differences - 1,186 - - 1,186
Change in hedging reserves
Reported in other comprehensive income - - -223 - -223
Transfer to income statement - - -355 - -355
Tax attributable to hedging reserves - - 139 - 139
Revaluations relating to defined benefit pension
plans - - - -78 -78
Tax attributable to the above revaluation - - - 19 19
Other comprehensive income - 1,186 -439 -59 688
Total comprehensive income - 1,186 -439 18,577 19,324
Dividend - - - -16,137 -16,137
Shareholder's equity, 30 November 2016 207 2,849 -198 58,378 61,236
Share
capital
Translation
effects
Hedgings
reserves
Retained
earnings
Total
shareholders
equity
Shareholder's equity, 1 December 2014 207 149 55 51,145 51,556
Profit for the year - - - 20,898 20,898
Other comprehensive income
Translation differences - 1,514 - - 1,514
Change in hedging reserves
Reported in other comprehensive income - - 1,826 - 1,826
Transfer to income statement - - -1,581 - -1,581
Tax attributable to hedging reserves - - -59 - -59
Revaluation of defined benefit pension plans - - - 43 43
Tax attributable to the above revaluation - - - -11 -11
Other comprehensive income - 1,514 186 32 1,732
Total comprehensive income - 1,514 186 20,930 22,630
Dividend - - - -16,137 -16,137
Shareholder's equity, 30 November 2015 207 1,663 241 55,938 58,049
Since there are no minority interests, all shareholders' equity is attributable to the shareholders of the shareholders of the parent company,
H & M Hennes & Mauritz AB.

Full-year report 2016 (1 Dec 2015 –30 November 2016)
16
GROUP CASH FLOW STATEMENT (SEK m)
Full year 2016 Full year 2015
Current operations
Profit after financial items* 24,039 27,242
Provisions for pensions -9 28
Depreciation 7,605 6,399
Tax paid -4,470 -7,022
Cash flow from current operations before changes in working capital 27,165 26,647
Cash flow from changes in working capital
Current receivables -1,817 -249
Stock-in-trade -6,511 -5,105
Current liabilities 4,938 2,774
CASH FLOW FROM CURRENT OPERATIONS 23,775 24,067
Investment activities
Investment in leasehold and similar rights -139 -324
Investments in other immaterial assets -1,476 -1,140
Investment in buildings and land -60 -2
Investment in fixed assets -11,671 -10,593
Change in short-term investments, 4 - 12 months 0 2,602
Other investments -152 -153
CASH FLOW FROM INVESTMENT ACTIVITIES -13,498 -9,610
Financial activities
Short-term loans 2,068 -
Dividend -16,137 -16,137
CASH FLOW FROM FINANCIAL ACTIVITIES -14,069 -16,137
CASH FLOW FOR THE YEAR -3,792 -1,680
Cash and cash equivalents at beginning of the financial year 12,950 14,091
Cash flow for the year -3,792 -1,680
Exchange rate effect 288 539
Cash and cash equivalents at end of the financial year** 9,446 12,950
* Interest paid for the group amounts to SEK 8 m (10).
Received interest for the group amounts to SEK 224 m (310).
** Cash and cash equivalents and short-term investments at the end of the fiscal year amounted to SEK 9,446 m (12,950).

Full-year report 2016 (1 Dec 2015 –30 November 2016)
17
SALES INCLUDING VAT BY MARKET AND NUMBER OF STORES
Q4, 1 September - 30 November
Market Q4 - 2016 Q4 - 2015 30 Nov - 16
SEK m SEK m SEK Local
currency
No. of stores New
stores
Closed
stores
Sweden 2,670 2,521 6 6 176 6 3
Norway 1,599 1,449 10 5 127 4
Denmark 1,567 1,461 7 4 102 1 1
UK 4,006 4,406 -9 4 281 12 2
Switzerland 1,673 1,726 -3 -7 98 1
Germany 10,297 9,739 6 3 459 8 2
Netherlands 2,231 2,037 10 7 145 6
Belgium 1,172 1,081 8 5 90 4
Austria 1,531 1,457 5 2 83 2
Luxembourg 123 118 4 1 10
Finland 737 723 2 -1 61 1
France 3,536 3,536 0 -4 238 7
USA 7,294 6,777 8 3 468 24 1
Spain 2,054 2,025 1 -2 169 4 1
Poland 1,239 1,136 9 8 166 9 1
Czech Republic 400 351 14 10 48 2
Portugal 335 321 4 0 31 1
Italy 2,561 2,451 4 1 166 10
Canada 1,282 1,122 14 12 85 8 2
Slovenia 150 142 6 3 12
Ireland 294 280 5 1 23
Hungary 454 375 21 16 42 2
Slovakia 188 172 9 7 19 1
Greece 526 442 19 15 35
China 3,086 2,827 9 11 444 45 1
Hong Kong 477 475 0 -4 28 1
Japan 1,432 1,057 35 14 66 3
Russia 1,165 831 40 33 113 7
South Korea 495 353 40 31 35 2 1
Turkey 844 676 25 30 62 8
Romania 591 522 13 11 52 5
Croatia 248 238 4 0 15
Singapore 256 233 10 4 13
Bulgaria 181 148 22 19 19
Latvia 96 81 19 15 8 2
Malaysia 289 226 28 21 35 2
Mexico 453 334 36 53 25 6
Chile 340 189 80 73 4
Lithuania 87 78 12 7 8 1
Serbia 120 87 38 36 9
Estonia 102 80 28 23 8
Australia 649 363 79 67 22 5
Philippines 225 152 48 48 21 5
Taiwan 168 144 17 9 10 1
Peru 148 104 42 45 6 4
Macau 41 49 -16 -21 2
India 245 77 218 224 12 3
South Africa 192 98 96 111 8 3
Puerto Rico 38 2 1
Cyprus 35 1 1
New Zealand 55 1 1
Franchise 1,121 1,207 -7 -1 188 14 2
Total 61,098 56,477 8 7 4,351 233 17
Change in % Q4 - 2016

Full-year report 2016 (1 Dec 2015 –30 November 2016)
18
SALES INCLUDING VAT BY MARKET AND NUMBER OF STORES
Full year, 1 December - 30 November
Market 2016 2015 30 Nov - 16
SEK m SEK m SEK Local
currency
No. of stores New
stores
Closed
stores
Sweden 10,151 9,495 7 7 176 11 11
Norway 5,926 5,806 2 6 127 7 0
Denmark 5,682 5,413 5 4 102 1 2
UK 15,058 16,001 -6 3 281 22 5
Switzerland 6,328 6,844 -8 -7 98 3 1
Germany 37,174 36,943 1 0 459 19 9
Netherlands 7,898 7,521 5 5 145 10 4
Belgium 4,404 4,215 4 4 90 9 4
Austria 5,557 5,361 4 3 83 6 1
Luxembourg 464 433 7 6 10 0 0
Finland 2,866 2,805 2 2 61 4 3
France 13,559 13,579 0 -1 238 18 2
USA 26,874 25,135 7 5 468 61 8
Spain 7,894 7,736 2 1 169 7 3
Poland 4,701 4,356 8 12 166 14 2
Czech Republic 1,428 1,207 18 16 48 5 1
Portugal 1,272 1,276 0 -1 31 1 0
Italy 9,081 8,644 5 4 166 17 1
Canada 4,330 3,918 11 15 85 9 2
Slovenia 542 529 2 2 12 0 0
Ireland 1,103 1,026 8 7 23 1 1
Hungary 1,590 1,336 19 19 42 3 1
Slovakia 681 579 18 17 19 1 0
Greece 1,891 1,637 16 15 35 3 0
China 10,842 10,559 3 7 444 92 1
Hong Kong 1,919 1,870 3 1 28 3 0
Japan 4,600 3,754 23 9 66 11 2
Russia 4,304 3,460 24 38 113 17 0
South Korea 1,675 1,277 31 32 35 5 1
Turkey 2,816 2,193 28 41 62 16 0
Romania 2,102 1,796 17 18 52 10 0
Croatia 846 817 4 2 15 0 0
Singapore 1,030 970 6 5 13 1 0
Bulgaria 641 511 25 25 19 1 0
Latvia 332 309 7 7 8 2 0
Malaysia 1,130 973 16 24 35 6 0
Mexico 1,561 1,097 42 64 25 9 0
Chile 1,129 573 97 103 4 0 0
Lithuania 317 296 7 6 8 1 0
Serbia 369 318 16 17 9 3 0
Estonia 377 312 21 20 8 2 0
Australia 1,999 1,133 76 78 22 12 0
Philippines 869 557 56 60 21 9 0
Taiwan 665 332 100 101 10 4 0
Peru 510 261 95 106 6 4 0
Macau 166 89 87 83 2 0 0
India 606 77 687 718 12 10 0
South Africa 645 98 558 671 8 6 0
Puerto Rico 63 2 2 0
Cyprus 35 1 1 0
New Zealand 55 1 1 0
Franchise 4,808 4,494 7 5 188 37 5
Total 222,865 209,921 6 7 4,351 497 70
Change in % Full year

Full-year report 2016 (1 Dec 2015 –30 November 2016)
19
FIVE YEAR SUMMARY
Full year, 1 December - 30 November
2012 2013 2014 2015 2016
Sales including VAT, SEK m 140,948 150,090 176,620 209,921 222,865
Sales excluding VAT, SEK m 120,799 128,562 151,419 180,861 192,267
Change sales excl. VAT from previous year in SEK, % 10 6 18 19 6
Change sales excl. VAT previous year in local currencies, % 11 9 14 11 7
Operating profit, SEK m 21,754 22,090 25,583 26,942 23,823
Operating margin, % 18.0 17.2 16.9 14.9 12.4
Depreciation for the year, SEK m 3,705 4,191 5,045 6,399 7,605
Profit after financial items, SEK m 22,285 22,448 25,895 27,242 24,039
Profit after tax, SEK m 16,867 17,093 19,976 20,898 18,636
Cash and cash equivalents and short-term investments, SEK m 17,143 17,224 16,693 12,950 9,446
Stock-in-trade, SEK m 15,213 16,695 19,403 24,833** 31,732**
Equity, SEK m 43,835 45,248 51,556 58,049 61,236
Number of shares, thousands* 1,655,072 1,655,072 1,655,072 1,655,072 1,655,072
Earnings per share, SEK* 10.19 10.33 12.07 12.63 11.26
Equity per share, SEK* 26.49 27.34 31.15 35.07 37.00
Cash flow from current operations
per share, SEK* 11.42 14.40 14.60 14.54 14.36
Dividend per share, SEK 9.50 9.50 9.75 9.75 9.75***
Return on equity, % 38.4 38.4 41.3 38.1 31.2
Return on capital employed, % 50.3 50.0 53.1 49.3 39.2
Share of risk-bearing capital, % 76.1 73.0 72.5 72.7 67.1
Equity/assets ratio, % 72.8 68.9 68.2 67.6 62.1
Total number of stores 2,776 3,132 3,511 3,924 4,351
Average number of employees 72,276 81,099 93,351 104,634 114,586
* Before and after dilution.
*** Proposed by the Board of Directors
Definition on key figures see page 24
** The booked value of stock-in-trade for 2015 and 2016 is approximately 5 percent higher than previous years as a result of improved invoicing processes.
Accounts payable have increased with the corresponding amount.

Full-year report 2016 (1 Dec 2015 –30 November 2016)
20
SEGMENT REPORTING (SEK m)
2016 2015
Asia and Oceania
External net sales 27,416 23,610
Operating profit 1,927 1,740
Operating margin, % 7.0 7.4
Assets excluding tax receivables 14,657 11,171
Liabilities excluding tax liabilities 1,430 1,736
Investments 2,505 2,516
Depreciation 1,169 843
Europe and Africa
External net sales 132,689 128,200
Operating profit 4,006 4,828
Operating margin, % 3.0 3.8
Assets excluding tax receivables 41,143 33,258
Liabilities excluding tax liabilities 11,975 9,950
Investments 5,787 4,845
Depreciation 3,995 3,578
North and South America
External net sales 32,162 29,051
Operating profit 971 619
Operating margin, % 3.0 2.1
Assets excluding tax receivables 17,369 14,157
Liabilities excluding tax liabilities 5,998 4,712
Investments 3,360 2,966
Depreciation 1,791 1,547
Group Functions
Net sales to other segments 79,284 91,297
Operating profit 16,919 19,755
Operating margin, % 21.3 21.6
Assets excluding tax receivables 22,548 24,510
Liabilities excluding tax liabilities 12,608 6,988
Investments 2,009 1,732
Depreciation 650 431
Eliminations
Net sales to other segments -79,284 -91,297
Total
External net sales 192,267 180,861
Operating profit 23,823 26,942
Operating margin, % 12.4 14.9
Assets excluding tax receivables 95,717 83,096
Liabilities excluding tax liabilities 32,011 23,386
Investments 13,661 12,059
Depreciation 7,605 6,399

Full-year report 2016 (1 Dec 2015 –30 November 2016)
21
PARENT COMPANY INCOME STATEMENT (SEK m)
Q4
2016
Q4
2015
Full year
2016
Full year
2015
External sales excluding VAT - 13 - 15
Internal sales excluding VAT* 1,157 1,080 3,985 3,605
GROSS PROFIT 1,157 1,093 3,985 3,620
Selling expenses - 0 - 0
Administrative expenses -38 -76 -173 -126
OPERATING PROFIT 1,119 1,017 3,812 3,494
Dividend from subsidiaries 11,126 11,931 12,597 13,288
Interest income and similar items** 0 126 153 154
Interest expense - 0 0 -7
PROFIT AFTER FINANCIAL ITEMS 12,245 13,074 16,562 16,929
Year-end appropriations 18 17 18 17
Tax -250 -256 -876 -806
PROFIT FOR THE PERIOD 12,013 12,835 15,704 16,140
PARENT COMPANY STATEMENT OF COMPREHENSIVE INCOME (SEK m)
Q4
2016
Q4
2015
Full year
2016
Full year
2015
PROFIT FOR THE PERIOD 12,013 12,835 15,704 16,140
Other comprehensive income
Items that have not been and will not be reclassified to profit or loss
Remeasurement of defined benefit pension plans -4 37 -4 37
Tax related to the above remeasurement 1 -8 1 -8
OTHER COMPREHENSIVE INCOME -3 29 -3 29
TOTAL COMPREHENSIVE INCOME FOR THE PERIOD 12,010 12,864 15,701 16,169
* Internal sales in the quarter consists of royalty of SEK 1,026 m (932) and other SEK 131 m (148) received from group companies and for the full-
year of royalty of SEK 3,849 m (3,457) and other SEK 136 m (148).
** Interest income and similar items in the quarter consists of SEK 13 m (17) in interest income and SEK -13 m (109) in translation effects from group
companies and in the full-year of SEK 21 m (45) in interest income and SEK 132 m (109) in translation effects from group companies.

Full-year report 2016 (1 Dec 2015 –30 November 2016)
22
PARENT COMPANY BALANCE SHEET (SEK m)
30 Nov - 2016 30 Nov - 2015
ASSETS
FIXED ASSETS
Tangible fixed assets
Buildings and land 127 71
Equipment, tools, fixture and fittings 313 435
440 506
Financial fixed assets
Shares and participation rights 588 588
Receivables from subsidiaries 779 1,085
Long-term receivables 11 11
Deferred tax receivables 42 43
1,420 1,727
TOTAL FIXED ASSETS 1,860 2,233
CURRENT ASSETS
Current receivables
Receivables from subsidiaries 16,179 14,808
Tax receivables - -
Other receivables 7 2
Prepaid expenses 0 0
16,186 14,810
Cash and cash equivalents 376 1,758
TOTAL CURRENT ASSETS 16,562 16,568
TOTAL ASSETS 18,422 18,801

Full-year report 2016 (1 Dec 2015 –30 November 2016)
23
PARENT COMPANY BALANCE SHEET (SEK m)
30 Nov - 2016 30 Nov - 2015
EQUITY AND LIABILITIES
EQUITY
Restricted equity
Share capital 207 207
Restricted reserves 88 88
295 295
Non-restricted equity
Retained earnings 861 829
Profit for the year 15,701 16,169
16,562 16,998
TOTAL EQUITY 16,857 17,293
UNTAXED RESERVES 429 447
LIABILITIES
Long-term liabiliities
Provisions for pensions 191 195
Short-term liabiliities*
Accounts payable 3 5
Tax liabilities 729 671
Other liabilities 206 182
Accrued expenses and prepaid income 7 8
945 866
TOTAL LIABILITIES 1,136 1,061
TOTAL EQUITY AND LIABILITIES 18,422 18,801
Pledged assets
Contingent liabilities 13,064 14,654
* No current liabilities are interest-bearing.

Full-year report 2016 (1 Dec 2015 –30 November 2016)
24
KEY RATIO DEFINITIONS This report contains key financial ratios in accordance with the framework for financial reporting applied by the H&M group,
which is based on IFRS. Other key ratios and indicators are also used to follow up, analyse and govern the business and to
provide the H&M group’s stakeholders with financial information concerning the group’s financial position, results and
performance in a consistent way.
These other key ratios and indicators are considered necessary in order to be able to monitor performance against the
group’s financial targets. A combination of continual growth, high profitability, stable cash flow and using capital in the right
way is intended to generate a high overall return for the H&M group’s shareholders. It is therefore relevant to present key
ratios relating to growth, profitability and capital, share-based measurements and terms relating to capital on a continuous
basis.
The key ratios and indicators used, referred to and presented in the reporting are defined as shown in the list below.
Growth measurements Change in sales %, local currency: The group’s total change in sales in local currency is calculated as the period’s net sales
(calculated at the same average rate as was used for the same period in the previous year) minus the period’s net sales in the
previous year, as a percentage of the period’s net sales in the previous year
Yield measurements Operating margin: Operating profit as a percentage of net sales for the year
Return on equity: Profit for the year in relation to average shareholders’ equity
Return on capital employed: Profit after financial items plus interest expense in relation to average shareholders’ equity plus
average interest-bearing liabilities
Capital measurements Equity/assets ratio: Shareholders’ equity in relation to total assets
Share of risk-bearing capital, %: Shareholders’ equity plus deferred tax liability in relation to total assets
Share-related measurements Equity per share: Shareholders’ equity divided by the number of shares
Earnings per share: Profit for the period in relation to the number of shares during the period
P/E ratio: Price per share divided by earnings per share
Cash flow from operating activities per share: Cash flow from operating activities for the period divided by the average
number of shares during the period
Capital terms Operating profit: Calculated as profit before financial items and tax
Gross profit: Net sales minus cost of goods sold
Gross margin: Net sales minus cost of goods sold in relation to net sales
Capital employed: Equity plus interest-bearing liabilities