full year report january – december 2017 highlights from ... · january – december 2017...
TRANSCRIPT

Q4 2017
Full Year Report JANUARY – DECEMBER 2017
Highlights from the fourth quarter and full year
• In local currencies, sales increased by 6 percent for the fourth quarter and by 3 percent for the full year. Reported sales increased by 2 percent to 4,044 MSEK (3,957) for the fourth quarter and by 4 percent to 16,101 MSEK (15,551) for the full year.
• In local currencies, operating profit from product areas1) increased by 15 percent for the fourth quarter and by 5 percent for the full year. Reported operating profit from product areas increased by 9 percent to 1,044 MSEK (954) for the fourth quarter and by 6 percent to 4,218 MSEK (3,990) for the full year.
• Operating profit amounted to 1,179 MSEK (954) for the fourth quarter and to 4,591 MSEK (6,420) for the full year2).
• Profit after tax amounted to 904 MSEK (662) for the fourth quarter and to 3,400 MSEK (5,123) for the full year.
• Earnings per share amounted to 5.10 SEK (3.61) for the fourth quarter and to 18.88 SEK (27.38) for the full year. Earnings per share excluding both larger one-time items, dividends from STG in 2017 and share of net profit in STG in 2016 increased by 17 percent to 4.24 SEK (3.61) for the fourth quarter and by 14 percent to 16.39 SEK (14.39) for the full year.
• In November, Swedish Match completed the divestment of its remaining shareholding in STG.
• During 2017, Swedish Match distributed 5,498 MSEK to its shareholders in the form of an ordinary dividend, a special dividend and share repurchases.
• The Board proposes a dividend of 16.60 SEK per share consisting of an increased ordinary dividend of 9.20 SEK (8.50) and a special dividend of 7.40 SEK, following the final sale of shares in STG.
• As of January 1, 2018, Swedish Match will apply the new revenue recognition standard, IFRS 15. While not impacting profit, this implementation will have a significant effect on the recognition of net sales. Further information is given in Note 1, Accounting principles.
• The outlook for 2018 can be found on page 13.
1) Operating profit for Swedish Match product areas, which excludes larger one-time items and share of net profit in STG in 2016. 2) The full year 2017 includes larger one-time items of 373 MSEK relating to capital gains from the sale of STG shares and from
the sale of a parcel of land as well as an income from a defined benefit plan amendment. Previous full year included larger one-time items of 2,254 MSEK relating to capital gains from the partial divestments of STG and an unrealized gain from revaluing Swedish Match’s then remaining shareholding in STG to market value as well as a capital gain from the sale of a distribution center. The fourth quarter of 2017 includes larger one-time items of 135 MSEK relating to a capital gain from the sale of STG shares and an income from a defined benefit plan amendment.
________________________________________________________________________ January-December 2017 2
CEO Lars Dahlgren comments: 2017 – A year of growth built on quality, tradition, and innovation I am very pleased with Swedish Match’s performance in 2017 - a year of solid growth, with higher sales and operating profit from product areas. Investments that we have made within our consumer insights and R&D functions have strengthened our portfolio of smokeless offerings, and we have supplemented organic efforts through acquisitions. In recent years, global tobacco competitors have signaled a shift in their strategic agendas to acknowledge the role of less harmful alternatives. With our vision of a world without cigarettes and long history of offering tobacco consumers significantly less harmful products, Swedish Match has pioneered this effort.
During 2017, we saw a number of positive developments in the Snus and moist snuff product area. In both reported and local currency terms, our sales and operating profit in this product area grew both in Scandinavia and in the US.
In Sweden, the snus market has experienced greater stability in terms of price segmentation. The premium segment of the market has demonstrated stable or improving trends and our largest premium brands, General and Göteborgs Rapé, have maintained their market shares, aided by the positioning of our XR and, more recently, One brand extensions, which are modern variants with attractive premium pricing. In Norway, our market share toward the latter part of 2017 was very similar to the level in late 2016. This turnaround from recurring share losses to share stability stems from a combination of timely and focused R&D, marketing and sales execution along with a broader assortment of modern products that are very appealing to the Norwegian snus consumers. Growth from our G.3 range significantly outpaced the market in 2017, and the G.3 range of products now commands 14 percent of the total pouch segment in Norway.
In the US snus market, we experienced increased volumes, higher gross profit and reduced operating losses from our General brand. For ZYN, our nicotine pouch product without tobacco, we expanded our distribution in the western US, and volume growth has been impressive, coming from both store expansion and increased sales per store. For Swedish snus in the US and ZYN combined, profitability has been improving. In 2017 we announced an investment of about 40 MUSD to support ZYN manufacturing capacity in the US. In early 2018, we made a decision to further increase longer term capacity, and the total investment is now estimated to be more than 60 MUSD – a testament to the very strong reception to ZYN.
Within Other tobacco products (cigars and chewing tobacco) we had another outstanding year for cigars, with record volumes, sales and operating profit. The operating performance is even stronger than our financial results reflect, considering that FDA user fees in 2017 were approximately 60 MSEK higher when compared to 2016. For US chewing tobacco, while the market decline was in line with the average decline over the past several years, we have seen a notable shift in both the market and our own portfolio toward value priced products. While declining volumes and segment shifts put pressure on our sales and portfolio mix, we are encouraged by the fact that our own share developments in both the premium and value segments have improved during 2017. Chew bags are a small but growing chewing tobacco category in Europe, and our acquisition of V2 Tobacco substantially expanded our footprint for these convenient and easy-to-use chewing products. With our state of the art production facility in Denmark, our well accepted brands, and presence in both traditional retailers and e-commerce, we look forward to growth in this emerging category over the coming years.
Our lights business had a challenging year with volume declines for both lighters and matches, but strict cost control, a strong performance for complementary products, and favorable currency developments enabled our 2017 profitability to be fairly close to the 2016 level.
Our vision of a world without cigarettes has been reinforced through our strategic investments and our product offerings. We stand firmly behind our vision, knowing that the benefits to society of a world without cigarettes are vast. We are encouraged that certain regulators have begun to acknowledge, and more importantly, adopt the concept of harm reduction. In the US, the FDA has announced its support for regulations based on the continuum of risk for different tobacco and nicotine-containing products. Far too often, however, we are faced with increased regulation based not on science, but ideology, and the regulations themselves are, at times, arbitrary and discriminatory. Swedish Match understands and willingly accepts the responsibility that comes with selling products intended for adult consumers only. We will not, however, passively capitulate to regulations that we believe elevate ideology over societal health. As an example, Norway has passed plain packaging regulations that seemingly ignore the underlying comparable health risks of cigarettes versus snus.

________________________________________________________________________ January-December 2017 3
We challenged this regulation through the Norwegian courts, but lost in the first instance on November 6, 2017. However, we are undeterred in our position that this regulation is disproportionate and unfairly discriminatory toward snus and have appealed the lower court’s decision. Similarly, in January 2018, the legality of the snus ban within the EU was once again heard by the European Court of Justice, and we anticipate that it will be several months before the court reaches a final verdict. We would like to believe that justice will prevail and that we will see the removal of this disproportionate and discriminatory ban that limits the informed choice by European consumers.
During the year, we sold our remaining shareholding in Scandinavian Tobacco Group (STG). With our healthy balance sheet, cash generated from our operations, and supplemented by cash generated from our sale of shareholdings in STG, we delivered strong cash returns to our shareholders, with both our ordinary dividend and a special dividend. We also repurchased 8.8 million shares, further enhancing shareholder value. At the upcoming Annual General Meeting, the Board of Directors will be proposing an increased ordinary dividend, as well as a special dividend.
The fourth quarter For the fourth quarter, Swedish Match’s operating profits were up for all product areas, except for Other operations. Sales were higher in both reported and local currencies for both Snus and moist snuff and Other tobacco products. For Lights, sales were down slightly in SEK, but up in local currencies.
For Snus and moist snuff, we saw sales growth in both Sweden and Norway in local currencies. In the US, sales and volumes were higher for moist snuff, snus, and ZYN. For Other tobacco products, cigars once again reported higher volumes, sales, and operating profit in local currency, with volume growth from both natural leaf and HTL varieties. US chewing tobacco sales and operating profit declined in line with the full year performance. Within our Lights product area, operating profit was higher aided by lower overhead costs for the quarter.
In summary, our two largest product areas delivered solid financial performances during the fourth quarter and for the full year. Despite very competitive conditions and ongoing regulatory challenges, we are well positioned for future growth. Our brand portfolios are strong, with high quality traditional and innovative new offerings. As consumer demands evolve, we are encouraged that our approach of providing both new and well-established varieties is delivering positive market and financial results, bringing us closer to our vision and enabling us to deliver attractive returns to our shareholders.

________________________________________________________________________ January-December 2017 4
Summary of consolidated income statement MSEK October-December Chg Full Year Chg Note 2017 2016 % 2017 2016 %
Sales 4,044 3,957 2 16,101 15,551 4 Operating profit from product areas 1,044 954 9 4,218 3,990 6 Operating profit 1,179 954 24 4,591 6,420 -28 Profit before income tax 1,135 868 31 4,352 5,988 -27 Profit for the period 904 662 37 3,400 5,123 -34 Operating margin from product areas, % 25.8 24.1 26.2 25.7 Earnings per share, SEK 8 5.10 3.61 18.88 27.38 Earnings per share, excl. income from STG, SEK 8 4.90 3.61 18.37 26.44 Earnings per share, excl. income from STG, and larger one-time items, SEK 8 4.24 3.61 16.39 14.39
The fourth quarter (Note: Comments below refer to the comparison between the fourth quarter 2017 vs. the fourth quarter 2016).
Sales Sales increased by 2 percent to 4,044 MSEK (3,957). Currency translation negatively affected the sales comparison by 158 MSEK. In local currencies, sales increased 6 percent and were up for every product area with a contribution of somewhat more than 1 percent from newly acquired V2 Tobacco.
Earnings Operating profit from product areas increased by 9 percent to 1,044 MSEK (954). Operating profit increased for all product areas except for Other operations, in both reported and local currencies. In local currencies, operating profit from product areas was up by 15 percent. The growth in operating profit was driven by both increased sales and low operating expenses for the quarter across the portfolio. The acquisition of V2 Tobacco also contributed positively (with an effect of approximately 3 percent).
Operating profit, including larger one-time items, amounted to 1,179 MSEK (954). Larger one-time items included a capital gain from the sale of the total remaining shareholding in STG of 66 MSEK and an income from a defined benefit plan amendment of 69 MSEK.
The Group’s net finance cost amounted to 44 MSEK (85) including a dividend receipt from STG of 42 MSEK.
Profit for the period amounted to 904 MSEK (662).
Earnings per share (EPS) for the fourth quarter amounted to 5.10 SEK (3.61). EPS excluding both larger one-time items and a dividend from STG in 2017 and share of net profit in STG in 2016 increased by 17 percent to 4.24 SEK (3.61).
The full year (Note: Comments below refer to the comparison between full year 2017 vs. full year 2016).
Sales Sales increased by 4 percent to 16,101 MSEK (15,551). Currency translation affected the sales comparison positively by 27 MSEK. In local currencies, sales increased by 3 percent.
Earnings Operating profit from product areas increased by 6 percent to 4,218 MSEK (3,990). Operating profit increased for all product areas except Lights. In local currencies, the operating profit from product areas increased by 5 percent. FDA user fees for our cigar business burdened operating profit for all of 2017 but only the fourth quarter of the prior year and had a negative effect on operating profit from product areas of close to 2 percent.
Operating profit, including larger one-time items, amounted to 4,591 MSEK (6,420). Operating profit included income from associated companies of 10 MSEK (180) of which 0 MSEK (176) related to STG (see Note 9). Larger one-time items in 2017 included capital gains from the divestment of shares in STG of 197 MSEK and from the sale of land of 107 MSEK as well as the income from the defined benefit plan amendment of 69 MSEK. The previous full year included larger one-time items of 2,254 MSEK relating to capital gains on sale

________________________________________________________________________ January-December 2017 5
of shares in STG and an unrealized gain from revaluing Swedish Match’s then remaining shareholding in STG to market value as well as a capital gain from the sale of a distribution center. Currency translation had an immaterial positive effect on the comparison of operating profit between the years.
The Group’s net finance cost including dividends from STG of 107 MSEK in 2017 amounted to 240 MSEK (431). Prior year period’s net finance cost included costs of 67 MSEK for repurchases of bonds. The income tax expense amounted to 952 MSEK (865) and the tax rate, excluding associated companies, dividends from STG, and non-taxable larger one-time items was 23.8 percent (24.3). The reassessment of the deferred income tax balances of our US business following the passage of the Tax Cuts and Jobs Act in December 2017 had a small lowering effect on the tax rate for the year but had an adverse effect of negative 96 MSEK on the tax recognized in Other comprehensive income.
Profit for the period amounted to 3,400 MSEK (5,123).
EPS amounted to 18.88 SEK (27.38) for the full year. Adjusted for larger one-time items in both periods as well as dividends from STG in 2017 and share of net profit in STG in 2016, EPS increased by 14 percent to 16.39 SEK (14.39).
ZYN
During 2017, Swedish Match continued to broaden its distribution in the western US of ZYN, a range of nicotine pouch products without tobacco. In Sweden, ZYN was introduced in Swedish Match’s own stores in late 2016. During 2017, ZYN also became available for people living in Sweden via the online channel as well as in a selected number of convenience stores.
________________________________________________________________________ January-December 2017 6
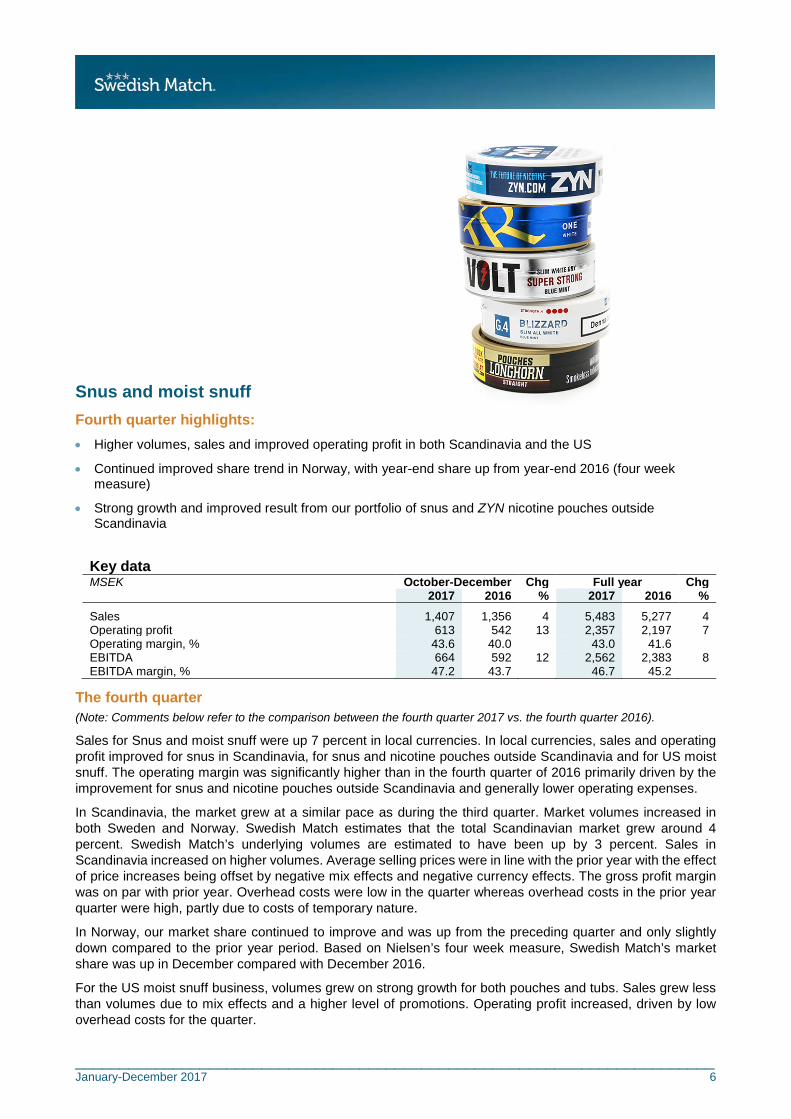
Snus and moist snuff Fourth quarter highlights: • Higher volumes, sales and improved operating profit in both Scandinavia and the US
• Continued improved share trend in Norway, with year-end share up from year-end 2016 (four week measure)
• Strong growth and improved result from our portfolio of snus and ZYN nicotine pouches outside Scandinavia
Key data MSEK October-December Chg Full year Chg 2017 2016 % 2017 2016 %
Sales 1,407 1,356 4 5,483 5,277 4 Operating profit 613 542 13 2,357 2,197 7 Operating margin, % 43.6 40.0 43.0 41.6 EBITDA 664 592 12 2,562 2,383 8 EBITDA margin, % 47.2 43.7 46.7 45.2
The fourth quarter (Note: Comments below refer to the comparison between the fourth quarter 2017 vs. the fourth quarter 2016).
Sales for Snus and moist snuff were up 7 percent in local currencies. In local currencies, sales and operating profit improved for snus in Scandinavia, for snus and nicotine pouches outside Scandinavia and for US moist snuff. The operating margin was significantly higher than in the fourth quarter of 2016 primarily driven by the improvement for snus and nicotine pouches outside Scandinavia and generally lower operating expenses.
In Scandinavia, the market grew at a similar pace as during the third quarter. Market volumes increased in both Sweden and Norway. Swedish Match estimates that the total Scandinavian market grew around 4 percent. Swedish Match’s underlying volumes are estimated to have been up by 3 percent. Sales in Scandinavia increased on higher volumes. Average selling prices were in line with the prior year with the effect of price increases being offset by negative mix effects and negative currency effects. The gross profit margin was on par with prior year. Overhead costs were low in the quarter whereas overhead costs in the prior year quarter were high, partly due to costs of temporary nature.
In Norway, our market share continued to improve and was up from the preceding quarter and only slightly down compared to the prior year period. Based on Nielsen’s four week measure, Swedish Match’s market share was up in December compared with December 2016.
For the US moist snuff business, volumes grew on strong growth for both pouches and tubs. Sales grew less than volumes due to mix effects and a higher level of promotions. Operating profit increased, driven by low overhead costs for the quarter.

________________________________________________________________________ January-December 2017 7
The total net operating loss for snus and nicotine pouches outside Scandinavia decreased to 23 MSEK (59), attributable to higher gross profit from higher volumes and improved pricing as well as lower marketing costs in the quarter. Snus is available in about 18,000 stores in the US. ZYN is available in close to 9,000 stores and velocity per store continued to increase. Volumes for both snus and nicotine pouches outside Scandinavia grew.
The full year (Note: Comments below refer to the comparison between full year 2017 vs. full year 2016).
Sales for the product area grew by 4 percent in local currencies. Operating profit increased to 2,357 MSEK (2,197) and included net operating result for snus and nicotine pouches outside Scandinavia of negative 167 MSEK (negative 232). The improved operating profit was driven by growth in Scandinavia and reduced operating losses from snus and nicotine pouch products outside Scandinavia.
Swedish Match estimates that its underlying volumes on the Scandinavian market were up by more than 1 percent. Swedish Match estimates that the total Scandinavian snus market grew by close to 4 percent in volume terms.
In Norway, the plain packaging regulation has been in force since July 1, 2017. New products launched after that date need to be in plain packaging. Products on the market prior to July 1, 2017 are required to be in plain packaging in the trade from July 1, 2018.
In Scandinavia, the operating profit grew primarily on higher volumes and improved average price. In the US, sales in local currency for moist snuff declined on lower volumes, while operating profit improved on higher average price and favorable production costs. For snus and nicotine pouches outside Scandinavia, both sales and gross profit increased.
Swedish Match shipment volumes Millions of cans October-December Chg Full year Chg 2017 2016 % 2017 2016 %
Snus, Scandinavia1) 66.4 62.4 6 247.6 241.3 3 Moist snuff, US 27.9 27.0 3 127.4 131.4 -3 Snus and nicotine pouches, outside Scandinavia1) 4.4 2.2 100 13.2 7.8 70 1) Includes V2 Tobacco snus volumes from date of acquisition.
Swedish Match Scandinavian snus market shares1)
Percent October-December Chg Full year Chg 2017 2016 ppts 2017 2016 ppts
Snus, Sweden, total 64.8 66.4 -1.6 65.2 67.3 -2.1 Snus, Sweden, premium 90.7 92.4 -1.7 91.2 92.7 -1.6 Snus, Sweden, value 35.2 37.0 -1.8 36.0 38.0 -2.0
Snus, Norway, total 52.5 52.6 -0.1 52.1 53.5 -1.4 1) Swedish Match estimates using Nielsen data (excluding tobacconists): 13 weeks and YTD to December 31, 2017 and January
1, 2017, respectively. All figures for the Swedish market have been restated to reflect changes in Nielsen store measurements.
________________________________________________________________________ January-December 2017 8
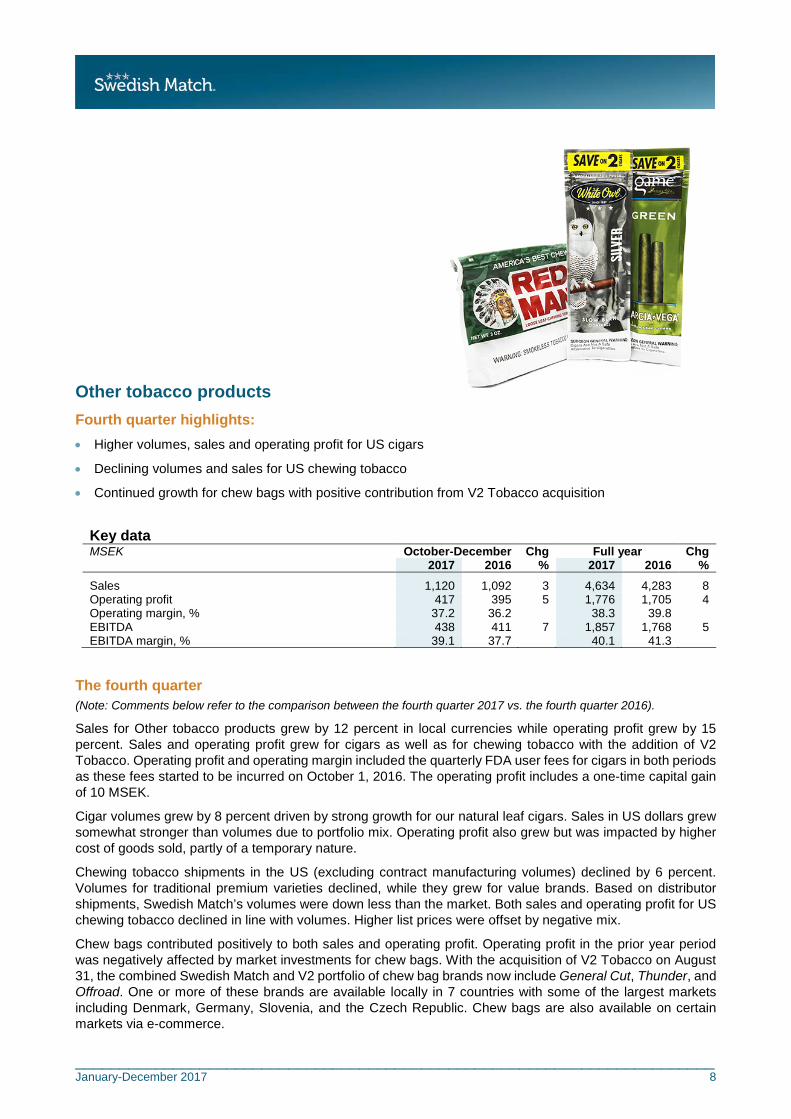
Other tobacco products Fourth quarter highlights: • Higher volumes, sales and operating profit for US cigars
• Declining volumes and sales for US chewing tobacco
• Continued growth for chew bags with positive contribution from V2 Tobacco acquisition
Key data MSEK October-December Chg Full year Chg 2017 2016 % 2017 2016 %
Sales 1,120 1,092 3 4,634 4,283 8 Operating profit 417 395 5 1,776 1,705 4 Operating margin, % 37.2 36.2 38.3 39.8 EBITDA 438 411 7 1,857 1,768 5 EBITDA margin, % 39.1 37.7 40.1 41.3
The fourth quarter (Note: Comments below refer to the comparison between the fourth quarter 2017 vs. the fourth quarter 2016).
Sales for Other tobacco products grew by 12 percent in local currencies while operating profit grew by 15 percent. Sales and operating profit grew for cigars as well as for chewing tobacco with the addition of V2 Tobacco. Operating profit and operating margin included the quarterly FDA user fees for cigars in both periods as these fees started to be incurred on October 1, 2016. The operating profit includes a one-time capital gain of 10 MSEK.
Cigar volumes grew by 8 percent driven by strong growth for our natural leaf cigars. Sales in US dollars grew somewhat stronger than volumes due to portfolio mix. Operating profit also grew but was impacted by higher cost of goods sold, partly of a temporary nature.
Chewing tobacco shipments in the US (excluding contract manufacturing volumes) declined by 6 percent. Volumes for traditional premium varieties declined, while they grew for value brands. Based on distributor shipments, Swedish Match’s volumes were down less than the market. Both sales and operating profit for US chewing tobacco declined in line with volumes. Higher list prices were offset by negative mix.
Chew bags contributed positively to both sales and operating profit. Operating profit in the prior year period was negatively affected by market investments for chew bags. With the acquisition of V2 Tobacco on August 31, the combined Swedish Match and V2 portfolio of chew bag brands now include General Cut, Thunder, and Offroad. One or more of these brands are available locally in 7 countries with some of the largest markets including Denmark, Germany, Slovenia, and the Czech Republic. Chew bags are also available on certain markets via e-commerce.

________________________________________________________________________ January-December 2017 9
The full year (Note: Comments below refer to the comparison between full year 2017 vs. full year 2016).
In local currencies, sales for Other tobacco products were up by 8 percent, while operating profit was up by 4 percent, driven by cigars. Operating profit and operating margin were negatively impacted by the introduction of FDA user fees for cigars beginning from October 1, 2016. Adjusted for the FDA fees (10.1 MUSD incurred in 2017 and 2.5 MUSD in 2016), the operating profit in local currencies would have increased by 8 percent.
Cigar volumes increased by 11 percent, with growth from both natural leaf and HTL varieties, and sales in US dollars increased in line with volumes. Operating profit was also higher despite the full year effects of FDA user fees.
Sales for chewing tobacco were on par with prior year while operating profit grew somewhat. For US chewing tobacco, volumes were down by close to 6 percent and sales declined as increased average price only partly mitigated the effect from the lower volumes. Chew bags contributed positively to both sales and operating profit and compensated for the lower sales and operating profit for US chewing tobacco.
Swedish Match US shipment volumes October-December Chg Full year Chg 2017 2016 % 2017 2016 %
Cigars, millions of sticks 398 367 8 1,629 1,472 11 Chewing tobacco, thousands of pounds (excluding contract manufacturing volumes) 1,352 1,440 -6 6,341 6,709 -5
Lights Fourth quarter highlights: • Higher sales for complementary products
• Lower sales for lighters and matches, affected by negative currency effects
• Growth in operating profit for all product categories
Key data MSEK October-December Chg Full year Chg 2017 2016 % 2017 2016 %
Sales 341 347 -2 1,291 1,314 -2 Operating profit 68 62 9 211 219 -4 Operating margin, % 19.9 17.9 16.4 16.7 EBITDA 78 73 7 253 259 -2 EBITDA margin, % 23.0 21.1 19.6 19.7

________________________________________________________________________ January-December 2017 10
The fourth quarter (Note: Comments below refer to the comparison between the fourth quarter 2017 vs. the fourth quarter 2016).
Sales declined by 2 percent, with increased sales for complementary products partially offsetting lower sales for both matches and lighters. Lower volumes for both lighters and matches and negative currency effects were partly compensated by higher pricing and positive mix. Operating profit for lighters and matches grew, on improved average price and lower overhead costs, partly of temporary nature. Operating profit for complementary products grew on higher sales.
The full year (Note: Comments below refer to the comparison between full year 2017 vs. full year 2016).
Sales declined by 2 percent for the product area but increased for both complementary products and matches. Lighter sales and operating profit declined on lower volumes. Sales for matches increased somewhat as lower volumes were compensated by positive pricing, mix and currency effects but operating profit was down on higher production costs. Operating profit for complementary products increased on higher sales and favorable costing.
Swedish Match shipment volumes, worldwide October-December Chg Full year Chg 2017 2016 % 2017 2016 %
Matches, billion sticks 18.2 19.1 -5 65.0 72.0 -10 Lighters, million units 93.1 94.7 -2 368.1 399.2 -8
Other operations Other operations consists of corporate functions providing services to the Swedish Match operating divisions. Services provided include, among other, regulatory affairs, legal and financial services as well as a distribution function. The distribution function provides services to Swedish Match in Sweden and Norway as well as to other manufacturers within the Swedish distribution network. Following the implementation of IFRS 15, Other operations will no longer qualify as a reportable segment, as the recognized sales will be substantially lower. See Notes 1 and 2 for more information.
The fourth quarter Sales in Other operations for the fourth quarter amounted to 1,176 MSEK (1,163). Operating loss for Other operations was 53 MSEK (45). The operating result was negatively affected by high project costs as well as certain costs of a temporary nature relating to pensions.
The full year Sales for the full year amounted to 4,693 MSEK (4,676). Operating loss for the year was 126 MSEK (132). During the first quarter of 2016, a tax-exempt capital gain of 145 MSEK from the sale of the Solna distribution facility was recognized as a larger one-time item.
Financing and cash flow Cash flow from operating activities for the year amounted to 3,402 MSEK (2,929). Adjusted for the dividend received from STG in the prior year, the cash flow from operating activities increased by 665 MSEK to 3,402 MSEK (2,738). The increase in cash flow from operating activities was driven by improved EBITDA, lower pension contributions and lower income taxes paid. The lower income taxes paid were a result of a positive cash receipt in 2017 from the tax deduction, at the 38 percent tax rate, on the payment in 2016 of a large contribution to a US defined benefit plan.
During the year, Swedish Match had a positive net cash flow from investing activities. Swedish Match received 2,554 MSEK from the two divestments of shares in STG (first and fourth quarters). In the first quarter, another 107 MSEK of additional purchase price payments relating to a parcel of land sold in 2007 was received, and during the fourth quarter 106 MSEK was received following the divestment of shares in Arnold André. Cash flows from investing activities also include dividends of 107 MSEK from STG received during the second and fourth quarters of 2017 (based on our 9.1 percent ownership interest). The dividend received from STG of 191 MSEK during the second quarter of 2016 (based on our 31.1 percent ownership interest) was recognized as cash flows from operating activities.
________________________________________________________________________ January-December 2017 11
Investments in property, plant and equipment as well as intangible assets decreased to 378 MSEK (666), with prior year investments reflecting the acquisition of patent rights for a nicotine pouch product without tobacco.
Net finance cost for the year decreased to 240 MSEK (431) and included the dividend received from STG of 107 MSEK. Net finance cost in 2016 included a cost of 67 MSEK relating to repurchase of bond loans. Adjusting for both the dividend from STG and the cost of 67 MSEK, the net finance cost improved by 18 MSEK. This improvement is mainly related to lower net interest expense on pensions. Interest expenses on the bond portfolio were on a similar level to prior year with the effect of higher average debt being offset by lower interest rates.
During 2017, new bond loans of 3,293 MSEK were issued, of which a 200 MEUR public bond maturing in 2025 was issued in November 2017. In total, during the year, repayments of bond loans amounted to 1,988 MSEK, all of which were repaid in November. As of December 31, 2017, Swedish Match had 11,123 MSEK of interest bearing debt excluding retirement benefit obligations compared to 9,854 MSEK at December 31, 2016. During 2018, 1,250 MSEK of this debt falls due for payment. For further detail of the maturity profile of the debt portfolio please see the Company website.
Net retirement benefit obligations decreased to 1,058 MSEK as of December 31, 2017, from 1,452 MSEK at December 31, 2016. The decrease is mainly due to positive currency effects and additional defined benefit obligation contributions.
As of December 31, 2017, Swedish Match had 1,500 MSEK in unutilized committed credit lines. Cash and cash equivalents amounted to 3,998 MSEK at the end of the period, compared to 3,364 MSEK at December 31, 2016. The cash and cash equivalent balance includes the proceeds from the sale of STG shares in November which are proposed to be distributed to the shareholders.
The net debt as of December 31, 2017 amounted to 8,183 MSEK compared to 7,941 MSEK at December 31, 2016.
Shareholder distributions During 2017, Swedish Match has distributed a total of 5,498 MSEK (6,771) to its shareholders in the form of ordinary and special dividends as well as share repurchases.
In 2017, Swedish Match paid dividends totaling 2,908 MSEK, consisting of an ordinary dividend of 1,545 MSEK and a special dividend of 1,363 MSEK following the partial divestment of shares in STG in January. During the year, Swedish Match repurchased 8.8 million shares for 2,590 MSEK at an average price of 295.62 SEK, following authorization from the Annual General Meetings held in 2016 and 2017. Total shares bought back by Swedish Match since the buyback program started have been repurchased at an average price of 123.32 SEK.
At December 31, 2017 Swedish Match held 5.9 million shares, corresponding to 3.24 percent of the total number of registered shares. The number of shares outstanding, net, at December 31, 2017, amounted to 175.9 million.
The Board of Directors will propose to the Annual General Meeting in April 2018 a renewed mandate to repurchase shares up to a total holding in treasury not exceeding 10 percent of the number of registered shares in the Company until the Annual General Meeting in 2019.
Proposed dividend per share The Board of Directors proposes to the Annual General Meeting (AGM) a total dividend of 16.60 SEK per share consisting of an increased ordinary dividend per share of 9.20 SEK (8.50) and a special dividend of 7.40 SEK. The proposed ordinary dividend is in line with Swedish Match’s ambition to continually grow dividend per share with a payout ratio normally within 40-60 percent of earnings per share, subject to adjustment for larger one-time items. The proposed dividend of 9.20 SEK per share represents an increase of 8 percent and equal a payout ratio of 56 percent (59) of the earnings per share for the year, excluding income from STG and larger one-time items. The special dividend of 7.40 SEK is proposed in accordance with Swedish Match’s financial policy of returning excess cash to its shareholders and follows the sale of the remaining shareholding in STG in November 2017. The proposed ordinary and special dividend together amounts to 2,920 MSEK based on the 175.9 million shares outstanding at the end of the year.

________________________________________________________________________ January-December 2017 12
Other events during the quarter Divestment of shares in Scandinavian Tobacco Group On November 8, Swedish Match divested its remaining holding of 9,069,906 shares in STG at a price of 109.13 DKK per share. Swedish Match’s proceeds, net of transaction costs, from this divestment amounted to 1,200 MSEK. The tax-exempt capital gain from the divestment amounted to 66 MSEK, corresponding to the difference between the price at divestment and the market value at reclassification in September 2016, less transaction costs, and has been recognized as a larger one-time item in the fourth quarter.
Divestment of Arnold André On October 17, Swedish Match reached an agreement to divest its 40 percent holding in the German cigar company Arnold André GmbH & Co. KG. This holding has been reported as an associated company under the equity method. The transaction was closed on October 31, 2017.
Plain packaging legislation in Norway On November 6, the Norwegian courts concluded that the standardized packaging for snus is consistent with the proportionality principle in EU/EEA law. Swedish Match appealed the verdict on January 7, 2018 because in our view, the standardized packaging ruling, among other points, 1) makes incorrect claims about the health risks with snus use, 2) shows consistent lack of distinction between snus and cigarettes, 3) is based on an inadequate assessment of whether the injunction will have a positive impact on public health. If there are no changes following the verdict, all snus and cigarette products sold at retail from July 1, 2018 must be packaged in plain packaging.
Tax cases in Sweden The Swedish Tax Agency has performed tax audits of a number of Swedish Match’s Swedish group companies. After completing the audits, the Swedish Tax Agency has notified Swedish Match that deductions of certain costs in two cases have been denied. The Tax Agency is claiming total income tax and penalties of approximately 300 MSEK. Swedish Match does not agree with the Tax Agency’s assessment and has appealed the decisions. No provision has been recognized.
“Track and trace” regulation in Sweden The 2014 EU directive on tobacco products (Directive 2014/40/EU) stipulated that the EU Commission should determine technical standards for the establishment and operation of a tracking and tracing system for tobacco products. In November, the EU Commission adopted such technical standards and the system is to be implemented in the member states in May 2019 for cigarettes and roll-your-own tobacco and in May 2024 for other tobacco products. Since the system is not applicable to Swedish Match products until 2024, the most immediate impact on Swedish Match will be on its distribution function in Sweden. The Swedish Public Health Authority (FHM) has not yet proposed how the system should be implemented in Sweden.
Nominating Committee In accordance with the instructions adopted by the Annual General Meeting 2017, a Nominating Committee has been appointed. In addition to Conny Karlsson (Chairman of the Board), Mark Husson (Cedar Rock Capital), Ossian Ekdahl (First Swedish National Pension Fund), Daniel Ovin (Nordea Asset Management), and William James (Standard Life Investments), have been appointed members of the Nominating Committee.
Events after the reporting period Swedish proposition on extended regulation on tobacco and similar products The Swedish Government has announced that it intends to propose new legislation on tobacco and similar products to the Parliament on February 20, 2018. The announced proposal is scheduled to take effect from January 1, 2019 and includes a number of proposed measures including a ban on consumer self-service for all tobacco products at point of sale, a ban on tobacco advertising at point of sale other than in specialty tobacco shops and for snus a minimum of 20 pouches per can. The announced proposal also includes the EU mandated track and trace system for tobacco products but detailed instructions for such implementation will be announced at a later date.
________________________________________________________________________ January-December 2017 13
The European Court of Justice’s hearings on the snus ban and legality of chew bags The European Court of Justice (ECJ) had its hearing with regard to the ban on the sale and distribution of snus within the European Union on January 25, 2018. A ruling on the challenge of the EU snus ban before the ECJ is not expected before the second half of 2018.
The ECJ is also expected to hear a case referred by the Administrative court of Bavaria regarding whether chew bags shall be defined as chewing tobacco and thereby allowed within the EU market (the Hartmann case). The ECJ is expected to hear this case a number of months following the case regarding the snus ban. A negative ruling could impact Swedish Match’s sale of chew bags on certain European markets.
Outlook Swedish Match expects that the trend of increased interest from consumers, industry players and regulators in less harmful alternatives to cigarettes will continue. Swedish Match takes pride in paving the way with its vision of a world without cigarettes. By providing products that are recognized as safer alternatives to cigarettes, our ambition is to create value for both shareholders and the society.
For 2018, on a full year basis, Swedish Match expects the Scandinavian snus market to continue to grow and to remain highly competitive. In the US moist snuff market, we expect continued good growth for pouches. Swedish Match also expects the US snus/nicotine pouch market to grow. For US chewing tobacco we expect continued market declines, while for chew bags in Europe we expect continued market growth.
We will continue to invest in growth for snus and nicotine pouches outside Scandinavia. We will also increase the availability of nicotine pouches to Swedish consumers and explore new market opportunities for chew bags. The operating loss for snus and nicotine pouches outside Scandinavia is expected to be noticeably lower in 2018 than in 2017. The decision to invest in ZYN production capacity in the US will predominantly affect capital expenditures in 2018.
For the full year, Swedish Match expects continued growth in the US cigar market. Swedish Match expects the US cigar market to remain highly competitive.
The effective corporate tax rate in 2018, excluding associated companies and any non-taxable larger one-time items, is expected to be around 21.5 percent (23.8). The expected reduction in tax rate is a consequence of the US corporate income tax reform effective January 1, 2018.
The Company remains committed to returning cash not needed in operations to shareholders.
Risk factors Swedish Match faces intense competition in all of its markets and for each of its products and such competition may increase in the future. To remain successful, the Group must develop products and brands that resonate with changing consumer trends, and price and promote its brands competitively. Restrictions on advertising and promotion may, however, make it more difficult to counteract any loss of consumer loyalty. Competitors may develop and promote new products which could be successful, and could thereby have an adverse effect on Swedish Match results of operations.
Swedish Match has substantial sales in the US, with products sourced from local US production facilities and imports from Swedish Match’s production facilities in the Dominican Republic and in Sweden. Swedish Match also has operations in Brazil, Norway and EMU member countries. Consequently, changes in import duties as well as in exchange rates of the euro, Norwegian krone, Brazilian real, the Dominican peso and in particular the US dollar may adversely affect the Group’s results of operations, cash flow, financial condition or relative price competitiveness in the future. Such effects may occur both in local currencies and when such local currencies are translated into Swedish currency for purposes of financial reporting.
Regulatory developments and fiscal changes related to tobacco, corporate income and other taxes, as well as to the marketing, sale and consumption of tobacco products, in the countries where the Group is operating may have an adverse effect on Swedish Match results of operations.
For a further description of risk factors affecting Swedish Match, see the Report of the Board of Directors in the Swedish Match annual report for 2016, available on swedishmatch.com.
________________________________________________________________________ January-December 2017 14
Swedish Match AB (publ) Swedish Match AB (publ) is the Parent Company of the Swedish Match Group. The main sources of income for the Parent Company are dividends and Group contributions from subsidiaries.
Sales in the Parent Company for the full year 2017 amounted to 47 MSEK (52). Profit before income tax amounted to 6,664 MSEK (4,260) and net profit for the year amounted to 6,367 MSEK (4,041). The higher net profit for the year mainly pertains to higher dividends from subsidiaries compared to previous year.
During the year, the Parent Company received dividends amounting to 23,827 MSEK (3,395) as well as net contributions amounting to 2,415 MSEK (2,179). A large part of the dividend received is a result of an internal group loan being settled and the creditor distributing the settlement amount to the Parent Company. Due to the subsidiary’s reduced equity following the distribution, the Parent Company wrote down shares in subsidiaries by a corresponding amount.
The Parent Company sold a parcel of land adjacent to the former headquarters building in Stockholm in 2007, for which the final purchase price was subject to approval of a changed city plan. This approval was received in the first quarter of 2017 as well as an additional payment of 107 MSEK.
Lower administration costs mainly relate to lower pension costs compared to prior year. Pension costs in the prior year period were high due to lower discount rate assumptions. Pension costs in the current year are affected by a one-time income from surplus assets relating to insurance contracts purchased in previous years to settle certain defined benefit obligations in Sweden.
Part of the Group’s treasury operations are within the operations of the Parent Company, including the major part of the Group’s external borrowings. The majority of these loans have fixed interest rates. During the year, repayments of bond loans amounted to 1,988 MSEK and new bond loans of 3,293 MSEK were issued.
A dividend of 2,908 MSEK (5,522) was paid during the year, including a special dividend of 1,363 MSEK (4,016) relating to a partial divestment of shares in STG. During the year, the Parent Company also distributed 2,590 MSEK (1,249) in the form of share repurchases.
No capital expenditures of tangible or intangible fixed assets have been recognized during the year. During 2016, a minor amount was capitalized as tangible fixed asset.
Forward-looking information This report contains forward-looking information based on the current expectation of the Swedish Match Group’s management. Although management deems that the expectations presented by such forward-looking information are reasonable, no guarantee can be given that these expectations will prove correct. Accordingly, the actual future outcome could vary considerably compared to that stated in the forward-looking information, due to such factors as changed market conditions for Swedish Match’s products and more general factors such as business cycles, markets and competition, changes in legal requirements or other political measures, and fluctuations in exchange rates.
Additional information This report has not been reviewed by the Company’s auditors. The annual report for 2017 is expected to be distributed the week beginning with March 19 and will be available on the Company’s website swedishmatch.com and at Swedish Match’s headquarters, Sveavägen 44, Stockholm. The Annual General Meeting will be held on April 11, 2018 in Stockholm, Sweden. The January-March 2018 report will be released on May 4, 2018.
Stockholm, February 14, 2018 Lars Dahlgren President and CEO
________________________________________________________________________ January-December 2017 15
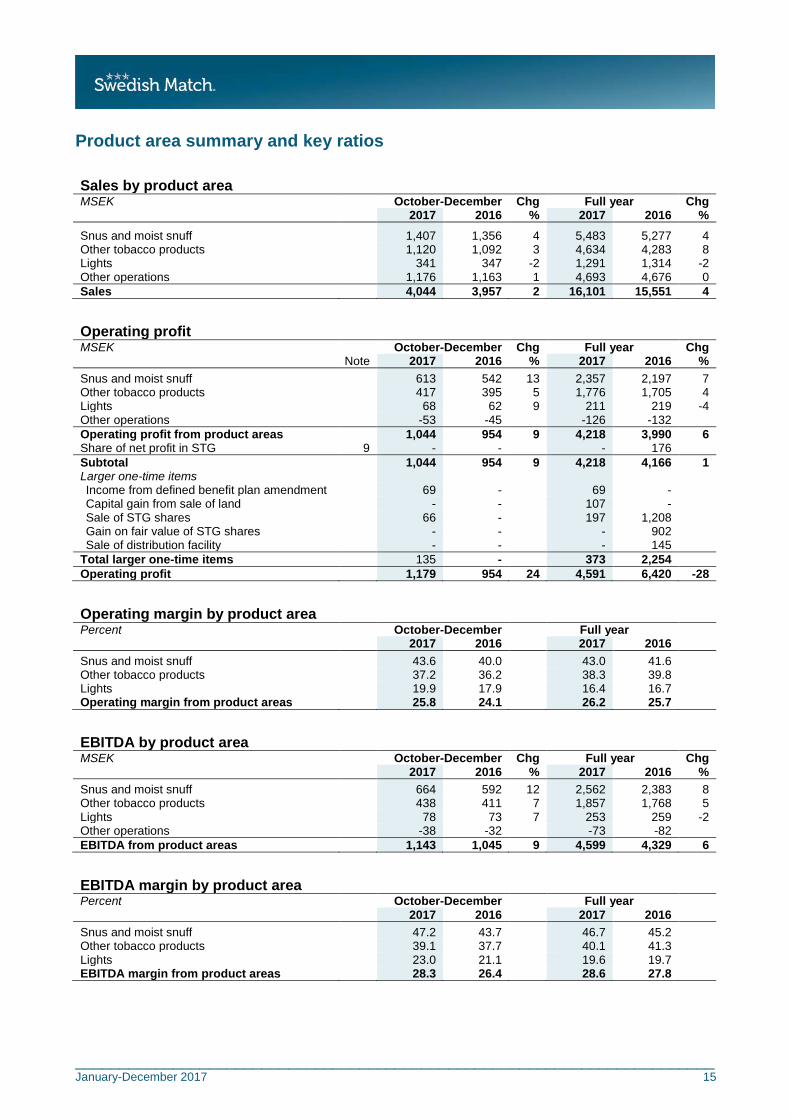
Product area summary and key ratios Sales by product area MSEK October-December Chg Full year Chg 2017 2016 % 2017 2016 %
Snus and moist snuff 1,407 1,356 4 5,483 5,277 4 Other tobacco products 1,120 1,092 3 4,634 4,283 8 Lights 341 347 -2 1,291 1,314 -2 Other operations 1,176 1,163 1 4,693 4,676 0 Sales 4,044 3,957 2 16,101 15,551 4
Operating profit MSEK October-December Chg Full year Chg Note 2017 2016 % 2017 2016 %
Snus and moist snuff 613 542 13 2,357 2,197 7 Other tobacco products 417 395 5 1,776 1,705 4 Lights 68 62 9 211 219 -4 Other operations -53 -45 -126 -132 Operating profit from product areas 1,044 954 9 4,218 3,990 6 Share of net profit in STG 9 - - - 176 Subtotal 1,044 954 9 4,218 4,166 1 Larger one-time items Income from defined benefit plan amendment 69 - 69 - Capital gain from sale of land - - 107 - Sale of STG shares 66 - 197 1,208 Gain on fair value of STG shares - - - 902 Sale of distribution facility - - - 145
Total larger one-time items 135 - 373 2,254 Operating profit 1,179 954 24 4,591 6,420 -28
Operating margin by product area
Percent October-December Full year 2017 2016 2017 2016
Snus and moist snuff 43.6 40.0 43.0 41.6 Other tobacco products 37.2 36.2 38.3 39.8 Lights 19.9 17.9 16.4 16.7 Operating margin from product areas 25.8 24.1 26.2 25.7
EBITDA by product area
MSEK October-December Chg Full year Chg 2017 2016 % 2017 2016 %
Snus and moist snuff 664 592 12 2,562 2,383 8 Other tobacco products 438 411 7 1,857 1,768 5 Lights 78 73 7 253 259 -2 Other operations -38 -32 -73 -82 EBITDA from product areas 1,143 1,045 9 4,599 4,329 6
EBITDA margin by product area
Percent October-December Full year 2017 2016 2017 2016
Snus and moist snuff 47.2 43.7 46.7 45.2 Other tobacco products 39.1 37.7 40.1 41.3 Lights 23.0 21.1 19.6 19.7 EBITDA margin from product areas 28.3 26.4 28.6 27.8

________________________________________________________________________ January-December 2017 16
Key ratios Full year 2017 2016
Operating margin from product areas, % 26.2 25.7
Net debt, MSEK 8,183 7,941 Investments in property, plant and equipment, MSEK 369 537
EBITA from product areas, MSEK 4,277 4,043 EBITA interest cover1) 12.6 9.7 Net debt/EBITA from product areas 1.9 2.0
Share data Number of shares outstanding at end of period 175,910,538 184,672,687 Average number of shares outstanding 180,096,690 187,116,474 1) 2016 restated to exclude STG.

________________________________________________________________________ January-December 2017 17
Financial statements Condensed consolidated income statement MSEK October-December Chg Full year Chg Note 2017 2016 % 2017 2016 %
Sales, including tobacco tax 7,169 7,177 28,824 28,482 Less tobacco tax -3,125 -3,220 -12,722 -12,932 Sales 4,044 3,957 2 16,101 15,551 4 Cost of goods sold -2,222 -2,116 -8,707 -8,325 Gross profit 1,822 1,841 -1 7,395 7,226 2 Selling and admin. expenses -780 -889 -3,187 -3,240 Share of profit/loss in associated companies 9 2 2 10 180 Income from defined benefit plan amendment 69 - 69 - Capital gain from sale of land - - 107 - Sale of STG shares 66 - 197 1,208 Gain on fair value of STG shares - - - 902 Sale of distribution facility - - - 145 Operating profit 1,179 954 24 4,591 6,420 -28
Dividend from STG 42 - 107 - Finance income 10 23 49 53 Finance costs -96 -109 -396 -484 Net finance cost -44 -85 -240 -431 Profit before income tax 1,135 868 31 4,352 5,988 -27 Income tax expense -231 -206 -952 -865 Profit for the period 904 662 37 3,400 5,123 -34 Attributable to: Equity holders of the Parent 904 662 3,400 5,123 Non-controlling interests 0 0 0 0 Profit for the period 904 662 37 3,400 5,123 -34
Earnings per share, SEK 8 5.10 3.61 18.88 27.38

________________________________________________________________________ January-December 2017 18
Condensed consolidated statement of comprehensive income MSEK October-December Full year Note 2017 2016 2017 2016
Profit for the period 904 662 3,400 5,123
Other comprehensive income that may be reclassified to the income statement Translation differences related to foreign operations 18 231 -301 558 Translation differences included in profit and loss -6 - -6 -143 Effective portion of changes in fair value of cash flow hedges -83 -5 -126 -81 Reclassification of gains/losses on cash flow hedges included in profit and loss 22 - 22 16 Share of other comprehensive income in associated companies 9 - - - -20 Share of other comprehensive income in associated companies included in profit and loss - - - -509 Change in fair value of STG shares 14 124 -80 310 Change in fair value of STG shares included in profit and loss -93 - -230 - Income tax relating to reclassifiable components of other comprehensive income 4 1 23 14 Subtotal, net of tax for the period -124 351 -697 144 Other comprehensive income that will not be reclassified to the income statement Actuarial gains/losses attributable to pensions, incl. payroll tax 82 322 116 -150 Share of other comprehensive income in associated companies 9 - - - -2 Income tax relating to non-reclassifiable components of other comprehensive income1) -125 -117 -133 39 Subtotal, net of tax for the period -43 205 -17 -113 Total comprehensive income for the period 737 1,218 2,685 5,155 Attributable to: Equity holders of the Parent 737 1,218 2,685 5,155 Non-controlling interests 0 0 0 0 Total comprehensive income for the period 737 1,218 2,685 5,155 1) As a consequence of the US tax reform, effective as of 2018, the income tax relating to non-reclassifiable components of other
comprehensive income for 2017 have been impacted by a reassessment of deferred tax on cumulative actuarial net losses on defined benefit plans in US.

________________________________________________________________________ January-December 2017 19
Condensed consolidated balance sheet MSEK Note December 31, 2017 December 31, 2016
Intangible assets 2,088 1,250 Property, plant and equipment 2,558 2,543 Investments in associated companies 22 122 Other non-current assets and operating receivables 22 23 Other non-current financial assets and receivables1)2) 7 1,254 4,450 Total non-current assets 5,944 8,387 Other current financial receivables2) 7 263 251 Current operating assets and receivables 3,438 3,333 Cash and cash equivalents 3,998 3,364 Total current assets 7,699 6,948 Total assets 13,643 15,335
Equity attributable to equity holders of the Parent -4,179 -1,366 Non-controlling interests 1 1 Total equity -4,178 -1,365 -
Non-current financial provisions 1,200 1,168 Non-current loans 10,277 8,169 Other non-current financial liabilities2) 7 1,218 1,613 Other non-current operating liabilities 368 369 Total non-current liabilities 13,063 11,318 Current loans 1,253 2,047 Other current financial liabilities2) 7 541 321 Other current operating liabilities 2,965 3,013 Total current liabilities 4,758 5,382 Total liabilities 17,821 16,700 Total equity and liabilities 13,643 15,335 1) 2016 included investment in STG of 2,761 MSEK. 2) Certain components of derivatives are reclassified between assets and liabilities as compared to the full year 2016 report.

________________________________________________________________________ January-December 2017 20
Condensed consolidated cash flow statement MSEK January-December 2017 2016 Operating activities Profit before income taxes 4,352 5,988 Share of profit/loss in associated companies -10 -180 Dividend received from associated companies 0 192 Other non-cash items and other -175 -2,338 Income tax paid -611 -693 Cash flow from operating activities before changes in working capital 3,556 2,969 Changes in working capital -154 -40 Net cash generated from operating activities 3,402 2,929
Investing activities Purchase of property, plant and equipment -369 -537 Proceeds from sale of property, plant and equipment 7 190 Purchase of intangible assets -8 -129 Acquisition of subsidiaries -929 - Proceeds from sale of land 107 - Divestments of associated companies 2,660 3,908 Investments in associated companies - -5 Dividend from STG 107 - Changes in financial receivables etc. 20 -20 Net cash from investing activities 1,594 3,408
Financing activities Proceeds from borrowings 3,293 3,364 Repayment of borrowings -1,988 -1,618 Dividend paid to equity holders of the Parent -2,908 -5,522 Repurchase of own shares -2,590 -1,249 Realized exchange gain/losses on financial instruments -90 259 Other 0 2 Net cash used in financing activities -4,283 -4,764 Net increase in cash and cash equivalents 713 1,573 Cash and cash equivalents at the beginning of the period 3,364 1,732 Effect of exchange rate fluctuations on cash and cash equivalents -79 59 Cash and cash equivalents at the end of the period 3,998 3,364
Condensed consolidated statement of changes in equity MSEK
Equity attributable to
holders of the Parent
Non-controlling interests Total equity
Equity at January 1, 2016 251 1 252
Profit for the period 5,123 0 5,123 Other comprehensive income, net of tax for the period 31 0 32 Total comprehensive income for the period 5,155 0 5,155 Dividend -5,522 0 -5,523 Repurchase of own shares -1,249 - -1,249 Cancellation of shares -15 - -15 Bonus issue 15 - 15 Equity at December 31, 2016 -1,366 1 -1,365
Equity at January 1, 2017 -1,366 1 -1,365
Profit for the period 3,400 0 3,400 Other comprehensive income, net of tax for the period -715 0 -715 Total comprehensive income for the period 2,685 0 2,685 Dividend -2,908 0 -2,908 Repurchase of own shares -2,590 - -2,590 Cancellation of shares -14 - -14 Bonus issue 14 - 14 Equity at December 31, 2017 -4,179 1 -4,178

________________________________________________________________________ January-December 2017 21
Condensed Parent Company income statement MSEK January-December 2017 2016
Sales 47 52 Administrative expenses -166 -261 Operating loss -118 -208 Result from participation in Group companies 5,310 3,319 Net finance cost -608 -710 Profit after financial items 4,584 2,401 Appropriations 2,080 1,859 Profit before income tax 6,664 4,260 Income tax -298 -218 Profit for the period 6,367 4,041
Condensed Parent Company statement of comprehensive income MSEK January-December 2017 2016
Profit for the period 6,367 4,041
Other comprehensive income that may be reclassified to the income statement
Effective portion of changes in fair value of cash flow hedges -104 -81 Reclassification for gains/losses on cash flow hedges included in profit and loss - 16 Income tax relating to components of other comprehensive income 23 14 Other comprehensive income, net of tax for the period -81 -51 Total comprehensive income for the period 6,286 3,990
Condensed Parent Company balance sheet
MSEK December 31, 2017 December 31, 2016
Intangible and tangible assets 1 2 Non-current financial assets1) 32,002 49,719 Current assets1) 4,394 3,311 Total assets 36,397 53,032
Equity 19,221 18,434 Untaxed reserves 1,330 995 Provisions 86 100 Non-current liabilities1) 10,349 26,338 Current liabilities1) 5,409 7,165 Total liabilities 15,845 33,603 Total equity and liabilities 36,397 53,032 1) Certain components of derivatives are reclassified between assets and liabilities as compared to the full year 2016 report.
Note 1 – Accounting principles This report for the Group is prepared in accordance with the Accounting Standard IAS 34 Interim Financial Reporting and applicable rules in the Annual Accounts Act. The report for the Parent Company for the same period is prepared in accordance with the Annual Accounts Act, Chapter 9 and RFR 2. Additional disclosures as required under IAS 34.16A may be found within the financial statements and related notes and in the narrative text of the interim financial report. The accounting principles and basis of calculation in this report are the same as in the annual report for 2016.
New standards, amendments and interpretations applied in 2017 The new amendments and interpretations to existing standards applicable as of January 1, 2017 have not had a material effect on the Group’s financial result or position.
New IFRSs and interpretations which have not yet been applied A number of new standards, changes in standards and interpretations of standards apply from 2018 or later and have not been applied in these financial reports. Only IFRS 15 Revenue from Contracts with Customers is expected to have material impact on the financial statements of Swedish Match. IFRS 15 supersedes IAS 18 Revenue and IAS 11 Construction Contracts and the related Interpretations. This new standard will

________________________________________________________________________ January-December 2017 22
materially affect the revenue recognition of the Swedish distribution function but with no effect on profit. Because of the new standard, the segment reporting will change in 2018.
The main principle of IFRS 15 is that revenue shall be recognized when the control of the promised good or service is transferred to the customer at the expected consideration for such delivery. To apply the standard, an entity needs to understand what has been promised and when the promise is satisfied. In determining the expected consideration, the expected outcome of variable considerations as well as expected reimbursements of goods returned need to be considered.
In determining the nature of the promise IAS 18 applies a “risks and rewards” approach whereas IFRS 15 instead emphasizes the transfer of control. When analyzing the contracts and all facts and circumstances of the Swedish distribution function, Swedish Match concludes that for most of the transactions, the Swedish distribution function is acting as an agent. Under IAS 18 the conclusion has been that the Swedish distribution function is acting as a principal for all its transactions.
The new standard will also have an effect on the timing of revenue recognition from goods returned within the reportable segment Snus and moist snuff. However, this effect is not material. The estimated IFRS 15 transition effect on the Group’s retained earnings from the timing of returns amounts to negative 23 MSEK.
Reclassification from principal to agent as a consequence of IFRS 15 The Swedish distribution function provides logistics services to third party suppliers of tobacco products on the Swedish market. In summary, the services provided include transportation to retail, order taking and invoicing. According to IAS 18, the Swedish distribution function is considered a principal in this set-up based on the fact that the Swedish distribution function takes legal title to the products while arranging for the delivery of the tobacco products to retail and is subject to the credit risk of the gross amount of consideration payable by the retail. IAS 18 specifically points out credit risk as an indicator of an entity being a principal under the “risks and rewards” approach. Under IFRS 15 credit risk is not deemed an indicator of control of the specified products or services. In applying IFRS 15 under a transfer of control perspective, Swedish Match concluded that based on the nature of the services provided and the lack of control of the products delivered to retail, the Swedish distribution function should be considered an agent in its arrangement of these services. The contractual terms with the third party suppliers clearly conveys very limited control of the products to the Swedish distribution function.
The consequences of adopting IFRS 15 will result in a reduction in sales and cost of goods sold attributed to distributed third party tobacco products compared to how Swedish Match reported such sales under IAS 18. Under IFRS 15, for the transactions where the Swedish distribution function is acting as an agent, the revenue recognized will be the amount of the fee received from the principals (the manufacturers of the goods) for arranging for the goods to be delivered to retail. This fee equals the gross profit previously recognized for these transactions under IAS 18, i.e. the net amount retained from the consideration received from the retail after paying the principals. Recognizing the fee instead of the gross invoiced amount will materially reduce the net sales of Swedish Match but not alter the profit.
The balance sheet presentation will follow the agent/principal presentation of the income statement. Under IFRS 15, no inventory relating to the third party tobacco products for which the Swedish distribution function is acting as an agent when arranging for the delivery to retail will be recognized in Swedish Match’s balance sheet. The Swedish distribution function has limited control over such inventory and will not recognize it as an asset.
Swedish Match will apply IFRS 15 on its financial statements as of the standard’s effective date January 1, 2018. For illustrative purposes, the 2017 financial statements and segment reporting have been restated in tables below reflecting the accounting according to the new standard.

________________________________________________________________________ January-December 2017 23
Condensed consolidated income statement MSEK
Full year 2017
IFRS 15 transition effects
estimated adjustments Restated 2017
IFRS 15 Reclassification from
principal to agent
Sales, including tobacco tax 28,824 -13,800 15,024 Less tobacco tax -12,722 9,449 -3,273 Sales 16,101 -4,351 11,750 Cost of goods sold -8,707 4,351 -4,356 Gross profit 7,395 - 7,395 Selling and admin. expenses -3,187 - -3,187 Share of profit/loss in associated companies 10 - 10 Larger one-time items 373 - 373 Operating profit 4,591 - 4,591
Dividend from STG 107 - 107 Finance income 49 - 49 Finance costs -396 - -396 Net finance cost -240 - -240 Profit before income tax 4,352 - 4,352 Income tax expense -952 - -952 Profit for the period 3,400 - 3,400 Attributable to: Equity holders of the Parent 3,400 - 3,400 Non-controlling interests 0 - 0 Profit for the period 3,400 - 3,400
Earnings per share, SEK 18.88 - 18.88 Condensed consolidated balance sheet MSEK
Dec 31, 2017
IFRS 15 transition effects
estimated adjustments Restated Dec 31, 2017
IFRS 15 Reclassification from
principal to agent
Intangible assets 2,088 - 2,088 Property, plant and equipment 2,558 - 2,558 Investments in associated companies 22 - 22 Other non-current assets and operating receivables 22 - 22 Other non-current financial assets and receivables 1,254 - 1,254 Total non-current assets 5,944 - 5,944 Other current financial receivables 263 - 263 Current operating assets and receivables 3,438 -267 3,171 Cash and cash equivalents 3,998 - 3,998 Total current assets 7,699 -267 7,432 Total assets 13,643 -267 13,376
Equity attributable to equity holders of the Parent -4,179 - -4,179 Non-controlling interests 1 - 1 Total equity -4,178 - -4,178
Non-current financial provisions 1,200 - 1,200 Non-current loans 10,277 - 10,277 Other non-current financial liabilities 1,218 - 1,218 Other non-current operating liabilities 368 - 368 Total non-current liabilities 13,063 - 13,063 Current loans 1,253 - 1,253 Other current financial liabilities 541 - 541 Other current operating liabilities 2,965 -267 2,698 Total current liabilities 4,758 -267 4,491 Total liabilities 17,821 -267 17,554 Total equity and liabilities 13,643 -267 13,376
________________________________________________________________________ January-December 2017 24
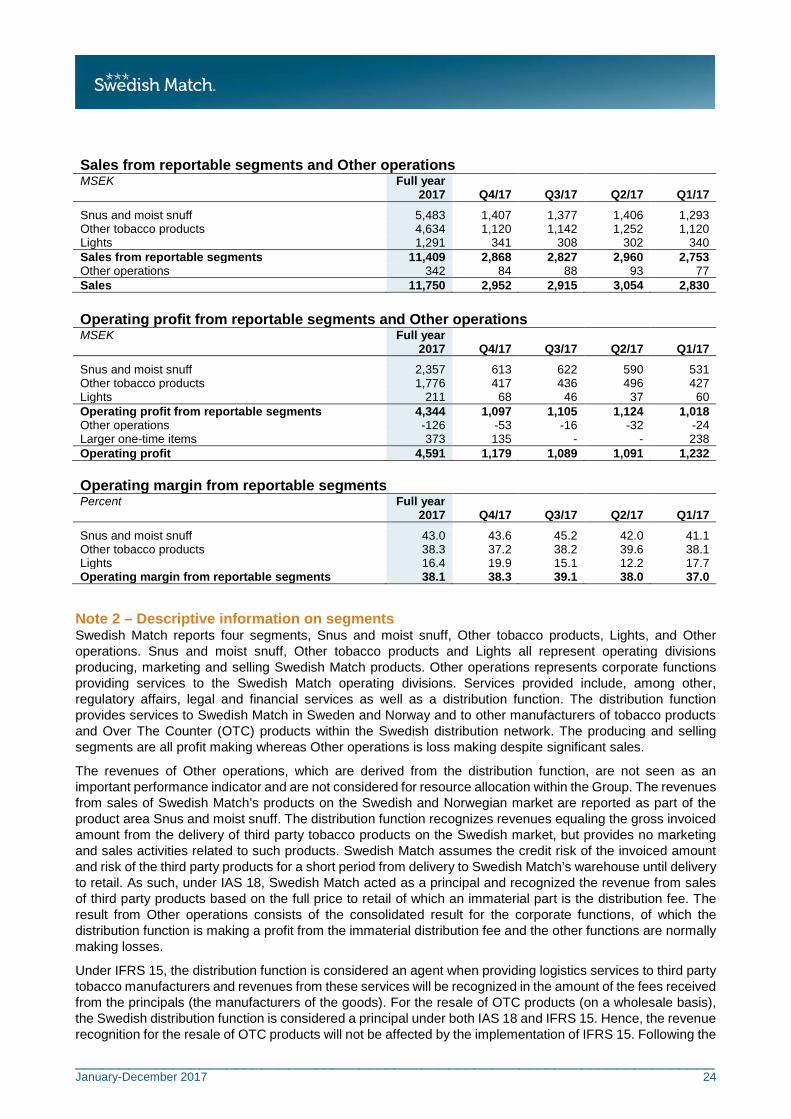
Sales from reportable segments and Other operations MSEK Full year
2017 Q4/17 Q3/17 Q2/17 Q1/17
Snus and moist snuff 5,483 1,407 1,377 1,406 1,293 Other tobacco products 4,634 1,120 1,142 1,252 1,120 Lights 1,291 341 308 302 340 Sales from reportable segments 11,409 2,868 2,827 2,960 2,753 Other operations 342 84 88 93 77 Sales 11,750 2,952 2,915 3,054 2,830
Operating profit from reportable segments and Other operations MSEK Full year
2017 Q4/17 Q3/17 Q2/17 Q1/17
Snus and moist snuff 2,357 613 622 590 531 Other tobacco products 1,776 417 436 496 427 Lights 211 68 46 37 60 Operating profit from reportable segments 4,344 1,097 1,105 1,124 1,018 Other operations -126 -53 -16 -32 -24 Larger one-time items 373 135 - - 238 Operating profit 4,591 1,179 1,089 1,091 1,232
Operating margin from reportable segments Percent Full year
2017 Q4/17 Q3/17 Q2/17 Q1/17
Snus and moist snuff 43.0 43.6 45.2 42.0 41.1 Other tobacco products 38.3 37.2 38.2 39.6 38.1 Lights 16.4 19.9 15.1 12.2 17.7 Operating margin from reportable segments 38.1 38.3 39.1 38.0 37.0
Note 2 – Descriptive information on segments Swedish Match reports four segments, Snus and moist snuff, Other tobacco products, Lights, and Other operations. Snus and moist snuff, Other tobacco products and Lights all represent operating divisions producing, marketing and selling Swedish Match products. Other operations represents corporate functions providing services to the Swedish Match operating divisions. Services provided include, among other, regulatory affairs, legal and financial services as well as a distribution function. The distribution function provides services to Swedish Match in Sweden and Norway and to other manufacturers of tobacco products and Over The Counter (OTC) products within the Swedish distribution network. The producing and selling segments are all profit making whereas Other operations is loss making despite significant sales.
The revenues of Other operations, which are derived from the distribution function, are not seen as an important performance indicator and are not considered for resource allocation within the Group. The revenues from sales of Swedish Match’s products on the Swedish and Norwegian market are reported as part of the product area Snus and moist snuff. The distribution function recognizes revenues equaling the gross invoiced amount from the delivery of third party tobacco products on the Swedish market, but provides no marketing and sales activities related to such products. Swedish Match assumes the credit risk of the invoiced amount and risk of the third party products for a short period from delivery to Swedish Match’s warehouse until delivery to retail. As such, under IAS 18, Swedish Match acted as a principal and recognized the revenue from sales of third party products based on the full price to retail of which an immaterial part is the distribution fee. The result from Other operations consists of the consolidated result for the corporate functions, of which the distribution function is making a profit from the immaterial distribution fee and the other functions are normally making losses.
Under IFRS 15, the distribution function is considered an agent when providing logistics services to third party tobacco manufacturers and revenues from these services will be recognized in the amount of the fees received from the principals (the manufacturers of the goods). For the resale of OTC products (on a wholesale basis), the Swedish distribution function is considered a principal under both IAS 18 and IFRS 15. Hence, the revenue recognition for the resale of OTC products will not be affected by the implementation of IFRS 15. Following the
________________________________________________________________________ January-December 2017 25
implementation of IFRS 15 on January 1, 2018, and the changed method for recognizing sales, the sales and operating profit for Other operations will fall below the thresholds requiring it to be a reportable segment. Hence the reportable segments in 2018 will consist of Snus and moist snuff, Other tobacco products and Lights.
Note 3 – Business combinations On August 31, 2017, Swedish Match acquired 100 percent of the shares in V2 Holding ApS ("V2 Tobacco"), including its subsidiaries. The consideration amounted to 732 MDKK and was paid in cash. At the date of the acquisition the DKK/SEK currency rate was 1.28.
Effects of acquisition The total consideration paid, less acquired liquid funds, amounted to 929 MSEK. The acquired assets and liabilities were recognized in the Group’s balance sheet at fair value at the acquisition date. The acquired net assets amounted to 372 MSEK, whereof total assets amounted to 515 MSEK and total liabilities amounted to 143 MSEK. During the fourth quarter a final assessment of fair value of acquired trademarks was completed which resulted in an increase to the acquired trademark balance and a decrease to goodwill. Acquired goodwill recognized in the Group’s balance sheet amounted to 565 MSEK and acquired trademark amounted to 343 MSEK.
The goodwill associated with the acquisition mainly pertains to the company’s well established positions in a number of fast growing niche tobacco markets, its modern and flexible production, skilled sales-force and business processes. Immediate synergy savings are expected to be limited as the company will mostly operate independently from other Swedish Match businesses. No part of the goodwill value is expected to be deductible for tax purposes.
Acquisition costs amounted to 4 MSEK and mainly pertain to consultancy fees relating to the due diligence process. Acquisition costs are recognized in profit and loss as administration costs.
No contingent liabilities arising from the acquisition have been identified.
Sales attributable to V2 Tobacco from the day of acquisition on August 31, 2017 amounted to 76 MSEK and is included in the Group’s net sales. V2 Tobacco also contributed profit after tax of 32 MSEK over the same period. If V2 Tobacco had been consolidated as of January 1, 2017 the Group’s net sales would have included sales from V2 Tobacco of 198 MSEK and profit after tax of 74 MSEK.
Note 4 – Related parties transactions The Group’s related parties include associated companies and key management personnel with significant influence over the Company. Key management personnel with significant influence over the Company are Swedish Match Board of Directors and members of the Group Management Team.
In the normal course of business, Swedish Match conducts various transactions with associated companies. Transactions are conducted on an arms-length basis. At December 31, 2017, receivables from these companies amounted to 13 MSEK (25) and total payables to these companies amounted to 2 MSEK (2). During 2017, total sales to associated companies amounted to 66 MSEK (142) and total purchases from associated companies amounted to 3 MSEK (58).
No transactions with key management personnel besides normal remuneration have been conducted during the period.
Note 5 – Carrying value and fair value Swedish Match uses the following valuation techniques of the fair value hierarchy in determining the fair values of the financial instruments:
Level 1 - Quoted prices (unadjusted) in active markets Level 2 - Inputs other than quoted prices included within level 1 that are observable, either directly or indirectly Level 3 - Inputs that are not based on observable market data

________________________________________________________________________ January-December 2017 26
The following table shows carrying value and fair value for financial instruments per December 31, 2017.
Carrying value and fair value MSEK
Items carried at fair value
via the income
statement
Loans and
receiv-ables
Other financial liabilities
Cash flow hedges
Non-financial instruments
Total carrying
value Estimated fair value
Trade receivables - 1,536 - - - 1,536 1,536 Other non-current financial receivables - - - 273 438 711 711 Other current assets and financial receivables 0 - - - 193 193 193 Prepaid expenses and accrued income1) - - - 1 80 81 81 Cash and cash equivalents - 3,998 - - - 3,998 3,998 Total assets 0 5,534 - 274 711 6,519 6,519
Loans and borrowings - - 11,530 - - 11,530 11,705 Other non-current financial liabilities - - - 72 74 147 147 Other current liabilities 40 - - - 1,431 1,471 1,471 Accrued expenses and deferred income1) - - 100 25 729 854 854 Trade payables - - 698 - - 698 698 Total liabilities 40 - 12,328 97 2,234 14,700 14,875 1) Accrued interest income on cash flow hedges is reported in the balance sheet as Prepaid expenses and accrued income and
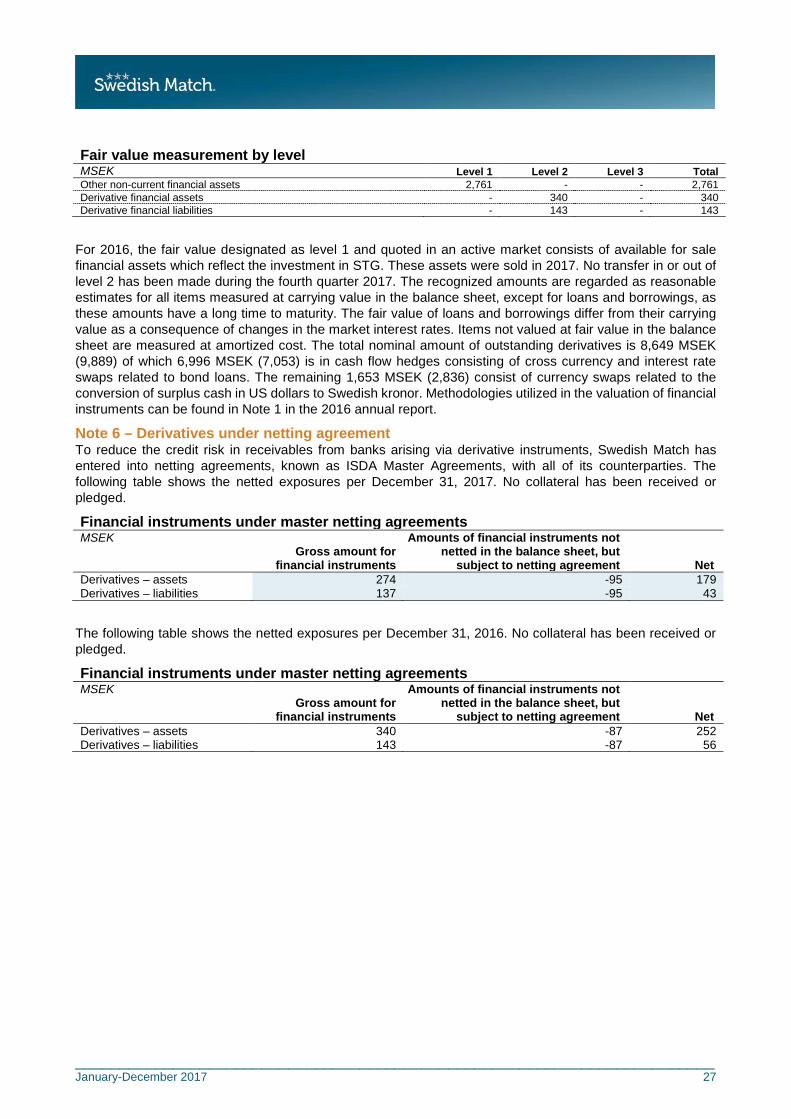
accrued interest expense on cash flow hedges is reported as Accrued expenses and deferred income. Fair value measurement by level MSEK Level 1 Level 2 Level 3 Total Derivative financial assets - 274 - 274 Derivative financial liabilities - 137 - 137
The following table shows carrying value and fair value for financial instruments per December 31, 2016.
Carrying value and fair value MSEK
Items carried at fair value
via the income
statement
Loans and
receiv-ables
Available for sale
financial assets
Other financial liabilities
Cash flow hedges
Non-financial instruments
Total carrying
value Estimated fair value
Trade receivables - 1,539 - - - - 1,539 1,539 Other non-current financial assets - - 2,761 - - - 2,761 2,761 Other non-current financial receivables - - - - 328 447 774 774 Other current assets and financial receivables - - - - 10 206 216 216 Prepaid expenses and accrued income1) - - - - 2 80 82 82 Cash and cash equivalents - 3,364 - - - - 3,364 3,364 Total assets - 4,903 2,761 - 340 733 8,736 8,736
Loans and borrowings - - - 10,216 - - 10,216 10,545 Other non-current financial liabilities - - - - 69 49 118 118 Other current liabilities 65 - - - - 1,462 1,527 1,527 Accrued expenses and deferred income1) - - - 96 9 749 854 854 Trade payables - - - 686 - - 686 686 Total liabilities 65 - - 10,998 78 2,260 13,401 13,730 1) Accrued interest income on cash flow hedges is reported in the balance sheet as Prepaid expenses and accrued income and
accrued interest expense on cash flow hedges is reported as Accrued expenses and deferred income.
________________________________________________________________________ January-December 2017 27
Fair value measurement by level MSEK Level 1 Level 2 Level 3 Total Other non-current financial assets 2,761 - - 2,761 Derivative financial assets - 340 - 340 Derivative financial liabilities - 143 - 143
For 2016, the fair value designated as level 1 and quoted in an active market consists of available for sale financial assets which reflect the investment in STG. These assets were sold in 2017. No transfer in or out of level 2 has been made during the fourth quarter 2017. The recognized amounts are regarded as reasonable estimates for all items measured at carrying value in the balance sheet, except for loans and borrowings, as these amounts have a long time to maturity. The fair value of loans and borrowings differ from their carrying value as a consequence of changes in the market interest rates. Items not valued at fair value in the balance sheet are measured at amortized cost. The total nominal amount of outstanding derivatives is 8,649 MSEK (9,889) of which 6,996 MSEK (7,053) is in cash flow hedges consisting of cross currency and interest rate swaps related to bond loans. The remaining 1,653 MSEK (2,836) consist of currency swaps related to the conversion of surplus cash in US dollars to Swedish kronor. Methodologies utilized in the valuation of financial instruments can be found in Note 1 in the 2016 annual report.
Note 6 – Derivatives under netting agreement To reduce the credit risk in receivables from banks arising via derivative instruments, Swedish Match has entered into netting agreements, known as ISDA Master Agreements, with all of its counterparties. The following table shows the netted exposures per December 31, 2017. No collateral has been received or pledged.
Financial instruments under master netting agreements MSEK Gross amount for
financial instruments
Amounts of financial instruments not netted in the balance sheet, but
subject to netting agreement Net Derivatives – assets 274 -95 179 Derivatives – liabilities 137 -95 43
The following table shows the netted exposures per December 31, 2016. No collateral has been received or pledged.
Financial instruments under master netting agreements MSEK Gross amount for
financial instruments
Amounts of financial instruments not netted in the balance sheet, but
subject to netting agreement Net Derivatives – assets 340 -87 252 Derivatives – liabilities 143 -87 56

________________________________________________________________________ January-December 2017 28
Note 7 – Alternative performance measures Swedish Match presents several financial measures that are outside IFRS definitions (Alternative performance measures, according to ESMA’s guidelines) with the aim of enabling effective evaluation of the company’s financial position and performance for investors and for the company’s management. This means that these measures are not always comparable with measures used by other companies and shall therefore be considered as a complement to measures defined according to IFRS. Swedish Match applies these alternative key ratios consistently over time. The key ratios are alternative performance measures according to ESMA guidelines unless otherwise stated.
KEY RATIO DEFINITION/CALCULATION PURPOSE OPERATING PROFIT (EBIT) Earnings excluding net finance cost and
income taxes
Used as a measure of operating performance, excluding the impact of financing and corporate income tax.
OPERATING PROFIT/LOSS (EBIT) FROM PRODUCT AREAS
Earnings from product areas excluding share of profit in STG, net finance cost, income tax and larger one-time items
Used as a measure of operating performance of the ongoing business, excluding the impact of financing and corporate income tax.
OPERATING MARGIN (%) 100 × Operating profit ÷ Sales Used as a measure of operational profitability. OPERATING MARGIN FROM PRODUCT AREAS (%)
100 × Operating profit from product areas ÷ Sales
Used as a measure of operational profitability of the ongoing business.
LARGER ONE-TIME ITEMS Larger one-time items are separately disclosed non-recurring income and cost
Used to provide information regarding items which impact comparability between periods.
EBITDA Earnings from product areas, excluding net finance cost, income tax, larger one-time items, depreciation, amortization and impairments of tangible and intangible assets
Used as an alternative measure of operating performance that is not impacted by historical investments and the related accounting treatment of such investments.
EBITDA FROM PRODUCT AREAS
Earnings from product areas, excluding share of profit in STG, net finance cost, income tax, larger one-time items, depreciation, amortization and impairments of tangible and intangible assets
Used as an alternative measure of operating performance for the ongoing business, that is not impacted by historical investments and the related accounting treatment of such investments.
EBITDA MARGIN (%) 100 × EBITDA ÷ Sales Used as an alternative measure of operating profitability.
EBITDA MARGIN FROM PRODUCT AREAS (%)
100 × EBITDA from product areas ÷ Sales
Used as an alternative measure of operating profitability for the ongoing business.
PROFIT FOR THE PERIOD, EXCLUDING STG
Profit for the period, excluding the effects of share of profit in STG and dividend from STG
Used as an alternative measure of profit for the period of the ongoing business.
PROFIT FOR THE PERIOD, EXCLUDING STG AND LARGER ONE-TIME ITEMS
Profit for the period, excluding the effects of share of profit in STG, dividend from STG and larger one-time items
Used as an alternative measure of profit for the period of the ongoing business which is not affected by items which impact comparability between periods.
EBITA Earnings excluding net finance cost, tax, larger one-time items, amortization and impairments of intangible assets
Used as a proxy for the free cash flow available for payment of financial obligations.
EBITA FROM PRODUCT AREAS
Earnings excluding share of profit in STG, net finance cost, income tax, larger one-time items, amortization and impairments of intangible assets
Used as a proxy for the free cash flow from the ongoing business, available for payment of financial obligations.
EBITA INTEREST COVERAGE RATIO (EBITA INTEREST COVER)
EBITA from product areas ÷ (Interest expense - interest income)
Used as a measure of the ability to fund interest expenses.
NET DEBT Current and non-current loans, adjusted for hedges relating to these loans + net provisions for pensions and similar obligations – cash and cash equivalents and other investments
Used as a measure of net financial obligations.
NET DEBT/EBITA FROM PRODUCT AREAS
NET DEBT ÷ EBITA from product areas Used as an indication of the duration (in years) required to fund existing net financial obligations with free cash flows from the ongoing business.
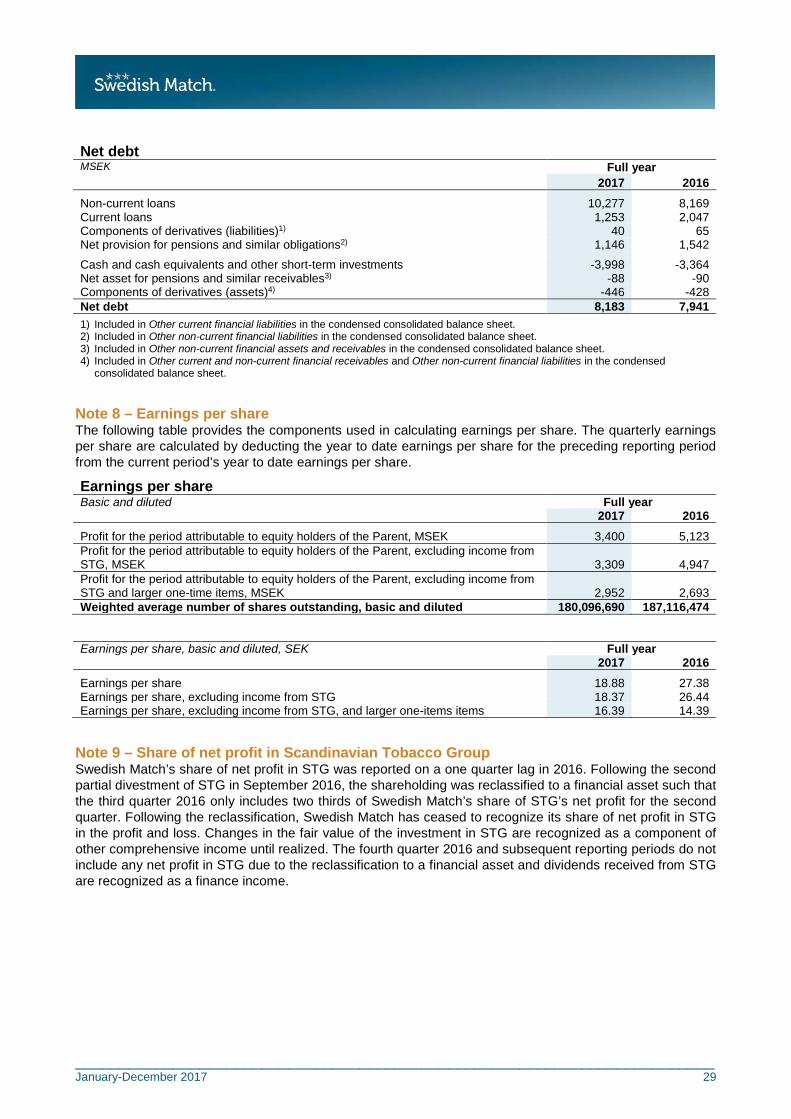
________________________________________________________________________ January-December 2017 29
Net debt MSEK Full year 2017 2016
Non-current loans 10,277 8,169 Current loans 1,253 2,047 Components of derivatives (liabilities)1) 40 65 Net provision for pensions and similar obligations2) 1,146 1,542
Cash and cash equivalents and other short-term investments -3,998 -3,364 Net asset for pensions and similar receivables3) -88 -90 Components of derivatives (assets)4) -446 -428 Net debt 8,183 7,941 1) Included in Other current financial liabilities in the condensed consolidated balance sheet. 2) Included in Other non-current financial liabilities in the condensed consolidated balance sheet. 3) Included in Other non-current financial assets and receivables in the condensed consolidated balance sheet. 4) Included in Other current and non-current financial receivables and Other non-current financial liabilities in the condensed
consolidated balance sheet.
Note 8 – Earnings per share The following table provides the components used in calculating earnings per share. The quarterly earnings per share are calculated by deducting the year to date earnings per share for the preceding reporting period from the current period’s year to date earnings per share.
Earnings per share
Basic and diluted Full year 2017 2016
Profit for the period attributable to equity holders of the Parent, MSEK 3,400 5,123 Profit for the period attributable to equity holders of the Parent, excluding income from STG, MSEK 3,309 4,947 Profit for the period attributable to equity holders of the Parent, excluding income from STG and larger one-time items, MSEK 2,952 2,693 Weighted average number of shares outstanding, basic and diluted 180,096,690 187,116,474
Earnings per share, basic and diluted, SEK Full year 2017 2016
Earnings per share 18.88 27.38 Earnings per share, excluding income from STG 18.37 26.44 Earnings per share, excluding income from STG, and larger one-items items 16.39 14.39
Note 9 – Share of net profit in Scandinavian Tobacco Group Swedish Match’s share of net profit in STG was reported on a one quarter lag in 2016. Following the second partial divestment of STG in September 2016, the shareholding was reclassified to a financial asset such that the third quarter 2016 only includes two thirds of Swedish Match’s share of STG’s net profit for the second quarter. Following the reclassification, Swedish Match has ceased to recognize its share of net profit in STG in the profit and loss. Changes in the fair value of the investment in STG are recognized as a component of other comprehensive income until realized. The fourth quarter 2016 and subsequent reporting periods do not include any net profit in STG due to the reclassification to a financial asset and dividends received from STG are recognized as a finance income.
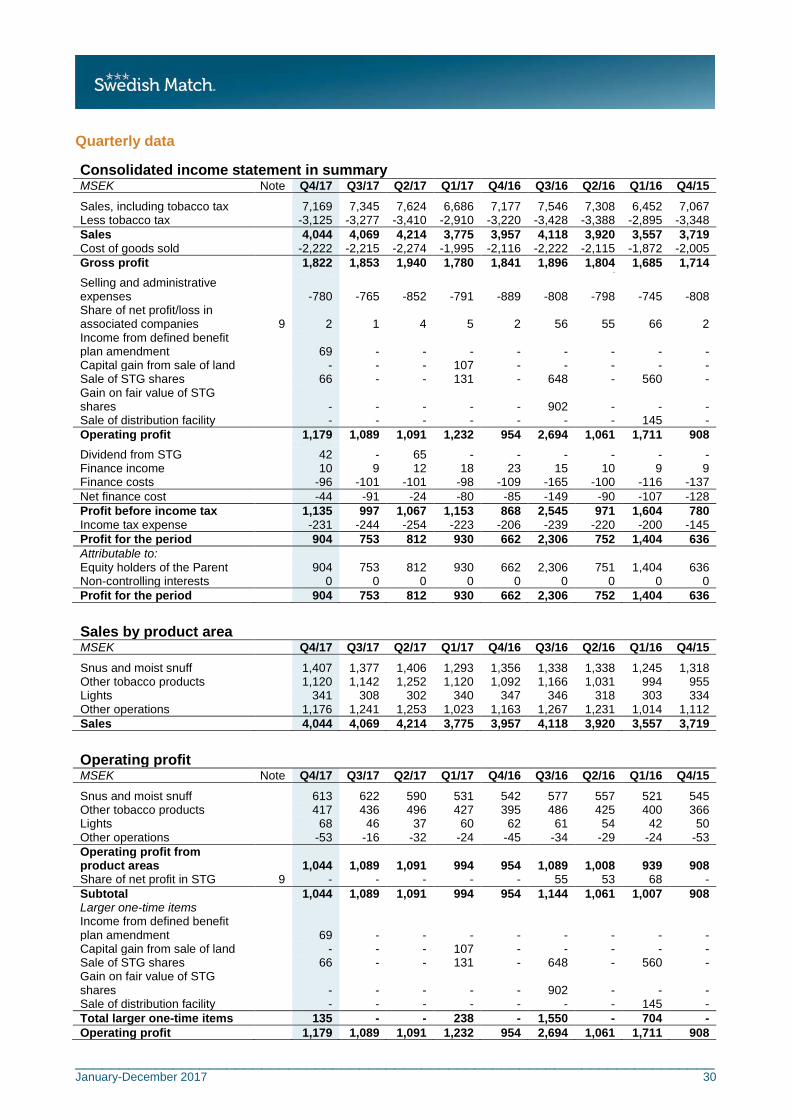
________________________________________________________________________ January-December 2017 30
Quarterly data Consolidated income statement in summary MSEK Note Q4/17 Q3/17 Q2/17 Q1/17 Q4/16 Q3/16 Q2/16 Q1/16 Q4/15
Sales, including tobacco tax 7,169 7,345 7,624 6,686 7,177 7,546 7,308 6,452 7,067 Less tobacco tax -3,125 -3,277 -3,410 -2,910 -3,220 -3,428 -3,388 -2,895 -3,348 Sales 4,044 4,069 4,214 3,775 3,957 4,118 3,920 3,557 3,719 Cost of goods sold -2,222 -2,215 -2,274 -1,995 -2,116 -2,222 -2,115 -1,872 -2,005 Gross profit 1,822 1,853 1,940 1,780 1,841 1,896 1,804 1,685 1,714 -
Selling and administrative expenses -780 -765 -852 -791 -889 -808 -798 -745 -808 Share of net profit/loss in associated companies 9 2 1 4 5 2 56 55 66 2 Income from defined benefit plan amendment 69 - - - - - - - - Capital gain from sale of land - - - 107 - - - - - Sale of STG shares 66 - - 131 - 648 - 560 - Gain on fair value of STG shares - - - - - 902 - - - Sale of distribution facility - - - - - - - 145 - Operating profit 1,179 1,089 1,091 1,232 954 2,694 1,061 1,711 908
Dividend from STG 42 - 65 - - - - - - Finance income 10 9 12 18 23 15 10 9 9 Finance costs -96 -101 -101 -98 -109 -165 -100 -116 -137 Net finance cost -44 -91 -24 -80 -85 -149 -90 -107 -128 Profit before income tax 1,135 997 1,067 1,153 868 2,545 971 1,604 780 Income tax expense -231 -244 -254 -223 -206 -239 -220 -200 -145 Profit for the period 904 753 812 930 662 2,306 752 1,404 636 Attributable to: Equity holders of the Parent 904 753 812 930 662 2,306 751 1,404 636 Non-controlling interests 0 0 0 0 0 0 0 0 0 Profit for the period 904 753 812 930 662 2,306 752 1,404 636
Sales by product area MSEK Q4/17 Q3/17 Q2/17 Q1/17 Q4/16 Q3/16 Q2/16 Q1/16 Q4/15
Snus and moist snuff 1,407 1,377 1,406 1,293 1,356 1,338 1,338 1,245 1,318 Other tobacco products 1,120 1,142 1,252 1,120 1,092 1,166 1,031 994 955 Lights 341 308 302 340 347 346 318 303 334 Other operations 1,176 1,241 1,253 1,023 1,163 1,267 1,231 1,014 1,112 Sales 4,044 4,069 4,214 3,775 3,957 4,118 3,920 3,557 3,719
Operating profit MSEK Note Q4/17 Q3/17 Q2/17 Q1/17 Q4/16 Q3/16 Q2/16 Q1/16 Q4/15
Snus and moist snuff 613 622 590 531 542 577 557 521 545 Other tobacco products 417 436 496 427 395 486 425 400 366 Lights 68 46 37 60 62 61 54 42 50 Other operations -53 -16 -32 -24 -45 -34 -29 -24 -53 Operating profit from product areas 1,044 1,089 1,091 994 954 1,089 1,008 939 908 Share of net profit in STG 9 - - - - - 55 53 68 - Subtotal 1,044 1,089 1,091 994 954 1,144 1,061 1,007 908 Larger one-time items Income from defined benefit plan amendment 69 - - - - - - - - Capital gain from sale of land - - - 107 - - - - - Sale of STG shares 66 - - 131 - 648 - 560 - Gain on fair value of STG shares - - - - - 902 - - - Sale of distribution facility - - - - - - - 145 - Total larger one-time items 135 - - 238 - 1,550 - 704 - Operating profit 1,179 1,089 1,091 1,232 954 2,694 1,061 1,711 908

________________________________________________________________________ January-December 2017 31
Operating margin by product area Percent Q4/17 Q3/17 Q2/17 Q1/17 Q4/16 Q3/16 Q2/16 Q1/16 Q4/15
Snus and moist snuff 43.6 45.2 42.0 41.1 40.0 43.1 41.7 41.8 41.4 Other tobacco products 37.2 38.2 39.6 38.1 36.2 41.6 41.2 40.2 38.3 Lights 19.9 15.1 12.2 17.7 17.9 17.6 17.0 13.8 14.9 Operating margin from product areas 25.8 26.8 25.9 26.3 24.1 26.5 25.7 26.4 24.4
EBITDA by product area
MSEK Q4/17 Q3/17 Q2/17 Q1/17 Q4/16 Q3/16 Q2/16 Q1/16 Q4/15
Snus and moist snuff 664 675 642 581 592 625 603 563 588 Other tobacco products 438 457 516 446 411 501 440 415 382 Lights 78 57 47 71 73 71 64 51 59 Other operations -38 -3 -20 -12 -32 -22 -16 -12 -42 EBITDA from product areas 1,143 1,185 1,186 1,085 1,045 1,175 1,091 1,018 987
EBITDA margin by product area Percent Q4/17 Q3/17 Q2/17 Q1/17 Q4/16 Q3/16 Q2/16 Q1/16 Q4/15
Snus and moist snuff 47.2 49.0 45.7 44.9 43.7 46.7 45.1 45.2 44.6 Other tobacco products 39.1 40.0 41.2 39.8 37.7 43.0 42.6 41.8 39.9 Lights 23.0 18.4 15.6 20.9 21.1 20.6 20.1 16.9 17.8 EBITDA margin from product areas 28.3 29.1 28.1 28.7 26.4 28.5 27.8 28.6 26.5
Depreciation, amortization and impairments MSEK Q4/17 Q3/17 Q2/17 Q1/17 Q4/16 Q3/16 Q2/16 Q1/16 Q4/15
Property, plant and equipment 85 80 80 77 77 73 69 68 68 Intangible assets 13 16 15 15 14 14 14 11 11 Total 98 96 95 91 91 86 83 79 79
Net finance cost MSEK Q4/17 Q3/17 Q2/17 Q1/17 Q4/16 Q3/16 Q2/16 Q1/16 Q4/15
Interest income 10 9 12 18 23 12 8 9 6 Interest expense -97 -99 -97 -96 -103 -161 -98 -109 -135 Net interest expense -87 -90 -85 -78 -79 -149 -90 -100 -129 Dividend from STG 42 - 65 - - - - - - Other finance costs, net 1 -1 -4 -2 -6 0 0 -7 1 Total net finance cost -44 -91 -24 -80 -85 -149 -90 -107 -128
__________
Contacts:
Lars Dahlgren, President and Chief Executive Officer Office +46 8 658 0441
Marlene Forsell, Senior Vice President and Chief Financial Officer Office +46 70 864 9244
Emmett Harrison, Senior Vice President Investor Relations and Corporate Sustainability Office +46 8 658 0173
Richard Flaherty, President US Division, US Investor Relations contact Office +1 804 787 5130 ___________

________________________________________________________________________ January-December 2017 32
This information is information that Swedish Match AB (publ) is obliged to make public pursuant to the EU Market Abuse Regulation and the Securities Markets Act. The information was submitted for publication, through the agency of the contact persons set out above, at 08.15 a.m. CET on February 14, 2018.
___________
Swedish Match develops, manufactures, and sells quality products with market-leading brands. Swedish Match’s product areas are Snus and moist snuff, Other tobacco products (cigars and chewing tobacco), Lights (matches, lighters, and complementary products), and Other operations. Production is located in six countries, with sales concentrated in Scandinavia and the US. The Swedish Match share is listed on Nasdaq Stockholm (SWMA).
Swedish Match’s vision is a world without cigarettes. Some of its well-known brands include: General, Longhorn, White Owl, Red Man, Fiat Lux, and Cricket. ___________
Swedish Match AB (publ), SE-118 85 Stockholm, Sweden Visiting address: Sveavägen 44, 8th Floor. Telephone: +46 8 658 0200 Corporate Identity Number: 556015-0756 swedishmatch.com