full year results, 2014 - gsk...jul 2014 aug 2014 sep 2014 oct 2014 nov 2014 dec 2014 jan 2015 anoro...
TRANSCRIPT
Full Year Results, 2014
4 February 2015
Cautionary statement regarding forward-looking
statements
Under the safe harbor provisions of the US Private Securities Litigation Reform Act of 1995,
the company cautions investors that any forward-looking statements or projections made by
the company, including those made in this document are subject to risks and uncertainties
that may cause actual results to differ materially from those projected.
Nothing in this document should be construed as a profit forecast.
2

Andrew Witty
Chief Executive Officer

Sharp focus on key strategic priorities
Rebuild sales growth momentum
• Product launch uptake
• Supply bounce back opportunity
R&D pipeline next waves
• Advanced pipeline
• Up to 10 Phase III Rx starts
• 15 Phase II Rx NME starts
Restructuring and cost reduction
• ~ £5bn benefits
Novartis transaction
• Financial benefits
• Cost synergies
• Revenue synergies
Innovation and access
Changing environment
• Global economic dynamics
• US market dynamics
• Emerging Markets volume potential
3
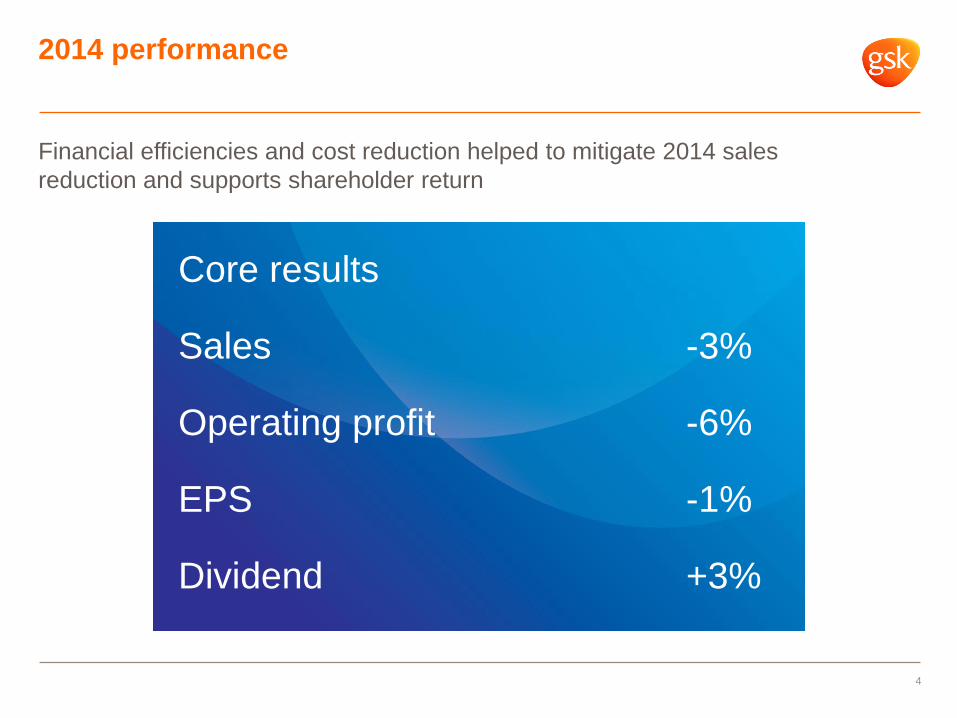
2014 performance
4
Financial efficiencies and cost reduction helped to mitigate 2014 sales
reduction and supports shareholder return
Core results
Sales -3%
Operating profit -6%
EPS -1%
Dividend +3%

30%
35%
40%
45%
50%
55%
Dec 2013
Jan 2014
Feb 2014
Mar 2014
Apr 2014
May 2014
Jun 2014
Jul 2014
Aug 2014
Sep 2014
Oct 2014
Nov 2014
Dec 2014
Jan 2015
Addressing challenges in US respiratory
Improved formulary coverage expected to improve outlook
6
Medicare Part D coverage
Jan
2014
Jan
2015
Breo 2% 74%
NRx growth (LABA / ICS)
Advair + Breo
Advair
NBRx share (LABA / ICS)
Source: IMS
-20%
-15%
-10%
-5%
0%
5%
10%
Dec 2013
Jan 2014
Feb 2014
Mar 2014
Apr 2014
May 2014
Jun 2014
Jul 2014
Aug 2014
Sep 2014
Oct 2014
Nov 2014
Dec 2014
Symbicort
Advair + Breo
Advair
Market
* Data presented for Advair removed due to restatement, please call
GSK Investor Relations if you have questions.

Addressing challenges in US respiratory
7
Improved formulary coverage expected to improve outlook
April
2014
Jan
2015
Positive head-to-head vs
tiotropium in promotional materials
September
DTC campaign began Q1 2015
Medicare Part D coverage
Anoro 65% 0%
Source: IMS
0%
1%
2%
3%
4%
Apr 2014
May 2014
Jun 2014
Jul 2014
Aug 2014
Sep 2014
Oct 2014
Nov 2014
Dec 2014
Jan 2015
Anoro share of market Market = LAMA containing (Anoro, Spiriva, Tudorza)
NRx
TRx

Encouraging early uptake of Relvar in Japan
0%
10%
20%
30%
40%
50%
60%
70%
Nov-1
3
De
c-1
3
Ja
n-1
4
Feb
-14
Ma
r-1
4
Ap
r-1
4
Ma
y-1
4
Ju
n-1
4
Ju
l-1
4
Au
g-1
4
Se
p-1
4
Oct-
14
Nov-1
4
Dec-1
4
8 Source: JMIRI G5 December 2014
0%
10%
20%
30%
40%
50%
60%
70%
Nov-1
3
Dec-1
3
Ja
n-1
4
Feb
-14
Ma
r-1
4
Ap
r-1
4
Ma
y-1
4
Ju
n-1
4
Ju
l-1
4
Au
g-1
4
Se
p-1
4
Oct-
14
Nov-1
4
Dec-1
4
Total GSK
Adoair
Symbicort
Relvar
Flutiform
Total GSK
Adoair
Relvar
Flutiform
Symbicort
Total patients New patients Ryotan
restriction
removed
Ryotan
restriction
removed
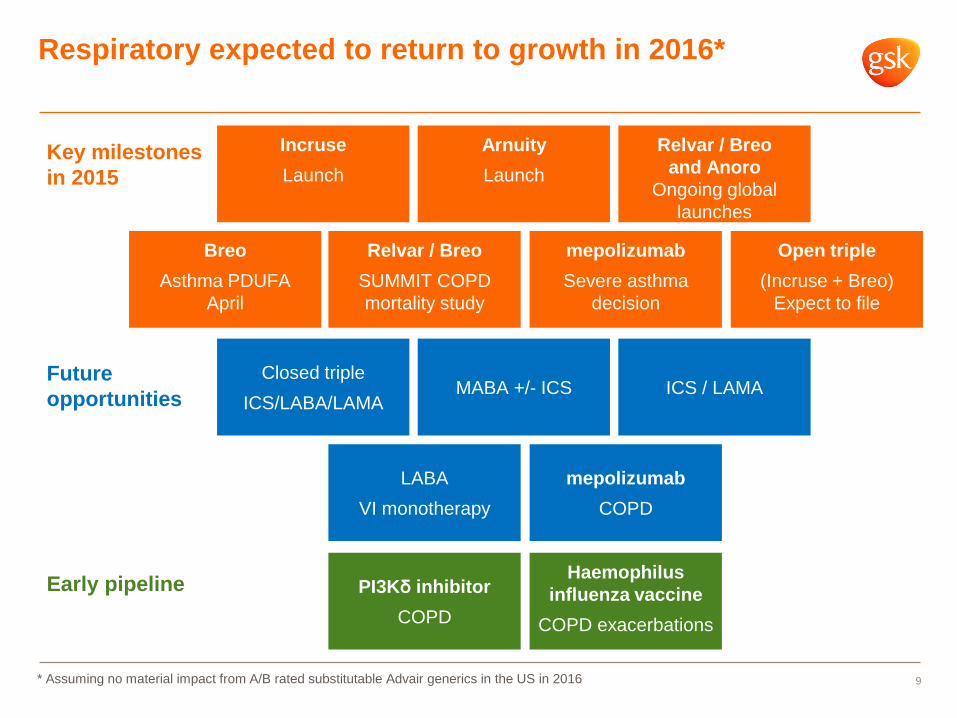
Respiratory expected to return to growth in 2016*
9 * Assuming no material impact from A/B rated substitutable Advair generics in the US in 2016
Early pipeline
Future
opportunities
Key milestones
in 2015
Incruse
Launch
Arnuity
Launch
Relvar / Breo
and Anoro
Ongoing global
launches
Breo
Asthma PDUFA
April
Relvar / Breo
SUMMIT COPD
mortality study
mepolizumab
Severe asthma
decision
Open triple
(Incruse + Breo)
Expect to file
Closed triple
ICS/LABA/LAMA MABA +/- ICS ICS / LAMA
LABA
VI monotherapy
mepolizumab
COPD
PI3Kδ inhibitor
COPD
Haemophilus
influenza vaccine
COPD exacerbations

0
1000
2000
3000
4000
5000
6000
7000
8000
9000
TR
x V
olu
me
US TRx comparison: 70 weeks post Tivicay / DTG launch
ViiV launches
10
Sales of £339m in 2014 for Tivicay and Triumeq
Japan Germany Australia Canada
+
Other HIV
launches
Source: IMS
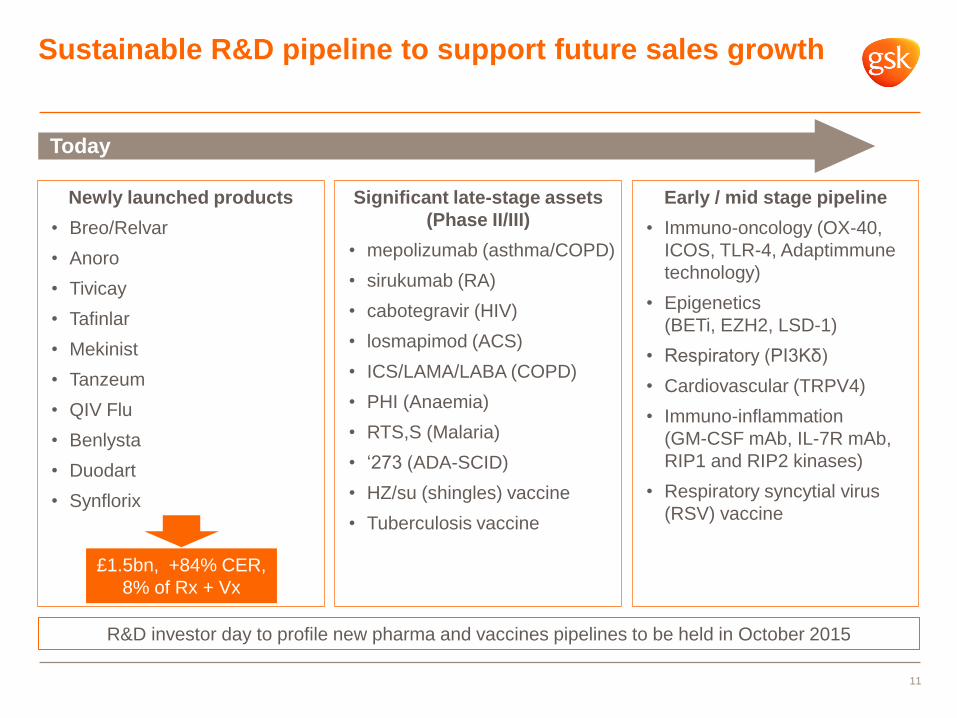
Sustainable R&D pipeline to support future sales growth
11
Newly launched products
• Breo/Relvar
• Anoro
• Tivicay
• Tafinlar
• Mekinist
• Tanzeum
• QIV Flu
• Benlysta
• Duodart
• Synflorix
Significant late-stage assets
(Phase II/III)
• mepolizumab (asthma/COPD)
• sirukumab (RA)
• cabotegravir (HIV)
• losmapimod (ACS)
• ICS/LAMA/LABA (COPD)
• PHI (Anaemia)
• RTS,S (Malaria)
• ‘273 (ADA-SCID)
• HZ/su (shingles) vaccine
• Tuberculosis vaccine
Early / mid stage pipeline
• Immuno-oncology (OX-40,
ICOS, TLR-4, Adaptimmune
technology)
• Epigenetics
(BETi, EZH2, LSD-1)
• Respiratory (PI3Kδ)
• Cardiovascular (TRPV4)
• Immuno-inflammation
(GM-CSF mAb, IL-7R mAb,
RIP1 and RIP2 kinases)
• Respiratory syncytial virus
(RSV) vaccine
Today
£1.5bn, +84% CER,
8% of Rx + Vx
R&D investor day to profile new pharma and vaccines pipelines to be held in October 2015
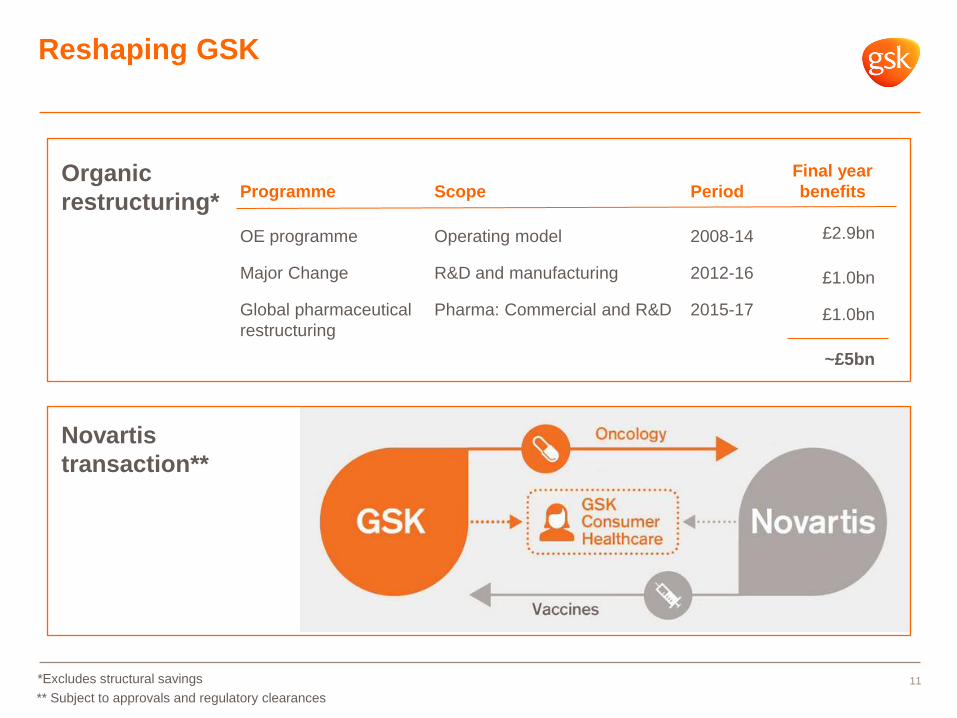
Novartis
transaction**
Reshaping GSK
11
Organic
restructuring*
Programme
OE programme
Major Change
Global pharmaceutical
restructuring
Final year
benefits
£2.9bn
£1.0bn
£1.0bn
~£5bn
Period
2008-14
2012-16
2015-17
Scope
Operating model
R&D and manufacturing
Pharma: Commercial and R&D
** Subject to approvals and regulatory clearances
*Excludes structural savings

Vaccines
~14%*
Respiratory
27%*
Pharma
~61%*
Reshaping GSK: Proposed Novartis transaction
#1 global position
~$26bn market
growing at mid
single digit
#1 OTC globally
Total consumer
~$73bn market
growing at ~4% p.a.
#2 globally
~$20bn market
growing at ~8% p.a.
#1 global position
~$29bn market
growing at ~2% p.a.
Consumer
~25%*
HIV
5%*
Source: Internal and external data, Euromonitor, Visiongain, Evaluate Pharma
* Percentage of sales based on 2013 Pro-forma of GSK post transaction with Novartis 13
Complemented by strength in Emerging Markets and Japan
Better balance, quality and durability of earnings
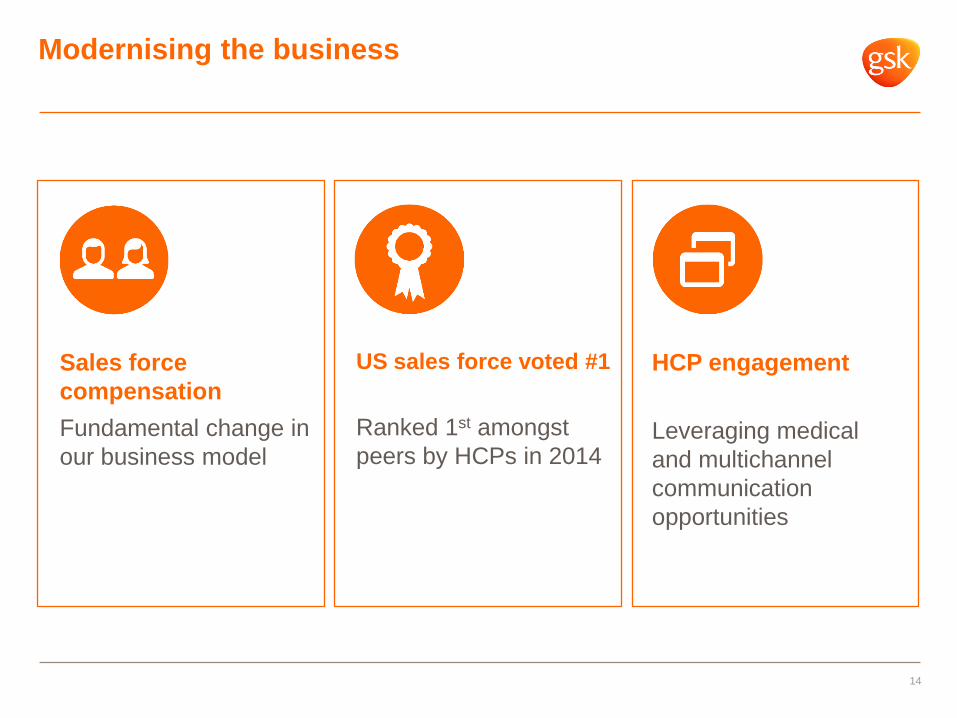
Modernising the business
14
US sales force voted #1
Ranked 1st amongst
peers by HCPs in 2014
HCP engagement
Leveraging medical
and multichannel
communication
opportunities
Sales force
compensation
Fundamental change in
our business model

Innovation and access
15
Ebola
Responding to a crisis
Phase III trials started
February 2015
Malaria
30 years and counting
Regulatory decision
in 2015
Access to
Medicines Index
Number 1 for the fourth
consecutive time

What to expect in 2015
16 * 2015 returns assumes positive readout of Combi-d
Results from the
Combi-d trial
Return of £4 billion
to shareholders
following Novartis
transaction close*
Up to10 Phase III
starts and
15 Phase II NME
starts
Closure of
Novartis
transaction**
Investor Day
(post Novartis
completion)
AdCom and
PDUFA decision
on asthma
indication for Breo
Readout of Breo
SUMMIT study of
mortality and
morbidity in COPD
R&D Investor Day
ViiV IPO decision AdCom and PDUFA
decision on
mepolizumab for severe
eosinophilic asthma
File GSK’s first cell
& gene therapy for
ADA-SCID
(‘273)
Dividend of 80p
per share
(same level as 2014)
Phase III data for
sirukumab for RA
Regulatory
decision for RTS,S
malaria vaccines
Confirmation of
filing strategy for
HZ/su shingles
vaccine
** Subject to approvals and regulatory clearances
Simon Dingemans
Chief Financial Officer

Growth %
£m 2014 CER £
Turnover 23,006 (3) (10)
Core operating profit 6,594 (6) (15)
Core EPS 95.4p (1) (12)
Adjusted net cash inflow from operations* 5,878 (20)
Adjusted FCF* 3,322 (30)
Headline results
18 *Adjusted net cash inflow from operations and adjusted FCF exclude legal charges
Core EPS -1% despite top line pressure
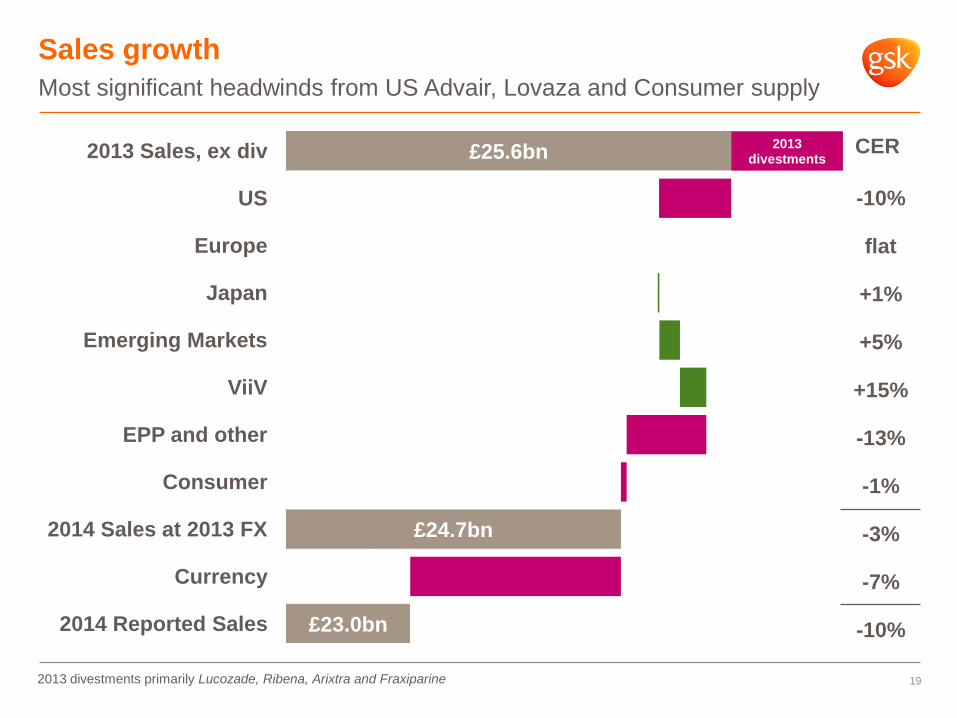
£25.6bn
£24.7bn
£23.0bn
2013 divestments 2013 Sales, ex div
US
Europe
Japan
Emerging Markets
ViiV
EPP and other
Consumer
2014 Sales at 2013 FX
Currency
2014 Reported Sales
Sales growth
Most significant headwinds from US Advair, Lovaza and Consumer supply
19
-10%
flat
+1%
+5%
+15%
-13%
-1%
-3%
-7%
-10%
2013 divestments primarily Lucozade, Ribena, Arixtra and Fraxiparine
CER

Operating profit margin breakdown
Reduced margin primarily reflects FX, lower sales, mix and investments
20
30.4%
29.5%
28.7%
0.1%
0.9%
0.2%
0.5%
0.2%
2013 OP (ex divestments)
Currency
COGS
SG&A
R&D
Royalties
2014 OP
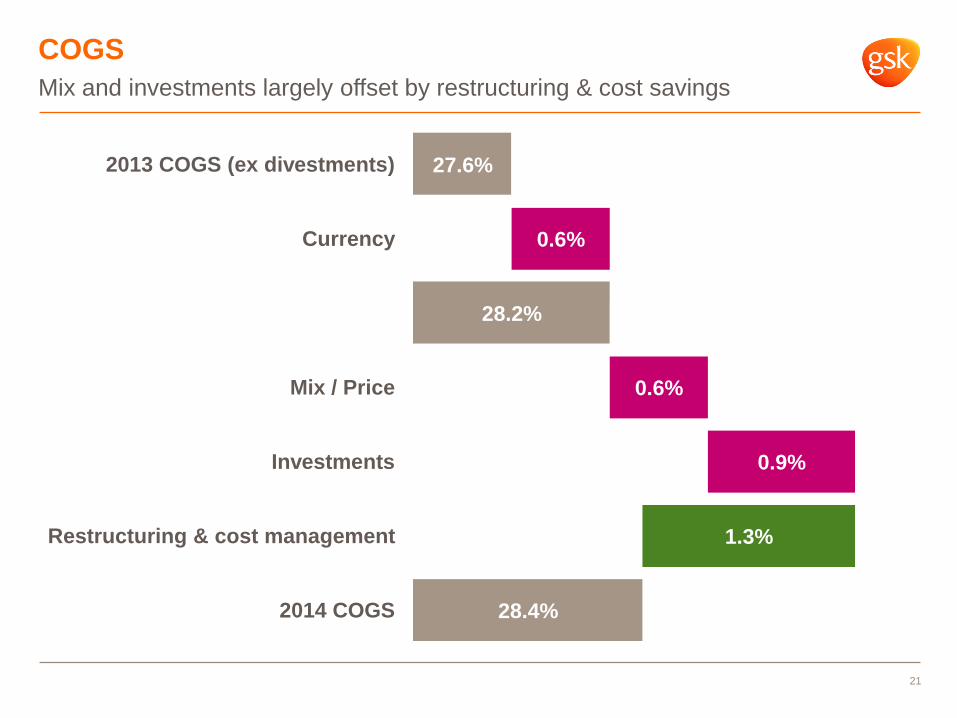
COGS
Mix and investments largely offset by restructuring & cost savings
21
27.6%
28.2%
28.4%
0.6%
0.6%
0.9%
1.3%
2013 COGS (ex divestments)
Currency
Mix / Price
Investments
Restructuring & cost management
2014 COGS
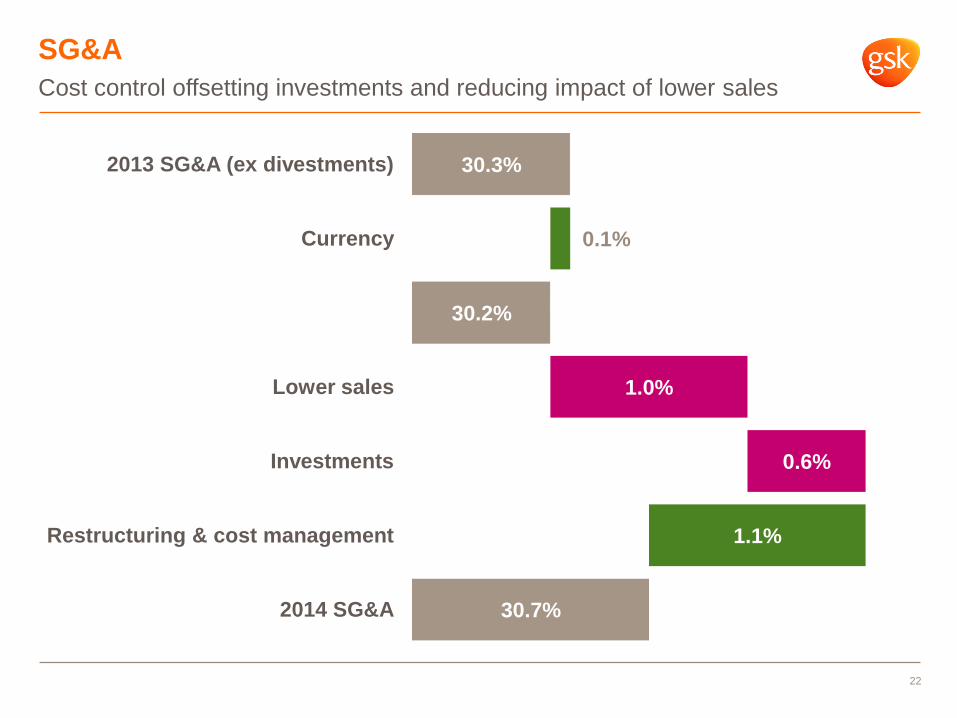
SG&A
Cost control offsetting investments and reducing impact of lower sales
22
30.3%
30.2%
30.7%
1.0%
0.6%
0.1%
1.1%
2013 SG&A (ex divestments)
Currency
Lower sales
Investments
Restructuring & cost management
2014 SG&A

2.5 2.7
2.9
0.3
0.6
0.4
0.3
0.2
2012 2013 2014
OE Programme Major Change Structural savings
23
Continued delivery of restructuring and structural benefits
Delivered ~£400m of incremental savings in 2014
3.7
£bn
3.3
2.9
+0.4
+0.4
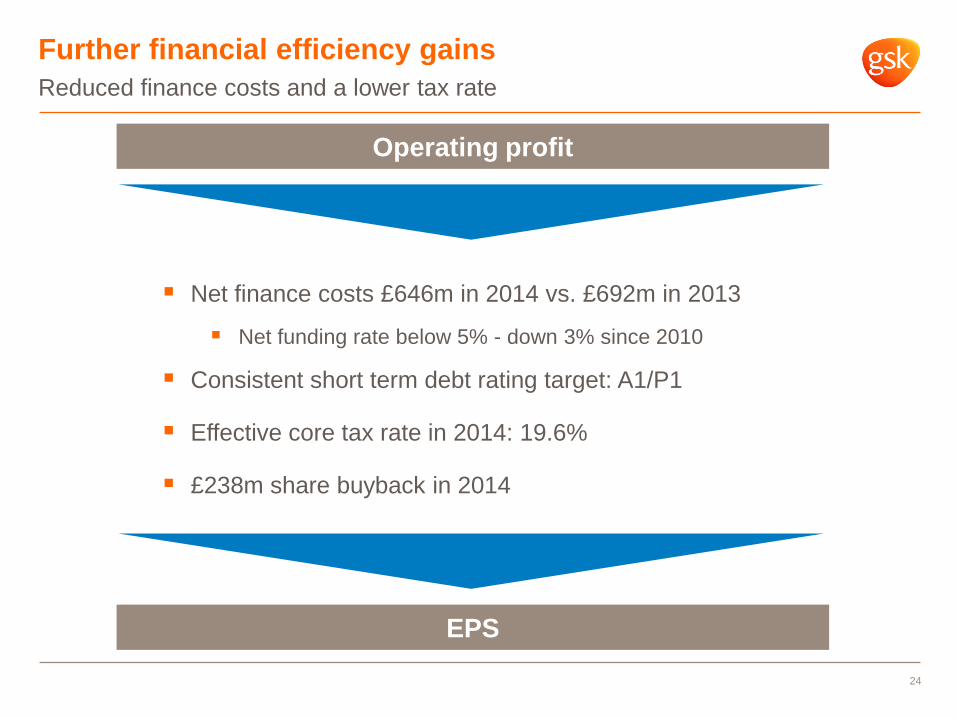
Further financial efficiency gains
Reduced finance costs and a lower tax rate
24
Operating profit
EPS
Net finance costs £646m in 2014 vs. £692m in 2013
Net funding rate below 5% - down 3% since 2010
Consistent short term debt rating target: A1/P1
Effective core tax rate in 2014: 19.6%
£238m share buyback in 2014

Cash generation and net debt
Net debt increased to £14.4bn
25
£m
Reported Ex divest.
2010 221 221
2011 210 210
2012 194 194
2013 176 190
2014 209 211
Working capital days
12,645 14,377
18,784
3,843
238 866 702
166
4,407
3,322
761
Net Debt 31/12/2013
Free cash flow ex legal
Dividends Share buybacks
Disposals Bolt-ons Legal Other Net Debt 31/12/2014
Cash and liquid inv
Gross Debt
31/12/2014

Novartis transaction* supports sustainable growth and
improving returns
26
Sales
growth
Operating
leverage
Financial
efficiency
Cash flow
growth
Returns to
shareholders
EPS
Free cash
flow
Better balanced and
broader range of
growth drivers
Significant synergy
and operating
leverage efficiencies
More balanced and
sustained cashflow
Continued financial
efficiencies
* Subject to approvals and regulatory clearances

Thank you
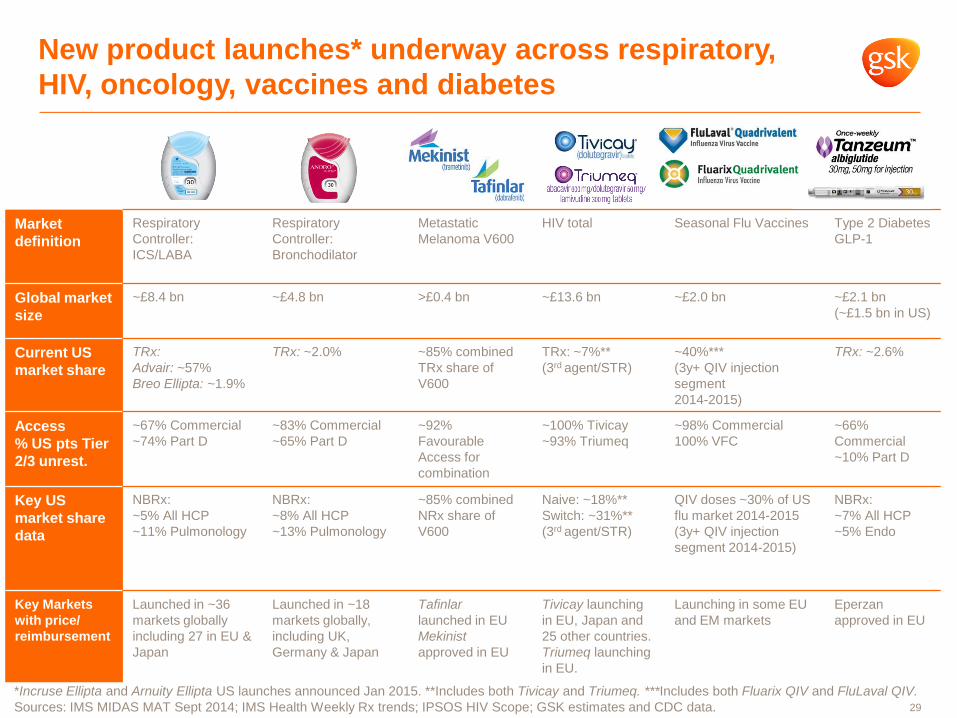
*Incruse Ellipta and Arnuity Ellipta US launches announced Jan 2015. **Includes both Tivicay and Triumeq. ***Includes both Fluarix QIV and FluLaval QIV.
Sources: IMS MIDAS MAT Sept 2014; IMS Health Weekly Rx trends; IPSOS HIV Scope; GSK estimates and CDC data.
Market
definition
Respiratory
Controller:
ICS/LABA
Respiratory
Controller:
Bronchodilator
Metastatic
Melanoma V600
HIV total Seasonal Flu Vaccines Type 2 Diabetes
GLP-1
Global market
size
~£8.4 bn ~£4.8 bn >£0.4 bn ~£13.6 bn ~£2.0 bn ~£2.1 bn
(~£1.5 bn in US)
Current US
market share
TRx:
Advair: ~57%
Breo Ellipta: ~1.9%
TRx: ~2.0% ~85% combined
TRx share of
V600
TRx: ~7%**
(3rd agent/STR)
~40%***
(3y+ QIV injection
segment
2014-2015)
TRx: ~2.6%
Access
% US pts Tier
2/3 unrest.
~67% Commercial
~74% Part D
~83% Commercial
~65% Part D
~92%
Favourable
Access for
combination
~100% Tivicay
~93% Triumeq
~98% Commercial
100% VFC
~66%
Commercial
~10% Part D
Key US
market share
data
NBRx:
~5% All HCP
~11% Pulmonology
NBRx:
~8% All HCP
~13% Pulmonology
~85% combined
NRx share of
V600
Naive: ~18%**
Switch: ~31%**
(3rd agent/STR)
QIV doses ~30% of US
flu market 2014-2015
(3y+ QIV injection
segment 2014-2015)
NBRx:
~7% All HCP
~5% Endo
Key Markets
with price/
reimbursement
Launched in ~36
markets globally
including 27 in EU &
Japan
Launched in ~18
markets globally,
including UK,
Germany & Japan
Tafinlar
launched in EU
Mekinist
approved in EU
Tivicay launching
in EU, Japan and
25 other countries.
Triumeq launching
in EU.
Launching in some EU
and EM markets
Eperzan
approved in EU
New product launches* underway across respiratory,
HIV, oncology, vaccines and diabetes
29