full year results 2017: tables - roche - doing now what ...29d4dcde-3b4d-43e3-91d6-08fdbd951… ·...
TRANSCRIPT

1
Appendix: Tables
1. Sales January to December 2017 and 2016....................................................................................................................................................................................................... 2
2. Quarterly sales and constant exchange rate sales growth by Division in 2017 and 2016................................................................................................................................. 3
3. Pharmaceuticals Division – Top-selling pharmaceuticals and recent new launches ......................................................................................................................................... 4
4. Top 20 Pharmaceuticals Division product sales and constant exchange rate growth YTD December 2017 vs. YTD December 2016 .............................................................. 5
5. Top 20 Pharmaceuticals Division quarterly product sales and quarterly constant exchange rate sales growth .............................................................................................. 6
6. Top 20 Pharmaceuticals Division quarterly product sales and quarterly constant exchange rate sales growth United States ....................................................................... 7
7. Top 20 Pharmaceuticals Division quarterly product sales and quarterly constant exchange rate sales growth Europe ................................................................................. 8
8. Top 20 Pharmaceuticals Division quarterly product sales and quarterly constant exchange rate sales growth Japan .................................................................................... 9
9. Top 20 Pharmaceuticals Division quarterly product sales and quarterly constant exchange rate sales growth International* .................................................................... 10
10. Roche Group consolidated income statement for the twelve months ended 31 December 2017 ................................................................................................................ 11
11. Roche Group core results reconciliation – Full Year 2017 ............................................................................................................................................................................... 12
12. Divisional core results reconciliation – Full Year 2017 .................................................................................................................................................................................... 13
13. Roche Group consolidated balance sheet ....................................................................................................................................................................................................... 14
14. Roche Group consolidated statement of cash flows ....................................................................................................................................................................................... 15
2
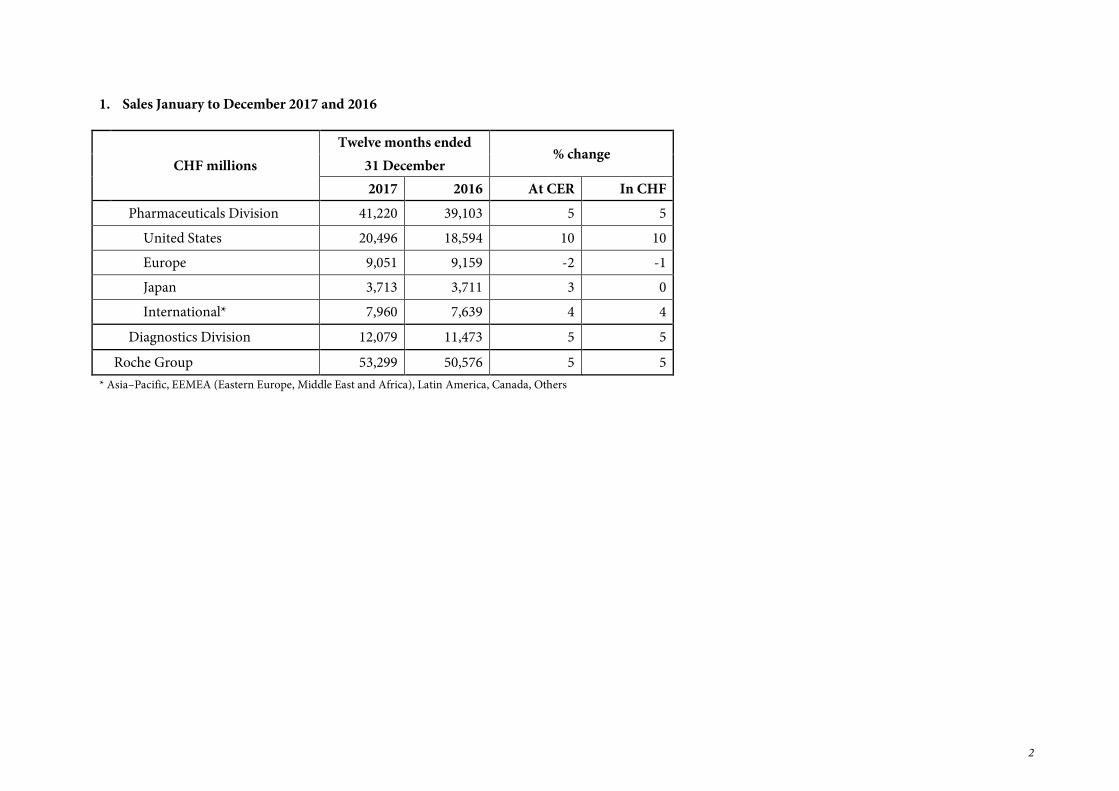
1. Sales January to December 2017 and 2016
Twelve months ended % change
CHF millions 31 December
2017 2016 At CER In CHF
Pharmaceuticals Division 41,220 39,103 5 5
United States 20,496 18,594 10 10
Europe 9,051 9,159 -2 -1
Japan 3,713 3,711 3 0
International* 7,960 7,639 4 4
Diagnostics Division 12,079 11,473 5 5
Roche Group 53,299 50,576 5 5
* Asia–Pacific, EEMEA (Eastern Europe, Middle East and Africa), Latin America, Canada, Others

3
2. Quarterly sales and constant exchange rate sales growth by Division in 2017 and 2016
CHF millions
% change % change % change % change % change
Q4 2016 vs. Q1 2017 vs. Q2 2017 vs. Q3 2017 vs. Q4 2017 vs.
Q4 2015 Q1 2016 Q2 2016 Q3 2016 Q4 2016
Pharmaceuticals Division 9,963 3 10,177 3 10,344 7 10,115 6 10,584 6
United States 4,744 3 5,070 6 5,115 10 5,081 12 5,230 12
Europe 2,243 2 2,273 1 2,266 0 2,227 -5 2,285 -5
Japan 1,021 3 856 -2 915 2 904 6 1,038 6
International* 1,955 3 1,978 1 2,048 8 1,903 2 2,031 3
Diagnostics Division 3,108 5 2,765 6 3,058 4 2,975 6 3,281 4
Roche Group 13,071 3 12,942 4 13,402 6 13,090 6 13,865 5
*Asia–Pacific, EEMEA (Eastern Europe, Middle East and Africa), Latin America, Canada, Others
4
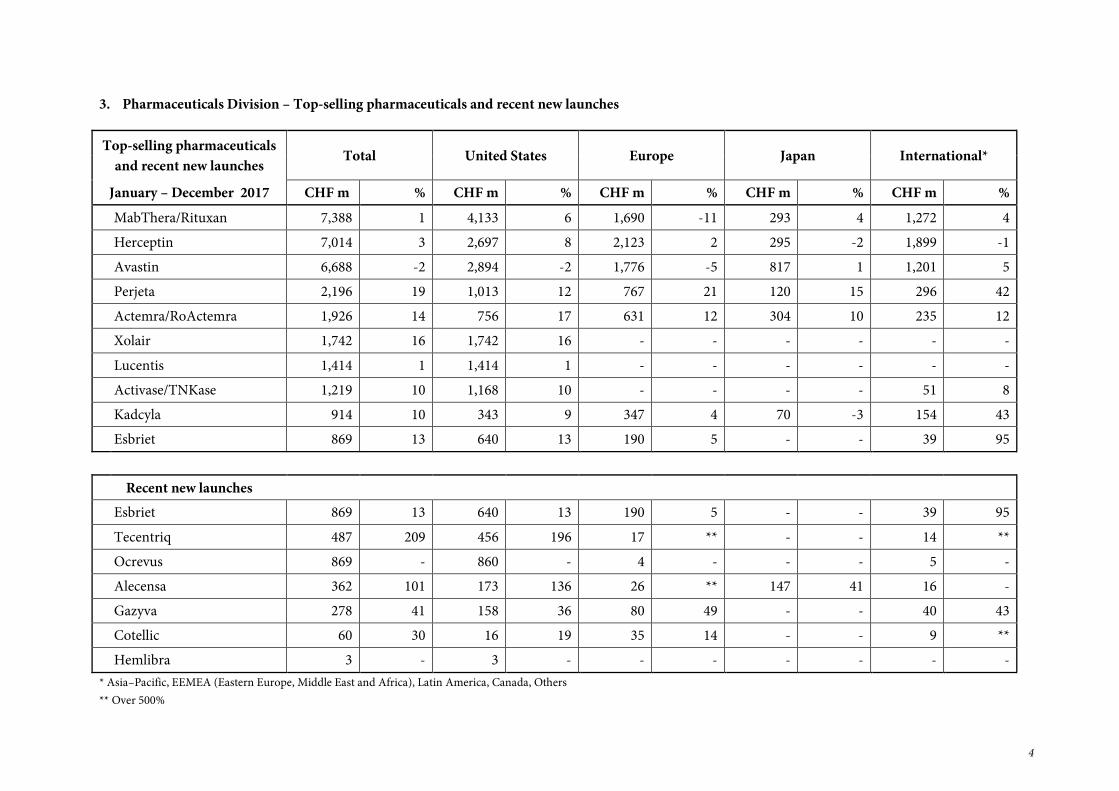
3. Pharmaceuticals Division – Top-selling pharmaceuticals and recent new launches
Top-selling pharmaceuticals
and recent new launches Total United States Europe Japan International*
January – December 2017 CHF m % CHF m % CHF m % CHF m % CHF m %
MabThera/Rituxan 7,388 1 4,133 6 1,690 -11 293 4 1,272 4
Herceptin 7,014 3 2,697 8 2,123 2 295 -2 1,899 -1
Avastin 6,688 -2 2,894 -2 1,776 -5 817 1 1,201 5
Perjeta 2,196 19 1,013 12 767 21 120 15 296 42
Actemra/RoActemra 1,926 14 756 17 631 12 304 10 235 12
Xolair 1,742 16 1,742 16 - - - - - -
Lucentis 1,414 1 1,414 1 - - - - - -
Activase/TNKase 1,219 10 1,168 10 - - - - 51 8
Kadcyla 914 10 343 9 347 4 70 -3 154 43
Esbriet 869 13 640 13 190 5 - - 39 95
Recent new launches
Esbriet 869 13 640 13 190 5 - - 39 95
Tecentriq 487 209 456 196 17 ** - - 14 **
Ocrevus 869 - 860 - 4 - - - 5 -
Alecensa 362 101 173 136 26 ** 147 41 16 -
Gazyva 278 41 158 36 80 49 - - 40 43
Cotellic 60 30 16 19 35 14 - - 9 **
Hemlibra 3 - 3 - - - - - - -
* Asia–Pacific, EEMEA (Eastern Europe, Middle East and Africa), Latin America, Canada, Others ** Over 500%

5
4. Top 20 Pharmaceuticals Division product sales and constant exchange rate growth YTD December 2017 vs. YTD December 2016
CHF millions
Total United States Europe Japan International*
CHF m % CHF m % CHF m % CHF m % CHF m %
MabThera/Rituxan 7,388 1 4,133 6 1,690 -11 293 4 1,272 4
Herceptin 7,014 3 2,697 8 2,123 2 295 -2 1,899 -1
Avastin 6,688 -2 2,894 -2 1,776 -5 817 1 1,201 5
Perjeta 2,196 19 1,013 12 767 21 120 15 296 42
Actemra/RoActemra 1,926 14 756 17 631 12 304 10 235 12
Xolair 1,742 16 1,742 16 - - - - - -
Lucentis 1,414 1 1,414 1 - - - - - -
Activase/TNKase 1,219 10 1,168 10 - - - - 51 8
Kadcyla 914 10 343 9 347 4 70 -3 154 43
Esbriet 869 13 640 13 190 5 - - 39 95
Ocrevus 869 - 860 - 4 - - - 5 -
Tarceva 843 -18 457 -18 140 -21 92 -9 154 -18
Pulmozyme 730 6 506 7 124 2 - - 100 10
CellCept 697 -6 120 -30 178 -1 78 13 321 1
Tamiflu 535 -33 239 -49 27 -74 148 25 121 13
Mircera 505 -1 - - 84 -5 210 -1 211 1
Tecentriq 487 209 456 196 17 ** - - 14 **
Xeloda 453 -10 36 -55 26 -19 107 -1 284 0
Alecensa 362 101 173 136 26 ** 147 41 16 -
Madopar 334 13 - - 103 3 16 -1 215 20
* Asia–Pacific, EEMEA (Eastern Europe, Middle East and Africa), Latin America, Canada, Others ** Over 500%

6
5. Top 20 Pharmaceuticals Division quarterly product sales and quarterly constant exchange rate sales growth
CHF millions
% change % change % change % change % change
Q4 2016 vs. Q1 2017 vs. Q2 2017 vs. Q3 2017 vs. Q4 2017 vs.
Q4 2015 Q1 2016 Q2 2016 Q3 2016 Q4 2016
MabThera/Rituxan 1,816 2 1,899 4 1,938 3 1,783 1 1,768 -3
Herceptin 1,657 0 1,756 2 1,786 4 1,691 0 1,781 6
Avastin 1,669 -4 1,684 -2 1,721 0 1,592 -4 1,691 1
Perjeta 467 14 524 19 541 16 552 17 579 22
Actemra/RoActemra 450 14 445 15 477 12 485 13 519 14
Xolair 378 8 437 22 429 13 448 17 428 15
Lucentis 329 -14 392 9 335 -5 399 8 288 -11
Activase/TNKase 301 15 316 13 297 12 307 15 299 0
Kadcyla 215 2 222 11 221 7 228 10 243 12
Esbriet 197 10 202 13 216 19 219 3 232 17
Ocrevus - - - - 192 - 308 - 369 -
Tarceva 259 -11 211 -19 225 -15 202 -16 205 -21
Pulmozyme 181 1 175 9 177 -1 179 8 199 10
CellCept 182 -10 170 -10 176 -4 169 -8 182 -1
Tamiflu 291 72 270 -27 94 110 33 -61 138 -52
Mircera 137 23 115 -4 121 -2 128 -2 141 3
Tecentriq 80 - 113 - 124 * 118 104 132 65
Xeloda 156 18 104 -7 125 5 112 -4 112 -28
Alecensa 60 -15 68 124 80 88 96 100 118 99
Madopar 76 6 86 18 77 10 81 10 90 14
* Over 500%
7
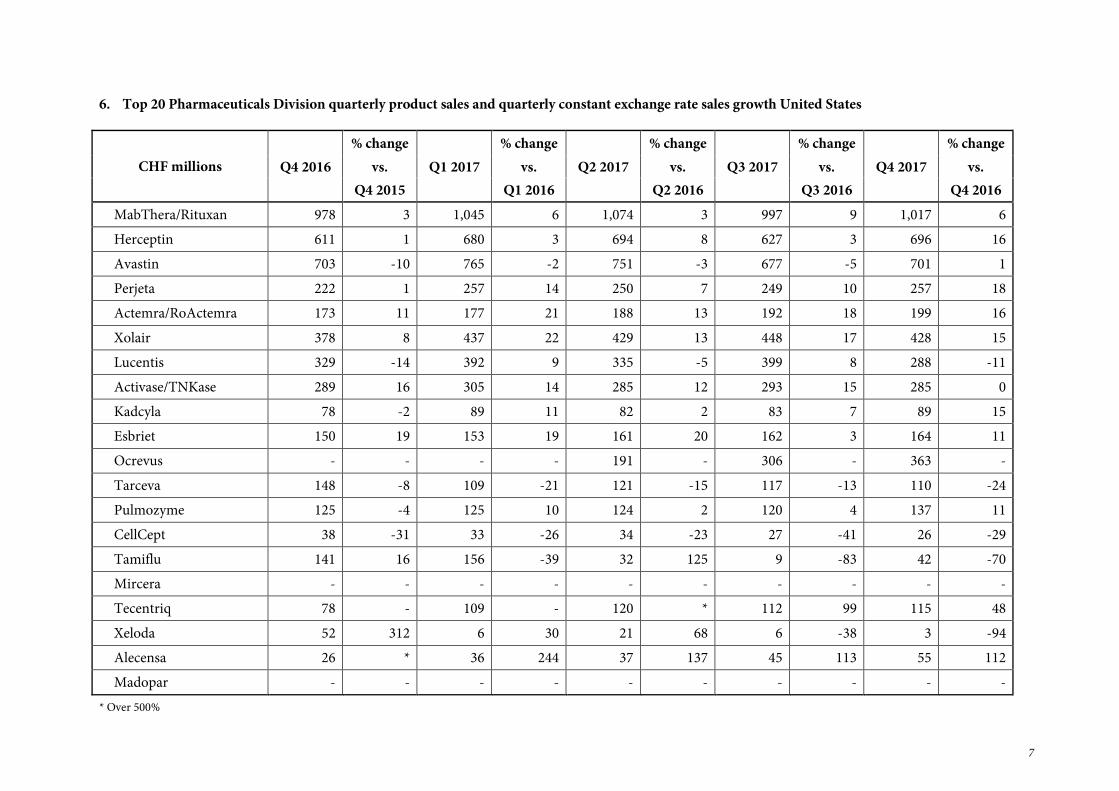
6. Top 20 Pharmaceuticals Division quarterly product sales and quarterly constant exchange rate sales growth United States
CHF millions
% change % change % change % change % change
Q4 2016 vs. Q1 2017 vs. Q2 2017 vs. Q3 2017 vs. Q4 2017 vs.
Q4 2015 Q1 2016 Q2 2016 Q3 2016 Q4 2016
MabThera/Rituxan 978 3 1,045 6 1,074 3 997 9 1,017 6
Herceptin 611 1 680 3 694 8 627 3 696 16
Avastin 703 -10 765 -2 751 -3 677 -5 701 1
Perjeta 222 1 257 14 250 7 249 10 257 18
Actemra/RoActemra 173 11 177 21 188 13 192 18 199 16
Xolair 378 8 437 22 429 13 448 17 428 15
Lucentis 329 -14 392 9 335 -5 399 8 288 -11
Activase/TNKase 289 16 305 14 285 12 293 15 285 0
Kadcyla 78 -2 89 11 82 2 83 7 89 15
Esbriet 150 19 153 19 161 20 162 3 164 11
Ocrevus - - - - 191 - 306 - 363 -
Tarceva 148 -8 109 -21 121 -15 117 -13 110 -24
Pulmozyme 125 -4 125 10 124 2 120 4 137 11
CellCept 38 -31 33 -26 34 -23 27 -41 26 -29
Tamiflu 141 16 156 -39 32 125 9 -83 42 -70
Mircera - - - - - - - - - -
Tecentriq 78 - 109 - 120 * 112 99 115 48
Xeloda 52 312 6 30 21 68 6 -38 3 -94
Alecensa 26 * 36 244 37 137 45 113 55 112
Madopar - - - - - - - - - -
* Over 500%
8
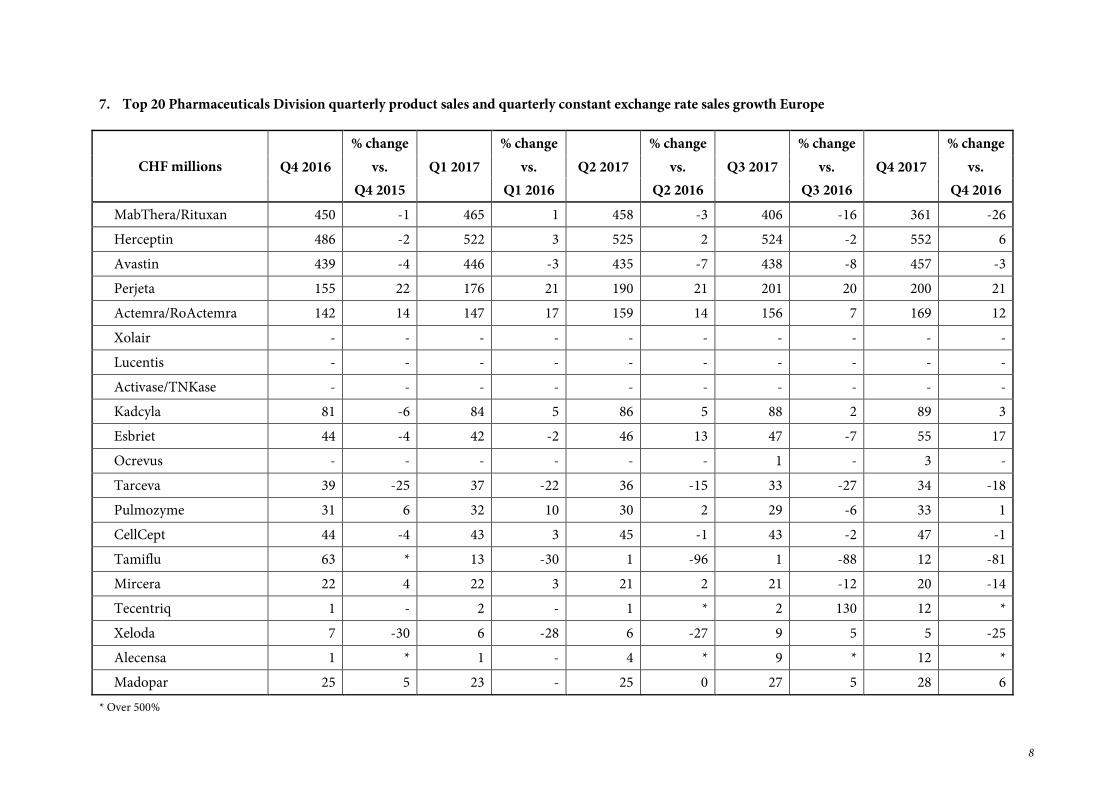
7. Top 20 Pharmaceuticals Division quarterly product sales and quarterly constant exchange rate sales growth Europe
CHF millions
% change % change % change % change % change
Q4 2016 vs. Q1 2017 vs. Q2 2017 vs. Q3 2017 vs. Q4 2017 vs.
Q4 2015 Q1 2016 Q2 2016 Q3 2016 Q4 2016
MabThera/Rituxan 450 -1 465 1 458 -3 406 -16 361 -26
Herceptin 486 -2 522 3 525 2 524 -2 552 6
Avastin 439 -4 446 -3 435 -7 438 -8 457 -3
Perjeta 155 22 176 21 190 21 201 20 200 21
Actemra/RoActemra 142 14 147 17 159 14 156 7 169 12
Xolair - - - - - - - - - -
Lucentis - - - - - - - - - -
Activase/TNKase - - - - - - - - - -
Kadcyla 81 -6 84 5 86 5 88 2 89 3
Esbriet 44 -4 42 -2 46 13 47 -7 55 17
Ocrevus - - - - - - 1 - 3 -
Tarceva 39 -25 37 -22 36 -15 33 -27 34 -18
Pulmozyme 31 6 32 10 30 2 29 -6 33 1
CellCept 44 -4 43 3 45 -1 43 -2 47 -1
Tamiflu 63 * 13 -30 1 -96 1 -88 12 -81
Mircera 22 4 22 3 21 2 21 -12 20 -14
Tecentriq 1 - 2 - 1 * 2 130 12 *
Xeloda 7 -30 6 -28 6 -27 9 5 5 -25
Alecensa 1 * 1 - 4 * 9 * 12 *
Madopar 25 5 23 - 25 0 27 5 28 6
* Over 500%

9
8. Top 20 Pharmaceuticals Division quarterly product sales and quarterly constant exchange rate sales growth Japan
CHF millions
% change % change % change % change % change
Q4 2016 vs. Q1 2017 vs. Q2 2017 vs. Q3 2017 vs. Q4 2017 vs.
Q4 2015 Q1 2016 Q2 2016 Q3 2016 Q4 2016
MabThera/Rituxan 80 11 62 -3 75 5 75 7 81 5
Herceptin 84 7 67 -4 76 -1 73 0 79 -1
Avastin 223 -5 181 -8 209 2 204 5 223 5
Perjeta 31 17 26 7 30 14 30 22 34 15
Actemra/RoActemra 79 14 64 4 76 9 77 12 87 15
Xolair - - - - - - - - - -
Lucentis - - - - - - - - - -
Activase/TNKase - - - - - - - - - -
Kadcyla 20 4 16 -9 17 -12 18 2 19 6
Esbriet - - - - - - - - - -
Ocrevus - - - - - - - - - -
Tarceva 28 4 22 -4 24 -10 22 -9 24 -11
Pulmozyme - - - - - - - - - -
CellCept 20 14 17 9 19 13 20 14 22 14
Tamiflu 46 243 65 5 7 183 16 63 60 36
Mircera 63 3 43 -6 54 0 54 3 59 -1
Tecentriq - - - - - - - - - -
Xeloda 29 4 25 -3 27 -4 26 -1 29 5
Alecensa 33 -55 29 50 36 35 38 44 44 39
Madopar 4 -5 4 -2 4 -3 3 1 5 2

10
9. Top 20 Pharmaceuticals Division quarterly product sales and quarterly constant exchange rate sales growth International*
CHF millions
% change % change % change % change % change
Q4 2016 vs. Q1 2017 vs. Q2 2017 vs. Q3 2017 vs. Q4 2017 vs.
Q4 2015 Q1 2016 Q2 2016 Q3 2016 Q4 2016
MabThera/Rituxan 308 3 327 4 331 10 305 1 309 0
Herceptin 476 1 487 0 491 2 467 0 454 -5
Avastin 304 13 292 7 326 15 273 -5 310 1
Perjeta 59 50 65 47 71 41 72 35 88 45
Actemra/RoActemra 56 22 57 7 54 9 60 16 64 16
Xolair - - - - - - - - - -
Lucentis - - - - - - - - - -
Activase/TNKase 12 -10 11 0 12 11 14 16 14 5
Kadcyla 36 38 33 49 36 44 39 53 46 29
Esbriet 3 -43 7 10 9 62 10 113 13 263
Ocrevus - - - - - - 1 - 4 -
Tarceva 44 -11 43 -18 44 -15 30 -19 37 -19
Pulmozyme 25 17 18 3 23 -17 30 50 29 15
CellCept 80 -4 77 -11 78 2 79 4 87 9
Tamiflu 41 20 36 -4 54 222 7 -29 24 -45
Mircera 52 70 50 -5 46 -7 53 -2 62 16
Tecentriq 1 - 2 - 3 - 4 ** 5 300
Xeloda 68 -16 67 -8 71 1 71 -1 75 11
Alecensa - - 2 - 3 - 4 - 7 -
Madopar 47 7 59 30 48 18 51 13 57 20
* Asia–Pacific, EEMEA (Eastern Europe, Middle East and Africa), Latin America, Canada, Others
** Over 500%
11
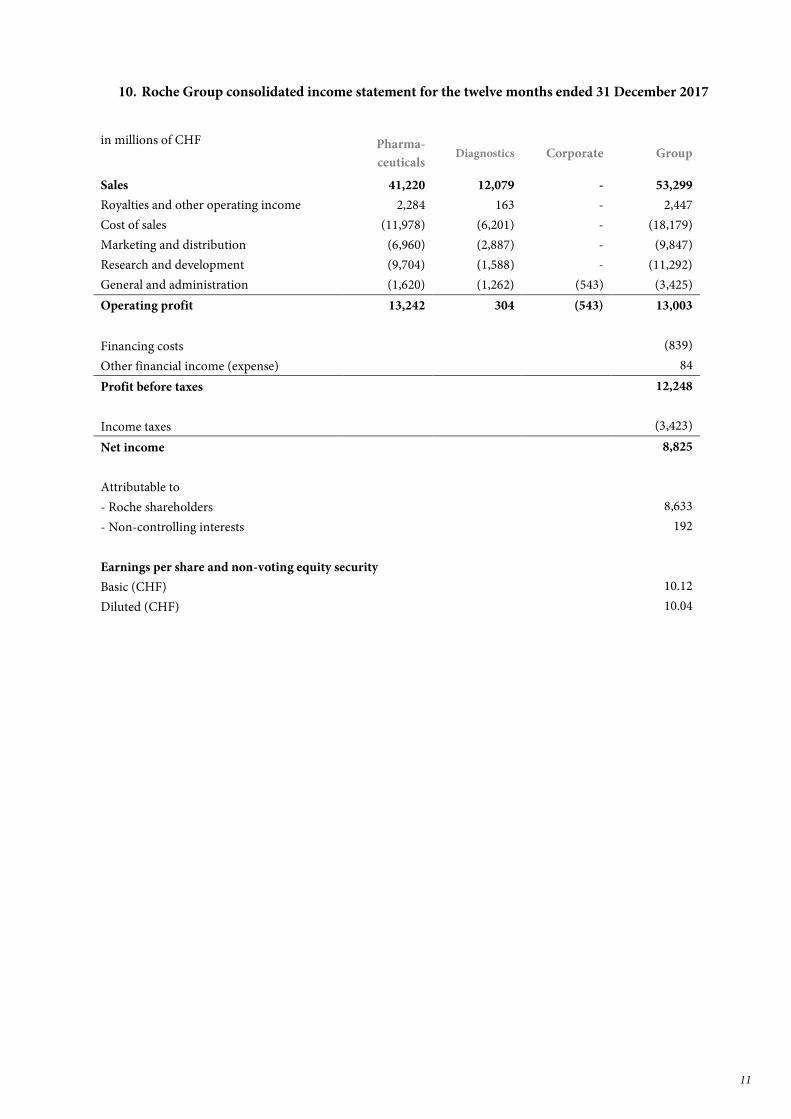
10. Roche Group consolidated income statement for the twelve months ended 31 December 2017
in millions of CHF Pharma-
ceuticals Diagnostics Corporate Group
Sales 41,220 12,079 - 53,299
Royalties and other operating income 2,284 163 - 2,447
Cost of sales (11,978) (6,201) - (18,179)
Marketing and distribution (6,960) (2,887) - (9,847)
Research and development (9,704) (1,588) - (11,292)
General and administration (1,620) (1,262) (543) (3,425)
Operating profit 13,242 304 (543) 13,003
Financing costs (839)
Other financial income (expense) 84
Profit before taxes 12,248
Income taxes (3,423)
Net income 8,825
Attributable to
- Roche shareholders 8,633
- Non-controlling interests 192
Earnings per share and non-voting equity security
Basic (CHF) 10.12
Diluted (CHF) 10.04

12
11. Roche Group core results reconciliation – Full Year 2017
in millions of CHF
IFR
S
Glo
bal
res
tru
ctu
rin
g
Inta
ngi
ble
s
amo
rtis
atio
n
Inta
ngi
ble
s
imp
airm
ent
All
ian
ces
& b
usi
nes
s
com
bin
atio
ns
Leg
al &
envi
ron
men
tal
Pen
sio
n p
lan
sett
lem
ents
Glo
bal
iss
ues
No
rmal
isat
ion
of
EC
P t
ax b
enef
it
Co
re
Sales 53,299 - - - - - - - - 53,299
Royalties and other operating income 2,447 - - - - - - - - 2,447
Cost of sales (18,179) 484 1,545 1,784 - - - - - (14,366)
Marketing and distribution (9,847) 326 9 - - - - - - (9,512)
Research and development (11,292) 87 137 676 - - - - - (10,392)
General and administration (3,425) 311 - 1,058 (350) (80) 22 - - (2,464)
Operating profit 13,003 1,208 1,691 3,518 (350) (80) 22 - - 19,012
Financing costs (839) 2 - - 14 4 - - - (819)
Other financial income (expense) 84 - - - (9) - - - - 75
Profit before taxes 12,248 1,210 1,691 3,518 (345) (76) 22 - - 18,268
Income taxes (3,423) (248) (513) (867) (2) 46 (4) 116 31 (4,864)
Net income 8,825 962 1,178 2,651 (347) (30) 18 116 31 13,404
Attributable to
- Roche shareholders 8,633 962 1,162 2,645 (347) (28) 18 116 31 13,192
- Non-controlling interests 192 - 16 6 - (2) - - - 212
EPS - diluted (CHF) 10.04 1.12 1.35 3.07 (0.40) (0.03) 0.02 0.13 0.04 15.34

13
12. Divisional core results reconciliation – Full Year 2017
in millions of
CHF
IFR
S
Glo
bal
res
tru
ctu
rin
g
Inta
ngi
ble
s
amo
rtis
atio
n
Inta
ngi
ble
s
imp
airm
ent
All
ian
ces
& b
usi
nes
s
com
bin
atio
ns
Leg
al &
envi
ron
men
tal
Pen
sio
n p
lan
sett
lem
ents
Co
re
Pharmaceuticals
Sales 41,220 - - - - - - 41,220
Royalties and
other operating
income
2,284 - - - - - - 2,284
Cost of sales (11,978) 377 1,230 1,664 - - - (8,707)
Marketing and
distribution (6,960) 234 6 - - - - (6,720)
Research and
development (9,704) 21 123 524 - - - (9,036)
General and
administration (1,620) 245 - 384 (324) (143) 18 (1,440)
Operating
profit 13,242 877 1,359 2,572 (324) (143) 18 17,601
Diagnostics
Sales 12,079 - - - - - - 12,079
Royalties and
other operating
income
163 - - - - - - 163
Cost of sales (6,201) 107 315 120 - - - (5,659)
Marketing and
distribution (2,887) 92 3 - - - - (2,792)
Research and
development (1,588) 66 14 152 - - - (1,356)
General and
administration (1,262) 27 - 674 (27) 58 4 (526)
Operating
profit 304 292 332 946 (27) 58 4 1,909
Corporate
General and
administration (543) 39 - - 1 5 - (498)
Operating
profit (543) 39 - - 1 5 - (498)

14
13. Roche Group consolidated balance sheet
in millions of CHF 31 December
2017
31 December
2016
Non-current assets
Property, plant and equipment 20,912 19,957
Goodwill 10,077 11,282
Intangible assets 8,368 12,046
Deferred tax assets 3,576 2,826
Defined benefit plan assets 801 738
Other non-current assets 1,370 1,300
Total non-current assets 45,104 48,149
Current assets
Inventories 7,407 7,928
Accounts receivable 9,577 8,760
Current income tax assets 348 335
Other current assets 2,243 2,540
Marketable securities 7,278 4,944
Cash and cash equivalents 4,719 4,163
Total current assets 31,572 28,670
Total assets 76,676 76,819
Non-current liabilities
Long-term debt (15,839) (16,992)
Net deferred tax liabilities (495) (838)
Defined benefit plan liabilities (7,421) (7,678)
Provisions (1,548) (1,777)
Other non-current liabilities (206) (532)
Total non-current liabilities (25,509) (27,817)
Current liabilities
Short-term debt (3,121) (5,363)
Current income tax liabilities (3,408) (2,713)
Provisions (2,042) (2,271)
Accounts payable (3,454) (3,375)
Other current liabilities (10,135) (8,878)
Total current liabilities (22,160) (22,600)
Total liabilities (47,669) (50,417)
Total net assets 29,007 26,402
Equity
Capital and reserves attributable to Roche
shareholders 26,441 23,911
Equity attributable to non-controlling interests 2,566 2,491
Total equity 29,007 26,402

15
14. Roche Group consolidated statement of cash flows
in millions of CHF
FY 2017 FY 2016
Cash flows from operating activities
Cash generated from operations 22,256 21,225
(Increase) decrease in net working capital 427 (1,023)
Payments made for defined benefit plans (538) (880)
Utilisation of provisions (621) (762)
Disposal of products 410 179
Other operating cash flows (1) -
Cash flows from operating activities, before income taxes paid 21,933 18,739
Income taxes paid (3,909) (3,738)
Total cash flows from operating activities 18,024 15,001
Cash flows from investing activities
Purchase of property, plant and equipment (3,509) (4,144)
Purchase of intangible assets (704) (1,001)
Disposal of property, plant and equipment 100 151
Disposal of intangible assets - -
Business combinations (280) (74)
Divestment of subsidiaries 11 -
Interest and dividends received 30 24
Sales of marketable securities 762 597
Purchases of marketable securities (319) (631)
Sales (purchases) of money market instruments and time accounts over
three months, net (2,612) 683
Other investing cash flows 62 (118)
Total cash flows from investing activities (6,459) (4,513)
Cash flows from financing activities
Proceeds from issue of bonds and notes 1,502 3,158
Redemption and repurchase of bonds and notes (3,068) (3,985)
Increase (decrease) in commercial paper (1,258) (454)
Increase (decrease) in other debt (385) (133)
Hedging and collateral arrangements 235 (211)
Changes in non-controlling interests - -
Equity contribution by non-controlling interests - capital injection 5 -
Interest paid (648) (849)
Dividends paid (7,140) (7,040)
Equity-settled equity compensation plans, net of transactions in own
equity (358) (557)
Other financing cash flows - -
Total cash flows from financing activities (11,115) (10,071)
Net effect of currency translation on cash and cash equivalents 106 15
Increase (decrease) in cash and cash equivalents 556 432
Cash and cash equivalents at beginning of period 4,163 3,731
Cash and cash equivalents at end of period 4,719 4,163