full year results - ir.aggreko.com
TRANSCRIPT

Full Year Results
For the year ending 31 December 2014

Agenda
2
Introduction
Ken Hanna, Chairman
Initial Impressions
Chris Weston, CEO
2014 Performance Review
Carole Cran, CFO
2015 Outlook
Carole Cran, CFO

3
IntroductionKen Hanna, Chairman

4
Initial ImpressionsChris Weston, CEO

5
2014 Performance ReviewCarole Cran, CFO

2014: a solid trading performance in a
challenging year
6
Highlights
• Strong growth in Americas and good growth in EMEA
• £200m return of value to shareholders
• Balance sheet remains strong at 0.9x net debt to EBITDA
Lowlights
• Challenging trading conditions in APAC
• Continuing to work through the challenges with our HFO product
• Difficult operating conditions in a number of our markets

Solid financial performance
7
Underlying revenue up 9%
Underlying trading profit down 2%
Underlying margin at 20%
EPS down 10% driven by currency
Dividend increase of 3%
£m FY14 FY13
Reported
Change
Underlying
Change
Revenue 1,577 1,573 -% 9%
Revenue excl.
pass-through fuel1,529 1,531 -% 9%
Trading profit 306 352 (13)% (2)%
Operating profit 310 358 (13)%
Net interest expense (21) (25) 15%
Profit before tax 289 333 (13)%
Tax (74) (87) 15%
Profit after tax 215 246 (13)%
Diluted earnings
per share82.5p 92.0p (10)%
Dividends per
share (declared)27.1p 26.3p 3%
Underlying excludes pass-through fuel and currency translation.

Solid performance in Local;
underlying revenue up 8%
Good performance in Power
Projects; underlying revenue
up 10%
Broadly in line with strategic
targets
Underlying growth across both businesses
8
Revenue Trading profit
FY14
£m
FY13
£m
Underlying
%
FY14
£m
FY13
£m
Underlying
%
Local Business 904 838 8% 139 144 (4)%
Trading Margin: 16% 17%
ROCE: 15% 17%
Power Projects
(ex fuel)625 567 10% 170 170 -%
Trading Margin: 27% 30%
ROCE: 25% 27%
Total
(ex fuel)1,529 1,405 9% 309 314 (2)%
Trading Margin: 20% 22%
ROCE: 19% 21%
Underlying excludes pass-through fuel and currency translation.

Strong performance in the Americas
9
Local business underlying revenue
up 12%
Power Projects revenue up 39%
despite £20m military reduction
Underlying margins and returns stable
Good start to 2015 with contract awards
Monitoring potential impact of lower
oil price
£m FY14 FY13
Reported
Change
Underlying
Change
Local 457 445 3% 12%
Power Projects 227 200 13% 39%
Revenue 684 645 6% 19%
Trading Profit 141 147 (4)% 17%
Trading Margin 21% 23%
ROCE 19% 20%
6%5%
4%
21%
13%5%
34%
3%9%
Events
Services
Mining
Oil & Gas
Petrochemical & Refining
Manufacturing
Utilities
Military
Other
Revenue by sector FY14
Underlying excludes currency translation

Challenging year in APAC
10
13%
7%
4%4%
59%
13%Mining
Oil & Gas
Construction
Contracting
Utilities
Other
Revenue by sector FY14
Underlying excludes currency translation
£m FY14 FY13
Reported
Change
Underlying
Change
Local 105 128 (18)% (9)%
Power Projects 141 175 (20)% (15)%
Revenue 246 303 (19)% (13)%
Trading Profit 49 91 (46)% (42)%
Trading Margin 20% 30%
ROCE 16% 25%
Local business underlying revenue
down 9%
Power Projects underlying revenue
down 15%, down 9% excluding Japan
Substantial decline in margins
and returns
Solid start to 2015 with contract award
and extension

£m FY14 FY13
Reported
Change
Underlying
Change
Local 341 331 3% 9%
Power Projects 258 252 3% 8%
Revenue 599 583 3% 9%
Trading Profit 119 116 2% 10%
Trading Margin 20% 20%
ROCE 21% 21%
Good performance in EMEA
11
Local business underlying revenue
up 9%
Power Projects underlying revenue
up 8% and good level of contract awards
Margins and returns stable
Difficult operating environment remains
Good start to 2015 with events contract
award and multi year contract extension7%
5%4%
15%
5%5%43%
5%
11%Events
Services
Mining
Oil & Gas
Construction
Contracting
Utilities
Manufacturing
Other
Underlying excludes currency translation and pass through fuel
Revenue by sector FY14

Working capital outflow driven by
debtors
Capex around 1x depreciation
£200m return of value in Q2 2014
Solid operating cashflow
12
£m FY14 FY13
Operating Profit 310 358
Depreciation 262 278
EBITDA 572 636
Working Capital (73) (25)
Other (1) (8)
Operating Cash Flow 498 603
Tax (77) (68)
Net Interest (20) (26)
Purchase of Fixed Assets (251) (228)
Proceeds from Fixed Asset Disposals 12 14
Acquisitions (4) -
Free Cash Flow 158 295
Dividends (70) (66)
Return of Value & Changes in Equity (195) -
Net Cash Flow (107) 229
Exchange (24) 1
Movement in Net Debt (131) 230

2013
2014
DieselGasHFO
2013
2014
DieselGasHFO
Fleet utilisation continues to improve
13
Power Projects and Local utilisation
continued to improve
£14m of Local business capex
funded from PP
290 refurbishments in FY14
Power Projects Fleet
At 31 December (MW)
Local Business Fleet
At 31 December (MW)
Local
Business
Power
Projects
FY14 FY13 FY14 FY13
Average
utilisation61% 60% 76% 74%
Fleet Capex /
Fleet
Depreciation
119% 74% 64% 85%
Fleet Capex £152m £97m £74m £108m
4,814
4,622
4,881
5,032

14
2015 OutlookCarole Cran, CFO

What is the implication of a lower oil price for a
sustained period?
15
Little impact to date; analysing medium term implications
TailwindsFuel component of
temporary power is
cheaper (c.50% if
running diesel)
Financing ability for
permanent power
reduced for oil exporting
countries
Boosts other industries
which are GDP driven
e.g. petrochemical and
refining
Facts17% of Group revenue
from oil & gas sector
c.40% of that is from US
shale
c.80% of North America
oil & gas revenue is from
production
Number of customers
have hedged fuel
positions for next 6-12
months
Break-even price of
shale is expected to fall
due to ongoing efficiency
gains
HeadwindsReductions being seen in
exploration capex
Some early signs of
pricing pressure
Low oil prices may have
an adverse impact on
emerging market GDP
growth, particularly for
commodity exporters
FX rates have moved
against many emerging
market countries

OutlooUnderlying trading profit broadly in line
with last year
16
We are encouraged by the Group’s performance at this early stage
Little impact to date from lower oil price, could be headwind later in year
Security challenges remain in a number of our markets, particularly Libya
We currently expect full year underlying trading profit to be broadly in line with 2014

17
Appendix

Diverse customer base
18
6%4%
3%4%
6%
17%
5%2%
42%
2%
2% 7%
Events
Construction
Contracting
Services
Quarrying and mining
Oil & Gas
Manufacturing
Shipping
Utilities
Other
Military
Petrochemical and refining
Revenue £1,529mFY14 Group Revenue (excl. pass-
through fuel)
22%
• Utilities 42% of revenue, Power
Projects driven
• Top 5 customers contribute 17%
of revenue
• Oil & gas biggest sector in Local

Balanced geographic spread
19
22%
15%
9%17%
16%
21%
North America
Europe
Middle East
Africa
Asia & Australasia
Latin America
Revenue £1,529mFY14 Group Revenue (excl. pass-
through fuel)
22%

Stable revenue mix
20
Revenue % of Revenue (ex fuel)
FY14
£m
FY13
£m
Underlying1
%
FY14
£m
FY13
£m
Change pp
Power 1,062 1,086 8% 70% 71% (1)
Temperature Control 119 124 2% 8% 8% -
Oil-Free Air 29 30 1% 2% 2% -
Total Rental 1,210 1,240 7% 80% 81% (1)
Service Revenue 319 291 18% 20% 19% 1
Revenue excl pass-
through fuel1,529 1,531 9% 100% 100% -
Pass-through fuel 48 42 NA
Total Revenue 1,577 1,573 9%
1 Excluding revenue from pass–through fuel and currency.

Declining impact from Military & Japan
21
Military & Japan not
mainstream
Japan was a “black swan
event”
Military has been declining
since 2009
Combined 4% of PP revenue
in 2015e
0%
5%
10%
15%
20%
25%
$0m
$20m
$40m
$60m
$80m
$100m
$120m
$140m
$160m
$180m
2007 2008 2009 2010 2011 2012 2013 2014 2015e
Military Japan % of Power Projects
Japan and Military Revenue
Japan and Military Revenue Power Projects Revenue

Strength relative to covenants
Tax rate stable at 26%
ROCE 2pp lower, healthy 19%
Strong ratios maintained
22
FY14 FY13
EBITDA £572m £636m
Capital investment £251m £228m
Net borrowings £494m £363m
Interest cover – EBITDA basis 27x 26x
Net debt to EBITDA 0.9x 0.6x
Effective tax rate 26% 26%
Dividend Cover (declared basis) 3.0x 3.5x
Return on average capital employed 19% 21%

Strong balance sheet
23
FY14
£m
FY13
£m
Intangible assets/goodwill 148 151
Tangible fixed assets 1,177 1,165
Working capital 334 266
Retirement benefit obligation (7) (6)
Derivative financial instruments (3) 2
Provisions for taxes (77) (75)
Net borrowings (494) (363)
Net Assets 1,078 1,140
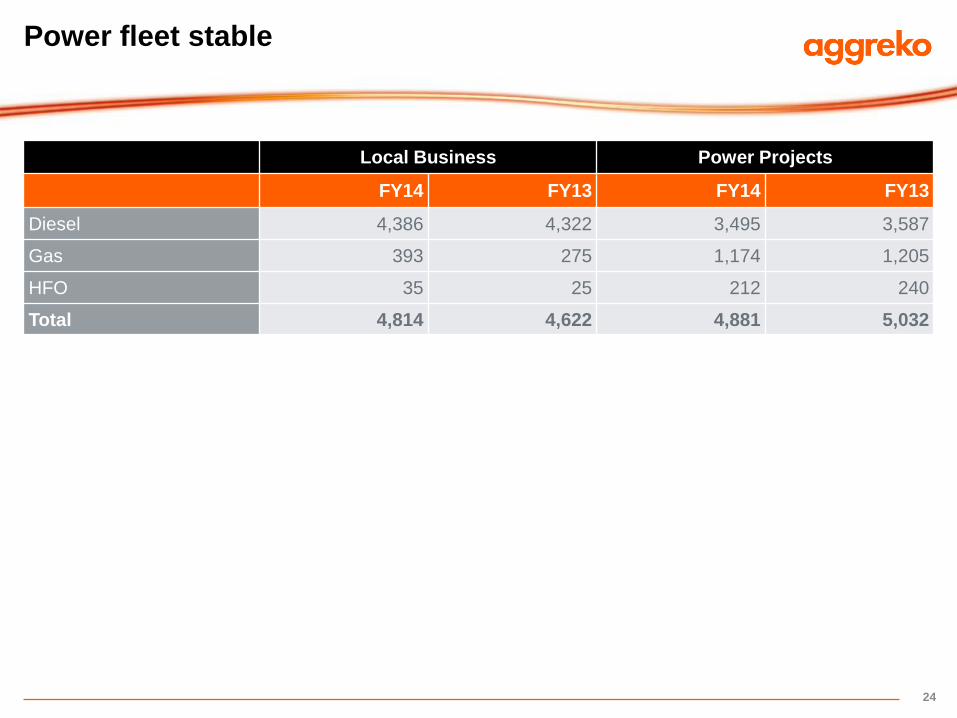
Power fleet stable
24
Local Business Power Projects
FY14 FY13 FY14 FY13
Diesel 4,386 4,322 3,495 3,587
Gas 393 275 1,174 1,205
HFO 35 25 212 240
Total 4,814 4,622 4,881 5,032

Broadly in line with strategic targets
25
1 These are averages over a five year period and there will be years when we may be outside one of these ranges. Revenue growth is underlying, i.e. excluding London Olympics,
Poit acquisition, pass-through fuel and currency translation and adjusted to exclude Military and Japan. Margin and ROCE targets are on a reported basis post amortisation.
Local • Superior service
• Utilise global scale for
efficiency
• Increase market share and
extend presence in emerging
markets
Revenue growth: 8-12%
Margin: 17-20%
ROCE: 18-21%
Revenue growth: 8%
Margin: 16%
ROCE: 15%
Power projects • Grow to secure operating
efficiencies and competitive
advantage
• Be the largest global operator
• Develop technology to make
temporary power competitive
with permanent power
Revenue growth: 10-15%
Margin: 27-32%
ROCE: 25-30%
Revenue growth: 18%
Margin: 27%
ROCE: 25%
Group • To be the leading global
provider of temporary power
and temperature control
Revenue growth: >10%
Margin: > 20%
ROCE: > 20%
Revenue growth: 12%
Margin: 19%
ROCE: 19%
Strategy FY14 PerformanceTargets1

Currently foreign exchange tailwind for 2015
26
Note: UAE Dirhams included within US Dollar as it is pegged to the US dollar; Argentinian Peso includes Power Projects
contracts which are pegged to the US Dollar but paid and reported in Argentinian Pesos.
FX Rates Revenue (£m)
FY14
£m
February
2015
Closing
FY14 Actual FY14 Actual
at February
2015 Rates
Variance % Variance
US Dollar 1.65 1.54 1,013 1,081 68 7%
Euro 1.24 1.36 93 85 (8) (9)%
Australian Dollar 1.83 1.98 65 60 (5) (8)%
Argentinian Peso 13.37 13.42 88 87 (1) (1)%
Brazilian Real 3.87 4.41 73 64 (9) (12)%
Canadian Dollar 1.82 1.93 41 39 (2) (6)%
Russian Rouble 62.98 96.27 31 20 (11) (35)%
Other 173 171 (2) (1)%
Total Revenue 1,577 1,607 30 2%
Total Trading Profit 306 313 7 2%

Disclaimer
27
The information contained in this presentation has largely been extracted
from the Results Announcement for the year ended 31st December 2014.
This presentation may contain certain “forward-looking” statements. By their
nature, forward-looking statements involve risk and uncertainty because they
relate to future events and circumstances. Actual outcomes and results may
differ materially from any outcomes or results expressed or implied by such
forward-looking statements. Any forward-looking statements made by or on
behalf of Aggreko speak only as of the date they are made and no
representation or warranty is given in relation to them, including as to their
completeness or accuracy or the basis on which they were prepared.
This presentation is published solely for information purposes.
The distribution of this presentation in jurisdictions other than the UK may be
restricted by law and therefore any persons who are subject to the laws of
any jurisdiction other than the UK should inform themselves about, and
observe, any applicable requirements.
All opinions expressed in this presentation are subject to change without
notice and may differ from opinions expressed elsewhere.