full-year results presentation 2016 - efg internationalcb0bb93e... · exclude bsi related...
TRANSCRIPT
Full-year results presentation 2016
Zurich, 15 March 2017
2
Important Legal Disclaimer
This document has been prepared by EFG International AG (“EFG") solely for use by you for general information only and
does not contain and is not to be taken as containing any securities advice, recommendation, offer or invitation to subscribe
for or purchase or redemption of any securities regarding EFG.
This presentation contains specific forward-looking statements, e.g. statements which include terms like "believe", "assume",
"expect", "target" or similar expressions. Such forward-looking statements represent EFG’s judgments and expectations and
are subject to known and unknown risks, uncertainties and other factors which may result in a substantial divergence
between the actual results, the financial situation, and/or the development or performance of the company and those
explicitly or implicitly presumed in these statements. These factors include, but are not limited to: (i) the ability to successfully
integrate BSI and realize expected synergies, (2) general market, macroeconomic, governmental and regulatory trends, (3)
movements in securities markets, exchange rates and interest rates, (4) competitive pressures, and (5) other risks and
uncertainties inherent in the business of EFG and its subsidiaries, including BSI group. EFG is not under any obligation to
(and expressly disclaims any such obligation to) update or alter its forward-looking statements, whether as a result of new
information, future events or otherwise, except as required by applicable law or regulation.
Nothing contained herein is, or shall be relied on as, a promise or representation as to the future performance of EFG and its
subsidiaries, including BSI. EFG and BSI as a combined group may not realize the full benefits of the contemplated
transaction, including the expected synergies, cost savings or growth opportunities within the anticipated time frame or at all.
3
Agenda
Introduction
Financial performance
Outlook, conclusion
Q&A
Joachim H. Straehle, CEO EFG International
Giorgio Pradelli, Deputy CEO & CFO EFG International
Joachim H. Straehle
All
4
Introduction
5
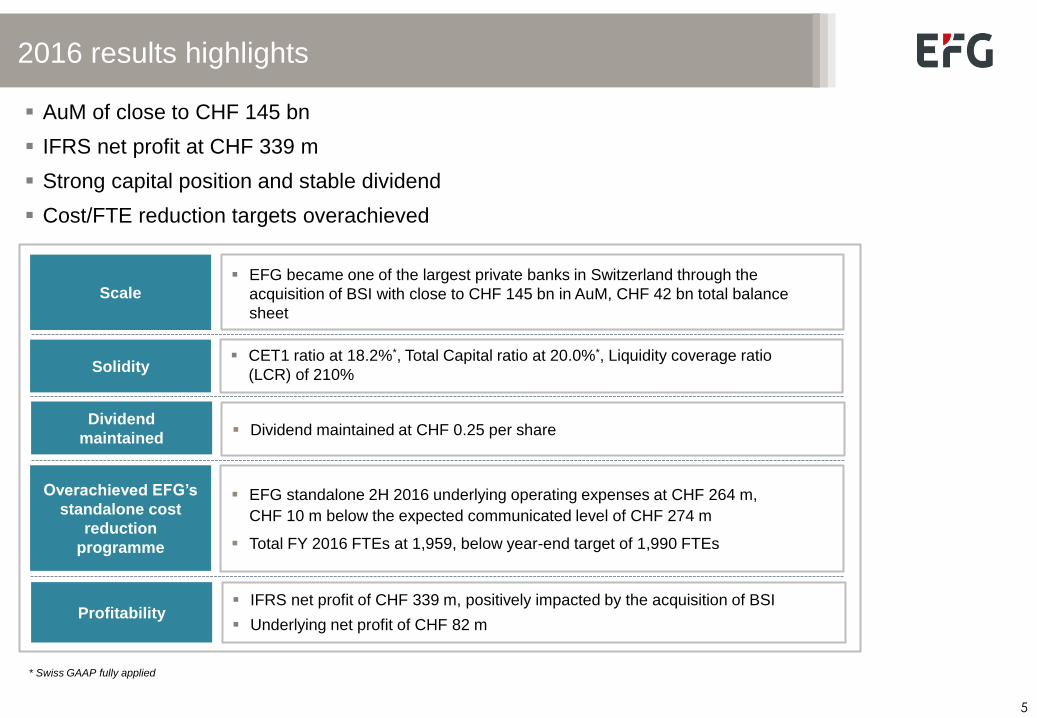
2016 results highlights
Scale
Profitability
EFG became one of the largest private banks in Switzerland through the
acquisition of BSI with close to CHF 145 bn in AuM, CHF 42 bn total balance
sheet
IFRS net profit of CHF 339 m, positively impacted by the acquisition of BSI
Underlying net profit of CHF 82 m
Overachieved EFG’s
standalone cost
reduction
programme
AuM of close to CHF 145 bn
IFRS net profit at CHF 339 m
Strong capital position and stable dividend
Cost/FTE reduction targets overachieved
EFG standalone 2H 2016 underlying operating expenses at CHF 264 m,
CHF 10 m below the expected communicated level of CHF 274 m
Total FY 2016 FTEs at 1,959, below year-end target of 1,990 FTEs
Solidity CET1 ratio at 18.2%*, Total Capital ratio at 20.0%*, Liquidity coverage ratio
(LCR) of 210%
Dividend
maintained Dividend maintained at CHF 0.25 per share
* Swiss GAAP fully applied
6
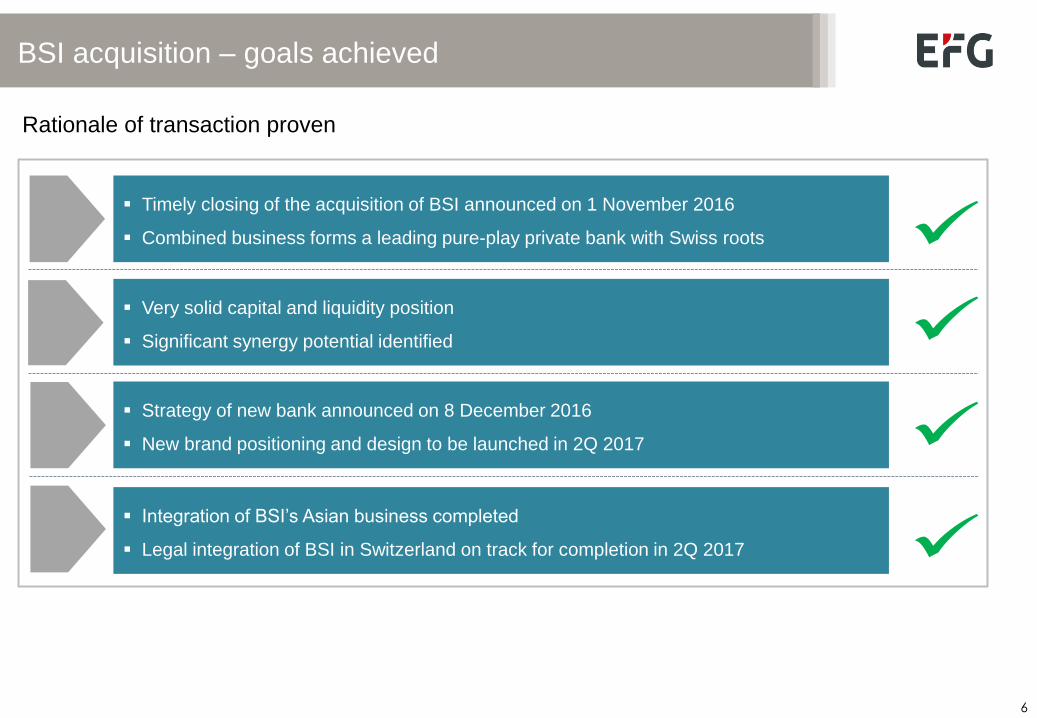
BSI acquisition – goals achieved
Timely closing of the acquisition of BSI announced on 1 November 2016
Combined business forms a leading pure-play private bank with Swiss roots
Very solid capital and liquidity position
Significant synergy potential identified
Strategy of new bank announced on 8 December 2016
New brand positioning and design to be launched in 2Q 2017
Integration of BSI’s Asian business completed
Legal integration of BSI in Switzerland on track for completion in 2Q 2017
Rationale of transaction proven
7
Financial performance
EFG standalone
BSI standalone
EFG-BSI combined
8
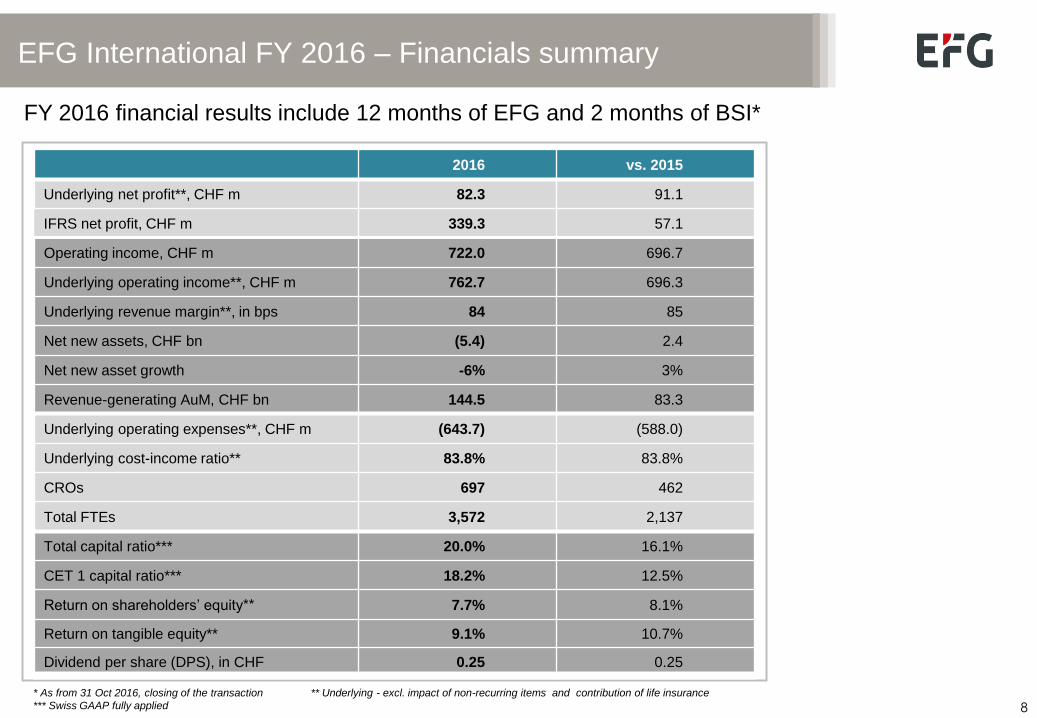
EFG International FY 2016 – Financials summary
2016 vs. 2015
Underlying net profit**, CHF m 82.3 91.1
IFRS net profit, CHF m 339.3 57.1
Operating income, CHF m 722.0 696.7
Underlying operating income**, CHF m 762.7 696.3
Underlying revenue margin**, in bps 84 85
Net new assets, CHF bn (5.4) 2.4
Net new asset growth -6% 3%
Revenue-generating AuM, CHF bn 144.5 83.3
Underlying operating expenses**, CHF m (643.7) (588.0)
Underlying cost-income ratio** 83.8% 83.8%
CROs 697 462
Total FTEs 3,572 2,137
Total capital ratio*** 20.0% 16.1%
CET 1 capital ratio*** 18.2% 12.5%
Return on shareholders’ equity** 7.7% 8.1%
Return on tangible equity** 9.1% 10.7%
Dividend per share (DPS), in CHF 0.25 0.25
* As from 31 Oct 2016, closing of the transaction ** Underlying - excl. impact of non-recurring items and contribution of life insurance
*** Swiss GAAP fully applied
FY 2016 financial results include 12 months of EFG and 2 months of BSI*
9
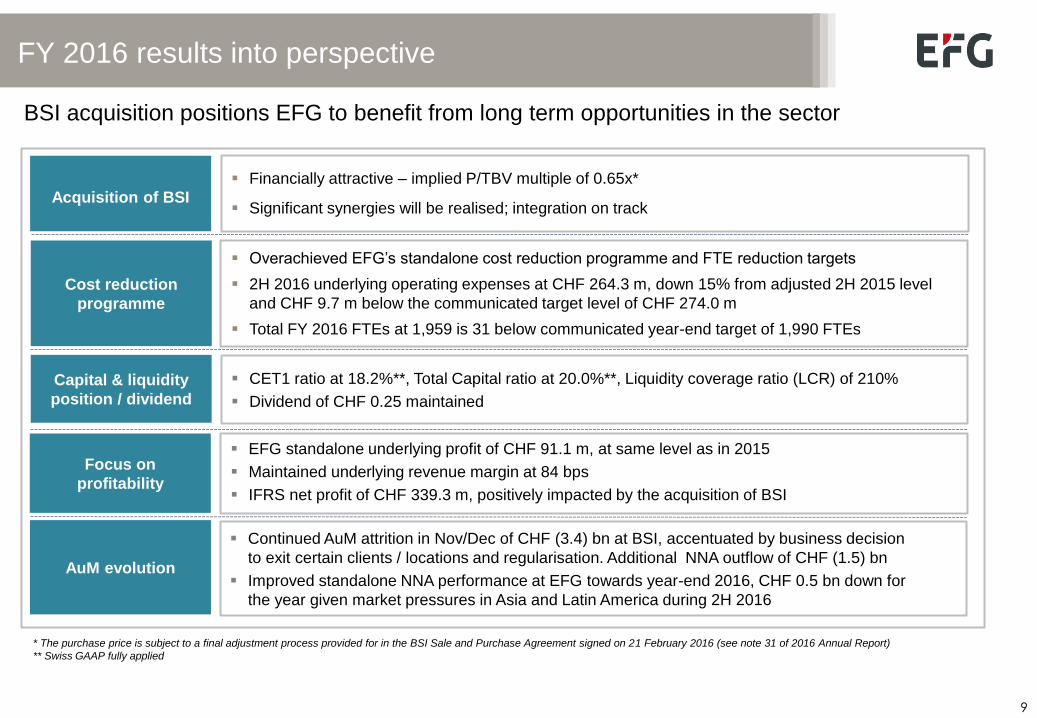
FY 2016 results into perspective
Acquisition of BSI
Financially attractive – implied P/TBV multiple of 0.65x*
Significant synergies will be realised; integration on track
Cost reduction
programme
Overachieved EFG’s standalone cost reduction programme and FTE reduction targets
2H 2016 underlying operating expenses at CHF 264.3 m, down 15% from adjusted 2H 2015 level
and CHF 9.7 m below the communicated target level of CHF 274.0 m
Total FY 2016 FTEs at 1,959 is 31 below communicated year-end target of 1,990 FTEs
Capital & liquidity
position / dividend
CET1 ratio at 18.2%**, Total Capital ratio at 20.0%**, Liquidity coverage ratio (LCR) of 210%
Dividend of CHF 0.25 maintained
Focus on
profitability
EFG standalone underlying profit of CHF 91.1 m, at same level as in 2015
Maintained underlying revenue margin at 84 bps
IFRS net profit of CHF 339.3 m, positively impacted by the acquisition of BSI
AuM evolution
Continued AuM attrition in Nov/Dec of CHF (3.4) bn at BSI, accentuated by business decision
to exit certain clients / locations and regularisation. Additional NNA outflow of CHF (1.5) bn
Improved standalone NNA performance at EFG towards year-end 2016, CHF 0.5 bn down for
the year given market pressures in Asia and Latin America during 2H 2016
* The purchase price is subject to a final adjustment process provided for in the BSI Sale and Purchase Agreement signed on 21 February 2016 (see note 31 of 2016 Annual Report)
** Swiss GAAP fully applied
BSI acquisition positions EFG to benefit from long term opportunities in the sector
10
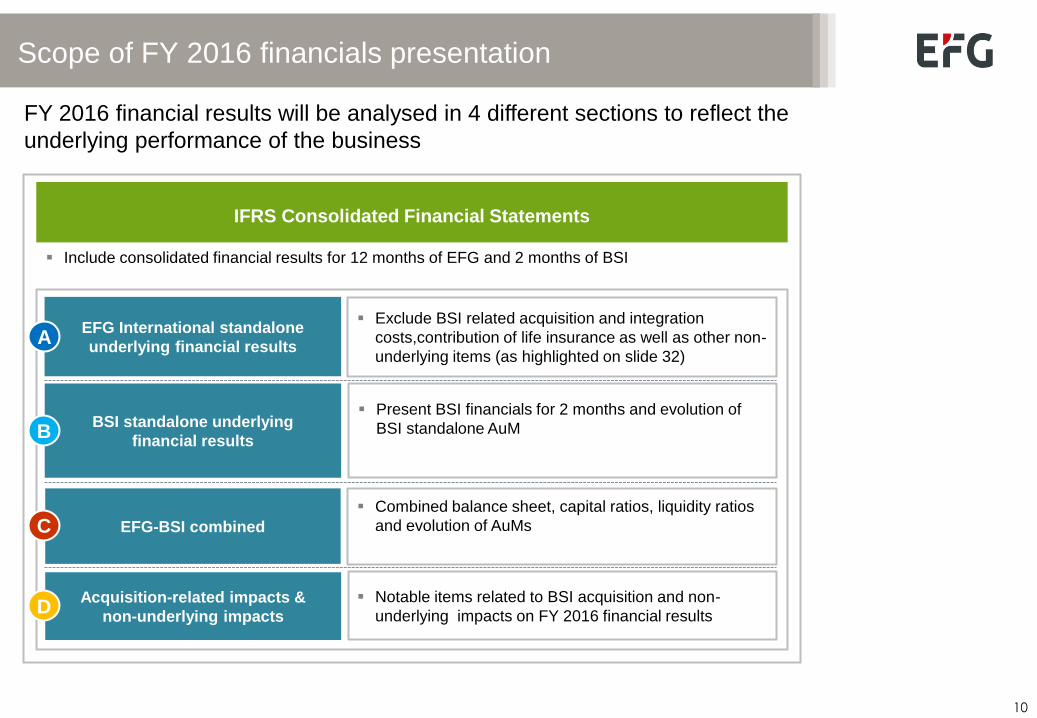
Scope of FY 2016 financials presentation
FY 2016 financial results will be analysed in 4 different sections to reflect the
underlying performance of the business
IFRS Consolidated Financial Statements
EFG International standalone
underlying financial results
Include consolidated financial results for 12 months of EFG and 2 months of BSI
Exclude BSI related acquisition and integration
costs,contribution of life insurance as well as other non-
underlying items (as highlighted on slide 32)
EFG-BSI combined
Acquisition-related impacts &
non-underlying impacts
BSI standalone underlying
financial results
Present BSI financials for 2 months and evolution of
BSI standalone AuM
Combined balance sheet, capital ratios, liquidity ratios
and evolution of AuMs
Notable items related to BSI acquisition and non-
underlying impacts on FY 2016 financial results
A
B
D
C
11
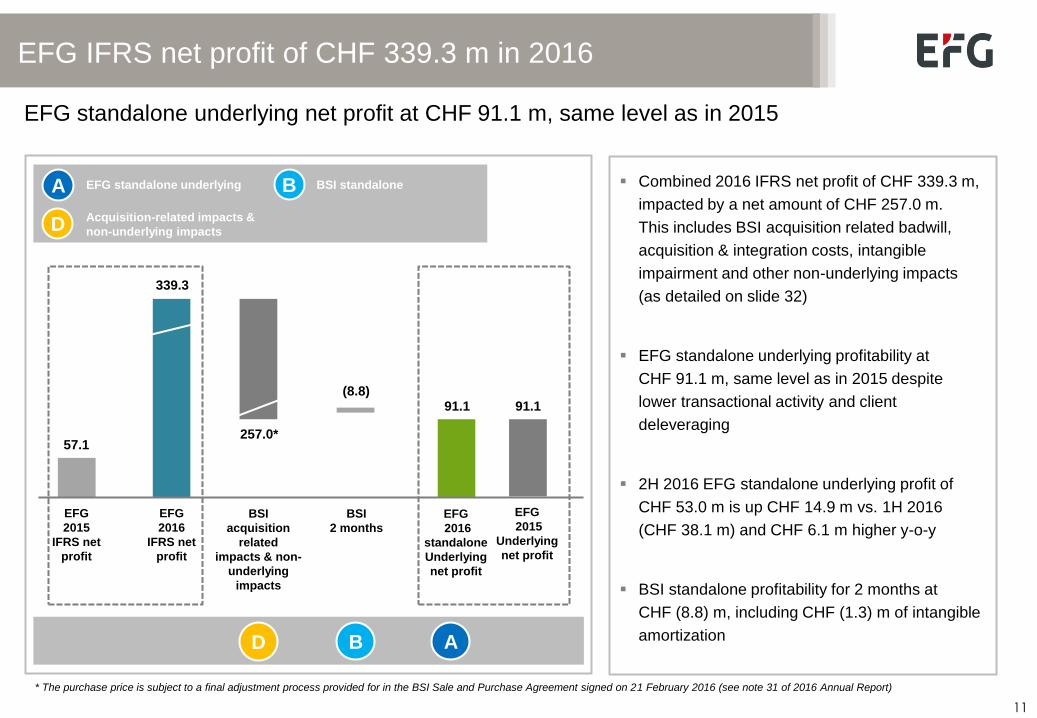
EFG IFRS net profit of CHF 339.3 m in 2016
EFG standalone underlying net profit at CHF 91.1 m, same level as in 2015
Combined 2016 IFRS net profit of CHF 339.3 m,
impacted by a net amount of CHF 257.0 m.
This includes BSI acquisition related badwill,
acquisition & integration costs, intangible
impairment and other non-underlying impacts
(as detailed on slide 32)
EFG standalone underlying profitability at
CHF 91.1 m, same level as in 2015 despite
lower transactional activity and client
deleveraging
2H 2016 EFG standalone underlying profit of
CHF 53.0 m is up CHF 14.9 m vs. 1H 2016
(CHF 38.1 m) and CHF 6.1 m higher y-o-y
BSI standalone profitability for 2 months at
CHF (8.8) m, including CHF (1.3) m of intangible
amortization
D
EFG standalone underlying
Acquisition-related impacts &
non-underlying impacts
339.3
EFG
2016
IFRS net
profit
257.0*
BSI
acquisition
related
impacts & non-
underlying
impacts
EFG
2016
standalone
Underlying
net profit
BSI
2 months
(8.8) 91.1
A B D
57.1
EFG
2015
IFRS net
profit
EFG
2015
Underlying
net profit
91.1
BSI standalone A B
* The purchase price is subject to a final adjustment process provided for in the BSI Sale and Purchase Agreement signed on 21 February 2016 (see note 31 of 2016 Annual Report)
12
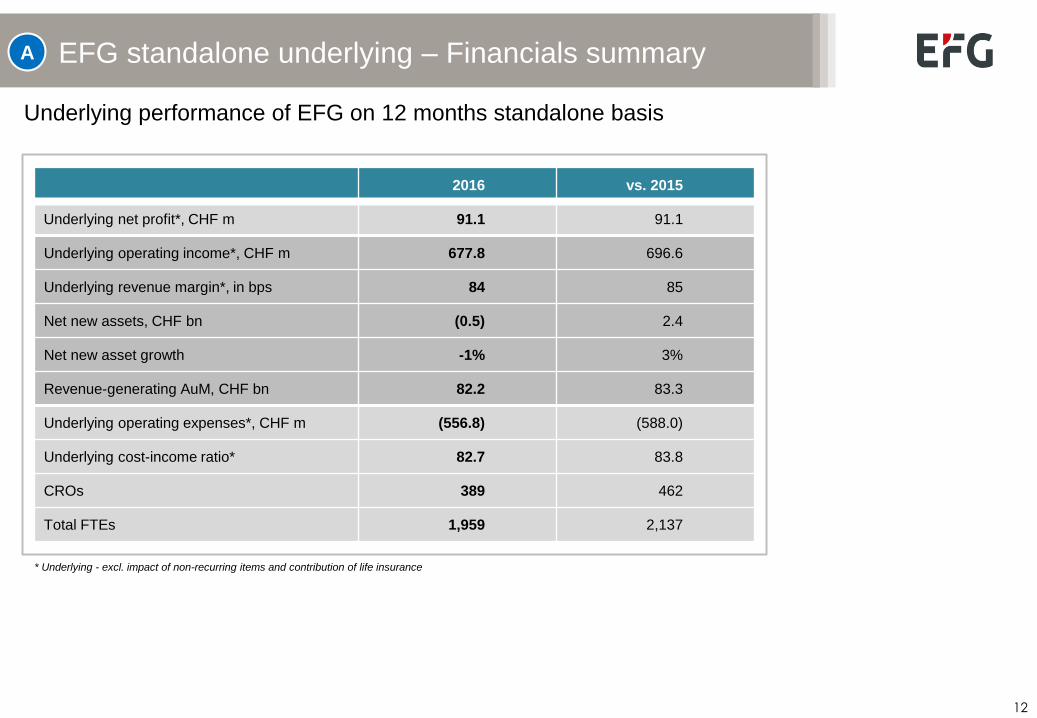
EFG standalone underlying – Financials summary
* Underlying - excl. impact of non-recurring items and contribution of life insurance
2016 vs. 2015
Underlying net profit*, CHF m 91.1 91.1
Underlying operating income*, CHF m 677.8 696.6
Underlying revenue margin*, in bps 84 85
Net new assets, CHF bn (0.5) 2.4
Net new asset growth -1% 3%
Revenue-generating AuM, CHF bn 82.2 83.3
Underlying operating expenses*, CHF m (556.8) (588.0)
Underlying cost-income ratio* 82.7 83.8
CROs 389 462
Total FTEs 1,959 2,137
A
Underlying performance of EFG on 12 months standalone basis
13
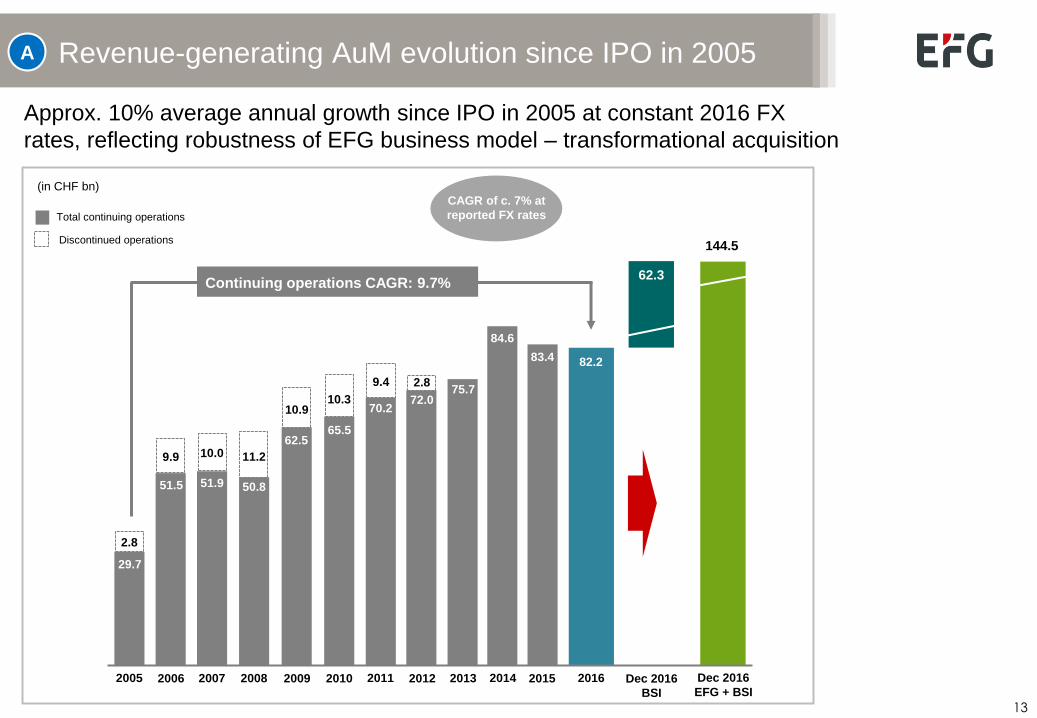
Revenue-generating AuM evolution since IPO in 2005
Approx. 10% average annual growth since IPO in 2005 at constant 2016 FX
rates, reflecting robustness of EFG business model – transformational acquisition
Continuing operations CAGR: 9.7%
2005 2006 2007 2008 2009 2010 2011 2012 2013 2014 2015
83.4
84.6
75.7 72.0
70.2
65.5 62.5
50.8 51.9 51.5
29.7
2.8
9.9 10.0 11.2
10.9 10.3
9.4 2.8
2016
82.2
Dec 2016
EFG + BSI
144.5
A
CAGR of c. 7% at
reported FX rates Total continuing operations
Discontinued operations
62.3
(in CHF bn)
Dec 2016
BSI
14
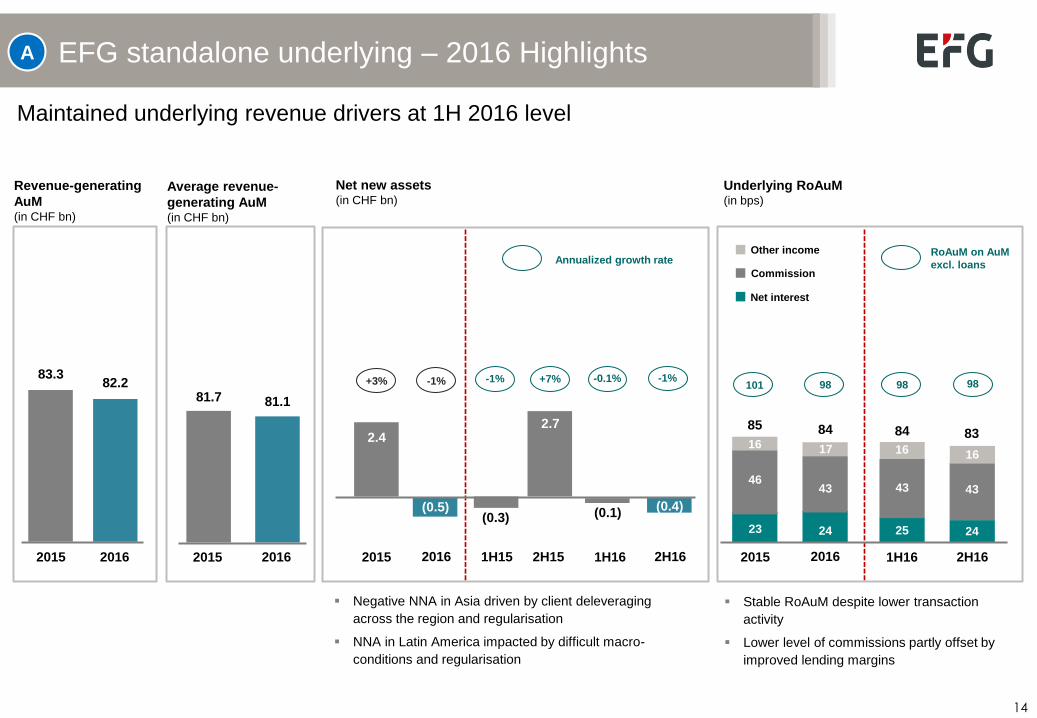
EFG standalone underlying – 2016 Highlights
Maintained underlying revenue drivers at 1H 2016 level
Net new assets (in CHF bn)
Underlying RoAuM (in bps)
Annualized growth rate
+7% -0.1%
1H16 2H15
(0.3)
2.7
(0.1)
-1%
1H15
Revenue-generating
AuM (in CHF bn)
2015 2016
83.3 82.2
Average revenue-
generating AuM (in CHF bn)
2015
81.7
2016
81.1
2H16
(0.4)
-1%
Negative NNA in Asia driven by client deleveraging
across the region and regularisation
NNA in Latin America impacted by difficult macro-
conditions and regularisation
Net interest
Commission
Other income
2015
23
46
16
85
1H16
25
43
84
16
2016
24
43
84
17
83
2H16
24
43
16
98 98 98
RoAuM on AuM
excl. loans
101
2016
-1%
2015
2.4
+3%
(0.5)
A
Stable RoAuM despite lower transaction
activity
Lower level of commissions partly offset by
improved lending margins
15
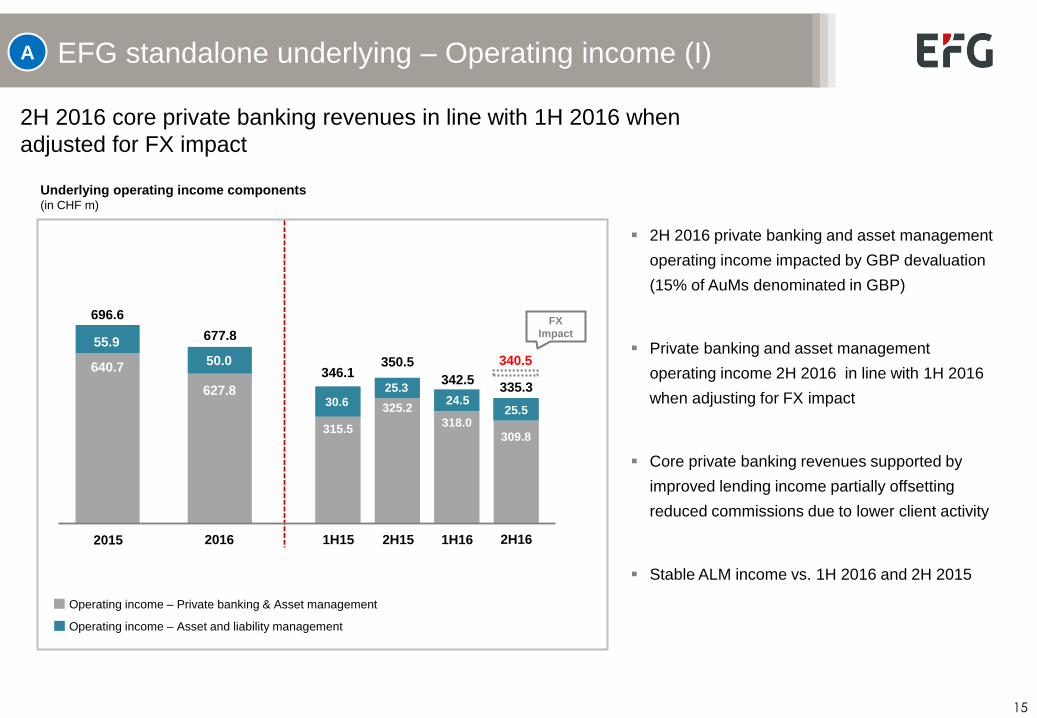
EFG standalone underlying – Operating income (I)
2H 2016 private banking and asset management
operating income impacted by GBP devaluation
(15% of AuMs denominated in GBP)
Private banking and asset management
operating income 2H 2016 in line with 1H 2016
when adjusting for FX impact
Core private banking revenues supported by
improved lending income partially offsetting
reduced commissions due to lower client activity
Stable ALM income vs. 1H 2016 and 2H 2015
Underlying operating income components (in CHF m)
Operating income – Private banking & Asset management
Operating income – Asset and liability management
2015
640.7
55.9
696.6
2016
627.8
50.0
677.8
1H15
13.1
2H15
299.7
1H16
315.5
346.1
30.6
2H16
325.2
350.5
25.3
318.0
342.5
24.5
309.8
335.3
25.5
A
340.5
2H 2016 core private banking revenues in line with 1H 2016 when
adjusted for FX impact
FX
Impact
16
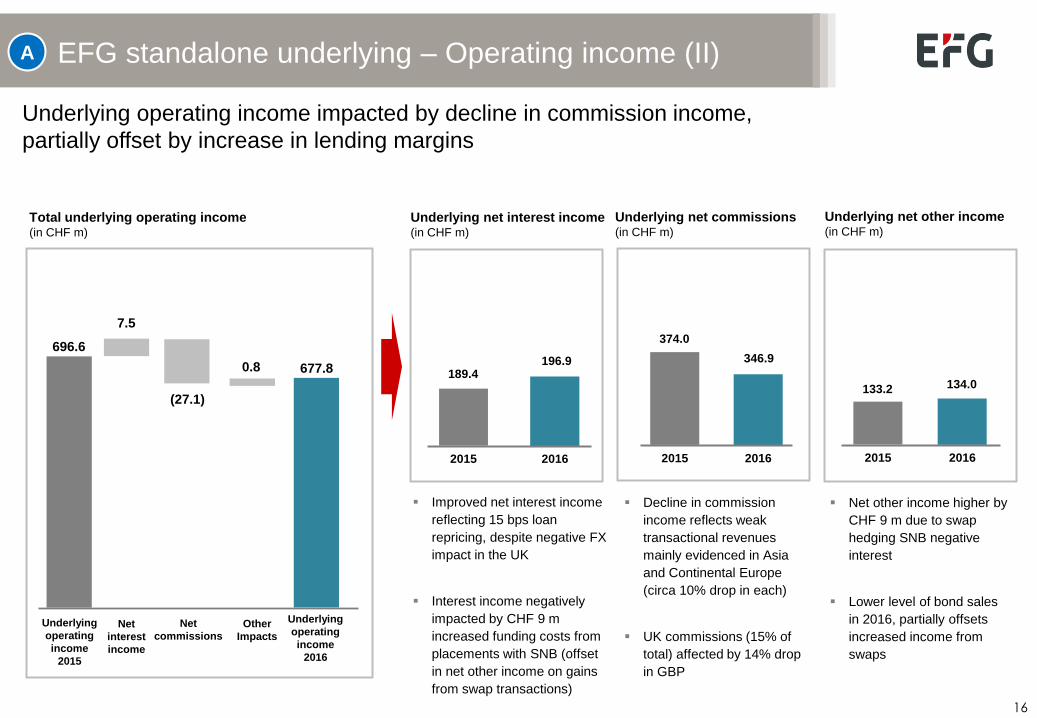
EFG standalone underlying – Operating income (II)
Underlying operating income impacted by decline in commission income,
partially offset by increase in lending margins
Underlying net other income (in CHF m)
Total underlying operating income (in CHF m)
Underlying net commissions (in CHF m)
Net other income higher by
CHF 9 m due to swap
hedging SNB negative
interest
Lower level of bond sales
in 2016, partially offsets
increased income from
swaps
Decline in commission
income reflects weak
transactional revenues
mainly evidenced in Asia
and Continental Europe
(circa 10% drop in each)
UK commissions (15% of
total) affected by 14% drop
in GBP
A
2015 2016
346.9
374.0
2015 2016
134.0 133.2
Underlying
operating
income
2015
696.6
0.8
Other
Impacts
677.8
Underlying
operating
income
2016
7.5
Net
interest
income
(27.1)
Net
commissions
Underlying net interest income (in CHF m)
2015 2016
196.9 189.4
Improved net interest income
reflecting 15 bps loan
repricing, despite negative FX
impact in the UK
Interest income negatively
impacted by CHF 9 m
increased funding costs from
placements with SNB (offset
in net other income on gains
from swap transactions)
17
EFG cost reduction programme – operating expenses
1H 2015
291.0 292.5
1H 2016
264.3
2H 2016
297.0
2H 2015
15.0
Full year effect
of 2H 2015
hirings
312.0
Adjusted
2H 2015
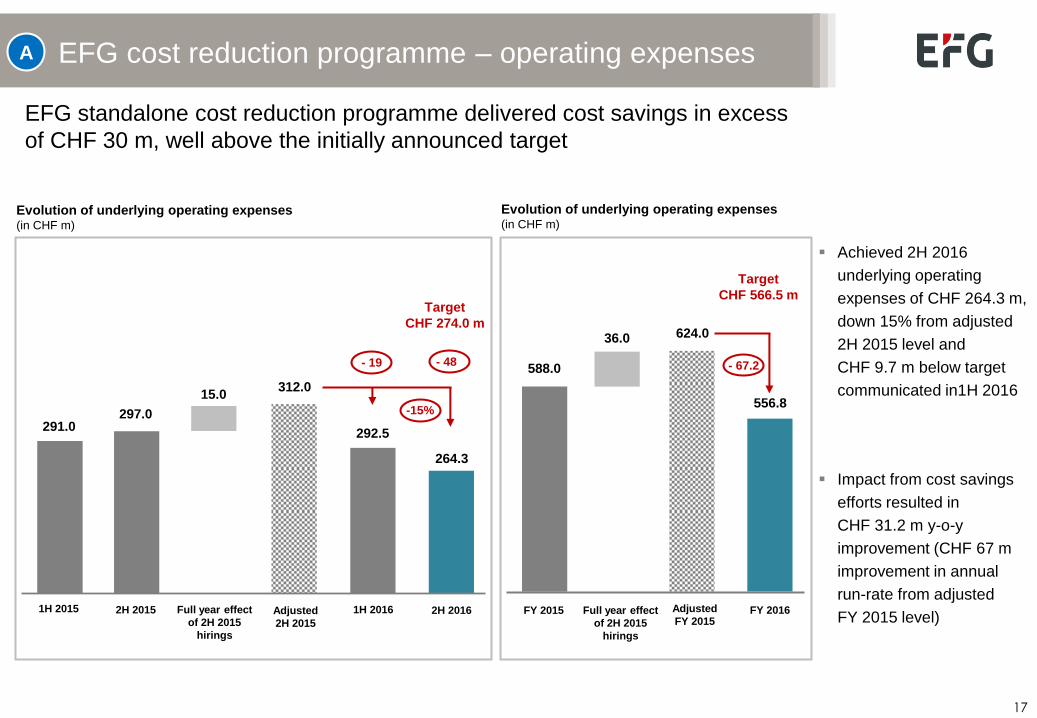
EFG standalone cost reduction programme delivered cost savings in excess
of CHF 30 m, well above the initially announced target
Evolution of underlying operating expenses (in CHF m)
FY 2015
588.0
556.8
FY 2016
36.0
Full year effect
of 2H 2015
hirings
624.0
Adjusted
FY 2015
Evolution of underlying operating expenses (in CHF m)
- 19 - 48 - 67.2
-15%
A
Achieved 2H 2016
underlying operating
expenses of CHF 264.3 m,
down 15% from adjusted
2H 2015 level and
CHF 9.7 m below target
communicated in1H 2016
Impact from cost savings
efforts resulted in
CHF 31.2 m y-o-y
improvement (CHF 67 m
improvement in annual
run-rate from adjusted
FY 2015 level)
Target
CHF 274.0 m
Target
CHF 566.5 m
18
Update on EFG standalone FTE reduction initiative
63
Net new
hires
(287)
Impact
cost
reduction
programme
Evolution of FTEs
Actual
1,959
Dec 2016
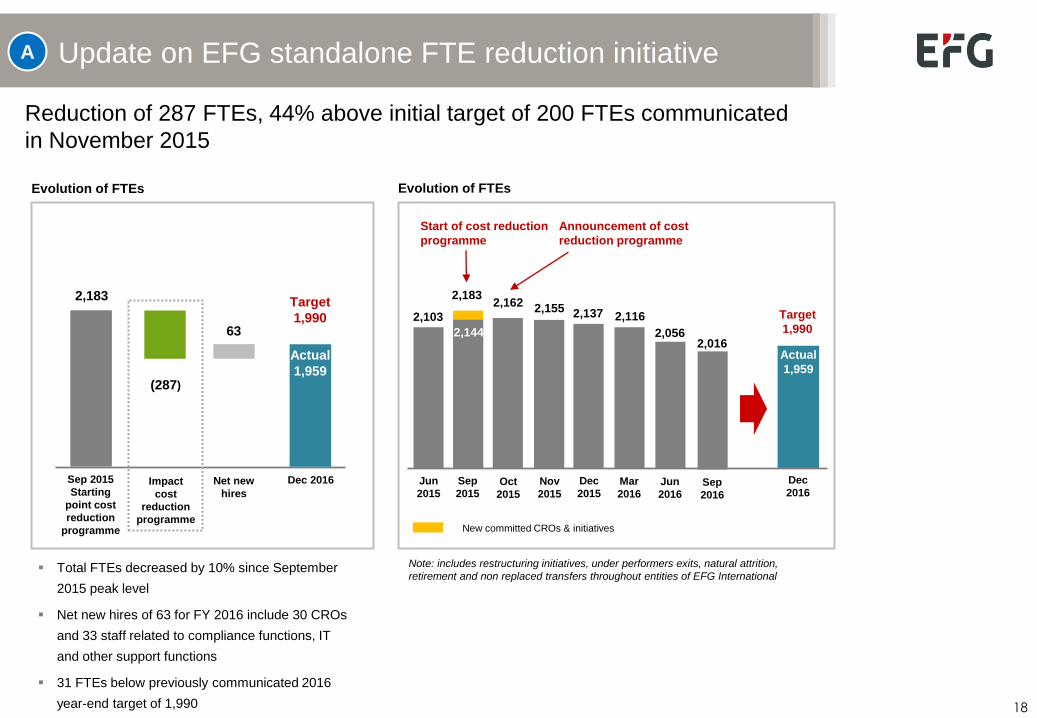
Total FTEs decreased by 10% since September
2015 peak level
Net new hires of 63 for FY 2016 include 30 CROs
and 33 staff related to compliance functions, IT
and other support functions
31 FTEs below previously communicated 2016
year-end target of 1,990
Reduction of 287 FTEs, 44% above initial target of 200 FTEs communicated
in November 2015
2,183
Sep 2015
Starting
point cost
reduction
programme
Target
1,990
A
Note: includes restructuring initiatives, under performers exits, natural attrition,
retirement and non replaced transfers throughout entities of EFG International
2,103
Jun
2015
2,144
Sep
2015
2,162
Oct
2015
2,155
Nov
2015
2,137
Dec
2015
Start of cost reduction
programme
Announcement of cost
reduction programme
Dec
2016
2,183
New committed CROs & initiatives
Target
1,990
Actual
1,959
2,056
Jun
2016
2,116
Mar
2016
2,016
Sep
2016
Evolution of FTEs
19
EFG standalone underlying – Operating expenses
* CIR = Ratio of underlying operating expenses before amortisation of
acquisition related intangibles
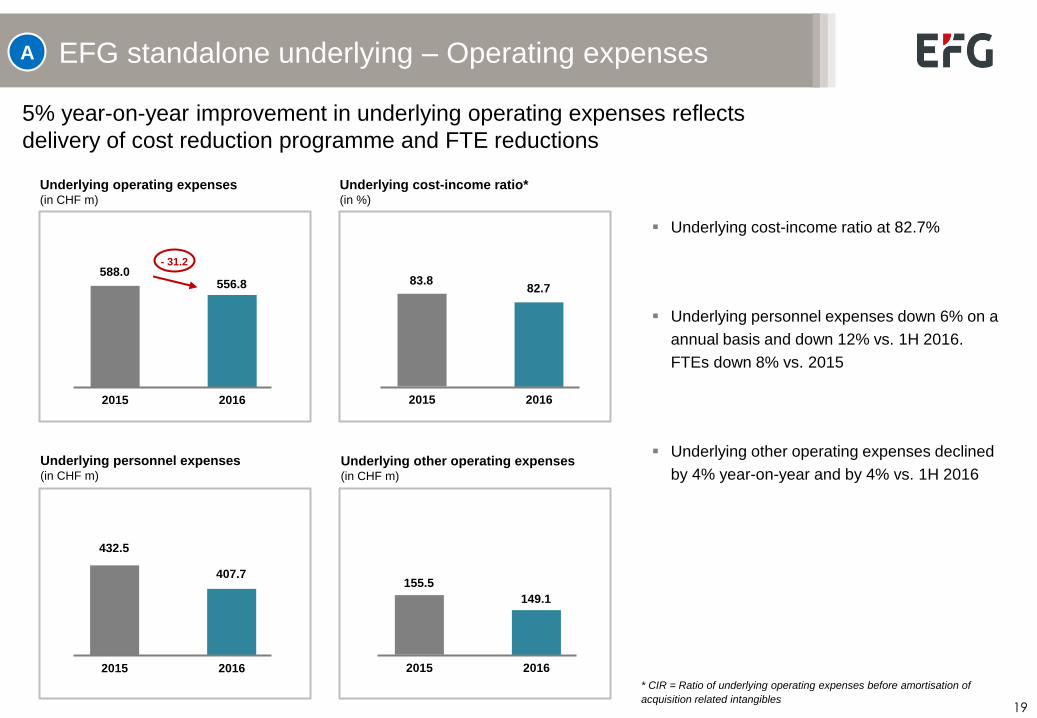
5% year-on-year improvement in underlying operating expenses reflects
delivery of cost reduction programme and FTE reductions
Underlying personnel expenses (in CHF m)
Underlying other operating expenses (in CHF m)
Underlying cost-income ratio* (in %)
Underlying operating expenses (in CHF m)
A
2015 2016
556.8 588.0
2015 2016
82.7 83.8
2015 2016
407.7
432.5
2015 2016
149.1
155.5
Underlying cost-income ratio at 82.7%
Underlying personnel expenses down 6% on a
annual basis and down 12% vs. 1H 2016.
FTEs down 8% vs. 2015
Underlying other operating expenses declined
by 4% year-on-year and by 4% vs. 1H 2016
- 31.2
20
EFG standalone - Growth and productivity drivers
Number of CROs
1H15 1H16
444 424
462
2H15 2H16
389
AuM per CRO (in CHF m)
2012
179
191
2014
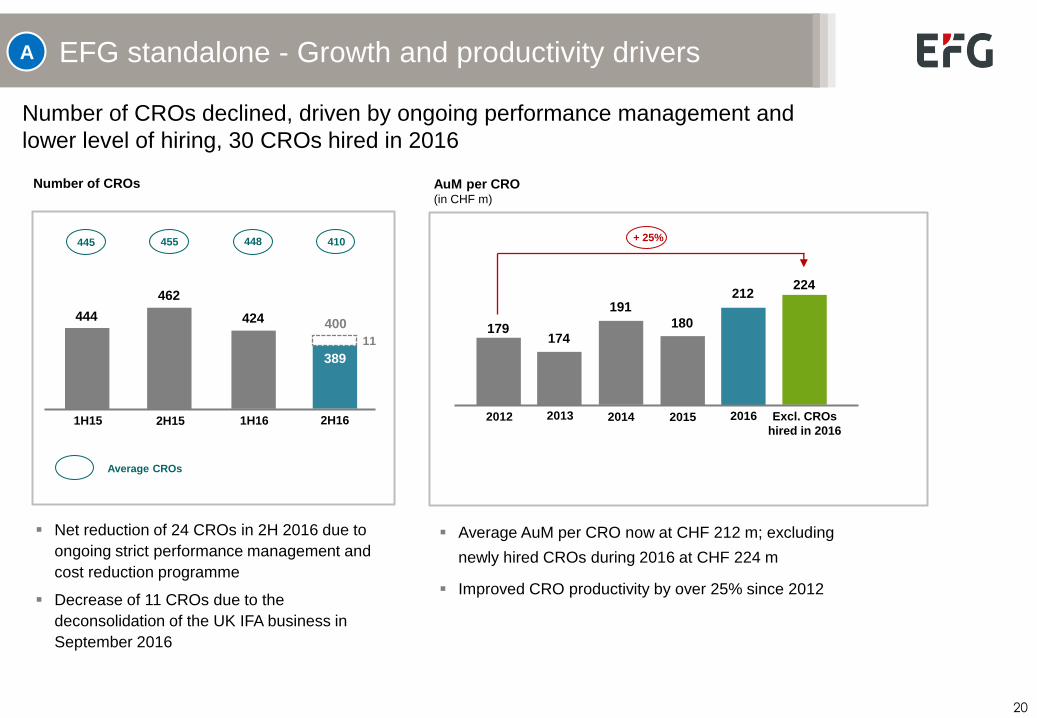
+ 25%
224
Excl. CROs
hired in 2016 2015
180
Number of CROs declined, driven by ongoing performance management and
lower level of hiring, 30 CROs hired in 2016
Net reduction of 24 CROs in 2H 2016 due to
ongoing strict performance management and
cost reduction programme
Decrease of 11 CROs due to the
deconsolidation of the UK IFA business in
September 2016
Average AuM per CRO now at CHF 212 m; excluding
newly hired CROs during 2016 at CHF 224 m
Improved CRO productivity by over 25% since 2012
410
Average CROs
448 455 445
2013
174
2016
212
A
400
11
21
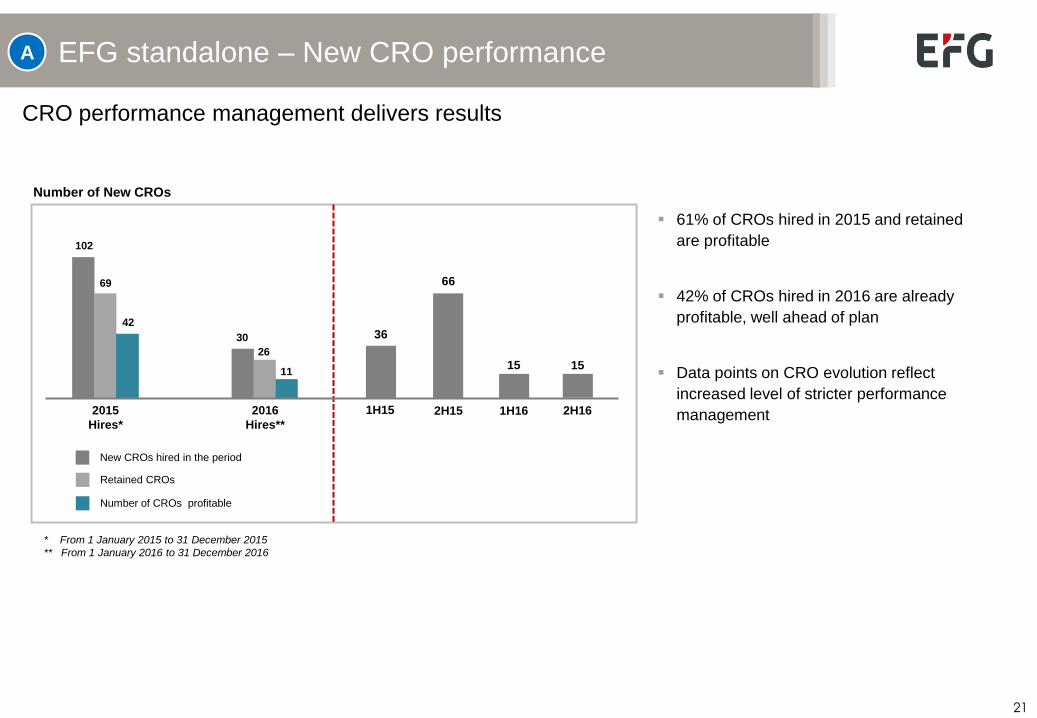
EFG standalone – New CRO performance
Number of New CROs
1H15 2H15 1H16
36
66
15
New CROs hired in the period
Retained CROs
Number of CROs profitable
CRO performance management delivers results
61% of CROs hired in 2015 and retained
are profitable
42% of CROs hired in 2016 are already
profitable, well ahead of plan
Data points on CRO evolution reflect
increased level of stricter performance
management 2015
Hires*
102
69
42
* From 1 January 2015 to 31 December 2015
** From 1 January 2016 to 31 December 2016
2016
Hires**
30
26
11
2H16
15
A
22
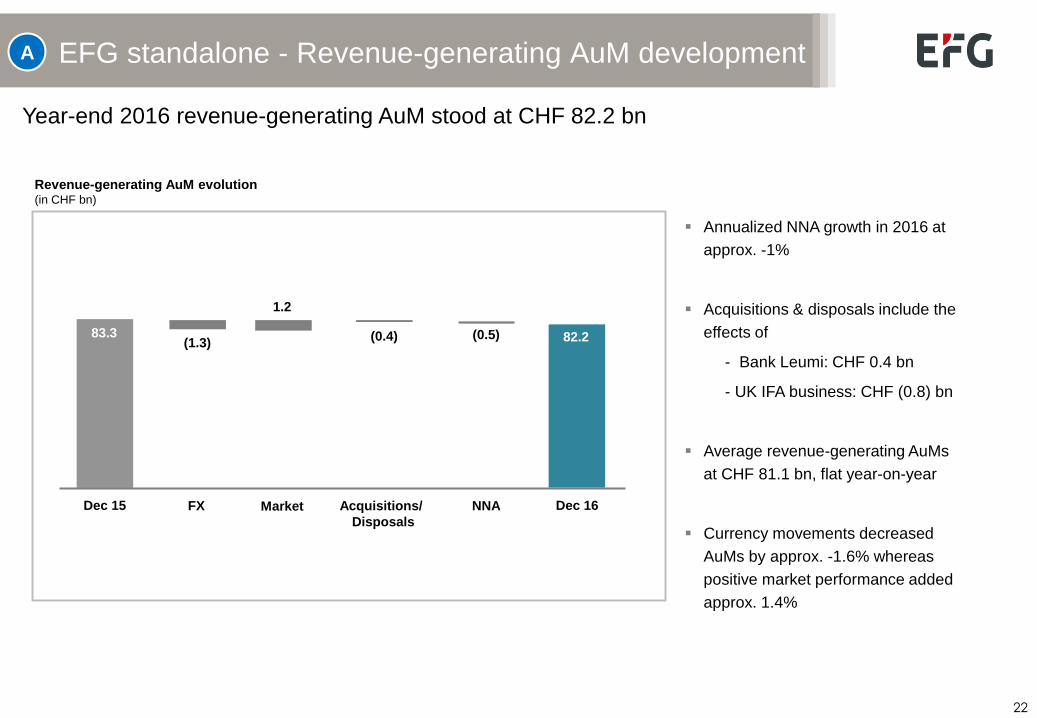
EFG standalone - Revenue-generating AuM development
Year-end 2016 revenue-generating AuM stood at CHF 82.2 bn
Annualized NNA growth in 2016 at
approx. -1%
Acquisitions & disposals include the
effects of
- Bank Leumi: CHF 0.4 bn
- UK IFA business: CHF (0.8) bn
Average revenue-generating AuMs
at CHF 81.1 bn, flat year-on-year
Currency movements decreased
AuMs by approx. -1.6% whereas
positive market performance added
approx. 1.4%
Revenue-generating AuM evolution (in CHF bn)
Dec 15
83.3
FX
(1.3)
Dec 16
82.2
Market
1.2
NNA
(0.5)
A
Acquisitions/
Disposals
(0.4)
23
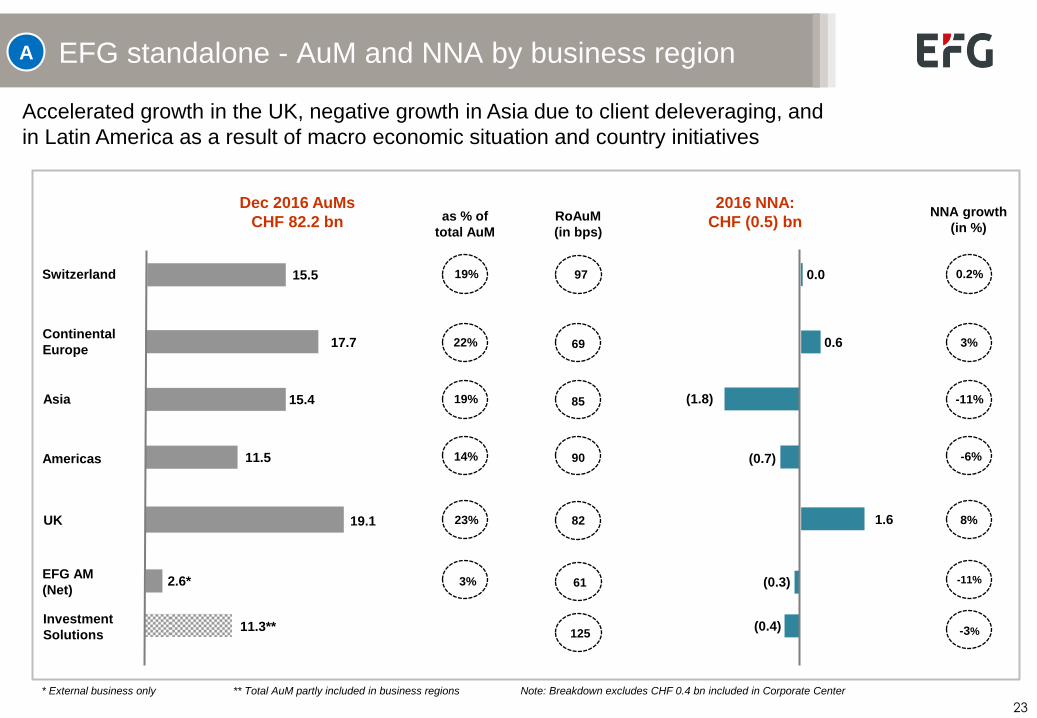
EFG standalone - AuM and NNA by business region
2.6*
19.1
11.5
15.4
17.7 Continental
Europe
UK
Americas
Asia
EFG AM
(Net)
Dec 2016 AuMs
CHF 82.2 bn
2016 NNA:
CHF (0.5) bn
11.3**
15.5 Switzerland 19%
22%
19%
14%
23%
3%
as % of
total AuM
RoAuM
(in bps)
NNA growth
(in %)
97
69
85
90
82
125
61
Investment
Solutions
0.2%
3%
-11%
-6%
8%
-11%
-3%
(0.3)
(0.4)
0.0
0.6
(1.8)
(0.7)
1.6
Accelerated growth in the UK, negative growth in Asia due to client deleveraging, and
in Latin America as a result of macro economic situation and country initiatives
A
* External business only ** Total AuM partly included in business regions Note: Breakdown excludes CHF 0.4 bn included in Corporate Center
24
BSI standalone
25
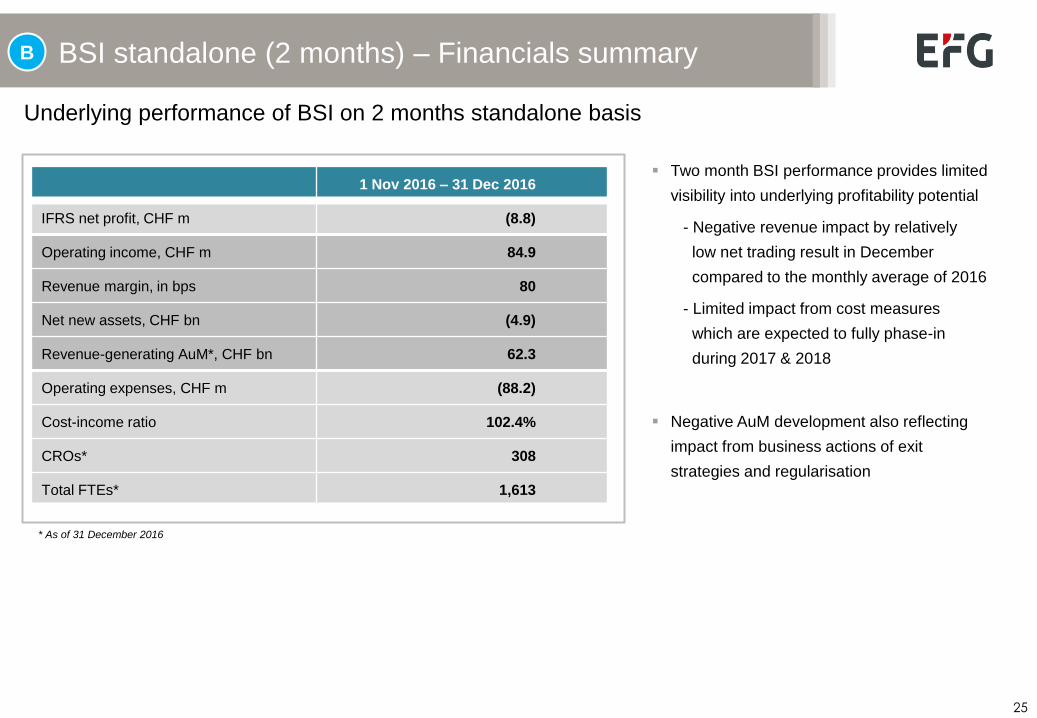
BSI standalone (2 months) – Financials summary
* As of 31 December 2016
1 Nov 2016 – 31 Dec 2016
IFRS net profit, CHF m (8.8)
Operating income, CHF m 84.9
Revenue margin, in bps 80
Net new assets, CHF bn (4.9)
Revenue-generating AuM*, CHF bn 62.3
Operating expenses, CHF m (88.2)
Cost-income ratio 102.4%
CROs* 308
Total FTEs* 1,613
B
Underlying performance of BSI on 2 months standalone basis
Two month BSI performance provides limited
visibility into underlying profitability potential
- Negative revenue impact by relatively
low net trading result in December
compared to the monthly average of 2016
- Limited impact from cost measures
which are expected to fully phase-in
during 2017 & 2018
Negative AuM development also reflecting
impact from business actions of exit
strategies and regularisation
26
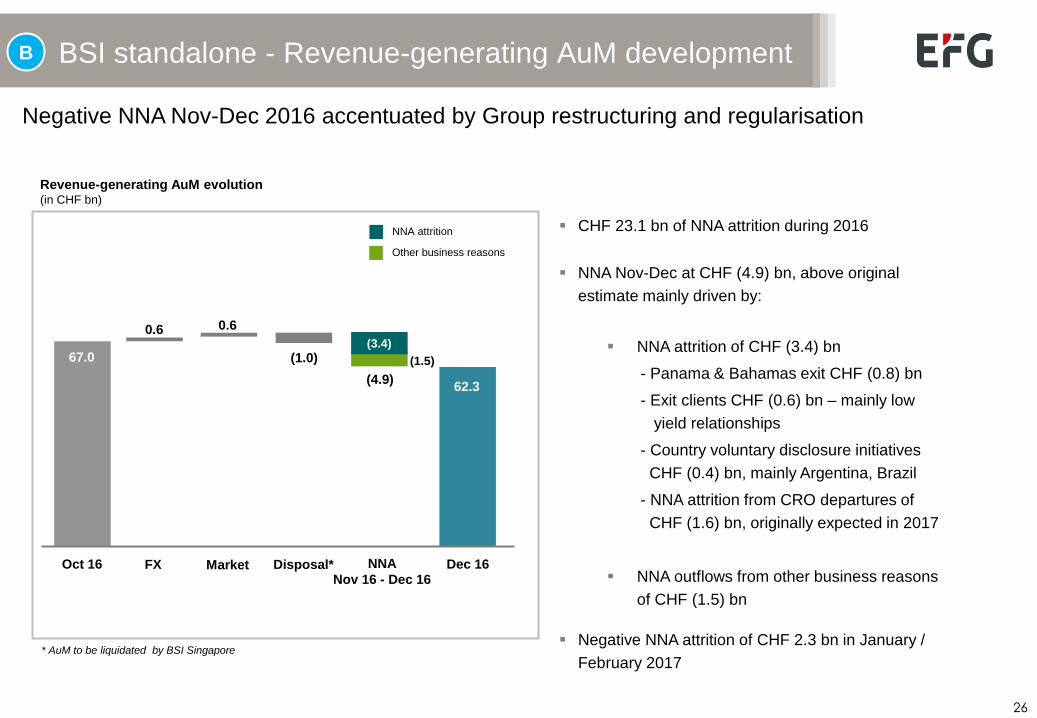
BSI standalone - Revenue-generating AuM development
Negative NNA Nov-Dec 2016 accentuated by Group restructuring and regularisation
CHF 23.1 bn of NNA attrition during 2016
NNA Nov-Dec at CHF (4.9) bn, above original
estimate mainly driven by:
NNA attrition of CHF (3.4) bn
- Panama & Bahamas exit CHF (0.8) bn
- Exit clients CHF (0.6) bn – mainly low
yield relationships
- Country voluntary disclosure initiatives
CHF (0.4) bn, mainly Argentina, Brazil
- NNA attrition from CRO departures of
CHF (1.6) bn, originally expected in 2017
NNA outflows from other business reasons
of CHF (1.5) bn
Negative NNA attrition of CHF 2.3 bn in January /
February 2017
Revenue-generating AuM evolution (in CHF bn)
Oct 16
67.0
FX
0.6
Dec 16
62.3
Market
0.6
B
NNA
Nov 16 - Dec 16
(4.9)
Disposal*
(1.0)
* AuM to be liquidated by BSI Singapore
(1.5)
(3.4)
NNA attrition
Other business reasons
27
EFG-BSI combined
28
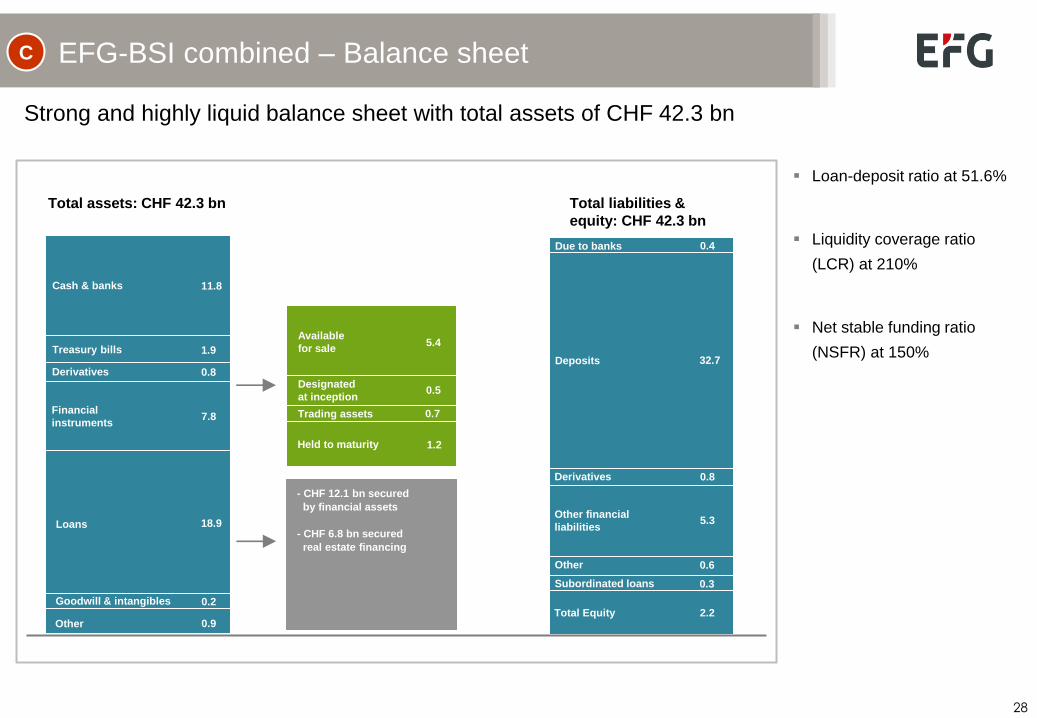
EFG-BSI combined – Balance sheet
Total assets: CHF 42.3 bn
Cash & banks 11.8
Treasury bills 1.9
0.8 Derivatives
7.8 Financial
instruments
18.9 Loans
0.2 Goodwill & intangibles
0.9 Other
Total liabilities &
equity: CHF 42.3 bn
5.3
Derivatives 0.8
32.7
0.4 Due to banks
Deposits
Other financial
liabilities
2.2 Total Equity
0.6 Other
- CHF 12.1 bn secured
by financial assets
- CHF 6.8 bn secured
real estate financing
Available
for sale 5.4
0.5
0.7
Designated
at inception
Trading assets
1.2 Held to maturity
Strong and highly liquid balance sheet with total assets of CHF 42.3 bn
Loan-deposit ratio at 51.6%
Liquidity coverage ratio
(LCR) at 210%
Net stable funding ratio
(NSFR) at 150%
0.3 Subordinated loans
C
29
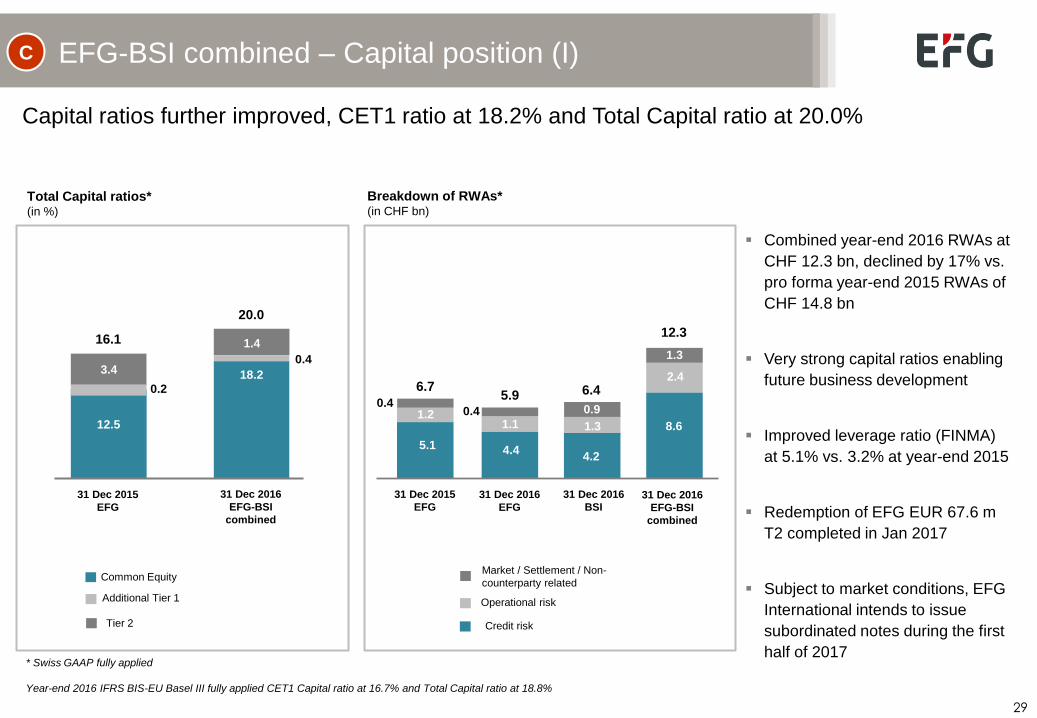
EFG-BSI combined – Capital position (I)
Capital ratios further improved, CET1 ratio at 18.2% and Total Capital ratio at 20.0%
Breakdown of RWAs* (in CHF bn)
Total Capital ratios* (in %)
Tier 2
Additional Tier 1
Common Equity
31 Dec 2015
EFG
12.5
16.1
3.4
0.2
31 Dec 2016
EFG-BSI
combined
18.2
20.0
1.4
0.4
Combined year-end 2016 RWAs at
CHF 12.3 bn, declined by 17% vs.
pro forma year-end 2015 RWAs of
CHF 14.8 bn
Very strong capital ratios enabling
future business development
Improved leverage ratio (FINMA)
at 5.1% vs. 3.2% at year-end 2015
Redemption of EFG EUR 67.6 m
T2 completed in Jan 2017
Subject to market conditions, EFG
International intends to issue
subordinated notes during the first
half of 2017 * Swiss GAAP fully applied
Year-end 2016 IFRS BIS-EU Basel III fully applied CET1 Capital ratio at 16.7% and Total Capital ratio at 18.8%
C
Credit risk
Operational risk
Market / Settlement / Non-
counterparty related
31 Dec 2015
EFG
6.7
1.2
5.1
0.4
31 Dec 2016
EFG-BSI
combined
12.3
2.4
8.6
1.3
6.4
1.3
4.2
0.9
31 Dec 2016
BSI
31 Dec 2016
EFG
5.9
1.1
4.4
0.4
8.6
30
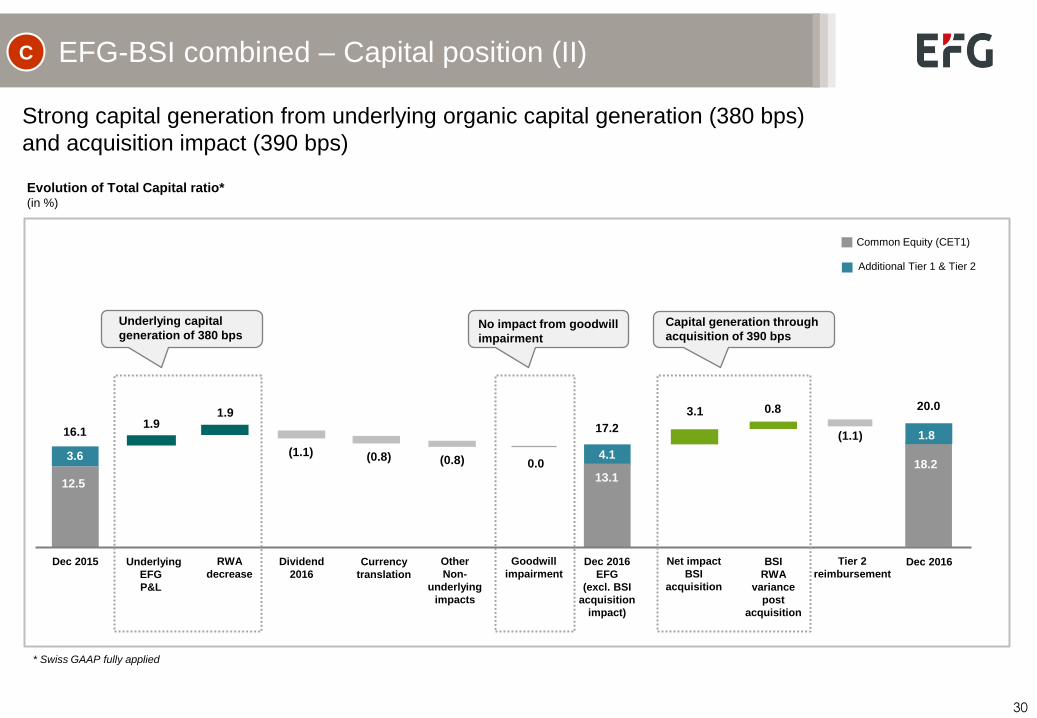
EFG-BSI combined – Capital position (II)
Evolution of Total Capital ratio* (in %)
Strong capital generation from underlying organic capital generation (380 bps)
and acquisition impact (390 bps)
Additional Tier 1 & Tier 2
Common Equity (CET1)
* Swiss GAAP fully applied
12.5
Dec 2015 Net impact
BSI
acquisition
3.1
3.6
16.1
Dec 2016
EFG
(excl. BSI
acquisition
impact)
4.1
17.2
Underlying
EFG
P&L
1.9
RWA
decrease
(0.8)
Other
Non-
underlying
impacts
(0.8) (1.1)
Dividend
2016
20.0
18.2
1.8
Dec 2016
13.1
BSI
RWA
variance
post
acquisition
0.8
(1.1)
Tier 2
reimbursement
1.9
Currency
translation
Goodwill
impairment
0.0
Capital generation through
acquisition of 390 bps No impact from goodwill
impairment
Underlying capital
generation of 380 bps
C
31
Details on acquisition-related & non-
underlying impacts, integration costs
and synergies
32
D
EFG standalone underlying
Acquisition-related impacts &
non-underlying impacts
339.3
EFG
2016
IFRS net
profit
257.0
BSI
acquisition
related
impacts & non-
underlying
impacts
EFG
2016
standalone
Underlying
net profit
BSI
2 months
(8.8)91.1
ABD
57.1
EFG
2015
IFRS net
profit
EFG
2015
Underlying
net profit
91.1
BSI standaloneA B
Acquisition-related & non-underlying impacts D
414.4*
Bargain
gain on
business
acquisition
116.4**
PPA**
(170.5)
EFG
Goodwill &
Intangible
impairment
(post-tax)
BSI
acquisition/
integration
costs
(35.8)
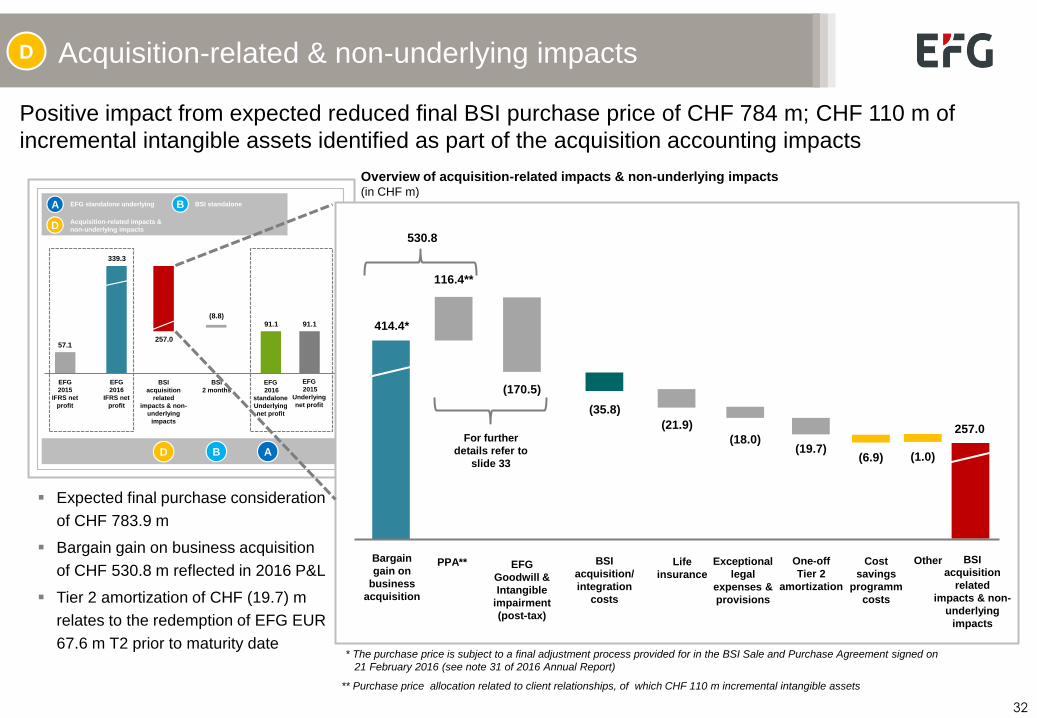
Positive impact from expected reduced final BSI purchase price of CHF 784 m; CHF 110 m of
incremental intangible assets identified as part of the acquisition accounting impacts
(21.9)
(18.0) (19.7)
(6.9)
257.0
Cost
savings
programm
costs
Life
insurance
Exceptional
legal
expenses &
provisions
One-off
Tier 2
amortization
(1.0)
Other
Expected final purchase consideration
of CHF 783.9 m
Bargain gain on business acquisition
of CHF 530.8 m reflected in 2016 P&L
Tier 2 amortization of CHF (19.7) m
relates to the redemption of EFG EUR
67.6 m T2 prior to maturity date
** Purchase price allocation related to client relationships, of which CHF 110 m incremental intangible assets
BSI
acquisition
related
impacts & non-
underlying
impacts
530.8
Overview of acquisition-related impacts & non-underlying impacts (in CHF m)
For further
details refer to
slide 33
* The purchase price is subject to a final adjustment process provided for in the BSI Sale and Purchase Agreement signed on
21 February 2016 (see note 31 of 2016 Annual Report)
33
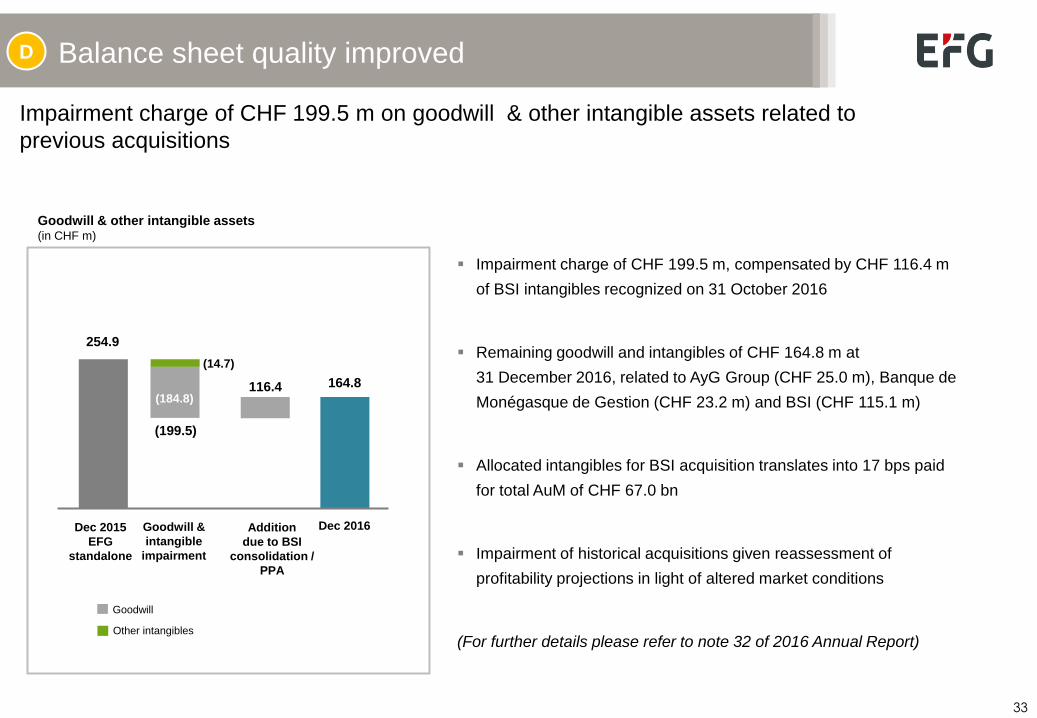
Balance sheet quality improved D
Impairment charge of CHF 199.5 m on goodwill & other intangible assets related to
previous acquisitions
Goodwill & other intangible assets (in CHF m)
116.4
254.9
164.8
(199.5)
Dec 2015
EFG
standalone
Dec 2016
Impairment charge of CHF 199.5 m, compensated by CHF 116.4 m
of BSI intangibles recognized on 31 October 2016
Remaining goodwill and intangibles of CHF 164.8 m at
31 December 2016, related to AyG Group (CHF 25.0 m), Banque de
Monégasque de Gestion (CHF 23.2 m) and BSI (CHF 115.1 m)
Allocated intangibles for BSI acquisition translates into 17 bps paid
for total AuM of CHF 67.0 bn
Impairment of historical acquisitions given reassessment of
profitability projections in light of altered market conditions
(For further details please refer to note 32 of 2016 Annual Report)
(14.7)
(184.8)
Goodwill &
intangible
impairment
Addition
due to BSI
consolidation /
PPA
Other intangibles
Goodwill
34
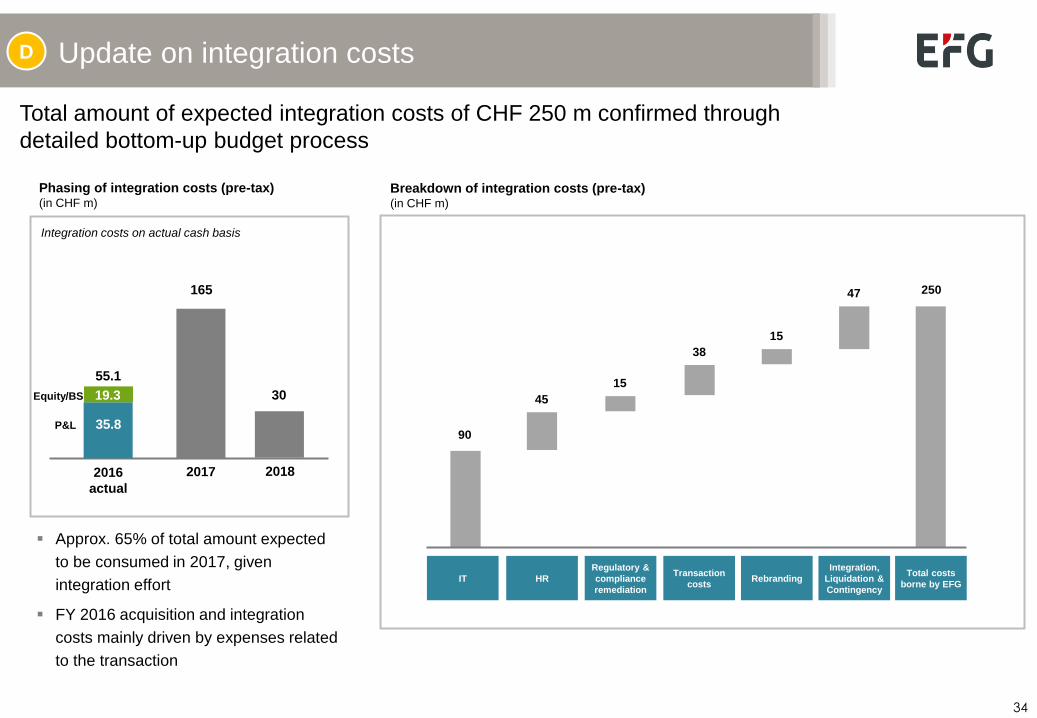
Update on integration costs D
Phasing of integration costs (pre-tax) (in CHF m)
2017
165
2018
30
2016
actual
55.1
Approx. 65% of total amount expected
to be consumed in 2017, given
integration effort
FY 2016 acquisition and integration
costs mainly driven by expenses related
to the transaction
Total amount of expected integration costs of CHF 250 m confirmed through
detailed bottom-up budget process
Breakdown of integration costs (pre-tax) (in CHF m)
HR IT Transaction
costs
Regulatory &
compliance
remediation
Total costs
borne by EFG
Integration,
Liquidation &
Contingency
Rebranding
250 47
15
38
15
45
90 35.8
19.3
P&L
Equity/BS
Integration costs on actual cash basis
35
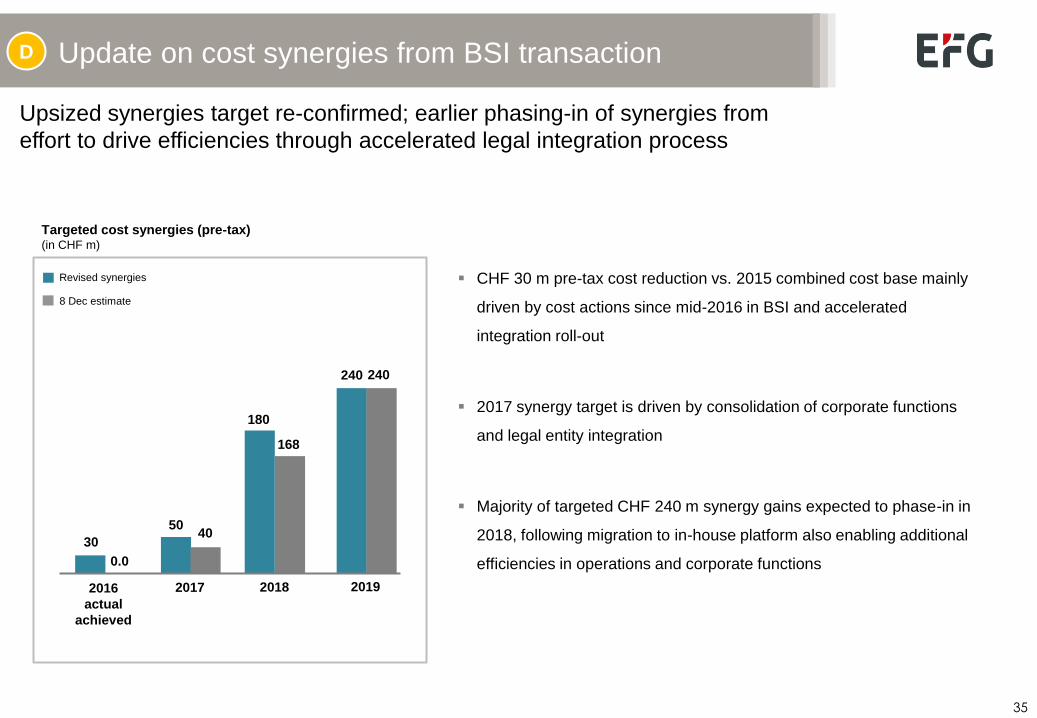
Update on cost synergies from BSI transaction
Upsized synergies target re-confirmed; earlier phasing-in of synergies from
effort to drive efficiencies through accelerated legal integration process
Targeted cost synergies (pre-tax) (in CHF m)
2017
50
2018
180
2016
actual
achieved
30
2019
240
CHF 30 m pre-tax cost reduction vs. 2015 combined cost base mainly
driven by cost actions since mid-2016 in BSI and accelerated
integration roll-out
2017 synergy target is driven by consolidation of corporate functions
and legal entity integration
Majority of targeted CHF 240 m synergy gains expected to phase-in in
2018, following migration to in-house platform also enabling additional
efficiencies in operations and corporate functions
D
0.0
40
168
240
Revised synergies
8 Dec estimate
36
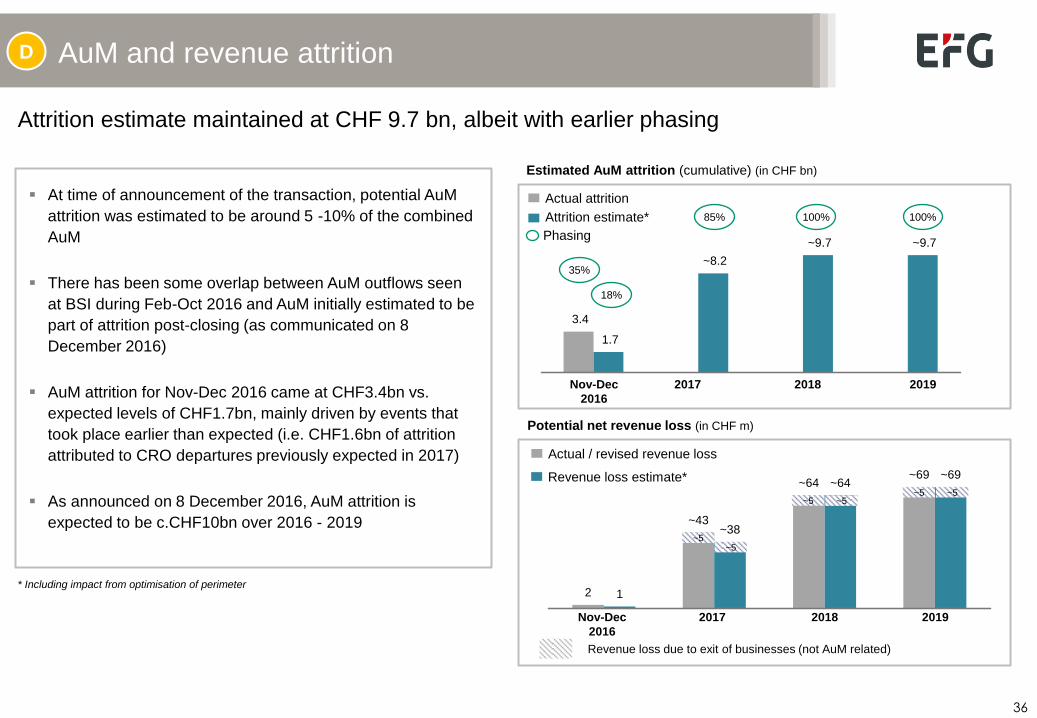
2
~43
~64 ~69
1
~38
~64 ~69
3.4
1.7
~8.2
~9.7 ~9.7
Revenue loss estimate*
At time of announcement of the transaction, potential AuM
attrition was estimated to be around 5 -10% of the combined
AuM
There has been some overlap between AuM outflows seen
at BSI during Feb-Oct 2016 and AuM initially estimated to be
part of attrition post-closing (as communicated on 8
December 2016)
AuM attrition for Nov-Dec 2016 came at CHF3.4bn vs.
expected levels of CHF1.7bn, mainly driven by events that
took place earlier than expected (i.e. CHF1.6bn of attrition
attributed to CRO departures previously expected in 2017)
As announced on 8 December 2016, AuM attrition is
expected to be c.CHF10bn over 2016 - 2019
AuM and revenue attrition
Attrition estimate maintained at CHF 9.7 bn, albeit with earlier phasing
Estimated AuM attrition (cumulative) (in CHF bn)
Attrition estimate*
Actual attrition
Nov-Dec
2016
2017 2018 2019
Potential net revenue loss (in CHF m)
2017 2018 2019
Revenue loss due to exit of businesses (not AuM related)
* Including impact from optimisation of perimeter
18%
85% 100% 100%
Phasing
~5
35%
Actual / revised revenue loss
~5 ~5 ~5
~5 ~5
Nov-Dec
2016
D
37
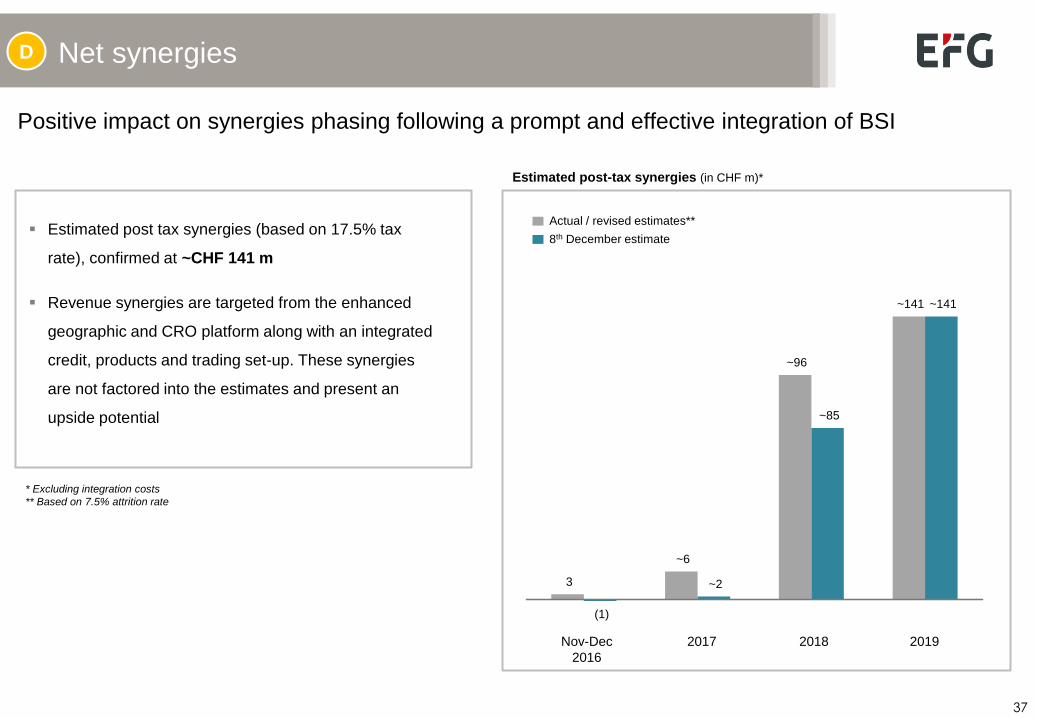
Net synergies
Estimated post tax synergies (based on 17.5% tax
rate), confirmed at ~CHF 141 m
Revenue synergies are targeted from the enhanced
geographic and CRO platform along with an integrated
credit, products and trading set-up. These synergies
are not factored into the estimates and present an
upside potential
Nov-Dec
2016
2017 2018 2019
* Excluding integration costs
** Based on 7.5% attrition rate
Positive impact on synergies phasing following a prompt and effective integration of BSI
Estimated post-tax synergies (in CHF m)*
8th December estimate
Actual / revised estimates**
3
~6
~96
~141
(1)
~2
~85
~141
D
38
Outlook, conclusion
39
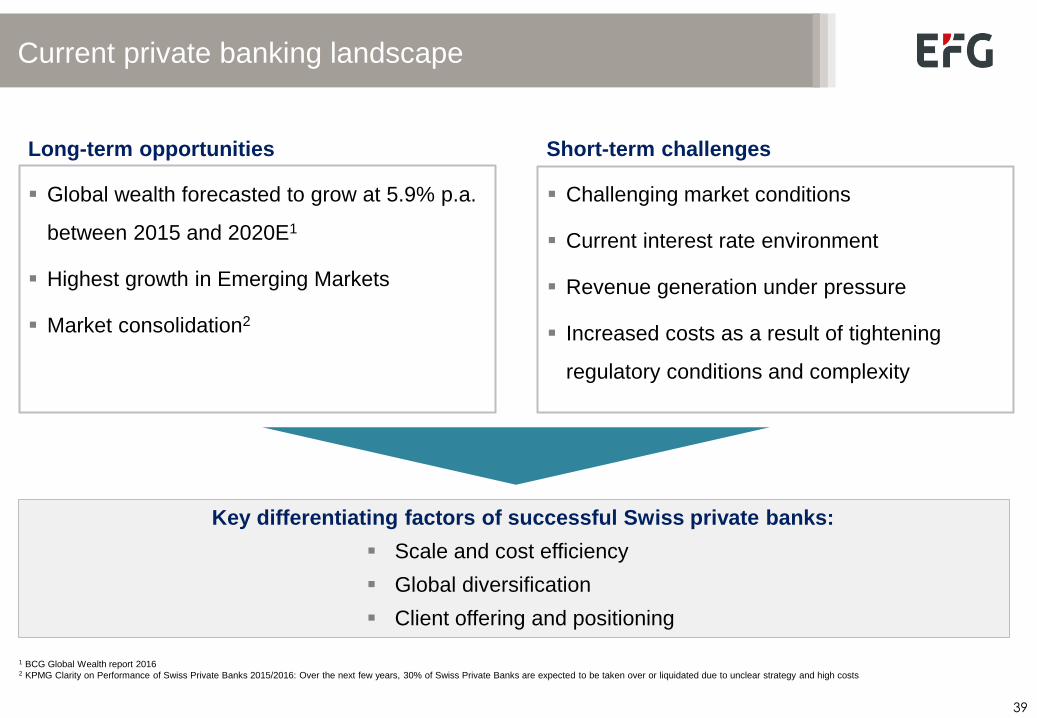
Current private banking landscape
1 BCG Global Wealth report 2016 2 KPMG Clarity on Performance of Swiss Private Banks 2015/2016: Over the next few years, 30% of Swiss Private Banks are expected to be taken over or liquidated due to unclear strategy and high costs
Long-term opportunities Short-term challenges
Global wealth forecasted to grow at 5.9% p.a.
between 2015 and 2020E1
Highest growth in Emerging Markets
Market consolidation2
Challenging market conditions
Current interest rate environment
Revenue generation under pressure
Increased costs as a result of tightening
regulatory conditions and complexity
Key differentiating factors of successful Swiss private banks:
Scale and cost efficiency
Global diversification
Client offering and positioning
40
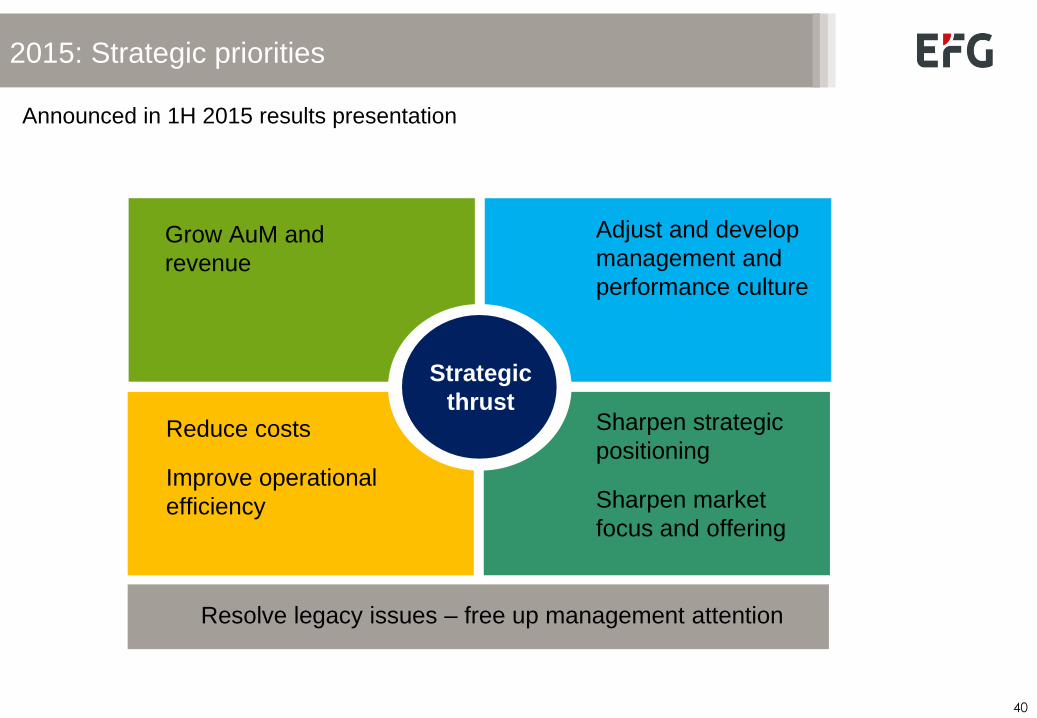
2015: Strategic priorities
Grow AuM and Top line Adjust and develop
Management and
Performance culture
Reduce costs
Improve operational
efficiency
Sharpen strategic
positioning
Sharpen market
focus and offering
Grow AuM and
revenue
Adjust and develop
management and
performance culture
Strategic
thrust
Resolve legacy issues – free up management attention
Announced in 1H 2015 results presentation
41
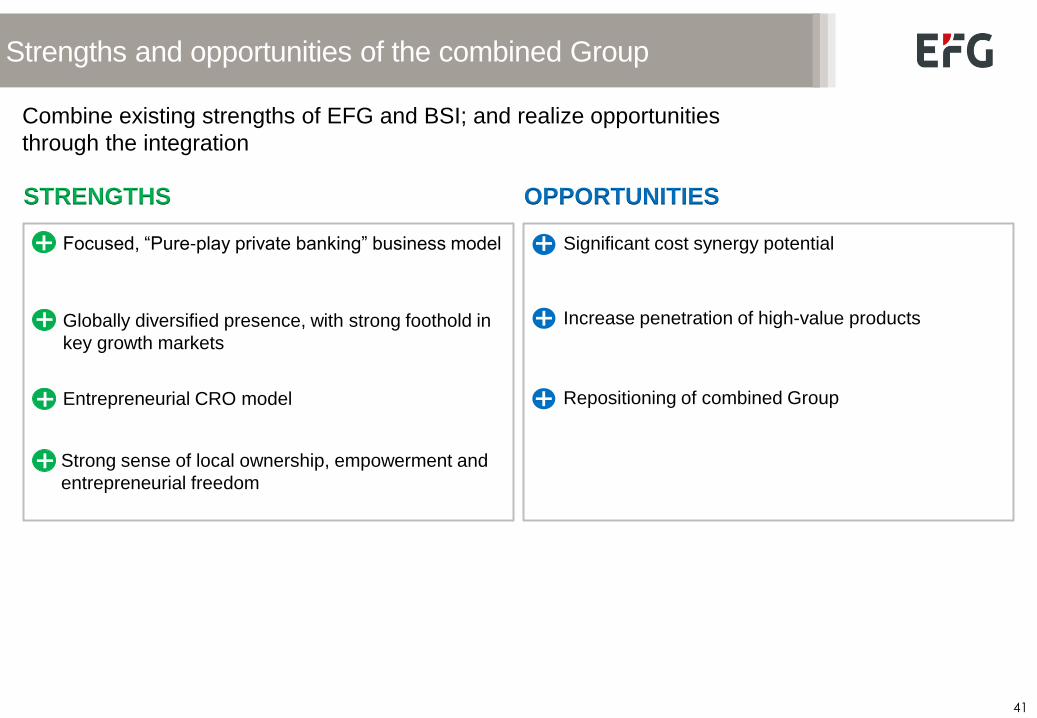
Strengths and opportunities of the combined Group
Combine existing strengths of EFG and BSI; and realize opportunities
through the integration
Focused, “Pure-play private banking” business model
Globally diversified presence, with strong foothold in
key growth markets
Entrepreneurial CRO model
Strong sense of local ownership, empowerment and
entrepreneurial freedom
Significant cost synergy potential
Increase penetration of high-value products
Repositioning of combined Group
STRENGTHS OPPORTUNITIES
42
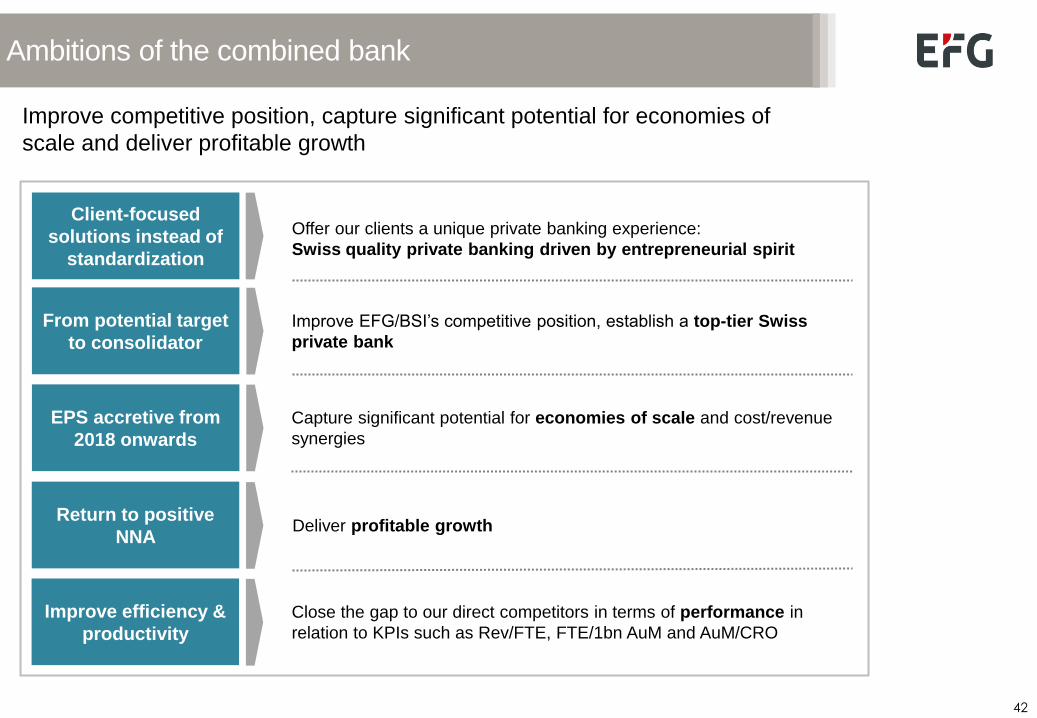
Improve competitive position, capture significant potential for economies of
scale and deliver profitable growth
Ambitions of the combined bank
Improve EFG/BSI’s competitive position, establish a top-tier Swiss
private bank
Close the gap to our direct competitors in terms of performance in
relation to KPIs such as Rev/FTE, FTE/1bn AuM and AuM/CRO
Offer our clients a unique private banking experience:
Swiss quality private banking driven by entrepreneurial spirit
Client-focused
solutions instead of
standardization
From potential target
to consolidator
EPS accretive from
2018 onwards
Capture significant potential for economies of scale and cost/revenue
synergies
Return to positive
NNA Deliver profitable growth
Improve efficiency &
productivity
43
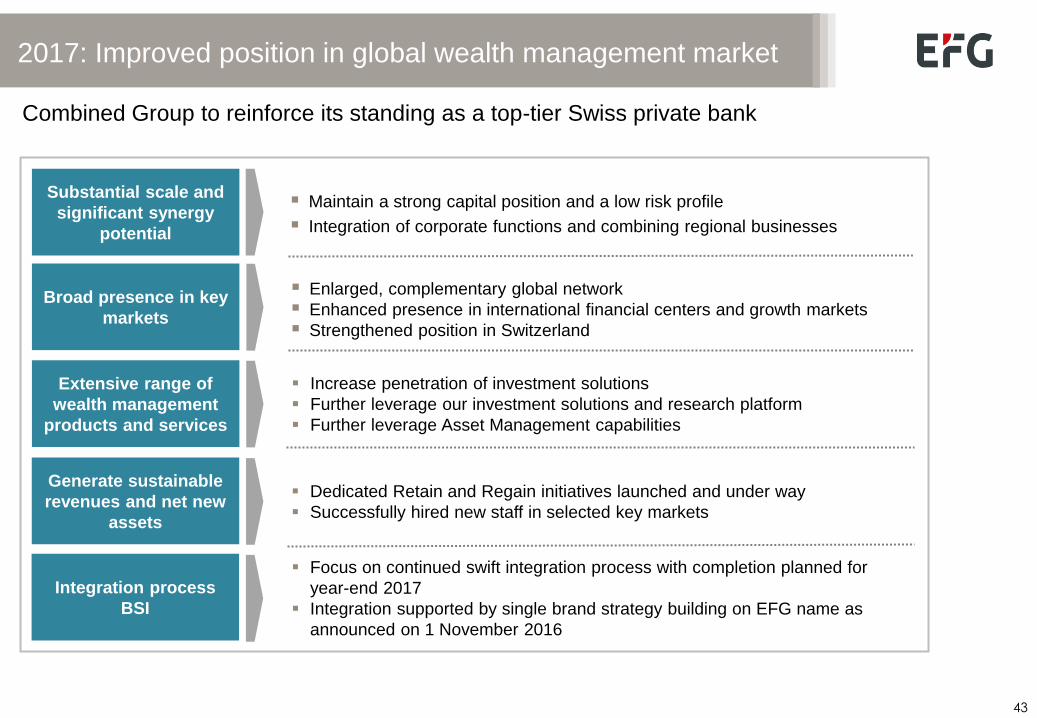
2017: Improved position in global wealth management market
Combined Group to reinforce its standing as a top-tier Swiss private bank
Enlarged, complementary global network
Enhanced presence in international financial centers and growth markets
Strengthened position in Switzerland
Focus on continued swift integration process with completion planned for
year-end 2017
Integration supported by single brand strategy building on EFG name as
announced on 1 November 2016
Substantial scale and
significant synergy
potential
Broad presence in key
markets
Extensive range of
wealth management
products and services
Increase penetration of investment solutions
Further leverage our investment solutions and research platform
Further leverage Asset Management capabilities
Generate sustainable
revenues and net new
assets
Dedicated Retain and Regain initiatives launched and under way
Successfully hired new staff in selected key markets
Integration process
BSI
Maintain a strong capital position and a low risk profile
Integration of corporate functions and combining regional businesses
44
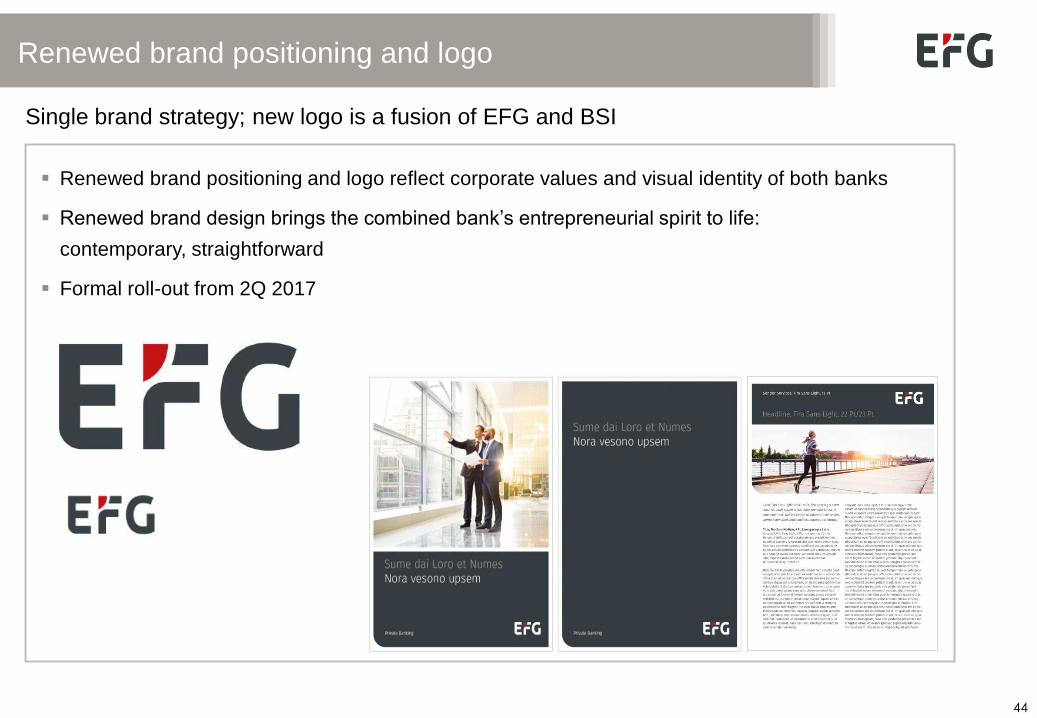
Renewed brand positioning and logo
Single brand strategy; new logo is a fusion of EFG and BSI
v
Renewed brand positioning and logo reflect corporate values and visual identity of both banks
Renewed brand design brings the combined bank’s entrepreneurial spirit to life:
contemporary, straightforward
Formal roll-out from 2Q 2017
45
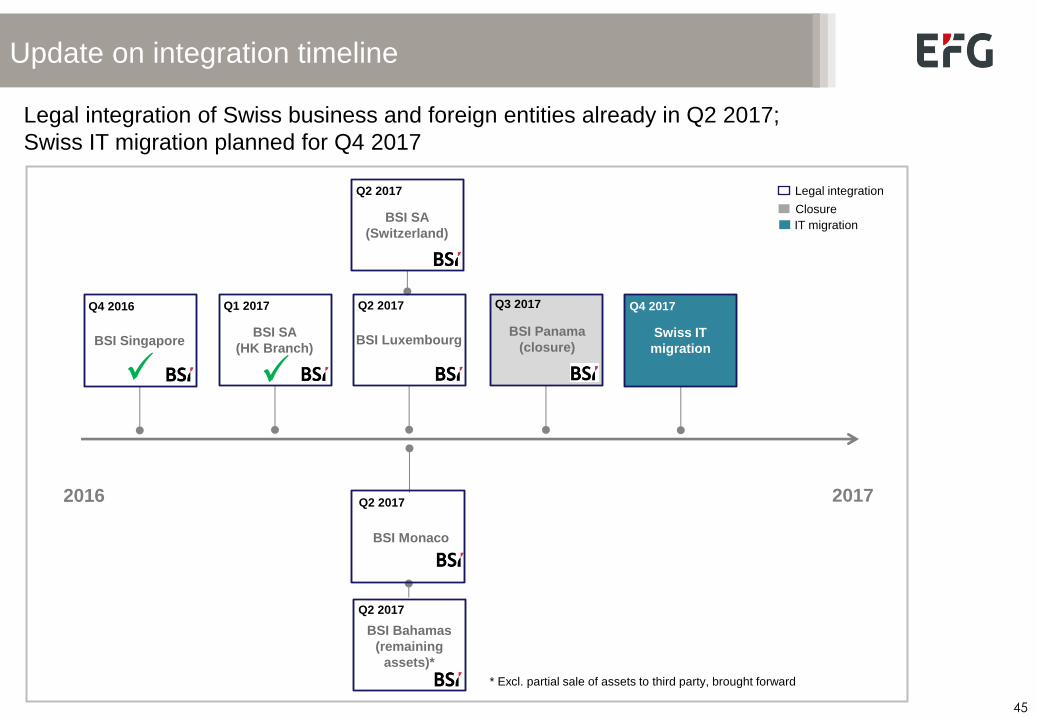
Update on integration timeline
Q2 2017
BSI Luxembourg
Q4 2017
Swiss IT
migration
Q2 2017
BSI Monaco
Q2 2017
BSI Bahamas
(remaining
assets)*
Q2 2017
BSI SA
(Switzerland)
Q1 2017
BSI SA
(HK Branch)
Q4 2016
BSI Singapore
Legal integration of Swiss business and foreign entities already in Q2 2017;
Swiss IT migration planned for Q4 2017
2016 2017
* Excl. partial sale of assets to third party, brought forward
Q3 2017
BSI Panama
(closure)
Closure
IT migration
Legal integration
46
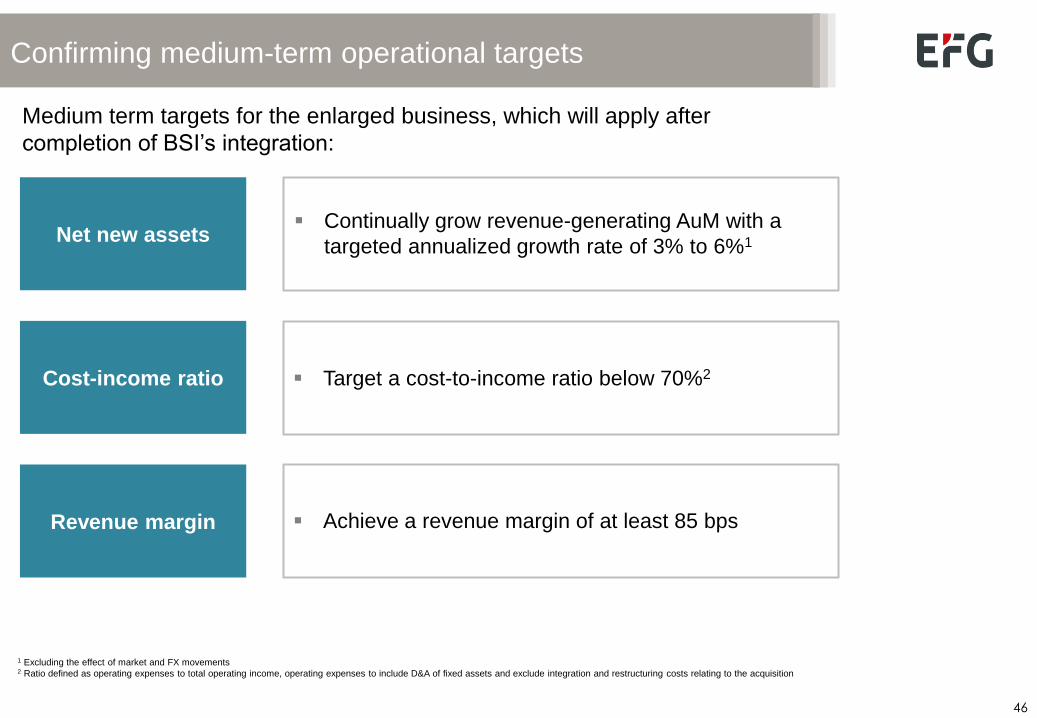
Confirming medium-term operational targets
1 Excluding the effect of market and FX movements
2 Ratio defined as operating expenses to total operating income, operating expenses to include D&A of fixed assets and exclude integration and restructuring costs relating to the acquisition
Net new assets
Cost-income ratio
Revenue margin
Medium term targets for the enlarged business, which will apply after
completion of BSI’s integration:
Continually grow revenue-generating AuM with a
targeted annualized growth rate of 3% to 6%1
Target a cost-to-income ratio below 70%2
Achieve a revenue margin of at least 85 bps
47
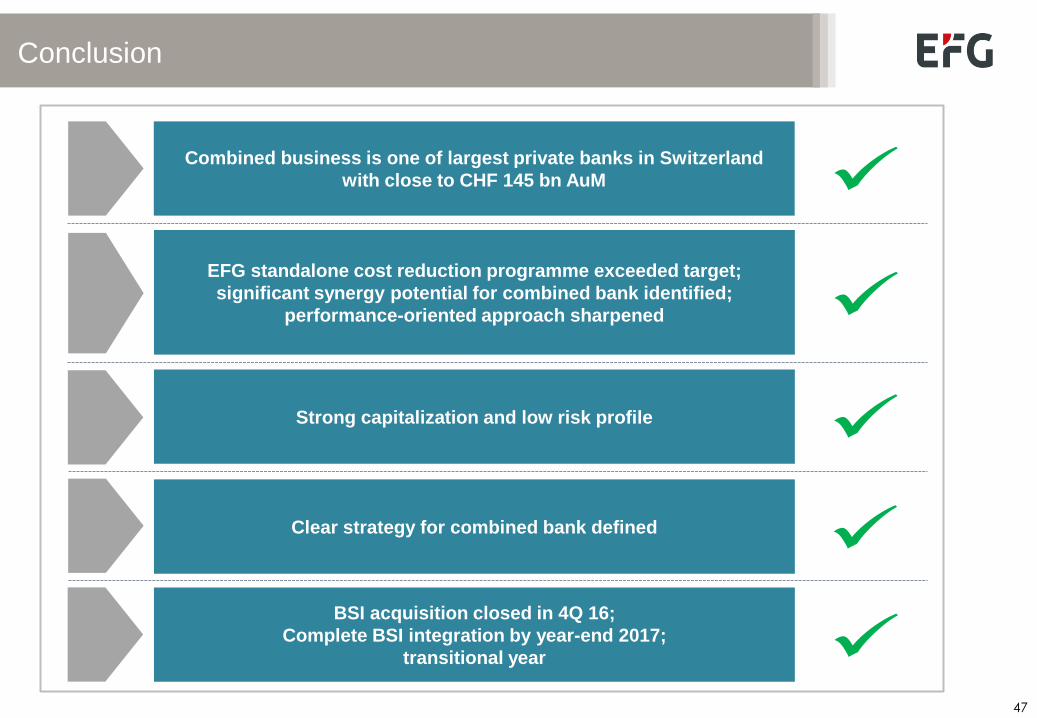
Conclusion
Combined business is one of largest private banks in Switzerland
with close to CHF 145 bn AuM
EFG standalone cost reduction programme exceeded target;
significant synergy potential for combined bank identified;
performance-oriented approach sharpened
Strong capitalization and low risk profile
Clear strategy for combined bank defined
BSI acquisition closed in 4Q 16;
Complete BSI integration by year-end 2017;
transitional year
48
www.efginternational.com

49
Appendix
50
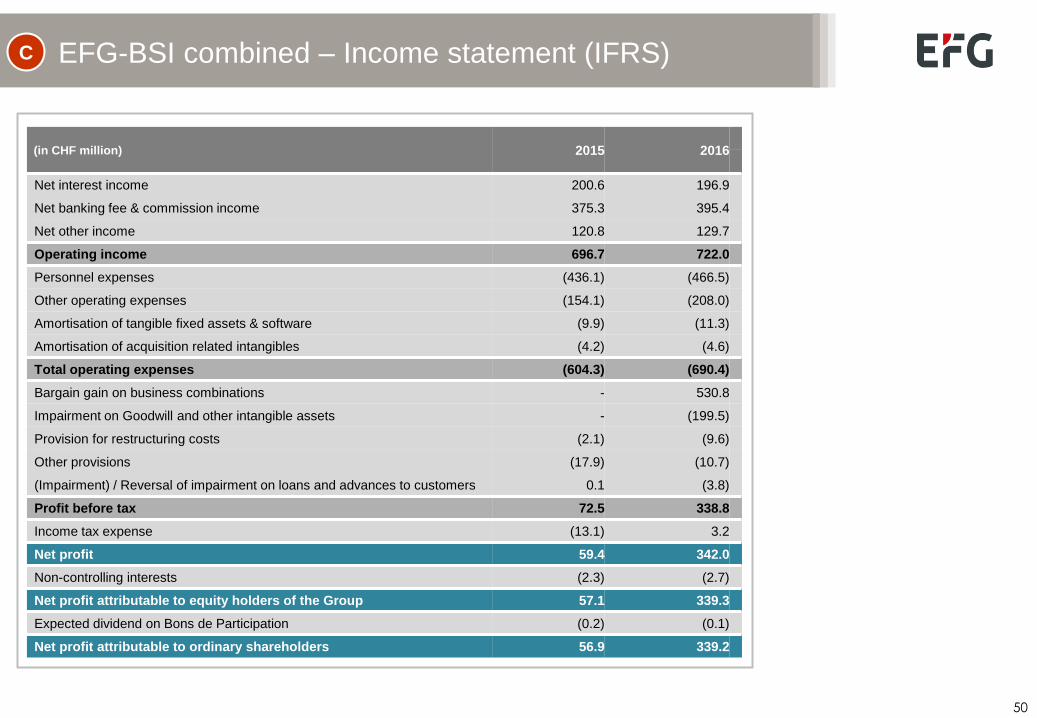
EFG-BSI combined – Income statement (IFRS)
(in CHF million) 2015 2016
Net interest income 200.6 196.9
Net banking fee & commission income 375.3 395.4
Net other income 120.8 129.7
Operating income 696.7 722.0
Personnel expenses (436.1) (466.5)
Other operating expenses (154.1) (208.0)
Amortisation of tangible fixed assets & software (9.9) (11.3)
Amortisation of acquisition related intangibles (4.2) (4.6)
Total operating expenses (604.3) (690.4)
Bargain gain on business combinations - 530.8
Impairment on Goodwill and other intangible assets - (199.5)
Provision for restructuring costs (2.1) (9.6)
Other provisions (17.9) (10.7)
(Impairment) / Reversal of impairment on loans and advances to customers 0.1 (3.8)
Profit before tax 72.5 338.8
Income tax expense (13.1) 3.2
Net profit 59.4 342.0
Non-controlling interests (2.3) (2.7)
Net profit attributable to equity holders of the Group 57.1 339.3
Expected dividend on Bons de Participation (0.2) (0.1)
Net profit attributable to ordinary shareholders 56.9 339.2
C
51
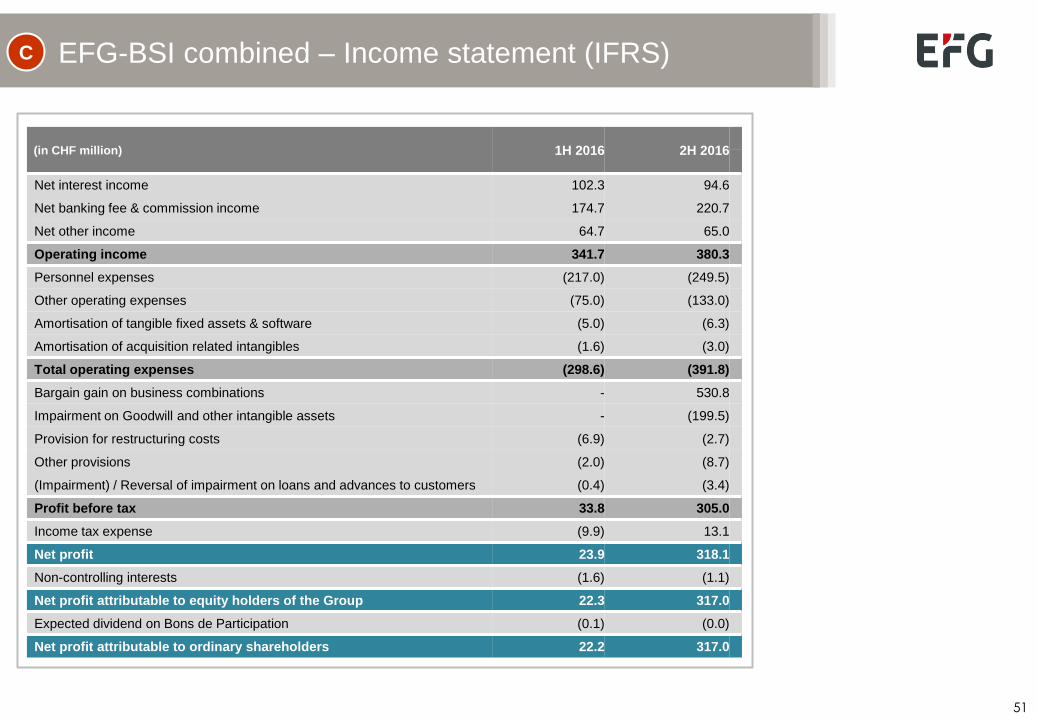
EFG-BSI combined – Income statement (IFRS)
(in CHF million) 1H 2016 2H 2016
Net interest income 102.3 94.6
Net banking fee & commission income 174.7 220.7
Net other income 64.7 65.0
Operating income 341.7 380.3
Personnel expenses (217.0) (249.5)
Other operating expenses (75.0) (133.0)
Amortisation of tangible fixed assets & software (5.0) (6.3)
Amortisation of acquisition related intangibles (1.6) (3.0)
Total operating expenses (298.6) (391.8)
Bargain gain on business combinations - 530.8
Impairment on Goodwill and other intangible assets - (199.5)
Provision for restructuring costs (6.9) (2.7)
Other provisions (2.0) (8.7)
(Impairment) / Reversal of impairment on loans and advances to customers (0.4) (3.4)
Profit before tax 33.8 305.0
Income tax expense (9.9) 13.1
Net profit 23.9 318.1
Non-controlling interests (1.6) (1.1)
Net profit attributable to equity holders of the Group 22.3 317.0
Expected dividend on Bons de Participation (0.1) (0.0)
Net profit attributable to ordinary shareholders 22.2 317.0
C
52
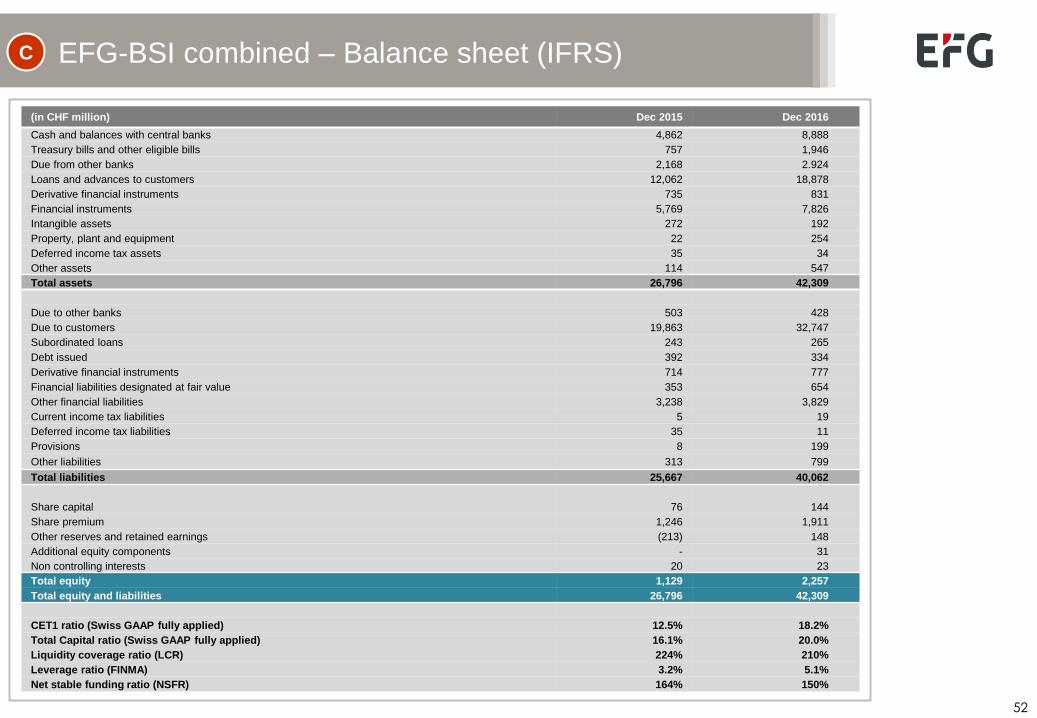
EFG-BSI combined – Balance sheet (IFRS)
(in CHF million) Dec 2015 Dec 2016
Cash and balances with central banks 4,862 8,888
Treasury bills and other eligible bills 757 1,946
Due from other banks 2,168 2.924
Loans and advances to customers 12,062 18,878
Derivative financial instruments 735 831
Financial instruments 5,769 7,826
Intangible assets 272 192
Property, plant and equipment 22 254
Deferred income tax assets 35 34
Other assets 114 547
Total assets 26,796 42,309
Due to other banks 503 428
Due to customers 19,863 32,747
Subordinated loans 243 265
Debt issued 392 334
Derivative financial instruments 714 777
Financial liabilities designated at fair value 353 654
Other financial liabilities 3,238 3,829
Current income tax liabilities 5 19
Deferred income tax liabilities 35 11
Provisions 8 199
Other liabilities 313 799
Total liabilities 25,667 40,062
Share capital 76 144
Share premium 1,246 1,911
Other reserves and retained earnings (213) 148
Additional equity components - 31
Non controlling interests 20 23
Total equity 1,129 2,257
Total equity and liabilities 26,796 42,309
CET1 ratio (Swiss GAAP fully applied) 12.5% 18.2%
Total Capital ratio (Swiss GAAP fully applied) 16.1% 20.0%
Liquidity coverage ratio (LCR) 224% 210%
Leverage ratio (FINMA) 3.2% 5.1%
Net stable funding ratio (NSFR) 164% 150%
C
53
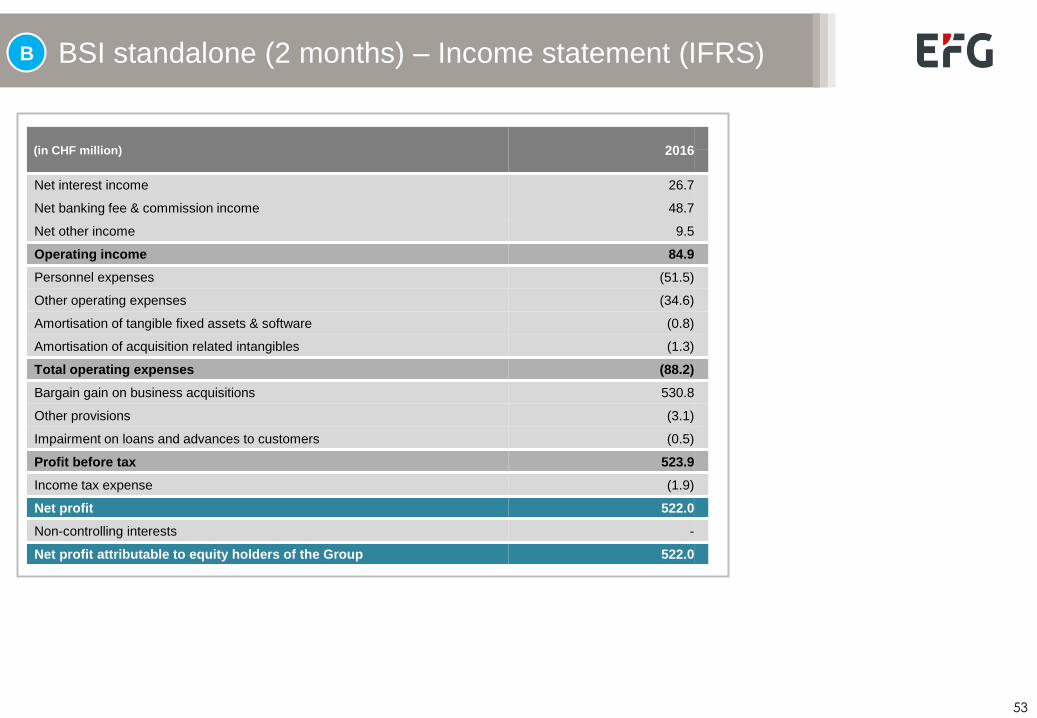
BSI standalone (2 months) – Income statement (IFRS)
(in CHF million) 2016
Net interest income 26.7
Net banking fee & commission income 48.7
Net other income 9.5
Operating income 84.9
Personnel expenses (51.5)
Other operating expenses (34.6)
Amortisation of tangible fixed assets & software (0.8)
Amortisation of acquisition related intangibles (1.3)
Total operating expenses (88.2)
Bargain gain on business acquisitions 530.8
Other provisions (3.1)
Impairment on loans and advances to customers (0.5)
Profit before tax 523.9
Income tax expense (1.9)
Net profit 522.0
Non-controlling interests -
Net profit attributable to equity holders of the Group 522.0
B
54
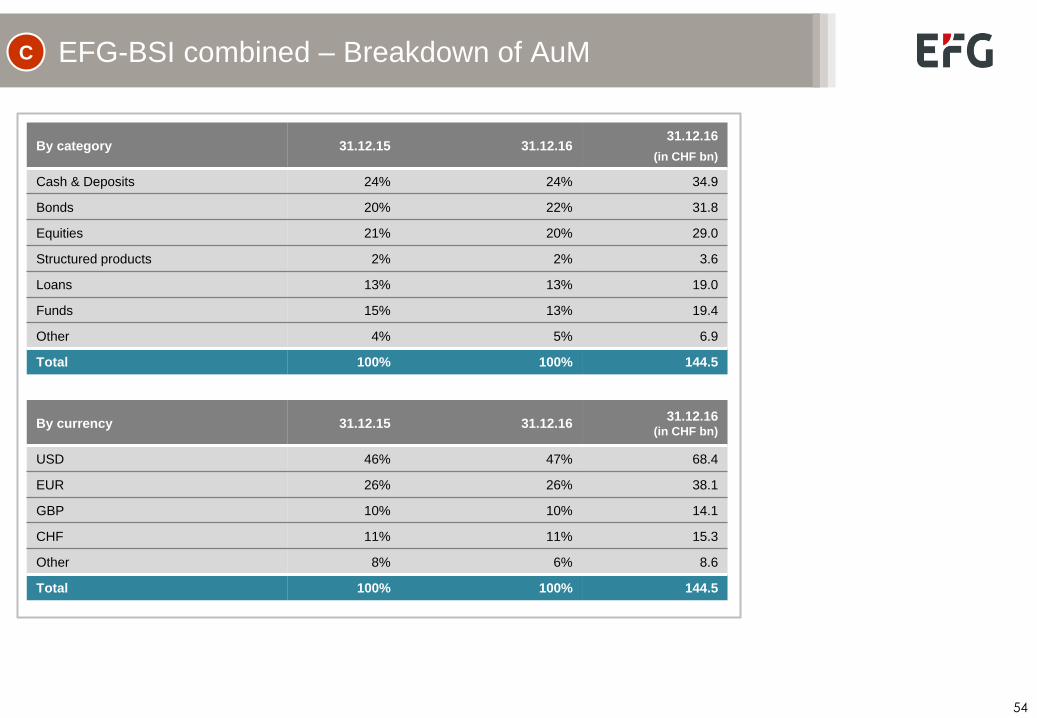
EFG-BSI combined – Breakdown of AuM
By category 31.12.15 31.12.16 31.12.16
(in CHF bn)
Cash & Deposits 24% 24% 34.9
Bonds 20% 22% 31.8
Equities 21% 20% 29.0
Structured products 2% 2% 3.6
Loans 13% 13% 19.0
Funds 15% 13% 19.4
Other 4% 5% 6.9
Total 100% 100% 144.5
By currency 31.12.15 31.12.16 31.12.16
(in CHF bn)
USD 46% 47% 68.4
EUR 26% 26% 38.1
GBP 10% 10% 14.1
CHF 11% 11% 15.3
Other 8% 6% 8.6
Total 100% 100% 144.5
C
55
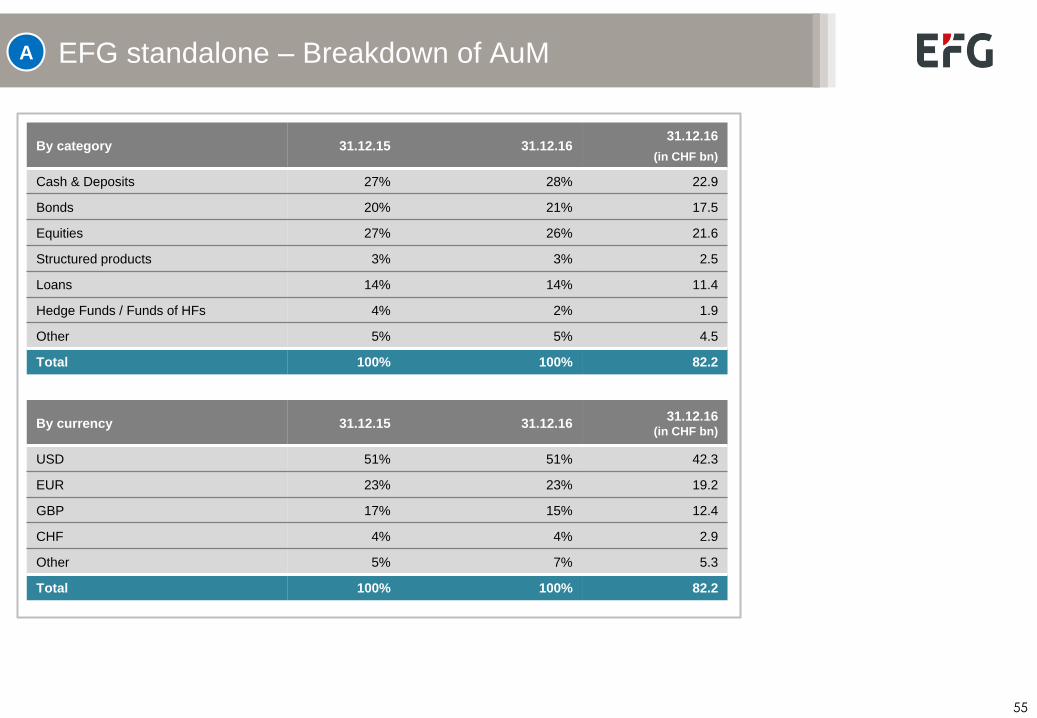
EFG standalone – Breakdown of AuM
By category 31.12.15 31.12.16 31.12.16
(in CHF bn)
Cash & Deposits 27% 28% 22.9
Bonds 20% 21% 17.5
Equities 27% 26% 21.6
Structured products 3% 3% 2.5
Loans 14% 14% 11.4
Hedge Funds / Funds of HFs 4% 2% 1.9
Other 5% 5% 4.5
Total 100% 100% 82.2
By currency 31.12.15 31.12.16 31.12.16
(in CHF bn)
USD 51% 51% 42.3
EUR 23% 23% 19.2
GBP 17% 15% 12.4
CHF 4% 4% 2.9
Other 5% 7% 5.3
Total 100% 100% 82.2
A
56
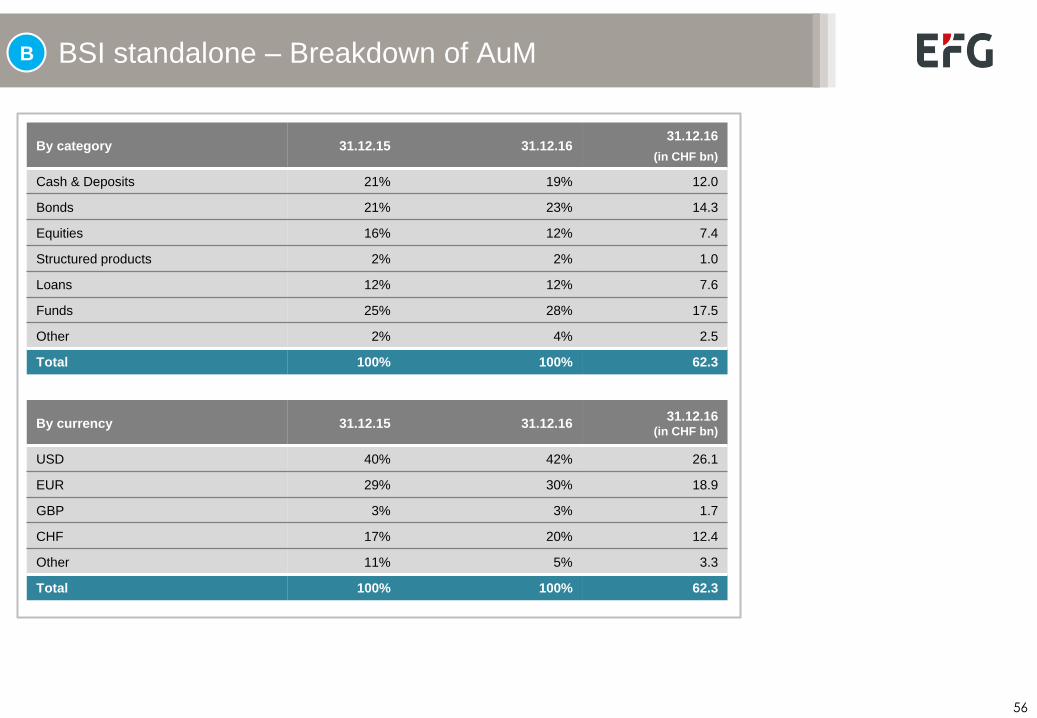
BSI standalone – Breakdown of AuM
By category 31.12.15 31.12.16 31.12.16
(in CHF bn)
Cash & Deposits 21% 19% 12.0
Bonds 21% 23% 14.3
Equities 16% 12% 7.4
Structured products 2% 2% 1.0
Loans 12% 12% 7.6
Funds 25% 28% 17.5
Other 2% 4% 2.5
Total 100% 100% 62.3
By currency 31.12.15 31.12.16 31.12.16
(in CHF bn)
USD 40% 42% 26.1
EUR 29% 30% 18.9
GBP 3% 3% 1.7
CHF 17% 20% 12.4
Other 11% 5% 3.3
Total 100% 100% 62.3
B
57
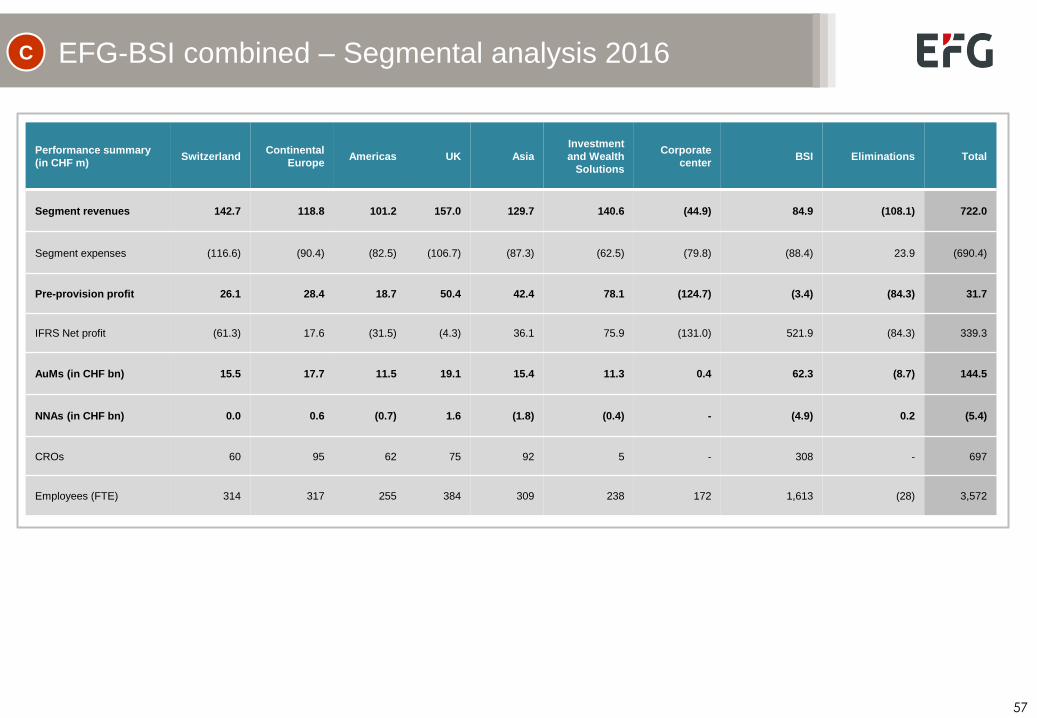
EFG-BSI combined – Segmental analysis 2016
Performance summary
(in CHF m) Switzerland
Continental
Europe Americas UK Asia
Investment
and Wealth
Solutions
Corporate
center BSI Eliminations Total
Segment revenues 142.7 118.8 101.2 157.0 129.7 140.6 (44.9) 84.9 (108.1) 722.0
Segment expenses (116.6) (90.4) (82.5) (106.7) (87.3) (62.5) (79.8) (88.4) 23.9 (690.4)
Pre-provision profit 26.1 28.4 18.7 50.4 42.4 78.1 (124.7) (3.4) (84.3) 31.7
IFRS Net profit (61.3) 17.6 (31.5) (4.3) 36.1 75.9 (131.0) 521.9 (84.3) 339.3
AuMs (in CHF bn) 15.5 17.7 11.5 19.1 15.4 11.3 0.4 62.3 (8.7) 144.5
NNAs (in CHF bn) 0.0 0.6 (0.7) 1.6 (1.8) (0.4) - (4.9) 0.2 (5.4)
CROs 60 95 62 75 92 5 - 308 - 697
Employees (FTE) 314 317 255 384 309 238 172 1,613 (28) 3,572
C
58
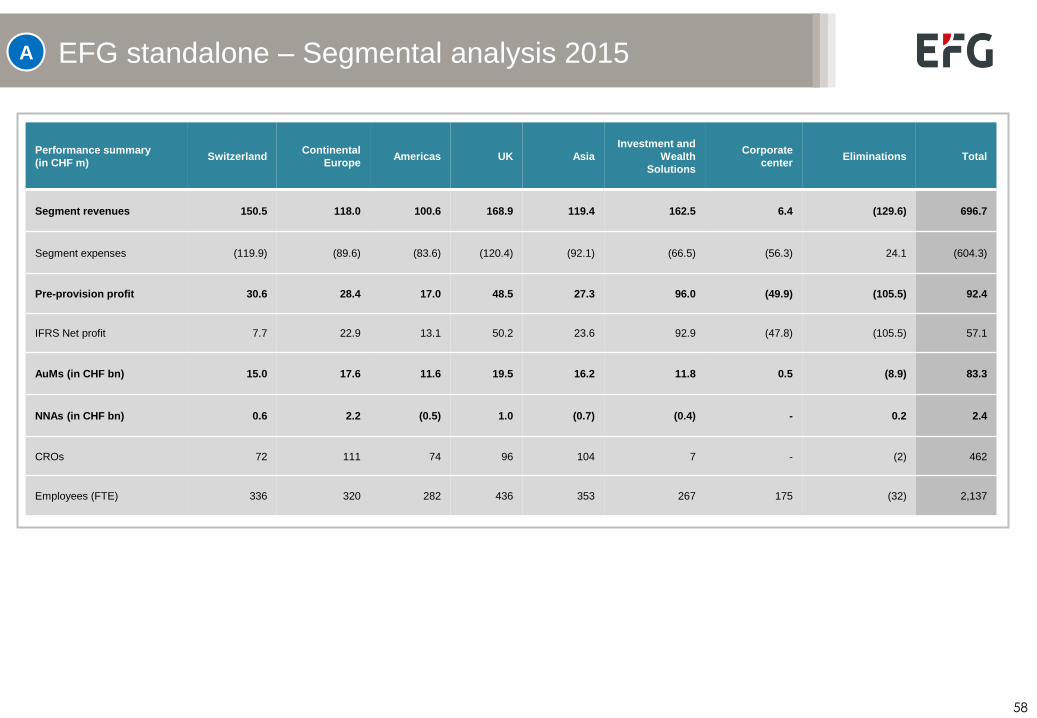
EFG standalone – Segmental analysis 2015
Performance summary
(in CHF m) Switzerland
Continental
Europe Americas UK Asia
Investment and
Wealth
Solutions
Corporate
center Eliminations Total
Segment revenues 150.5 118.0 100.6 168.9 119.4 162.5 6.4 (129.6) 696.7
Segment expenses (119.9) (89.6) (83.6) (120.4) (92.1) (66.5) (56.3) 24.1 (604.3)
Pre-provision profit 30.6 28.4 17.0 48.5 27.3 96.0 (49.9) (105.5) 92.4
IFRS Net profit 7.7 22.9 13.1 50.2 23.6 92.9 (47.8) (105.5) 57.1
AuMs (in CHF bn) 15.0 17.6 11.6 19.5 16.2 11.8 0.5 (8.9) 83.3
NNAs (in CHF bn) 0.6 2.2 (0.5) 1.0 (0.7) (0.4) - 0.2 2.4
CROs 72 111 74 96 104 7 - (2) 462
Employees (FTE) 336 320 282 436 353 267 175 (32) 2,137
A
59
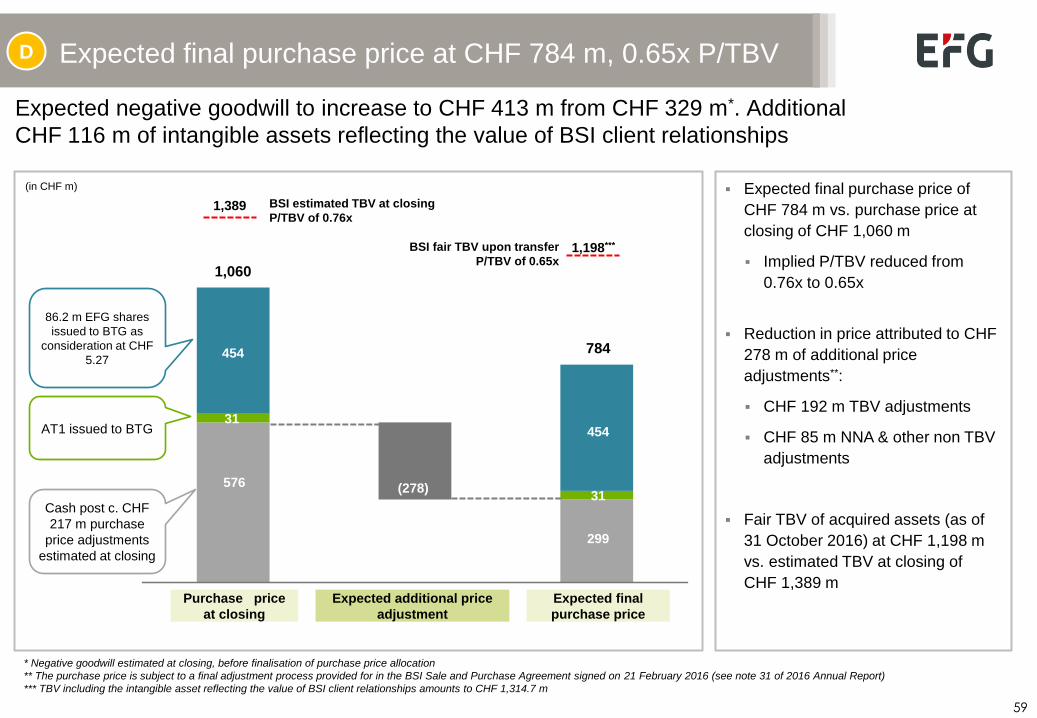
Expected final purchase price of
CHF 784 m vs. purchase price at
closing of CHF 1,060 m
Implied P/TBV reduced from
0.76x to 0.65x
Reduction in price attributed to CHF
278 m of additional price
adjustments**:
CHF 192 m TBV adjustments
CHF 85 m NNA & other non TBV
adjustments
Fair TBV of acquired assets (as of
31 October 2016) at CHF 1,198 m
vs. estimated TBV at closing of
CHF 1,389 m
Expected final purchase price at CHF 784 m, 0.65x P/TBV
Expected negative goodwill to increase to CHF 413 m from CHF 329 m*. Additional
CHF 116 m of intangible assets reflecting the value of BSI client relationships
Purchase price
at closing
Expected additional price
adjustment
Expected final
purchase price
Cash post c. CHF
217 m purchase
price adjustments
estimated at closing
AT1 issued to BTG
86.2 m EFG shares
issued to BTG as
consideration at CHF
5.27
576
(in CHF m)
* Negative goodwill estimated at closing, before finalisation of purchase price allocation
** The purchase price is subject to a final adjustment process provided for in the BSI Sale and Purchase Agreement signed on 21 February 2016 (see note 31 of 2016 Annual Report)
*** TBV including the intangible asset reflecting the value of BSI client relationships amounts to CHF 1,314.7 m
BSI estimated TBV at closing
P/TBV of 0.76x 1,389
31
454
1,060
299
31
454
784
BSI fair TBV upon transfer
P/TBV of 0.65x 1,198***
(278)
D
60
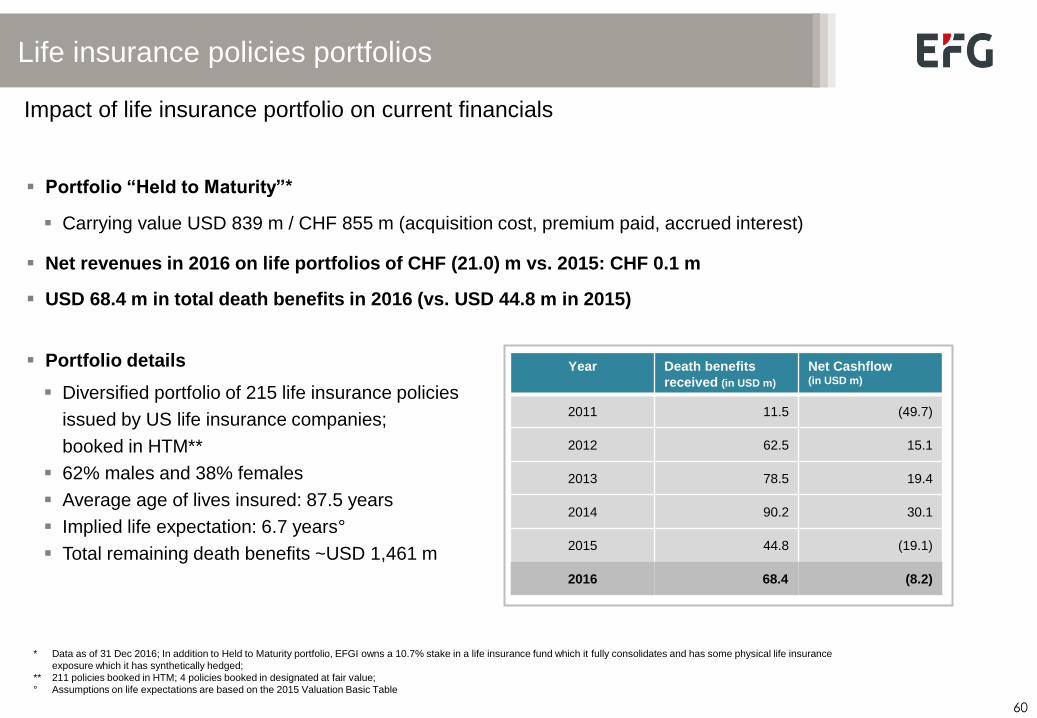
Life insurance policies portfolios
Impact of life insurance portfolio on current financials
Portfolio “Held to Maturity”*
Carrying value USD 839 m / CHF 855 m (acquisition cost, premium paid, accrued interest)
Portfolio details
Diversified portfolio of 215 life insurance policies
issued by US life insurance companies;
booked in HTM**
62% males and 38% females
Average age of lives insured: 87.5 years
Implied life expectation: 6.7 years°
Total remaining death benefits ~USD 1,461 m
* Data as of 31 Dec 2016; In addition to Held to Maturity portfolio, EFGI owns a 10.7% stake in a life insurance fund which it fully consolidates and has some physical life insurance
exposure which it has synthetically hedged;
** 211 policies booked in HTM; 4 policies booked in designated at fair value;
° Assumptions on life expectations are based on the 2015 Valuation Basic Table
Net revenues in 2016 on life portfolios of CHF (21.0) m vs. 2015: CHF 0.1 m
USD 68.4 m in total death benefits in 2016 (vs. USD 44.8 m in 2015)
Year Death benefits
received (in USD m)
Net Cashflow (in USD m)
2011 11.5 (49.7)
2012 62.5 15.1
2013 78.5 19.4
2014 90.2 30.1
2015 44.8 (19.1)
2016 68.4 (8.2)
61
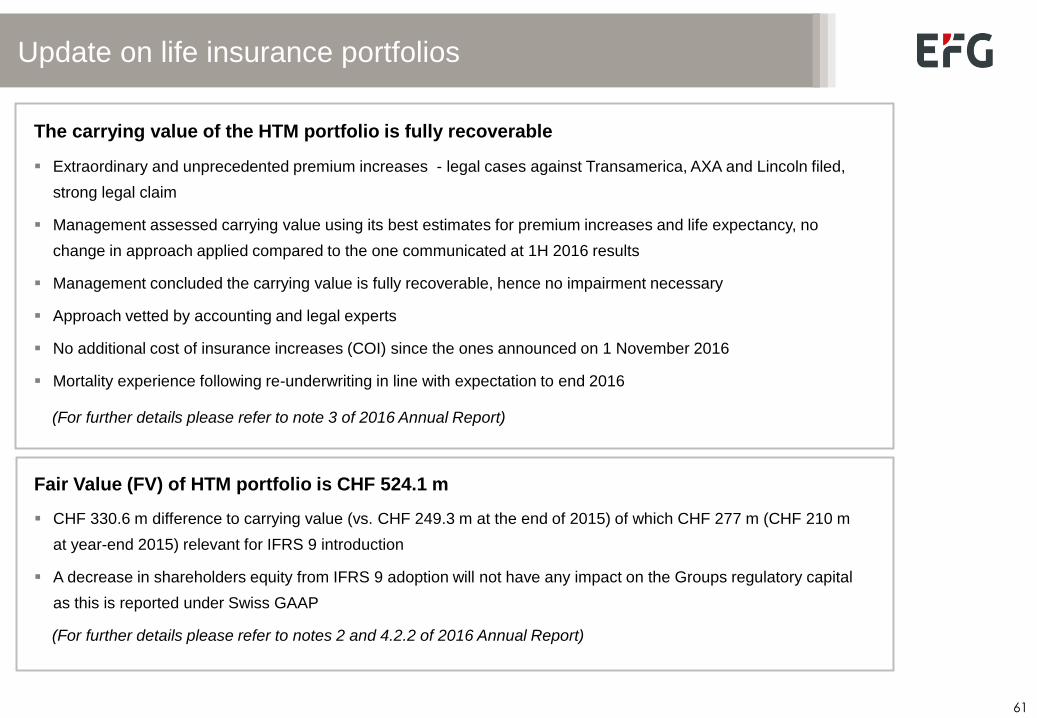
Update on life insurance portfolios
Fair Value (FV) of HTM portfolio is CHF 524.1 m
CHF 330.6 m difference to carrying value (vs. CHF 249.3 m at the end of 2015) of which CHF 277 m (CHF 210 m
at year-end 2015) relevant for IFRS 9 introduction
A decrease in shareholders equity from IFRS 9 adoption will not have any impact on the Groups regulatory capital
as this is reported under Swiss GAAP
(For further details please refer to notes 2 and 4.2.2 of 2016 Annual Report)
The carrying value of the HTM portfolio is fully recoverable
Extraordinary and unprecedented premium increases - legal cases against Transamerica, AXA and Lincoln filed,
strong legal claim
Management assessed carrying value using its best estimates for premium increases and life expectancy, no
change in approach applied compared to the one communicated at 1H 2016 results
Management concluded the carrying value is fully recoverable, hence no impairment necessary
Approach vetted by accounting and legal experts
No additional cost of insurance increases (COI) since the ones announced on 1 November 2016
Mortality experience following re-underwriting in line with expectation to end 2016
(For further details please refer to note 3 of 2016 Annual Report)
62
Contacts
EFG International AG, Bleicherweg 8,
8001 Zurich, Switzerland
Telephone: +41 44 212 73 77
Fax: +41 44 226 18 55
www.efginternational.com
Reuters: EFGN.S
Bloomberg: EFGN SW
Jens Brueckner
Head of Investor Relations
Telephone: +41 44 226 1799
E-mail: [email protected]
Investor Relations
Investors
Daniela Haesler
Head of Marketing & Communications
Telephone: +41 44 226 1804
E-mail: [email protected]
Marketing & Communications
Media